Page 1
Electronic copy available at: https://ssrn.com/abstract=3102438
The Determinants of IPO Withdrawal - Evidence fromEurope
Pia Helbinga, Brian Luceya,∗
aTrinity Business School, Trinity College Dublin, Dublin 2, Ireland
Abstract
Why do companies, having filed for an IPO and incurred the costs thereof,
not follow through? We investigate this by examining all common stock
IPO’s for the largest countries in Europe over the 2001-2015 period, covering
more than 80% of the Western European IPO market by number and value.
We identify key characteristics that influence the probability of withdrawal.
Negative signals include venture capital or private equity involvement, the
presence of negative news or the intent to retire debt. A number of these are
in contrast to previous, US based, research, which highlights the importance
of institutional and legal characteristics in research replication for Europe.
Keywords: Integration, Initial Public Offering, Europe, Withdrawal,
Probit
JEL Codes : G14; G24; G32
∗Corresponding AuthorEmail addresses: [email protected] (Pia Helbing), [email protected] (Brian Lucey)
1The authors wish to thank Philipp Bruggen, Wolfgang Bessler, Arnold Cowan, Dou-glas Cumming, Gabriele Lattanzio for their valuable comments; seminar participants atQueen’s University Management School and Trinity Business School; discussants and au-dience members at 2017 INFINITI Conference, 2017 Money Macro and Finance ResearchGroup Annual Conference; Pia Helbing acknowledges the funding from the Friedrich-Naumann Foundation for Freedom.
Page 2
Electronic copy available at: https://ssrn.com/abstract=3102438
1. Introduction
Arguably one of the most important decisions in a company’s life cycle
is the decision to go public, to launch an initial public offering (IPO). 2
Despite clearly understood benefits, there are costs to the decision to
pursue an initial public offering. It is well accepted that the overt and
hidden costs of going public - increased oversight, increased scrutiny etc -
can act as a significant deterrent to IPOs (Bessler et al., 2017).
Identifying information asymmetries during the price discovery process,
potential investors and IPO insiders might come to diverging IPO valua-
tions. Owen-Smith et al. (2015) argue that this process is influenced by a
composition of status signalling as well as a combination of resource and
information transfer. The IPO company together with the underwriter is
thus trading-off the costs and benefits of the optimal level of information
revelation so as to increase the accuracy of price discovery (Sherman and
Titman, 2002).
The issuer always reserves an option to change course at any time and
withdraw the IPO before its completion. Particularly when the ex-ante
uncertainty around a firm value is high, the propensity for negative infor-
mation perception by investors is higher and as a consequence likewise for
withdrawal (Busaba et al., 2001). As Boeh and Dunbar (2013) note, an IPO
withdrawal can be a positive as well as a negative event. If the issuer has a
superior option for cashing out or otherwise obtaining objectives, compared
2The decision to go public has been thoroughly researched and it is suggested that an
IPO is undertaken to finance future endeavours when gaining access to the equity market
(Benninga et al., 2005). While exploiting temporary favourable overvaluation, companies
may go public to adjust their capital structure (Baker and Wurgler, 2002). The successful
IPO company can increase its publicity as well as reputation and in consequence enhance
firm value. Also, an IPO can represent an attractive exit for insiders such as for venture
capitalists and facilitate future acquisition activity (Brau and Fawcett, 2006). Bancel and
Mittoo (2009) argue that, once public, the company is exposed to outsider monitoring
which is considered a substantial benefit by European companies.
2
Page 3
to an IPO, the withdrawal can be a positive. Having withdrawn, a company
can reissue. Research has however shown that an IPO withdrawal is nega-
tively priced into a retry value and probability of a second time round IPO.
Dunbar (1998) and Lian and Wang (2012) find that issuers withdrawing
their IPO are mostly unlikely to return.
To date the determinants of an IPO withdrawal remain opaque - espe-
cially in Europe. How can we understand the puzzles around initial public
offerings if we are unaware of 12% of the pieces? These 12% represent the ap-
proximated IPO withdrawal rate in Europe represented by a sample of 2808
IPO filings in France, Germany, Italy, Spain, Scandinavia and the United
Kingdom that have filed for an IPO during 2001 and 2015. In contrast to
the USA where the withdrawal rate is closer to 20%, in Europe only a few
large capital markets attract IPOs.
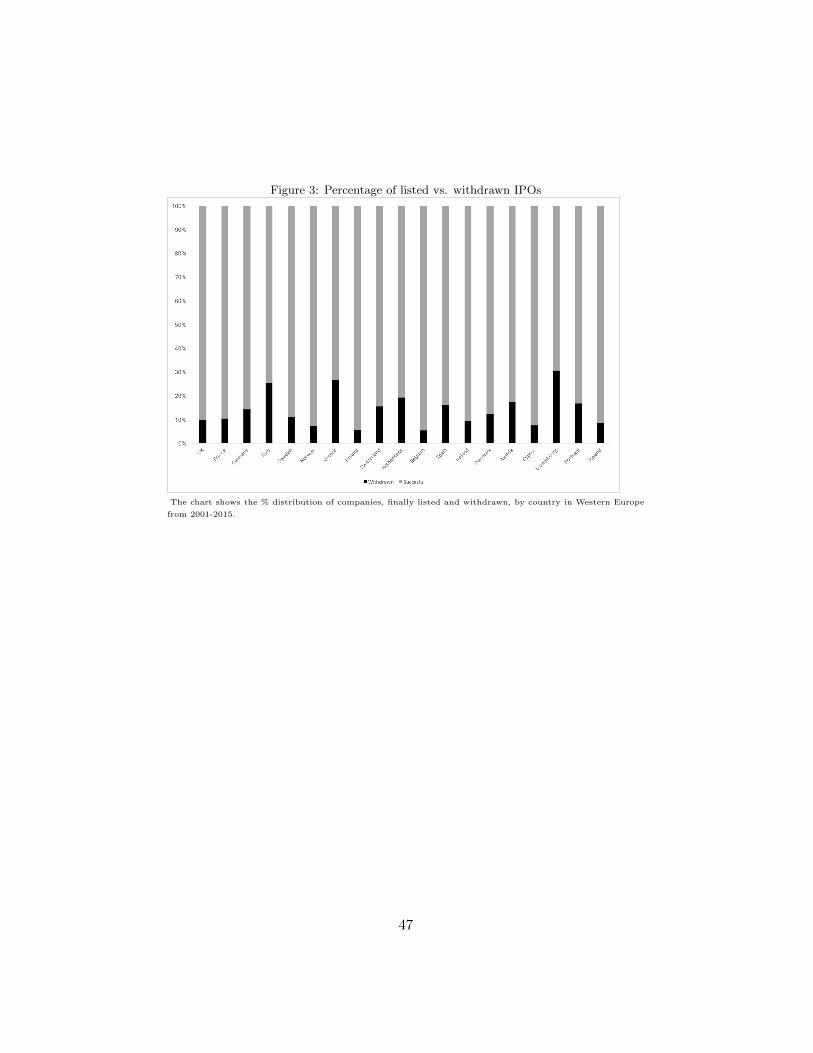
. This paper therefore aims to advance research in three areas. First,
we document for the first time the extent of IPO withdrawal vs listing for
the main European countries. Second, we extent the existing US based
literature, both geographically as noted and also by including a variety of
hand collected variables and variables not previously considered in the de-
termination of the withdrawal decision. Third, having surfaced a number of
findings that are at variance with the existing literature we deploy a battery
of robustness checks not heretofore used in this literature, with the main
findings remaining solid.
We find that venture capital (VC) and private equity (PE) involvement
significantly increases the likelihood of withdrawal which is in stark contrast
to previous findings in the USA (Dunbar and Foerster, 2008). We find that
the intent to retire debt with the IPO proceeds also significantly increases
the probability of withdrawal. A larger firm size decreases the probability of
withdrawal, whereas a larger offer size increases same. Most companies that
withdraw blame unfavourable market conditions. Here we identify IPO offer
characteristics to be the main driver of IPO withdrawal. Given the empirical
3
Page 4
evidence we hypothesise that the costs to mimic good firm’s signals or to
drown out negative signals lead companies in the last instance to withdraw
their IPO. Issuers that face negative news prior to their IPO are more likely
to withdraw. When insiders agree on longer lock-up periods as well as a
higher board independence or disclose intellectual capital, issuers are more
likely to follow through with the IPO. Also, a higher level of Rule of Law in
the country decreases the probability of IPO withdrawal.
The remainder of the paper is structured as follows. In section 2 the
factors influencing IPO withdrawal are described. In section 3 the modeling
approach as well as the dataset are introduced. The descriptive statistics and
empirical evidence for the determinants of IPO withdrawals from analysing
market and firm level data are presented in section 4. Finally, the paper
is concluded with a brief summary and discussion about the implication of
this research.
2. Factors Influencing IPO Withdrawal
The valuation of an IPO company is influenced by a variety of firm and
non-firm specific characteristics (Allen and Faulhaber, 1989). As Benveniste
et al. (2002) argue, the IPO marks the most important public information
event in the company’s life cycle, opening a two-way information channel.
Using their framework of information revelation theory, signals in general
decrease a priori uncertainty about the success of an IPO company. While
strong, positive signals such as certification increase the aggregate demand
for the IPO firm’s shares, negative ones decrease same (Brau and Fawcett,
2006). Chemmanur and Fulghieri (1999) argue that companies that face
higher uncertainty intrinsically are more difficult to value and therefore have
higher evaluation costs. However, not all the companies trying to go public
are successful, as the equilibrium offer price is noisy. Potential investors
value the IPO company based on a probability of future success derived from
a network of strong and weak positive as well as negative signals represented
4
Page 5
by firm and non-firm characteristics (Owen-Smith et al., 2015).
According to Rock (1986) information can be revealed directly through
the IPO prospectus or indirectly through price. In consequence, the IPO
company can (falsely) signal the unobservable quality to the potential in-
vestor via observable proxies in the IPO prospectus or during the bookbuild-
ing process for instance (Connelly et al., 2010).3 While the IPO company
and the underwriter trade-off the benefits and costs of information revela-
tion (Sherman and Titman, 2002). The IPO company remains private if
the potential investors incur significant information acquisition costs (Allen
and Faulhaber, 1989). Edelen and Kadlec (2005) argue that underpric-
ing an IPO decreases the probability of IPO withdrawal, where the issuer
henceforth must trade-off the proceeds from the underpriced IPO against
the probability of IPO withdrawal. This implies that IPOs are withdrawn
when the equilibrium offer price is below a certain issuer’s fundamental value
threshold (Chemmanur and Fulghieri, 1999).
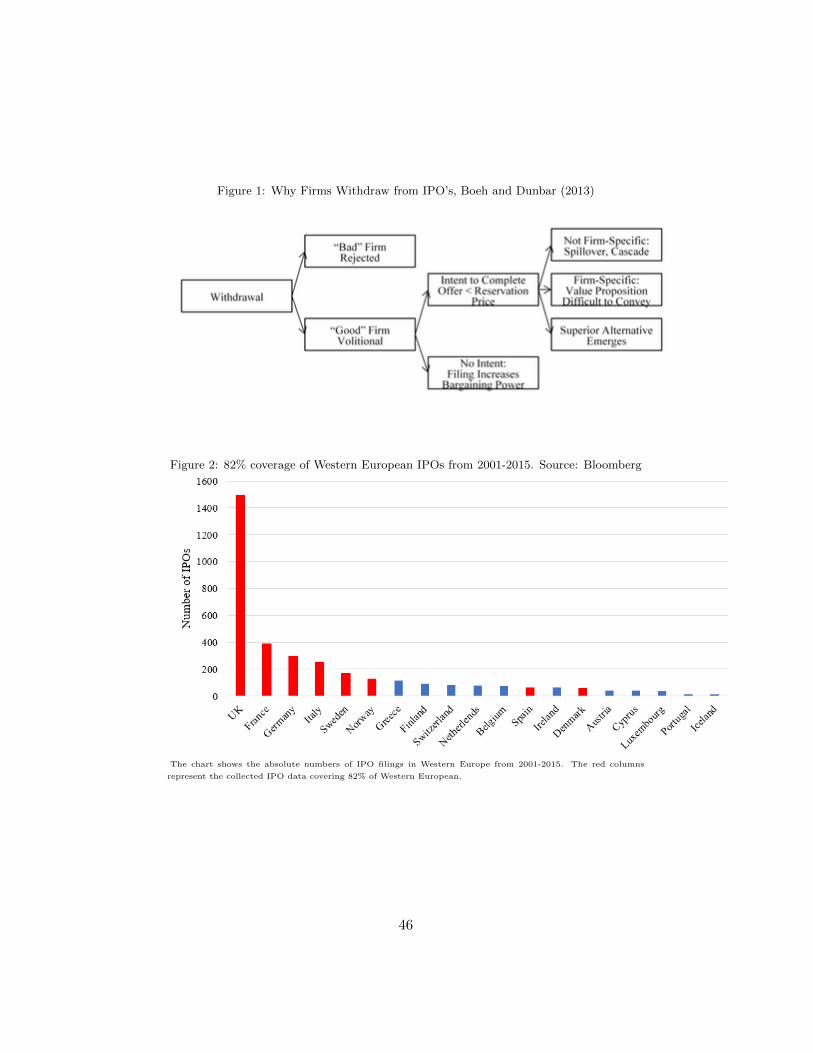
As outlined in Figure 6, firms withdraw for a variety of reasons (Boeh
and Dunbar, 2013). A clear complication in evaluating IPO withdrawals is
therefore intent. Over the last decade it has become more common for com-
panies to operate a ”dual track” approach (Field and Karpoff, 2002, Ewens
and Farre-Mensa, 2017), and more recently Aktas et al. (2017) and Greene
(2016) whereby concurrent with the IPO filing trade sale opportunities are
also sought. In most cases the existence of a dual tracking approach is only
observable ex post, typically defined as an instance whereby a withdrawn
IPO is sold in a trade sale within one year of the withdrawal. The post with-
drawal experience of IPO candidates has received limited attention. Much
of this research has been in the areas of entrepreneurial finance, with papers
such as Brau et al. (2010), Field and Karpoff (2002). More recent work
3Literature on the IPO bookbuilding process in terms of information revelation cast
doubt in the actual information production during same in Europe (Jenkinson and Jones,
2004).
5
Page 6
begins to evaluate the afterlife of withdrawn firms, surfacing the determi-
nants of different post-withdrawal outcomes (see Boeh and Dunbar (2013)).
Of course, prior to evaluation of a taxonomy of post withdrawal events it
is necessary to lay groundwork in terms of numbers and determinants of
withdrawals, as we do here.
An emerging literature tests the determinants on the decision to with-
draw, starting with Busaba et al. (2001). This is extended by Dunbar and
Foerster (2008) who broadens the set of possible market and firm level ex-
planatory variables. From these and other papers we can derive and iden-
tify a number of factors which may be relevant in the IPO withdrawal phe-
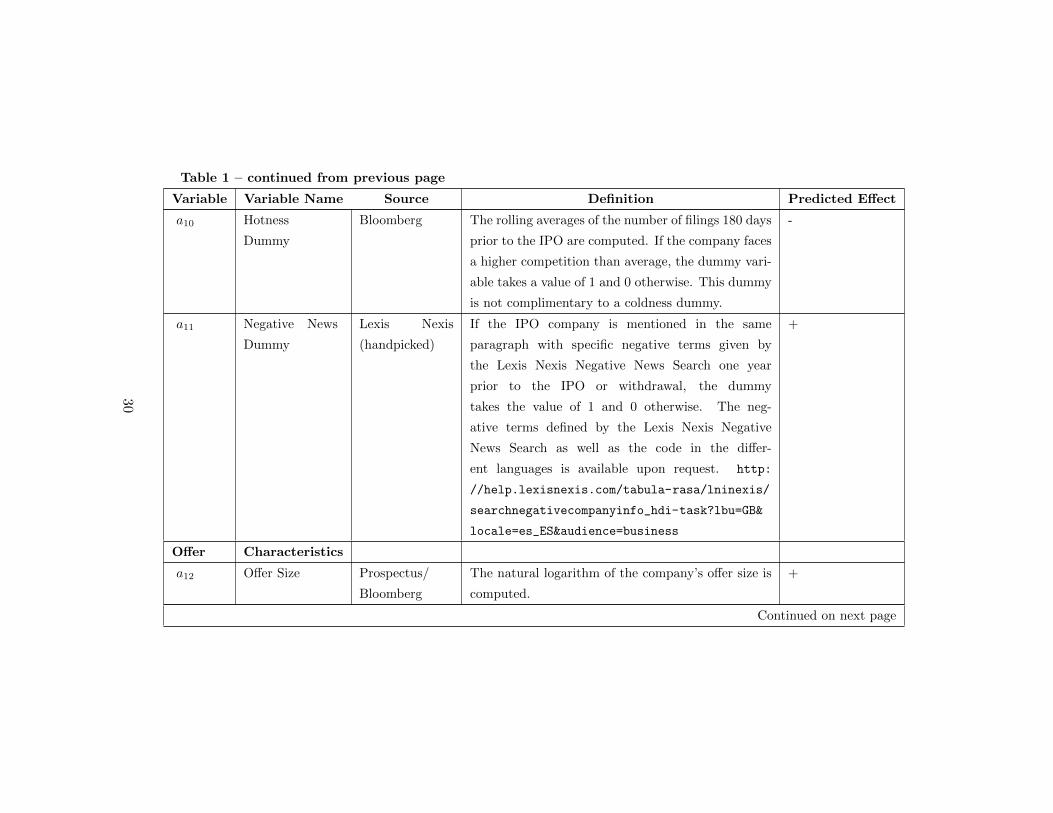
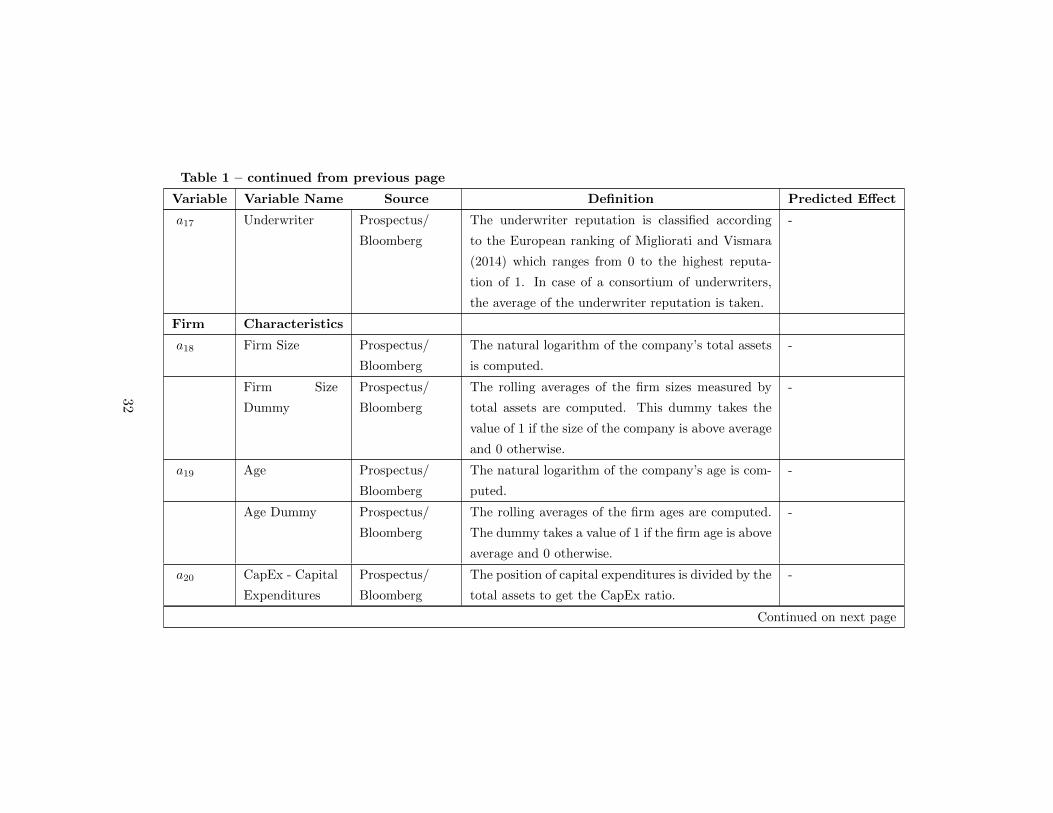
nomenon. Details of the measures used to proxy these features are contained
in Table 1. We can break the characteristics hypothesised to impact the IPO
withdrawal into a number of larger sets representing market, firm and offer
characteristics.
Market characteristics can be broken into three subcategories. First,
we consider the level of regulatory environment approximated by measures of
the Rule of Law, Regulatory Efficiency as well as the Market Openness Index
provided by the Heritage Foundation as well as a common law jurisdiction
dummy variable. La Porta et al. (1997) suggest that a higher level of po-
litical stability as well as legal framework can be considered as a favourable
environment for investors. As the regulatory environment influences the un-
certainty prior to an IPO (Engelen and van Essen, 2010), we expect that a
better environment decreases the probability of withdrawal. Second, we use
the change in the country’s Gross Domestic Product (dGDP), the monthly
yield for the ten-year government bond, and the credit spread to represent
the (credit) economic conditions (Bergbrant et al., 2015). Third, we ex-
amine equity market conditions since a multiplicity of research on market
timing suggests that companies go public given favourable market condi-
tions, exploiting investor sentiment (Lowry, 2003). The change in the main
stock market index (dINDEX) likewise signals positive information spill-
6
Page 7
overs for potential issues. Since IPOs tend to come in waves, we examine
a hotness dummy (Chemmanur and He, 2011). Recent research on market
sentiment supports that (negative) news affects stock returns (Shi et al.,
2016).4 Finally, we introduce the market estimate of volatility (VIX) to
further approximate the investor sentiment.
Firm characteristics can be categorized into three areas. First, the
offer characteristics include the offer size and the intent to retire debt with
the IPO proceeds. We anticipate that a proposal to use IPO proceeds for
debt retirement is a negative signal and increases the risk for the investor
(Busaba et al., 2001). Krigman et al. (2001) identify the underwriter rep-
utation as vital to the success of issues which is supported by the findings
of Busaba et al. (2001), Dunbar and Foerster (2008), Boeh and Southam
(2011). Another characteristic included is venture capital involvement. We
additionally include private equity involvement since previous research has
not differentiated same. Research findings are not unanimous. Busaba et al.
(2001) find that VC-backed companies that withdrew their IPO were less
likely to succeed in a second-time IPO. While Boeh and Southam (2011)
find that venture capitalists are more inclined to withdraw an IPO. In con-
trast, Dunbar and Foerster (2008) identify venture capitalist involvement
as key for a successful return to the equity market due to its significant,
positive certification. Considering the ineffective certification of VC in, for
example, France (Chahine and Filatotchev, 2008) combined with the frag-
mented European market for risk capital, we query this proposition (Goer-
gen et al., 2009, Groh et al., 2010). Finally, as Chemmanur and Fulghieri
(1999) hypothesise, cost of information production is essential in the IPO
process. IPO insiders need to trade-off the benefit from disclosing relevant
4The negative terms defined by the Lexis Nexis Negative News Search. The code
in the different languages is available upon request. http://help.lexisnexis.com/
tabula-rasa/lninexis/searchnegativecompanyinfo_hdi-task?lbu=GB&locale=es_
ES&audience=business
7
Page 8
information to potential investors to the costs of doing so. Drawing from
this framework, higher disclosure of the company’s intangible assets or com-
petitive advantage reduces the information asymmetry between issuer and
potential investor.5 This is denoted as intellectual capital disclosure in the
IPO prospectus (IC dummy) in our analysis (Singh and van der Zahn, 2007).
Second, the firm characteristics include the firm size and age as we ex-
pect that larger and older issuers reduce the uncertainty about the long-term
success of the IPO issue through positive signalling (Brau and Fawcett, 2006,
Engelen and van Essen, 2010). We also include variables for a higher level
of capital expenditure and net income (Lowry, 2003). Barry and Mihov
(2015) state that financial intermediaries involvement such as bank debt-
financing provides information to the investor and consequently reduces the
uncertainty about the firm value prior to the IPO. However, we propose a
negative signal of debt to investors as companies with too high a degreee of
leverage might also face costs of financial distress which increases the risk
to investors. In addition, we suggest that the level of uncertainty prior to
the IPO for high-tech companies will typically be more pronounced due to
greater uncertainty in IPO issue valuation (Engelen and van Essen, 2010).
Lastly, we expect more multinational companies to be perceived as less risky
by investors due to the inherent operational hedge conferred by multination-
ality.
Third, the decision to undertake an initial public offering boosts poten-
tial agency problems as the ownership is dispersed. Consequently, we include
Corporate Governance characteristics. Investors are likely to demand sig-
nals that reduce possible agency issues. To proxy these, the level of retained
ownership by shareholders prior to IPO, the lock-up period, the board size
and independence, the proportion of female board members as well as the
CEO duality role are presumed to influence the probability of IPO with-
5Patent quality and extant is discussed comprehensively in Bessler and Bittelmeyer
(2008), who shows positive valuation and financing effects.
8
Page 9
drawal (Howton et al., 2001, Djerbi and Anis, 2015, Brav and Gompers,
2003, McGuiness, 2016). A more detailed description of the variables can
be found in Table 1.
3. Methods and Data
As is common we employ a probit model to identify the determinants of
IPO withdrawals (Dunbar and Foerster, 2008, Busaba et al., 2001). We ap-
ply a binary model, where the dependent variable is 1 if the IPO is withdrawn
and 0 otherwise. This paper examines all IPO filings in France, Germany,
Italy, Spain, Scandinavia and the UK from January 2001 until December
2015. 6 Following usual practice in IPO literature (Ritter, 1987), we exam-
ine all common stock IPOs and therefore exclude Real Estate Investment
Trusts (REITs), American Depositary Receipts (ADRs), closed-end or mu-
tual funds, special purpose entities and rights issuance. Unlike other studies
financial companies remain in the sample.7 We use public sources such as
Bloomberg or Thomson Reuters for much data but hand collect multiple
variables from IPO prospectuses for most. Our data and sources are de-
scribed in more detail in Table 1.
Our data frame consists of a total of 2808 companies that filed for an
IPO from 2001 to 2015 of which 2474 were successful and listed whereas 334
(11.89%) withdrew their IPO. Our dataset covers 82% of the Western Euro-
pean IPO market (see Figure 2). The majority of IPO filings in number and
volume are in the UK given the Alternative Investment Market with 1454
successful and 147 withdrawn IPOs overall (about 50% of sample), followed
by France and then Germany. We commence in 2001 for two reasons. First,
6Throughout the modeling process we tested for endogeneity in our estimates. We do
not show these results here, for space reasons. Results are available on request but in no
case was endogeneity an issue.7As a robustness check we excludes financial and state-owned enterprises from the
sample. Our findings remained broadly unchanged. Results are available on request.
9
Page 10
this provides us with a sample period post the dot.com period yet covering
at least two full economic cycles in Europe. Second given the significant
changes in regulation, European integration, and corporate governance we
felt that moving back into the 1990s and beyond would result in a dataset
of considerably greater than needed heterogeneity.
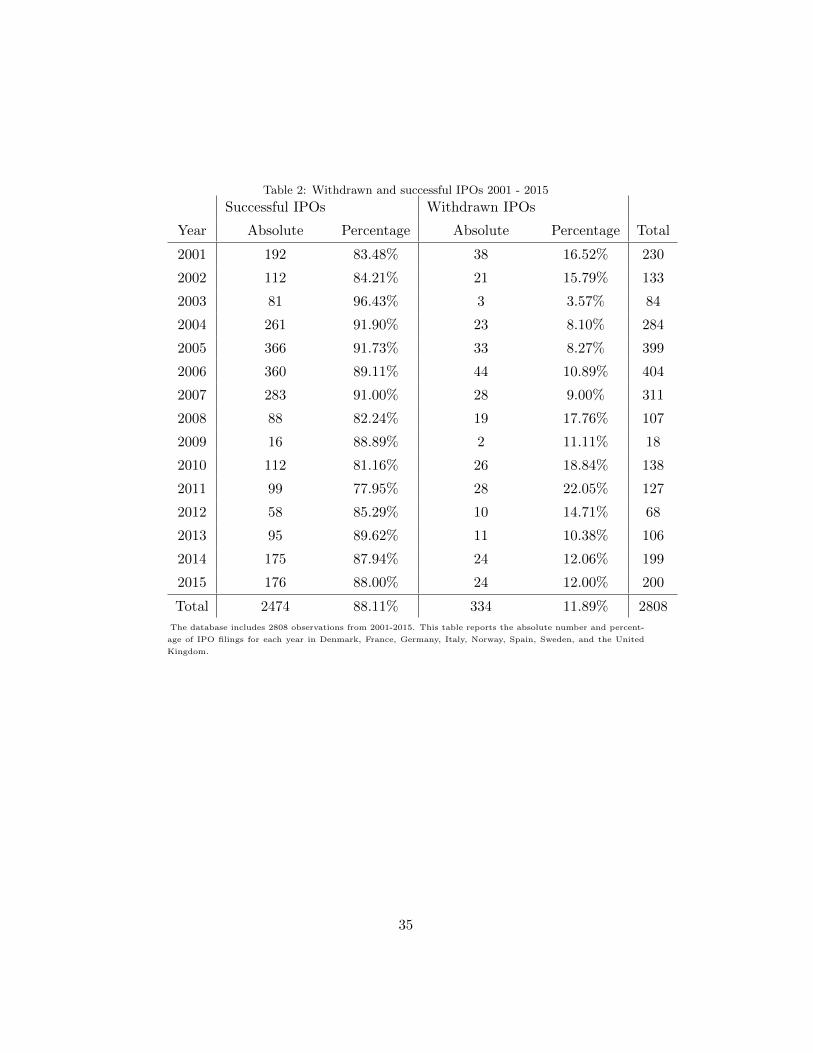
There is considerable variation in the level of European IPOs as depicted
in Table 2. The wave like nature of IPO’s over time is evident here. The
number of companies that file for an initial public offering were highest be-
tween 2004 and 2007 with a peak of 366 IPO filings in 2005. In contrast,
after the global financial crisis erupted in 2007, there were as low as 18 fil-
ings in all countries together in 2009. In terms of IPO withdrawals, Europe
is characterised by high variation, too. The lowest IPO withdrawal rate
is about 3.5% in 2003 with a peak of 22% in 2011. Significant variation
is also evident across countries. In Figure 6 we show the extent of with-
drawals and variation over the database, by country. Typically between 10
and 20% of all filed IPOs do not subsequently list. As a preliminary in-
vestigation, in Table 3 we report the means and standard deviations of the
variables, according to IPO status. We also provide a test for differences
in means across status. The majority of companies withdrawing typically
blame unfavourable market conditions. Successful IPOs are associated with
higher levels of regulatory environment metrics such as the Rule of Law,
Regulatory Efficiency or Common Law Jurisdiction which is consistent with
previous findings (La Porta et al., 1998). Consistent with Chemmanur and
Fulghieri (1999), successful IPO listings are during ”hot”markets, the mar-
ket estimate for future volatility (VIX) and the credit market conditions
are lower. In contrast, market conditions, approximated with the change of
the lead stock market index or GDP, are marginally positive for successful
IPOs which supports the idea of market timing (Benninga et al., 2005). In
addition, market sentiment seems to have an effect - negative news coverage
is significantly more frequent for companies that withdraw their IPO than
10
Page 11
for successful companies.
The offer size of withdrawn IPOs is significantly larger which enforces
the claim that potential investors and IPO insiders have diverging views on
the offer price and size (Benveniste and Spindt, 1989). As anticipated, with-
drawn companies display significantly higher mean levels of debt and also
are more likely to use the IPO proceeds to retire outstanding debts. We find
a surprising result when we examine the role of private equity and venture
capital. Withdrawals are more likely to have had PE or VC involvement
than successful IPOs.
Besides this, consistent with Boeh and Southam (2011), withdrawn IPOs
tend to have poorer corporate governance which is represented firstly in a
shorter lock-up period. This is consistent with Brav and Gompers (2003)
who establish longer lock-up periods as a positive signal. Also, withdrawn
IPOs have fewer independent board members. While the lack of board
independence is interpreted as an absence of a critical disciplining body
of management, this might be perceived as risky by investors (Djerbi and
Anis, 2015). Finally, withdrawn issues disclosed their intellectual capital and
competitive advantage less often which is consistent with previous findings
(Singh and van der Zahn, 2007).
4. The Determinants of IPO Withdrawal
4.1. General findings
In Table 4 the results of a probit analysis are given. We report the probit
coefficient estimates and the corresponding p-values. We also provide the
marginal effects which accounts for the impact of a unit change given one
standard deviation of the variable on the probability of withdrawal (Aldrich
and Nelson, 1984).8 The results of the probit regression are largely consistent
8The regressions appear reasonably well specified as shown in Table 4. The HL good-
ness of fit test and the Pseudo-r2 suggest an adequate model.
11
Page 12
with the findings from the descriptive statistics. At a 5% significance level
we find that 16 variables show explanatory power on the probability to
withdraw an IPO.
Four offer characteristics come up as positive and significant. We find
that the larger the offer size, the higher the probability of withdrawal. As
mentioned above, one possibility is that larger issues are more likely to
be withdrawn when they face skepticism at the aggregated demand from
potential investors (Benveniste et al., 2002). We assume that this finding is
driven by the determinants of IPO withdrawal in the UK and France as is
shown in Tables 6 and 7.
The intent to retire debt with the proceeds of the IPO has negative sig-
nalling power to the investor (Owen-Smith et al., 2015). This is confirmed
by the probit findings suggesting that debt retirement has net negative sig-
nals and increases the probability to withdraw as much as 4% according to
the marginal effects in Table 4. Dunbar and Foerster (2008) hypothesise
that debt signals the availability of alternative sources of finance, leading to
a higher propensity of IPO withdrawal. In the European context, one can
more likely conclude that debt and debt retirement serve as negative sig-
nals on the future success of the company. As Pagano et al. (1998) evidence
that most companies intend to rebalance their accounts with the IPO in Eu-
rope. The objective of capital adjustment raises the level of risks perceived
by the investor due to inefficiencies in the consequent capital structure or
too leveraged position after all - which might lead to a lack of demand for
the set offer price. Especially when considering the role of debt in Italy
or Germany, banks exert substantial control over the firms such as being
represented in the supervisory board or holding voting rights (Chirinko and
Elston, 2006). Despite potential benefits of bank concentrated ownership,
control dilemmas are presents in this construct (Elston and Rondi, 2006).
Consequently moral hazard might arise, imposing a risk on future successes
of the IPO company. Investors demand higher compensation which in com-
12
Page 13
bination causes the company to be more likely to withdraw.
We find that VC and PE significantly and economically increases the
probability of IPO withdrawal by almost 6% and 3%, respectively. We
interpret this as evidence that the risk capital providers are not perceived
as a certification of a strong positive signal to the issuer in Europe. On the
contrary, it almost seems as if issues with VC and PE backing for Germany
and Italy are seen as riskier. This can be lead back to the relatively lower
level and complexity of PE and VC performance, reputation, and consistency
in Europe as argued by Tykvova and Walz (2007). Compared to the USA,
in general, the European market for venture capital and private equity is
still seen as lagging behind, see as a discussion Bessler and Thies (2006), and
more recently Bertoni et al. (2015). For a trade perspective on the persistent
differences and relative lagging of the European markets, see Levin (2016),
Basta (2017).
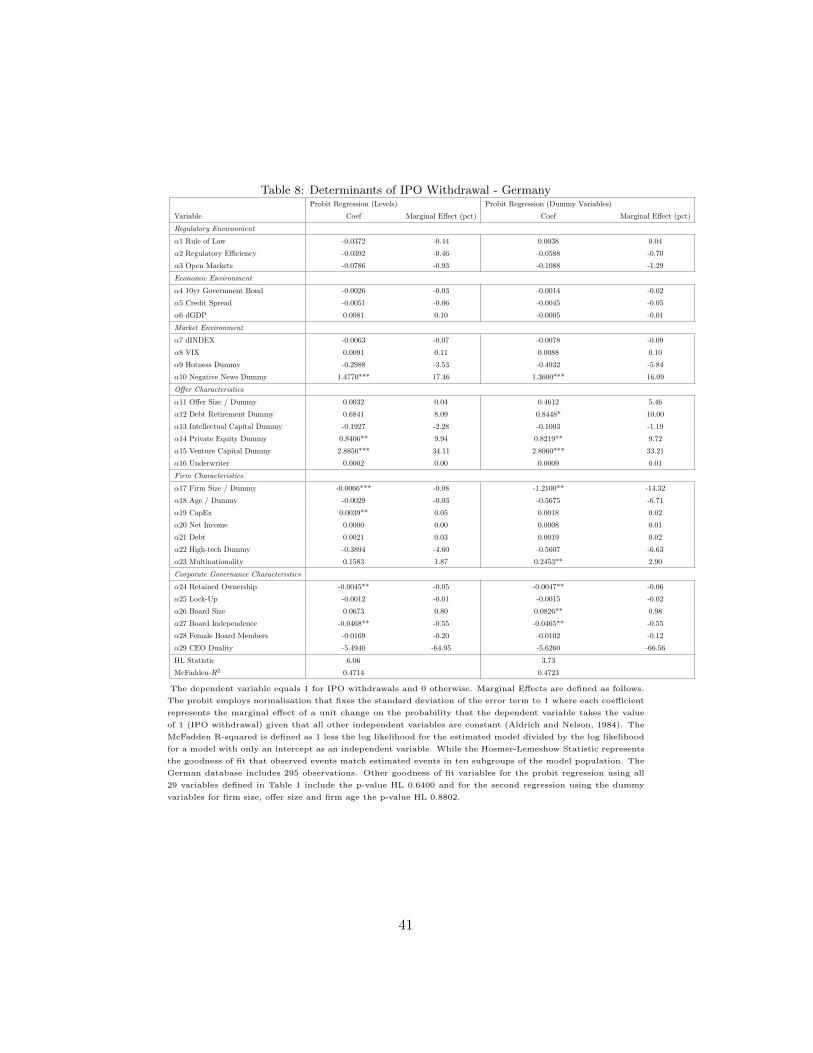
Proksch et al. (2017) undertake a qualitative analysis of German ven-
ture capital companies’ business documentation showing that venture capi-
tal activity is rather heterogeneous in terms of value added activity within
backed firms. There is clear evidence of financial but less clear evidence of
operational value adding components. While France and Italy score below
average on the VC/PE attractiveness index, Germany scores average due to
the bank-led capital market. The UK scores highest on VC/PE attractive-
ness index given the depth of capital market but is still a fraction of the US
market (Groh et al., 2010). Tykvova and Walz (2007) posit that venture
capitalists and private equity firms have an information advantage over in-
vestors and will exploit this in IPOs. They find evidence that VC-backed
IPOs face more severe underpricing in Germany, acting as an up front fee,
for this exploitation hazard. Venture capital investment varies significantly
in quality such as a lack of control negatively affecting the performance
of same and henceforth the certification (Cumming, 2008). Some evidence
to back this is also provided in Oehler et al. (2016) who note that there
13
Page 14
is scant evidence of PE backed German IPO companies showing superior
(short-term) out performance.9 We can identify that this finding is mainly
driven by the Italian and by the German IPO filings as the results in Ta-
bles 9 and 8 depict. Scribano (2015) notes that Italian companies with more
prestigious underwriting syndicates and / or PE backing do not outperform.
Klein et al. (2016) attribute the banking system in Germany as the
cornerstone of its capital market. PE and VC might not be independent
from banks and thus be perceived as a riskier form of credit financing only.
Moreover, risk capitalists pursue several exit alternatives alongside the IPO
and as a consequence are more likely to withdraw the IPO for the benefit of
a more favourable option (Cumming, 2008). In fact, Gill and Walz (2016)
argue that an IPO with venture capital backing can be interpreted as a
delayed trade sales which decreases the probability of future success for the
IPO company. Reber (2017) analyse US evidence on the effect of VC backing
on IPO downside risk, finding no evidence that it is mitigated.
Consistent with previous findings (Busaba, 2006, Dunbar and Foerster,
2008) the larger the firm size, the lower the probability of IPO withdrawal
as information production costs are decreased (Chemmanur and Fulghieri,
1999). Two market characteristics positively influence the probability of
IPO withdrawal. First, the market estimate of future volatility (VIX) in-
creases the probability to withdrawal which is as expected as the uncertainty
of the IPO company’s future success increases. As suggested by the descrip-
tive statistics, the presence of negative news prior to an IPO increases the
probability to withdraw by as much as 14% which is a remarkably large
effect. This result is by all means unsurprising, considering the importance
of market sentiment and the effect of negative signals (Shi et al., 2016).
9As proposed by Nahata (2008), time-variant venture capital quality and consistency
seems to be a piece to the risk capital puzzle. Given the sample size of VC-backed IPOs
in Europe from 2001-2015 a qualitative approach seems most adequate which is beyond
the limits of this paper.
14
Page 15
The corporate governance metrics of lock-up period, board independence
and CEO duality prove to be of significant explanatory power in accor-
dance with the descriptive statistics. This supports the findings of Boeh
and Southam (2011) that good corporate governance is a positive signal
to investors and reduces the IPO company’s uncertainty and likewise the
probability to withdraw. We then break the sample into country specific
elements. Considering the country specific results of the probit analysis for
the UK, France, Germany, Italy, and Scandinavia in Tables 6, 7 and 8, 9, 10
it becomes clear that corporate governance metrics indeed reduce the prob-
ability of withdrawal. Lock-up periods are important in Europe, while in
Germany retained ownership appears to matter more. All countries except
France value independence of the board. As outlined the disclosure of intel-
lectual capital or competitive advantages mitigates information asymmetries
(Singh and van der Zahn, 2007). This holds to be true since our findings
suggest that IC disclosure reduces the probability of withdrawal by about
6%. In particular this result provides reasonable evidence for the benefits of
information revelation. Companies that withdraw their IPOs disclose their
intellectual capital or competitive advantage less frequent imposing a higher
evaluation cost on the potential investors. We conclude that the benefit of
information disclosure reducing the uncertainty of the IPO company is ex-
ceeding the cost of same. Information disclosure can serve as a differentiator
between good and bad firms. Bad firms would face high costs mimicking
the same level of information disclosure by the good firms, leaving the bad
ones to withdraw their IPO.
The only market condition that decreases the probability of IPO with-
drawal is the Rule of Law, as expected by literature (La Porta et al., 1997).
Only in the European probit model underwriter quality has a positive statis-
tical explanatory power, while the economical effect is diminishing. Contex-
tualising this finding, which seems to be driven by the French sample data
15
Page 16
(see Table 7), 10 the country specific probit analyses even show a positive re-
lationship between underwriter reputation and the probability to withdraw
(see Tables 6, 8, 9, 10). In Germany, Italy, Scandinavia and the United
Kingdom, more reputable underwriters are contracted for issues that were
withdrawn. This outcome might well be driven by the German, Italian and
Scandinavian IPO filings since the banking system can be considered quite
different from the rest of the countries.
Summarizing, the following characteristics are of statistical and econom-
ical power: While the presence of negative news, venture capital or private
equity backing and debt retirement increases the probability of IPO with-
drawal, the disclosure of intellectual capital and better corporate governance
decreases same. Consolidating our findings into the categories, the regula-
tory environment is net neutral in its statistical and economical signalling
power, likewise the economic and market conditions. Whereas the offer
characteristics statistically and economically show with a net negative sig-
nal. Firm characteristics and corporate governance characteristics might
have a consolidated statistical net negative or positive signal and increase/
decrease the probability of withdrawal respectively, but lack the economical
power . As it becomes evident, the country specific determinants of IPO
withdrawal overwhelmingly coincide with the consolidated results for the
European determinants of IPO withdrawal.
4.2. Comparison with US-findings
We already know that there exist differences between the European and
American IPO markets (Ritter, 2003). Interestingly we can identify differ-
ent empirical manifestations when examining the IPO phenomenon of with-
drawal. While most results for the largest European equity markets show
similarities to the US-based research, some of our findings are in contrast
to Busaba et al. (2001), Dunbar and Foerster (2008), Boeh and Southam
10In the Extreme Bounds Analysis underwriter quality is statistically insignificant.
16
Page 17
(2011). Previous studies (Busaba, 2006, Dunbar and Foerster, 2008) found
that for successful IPO companies the offer size was significantly larger than
for withdrawals. The results at hand contradict these US-findings. With-
drawn IPOs are of a significantly larger filing size. Busaba et al. (2001)
points out that a larger offer size might reveal more information and thus
reduces uncertainties. While this may be the case for US IPOs it does not
seem to carry through to the European market.
The finding that is in starkest contrast to US studies is the role that
venture capitalist and private equity involvement plays. Busaba et al. (2001)
find that VC-backed companies that withdrew their IPO were less likely to
succeed in a second-time IPO. In contrast, Dunbar and Foerster (2008)
identify venture capitalist involvement as key for a successful return to the
equity market. As already pointed out, compared to the USA, in general,
the European market for venture capital and private equity is still seen
as lagging behind (Bessler and Thies, 2006). Tykvova and Walz (2007)
posit that venture capitalists and private equity firms have an information
advantage over investors and will exploit this in IPOs. We uncover further
evidence to cast doubt on the causal mechanisms of certification proposed for
the USA consistent with Chahine and Filatotchev (2008) finding for France
alone.
The variables that do not appear as significant are also of interest in com-
parison to previous US studies. Carter and Manaster (1990) and Krigman
et al. (2001) established the positive signalling effect of the underwriters’
reputation for the USA. Unlike in the study of withdrawals for the US mar-
ket by Dunbar and Foerster (2008) reputation does not appear to matter in
the European market. Klein et al. (2016) argue that companies chose their
underwriter not on reputation as proposed by Krigman et al. (2001) but by
previous linkages. Therefore, the certification role of underwriters that is
observed in the USA does not apply to Germany, Italy, Scandinavia or the
UK due to the specific universal operations of banks. A preexisting lend-
17
Page 18
ing relationship with the underwriter bank may facilitates access to further
credits (Klein et al., 2016).
4.3. Robustness checks
As a robustness check 11, we run probit regressions using dummy vari-
ables (where firm values are contrasted as above/below median sample val-
ues), as opposed to logarithmic values, for certain firm characteristics such
as the firm size, offer size and firm age for the European sample as well as
the country specific ones in Tables 4, 6, 7, 8, 9, 10 and 11. The majority
of variables are significant in both specifications for the European dataset
as well as for the country specific ones. We also run a probit regression
excluding the UK as those IPOs constitute about 52% of our sample data.
The results in Table 5 indicate that the probit regression remains broadly
unchanged.
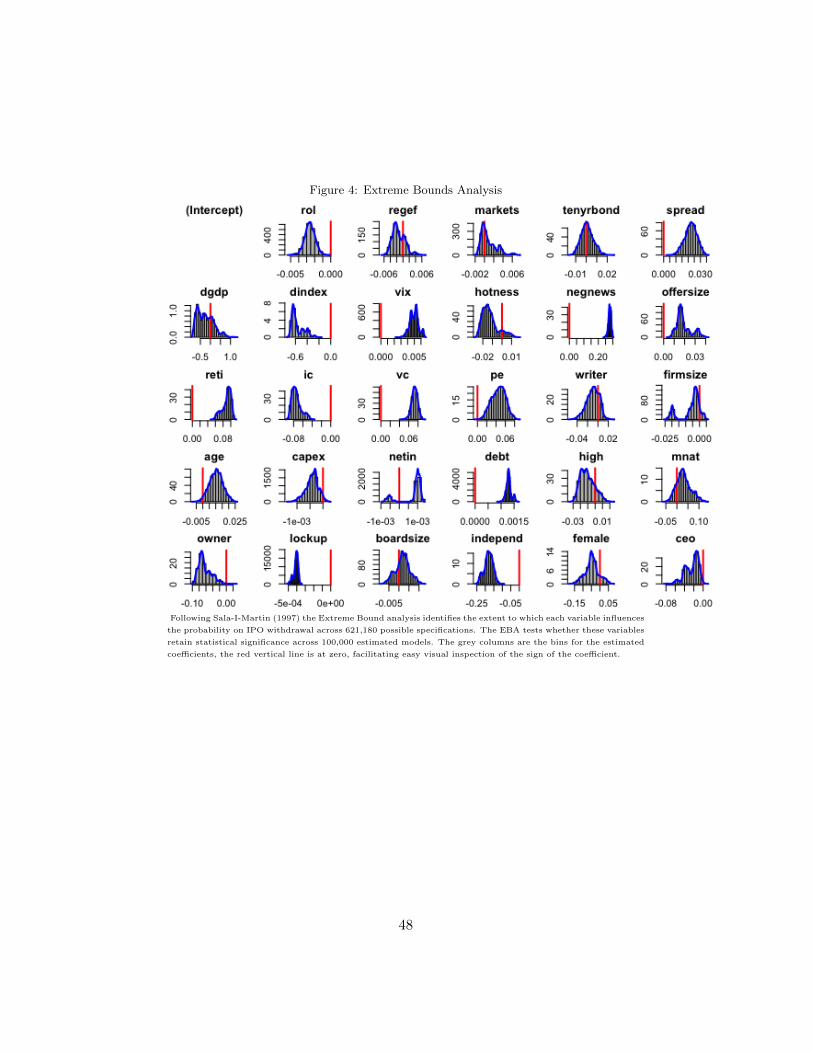
As a further robustness test we employ Extreme Bounds analysis follow-
ing Sala-I-Martin (1997). The analysis allows us to surface the extent to
which each variable influences the probability of IPO withdrawal across a
wide variety of possible specifications. When evaluating the coefficients of
the elements, we test whether these variables retain statistical significance
across a wide range of the estimated models. As depicted in Table 12 and
Figure 6 we can see that the significant variables from the probit regression
of the European sample in Table 4 mostly retain significance in the EBA
formulation. For instance, the Extreme Bound analysis makes evident that
the presence of negative news, venture capital or private equity, a higher
level of debt or the intent to retire debt with the IPO proceeds as well as a
higher credit spread increases the probability of IPO withdrawal. Whereas
higher levels of Rule of Law or Corporate Governance as well as disclosure
11Given the large number of possible variables that influence the probability of IPO
withdrawal, we compute a correlation matrix which shows that multicollinearity is not
present
18
Page 19
of intellectual capital are significantly decreasing the probability of same.
While the significant finding of the role of the underwriter in Table 4 does
not retain statistical significance in the Extreme Bound analysis in Table 12
confirming our claim.
We run a stepwise probit regression, the results of which are shown in
Table 11 using all 30 variables defined in Table 1. We see that all of the
significant variables in the probit regression in Table 4 are likewise significant
in the stepwise probit regression at a 5% significance level. Comparing the
stepwise probit regression using the dummy variables for firm size, offer size
and age in Table 11, our findings using the logarithmised values of same are
confirmed. We also included a series of dummy variables which represent
the OECD estimated recession periods for OECD members. Results are
available on request but the dummy variables were not significant nor were
there material changes in the estimated coefficients. All tests and databases
are available upon request.
5. Conclusion
This study analyses a dataset of all IPO filings from 2001 through 2015
in the France, Germany, Italy, Scandinavia, Spain and the UK. What are the
implications of our results? We postulate that Europe is different from the
USA when it comes to the level and determinants of IPO withdrawals. We
find that market sentiment does matter since negative news about an issuer
or the level of estimated market volatility increase the probability of IPO
withdrawal. While good corporate governance and the disclosure of intellec-
tual capital decrease same. We find that venture capital and private equity
involvement significantly increases the probability of withdrawal which is
driven by the German and Italian markets. We explain this phenomenon
with the less advanced role of these in Europe compared to the USA. We
argue that investors perceive a large offer size, a higher level of debt and the
intent to retire debt as risky. Drawing from the empirical evidence we can
19
Page 20
suggest the following theoretical implications of determinants of IPO with-
drawal within an information asymmetric framework. First, we can enforce
the argument by Owen-Smith et al. (2015) that the process of IPO with-
drawal is affected by a network of strong, weak, positive and negative signals
of the determinants defined in Table 1. Overall, The costs to mimic good
firms’ signals such as the information disclosure or to drown out negative
signals such as the negative news leave companies to withdraw their IPO.
As to whether the IPO withdrawal itself is a negative or positive signal, this
must be uncovered in further investigations. Second, the signalling power
and direction of the determinants of IPO withdrawal within this network
differ in the European compared to the USA market. Especially, we show
that US-American findings such as the signalling effect of the underwriter
as well as PE or VC involvement cannot be taken to automatically hold
true for Europe. Third, we shed light on the difference and similarities of
determinants of IPO withdrawal under the lens of European equity market
integration.
Further evidence and research on the precise role played by VC and PE
would be required to surface the causal mechanisms, however. We also iden-
tify the IPO allocation process and mechanism in the light of IPO withdrawal
to be a interesting future research topic likewise extending this analysis to
Asian IPO markets. Furthermore, an extension of the empirical and theo-
retical implication of IPO withdrawal on the IPO valuation and survival of
matched IPO companies would be highly insightful.
20
Page 21
6. References
Aggarwal, R., J. Berrill, E. Hutson, and C. Kearney (2011). What is a
multinational corporation? Classifying the degree of firm-level multina-
tionality. International Business Review 20 (5), 557–577.
Aktas, N., C. Andres, and A. Ozdakak (2017). The interplay of IPO and
M&A markets: The many ways one affects the other. In Forthcoming in
Oxford Handbook of IPOs edited by Douglas Cumming and Sofia Johan,
pp. 1–32.
Aldrich, J. H. and F. D. Nelson (1984). Linear Probability, Logit, and Probit
Models. Iowa City: Sage QASS Series.
Allen, F. and G. R. Faulhaber (1989). Signaling by Underpricing in the IPO
Market. Journal of Financial Economics 23, 303–323.
Baker, M. and J. Wurgler (2002). Market Timing and Capital Structure.
The Journal of Finance 57 (1).
Bancel, F. and U. R. Mittoo (2009). Why Do European Firms Go Public?
European Financial Management 15 (4), 844–884.
Barry, C. B. and V. T. Mihov (2015). Debt financing, venture capital,
and the performance of initial public offerings. Journal of Banking &
Finance 58, 144–165.
Basta, V. (2017). Venture investing in the US and Europe are totally dif-
ferent industries.
Benninga, S., M. Helmantel, and O. Sarig (2005). The timing of initial
public offerings. Journal of Financial Economics 75, 115–132.
Benveniste, L. M., W. Y. Busaba, and W. J. Wilhelm (2002). Information
Externalities and the Role of Underwriters in Primary Equity Markets.
Journal of Financial Intermediation 11 (1), 61–86.
21
Page 22
Benveniste, L. M. and P. A. Spindt (1989). How investment bankers deter-
mine the offer price and allocation of new issues. Journal of Financial
Economics 24 (2), 343–361.
Bergbrant, M. C., D. Bradley, and D. M. Hunter (2015). Does bank loan
supply affect the supply of equity capital? Evidence from new share is-
suance and withdrawal. Journal of Financial Intermediation 29, 32–45.
Bertoni, F., M. G. Colombo, and A. Quas (2015). The patterns of venture
capital investment in Europe. Small Business Economics 45 (3), 543560.
Bessler, W. and C. Bittelmeyer (2008). Patents and the performance of tech-
nology firms: Evidence from initial public offerings in Germany. Financial
Markets and Portfolio Management 22 (4), 323–356.
Bessler, W., C. Schneck, and J. Zimmermann (2017). Growth Strategies of
Initial Public Offerings in Europe. Working Paper .
Bessler, W. and S. Thies (2006). Initial Public Offerings, Subsequent Sea-
soned Equity Offerings, and Long-Run Performance: Evidence from IPOs
in Germany. The Journal of Entrepreneurial Finance and Business Ven-
tures 11 (3), 1–37.
Boeh, K. K. and C. G. Dunbar (2013). Post IPO Withdrawal Outcomes.
Working Paper .
Boeh, K. K. and C. Southam (2011). Impact of initial public offering coali-
tion on deal completion. Venture Capital 13 (4), 313–336.
Brau, J. C. and S. Fawcett (2006). Initial public offerings: An analysis of
theory and practice. The Journal of Finance 61 (1), 399–436.
Brau, J. C., N. K. Sutton, and N. W. Hatch (2010). Dual-track versus single-
track sell-outs: An empirical analysis of competing harvest strategies.
Journal of Business Venturing 25 (4), 389–402.
22
Page 23
Brav, A. and P. Gompers (2003). The Role of Lockups in Initial Public
Offerings. Review of Financial Studies 16 (1), 1–29.
Busaba, W. Y. (2006). Bookbuilding, the option to withdraw, and the timing
of IPOs. Journal of Corporate Finance 12 (2), 159–186.
Busaba, W. Y., L. M. Benveniste, and R.-J. Guo (2001). The option to with-
draw IPOs during the premarket: empirical analysis. Journal of Financial
Economics 60, 73–102.
Carter, R. and S. Manaster (1990). Initial Public Offerings and Underwriter
Reputation. The Journal of Finance 45 (4), 1045–1067.
Chahine, S. and I. Filatotchev (2008). The effects of venture capitalist
affiliation to underwriters on short- and long-term performance in French
IPOs. Global Finance Journal 18 (3), 351–372.
Chemmanur, T. J. and P. Fulghieri (1999). A Theory of the Going-Public
Decision. The Review of Financial Studies 12 (2), 249–279.
Chemmanur, T. J. and J. He (2011). IPO waves, product market compe-
tition, and the going public decision: Theory and evidence. Journal of
Financial Economics 101 (2), 382–412.
Chirinko, R. S. and J. A. Elston (2006). Finance, control and profitabil-
ity: the influence of German banks. Journal of Economic Behavior &
Organization 59, 69–88.
Connelly, B. L., S. T. Certo, D. Ireland, and C. R. Reutzel (2010). Signaling
theory: A review and assessment. Journal of Management 37 (1), 39–67.
Cumming, D. (2008). Contracts and Exits in Venture Capital Finance. The
Review of Financial Studies 21 (5), 1947–1982.
Djerbi, C. and J. Anis (2015). Boards, retained ownership and failure risk
of French IPO firms. Corporate Governance: The international journal
of business in society 15 (1), 108–121.
23
Page 24
Dunbar, C. G. (1998). The Choice between Firm-Commitment and Best-
Efforts Offering Methods in IPOs: The Effect of Unsuccessful Offers. Jour-
nal of Financial Intermediation 90, 60–90.
Dunbar, C. G. and S. R. Foerster (2008). Second time lucky? Withdrawn
IPOs that return to the market. Journal of Financial Economics 87 (3),
610–635.
Edelen, R. M. and G. B. Kadlec (2005). Issuer surplus and the partial
adjustment of IPO prices to public information. Journal of Financial
Economics 77, 347–373.
Elston, J. A. and L. Rondi (2006). Shareholder Protection and the Cost of
Capital. Working Paper CERIS-CNR 3-24 .
Engelen, P. J. and M. van Essen (2010). Underpricing of IPOs: Firm-,
issue- and country-specific characteristics. Journal of Banking and Fi-
nance 34 (8), 1958–1969.
Ewens, M. and J. Farre-Mensa (2017). The Evolution of the Private Equity
Market and the Decline in IPOs.
Field, L. C. and J. M. Karpoff (2002). Takeover defenses of IPO firms.
Journal of Finance 57 (5), 1857–1889.
Gill, A. and U. Walz (2016). Are VC-backed IPOs delayed trade sales?
Journal of Corporate Finance 37, 356–374.
Goergen, M., A. Khurshed, and L. Renneboog (2009). Why are the French
so different from the Germans? Underpricing of IPOs on the Euro New
Markets. International Review of Law and Economics 29 (3), 260–271.
Greene, M. (2016). Sale or IPO? Some Companies Take the Dual Route.
Groh, A. P., H. von Liechtenstein, and K. Lieser (2010). The European Ven-
ture Capital and Private Equity country attractiveness indices. Journal
of Corporate Finance 16, 205–224.
24
Page 25
Howton, S. D., S. W. Howton, and G. T. Olson (2001). Board Ownership
and IPO Returns. Journal of Economics and Finance 25 (1), 100–114.
Jenkinson, T. and H. Jones (2004). Bids and Allocations in European IPO
Bookbuilding. The Journal of Finance 54 (5), 2309–2338.
Klein, P. G., R. Wuebker, and K. Zoeller (2016). Relationship banking
and conflicts of interest: Evidence from German initial public offerings.
Journal of Corporate Finance 39, 210–221.
Krigman, L., W. H. Shaw, and K. L. Womack (2001). Why do firms switch
underwriters? Journal of Financial Economics 60, 254–284.
La Porta, R., F. Lopez-de Silanes, A. Shleifer, and R. W. Vishny (1997).
Legal Determinants of External Finance. The Journal of Finance 52 (3),
1131–1151.
La Porta, R., F. Lopez-de Silanes, A. Shleifer, and R. W. Vishny (1998).
Law and Finance. The Journal of Political Economy 106 (6), 1113–1155.
Levin, E. (2016). Why Europe lags behind the US in VC investment.
Lian, Q. and Q. Wang (2012). Acquisition valuations of withdrawn IPOs:
When IPO plans turn into mergers. Journal of Banking & Finance 36,
1424–1436.
Lowry, M. (2003). Why does IPO volume fluctuate so much? Journal of
Financial Economics 67, 3–40.
McGuiness, P. B. (2016). IPO Firm Performance and Its Link with Board
Officer Gender, Family-Ties and Otjer Demographics. Journal of Business
Ethics 43, 197–212.
Migliorati, K. and S. Vismara (2014). Ranking underwriters of European
IPOs. European Financial Management 20 (5), 891–925.
25
Page 26
Nahata, R. (2008). Venture capital reputation and investment performance.
Journal of Financial Economics 90, 127–151.
Oehler, A., T. A. Herberger, M. Horn, and H. Schalkowski (2016). IPOs,
the Level of Private Equity Engagement and Stock Performance Matters:
Empirical Evidence from Germany. Corporate Ownership and Control 15,
72–82.
Owen-Smith, J., N. C. Cotton-Nessler, and H. Buhr (2015). Network effects
on organizational decision-making: Blended social mechanisms and IPO
withdrawal. Social Networks 41, 1–17.
Pagano, M., F. Panetta, and L. Zingales (1998). Why do companies go
public? An empirical analysis. The Journal of Finance 53 (1), 27–64.
Proksch, D., W. Stranz, N. Rohr, C. Ernst, A. Pinkwart, and M. Schefczyk
(2017). Value-adding activities of venture capital companies: a con-
tent analysis of investors original documents in Germany. Venture Capi-
tal 19 (3), 129–146.
Reber, B. (2017). Does mispricing, liquidity or third-party certification con-
tribute to IPO downside risk? International Review of Financial Analy-
sis 51, 25–53.
Ritter, J. R. (1987). The costs of going public. Journal of Financial Eco-
nomics 19, 269–281.
Ritter, J. R. (2003). Differences between European and American IPO Mar-
kets. European Financial Management 9 (4), 421–434.
Rock, K. (1986). Why New Issues are Underpriced. Journal of Financial
Economics 15, 187–212.
Sala-I-Martin, X. X. (1997). I Just Ran Two Million Regressions. American
Economic Review 87 (2), 178–183.
26
Page 27
Scribano, F. (2015). The Impact of Third- Party Certification on Italian
Initial Public Offerings. Working Paper .
Sherman, A. E. and S. Titman (2002). Building the IPO order book: Un-
derpricing and participation limits with costly information. Journal of
Financial Economics 65 (1), 3–29.
Shi, Y., W. M. Liu, and K. Y. Ho (2016). Public news arrival and the
idiosyncratic volatility puzzle. Journal of Empirical Finance 37, 159–172.
Singh, I. and J.-L. van der Zahn (2007). Does intellectual capital disclosure
reduce an IPO’s cost of capital? The case of underpricing. Journal of
Intellectual Capital 8 (3), 494–516.
Tykvova, T. and U. Walz (2007). How important is participation of different
venture capitalists in German IPOs? Global Finance Journal 17 (3), 350–
378.
27
Page 28
Table 1: Data Definition and Sources
Variable Variable Name Source Definition Predicted Effect
a1 ROL - Rule of
Law
The Heritage
Foundation
Provides annual data on how the rule of law and
its enforcement is experienced by the general pub-
lic including dimensions such as property rights and
freedom from corruption.
-
a2 Regulatory Effi-
ciency
The Heritage
Foundation
Provides annual data on how the regulatory effi-
ciency is experienced by the general public including
quantitative measures such as labour, business and
monetary freedom.
-
a3 Open Markets The Heritage
Foundation
Provides annual data on how the openness of the
markets is experienced by the general public includ-
ing dimensions such as trade, investment and finan-
cial freedom.
-
a4 Common Law
Dummy
Prospectus This dummy variable takes the value of 1 if the IPO
is in a common law jurisdiction and 0 otherwise.
-
Economic Environment
a5 10 yr Govern-
ment Bond
Thomson
Reuters Datas-
tream
The basis points of the 10 year Government Bond
yields are provided on a monthly basis and approxi-
mate the cost of lending.
-
Continued on next page
28
Page 29
Table 1 – continued from previous page
Variable Variable Name Source Definition Predicted Effect
a6 Credit Spread Thomson
Reuters Datas-
tream
The monthly difference between the 10 yr Govern-
ment Bond and the 1 year Government Bond yields
signals the credit conditions.
+
a7 dGDP - change
of the Gross Do-
mestic Product
Bloomberg An aggregate measure of production equal to the sum
of the gross values added of all resident, institutional
units engaged in production. It provides information
on the economic performance of a country.
-
Market Environment
a8 dIndex - change
of the stock
market index
Bloomberg/
Thomson
Reuters Datas-
tream
It is the change of the corresponding main stock mar-
ket index providing information on the equity market
(bull or bear market).
-
a9 VIX - Chicago
Board Options
Exchange SPX
Volatility Index
Bloomberg This index represents a market estimate of the future
volatility.
+
Continued on next page
29
Page 30
Table 1 – continued from previous page
Variable Variable Name Source Definition Predicted Effect
a10 Hotness
Dummy
Bloomberg The rolling averages of the number of filings 180 days
prior to the IPO are computed. If the company faces
a higher competition than average, the dummy vari-
able takes a value of 1 and 0 otherwise. This dummy
is not complimentary to a coldness dummy.
-
a11 Negative News
Dummy
Lexis Nexis
(handpicked)
If the IPO company is mentioned in the same
paragraph with specific negative terms given by
the Lexis Nexis Negative News Search one year
prior to the IPO or withdrawal, the dummy
takes the value of 1 and 0 otherwise. The neg-
ative terms defined by the Lexis Nexis Negative
News Search as well as the code in the differ-
ent languages is available upon request. http:
//help.lexisnexis.com/tabula-rasa/lninexis/
searchnegativecompanyinfo_hdi-task?lbu=GB&
locale=es_ES&audience=business
+
Offer Characteristics
a12 Offer Size Prospectus/
Bloomberg
The natural logarithm of the company’s offer size is
computed.
+
Continued on next page
30
Page 31
Table 1 – continued from previous page
Variable Variable Name Source Definition Predicted Effect
Offer Size
Dummy
Prospectus/
Bloomberg
The rolling averages of the offer sizes are computed.
This dummy takes the value of 1 if the size of the
offer is above average and 0 otherwise.
+
a13 Debt Retire-
ment Dummy
Prospectus This dummy variable takes the value of 1 if the IPO
company intends to retire debt with the IPO pro-
ceeds and 0 otherwise.
+
a14 IC - Intellectual
Capital Dummy
Prospectus This dummy variable takes a value of 1 if the com-
pany discloses the intellectual capital or its compet-
itive advantage in the prospectus and 0 if the IC is
not mentioned or disclosed.
-
a15 PE - Private Eq-
uity Dummy
Prospectus This dummy variable takes a value of 1 if the com-
pany mentions private equity involvement in the
prospectus and 0 otherwise.
+
a16 VC - Venture
Capital Dummy
Prospectus This dummy variable takes a value of 1 if the com-
pany mentions venture capital involvement in the
prospectus and 0 otherwise.
+
Continued on next page
31
Page 32
Table 1 – continued from previous page
Variable Variable Name Source Definition Predicted Effect
a17 Underwriter Prospectus/
Bloomberg
The underwriter reputation is classified according
to the European ranking of Migliorati and Vismara
(2014) which ranges from 0 to the highest reputa-
tion of 1. In case of a consortium of underwriters,
the average of the underwriter reputation is taken.
-
Firm Characteristics
a18 Firm Size Prospectus/
Bloomberg
The natural logarithm of the company’s total assets
is computed.
-
Firm Size
Dummy
Prospectus/
Bloomberg
The rolling averages of the firm sizes measured by
total assets are computed. This dummy takes the
value of 1 if the size of the company is above average
and 0 otherwise.
-
a19 Age Prospectus/
Bloomberg
The natural logarithm of the company’s age is com-
puted.
-
Age Dummy Prospectus/
Bloomberg
The rolling averages of the firm ages are computed.
The dummy takes a value of 1 if the firm age is above
average and 0 otherwise.
-
a20 CapEx - Capital
Expenditures
Prospectus/
Bloomberg
The position of capital expenditures is divided by the
total assets to get the CapEx ratio.
-
Continued on next page
32
Page 33
Table 1 – continued from previous page
Variable Variable Name Source Definition Predicted Effect
a21 NI - Net Income Prospectus/
Bloomberg
The position of net income is divided by the total
assets to get the return on assets.
-
a22 Debt Prospectus/
Bloomberg
The position of debt is divided by the total assets to
compute the level of leverage of the IPO company.
+
a23 High-tech
Dummy
Prospectus/
Company Reg-
ister
This dummy variable takes the value of 1 if the IPO
company belongs to the high-tech industry and 0
otherwise. The categorisation of high-tech is based
on the Eurostat definition and includes the following
NACE codes (nomenclature statistique des activits
conomiques dans la Communaut europenne): 21, 26,
59, 60, 61, 62, 63, 72.
+
a24 MNAT- Multi-
nationality
Prospectus The scale of Aggarwal et al. (2011) is taken to quan-
tify the degree of multinationality which includes for
instance the revenue created abroad or foreign as-
sets. In case no country-level information can be
gathered, the presence of subsidiaries are taken. The
scale differentiates between seven categories of multi-
nationality where the highest level of MNAT is the
cumulation of all classifications up to the value of 1.
-
Continued on next page
33
Page 34
Table 1 – continued from previous page
Variable Variable Name Source Definition Predicted Effect
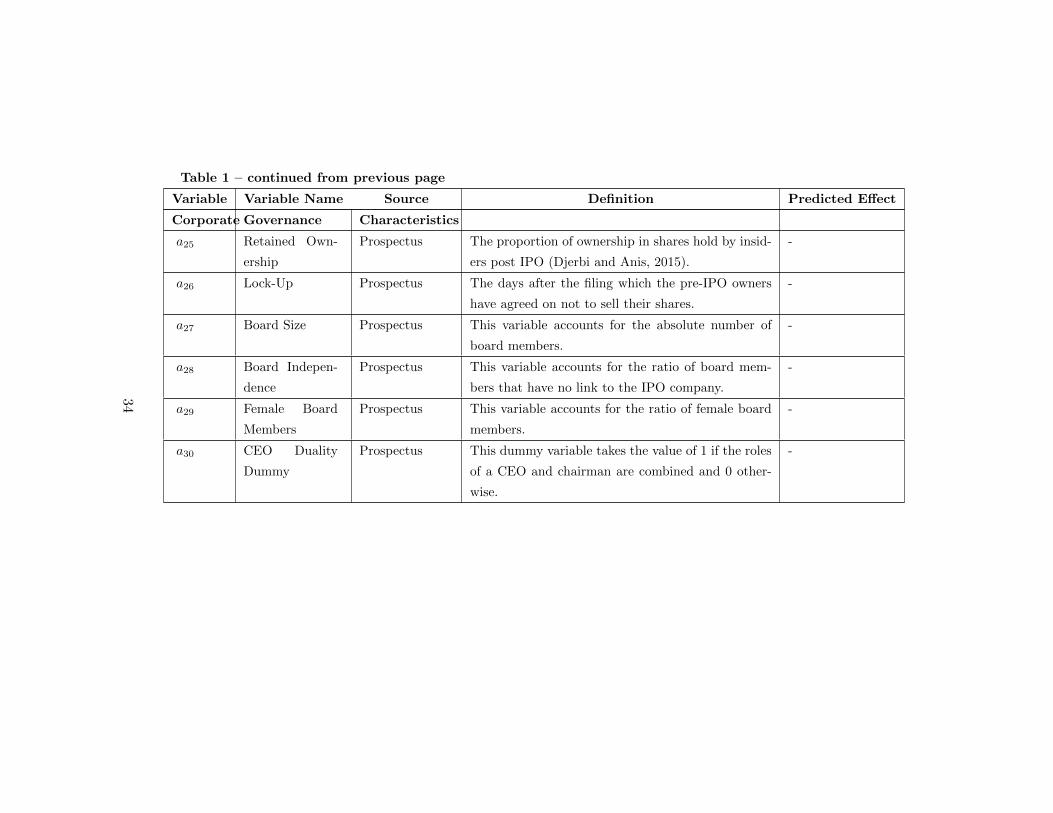
Corporate Governance Characteristics
a25 Retained Own-
ership
Prospectus The proportion of ownership in shares hold by insid-
ers post IPO (Djerbi and Anis, 2015).
-
a26 Lock-Up Prospectus The days after the filing which the pre-IPO owners
have agreed on not to sell their shares.
-
a27 Board Size Prospectus This variable accounts for the absolute number of
board members.
-
a28 Board Indepen-
dence
Prospectus This variable accounts for the ratio of board mem-
bers that have no link to the IPO company.
-
a29 Female Board
Members
Prospectus This variable accounts for the ratio of female board
members.
-
a30 CEO Duality
Dummy
Prospectus This dummy variable takes the value of 1 if the roles
of a CEO and chairman are combined and 0 other-
wise.
-
34
Page 35
Table 2: Withdrawn and successful IPOs 2001 - 2015
Successful IPOs Withdrawn IPOs
Year Absolute Percentage Absolute Percentage Total
2001 192 83.48% 38 16.52% 230
2002 112 84.21% 21 15.79% 133
2003 81 96.43% 3 3.57% 84
2004 261 91.90% 23 8.10% 284
2005 366 91.73% 33 8.27% 399
2006 360 89.11% 44 10.89% 404
2007 283 91.00% 28 9.00% 311
2008 88 82.24% 19 17.76% 107
2009 16 88.89% 2 11.11% 18
2010 112 81.16% 26 18.84% 138
2011 99 77.95% 28 22.05% 127
2012 58 85.29% 10 14.71% 68
2013 95 89.62% 11 10.38% 106
2014 175 87.94% 24 12.06% 199
2015 176 88.00% 24 12.00% 200
Total 2474 88.11% 334 11.89% 2808
The database includes 2808 observations from 2001-2015. This table reports the absolute number and percent-
age of IPO filings for each year in Denmark, France, Germany, Italy, Norway, Spain, Sweden, and the United
Kingdom.
35
Page 36
Table 3: Descriptive Statistics
Successful IPOs Withdrawn IPOs p-value successful
Variable Mean St.D. Mean St.D. vs. withdrawn
Regulatory Environment
α1 Rule of Law 81.82 11.10 78.15 13.88 0.0000
α2 Regulatory Efficiency 79.35 5.95 78.47 5.89 0.0109
α3 Open Markets 78.92 8.46 78.55 7.62 0.4533
α4 Common Law Dummy 0.53 0.50 0.44 0.50 0.0025
Economic Environment
α5 10yr Government Bond 3.89 1.19 3.86 1.18 0.6443
α6 Credit Spread 0.88 1.17 1.23 1.22 0.0000
α7 dGDP 0.02 0.01 0.02 0.01 0.0737
Market Environment
α8 dINDEX 0.00 0.03 0.00 0.04 0.0003
α9 VIX 17.04 5.55 18.66 6.28 0.0000
α10 Hotness Dummy 0.63 0.48 0.58 0.49 0.0661
α11 Negative News Dummy 0.07 0.25 0.31 0.46 0.0000
Offer Characteristics
α12 Offer Size (emn) 174.71 2529.41 504.96 2912.79 0.0281
α13 Debt Retirement Dummy 0.14 0.35 0.27 0.45 0.0000
α14 Intellectual Capital Dummy 0.34 0.47 0.19 0.39 0.0000
α15 Private Equity Dummy 0.16 0.37 0.24 0.43 0.0003
α16 Venture Capital Dummy 0.06 0.23 0.10 0.30 0.0033
α17 Underwriter 0.24 0.26 0.25 0.27 0.7456
Firm Characteristics
α18 Firm Size (emn) 1683.34 16820.81 6645.30 59782.44 0.0011
α19 Age 15.55 26.39 21.98 33.84 0.0001
α20 CapEx 0.20 4.43 0.13 1.28 0.7780
α21 Net Income -0.07 6.48 0.55 13.81 0.1700
α22 Debt 0.62 1.22 3.07 40.08 0.0025
α23 High-tech Dummy 0.24 0.43 0.21 0.41 0.2878
α24 Multinationality 0.29 0.18 0.31 0.20 0.1832
Corporate Governance Characteristics
α25 Retained Ownership 0.56 0.26 0.52 0.29 0.0033
α26 Lock-Up (days) 250.74 175.13 126.64 164.79 0.0000
α27 Board Size 5.62 2.63 5.87 3.91 0.1160
α28 Board Independence 0.26 0.27 0.15 0.22 0.0000
α29 Female Board Members (%) 0.09 0.14 0.09 0.15 0.5873
α30 CEO Duality 0.15 0.36 0.14 0.35 0.6840
The database includes 2474 observations for successful IPOs and 334 for withdrawn IPOs. This table reports
the means and standard deviations for 30 variables broken down by successful and withdrawn IPO filing. All
variable definitions can be found in Table 1.
36
Page 37
Table 4: Determinants of IPO WithdrawalProbit Regression (Levels) Probit Regression (Dummy Variables)
Variable Coef Marginal Effect (pct) Coef Marginal Effect (pct)
Regulatory Environment
α1 Rule of Law -0.0163*** -0.25 -0.0157*** -0.24
α2 Regulatory Efficiency 0.0014 0.02 0.0010 0.01
α3 Open Markets 0.0079*** 0.12 0.0093*** 0.14
α4 Common Law Dummy -0.2781 -4.22 -0.3445* -5.34
Economic Environment
α5 10yr Government Bond -0.0001 0.00 -0.0002 0.00
α6 Credit Spread -0.0001 0.00 0.0000 0.00
α7 dGDP 0.0003 0.00 0.0003 0.01
Market Environment
α8 dINDEX -0.0001 0.00 -0.0002 0.00
α9 VIX 0.0019* 0.03 0.0015 0.02
α10 Hotness Dummy 0.0243 0.37 0.0264 0.41
α11 Negative News Dummy 0.8967*** 13.61 0.9148*** 14.192
Offer Characteristics
α12 Offer Size / Dummy 0.0004*** 0.01 0.3541*** 5.49
α13 Debt Retirement Dummy 0.2739*** 4.16 0.2565** 3.98
α14 Intellectual Capital Dummy -0.3644*** -5.53 -0.3478*** -5.40
α15 Private Equity Dummy 0.1974* 3.00 0.1780 2.76
α16 Venture Capital Dummy 0.3186** 4.83 0.3403** 5.28
α17 Underwriter -0.0006** -0.01 -0.0005* -0.01
Firm Characteristics
α18 Firm Size / Dummy -0.0004*** -0.01 -0.2934** -4.55
α19 Age / Dummy 0.0023 0.03 -0.0592 -0.92
α20 CapEx -0.0002*** 0.00 -0.0002*** 0.00
α21 Net Income -0.0001* 0.00 -0.0001 0.00
α22 Debt 0.0001 0.00 0.0001 0.00
α23 High-tech Dummy 0.0227 0.34 0.0163 0.25
α24 Multinationality 0.0158 0.24 0.0288 0.45
Corporate Governance Characteristics
α25 Retained Ownership -0.0001 0.00 -0.0001* 0.00
α26 Lock-Up -0.0025*** -0.04 -0.0025*** -0.04
α27 Board Size -0.0179 -0.27 -0.0019 -0.03
α28 Board Independence -0.0081*** -0.12 -0.0084*** -0.13
α29 Female Board Members -0.0030 -0.05 -0.0023 -0.04
α30 CEO Duality -0.4277*** -6.49 -0.3758*** -5.83
HL Statistic 13.47 19.79
McFadden-R2 0.2458 0.2287
The dependent variable equals 1 for IPO withdrawals and 0 otherwise. Marginal Effects are defined as follows.
The probit employs normalisation that fixes the standard deviation of the error term to 1 where each coefficient
represents the marginal effect of a unit change on the probability that the dependent variable takes the value
of 1 (IPO withdrawal) given that all other independent variables are constant (Aldrich and Nelson, 1984). The
McFadden R-squared is defined as 1 less the log likelihood for the estimated model divided by the log likelihood
for a model with only an intercept as an independent variable. While the Hosmer-Lemeshow Statistic represents
the goodness of fit that observed events match estimated events in ten subgroups of the model population. The
database includes 2808 observations. Other goodness of fit variables for the probit regression using all 30 variables
defined in Table 1 include the p-value HL 0.0967 and for the second regression using the dummy variables for
firm size, offer size and firm age we get a p-value HL 0.0113.
37
Page 38
Table 5: Determinants of IPO Withdrawal excl. UKProbit Regression (Levels) Probit Regression (Dummy Variables)
Variable Coef Marginal Effect (pct) Coef Marginal Effect (pct)
Regulatory Environment
α1 Rule of Law -0.0191*** -0.32 -0.0187*** -0.32
α2 Regulatory Efficiency 0.0009 0.02 0.0004 0.01
α3 Open Markets 0.0097*** 0.16 0.0108*** 0.18
Economic Environment
α4 10yr Government Bond 0.0007 0.01 0.0007 0.01
α5 Credit Spread -0.0004 -0.01 -0.0003 -0.01
α6 dGDP 0.0009 0.01 0.0007 0.01
Market Environment
α7 dINDEX -0.0003 -0.01 -0.0004 -0.01
α8 VIX 0.0010 0.02 0.0005 0.01
α9 Hotness Dummy -0.1001 -1.68 -0.1005 -1.70
α10 Negative News Dummy 1.0490*** 17.63 1.0934*** 18.47
Offer Characteristics
α11 Offer Size / Dummy 0.0007*** 0.01 0.3428** 5.79
α12 Debt Retirement Dummy 0.3625** 6.09 0.3752*** 6.34
α13 Intellectual Capital Dummy -0.2526** -4.24 -0.2272* -3.84
α14 Private Equity Dummy 0.1378 2.32 0.1371 2.32
α15 Venture Capital Dummy 0.5274*** 8.86 0.5072*** 8.57
α16 Underwriter -0.0009* -0.02 -0.0008 -0.01
Firm Characteristics
α17 Firm Size / Dummy -0.0006*** -0.01 -0.4034** -6.81
α18 Age / Dummy 0.0022 0.04 -0.0451 -0.76
α19 CapEx -0.0002 0.00 -0.0002 0.00
α20 Net Income -0.0003* 0.00 -0.0002 0.00
α21 Debt 0.0000 0.00 0.0000 0.00
α22 High-tech Dummy 0.0415 0.70 0.0079 0.13
α23 Multinationality 0.0218 0.37 0.0432 0.73
Corporate Governance Characteristics
α24 Retained Ownership -0.0005** -0.01 -0.0006*** -0.01
α25 Lock-Up -0.0023*** -0.04 -0.0024*** -0.04
α26 Board Size -0.0148 -0.25 0.0049 0.08
α27 Board Independence -0.0074*** -0.12 -0.0072*** -0.12
α28 Female Board Members -0.0039 -0.07 -0.0034 -0.06
α29 CEO Duality -0.8098*** -13.61 -0.8171*** -13.80
HL Statistic 11.26 5.67
McFadden-R2 0.2429 0.2395
The dependent variable equals 1 for IPO withdrawals and 0 otherwise. Marginal Effects are defined as follows.
The probit employs normalisation that fixes the standard deviation of the error term to 1 where each coefficient
represents the marginal effect of a unit change on the probability that the dependent variable takes the value
of 1 (IPO withdrawal) given that all other independent variables are constant (Aldrich and Nelson, 1984). The
McFadden R-squared is defined as 1 less the log likelihood for the estimated model divided by the log likelihood
for a model with only an intercept as an independent variable. While the Hosmer-Lemeshow Statistic represents
the goodness of fit that observed events match estimated events in ten subgroups of the model population. The
French, German, Italian, Scandinavian and Spanish database includes 1354 observations. Other goodness of fit
variables for the probit regression using all 29 variables defined in Table 1 include the p-value HL 0.1876 and for
the second regression using the dummy variables for firm size, offer size and firm age the p-value HL 0.6836.
38
Page 39
Table 6: Determinants of IPO Withdrawal - UKProbit Regression (Levels) Probit Regression (Dummy Variables)
Variable Coef Marginal Effect (pct) Coef Marginal Effect (pct)
Regulatory Environment
α1 Rule of Law -0.0336 -0.40 -0.0329 -0.41
α2 Regulatory Efficiency -0.0215 -0.25 -0.0209 -0.26
α3 Open Markets -0.0193 -0.23 -0.0115 -0.14
Economic Environment
α4 10yr Government Bond -0.0009 -0.01 -0.0016 -0.02
α5 Credit Spread 0.0001 0.00 0.0003 0.00
α6 dGDP -0.0142 -0.17 -0.0097 -0.12
Market Environment
α7 dINDEX 0.0010 0.01 0.0007 0.01
α8 VIX 0.0017 0.02 0.0015 0.02
α9 Hotness Dummy 0.0243 0.29 0.0051 0.06
α10 Negative News Dummy 0.8231*** 9.73 0.8487*** 10.58
Offer Characteristics
α11 Offer Size / Dummy 0.0009*** 0.01 0.2666 3.32
α12 Debt Retirement Dummy 0.3004* 3.55 0.2403 3.00
α13 Intellectual Capital Dummy -0.9934*** -11.75 -0.9710*** -12.11
α14 Private Equity Dummy 0.3565 4.22 0.2452 3.06
α15 Venture Capital Dummy 0.1916 2.27 0.2334 2.91
α16 Underwriter 0.0001 0.00 -0.0001 0.00
Firm Characteristics
α17 Firm Size / Dummy -0.0010*** -0.01 -0.0455 -0.57
α18 Age / Dummy 0.0012 0.01 -0.1042 -1.30
α19 CapEx -0.0008*** -0.01 -0.0008*** -0.01
α20 Net Income -0.0001 0.00 0.0000 0.00
α21 Debt 0.0002 0.00 0.0002 0.00
α22 High-tech Dummy 0.0564 0.67 0.0817 1.02
α23 Multinationality 0.0409 0.48 0.0282 0.35
Corporate Governance Characteristics
α24 Retained Ownership 0.0003 0.00 0.0002 0.00
α25 Lock-Up -0.0026*** -0.03 -0.0025*** -0.03
α26 Board Size 0.0046 0.05 0.0073 0.09
α27 Board Independence -0.0310*** -0.37 -0.0345*** -0.43
α28 Female Board Members -0.0012 -0.01 0.0005 0.01
α29 CEO Duality 0.1754 2.07 0.2064 2.57
HL Statistic 9.54 10.92
McFadden-R2 0.3405 0.3048
The dependent variable equals 1 for IPO withdrawals and 0 otherwise. Marginal Effects are defined as follows.
The probit employs normalisation that fixes the standard deviation of the error term to 1 where each coefficient
represents the marginal effect of a unit change on the probability that the dependent variable takes the value
of 1 (IPO withdrawal) given that all other independent variables are constant (Aldrich and Nelson, 1984). The
McFadden R-squared is defined as 1 less the log likelihood for the estimated model divided by the log likelihood
for a model with only an intercept as an independent variable. While the Hosmer-Lemeshow Statistic represents
the goodness of fit that observed events match estimated events in ten subgroups of the model population.
The UK database includes 1454 observations. Other goodness of fit variables for the probit regression using all
29 variables defined in Table 1 include the p-value HL 0.2991 and for the second regression using the dummy
variables for firm size, offer size and firm age the p-value HL 0.2061.
39
Page 40
Table 7: Determinants of IPO Withdrawal - FranceProbit Regression (Levels) Probit Regression (Dummy Variables)
Variable Coef Marginal Effect (pct) Coef Marginal Effect (pct)
Regulatory Environment
α1 Rule of Law -0.1948** -2.01 -0.1241* -1.37
α2 Regulatory Efficiency 0.0016 0.02 -0.0522 -0.58
α3 Open Markets 0.0503 0.52 0.0571 0.63
Economic Environment
α4 10yr Government Bond -0.0094 -0.10 -0.0009 -0.01
α5 Credit Spread -0.0038 -0.04 -0.0026 -0.03
α6 dGDP 0.0381 0.39 0.0779* 0.86
Market Environment
α7 dINDEX 0.0043 0.04 0.0032 0.04
α8 VIX 0.0059 0.06 -0.0002 0.00
α9 Hotness Dummy -0.3256 -3.36 -0.1337 -1.48
α10 Negative News Dummy 1.0793*** 11.13 0.9626*** 10.64
Offer Characteristics
α11 Offer Size / Dummy 0.0074*** 0.08 1.0410** 11.51
α12 Debt Retirement Dummy 0.6484* 6.69 0.6922** 7.65
α13 Intellectual Capital Dummy -0.6174 -6.37 -1.0080*** -11.14
α14 Private Equity Dummy 0.0970 1.00 0.3043 3.36
α15 Venture Capital Dummy 0.7907 8.15 0.8974** 9.92
α16 Underwriter -0.0084* -0.09 -0.0046 -0.05
Firm Characteristics
α17 Firm Size / Dummy -0.0002 0.00 -0.0069 -0.08
α18 Age / Dummy -0.0057 -0.06 -0.4904 -5.42
α19 CapEx -0.0015 -0.01 -0.0010 -0.01
α20 Net Income -0.0015 -0.02 -0.0008 -0.01
α21 Debt 0.0007 0.01 -0.0001 0.00
α22 High-tech Dummy -0.1852 -1.91 -0.1914 -2.12
α23 Multinationality 0.0899 0.93 0.1459 1.61
Corporate Governance Characteristics
α24 Retained Ownership -0.0015 -0.02 -0.0020 -0.02
α25 Lock-Up -0.0043*** -0.04 -0.0032** -0.04
α26 Board Size -0.1505*** -1.55 -0.0922 -1.02
α27 Board Independence -0.0180 -0.19 -0.0218 -0.24
α28 Female Board Members -0.0139 -0.14 -0.0158 -0.17
α29 CEO Duality -0.7038** -7.26 -0.6589** -7.28
HL Statistic 0.96 12.25
McFadden-R2 0.4251 0.3942
The dependent variable equals 1 for IPO withdrawals and 0 otherwise. Marginal Effects are defined as follows.
The probit employs normalisation that fixes the standard deviation of the error term to 1 where each coefficient
represents the marginal effect of a unit change on the probability that the dependent variable takes the value
of 1 (IPO withdrawal) given that all other independent variables are constant (Aldrich and Nelson, 1984). The
McFadden R-squared is defined as 1 less the log likelihood for the estimated model divided by the log likelihood
for a model with only an intercept as an independent variable. While the Hosmer-Lemeshow Statistic represents
the goodness of fit that observed events match estimated events in ten subgroups of the model population. The
French database includes 398 observations. Other goodness of fit variables for the probit regression using all
29 variables defined in Table 1 include the p-value HL 0.9985 and for the second regression using the dummy
variables for firm size, offer size and firm age the p-value HL 0.1406.
40
Page 41
Table 8: Determinants of IPO Withdrawal - GermanyProbit Regression (Levels) Probit Regression (Dummy Variables)
Variable Coef Marginal Effect (pct) Coef Marginal Effect (pct)
Regulatory Environment
α1 Rule of Law -0.0372 -0.44 0.0038 0.04
α2 Regulatory Efficiency -0.0392 -0.46 -0.0588 -0.70
α3 Open Markets -0.0786 -0.93 -0.1088 -1.29
Economic Environment
α4 10yr Government Bond -0.0026 -0.03 -0.0014 -0.02
α5 Credit Spread -0.0051 -0.06 -0.0045 -0.05
α6 dGDP 0.0081 0.10 -0.0005 -0.01
Market Environment
α7 dINDEX -0.0063 -0.07 -0.0078 -0.09
α8 VIX 0.0091 0.11 0.0088 0.10
α9 Hotness Dummy -0.2988 -3.53 -0.4932 -5.84
α10 Negative News Dummy 1.4770*** 17.46 1.3600*** 16.09
Offer Characteristics
α11 Offer Size / Dummy 0.0032 0.04 0.4612 5.46
α12 Debt Retirement Dummy 0.6841 8.09 0.8448* 10.00
α13 Intellectual Capital Dummy -0.1927 -2.28 -0.1003 -1.19
α14 Private Equity Dummy 0.8406** 9.94 0.8219** 9.72
α15 Venture Capital Dummy 2.8850*** 34.11 2.8060*** 33.21
α16 Underwriter 0.0002 0.00 0.0009 0.01
Firm Characteristics
α17 Firm Size / Dummy -0.0066*** -0.08 -1.2100** -14.32
α18 Age / Dummy -0.0029 -0.03 -0.5675 -6.71
α19 CapEx 0.0039** 0.05 0.0018 0.02
α20 Net Income 0.0000 0.00 0.0008 0.01
α21 Debt 0.0021 0.03 0.0019 0.02
α22 High-tech Dummy -0.3894 -4.60 -0.5607 -6.63
α23 Multinationality 0.1583 1.87 0.2453** 2.90
Corporate Governance Characteristics
α24 Retained Ownership -0.0045** -0.05 -0.0047** -0.06
α25 Lock-Up -0.0012 -0.01 -0.0015 -0.02
α26 Board Size 0.0673 0.80 0.0826** 0.98
α27 Board Independence -0.0468** -0.55 -0.0465** -0.55
α28 Female Board Members -0.0169 -0.20 -0.0102 -0.12
α29 CEO Duality -5.4940 -64.95 -5.6260 -66.56
HL Statistic 6.06 3.73
McFadden-R2 0.4714 0.4723
The dependent variable equals 1 for IPO withdrawals and 0 otherwise. Marginal Effects are defined as follows.
The probit employs normalisation that fixes the standard deviation of the error term to 1 where each coefficient
represents the marginal effect of a unit change on the probability that the dependent variable takes the value
of 1 (IPO withdrawal) given that all other independent variables are constant (Aldrich and Nelson, 1984). The
McFadden R-squared is defined as 1 less the log likelihood for the estimated model divided by the log likelihood
for a model with only an intercept as an independent variable. While the Hosmer-Lemeshow Statistic represents
the goodness of fit that observed events match estimated events in ten subgroups of the model population. The
German database includes 295 observations. Other goodness of fit variables for the probit regression using all
29 variables defined in Table 1 include the p-value HL 0.6400 and for the second regression using the dummy
variables for firm size, offer size and firm age the p-value HL 0.8802.
41
Page 42
Table 9: Determinants of IPO Withdrawal - ItalyProbit Regression (Levels) Probit Regression (Dummy Variables)
Variable Coef Marginal Effect (pct) Coef Marginal Effect (pct)
Regulatory Environment
α1 Rule of Law -0.1436* -1.67 -0.1626** -1.89
α2 Regulatory Efficiency -0.0606 -0.70 -0.0361 -0.42
α3 Open Markets -0.0700 -0.81 -0.0317 -0.37
Economic Environment
α4 10yr Government Bond 0.0087 0.10 0.0102 0.12
α5 Credit Spread 0.0073 0.08 -0.0018 -0.02
α6 dGDP 0.0058 0.07 0.0017 0.02
Market Environment
α7 dINDEX 0.0031 0.04 0.0068 0.08
α8 VIX 0.0058 0.07 0.0071 0.08
α9 Hotness Dummy -0.4044 -4.69 -0.2654 -3.09
α10 Negative News Dummy 1.3630*** 15.82 1.6600*** 19.32
Offer Characteristics
α11 Offer Size / Dummy 0.0035 0.04 -0.7298 -8.49
α12 Debt Retirement Dummy 0.6737 7.82 0.7784 9.06
α13 Intellectual Capital Dummy -0.9649*** -11.20 -1.0210*** -11.88
α14 Private Equity Dummy 0.0095 0.11 0.0625 0.73
α15 Venture Capital Dummy 1.4280** 16.57 1.6580** 19.30
α16 Underwriter 0.0098 0.11 0.0135** 0.16
Firm Characteristics
α17 Firm Size / Dummy 0.0036 0.04 0.4119 4.79
α18 Age / Dummy 0.0001 0.00 0.6501 7.57
α19 CapEx -0.0132*** -0.15 -0.0124*** -0.14
α20 Net Income 0.0010 0.01 0.0019 0.02
α21 Debt 0.0028 0.03 0.0035 0.04
α22 High-tech Dummy 0.4078 4.73 0.3712 4.32
α23 Multinationality -0.0387 -0.45 0.0077 0.09
Corporate Governance Characteristics
α24 Retained Ownership 0.0004 0.00 0.0001 0.00
α25 Lock-Up -0.0044*** -0.05 -0.0049*** -0.06
α26 Board Size 0.0323 0.37 0.0391 0.46
α27 Board Independence -0.0337 -0.39 -0.0261 -0.30
α28 Female Board Members -0.0099 -0.12 -0.0072 -0.08
α29 CEO Duality -0.2782 -3.23 -0.5105 -5.94
HL Statistic 2.27 3.21
McFadden-R2 0.6173 0.6152
The dependent variable equals 1 for IPO withdrawals and 0 otherwise. Marginal Effects are defined as follows.
The probit employs normalisation that fixes the standard deviation of the error term to 1 where each coefficient
represents the marginal effect of a unit change on the probability that the dependent variable takes the value
of 1 (IPO withdrawal) given that all other independent variables are constant (Aldrich and Nelson, 1984). The
McFadden R-squared is defined as 1 less the log likelihood for the estimated model divided by the log likelihood
for a model with only an intercept as an independent variable. While the Hosmer-Lemeshow Statistic represents
the goodness of fit that observed events match estimated events in ten subgroups of the model population. The
Italian database includes 242 observations. Other goodness of fit variables for the probit regression using all
29 variables defined in Table 1 include the p-value HL 0.9705 and for the second regression using the dummy
variables for firm size, offer size and firm age the p-value HL 0.9208.
42
Page 43
Table 10: Determinants of IPO Withdrawal - ScandinaviaProbit Regression (Levels) Probit Regression (Dummy Variables)
Variable Coef Marginal Effect (pct) Coef Marginal Effect (pct)
Regulatory Environment
α1 Rule of Law -0.0375 -0.50 -0.0114 -0.15
α2 Regulatory Efficiency 0.0379* 0.50 0.0262 0.35
α3 Open Markets -0.0181 -0.24 -0.0089 -0.12
Economic Environment
α4 10yr Government Bond 0.0009 0.01 -0.0011 -0.01
α5 Credit Spread 0.0062** 0.08 0.0052* 0.07
α6 dGDP -0.0122 -0.16 -0.0117 -0.16
Market Environment
α7 dINDEX -0.0018 -0.02 -0.0031 -0.04
α8 VIX 0.0000 0.00 0.0010 0.01
α9 Hotness Dummy 0.1066 1.41 0.0469 0.63
α10 Negative News Dummy 2.8190*** 37.28 2.9050*** 38.75
Offer Characteristics
α11 Offer Size / Dummy 0.0003 0.00 0.0690 0.92
α12 Debt Retirement Dummy -0.1549 -2.05 -0.2277 -3.04
α13 Intellectual Capital Dummy 0.0459 0.61 0.0627 0.84
α14 Private Equity Dummy 0.5183 6.85 0.4705 6.28
α15 Venture Capital Dummy 0.2291 3.03 0.2537 3.38
α16 Underwriter 0.0371** 0.49 0.0325 0.43
Firm Characteristics
α17 Firm Size / Dummy -0.0077*** -0.10 -1.2750*** -17.01
α18 Age / Dummy 0.0096 0.13 0.0529 0.71
α19 CapEx 0.0015 0.02 0.0008 0.01
α20 Net Income -0.0005 -0.01 -0.0003 0.00
α21 Debt -0.0015 -0.02 -0.0013 -0.02
α22 High-tech Dummy 0.0002 0.00 0.0218 0.29
α23 Multinationality -0.1479 -1.96 -0.1466 -1.96
Corporate Governance Characteristics
α24 Retained Ownership -0.0011 -0.01 -0.0010 -0.01
α25 Lock-Up -0.0024*** -0.03 -0.0026*** -0.04
α26 Board Size 0.1307 1.73 0.0939 1.25
α27 Board Independence -0.0406*** -0.54 -0.0417*** -0.56
α28 Female Board Members 0.0077 0.10 -0.0005 -0.01
α29 CEO Duality -6.0560 -80.09 -6.3840 -85.17
HL Statistic 4.08 9.01
McFadden-R2 0.2929 0.2829
The dependent variable equals 1 for IPO withdrawals and 0 otherwise. Marginal Effects are defined as follows.
The probit employs normalisation that fixes the standard deviation of the error term to 1 where each coefficient
represents the marginal effect of a unit change on the probability that the dependent variable takes the value
of 1 (IPO withdrawal) given that all other independent variables are constant (Aldrich and Nelson, 1984). The
McFadden R-squared is defined as 1 less the log likelihood for the estimated model divided by the log likelihood
for a model with only an intercept as an independent variable. While the Hosmer-Lemeshow Statistic represents
the goodness of fit that observed events match estimated events in ten subgroups of the model population. The
Scandinavian database includes 357 observations. Other goodness of fit variables for the probit regression using
all 29 variables defined in Table 1 include the p-value HL 0.8503 and for the second regression using the dummy
variables for firm size, offer size and firm age the p-value HL 0.3415.
43
Page 44
Table 11: Determinants of IPO Withdrawal: Stepwise Probit Regression on full sampleProbit Regression (Levels) Probit Regression (Dummy Variables)
Variable Coef Marginal Effect (pct) Coef Marginal Effect (pct)
Regulatory Environment
α1 Rule of Law -0.0144 -0.29 -0.0141 -0.34
α3 Open Markets 0.0469 0.14 0.0493 0.18
α Common Law Dummy -0.5636 -2.66 -0.6143 -4.73
Economic Environment
α4 10yr Government Bond 0.0780 0.00 - -
α5 Credit Spread - - 0.0762 -0.01
α6 dGDP 9.1614 -0.01 8.8826 -0.01
Market Environment
α8 VIX 0.0222 0.02 0.0200 0.02
α10 Negative News Dummy 0.9563 13.89 0.9379 14.26
Offer Characteristics
α11 Offer Size 0.1244 0.01 0.3479 4.86
α12 Debt Retirement Dummy 0.2624 4.12 0.2460 3.74
α13 Intellectual Capital Dummy -0.4307 -6.11 -0.4038 -5.84
α14 Private Equity Dummy - - 0.1891 1.81
α15 Venture Capital Dummy 0.3684 3.98 0.3892 5.68
Firm Characteristics
α17 Firm Size -0.1045 -0.01 -0.2981 -4.62
α21 Debt - - 0.0513 0.00
Corporate Governance Characteristics
α25 Lock-Up -0.0026 -0.04 -0.0026 -0.05
α27 Board Independence -1.2641 -0.14 -1.2691 -0.14
α30 CEO Duality -0.3470 -8.07 -0.3157 -7.79
HL Statistic 14.94 5.42
McFadden-R2 0.2614 0.2456
The database includes 2808 observations. Other goodness of fit variables for the stepwise probit regression
include the p-value HL 0.0604. This stepwise probit regression is executed at a 0.05 significance level and started
off including all 30 variables outlined in Table 1. Other goodness of fit variables include the p-value HL 0.7124.
This stepwise probit regression is including the variables outlined in Table 1 while using the dummies for firm
size, offer size and age instead of the logarithmised values.
44
Page 45
Table 12: Determinants of IPO Withdrawal - Extreme Bound Analysis
Variable Normal Negative Normal Positive General Negative General Positive
Intercept 0.08 99.92 7.36 92.64
Regulatory Environment
α1 Rule of Law* 100.00 0.00 99.90 0.10
α2 Regulatory Efficiency 88.25 11.75 73.86 26.14
α3 Open Markets 14.88 85.12 38.44 61.57
Economic Environment
α4 10yr Government Bond 42.86 57.14 46.42 53.58
α5 Credit Spread* 0.00 100.00 0.18 99.82
α6 dGDP 71.44 28.56 67.30 32.70
Market Environment
α7 dINDEX* 99.94 0.06 99.53 0.47
α8 VIX* 0.00 100.00 0.01 99.99
α9 Hotness Dummy 84.37 15.63 80.42 19.58
α10 Negative News Dummy* 0.00 100.00 0.00 100.00
Offer Characteristics
α11 Offer Size / Dummy* 0.00 100.00 0.01 99.99
α12 Debt Retirement Dummy* 0.00 100.00 0.00 100.00
α13 Intellectual Capital Dummy* 100.00 0.00 100.00 0.00
α14 Private Equity Dummy* 0.29 99.71 2.20 97.80
α15 Venture Capital Dummy* 0.18 99.82 0.25 99.75
α16 Underwriter 66.40 33.60 64.50 35.50
Firm Characteristics
α17 Firm Size / Dummy* 99.00 1.00 81.82 18.18
α18 Age / Dummy* 0.93 99.07 6.40 93.60
α19 CapEx 61.45 38.56 61.25 38.75
α20 Net Income 17.80 82.21 20.14 79.86
α21 Debt* 0.22 99.78 0.24 99.76
α22 High-tech Dummy 76.68 23.32 72.97 27.03
α23 Multinationality 18.11 81.90 25.67 74.33
Corporate Governance Characteristics
α24 Retained Ownership* 99.73 0.27 97.85 2.15
α25 Lock-Up* 100.00 0.00 100.00 0.00
α26 Board Size 20.75 79.26 32.15 67.85
α27 Board Independence* 100.00 0.00 100.00 0.00
α28 Female Board Members 86.38 13.62 78.84 21.17
α29 CEO Duality 91.97 8.03 86.09 13.91
Following Sala-I-Martin (1997) the Extreme Bound analysis identifies the extent to which each variable influences
the probability on IPO withdrawal across 621,180 possible specifications. The EBA tests whether these variables
retain statistical significance across 100,000 of estimated models. Variables marked with a * are statistically
significant at a 0.05 significance level. Normal Negative/Positive represents the % of occurrences of the coefficient
on the variable being negative or positive, given that the error terms are normally distributed. While General is
the same, except with the error terms following a General Error Distribution.
45
Page 46
Figure 1: Why Firms Withdraw from IPO’s, Boeh and Dunbar (2013)
Figure 2: 82% coverage of Western European IPOs from 2001-2015. Source: Bloomberg
The chart shows the absolute numbers of IPO filings in Western Europe from 2001-2015. The red columns
represent the collected IPO data covering 82% of Western European.
46
Page 47
Figure 3: Percentage of listed vs. withdrawn IPOs
The chart shows the % distribution of companies, finally listed and withdrawn, by country in Western Europe
from 2001-2015.
47
Page 48
Figure 4: Extreme Bounds Analysis
Following Sala-I-Martin (1997) the Extreme Bound analysis identifies the extent to which each variable influences
the probability on IPO withdrawal across 621,180 possible specifications. The EBA tests whether these variables
retain statistical significance across 100,000 estimated models. The grey columns are the bins for the estimated
coefficients, the red vertical line is at zero, facilitating easy visual inspection of the sign of the coefficient.
48