32
The determinants of subjective wellbeing in a developing country: The Ecuadorian case Pontarollo Nicola Mercy Orellana Bravo Joselin Segovia Sarmiento 2018 EUR 28890 EN

The determinants of subjective wellbeing in a developing
country: The Ecuadorian case
Pontarollo Nicola
Mercy Orellana Bravo
Joselin Segovia Sarmiento
2018
EUR 28890 EN
This publication is a Technical report by the Joint Research Centre (JRC), the European Commission’s science
and knowledge service. It aims to provide evidence-based scientific support to the European policymaking
process. The scientific output expressed does not imply a policy position of the European Commission. Neither
the European Commission nor any person acting on behalf of the Commission is responsible for the use that
might be made of this publication.
Contact information
Name: Nicola Pontarollo
Address: Via E. Fermi 2749 I-21027 Ispra (VA) Italy
Email: [email protected]
Tel.: +39/0332786658
JRC Science Hub
https://ec.europa.eu/jrc
JRC109319
EUR 28890 EN
PDF ISBN 978-92-79-76843-9 ISSN 1831-9424 doi:10.2760/858865
Luxembourg: Publications Office of the European Union, 2018
© European Union, 2018
Reuse is authorised provided the source is acknowledged. The reuse policy of European Commission documents is regulated by Decision 2011/833/EU (OJ L 330, 14.12.2011, p. 39).
For any use or reproduction of photos or other material that is not under the EU copyright, permission must be
sought directly from the copyright holders.
How to cite this report: Nicola Pontarollo, Mercy Orellana Bravo, Joselin Segovia Sarmiento The determinants
of subjective wellbeing in a developing country: The Ecuadorian case, EUR 28890 EN, Publications Office of the European Union, Luxembourg, 2018, ISBN 978-92-79-76843-9, doi:10.2760/858865, JRC109319.
All images © European Union 2018.
i
Contents
1 Introduction ...................................................................................................... 3
2 Background, Methodology and Data ..................................................................... 4
2.1 Background................................................................................................. 4
2.2 Methodology ............................................................................................... 5
2.3 Data .......................................................................................................... 6
Individual variables ........................................................................................ 7
Contextual variables ...................................................................................... 9
3 Results ........................................................................................................... 12
4 Conclusion and policy implications ..................................................................... 15
References ......................................................................................................... 17
Appendix 1: Robustness check .............................................................................. 22
List of figures ...................................................................................................... 27
List of tables ....................................................................................................... 28

2
The determinants of subjective wellbeing in a developing country:
The Ecuadorian case
Nicola Pontarollo*
JRC European Commission, email: [email protected]
Mercy Orellana
GIER, Universidad de Cuenca, email: [email protected]
Joselin Segovia
GIER, Universidad de Cuenca, email: [email protected]
Abstract
Ecuador is a country characterized by deep social and territorial inequalities. In order to
overcome this issue the national government setup in 2008 the National Plan of Wellbeing, a
master plan whose objective is to put at the centre of the political action the wellbeing of the
human being. This study aims to analyze the individual and contextual determinants of
subjective wellbeing in Ecuador by examining a set of variables linked to the specific social
and territorial characteristics of the country and to its main policy priorities. The assessment
is based on econometric techniques able to account for the nested structure of the data,
namely ordinary least squares and ordered logit with clustered standard errors and multilevel
ordered logit. The results are robust and show that institutional trust, income, good housing
conditions and education fosters wellbeing. On the other hand, being a woman, belonging to
an ethnic minority or living in an oil dependent area is negatively correlated to subjective
wellbeing. The policy implications range from an improvement of the institutional framework
and redistributive system to better inclusion policies.
Keywords: individual wellbeing, Ecuador, multilevel model, clustered standard errors.
JEL classification: I3, P16, C30
*The views expressed are the author’s alone and do not necessarily correspond to those of the European Commission.
3
1 Introduction
In recent years, subjective wellbeing has provoked increasing interest from both social science
researchers and governmental institutions. In developed countries, it is worth mentioning the
Canadian Index of Wellbeing and the inclusion of the measure of “equitable and sustainable
wellbeing” in the Italian State Balance in 2016. Furthermore, the UK (Dolan et al. 2011),
France (Tavernier et al., 2015) and Germany (Die Bundesregierumg, 2017) all have initiatives
to include wellbeing into high level policy discussion. Developing countries are also beginning
to consider wellbeing formally, with Mexico and Brazil including it in their constitutions in 2010
and 2015, respectively, and Ecuador in 2008. In the last country, the principle of good living,
embodied in the Constitution and based on the ancestral concept of “Sumak Kawsay” (see
García Álvarez, 2014), guides social and state action (SENPLADES, 2009, p. 32) and is
operationalized through the National Plan for Good Living (SENPLADES, 2009).
In light of the originality of the Ecuadorian case, this paper aims to analyze the individual and
contextual determinants of subjective wellbeing in this country.
To our knowledge little research has been conducted on the determinants of wellbeing in South
American countries (among the few examples there are: Dugain & Olaberría, 2015; Gómez et
al., 2016; Graham & Felton, 2006; Valente & Berry, 2016), and only one study by Ramirez
(2009) has estimated the determinants of life satisfaction in Ecuador. Ramirez (2009) includes
a set of subjective and objective variables at the individual level and finds that the effect of
the former outweighs the effect of the latter on life satisfaction. The results of the ordinary
least squares (OLS) and probit estimations show that, among the objective variables, leisure
hours and income have a positive relationship with life satisfaction. Conversely, being
indigenous or a male translates into lower reported wellbeing. Regarding subjective factors,
social relationships and civil status have the most impact. Despite its importance as the only
study in Ecuador, one of its problem is that it includes subjective variables that may have led
to unsolved endogeneity problems (Kuroki, 2011). Beside this, it does not explicitly account
for i) variables linked with the National Plan for Good Living and ii) contextual effects, which
should not be ignored in a country characterized by deep territorial inequalities (Mendieta
Muñoz & Pontarollo, 2016).
To overcome these limitations, in our analysis, we do not include subjective variables, but we
do consider both the individual and contextual variables traditionally investigated in the
literature on wellbeing, as well as some others related to the National Plan for Good Living:
i.e. institutional trust, health insurance and housing conditions among the individual factors
and, for the contextual variables, oil dependency, urbanization and natural hazards.
Finally, regarding the empirical technique, we adopt an OLS and ordered logit approach with
clustered standard errors, and an ordered logistic multilevel analysis in order to take account
of the nested structure of the data: i.e. individual observations within distinct territorial units.
The adoption of these three approaches, which are usually used singularly in evaluating the
determinants of wellbeing, allows us to check the robustness of our estimates to different
techniques.
This paper is organized as follows. Section 2 describes the background, methodology and the
data. In Section 3 we present the results of the empirical analysis and in the last section we
provide some conclusions and policy implications.

4
2 Background, Methodology and Data
2.1 Background
Ecuador is a country with 16.5 million inhabitants, divided into four geographic regions, 24
provinces, 221 cantons and 1,228 parishes. Each of its four regions has its own climate and
biodiversity conditions (see Figure 1). Ecuador is a rich country in terms of natural resources,
although also highly exposed to natural disasters (Demorales & D’Ercole, 2001). World Bank
(2015) shows that, among South American countries, it has one of the highest proportions of
the population living in rural areas (36%). According to the last census, the ten most populated
cities account for half of the population of the country, and the two main cities, Quito and
Guayaquil, account for one third and half of the Gross Value Added (GVA) product, respectively
(Ecuadorian Central Bank, 2017).
The Ecuadorian population has historically been subject to poverty and social inequality
(SENPLADES & SETEP, 2014). In particular, poverty has affected women, indigenous groups1
and rural populations extensively (BTI, 2016). The dependency of the national economy on
the export of oil and other commodities constantly exposes the country to price volatility and
therefore to periodic sharp economic downturns.
Limitations in basic services, housing, education and health care are associated with central
Andes, north Amazonia and rural areas, particularly affecting indigenous households
(SENPLADES, 2009, 2013a, 2013b). As a result, spatial heterogeneity as well as profound
social and economic disparities, persist (Mendieta Muñoz & Pontarollo, 2016).
In 2007, left-wing president Rafael Correa took office and pushed the writing of a new
constitution, which was adopted in 2008. This includes major improvements to enforce the
rights of women, minorities and, moreover, consideration of the rights of the natural
environment (Freedom House, 2017). The foundation of this new Constitution of the Republic
of Ecuador was Good Living, and, since then, planning and public policy have been oriented
towards the achievement of that. To this extent, in 2008, the national government designed
the National Plan for Good Living (SENPLADES, 2009) as Ecuador’s planning instrument. Based
on the indigenous concept of “sumak kawsay”, the SENPLADES (2009, p. 6) defines the
concept of Good Living as “covering needs, achieving a dignified quality of life and death;
loving and being loved; the healthy flourishing of all individuals in peace and harmony with
nature; and achieving an indefinite reproduction perpetuation of human cultures. Good Living
implies having free time for contemplation and personal emancipation; enabling the expansion
and flourishing of people’s liberties, opportunities, capabilities and potentialities so as to
simultaneously allow society, specific territories, different collective identities, and each
individual, understood both in universal and relative terms, to achieve their objectives in life
(without causing any kind of material or subjective dominance over any other individual). Our
concept of Good Living compels us to re-build the public sphere in order to recognize,
understand and value ourselves as diverse but equal individuals, and in order to advance
reciprocity and mutual recognition, enable self-advancement, and build a shared social future
(Ramírez, 2008: 387)”. The plan is operationalized through twelve overarching objectives
intended to address national needs and to foster social and economic justice. The objectives
aim (i) to consolidate democratic governance and construct the people’s power, (ii) to foster
social and territorial equity, cohesion, inclusion, (iii) to improve people’s quality of life, (iv) to
strengthen citizen capacities and potential, (v) to build spaces for social interaction and
strengthen national identity, diverse identities, pluri-nationality and interculturality, (vi) to
consolidate the transformation of the judicial system and reinforce comprehensive security,
with strict respect for human rights, (vii) to guarantee the rights of Nature and promote
environmental sustainability globally, (viii) to consolidate the solidarity of the social and
1According to the last Census, indigenous people represent 7% of the population.

5
economic system, (ix) to guarantee dignified work in all forms, (x) to promote transformation
of the productive structure, (xi) to ensure the sovereignty and efficiency of the strategic
sectors for industrial and technological transformation, (xii) to guarantee sovereignty and
peace, enhancing strategic insertion worldwide and Latin American integration (SENPLADES,
2013b, pp. 47-50).
In the last decade, important goals within the Good Living objectives were achieved thanks to
the high oil prices that allowed social spending to double, especially through a vast investment
in infrastructure, and increasing public sector wages and subsidies (BTI, 2016). Among the
main objectives achieved, have been a reduction in rates of poverty and extreme poverty,
which have declined by 38% and 47%, respectively. The inequality and unemployment rates
have also significantly reduced, while educational enrolment rates have increased at various
levels in the education system (BTI, 2016). With regards to education, public spending on
higher education has risen from 0.7% of 2006 to 2.1% of GDP in 2016, the highest in Latin
America (CEPR, 2017). Additionally, one of the greatest achievements during the last decade
has been the increase in the minimum wage by 48% in real terms, which allowed the reference
household income to exceed the cost of the basic consumption basket for the first time in
2014 (IMF, 2015).
Despite the social progress described above, many challenges still remain, with 61% of
indigenous people in Ecuador still reporting that their basic needs are not satisfied. Only 54%
of households report good quality of their houses’ walls, and among these, 82% additionally
reported good status of floors and roofs (INEC, 2015). In addition, in 2015, only 22% of
Ecuadorian women who were heads of households had access to health insurance, versus 34%
of men (INEC, 2015).
Furthermore, Ecuador is a country characterized by a weak institutional framework and has
one of the highest corruption indices, ranking 120 among 176 countries (Transparency
International, 2017). The public administration has been criticized regarding rights and
freedoms of the population: in the last years the indigenous movements and the labour unions
have been weakened, in addition to a permanent dispute between the government and the
media, (BTI, 2016). From an economic perspective, the greatest challenges faced by the
country are the low level of Foreign Direct Investment and its dependency on oil (BTI, 2016).
Finally, since 2013, with the decline of oil prices, the public administration has been forced to
cut the public budget: in 2015, and the share of social spending as a proportion of GDP,
reached the lowest value since 2010 (CEPR, 2017).
2.2 Methodology
Our empirical model follows Fleche et al. (2011) and Blanchflower & Oswald (2004) and adopts
the following structure:
Life satisfaction ic = α + β individual ic + γ contextualc + εi (1)
Where the subscripts i represent individuals and c local administrative units (cantons).
Individual displays a vector of personal; while contextual represents a set of territory specific variables, and εi is the error term. Following the approach of Alesina et al. (2004), Rodrıguez-
Pose and von Berlepsch (2013) and Rozer and Kraaykamp (2013), among others, we avoid
the inclusion of subjective assessment variables because they may be highly endogenous with
the dependent variable (Kuroki, 2011). The data will be discussed in detail in the following
section.
The dependent variable Life satisfaction ic is the self-reported life satisfaction, which is an
ordered categorical variable, while the true wellbeing is a latent variable that is unobservable.
6
The reported life satisfaction, then, is a reporting function of the true life satisfaction. Since
the dependent variable in this study is measured on an ordinal scale, the empirical analysis is
conducted through the use of an ordered logistic regression (Blanchflower & Oswald, 2004;
Fleche et al., 2011; Rodríguez-Pose & von Berlepsch, 2014). In addition, we adopt an OLS
analysis because, according to Van Praag & Ferrer-i-Carbonell (2008), this is an alternative to
the ordered logistic regression where the dependent variable can also be treated as cardinal,
at least in practice if not in theory. Ferrer-i-Carbonell & Frijters (2004), Graham & Nikolova
(2015) and Rodríguez-Pose & von Berlepsch (2014), among others, report that the application
of the OLS to the estimation of the determinants of subjective wellbeing has resulted in quite
similar outcomes to those obtained by the use of ordered logistic regressions.
Furthermore, in order to deal with the above-discussed contextual variables, which include
the territorial peculiarities of each canton, we also adopt an ordered logistic multilevel
approach including random intercepts and fixed slope coefficients (Rözer & Kraaykamp, 2013).
According to Deeming & Jones (2015), there is a natural congruence between the multilevel
random coefficients approach and the aim of incorporating context-specific determinants to
investigate the determinants of individual wellbeing. While modelling both individuals and their
contexts simultaneously, with this analysis we work under the assumption that there is a
general pattern that holds across groups of population belonging to the same canton, and that
random intercepts are established by each of them to allow for variation that we do not model
(Hox, 1995). In multilevel analysis, the dependent variable is considered at Level 1 -
individuals in our case - who are nested in cantons (Level 2). An analogous choice has been
done by Ballas and Tranmer (2012) because multilevel models, among other advantages allow
to explicitly avoid the issue of endogeneity bias (Rice and Jones, 1997).
Furthermore, to address the hierarchical structure of the dataset, we estimate clustered
standard errors at cantonal level for OLS and ordered logistic models (Alesina et al., 2004;
Graham & Felton, 2006; Di Tella et al., 2001). As Moulton (1986) shows, when the nesting of
observations within geographical units is not taken into account, the unobserved
characteristics that individuals share within this unit are not accounted for, leading to an
underestimation of the standard errors of the dependent variables. This is due to the within-
group (intra-class) correlation across individual units.
2.3 Data
The dependent variable of life satisfaction comes from the National Survey on Employment,
Unemployment and Underemployment 2015 (ENEMDU), December edition, provided by the
Ecuadorian National Institute of Statistics and Census (INEC, 2015).2 It is defined by a
question in which, using a Cantril ladder, respondents are asked to assess their lives (Helliwell
et al., 2017)3 by replying to the question: “if 0 means totally unhappy and 10 totally happy,
how do you feel regarding all aspects of your life taken together?” Following Rodríguez-Pose
& von Berlepsch (2014), despite the different connotations of the terms life satisfaction,
subjective wellbeing and wellbeing, we will use them interchangeably.
The data was originally gathered in interviews with respondents aged five and older; however,
in our paper only respondents identified as households heads are considered. Furthermore,
2 The ENEMDU dataset comes from a quarterly survey exploring employment, educational attainment, housing services and conditions,
consumption and self-perception questions. The surveys of June and December almost double the sample size of the others and contain questions
on self-perception on which we rely for representing life satisfaction.
3 Subjective wellbeing comprises three dimensions: evaluative, hedonic, and eudaimonic (see OECD (2013), for a
revision of these concepts). Due to the wide development of the conceptual framework for research on the former and
given data availability, in this study we will focus on the evaluative dimension.

7
we limited our analysis to cantons where more than 30 individuals were interviewed, resulting
in a total database of 157 cantons and 21,265 individuals. A robustness check is conducted
including cantons where more than 50, 70 and more than 90 individuals were interviewed.
Figure 1: Wellbeing across cantons in Ecuador (2015)
Source: authors’ elaboration based on ENEMDU, INEC 2015.
Ecuadorians report an average life satisfaction level equal to 7.49. The spatial distribution of
wellbeing is highly heterogeneous, however. Oil cantons, located in the north of the Amazon
region (north-east in the map), are those reporting the lowest levels of wellbeing: 7.10; while
the Galapagos territories (west islands) report the highest level.
2.3.1 Individual variables
Following most wellbeing research, we include a set of individual variables from ENEMDU 2015
(a summary of the definitions and descriptive statistics of our set of control variables is
provided in Table 1). In order to minimize the issue of omitted variables bias, a first set is
taken from the literature on the determinants of wellbeing, and another is related to the
specificities of the Ecuadorian context.
Among the individual variables of the first group expected to affect subjective wellbeing
positively there are: age, income level, education level, internet access, health status, marital
status (Easterlin, 1974; Kuroki, 2011). On the other hand, we consider characteristics likely
to decrease wellbeing such as unemployment, belonging to an ethnic minority, and household
size (Gómez et al., 2016; Kahneman & Deaton, 2010; Shams, 2016). Income is included in
deciles in order to elucidate in detail the type of relationship between this individual

8
characteristic and life satisfaction (Blanchflower & Oswald, 2004; Rodríguez-Pose & von
Berlepsch, 2014; Easterlin, 1974).
Table 1: Definition and descriptive statistics of individual variables
Variable type Description SD Mean Min Max
Urban 1 = if urban area of residence 0.42 0.77 0 1
Sex 1 = if man 0.44 0.73 0 1
Age Age of respondent 15 46 16 98
Married 1 = if married respondent 0.49 0.41 0 1
Religion Importance given to religion (1 – 4 = the highest)
0.72 3.53 1 4
Leisure time Personal satisfaction with available leisure time (1 -10 = the highest)
1.91 7.13 0 10
Institutional Trust Trust in the Public Defender Center (1 – 5 = the highest)
1.08 3.18 1 5
Indigenous 1 = if respondent self-identified as indigenous 0.21 0.12 0 1
Secondary 1 = if respondent reports secondary education 0.45 0.28 0 1
Tertiary 1 = if respondent reports tertiary education 0.41 0.21 0 1
Employed 1= if employed respondent 0.36 0.84 0 1
Socio-economic status
1= if respondent has a directive/managerial/scientific/intellectual job
0.29 0.09 0 1
Health Insurance 1= if respondent has health insurance 0.46 0.31 0 1
Condition of walls 1 = if walls are in good condition 0.50 0.54 0 1
Internet access 1 = if access 0.48 0.37 0 1
Home-owner 1 = if home owner 0.48 0.65 0 1
Household income lev.
Per capita household income 410.96 294.48 0 13371
Source: authors’ elaboration.
Considering the specificities of the Ecuadorian context, we highlight the inclusion of some
representative individual-level variables such as area of residence (urban or rural),
institutional trust, ethnicity, importance attributed to religion, health insurance and housing
conditions.
The type of area is incorporated in our analysis to describe whether an individual lives in an
urban area. Higher urbanization may increase the availability of services and job sources, and
then wellbeing. Empirical evidence, anyway, shows that urbanization can also prevent life
satisfaction if the access to these services is hindered by distance between them and people
(Hudson, 2006), or have no significant effects (Knight et al., 2009).
The inclusion of institutional trust in our study is supported by its importance in relation to
wellbeing (Frey & Stutzer, 2000; Hudson, 2006). In the particular case of Ecuador, the weak
institutional framework can generate discomfort among citizens.
Ecuador is recognized as an ethnically diverse country (SENPLADES, 2009), where minorities
tend to live in isolated communities. We therefore incorporate this key characteristic through
a dummy variable representing indigenous people, the largest ethnic groups in the country.
Religion is also important to our analysis since 91.95% of Ecuadorians report to have a
religious belief (INEC, 2012). Contrary to other regions, in Latin America people consider
9
religion to be an essential element of life (Lora, 2008): it seems to give hope, meaning,
optimism, and security to individuals. In this regard Helliwell & Putnam (2004) and Rodríguez-
Pose & von Berlepsch (2014) show that both religiosity and religious activity are positively
related to subjective wellbeing.
One of the peculiarities of Latin America is that health insurance coverage is not universal and
its expansion is a public policy priority (Miller et al., 2013). In Ecuador, according to the INEC
(2015), less than half of the population has access to a health insurance system. We therefore
include a dummy indicating whether the individual has any type of health insurance, public or
private. In Ecuador, health insurance later translates into access to retirement pensions.
Housing conditions are another key indicator of wellbeing in Latin America, and have been one
of the major concerns of the international development organizations since 1970, and thus
the focus of numerous studies, and recent wellbeing research gives credit to this link with
housing conditions (Lora, 2008). As shown in paragraph 2.1, there is evidence of a tight
relationship in Ecuador between quality of walls and the general housing conditions;4
therefore, we use a variable that indicates the status of walls to depict this characteristic.
2.3.2 Contextual variables
Taking into account the territorial heterogeneity present in Ecuador (Mendieta Muñoz &
Pontarollo, 2016; Orellana Bravo et al., 2016; Raileanu Szeles & Mendieta Muñoz, 2016), we
included a set of contextual variables shown in table 2. Defined at the cantonal level, these
include the percentage of urban area, the per capita Gross Value Added from Central Bank of
Ecuador and an income inequality index (Gini) and form ENEMDU 2015, a natural hazards
index (Demoraes & D'Ercole, 2001), and a dummy related to the presence of oil mining
activity.
Table 2:Definition and descriptive statistics of contextual variables
Variable type Description SD Mean Min Max
Oil dependant 1= if oil-dependent canton 0.12 0.01 0 1
GVA/pop LN of non-oil sector’s per capita GVA
0.36 8.59 7.83 10
Inequality Gini coefficient 0.06 0.43 0.26 1
Natural Hazard Natural Hazard Index
(1 – 12 = the highest)
2.09 7.36 0 12
Urban area Urban territory percentage 25.02 67.24 5.14 100
Source: authors’ elaboration.
The cantonal variable indicating the percentage of people living in urban areas accounts for
the quantity of services and job sources as well as possible congestion costs.
The Gross Value Added per capita is included in our analysis in order to associate the average
cantonal level of production to wellbeing. The former has been the focus of several economic
policies implemented in Ecuador with the objective of increasing the value added in production
so as to improve the quality of life (SENPLADES, 2013b). According to Stiglitz et al. (2009),
wellbeing is closely related to income and, therefore, consumption. Measures of production,
like GVA, however, do not inherently translate into individual income. This may result in an
4 To be habitable, a house must offer protection against environmental factors, isolation from the natural environment, privacy and comfort to carry out certain biological and social activities and help to avoid relative privation among its inhabitants (CEPAL, 1988)
10
inaccurate assumption of the existence of a positive relationship between production measures
and individual wellbeing. In this context, we incorporate the average per capita Gross Value
Added at cantonal level with the aim of evaluating whether value added in production can be
considered a vehicle of wellbeing.
Income inequality represents another important characteristic to study in wellbeing research
(Alesina et al., 2004). Nevertheless, results in respect to this factor are inconclusive (Graham
& Felton, 2006), as it appears to have positive, negative or no statistically significant effect,
depending on the aggregated income level (Rozer & Kraaykamp, 2013). Theoretically,
inequality has a high social cost due to its limiting effect on democracy and development,
which negatively affects growth and efficiency (Stiglitz, 2014). According to the Inter-
American Development Bank (2008), the high poverty rates in Latin America are the result of
high levels of inequality in the distribution of income. Furthermore, Ecuador has reported high
inequality rates throughout its history, which supports the insertion of this variable in this
study. Finally, GVA per capita and inequality are included together at cantonal level because
“there is also specific evidence that the omission of per capita GDP can seriously distort the
effect of inequality” Krzysztof (2013, p.1095).
Ecuador’s development model has, historically, been linked to the oil extraction sector, which
has an influence on wellbeing through the public investment it brings, but also through the
inequality and environmental degradation that it causes (Chiasson-LeBel, 2016). Oil
exploitation in non-industrialized countries like Ecuador has an enclave nature, and is not
considered a source of quality jobs for locals. Besides the unequal distribution of the resulting
oil rents, it does not generate spill-over effects to other industries of the economy (Ayelazuno,
2014). Seven out of 157 cantons rely on the oil mining industry, four of which are located in
the Amazon region and three in the Coast region. In our analysis, we aim to analyze the effect
of oil activity on wellbeing by using a dummy that indicates whether or not the territory is
considered to be an oil dependent canton.
Finally, living in a country highly exposed to natural hazards may suppress wellbeing. In this
context, we introduce to our analysis a cantonal natural hazards index built up by Demorales
& D’Ercole (2001) and based on a set of indicators about seismic and volcanic activity, along
with tsunami, landslide, flood and drought hazards (see Appendix 2 for the details). This
comprehensive cantonal natural hazards index tries to overcome the limitation of the approach
of Fleche et al. (2011), which uses an air quality index as a proxy for environmental conditions.
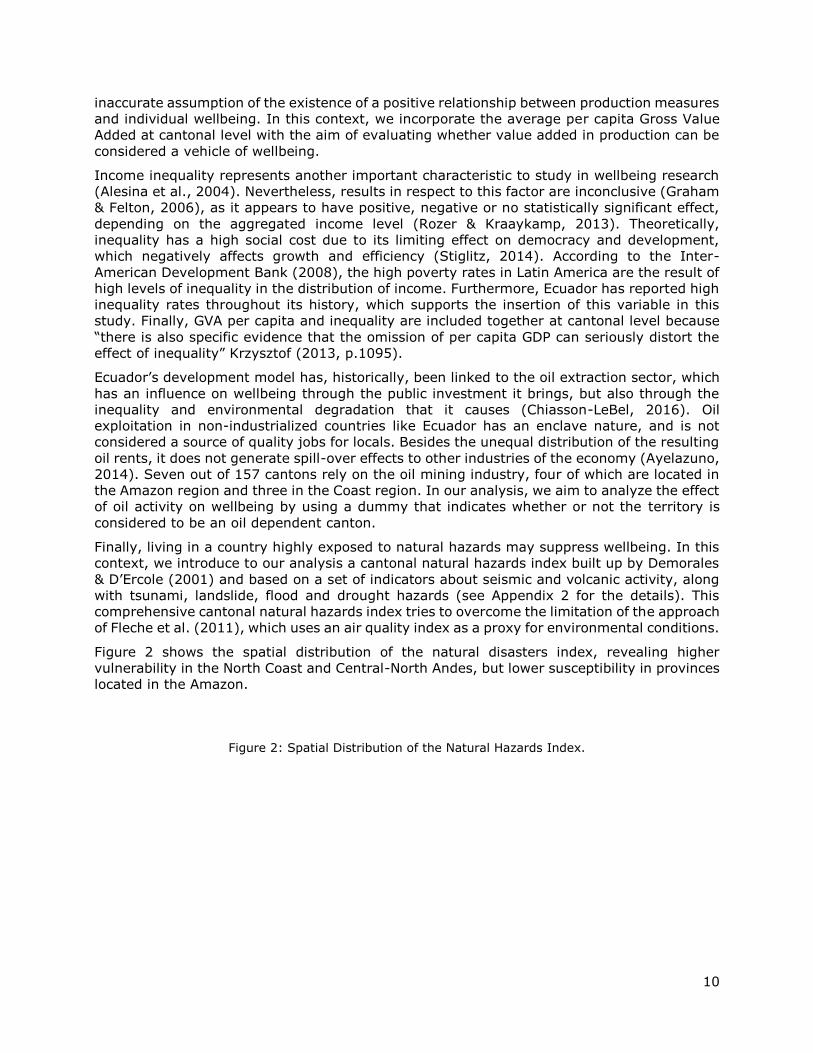
Figure 2 shows the spatial distribution of the natural disasters index, revealing higher
vulnerability in the North Coast and Central-North Andes, but lower susceptibility in provinces
located in the Amazon.
Figure 2: Spatial Distribution of the Natural Hazards Index.

11
Source: authors’ elaboration based on Demorales & D’Ercole (2001).

12
3 Results
Results of the estimation of equation (1) are presented in Table 3. Consistent with previous
research (see, for example, McNeish et al., 2017), the estimations performed through both
multilevel models and standard models with clustered standard errors show similar results in
terms of standard errors and coefficients. The results are also robust to changes in the
minimum size of cantons, as shown in Appendix 1.
Table 3: Regression results
OLS OLOGIT MULTILEVEL
(1) (2) (3)
Coefficients S.E. Coefficients S.E. Coefficients S.E.
Contextual
Oil Dependent -0.326* (0,17) -0.446** (0,22) -0,303 (0,22) Ln(GVA/pop) -0.278*** (0.10) -0.472*** (0.14) -0.124 (0.15) Inequality -0.252 (0.37) -0.243 (0.49) -0.216 (0.63) Natural Hazard -0.00862 (0.01) -0.0102 (0.01) -0.00658 (0.02) Urban Area 0.000396 (0.00) 0.000513 (0.00) 0.00279 (0.00)
Individual
Urban -0.0438 (0.05) -0.0921 (0.07) -0.0646 (0.07) Sex 0.102*** (0.03) 0.126*** (0.04) 0.0916** (0.04) Age -0.0127*** (0.00) -0.0170*** (0.00) -0.0210*** (0.00)
Age^2 0.00009** (0.00) 0.000120** (0.00) 0.000163*** (0.00) Married 0.0796*** (0.03) 0.0992*** (0.04) 0.153*** (0.03) Religion 0.0377* (0.02) 0.0313 (0.03) 0.0445* (0.03) Leisure Time 0.291*** (0.01) 0.401*** (0.02) 0.401*** (0.02) Inst. Trust 0.133*** (0.02) 0.174*** (0.02) 0.181*** (0.02) Indigenous -0.119* (0.07) -0.164** (0.08) -0.0501 (0.08)
Secondary 0.124*** (0.02) 0.142*** (0.03) 0.169*** (0.03)
Tertiary 0.190*** (0.04) 0.235*** (0.04) 0.269*** (0.04) Employed 0.130*** (0.03) 0.141*** (0.04) 0.164*** (0.04) Socio Econ. Status 0.143*** (0.04) 0.180*** (0.05) 0.203*** (0.05) Health Insurance 0.0611** (0.03) 0.0879*** (0.03) 0.0692** (0.03) Walls 0.210*** (0.03) 0.273*** (0.04) 0.294*** (0.04) Internet 0.100*** (0.03) 0.127*** (0.04) 0.169*** (0.03)
Home Owner 0.0599** (0.03) 0.0778** (0.04) 0.0541 (0.04) 2.Decile 0.0913* (0.05) 0.0963 (0.06) 0.0928 (0.06) 3.Decile 0.0823* (0.04) 0.111* (0.06) 0.126** (0.06) 4.Decile 0.0406 (0.05) 0.0275 (0.06) 0.048 (0.06) 5.Decile 0.0779* (0.05) 0.0904 (0.06) 0.115** (0.06) 6.Decile 0.116** (0.05) 0.119* (0.07) 0.151** (0.06) 7.Decile 0.169*** (0.05) 0.153** (0.07) 0.178*** (0.07)
8.Decile 0.192*** (0.06) 0.219*** (0.08) 0.241*** (0.07)
9.Decile 0.181*** (0.06) 0.220*** (0.07) 0.243*** (0.06) 10.Decile 0.329*** (0.06) 0.417*** (0.08) 0.407*** (0.07) Cantonal variance 0.285*** Observations 21265 21265 21265
N. of cantons 157 157 157
R2 0.2027 0.0664
AIC 75700,53 72686.31 71957.57
Log likelihood -37818,267 -36302.153 -35936.787
chi2 3224.16 2990.62
Prob > ꭓ2 0 0 0
Notes: *** p<0.01, ** p<0.05, *<0.10. Pseudo R2 for ologit. Clustered standard errors for OLS and ologit in parentheses. S.E. represents the standard errors.

13
The coefficients related to the personal characteristics show that being a man implies a higher
level of wellbeing. Although previous studies are not conclusive in this regard, our findings are
consistent with the findings obtained for Colombia (Gómez et al., 2016) and Mexico (Dugain
& Olaberría, 2015). As in related literature (Gómez et al., 2016; Kahneman & Deaton, 2010;
Shams, 2016), people belonging to an indigenous ethnicity have a lower wellbeing.
Furthermore, married individuals tend to have a higher life satisfaction than those reporting
other civil status (Frey and Stutzer, 2000; Helliwell, 2002), while age appears to have a U-
shaped effect, which is coherent with the findings of Blanchflower & Oswald (2008). The
turning point is around 70 years old,5 which corresponds the retirement stage, in which adults
feel a higher life satisfaction due to the reduced burden of responsibilities, especially in respect
to reduced labour-related commitments (Gómez et al., 2016).
In line with previous wellbeing research from Dugain & Olaberría (2015) and Krauss & Graham
(2013), education displays a positive and highly significant effect on individual wellbeing. This
reflects the knowledge and skills that formal education offers, enabling people to improve their
lives and health, and their civic and political participation, as well as making them to be more
likely to have a quality job and thus earn sufficient to meet their needs (Krauss, 2012).
In relation to work characteristics, being employed is positively related to life satisfaction (Di
Tella et al., 2001; Helliwell, 2002; Helliwell et al., 2017). Specifically, having a managerial,
scientific or intellectual job position compared to other activities increases life satisfaction
(Helliwell et al., 2017) as well as having health insurance (Kahneman & Deaton, 2010; Krauss
& Graham, 2013). The access to health insurance increases wellbeing as it is less likely that
individuals are affected by medical costs, thus reducing economic insecurity and probability of
debt (Krauss & Graham, 2013). Our results point out that money “buys” wellbeing
(Blanchflower & Oswald, 2004; Deeming & Jones, 2015; Helliwell, 2002). Indeed, the
relationship between income and subjective wellbeing is found to be non-linear, exerting
increasing effect as income increases, which may imply the absence of a satiation point, in
line with results of Stevenson & Wolfers (2013).
In line with Lora’s (2008) findings, religion is a positive driver of life satisfaction, which can
be explained either by the support provided by having a religious belief or by the social
connections built in to religious communities (Helliwell & Putnam, 2004). In the same way,
wellbeing is increased by higher satisfaction with leisure time (Van Praag & Ferrer-i-Carbonell,
2008; Ramirez, 2009) and higher institutional trust (Frey & Stutzer, 2000; Hudson, 2006;
Kuroki, 2011). The latter result is particularly important because it denotes that the
improvement of institutions is not important only for economic development (Acemoglu &
Robinson, 2008) but is associated with higher levels of subjective wellbeing (Frey & Stutzer,
2000). In the Ecuadorian case, this can be explained by the participative governmental
budgets, which are mandatory, and aim at involving citizens in the political decisional process.
This may generate direct utility (Frey & Stutzer, 2000) and better expectations about the
public administrations’ actions.
The properties of their place of inhabitation, such as access to the internet and structural
integrity are linked to improvement in wellbeing. Home ownership allows people to live in
comfort and avoid overcrowding but, in the Ecuadorian context, it is perceived also as a
guarantee for the future generations. In fact, approximately 14% of sons with their own
families live within the same house as their parents (INEC, 2010). Structural integrity (here
measured through the proxy of the perceived condition of the walls) can highly determine the
achievement of basic needs like shelter, sleep, access to water and sanitation, and personal
security, all contributing to wellbeing (Krauss & Graham, 2013). Internet access, finally,
5 The turning point for model (1) is calculated as:
𝜕𝑤𝑒𝑙𝑙𝑏𝑒𝑖𝑛𝑔
𝜕𝑎𝑔𝑒= −0.0127 + 2 × 0.00009𝑎𝑔𝑒 = 0 → 𝑎𝑔𝑒 =
0.0127
0.00018= 70
14
enables people to communicate socially and be interconnected, which can be especially
important in a country characterized by emigration like Ecuador (Hall & Banaszek, 2014).
Turning to the contextual variables included in our analysis, we observe a lack of significance
of the percentage of urban area per canton that might be due to the broad definition of urban
area adopted by the National Statistical Institute: human settlements with a population equal
to or higher than 2,000 inhabitants (INEC, 2015). The natural hazards index haves no
significant effect on individual subjective wellbeing. These results conflict with previous
research from Becchetti & Castriota (2010), and Ramirez (2009), but are in line with Fleche
et al. (2011) and Carroll et al. (2009). Carroll et al. (2009) suggest that accounting for
geographical specific effects (cantonal clustered standard errors and random variables, in our
case) reduces the significance of contextual variables.
The coefficient for the average cantonal GVA per capita is negative, which could possibly imply
a mismatch between the measure of GVA and of personal income.
Income inequality, on the other hand, does not affect the wellbeing in line with Senik (2004)
and Krzysztof (2013), but in contrast with Alesina et al. (2004) and Graham and Felton (2006).
The dummy for oil dependent cantons shows a negative and highly significant coefficient,
revealing its relevance in perceived individual wellbeing. This might be a consequence of the
enclave nature of the oil mining activity in Ecuador (Ayelazuno, 2014), which, besides causing
environmental damage, has also generated historical class conflict and social struggle
(Chiasson-LeBel, 2016). In fact, environmental degradation has been empirically related to
lower levels of wellbeing in many countries (Di Tella & MacCulloch, 2008), which is explained
by the intrinsic value given to “ecologically responsible behavior” (Warren Brown & Kasser,
2005) and to the environment itself. The latter is especially applicable to Ecuador, where the
indigenous communities consider themselves part of nature (Gudynas & Acosta, 2011).
Finally, we tested the presence of endogenous placement issue by estimating our model on
the subsample of people that never moved from their cantons and on the subsample of people
that lived in other places before displacing in the canton in which they are interviewed. The
Likelihood Chow test accepts the null hypothesis of coefficient stability between the two groups
at 1%. The results, available upon request, confirming that there are no significant differences
between the estimates of the two subsample, support the hypothesis of no endogenous
placement issue.

15
4 Conclusion and policy implications
Our study examines the individual and contextual factors that affect individual wellbeing in
Ecuador paying particular attention to those aspects that characterize the socio-economic
structure of this country. The outcomes highlight that the main factors influencing subjective
wellbeing in Ecuador are consistent with those reported in previous studies in other countries.
Regarding the variables related to the characteristics of the country, a positive role is played
by institutional trust, health insurance, condition of walls, religion, education and ethnicity.
Among territorial characteristics, oil cantons and GVA per capita are statistically significant
and negatively related to individual subjective wellbeing. Furthermore, we find that, the use
of an OLS and ordered probit with clustered standard errors leads to similar results as those
provided by a more complex multilevel ordered probit model. This leads us to prefer simpler
models, which require simpler computation and assumptions, correcting for the clustered
standard errors, a highlighted also by McNeish et al. (2017) and Primo et al. (2007).
The results suggest some relevant policy implications related to the National Plan for Good
Living.
The importance of appropriate housing conditions, such as the characteristics of walls, for
individual’s wellbeing is coherent with objective number 3 of the National Plan for Good Living.
According to our dataset, however, in 2015, around half of houses lacked good wall conditions.
In this context, public policies launched by the Ministry of Urban Development and Housing
should continue to promote adequate housing.
Beyond housing, objective number 9 of the National Plan for Good Living relates to job stability
and social security as channels to improve individuals’ life satisfaction and industrial
productivity. In this regard, our analysis shows that having health insurance can boost
wellbeing. Despite the advances in this domain, however, 46% of Ecuadorians (69% of
households’ heads) still do not have access to any type of health insurance system. Hence,
public policy should continue to encourage workers’ affiliation to social security systems as
mandatory in law.
Education is another priority included in the National Plan for Good Living (objective number
4). Our results show that the higher the education level is, the higher the reported wellbeing.
In Ecuador, there is a wide educational lag and an unequal distribution of education in
detriment of historically disadvantaged groups: women, indigenous and rural inhabitants
(SENPLADES, 2013b). Public policies should therefore continue to improve the accessibility to
education at all levels and guarantee its quality in order to improve life satisfaction and to
close gaps.
Despite the progress in the fields of social inclusion and justice, equal opportunities for women
and ethnic minorities remain a public policy goal. Nevertheless, as shown in this paper, heads
of the households who are women or who belong to an ethnic minority experience lower levels
of wellbeing. This might be related to cultural heritage and to their low access to sanitation,
education and labour markets. This suggests the importance of continuing to promote active
integration within society and the emancipation of the weaker sectors of the population.
Finally, a key role in respect to wellbeing is played by institutional trust. Institutional trust can
be enhanced through the improvement of national and local institutions. These are also
instrumental to income redistribution. In this regard, therefore, the Value Added produced in
the cantons needs to be translated into an improvement in the basic living needs of the
citizens, represented in our analysis by the condition of walls. This, in turn, would decrease
social and/or ethnic marginalization, and increase the trust in institutions. Institutional
improvement in developing countries, according to Kyriacou et al. (2016), can be reached via
fiscal decentralization, which can be used to modify the tax collection through increasing local
accountability (Escobar-Lemmon and Ross, 2014). The collection of more resources would

16
allow redistributive public policies for housing policies, social services, and market and social
inclusion, which, as discussed above, are directly linked to subjective wellbeing.
17
References
Acemoglu, D., & Robinson, J. (2008). The Role of Institutions in Growth and Development.
Commission on Growth and Development. Washington DC.
Alesina, A., Di Tella R., MacCulloch R. (2004) Inequality and happiness: are Europeans and
Americans different?. Journal of Public Economics, 88: 2009-2042
Ayelazuno, J. (2014). Oil wealth and the well-being of the subaltern classes in Sub-Saharan
Africa : A critical analysis of the resource curse in Ghana. Resources Policy, 40, 66–73.
Becchetti, L., & Castriota, S. (2010). The Effects of a Calamity on Income and Wellbeing of
Poor Microfinance Borrowers: The Case of the 2004 Tsunami Shock. The Journal of
Development Studies, 46, 37–41.
Blanchflower, D. G., & Oswald, A. J. (2004). Well-being over time in Britain and the USA.
Journal of Public Economics, 88, 1359–1386.
Blanchflower, D. G., & Oswald, A. J. (2008). Is well-being U-shaped over the life cycle ? Social
Science & Medicine, 66, 1733–1749.
Ballas D., Tranmer M., (2012). Happy People or Happy Places? A Multilevel Modeling Approach
to the Analysis of Happiness and Well-Being. International Regional Science Review, 35:
70-102.
BTI. (2016). Ecuador country report. Gütersloh: Bertelsmann Stiftung.
Carroll, N., Frijters, P., & Shields, M. A. (2009). Quantifying the Costs of Drought : New
Evidence from Life Satisfaction Data. Journal of Population Economics, 22, 445–461.
Central Bank of Ecuador. (2017). Estadísticas económicas. Retrieved from
https://www.bce.fin.ec/index.php/component/k2/item/756 (Last accessed 20 October
2017).
CEPAL. (1988). Ecuador: Mapa de Necesidades Básicas Insatisfechas. Comisión Económica
para América Latina y el Caribe. Quito.
CEPAL. (2014). Los pueblos indígenas en América Latina. Avances en el último decenio y retos
pendientes para la garantía de sus derechos. Santiago de Chile.
CEPR. (2017). Decade of reform: Ecuador’s macroeconomic policies, institutional changes,
and results. Retrieved from http://www.confirmado.net/wp-
content/uploads/2017/02/ecuador-2017-021.pdf (Last accessed 20 October 2017).
Chiasson-LeBel, T. (2016). The Extractive Industries and Society Neo-extractivism in
Venezuela and Ecuador: A weapon of class conflict. The Extractive Industries and Society,
3, 888–901.
Deeming, C., & Jones, K. (2015). Social Policy and Economic Development in Europe:
Investigating the Macro Determinants of Individual Health and Well-being in a
Multivariate Analysis of Thirty European Nations. International Journal of Sociology, 45.
Demorales, F., & D’Ercole, R. (2001). Cartografía de las amenazas de origen natural por
cantón en el Ecuador.
Di Tella, R., & MacCulloch, R. (2008). Gross national happiness as an answer to the Easterlin
Paradox? Journal of Development Economics, 86, 22–42.
Di Tella, R., Macculloch, R. J., & Oswald, A. J. (2001). Preferences over Inflation and
Unemployment : Evidence from Surveys of Happiness. The American Economic Review,
91, 335–341.

18
Die Bundesregierumg, (2017) Government Report on Wellbeing in Germany. Federal Press
Office.
Dolan, P., Layard, R., & Metcalfe, R. (2011). Measuring subjective wellbeing for public policy:
Recommendations on Measures (No. 23). London: Centre for Economic Performance,
LSE.
Dugain, V., & Olaberría, E. (2015). What Makes Mexicans Happy? OECD Economics
Department Working Papersn. 1196, 0–32.
Easterlin, R. (1974). Does economic growth improve the human lot? Some empirical evidence.
In P. David & M. Reder (Eds.), Nations and households in economic growth: Essays in
Honor of Moses Abramowitz (pp. 89–125). New York: Academic Press.
Ferrer-i-carbonell, A., & Frijters, P. (2004). How important in methodology for the estimates
of the determinants of Happiness?, The Economic Journal, 114, 641–659.
Freedom House. (2017). Freedom in the World 2017. Retrieved from
https://freedomhouse.org/report/freedom-world/freedom-world-2017 (Last accessed 20
October 2017).
Escobar-Lemmon M., & Ross, A.D., (2014) Does Decentralization Improve Perceptions
of Accountability? Attitudinal Evidence from Colombia, American Journal of Political
Science, 58: 175-188.
Fleche, S., Smith, C., & Sorsa, P. (2011). Exploring Determinants of Subjective Wellbeing in
OECD Countries: Evidence from the World Value Survey. OECD Economics Department
Working Papers. Paris.
Frey, B. S., & Stutzer, A. (2000). Happiness, Economy and Institutions. The Economic Journal,
110, 918–938.
García Álvarez, S. (2014) Sumak kawsay o buen vivir como alternativa al desarrollo en
Ecuador. Aplicación y resultados en el gobierno de Rafael Correa (2007-2011), PhD
thesis, Universidad Complutense De Madrid (unpublished)
Gasper, D. (2010). Understanding the diversity of conceptions of well-being and quality of life.
Journal of Socio-Economics, 39, 351–360.
Gómez, C., Suárez, G., Garzón, J. E., & Gómez, J. (2016). El ser y el tener de los habitantes
de la ciudad de Medellín como determinantes de la satisfacción con la vida. Centro de
Investigaciones Económicas Y Financieras. Universidad EAFIT, 16, 432.
Graham, C., & Felton, A. (2006). Inequality and happiness : Insights from Latin America.
Journal of Economic Inequality, 4, 107–122.
Graham, C., & Nikolova, M. (2015). Bentham or Aristotle in the Development Process ? An
Empirical Investigation of Capabilities and Subjective Well-Being. World Development,
68, 163–179.
Gudynas, E., & Acosta, A. (2011). La renovación de la crítica al desarrollo y el buen vivir como
alternativa. Revista Internacional de Filosofía Iberoamericana Y Teoría Social, 53, 71–83.
Hall, R. H., & Banaszek, A. (2014). Internet, Happiness, and Social Interaction: A Review of
Literature. Lecture Notes in Computer Science, 8527, 166-174.
Helliwell, J. (2002). How’s Life? Combining individual and national variables to explain
subjective well-being. NBER Working Papers No. 9065.
Helliwell, J., Layard, R., & Sachs, J. (2016). World Happiness Report 2016 (Vol. I). New York:
Sustainable Development Solutions Network.

19
Helliwell, J., Layard, R., & Sachs, J. (2017). World Happiness Report 2017. New York:
Sustainable Development Solutions Network.
Helliwell, J., & Putnam, R. (2004). The social context of well-being. Philosophical Transactions
of the Royal Society London B., 359, 1435–1446.
Hox, J. (1995). Applied Multilevel Analysis. Amsterdam: TT-Publikaties.
Hudson, J. (2006). Institutional Trust and Subjective Well-Being across the EU. KYKLOS, 59,
43–62.
INEC. (2010). Censo de Población y Vivienda 2010. Quito.
INEC. (2012). Primeras estadísticas oficiales sobre filiación religiosa en el Ecuador. Quito.
INEC. (2015). Encuesta Nacional de Empleo, Desempleo y Subempleo Urbano (ENEMDU).
IMF. (2015). IMF country report. Retrieved from
https://www.imf.org/external/pubs/ft/scr/2015/cr15289.pdf (Last accessed 20 October
2017).
Kahneman, D., & Deaton, A. (2010). High income improves evaluation of life but not emotional
well-being. PNAS, 107, 16489–16493.
Knight, J., Song, L., & Gunatilaka, R. (2009). Subjective well-being and its determinants in
rural China. China Economic Review, 20, 635–649.
Krauss, A. (2012). External Influences and the Educational Landscape: Analysis of Political,
Economic, Geographic, Health and Demographic Factors in Ghana. New York: Springer
Press.
Krauss, A., & Graham, C. (2013). Subjective wellbeing in Colombia : some insights on
vulnerability , job security , and relative incomes. International Journal of Happiness and
Development, 1, 233–260.
Kuroki, M. (2011). Does social trust increase individual happiness in Japan? The Japanese
Economic Review, 62, 444–459.
Kyriacou A.P., Muinelo-Gallo L. & Roca-Sagalés O. (2016) Regional inequalities, fiscal
decentralization and government quality, Regional Studies: 51, 945-957.
Lora, E. (2008). Beyond Facts. Understanding Quality of Life (Development in the Americas).
Washington DC.
McNeish, D., Stapleton L., Silverman, R.S., (2017) On the Unnecessary Ubiquity of Hierarchical
Linear Modeling. Psychological Methods, 22, 114-140.
Mendieta Muñoz, R., & Pontarollo, N. (2016). Cantonal Convergence in Ecuador: A Spatial
Econometric Perspective. Journal of Applied Economic Sciences, XI(1), 1-27.
Miller, G., Pinto, D., & Vera-hernández, M. (2013). Risk Protection, Service Use, and Health
Outcomes under Colombia’s Health Insurance Program for the Poor †. American Economic
Journal: Applied Economics, 5, 61–91.
Moulton, B.R. (1986). Random group effects and the precision of regression estimates, Journal
of Econometrics,32, 385–397.
OECD. (2013). OECD Guidelines on Measuring Subjective Well-being. OECD Publishing.
Orellana Bravo, M. R., Raileanu Szeles, M., & Argudo Barrera, D. M. (2016). A Multilevel
analysis of the returns to education in Ecuador. The multifaceted impact of human capital.
Scientific Annals of Economics and Business, 63, 1–19.
20
Primo D.M., Jacobsmeier, M.L., Mylio J. (2007) Estimating the Impact of State Policies and
Institutions with Mixed-Level Data. State Politics and Policy Quarterly, 7, 446-459.
Raileanu Szeles, M., & Mendieta Muñoz, R. (2016). Analyzing the Regional Economic
Convergence in Ecuador. Insights from parametric and nonparametric models. Romanian
Journal of Economic Forecasting, XIX, 43–65.
Ramírez, R. (2008) Igualmente pobres, desigualmente ricos. Quito, Editorial Ariel, Programa
de Naciones Unidas para el Desarrollo.
Ramirez, R. (2009). La felicidad como medida del Buen Vivir en Ecuador. Quito.
Rice, N., Jones A. (1997) Multilevel Models and Health Economics. Health Economics, 6: 561-
75.
Rodríguez-Pose, A., & von Berlepsch, V. (2014). Social Capital and Individual Happiness in
Europe. Journal of Happiness Studies, 15, 357–386.
Rozer, J., & Kraaykamp, G. (2013). Income Inequality and Subjective Well-being : A Cross-
National Study on the Conditional Effects of Individual and National Characteristics. Social
Indicators Research, 113, 1009–1023.
Senik, C. (2004). When information dominates comparison: Learning from Russian subjective
panel data Journal of Public Economics, 88, 2099–2123.
SENPLADES. (2009). Plan Nacional del Buen Vivir 2009-2013. Quito.
SENPLADES. (2011). 100 Logros de la Revolución Ciudadana. Nuestro Plan es el Buen Vivir.
Quito.
SENPLADES. (2013a). Atlas de las Desigualdades Socio-Económicas del Ecuador. Quito.
SENPLADES. (2013b). Plan Nacional del Buen Vivir 2013-2017. Quito.
SENPLADES, & SETEP. (2014). Estrategia Nacional para la Igualdad y la Erradicación de la
Pobreza. Quito.
Shams, K. (2016). Developments in the Measurement of Subjective Well-Being and Poverty:
An Economic Perspective. Journal of Happiness Studies, 17, 2213–2236.
Stevenson, B., & Wolfers, J. (2013). Subjective Well-Being and Income : Is There Any
Evidence of Satiation?†. American Economic Review: Papers & Proceedings, 103, 598–
604.
Stiglitz, J. (2014). The Price of Inequality: How Today’s Divided Society Endangers our Future.
Sustainable Humanity, Sustainable Nature: Our Responsibility. Vatican City.
Stiglitz, J., Sen, A., & Fitoussi, J.-P. (2009). Report by the Commission on the Measurement
of Economic Performance and Social Progress. Paris.
Trading economics (2017). Ecuador: economic indicators. Retrieved from
https://tradingeconomics.com/ecuador/indicators (Last accessed 20 October 2017).
Tavernier, J.L., Cuneo P., Plteau C. (2015) Measurement of Quality of Life and Well-Being in
France: The Drivers of Subjective Well-Being, Review of Income and Wealth, 61, 25-33.
Transparency International (2017). Retrieved from https://www.transparency.org/ (Last
accessed 20 October 2017).
Valente, R. R., & Berry, B. J. L. (2016). Dissatisfaction with city life? Latin America revisited.
Cities, 50, 62–67.
Van Praag, B., & Ferrer-i-Carbonell, A. (2008). Happiness Quantified. A Satisfaction Calculus
Approach. Oxford University Press.

21
Warren Brown, K., & Kasser, T. (2005). Are psychological and ecological well-being
compatible? The role of values, mindfulness, and lifestyle. Social Indicators Research, 74,
349–368.
World Bank (2015). Ecuador: social indicators. Retrieved from
https://datos.bancomundial.org/ (Last accessed 20 October 2017).

22
Appendix 1: Robustness check
Table A1.1: more than 50 persons per canton
OLS OLOGIT MULTILEVEL
(1) (2) (3)
Coefficients S.E. Coefficients S.E. Coefficients S.E.
Contextual
Oil Dependent -0.325* (0.17) -0.442** (0.21) -0.311 (0.23) Ln(GVA/pop) -0.308*** (0.10) -0.518*** (0.13) -0.269 (0.17) Inequality -0.261 (0.39) -0.261 (0.51) -0.391 (0.66) Natural Hazard -0.007 (0.01) -0.00779 (0.01) -0.000835 (0.03) Urban Area 0.000458 (0.00) 0.000618 (0.00) 0.00249 (0.00)
Individual
Urban -0.0478 (0.06) -0.0992 (0.07) -0.0695 (0.07)
Sex 0.0889*** (0.03) 0.109** (0.04) 0.0820** (0.04)
Age -0.0138*** (0.00) -0.0185*** (0.00) -0.0218*** (0.00) Age^2 0.00010** (0.00) 0.00014*** (0.00) 0.00017*** (0.00) Married 0.0868*** (0.03) 0.109*** (0.04) 0.154*** (0.04) Religion 0.0453** (0.02) 0.039 (0.03) 0.0542** (0.03) Leisure Time 0.292*** (0.01) 0.403*** (0.02) 0.403*** (0.02) Inst. Trust 0.129*** (0.02) 0.168*** (0.02) 0.179*** (0.02)
Indigenous -0.105 (0.07) -0.144* (0.08) -0.0323 (0.08) Secondary 0.124*** (0.02) 0.146*** (0.03) 0.169*** (0.03) Tertiary 0.195*** (0.04) 0.244*** (0.05) 0.270*** (0.04) Employed 0.134*** (0.03) 0.147*** (0.04) 0.163*** (0.04) Socio Econ. Status 0.134*** (0.04) 0.165*** (0.05) 0.193*** (0.05) Health Insurance 0.0568** (0.03) 0.0837** (0.03) 0.0650** (0.03) Walls 0.206*** (0.03) 0.270*** (0.04) 0.283*** (0.04)
Internet 0.104*** (0.03) 0.133*** (0.04) 0.169*** (0.03)
Home Owner 0.0576* (0.03) 0.0725* (0.04) 0.0551 (0.04) 2.Decile 0.0848 (0.05) 0.0897 (0.07) 0.0871 (0.07) 3.Decile 0.0814* (0.05) 0.120** (0.06) 0.132** (0.06) 4.Decile 0.0342 (0.06) 0.0224 (0.07) 0.044 (0.07) 5.Decile 0.0722 (0.05) 0.0902 (0.06) 0.115** (0.06) 6.Decile 0.109* (0.06) 0.118* (0.07) 0.145** (0.07)
7.Decile 0.163*** (0.06) 0.152** (0.07) 0.174** (0.07) 8.Decile 0.190*** (0.06) 0.219*** (0.08) 0.235*** (0.08) 9.Decile 0.174*** (0.06) 0.212*** (0.07) 0.234*** (0.07) 10.Decile 0.321*** (0.07) 0.412*** (0.08) 0.397*** (0.08) Cantonal variance 0.274*** Observations 20150 20150 20150
N. of cantons 116 116 116
R2 0.2024 0.0664
AIC 71803.82 68891.47 68237.9
Log likelihood -35869.911 -34404.737 -34076.949
chi2 3077.75 2989.36
Prob > ꭓ2 0 0
Notes: *** p<0.01, ** p<0.05, *<0.10. Pseudo R2 for ologit. Clustered standard errors for OLS and ologit in parentheses. S.E. represents the standard errors.

23
Table A1.2: more than 70 persons per canton
OLS OLOGIT MULTILEVEL
(1) (2) (3)
Coefficients S.E. Coefficients S.E. Coefficients S.E.
Contextual
Oil Dependent -0.344** (0.17) -0.471** (0.21) -0.387* (0.22) Ln(GVA/pop) -0.307*** (0.10) -0.518*** (0.14) -0.224 (0.18)
Inequality -0.145 (0.39) -0.116 (0.52) -0.165 (0.64) Natural Hazard -0.00986 (0.01) -0.0117 (0.01) -0.0176 (0.02) Urban Area 0.000565 (0.00) 0.000699 (0.00) 0.00225 (0.00)
Individual
Urban -0.0551 (0.06) -0.111 (0.08) -0.0775 (0.07) Sex 0.0787** (0.03) 0.0994** (0.04) 0.0799* (0.04) Age -0.0148*** (0.00) -0.0192*** (0.00) -0.0228*** (0.00)
Age^2 0.00011*** (0.00) 0.00014*** (0.00) 0.00018*** (0.00) Married 0.0888*** (0.03) 0.110*** (0.04) 0.153*** (0.04)
Religion 0.0468** (0.02) 0.0426 (0.03) 0.0540** (0.03) Leisure Time 0.289*** (0.01) 0.400*** (0.02) 0.402*** (0.02) Inst. Trust 0.131*** (0.02) 0.171*** (0.02) 0.180*** (0.02) Indigenous -0.107 (0.08) -0.152* (0.09) -0.0642 (0.09) Secondary 0.127*** (0.02) 0.151*** (0.03) 0.169*** (0.03) Tertiary 0.190*** (0.04) 0.240*** (0.05) 0.268*** (0.05) Employed 0.131*** (0.03) 0.144*** (0.04) 0.163*** (0.04)
Socio Econ. Status 0.120*** (0.04) 0.148*** (0.05) 0.177*** (0.05) Health Insurance 0.0695*** (0.03) 0.0975*** (0.03) 0.0698** (0.03) Walls 0.209*** (0.03) 0.273*** (0.04) 0.285*** (0.04) Internet 0.104*** (0.03) 0.130*** (0.04) 0.165*** (0.03) Home Owner 0.0591* (0.03) 0.0763* (0.04) 0.0604 (0.04) 2.Decile 0.0947* (0.06) 0.104 (0.07) 0.101 (0.07)
3.Decile 0.0832* (0.05) 0.125** (0.06) 0.138** (0.06) 4.Decile 0.05 (0.06) 0.0463 (0.07) 0.0572 (0.07) 5.Decile 0.0937* (0.05) 0.124** (0.06) 0.143** (0.06) 6.Decile 0.125** (0.06) 0.141* (0.07) 0.158** (0.07) 7.Decile 0.185*** (0.06) 0.185** (0.07) 0.197*** (0.07) 8.Decile 0.213*** (0.06) 0.253*** (0.08) 0.256*** (0.08) 9.Decile 0.199*** (0.06) 0.248*** (0.07) 0.260*** (0.07)
10.Decile 0.346*** (0.07) 0.450*** (0.09) 0.421*** (0.08) Cantonal variance 0.214*** Observations 19191 19191 19191
N. of cantons 95 95 95
R2 0.2037 0.0672
AIC 68381.98 65559.48 65028.56
Log likelihood -34158.989 -32738.74 -32472.278
chi2 3290.12 3045.41
Prob > ꭓ2 0 0
Notes: *** p<0.01, ** p<0.05, *<0.10. Pseudo R2 for ologit. Clustered standard errors for OLS and ologit in parentheses. S.E. represents the standard errors.

24
Table A1.3: more than 90 persons per canton
OLS OLOGIT MULTILEVEL
(1) (2) (3)
Coefficients S.E. Coefficients S.E. Coefficients S.E.
Contextual
Oil Dependent -0.354** (0.17) -0.486** (0.22) -0.427** (0.22) Ln(GVA/pop) -0.313*** (0.10) -0.528*** (0.14) -0.234 (0.19)
Inequality -0.0206 (0.42) 0.0766 (0.56) 0.375 (0.74) Natural Hazard -0.00963 (0.01) -0.0117 (0.01) -0.0208 (0.02) Urban Area 0.000353 (0.00) 0.000544 (0.00) 0.00128 (0.00)
Individual
Urban -0.0642 (0.06) -0.123 (0.08) -0.0965 (0.08) Sex 0.0776** (0.03) 0.0947** (0.04) 0.0756* (0.04) Age -0.0136*** (0.00) -0.0176*** (0.00) -0.0213*** (0.00)
Age^2 0.000096** (0.00) 0.00012** (0.00) 0.00016*** (0.00) Married 0.0916*** (0.03) 0.118*** (0.04) 0.162*** (0.04)
Religion 0.0477** (0.02) 0.0433 (0.03) 0.0533* (0.03) Leisure Time 0.289*** (0.01) 0.402*** (0.02) 0.404*** (0.02) Inst. Trust 0.139*** (0.02) 0.181*** (0.02) 0.189*** (0.02) Indigenous -0.125 (0.08) -0.173* (0.09) -0.082 (0.09) Secondary 0.129*** (0.02) 0.153*** (0.03) 0.163*** (0.03) Tertiary 0.185*** (0.04) 0.236*** (0.05) 0.253*** (0.05) Employed 0.121*** (0.03) 0.135*** (0.04) 0.155*** (0.04)
Socio Econ. Status 0.111*** (0.04) 0.136*** (0.05) 0.169*** (0.05) Health Insurance 0.0707*** (0.03) 0.0924*** (0.03) 0.0695** (0.03) Walls 0.209*** (0.03) 0.273*** (0.04) 0.293*** (0.04) Internet 0.101*** (0.03) 0.126*** (0.04) 0.161*** (0.04) Home Owner 0.0458 (0.03) 0.0594 (0.04) 0.0455 (0.04) 2.Decile 0.106* (0.06) 0.117* (0.07) 0.121* (0.07)
3.Decile 0.0942* (0.05) 0.140** (0.06) 0.159** (0.06) 4.Decile 0.0468 (0.06) 0.0496 (0.07) 0.0668 (0.07) 5.Decile 0.103** (0.05) 0.138** (0.06) 0.168*** (0.06) 6.Decile 0.135** (0.06) 0.159** (0.08) 0.180** (0.07) 7.Decile 0.197*** (0.06) 0.206*** (0.07) 0.221*** (0.07) 8.Decile 0.221*** (0.07) 0.264*** (0.09) 0.270*** (0.08) 9.Decile 0.216*** (0.06) 0.274*** (0.07) 0.287*** (0.07)
10.Decile 0.360*** (0.07) 0.468*** (0.09) 0.442*** (0.08) Cantonal variance 0.166*** Observations 18286 18286 18286
N. of cantons 79 79 79
R2 0.2055 0.0681
AIC 65049.41 62341.51 61920.55
Log likelihood -32492.706 -31129.754 -30918.276
chi2 3328.85 3141.38
Prob > ꭓ2 0 0 0
Notes: *** p<0.01, ** p<0.05, *<0.10. Pseudo R2 for ologit. Clustered standard errors for OLS and ologit in parentheses. S.E. represents the standard errors.

25
Appendix 2: Natural Hazards Index Methodology
Demorales & D’Ercole (2001) built a quantitative synthetic indicator based on the valuation of
six natural hazards for 218 Ecuadorian cantons: (i) the expected magnitude (seismic), (ii) the
intensity (droughts), (iii) the extent of the danger (landslides and floods), (iv) the danger
(volcanoes), (v) the recurrence (floods) and (vi) the potential (tsunami, earthquakes,
volcanoes). Each natural hazard was scored on a 0 - 2 or 0 - 3 scale for every canton. This
information was provided by the National Institute of Meteorology and Hydrology, the
Geophysical Institute of the National Polytechnic School and the Military Geographic Institute.
Table A2.1: scores’ range for each of the natural hazard
Natural Hazard Score range
Earthquake 0-3 Tsunami 0-2
Volcano 0-3 Flood 0-3 Landslide 0-3 Drought 0-2
Total Hazard Index 0-16
Source: (Demorales & D’Ercole, 2001).
The range is determined by the degree of danger represented by the potential natural disaster,
as established by the institution providing the information. For instance, the Geophysical
Institute of the National Polytechnic School points out four seismic and tsunami hazard zones.
For the most dangerous zones, the score will be 3 and zero for the less dangerous. Droughts,
on the other hand, have a three categories rating: strong potential (scores 2), average
potential (scores 1) and weak potential (scores 0).
In cases where the given information shows a canton to be exposed, at least partly, to a
natural hazard, all its territory is given the corresponding score. The final cantonal score is
given by the addition of each natural hazard’s score and the maximum possible value for the
cantonal index is 16.

26
Appendix 3: Correlation matrix
Table A3.1: correlation matrix
SWB Urban Sex Age Marr. Relig. Leis.
time
Inst.
Trust Indig. Sec. Ter. Emp.
Soc.
st.
Health
ins Walls Internet
Home
owner Decile
Oil
dep GVA/pop Ineq
Nat
haz
Urb.
area
Well-
being 1
Urban 0.028 1
Sex 0.075 -0.108 1
Age -0.043 0.007 -0.073 1
Married 0.089 -0.031 0.391 0.044 1 Religion 0.014 -0.029 -0.022 0.077 0.004 1
Leisure
time 0.376 0.082 0.032 -0.007 0.076 0.013 1
Inst.
Trust 0.110 -0.072 0.001 -0.037 -0.013 0.027 0.078 1
Indig. -0.030 -0.224 0.050 -0.058 0.111 -0.005 -0.012 0.021 1
Second. 0.037 0.133 0.012 -0.207 -0.009 -0.022 0.043 0.004 -0.027 1
Tertiary 0.141 0.172 -0.015 -0.067 0.116 -0.039 0.113 -0.045 -0.060 -
0.323 1
Employed 0.064 -0.091 0.273 -0.354 0.087 -0.028 0.005 0.017 0.053 0.039 0.037 1
Soc.-econ.
stat. 0.127 0.095 0.012 -0.031 0.092 -0.033 0.078 0.007 -0.020
-
0.148 0.538 0.137 1
Health Ins. 0.114 0.103 0.117 -0.244 0.089 -0.034 0.090 0.006 -0.043 0.101 0.266 0.288 0.314 1 Cond. of
walls 0.162 0.175 0.021 0.001 0.144 -0.014 0.168 0.013 -0.054 0.069 0.250
-
0.012 0.173 0.130 1
Internet
access 0.137 0.235 0.032 -0.004 0.227 -0.021 0.123 -0.052 -0.116 0.068 0.381 0.039 0.294 0.237 0.305 1
Home -
owner 0.008 -0.149 -0.001 0.333 0.114 0.024 -0.006 -0.013 0.043
-
0.139
-
0.028
-
0.093 -0.004 -0.123
-
0.055 0.017 1
Decile 0.150 0.257 0.027 0.130 0.079 -0.007 0.152 -0.039 -0.134 0.040 0.380 0.004 0.312 0.307 0.310 0.377 -0.029 1
Oil-
dependant -0.027 -0.026 0.019 -0.037 -0.005 -0.002 -0.029 -0.004 0.046 0.025
-
0.016 0.020 -0.001 0.021
-
0.035 -0.025 -0.005
-
0.026 1
GVA/pop -0.045 0.209 -0.036 -0.029 0.011 -0.043 0.039 -0.070 -0.084 0.085 0.091 -
0.023 0.058 0.136 0.167 0.165 -0.116 0.216 0.285 1
Inequality 0.017 -0.113 0.045 -0.004 0.054 0.001 0.027 -0.002 0.105 -
0.014 0.047 0.012 0.066 0.019 0.046 0.012 0.008
-
0.019 0.175 -0.002 1
Natural
Hazard -0.022 0.192 -0.025 0.008 -0.011 -0.062 0.022 -0.065 -0.083 0.020 0.054
-
0.050 0.016 0.065 0.049 0.050 -0.019 0.058 -0.289 0.080 0.109 1
Urban area 0.010 0.511 -0.080 0.016 -0.069 -0.026 0.066 -0.069 -0.200 0.104 0.090 -
0.071 0.021 0.075 0.091 0.159 -0.088 0.208 -0.098 0.265
-
0.266 0.218 1
27
List of figures
Figure 1: Wellbeing across cantons in Ecuador (2015) ................................................ 7
Figure 2: Spatial Distribution of the Natural Hazards Index. .......................................10

28
List of tables
Table 1: Definition and descriptive statistics of individual variables .............................. 8
Table 2:Definition and descriptive statistics of contextual variables .............................. 9
Table 3: Regression results ....................................................................................12
Table A1.1: more than 50 persons per canton ..........................................................22
Table A1.2: more than 70 persons per canton ..........................................................23
Table A1.3: more than 90 persons per canton ..........................................................24
Table A2.1: scores’ range for each of the natural hazard ...........................................25
Table A3.1: correlation matrix ................................................................................26

GETTING IN TOUCH WITH THE EU
In person
All over the European Union there are hundreds of Europe Direct information centres. You can find the address of the centre nearest you at: http://europea.eu/contact
On the phone or by email
Europe Direct is a service that answers your questions about the European Union. You can contact this service:
- by freephone: 00 800 6 7 8 9 10 11 (certain operators may charge for these calls),
- at the following standard number: +32 22999696, or
- by electronic mail via: http://europa.eu/contact
FINDING INFORMATION ABOUT THE EU
Online
Information about the European Union in all the official languages of the EU is available on the Europa website at: http://europa.eu
EU publications You can download or order free and priced EU publications from EU Bookshop at:
http://bookshop.europa.eu. Multiple copies of free publications may be obtained by contacting Europe
Direct or your local information centre (see http://europa.eu/contact).

KJ-N
A-28890-EN
-N
doi:10.2760/858865
ISBN 978-92-79-76843-9


