Page 1
The Development of Synergistic Heat Stabilizers for PVC
from Zinc Borate – Zinc Phosphate
By
C.Aykut ERDODU
A Dissertation Submitted to the
Graduate School in Partial Fulfillment of the
Requirement for the Degree of
MASTER OF SCIENCE
Department: Chemical Engineering
Major: Chemical Engineering
zmir Institute of Technology
zmir, Turkey
August, 2004
A-PDF MERGER DEMO
Page 2
We approve the thesis of C.Aykut ERDODU Date of Signature ………………………………………….. 30.08.2004 Prof. Dr. Devrim BALKÖSE Supervisor Department of Chemical Engineering ………………………………………….. 30.08.2004 Prof. Dr. Semra ÜLKÜ Co-Supervisor Department of Chemical Engineering ………………………………………….. 30.08.2004 Prof.Dr. Tamerkan ÖZGEN Department of Chemistry ………………………………………….. 30.08.2004 Assist.Prof.Dr.Funda TIHMINLIOLU Department of Chemical Engineering ………………………………………….. 30.08.2004 Assist.Prof. Dr. Fikret NAL Department of Chemical Engineering ………………………………………….. 30.08.2004 Prof. Dr. Devrim BALKÖSE Head of Chemical Engineering Department
Page 3
ACKNOWLEDGEMENT
The financial support of this project by 2003-IYTE-39 is gratefully acknowledged. I
would like to express my sincere gratitude to my advisors Prof. Devrim BALKÖSE and
Prof. Semra ÜLKÜ for their support, guidance and encouragement during this study and
the preparation of the thesis.
I am very grateful to Sevdiye ATAKUL, Mehmet GÖNEN, Öniz BRSOY and Yarkın
ÖZGARP for their help, encouragement and friendship throughout this project. I want to
express my thanks to Gökhan ERDOAN for his help for SEM and EDX analyses, Burcu
ALP for TGA analyses and Özlem Çalar DUVARCI and Filiz ÖZMIHÇI for FTIR
analysis.
I also present my deepest thanks to my officemate, Emre ELTEPE and my managers in
Pigment Sanayi A.. Kadri ELTEPE and A.Kemal YALNIZ and all other friends for their
friendship, encouragement and understandings during this study.
Finally, my thanks go to my family for their help and encouragement during the
preparation of the thesis.
Page 4
TABLE OF CONTENTS
Page
ABSTRACT i
ÖZ iii
LIST OF FIGURES v
LIST OF TABLES viii
CHAPTER 1. INTRODUCTION 1
CHAPTER 2. THE THERMAL DEGRADATION OF PVC 4
CHAPTER 3. THERMAL STABILIZATION AND STABILIZERS 10
3.1 Thermal Stabilization 10
3.2 Heat Stabilizers 10
3.2.1 Lead Compounds 10
3.2.2 Organotin Compounds 11
3.2.3 Compounds of Other Metals 11
3.2.4 Organic Stabilizers 11
3.3 Flame Retardants 12
3.4 Flame Retardants For PVC 14
3.4.1 Antimony Oxide 14
3.4.2 Molybdenum Oxide 15
3.4.3 Zinc Stannates 15
3.4.4 Aluminium Trihydrate 15
CHAPTER 4. ZINC BORATE AND ZINC PHOSPHATE 16
4.1 Zinc Borate 16
4.1.1 Production 17
Page 5
4.1.2 Boron Mechanism 18
4.1.3 Flame Retardant Effect of ZB 19
4.2 Zinc Phosphate 28
4.2.1 Synergism in Nickel Oxide and Zinc Phosphate 28
4.2.2 IR Spectroscopic Study of Phosphate Minerals 29
CHAPTER 5. EXPERIMENTAL 32
5.1 Materials Used 32
5.2 Methods 34
5.2.1 Film Preparation 34
5.2.2 Film Characterization 35
5.2.2.1 Scanning Electron Microscope 35
5.2.2.2 Energy Dispersive X-Ray 35
5.2.3 Thermal Stability Tests 36
5.2.3.1 Static Oven Tests 36
5.2.3.2 PVC Thermomat 36
5.2.3.3 TGA Analyses 38
5.2.4 Fourier Transform Infrared Analyses 39
5.2.5 Fourier Transform Infrared Analyses by ATR Method 39
5.2.6 Colour Measurement 39
CHAPTER 6. RESULTS AND DISCUSSION 40
6.1 Characterization of Zinc Borate and Zinc Phosphate 40
6.2 Kinetic Study of Dehydrochlorination of PVC Plastigels 44
6.2.1 Kinetic Theory of Degradation PVC Plastigels 44
6.2.2 Kinetic Study of PVC Plastigels 47
Page 6
6.2.3 Activation Energies of Dehydrochlorination Reactions 55
6.2.4 Preexponential Factors of Dehydrochlorination Reactions 56
6.3 Characterization of PVC Plastisols and PVC Plastigels 59
6.3.1 Thermogravimetric Study of PVC Films 59
6.4 Colour Tests of PVC Plastigels 65
6.4.1 Static Oven Test 65
6.5 Colour Measurement 67
6.6 Spectroscopy Analyses of Films 70
6.6.1 Fourier Transmission Infrared (FT-IR) Spectra Tests 70
6.6.2 Atanuated Total Reflection (ATR) Spectra Tests 76
6.7 Morphology of PVC Plastigels 82
6.8 Elemental Analyses of PVC Plastigels 87
CHAPTER 7 CONCLUSIONS 91
APPENDIX 93
REFERENCES 100
Page 7
i
ABSTRACT
Poly(vinyl chloride) (PVC), releases smoke and toxic gases (hydrogen chloride,
HCl) during heating at temperatures above 140°C with the result of dehydrochlorination
reaction. Obtaining flame retardant and smoke suppressed PVC compositions are
getting more and more important. PVC is widely applied as a covering insulation for
electrical and communication cables and in domestic uses such as window frames,
doors, profiles, sidings and gutters because of its high level of combustion resistance.
For this reason, many additives are studied to achieve better compositions than the
present ones.
In this study, the synergistic effects of zinc borate (ZB) – zinc phosphate (ZP) on
thermal stability of plastigels obtained from PVC and dioctylphthalate (DOP) plastisols
were investigated using spectroscopic and thermal techniques.
Plastigels having a total of 2.5 parts (w/w) of zinc borate and zinc phosphate, 80
parts (w/w) of DOP and 100 parts (w/w) of PVC were gelled at 140°C for 15 minutes in
a vacuum oven. The plastigel films having different compositions of ZB and ZP were
investigated after heating at 140°C and 160°C from 15 minutes to 90 minutes by using
Fourier Transform Infrared (FT-IR) spectroscopy, Scanning Electron Microscope
(SEM), Energy Dispersive X-ray (EDX). The kinetic studies were made by PVC
Thermomat 763 instrument. HCl gas released due to heating of the plastigel films at
both 140°C and 160°C in PVC Thermomat instrument under nitrogen gas increases the
conductivity of deionized water in measuring vessels of this instrument. By measuring
the conductivity change in water caused by the absorption of HCl released, the thermal
degradation of PVC plastigel films were studied by means of reaction rates, rate
constants and activation energies. Compositions having only ZB or ZP have retarded
dehydrochlorination of PVC compared with the control sample. However, the
compositions with both ZB and ZP have a superior synergistic effect on char formation
of PVC. Since induction times of the compositions having both ZB and ZP were higher
than that of the control samples having only ZB or only ZP, the synergistic effect was
observed.
The compositions greatly promote the char formation of PVC. The thermal stability
of plastigels was also studied by their yellowness index (YI). The elemental
Page 8
ii
compositions of these films were investigated in atomic scale using EDX and SEM and
their compositions were calculated both for particles and matrix.
Page 9
iii
ÖZ
Poli(vinil klorür) (PVC), 140°C’ nin üstünde ısıtıldıında dehidroklorinasyon
reaksiyonundan dolayı duman ve zehirli gazları (hidrojen klorür, HCl) ortama salar.
Alev geciktirici ve duman önleyici katkı maddelerine sahip PVC birleimlerinin eldesi
gittikçe daha önem kazanmaktadır. PVC elektrik ve haberleme kablolarında izolasyon
malzemesi ve evlerimizide kapı ve pencere çerçevelerinde, profillerde yanmaya karı
yüksek rezistansından dolayı gittikçe daha çok kullanılmaktadır. Bu nedenle,
mevcutlardan daha iyi bir birleim elde etmek için birçok katkı malzemesi
aratırılmaktadır.
Bu çalımada, çinko borat (ZB), çinko fosfat (ZP), PVC ve dioktilfitalat (DOP)
plastisollerinden elde edilen plastijellerin termal kararlılıı üzerindeki sinerjistik etkileri
spektroskopik ve termal teknikler kullanılarak incelenmitir.
Toplam 2.5 kısım (aırlıkça) çinko borat ve çinko fosfat, 80 kısım (aırlıkça) DOP
ve 100 kısım (aırlıkça) PVC karıımına sahip olan plastijeller havayla dolaımı
salanan bir vakum fırınında 140°C altında jelletirilmitir. Çeitli çinko borat ve çinko
fosfat oranlarına sahip olan plastijeller 140°C ve 160°C altında 15 dakikadan 90
dakikaya kadar 15 dakikalık aralıklarla ısıtılmı ve bu numuneler üzerinde FT-IR
spektroskopi, elektron taramalı mikroskop, EDX analizleri yapılmıtır. Kinetik
çalımalar 763 PVC Thermomat cihazıyla yapılmıtır. Plastijellerin 140°C ve 160°C
altında ısıtılmalarından dolayı açıa çıkan HCl gazı azot gazı yardımıyla bu cihazın
ölçüm hücrelerine taınarak deionize suyun içerisindeki iletkenlik deerlerini
arttırmıtır. Açıa çıkan HCl gazının deionize suyun içine absorplanarak suyun
iletkenlik deerlerini deitirmesi ve bu deerlerin ölçülmesinden PVC plastijel
filmlerinin ısıl kararlılıı reaksiyon hızları, reaksiyon sabitleri ve aktivasyon enerjileri
cinsinden çalıılmıtır. Sadece çinko borat ya da sadece çinko fosfat içeren birleimlerin
PVC’nin dehidroklorinasyonunu, kontrol örneine göre geciktirdii görülmütür. Aynı
zamanda hem çinko borat hem de çinko fosfat içeren birleimler PVC’nin
kömürlemesinde daha iyi sinerjistik etkiye sahiptir. Çinko borat ve çinko fosfat içeren
birleimlerin indüksiyon zamanları kontrol numunesine göre daha yüksek olduundan
dolayı sinerjistik etkinin olduu gözlenmitir.
Page 10
iv
Birleimler kömürlemeyi de hızlandırmıtır. Isıl kararlılıkları ayrıca sarılık
indeksleri yönünden de incelenmitir. Filmlerin elemental içerikleri atomik ölçüde EDX
ve taramalı elektron mikroskobu yardımıyla incelenmi ve kompozisyonları
hesaplanmıtır.
Page 11
v
LIST OF FIGURES Page Figure 1.1 PVC molecule 1 Figure 2.1 The general mechanism of degradation of PVC 5
Figure 3.1 A comparison of the effect of antimony oxide and ZB on the oxygen index of
flexible PVC containing from 20 to 50 phr DOP 15
Figure 4.1 Scanning-type electron microphotograph of Zinc Borate 18
Figure 4.2 a) Effects of ATH, ZB and ZB – ATH contents on LOI of PVC. b) Effects of
ATH, ZB, and ZB – ATH contents of smoke density of PVC 21
Figure 4.3 a) TGA curves of PVC and PVC/ZB – ATH,
b) Effects of ATH, ZB, and ZB – ATH contents on char residue of PVC 22
Figure 4.4 Effects of ZB and ZB – ATH content on the LOI of PVC 23
Figure 4.5 Effects of the ZB and ZB – ATH content on the impact strength of PVC 24
Figure 4.6 Effects of ZB and ZB – ATH content on the yield strength of PVC 24
Figure 4.7 LOI Values (%) of the compositions 25
Figure 4.8 Changes of dynamic FTIR spectra obtained from the thermo-oxidative
degradation of LLDPE/10% EG/20% ZB blends in the condensed phase with
different pyrolysis times. (a): 300°C, b):400°C 26
Figure.4.9 Infrared spectroscopic results for parahopeite 31
Figure 5.1 Dioctyl Phthalate Molecule 33
Figure 5.2 Blade of Film Applicator and Film Applicator 35
Figure 5.3 PVC Thermomat Instrument 37
Figure 5.4 Top view of PVC Thermomat instrument 38
Figure 5.5 The measuring blocks of 763 PVC Thermomat instrument 39
Figure 6.1 TGA curve of ZB powder 41
Figure 6.2 TGA curve of ZP powder 42
Figure 6.3 FT-IR spectra of ZB powder sample 43
Figure 6.4 FT-IR spectra of ZP powder sample 43
Figure 6.5 The Scanning electron micrographs of the ZB and ZP powders
a.) ZB, 2 µm, b.) ZB, 10 µm, c.) ZP, 10 µm.,d.) ZP, 20 µm 44
Figure 6.6 A representative curve for PVC Thermomat results 48
Figure 6.7 PVC Thermomat Results of PVC films heated at 140°C 49
Page 12
vi
Figure 6.8 PVC Thermomat Results of PVC films heated at 160°C 50
Figure 6.9 The bar graph of evaluated induction time for zinc borate at 140°C 54
Figure 6.10 The bar graph of visual induction time for zinc borate at 140°C 54
Figure 6.11 The bar graph of evaluated induction time for zinc borate at 160°C 55
Figure 6.12 The bar graph of visual induction time for zinc borate at 160°C 55
Figure 6.13 Kinetic compensation effect curve for the samples having different
compositions 59
Figure 6.14 (a) TGA curves of Sample Nos.1 – 4 62
Figure 6.14 (b) TGA curves of Sample Nos.5 – 8 62
Figure 6.15 The onset temperature bar graph of the samples 65
Figure 6.16 The change of yellowness index tendency of the PVC plastigel films with time at 140°C 70
Figure 6.17 The change of yellowness index tendency of the PVC plastigel films with time at 160°C 70
Figure 6.18 FT-IR spectra of PVC control sample at 140°C and 160°C. 72
Figure 6.19 FT-IR spectra of sample having 1.36% ZP at 140°C and 160°C. 73
Figure 6.20 FT-IR spectra of sample having 0.27% ZB and 1.29% ZP at 140°C
and 160°C 73
Figure 6.21 FT-IR spectra of sample having 0.54% ZB and 0.81% ZP at 140°C
and 160°C 74
Figure 6.22 FT-IR spectra of sample having 0.68% ZB and 0.68% ZP at 140°C
and 160°C 74
Figure 6.23 FT-IR spectra of sample having 0.81% ZB and 0.54% ZP at 140°C
and 160°C 75
Figure 6.24 FT-IR spectra of sample having 1.29% ZB and 0.27% ZP at 140°C
and 160°C 75
Figure 6.25 FT-IR spectra of sample having 1.36% ZB at 140°C and 160°C. 76
Figure 6.26 Absorbance versus ZB wt% at 1580cm-1 at 140 and 160°C. 76
Figure 6.27 Absorbance versus ZB wt% at 3227cm-1 at 140 and 160°C. 77
Figure 6.28 FT-IR spectra of PVC Control sample at 140°C and 160°C. 78
Figure 6.29 FT-IR spectra of sSample having 0.00% ZB and 1.36% ZP at 140°C and 160°C.
79
Figure 6.30 FT-IR spectra of sample having 0.27% ZB and 1.29% ZP at 140°C and 160°C.
79
Page 13
vii
Figure 6.31 FT-IR spectra of sample having 0.54% ZB and 0.81% ZP at 140°C and 160°C.
80
Figure 6.32 FT-IR spectra of sample having 0.68% ZB and 0.68% ZP at 140°C and 160°C.
80
Figure 6.33 FT-IR spectra of sample having 0.81% ZB and 0.54% ZP at 140°C and 160°C.
81
Figure 6.34 FT-IR spectra of sample having 1.29% ZB and 0.27% ZP at 140°C and 160°C.
81
Figure 6.35 FT-IR spectra of sample No.8 having 1.36% ZB and 0.00% ZP at 140°C and
160°C. 82
Figure 6.36 Absorbance versus ZB wt% at 1540cm-1 at 140 and 160°C. 82
Figure 6.37 Absorbance versus ZB wt% at 3227cm-1 at 140 and 160°C. 83
Figure 6.38 SEM microphotographs of PVC control samples
a) Heated at 140°C for 15 min. b) Heated at 160°C for 90 min 84
Figure 6.39 SEM microphotographs of sample having 1.36% ZP only.
a) Heated at 140°C for 15 min. b) Heated at 160°C for 90 min 84
Figure 6.40 SEM microphotographs of sample having 0.27% ZB and 1.29% ZP.
a)Heated at 140°C for 15 min. b) Heated at 160°C for 90 min 85
Figure 6.41 SEM microphotographs of sample having 0.54% ZB and 0.81% ZP.
a) Heated at 140°C for 15 min. b) Heated at 160°C for 90 min 85
Figure 6.42 SEM microphotographs of sample having 0.68% ZB and 0.68% ZP.
a) Heated at 140°C for 15 min. b) Heated at 160°C for 90 min 86
Figure 6.43 SEM microphotographs of sample having 0.81% ZB and 0.54% ZP.
a) Heated at 140°C for 15 min. b) Heated at 160°C for 90 min 86
Figure 6.44 SEM microphotographs of sample having 1.29% ZB and 0.27% ZP.
a) Heated at 140°C for 15 min. b) Heated at 160°C for 90 min 87
Figure 6.45 SEM microphotographs of sample having 1.36% ZB only.
a) Heated at 140°C for 15 min. b) Heated at 160°C for 90 min 87
Figure 6.46 a) EDX analysis of elements of PVC plastigel having 1.36% ZP only.
b) SEM micrograph of PVC plastigel having 1.36% ZP only.
c) EDX analysis of elements of PVC plastigel having 0.27% ZB + 1.29% ZP.
d) SEM micrograph of PVC plastigel having 0.27% ZB + 1.29% ZP 89
Page 14
viii
LIST OF TABLES
Page
Table 1.1 Principal groups of fire retardants and their market in 2003 2
Table 3.1 Effect of flame retardancy of molybdenum oxide and antimony oxide 16
Table 4.1 Manufacturers and Trade Names of some ZB Flame Retardants 19
Table 4.2 Composition of flame-retardant coatings 25
Table 4.3 The Composition in US.Patent No.5,886,072 28
Table 4.4 The compositions of US.Patent No.5,338,791 28
Table 4.5 The results of US.Patent No.5,338,791 28
Table 4.6 Test results and compositions of US.Patent No.3,965,068 29
Table 5.1 The general product specifications of Viscobyk 5025 33
Table 5.2 The general product specifications of STORFLAM ZB 2335 34
Table 5.3 The general product specifications of ZP – 46 34
Table 5.4 The compositions used in the experiments 36
Table 6.1 Elemental composition of the ZB and ZP powder 44
Table 6.2 PVC Thermomat Results at 140°C of PVC plastigels 52
Table 6.3 PVC Thermomat Results at 160°C of PVC plastigels 53
Table 6.4 Activation energies of PVC plastigels heated at 140° and 160°C 57
Table 6.5 Preexponential factors of PVC plastigels heated at 140° and 160°C 58
Table 6.6 Mass loss of PVC plastigel films at 225°C 63
Table 6.7 Mass loss of PVC plastigel films at 400°C 63
Table 6.8 Mass loss of PVC plastigel films at 600°C 64
Table 6.9 Onset temperatures of PVC plastigel films 64
Table 6.10 The appearance of the film samples heated at 140°C for
different time periods 67
Page 15
ix
Table 6.11 The appearance of the film samples heated at 160°C for
different time periods 67
Table 6.12 Yellowness Index values of the PVC Films heated at 140°C 68
Table 6.13 Yellowness Index values of the PVC Films heated at 160°C 68
Table 6.14 The theoretical compositions of components 89
Table 6.15 Elemental analyses of particles at 140°C for 15 minutes
(Average values) 90
Table 6.16 Elemental analyses of polymer phase at 140°C for 15 minutes
(Average values) 90
Table 6.17 Elemental analyses of particles at 160°C for 90 minutes
(Average values) 91
Table 6.18 Elemental analyses of polymer phase at 160°C
for 90 minutes (Average values) 91
Table A.1 The EDX results of PVC control sample at 140°C for 15 minutes 94
Table A.2 The EDX results of sample 1.36% ZP only at 140°C for 15 minutes 94
Table A.3 The EDX results of sample 0.27% ZB + 1.29% ZP at 140°C
for 15 minutes 94
Table A.4 The EDX results of sample 0.54% ZB + 0.81% ZP at 140°C
for 15 minutes 94
Table A.5 The EDX results of sample 0.68% ZB + 0.68% ZP at 140°C
for 15 minutes 95
Table A.6 The EDX results of sample 0.81% ZB + 0.54% ZP at 140°C
for 15 minutes 95
Table A.7 The EDX results of sample 1.27% ZB + 0.29% ZP at 140°C
for 15 minutes 95
Page 16
x
Table A.8 The EDX results of sample 1.27% ZB + 0.29% ZP at 140°C
for 15 minutes 95
Table A.9 The EDX results of PVC control sample at 160°C for 90 minutes 96
Table A.10 The EDX results of sample 1.36% ZP only at 160°C for 90 minutes 96
Table A.11 The EDX results of sample 0.27% ZB + 1.29% ZP at 160°C
for 90 minutes 96
Table A.12 The EDX results of sample 0.54% ZB + 0.81% ZP at 160°C
for 90 minutes 97
Table A.13 The EDX results of sample 0.68% ZB + 0.68% ZP at 160°C
for 90 minutes 97
Table A.14 The EDX results of sample 0.81% ZB + 0.54% ZP at 160°C
for 90 minutes 97
Table A.15 The EDX results of sample 1.27% ZB + 0.29% ZP at 160°C
for 90 minutes 98
Table A.16 The EDX results of sample 1.27% ZB + 0.29% ZP at 160°C
for 90 minutes 98
Table A.17 CIE XYZ and Lab* values of white paper 98
Table A.18 CIE XYZ and Lab* values of the PVC plastigel films heated at 140°C for
15 minutes. 99
Table A.19 CIE XYZ and Lab* values of the PVC plastigel films heated at 160°C for
90 minutes. 100
Page 17
1
CHAPTER 1
INTRODUCTION
It is well known that poly (vinyl chloride) (PVC) has high chlorine content, so it is
an incombustible material. The construction of buildings often requires the use of fire or
flame retardant jacketing, facing materials for heating, duct insulation, electrical
insulation applications, cables and domestic uses such as in gutters, doors, profiles,
house sidings, and similar applications involving plies of combustible sheet material or
plies of such sheet materials laminated to various substrates such as aluminium foil and
fibre glass batting.
The general formula of PVC is -(CH2CHCl)n-.
'C
H
H
'C
H
Cl Figure 1.1 PVC molecule.
Because of its lower cost and versatility, PVC is often used to prepare such sheet
materials by being blended with various additives which are designed to impart the
required flame retardant characteristics. However, although PVC has a good flame
retardancy because of its high chlorine content, PVC is not a safe material by means of
fire hazards because it releases high levels of smoke and toxic gases like hydrogen
chloride, benzene, toluene and other aromatic compounds leading to a colour change
from brown and even black in the end (Pi et.al., 2002; Ning, and Guo, 2000; Baltacıolu
and Balköse, 1999).
Additives such as compounds containing metals like antimony, zinc, copper, iron,
aluminium, magnesium and molybdenum are widely used in reduced flammability and
smoke suppression, the most important commercial smoke suppressants are zinc and
aluminium compounds (Pi et.al., 2002; Ning and Guo, 2000). Many of these additives
have been aimed at the effects of these compounds on the flame retardancy and smoke
suppression of PVC as well as on the chemistry of PVC decomposition. Metal
compounds are used to displace the labile chlorine atom in PVC polymer chain by more
stable groups.
Page 18
2
Nonetheless a large number of fire retardant additives are possible. The
development of the field of fire retardant additives has achieved many different
compounds and research has led to a diversity of additives and a thriving market. Fire
retardants are now the most used plastics additives, exceeding 40% of a $1 billion
market in 1991 (Kirk-Othmer, 1994). This market is expected to increase. Table 1.1
gives the principal groups of chemicals (Tekta, Mergen, 2003).
Table 1.1 Principal groups of fire retardants and their market in 2003 (Tekta,
Mergen, 2003).
Group USA, % West Europe, %
Al(OH)3 39 47
Brominated compounds 27 13
Phosphonated compounds 12 23
Chlorinated compounds 11 3
Antimony oxides 8 7
Mg(OH)2 1 2
Others* 2 5
*Zinc borate and some other borate flame retardants.
85% of all of the flame retardants produced all around the world is used in plastics.
As it is seen the most widely used compound is Al(OH)3 and its usage is around 50%.
Currently, borates have a low demand in world flame retardant market. In North
America, annual demand of flame retardants is 350,000 ton and the borates have a 1%
share in this market making 3,500 ton per annum. However, from 1991 onwards the
share of borate compounds as flame retardants has increased and it is still increasing
therefore the major producer in USA, U.S.Borax has increased its capacity. The market
increase of zinc borate all around the world is expected to be 12 – 15 % (Tekta,
Mergen, 2003).
PVC plastisol is a mixture of PVC powder and plasticizer. It is transformed into the
solid substance of the ultimate paste-derived product by heating at an elevated
temperature, known as gelation. As the temperature of the plastisol rises, the plasticizer
penetrates into the polymer particles which swell and merge, first loosely and then more
fully, until the process culminates in complete mutual solution of polymer and
Page 19
3
plasticizer with the formation of homogeneous plasticized PVC melt (Titow et.al.,
1985).
To enhance the fire retardancy and to improve the thermal stability of PVC, the
synergistic effect of the combination of Zinc Borate (ZB) and Zinc Phosphate (ZP) on
the flame retardancy, char residue, thermal degradation kinetics of PVC and its
mechanism were studied in this study. The study aims to find out the optimum
synergistic composition of ZB and ZP in PVC thermal stabilization.
Thermal stabilization of PVC was determined by PVC Thermomat instrument. The
conductivities of deionized water in which the plastigel films were placed and heated at
elevated temperatures in the presence of nitrogen gas, were measured with respect to
time. The time when the conductivity starts to increase is marked as Induction Time and
the time when the conductivity reaches 50 µS/cm is marked as Stability Time, which is
the maximum acceptable level of degradation. The char residue of formation was
investigated by TGA analyses. It was calculated by the ratios of the initial masses of
PVC plastigel films to final masses after heating.
ZB and ZP were supplied from commercial products for all of the tests.
Page 20
4
CHAPTER 2
THE THERMAL DEGRADATION OF PVC
PVC is commonly used as a thermoplastic because of its wide variability of
properties allowing its application in rigid and soft products. However, PVC has very
poor thermal, thermo oxidative light stability. The degradation of PVC and some
copolymers, and the ways in which various stabilizers counteract and modify the
process, have been widely studied for many years. The major chain degradation occurs
by the elimination of HCl and simultaneous formation of conjugated double bond
leading to a colour change (progressing with the extent of breakdown from light yellow,
through reddish brown, to almost black in severe cases) and also which causes the
deteriorations of physical, chemical and electrical properties. Dehydrochlorination can
occur at only moderately elevated temperatures (about 100°C). It is catalyzed by the
HCl evolved (autocatalysis), and can also be promoted or initiated by other strong acids
(Titow et.al., 1985). Numerous stabilizers have been developed to neutralize the
released HCl and prohibit further degradation by preventive reactions.
PVC polymers and copolymers are susceptible to degradation by heat (the thermal
degradation is sometimes referred to as “thermolysis”) and by light (photolysis, also
called photo degradation, and in some contexts photochemical degradation); in both
cases degradation is rapid and more severe in the presence of oxygen. Heat stabilizers
are incorporated in all PVC compositions to protect the polymer against thermal
degradation at high temperatures of composition and also subsequently in service by
eliminating the labile chlorine atom near the double bond.
Page 21
5
The general mechanism of degradation of PVC is shown in Figure 2.1.
Cl Cl Cl
Cl Cl
Cl H
Cl
Cl HHCl Figure 2.1. The general mechanism of degradation of PVC.
A detailed mechanism has been suggested (Ning and Guo, 2000). ZnCl2 from zinc
salts of thermal stabilizers which is formed along with the thermal decomposition of
PVC acts as an effective catalyst for the ionic dehydrochlorination of PVC. The
dehydrochlorination of PVC with the influence of ZnCl2 is observed with the formation
of trans-polyene structures which results in increased char formation and smoke
formation. The said mechanism is given as follows,
Page 22
6
CH
Cl
H
CH
Cl
H
CH
H
CH Cl ZnCl2
CH2
CH
CH
CH
CH2
CH
CH
CH
CH
CH
CH2
CH
CH
CH
CH
CH
ZnCl2
ZnCl2
δ+
δ+δ−
+
-ZnCl3
ZnCl3
+
-
+ +
(2.1)
(2.2)
ZnCl3-
++
(2.3)
ZnCl3
+
-
................ Char (2.4)
ZnCl3-
(Ning and Guo,2000).
The process starts with a chlorine atom activated by an adjacent allylic bond
configuration where that is already present in mid-chain; chlorine in the same position
relative to an allylic end-group would also be activated.
Dehydrochlorination can occur at only moderately elevated temperatures (about
100°C). It is catalysed by the HCl evolved (autocatalysis), and can also be promoted or
initiated by other strong acids.
In addition to dehydrochlorination, thermal degradation of PVC polymer in the
presence of oxygen also involves oxidation, with the formation of hydroperoxide, cyclic
peroxide, and keto groups, some of which can provide additional active sites for
initiation of dehydrochlorination.
Chain scission and cross-linking can also take place as degradation proceeds, both in
air and in an inert atmosphere.
If the thermal stability of PVC polymer or composition at a given temperature is
defined in terms of time required for one of the main manifestations of degradation to
Page 23
7
reach a stated level and if the degradation is treated as a unified process, thermally
activated in the classic manner, the appropriate Arrhenius-type relationship may be
written in the form below:
where;
t is the duration of stability;
t0 is a constant;
E is the activation energy for thermal degradation of PVC polymer in the conditions
(and/or composition) concerned;
R is the ideal gas constant and
T is the absolute temperature.
The activation energy for thermal degradation of an uPVC composition is quoted by
Chauffoureaux, et.al.(1979) as 25.9 kcal mol-1, by Rice and Adam (1977) as 20 kcal
mol-1.
Susceptibility to the thermal degradation varies with the process of manufacture of
the PVC polymer and also with the source of supply. Other things being equal, the
susceptibility increases (inherent stability decreases) in the sequence:
Mass polymer suspension polymer emulsion polymer
Higher molecular weight makes for greater resistance to degradation. The stability
of PVC resin can also be adversely influenced by other constituents (e.g. antistatic
agents, some colorants). The ease of stabilization and response to particular stabilizers
in particular conditions also vary with the above features.
Rate of dehydrochlorination can be evaluated by measuring the conductivity change
in the solution into which the evolved HCl gas is solved from the heated PVC polymer.
Electrical conduction is a transport phenomenon in which electrical charge (carried by
electrons or ions) moves through the system. The electric current I is defined as the rate
of flow of charge through the conducting material:
)/exp(0 RTEtt −∗= (2.5)
Page 24
8
dtdQI ≡
where dQ is the charge that passes through a cross section of the conductor in time
dt. The electric current density j is the electric current per unit cross-sectional area:
AIj ≡
where A is the conductor’s cross-sectional area. The SI unit of current is the ampere,
A and equals one coulomb per second.
SCA /11 =
The conductivity κ, of a substance is defined by
EjorEj κκ ==
where, E is the magnitude of the electric field. The higher the conductivity κ, the
greater the current density j that flows for a given applied electric field. The reciprocal
of the conductivity is the resistivity ρ:
κρ 1=
The resistivity is measured in Ω.m and the conductivity in m-1.Ω -1. The reciprocal
of Ω is Siemens (S). Hence conductivity is S.m-1.
1 Ω 1 V/A = 1 kgm² s-1 C-2
The current in an electrolyte solution is the sum of the currents carried by the
individual ions. The conductivity of the solution is
=i
iii cFuzκ
Where,
ui is the mobility of ion i (m2/V.s),
F is the Faraday’s constant (F = 96485 °C/mol),
zi= Total charge number,
ci. = Concentration of the solution (mol/m3).
The mobility of the ions is the sum of the mobility of cations and anions.
−−−+++ += cFuzcFuzκ
The mobility of H+ and Cl- in water at 25°C for HCl is as follows (Levine, 1995) ;
(2.6)
(2.7)
(2.8)
(2.9)
(2.10)
(2.11)
(2.12)
(2.13)
Page 25
9
uH+ = 36.2510-8 , m²/V.s
uCl- = 7.91310-8 , m²/V.s
uHCl = 44.16310-8 , m²/V.s
(2.14)
(2.15)
(2.16)
Page 26
10
CHAPTER 3
THERMAL STABILIZATION and STABILIZERS
3.1 Thermal Stabilization
PVC polymers and copolymers are susceptible to degradation by heat and light: in
both cases degradation is rapid and more severe in the presence of oxygen. Heat
stabilizers are incorporated in all PVC compositions to protect the polymer against
thermal degradation at high temperatures of processing and also subsequently in
service.
The main outward manifestations of thermal degradation of PVC (at temperatures
sensibly below those of pyrolytic decomposition and combustion, against which no
stabilization is possible) are the evolution of HCl, development of colour (from light
yellow, through reddish brown, to almost black in severe cases) and deterioration of
physical, chemical and electrical properties (Titow et.al., 1985).
3.2 Heat Stabilizers
All heat stabilizers and stabilizer systems in industrial use are of the “external” kind
in the application sense, in that they are additives incorporated in the PVC by physical
admixing. On the basis, the compounds used as heat stabilizers for PVC may be divided
into the following general groups:
I. Lead compounds;
II. Organotin compounds;
III. Compounds of other metals;
IV. Organic stabilizers.
Page 27
11
3.2.1 Lead Compounds
These are either lead salts or lead soaps (salts with stearic acid). The main advantage
of these old-established stabilizers is cost-effective good heat-stabilizing power, and
particular suitability for use in electrical insulation. However, they are not suitable for
clear compositions, where their toxicity presents a hazard, as, for example, in food-
contact applications (e.g. packaging films, containers), products for medical use, or
children’s toys (Titow et al., 1985). Some of the well known lead compounds are basic
lead carbonate, tribasic lead sulphate, dibasic lead phosphate, lead silicate and lead
stearate.
3.2.2 Organotin Compounds
Commercial organotin stabilizers are mainly compounds of the general formula
below on the left, but also the one on the right is used too.
The nomenclature is largely associated with the R groups. Because their stabilizing
effects in PVC are lower and their toxicity high, than those of compounds above, they
are normally regarded as undesirable by-products and the production processes run so
as to minimize their formation (Titow et.al., 1985).
3.2.3 Compounds of other metals
Apart from those of lead and tin, certain compounds are also of interest as stabilizers
for PVC: stearates and laureates of zinc, calcium, aluminium, barium, antimony,
lithium, magnesium, sodium, potassium and cadmium.
According to Frye-Horst mechanism, an esterification reaction takes place where the
chlorine atom is bonded to the molecule between PVC and fatty acid salt of metal ion
(M++).
Sn
A
A
R
R
Sn
AR
AA
Page 28
12
MX CH
Cl
CH
H
ClMX CH
C-H
X
H
2 + + ( 3.1 )
where X: Carboxylate anion.
Further combinations of two or three of these compounds are also used stabilizers.
Composite metal stabilizers are also widely used in solid (powder, flake), liquid, or
paste forms. More recently concentrates of some systems in PVC polymer have also
becoming important (Titow et.al., 1985).
3.2.4 Organic Stabilizers
The organic stabilizers are widely used because they are uniformly and intimately
dispersible in PVC compositions but some have limited compatibility with plasticizers,
or particular plasticizer/resin combinations in pPVC. To count some of them,
• Esters of aminocrotonic acid,
• Urea derivatives (phenyl urea, diphenyl urea),
• Epoxy compounds,
• Organic phosphates and
• Miscellaneous organic co-stabilizers (Titow et.al., 1985).
3.3 Flame Retardants
In order for a solid to burn it must be volatilized, because combustion is almost
exclusively a gas-phase phenomenon. In the case of a polymer, this means that
decomposition must occur. The decomposition produces low molecular weight
chemical compounds that eventually enter the gas phase. Heat from combustion causes
further decomposition and volatilization, and therefore combustion. For a compound to
function as a flame retardant it must interrupt this cycle in some way.
A compound or mixture of compounds that when added to or incorporated
chemically into a polymer serves to slow or hinder the ignition or growth of fire, the
foregoing effect occurring primarily in the vapour phase.
Page 29
13
Flame (or fire) retardant additives are most often used to improve fire performance
of low-to-moderate cost commodity polymers. These additives may be physically
blended with or chemically bonded to host polymer. They generally affect either low
ignition susceptibility or once ignited, lower flammability. Ignition resistance can be
improved solely from the thermal behaviour of the additive in the condensed phase.
Retardants such as alumina add to the heat capacity of the product, thus increasing the
enthalpy needed to bring the polymer to a temperature at which fracture of the chemical
bonds occurs. The endothermic volatilization of bound water can be a significant
component of the effectiveness of this family of retardants such as in zinc borates. Other
additives, such as organophosphates, change polymer decomposition chemistry. These
materials can induce the formation of a cross-linked, more stable solid and can also lead
to the formation of a surface char layer. This layer both insulates the product from
further thermal degradation and impedes the flow of potentially flammable
decomposition products from the interior of the product to the gas phase where
combustion would occur.
Flame retardants function in the vapour phase where the enthalpy-generating
combustion reactions occur. Halogen-containing species, for instance, can be selected to
vaporize at the same temperature as the polymer fragments. Coexisting in the reactive
area of the flame, the halogens are effective at decreasing the concentrations of the free
radicals that propagate flames, thus reducing the flame intensity, the enthalpy returned
to the product, and the burning rate, in that order. They can also be self-extinguishing
(Bowen, 1985; Jenkner et.al., 1982).
Compound of chlorine and bromine are the halogen compounds having commercial
significance as flame-retardant chemicals. Fluorine compounds are expensive except in
special cases. Iodine compounds although effective, are expensive and too unstable to
be used. Halogenated flame retardants can be broken down into three classes:
i. Brominated aliphatic,
ii. Chlorinated aliphatic, and
iii. Brominated aromatic which the thermal stability increases from
up to down.
Page 30
14
It is commonly thought that it is desirable for the flame retardant to decompose with
the liberation of halogen at a somewhat lower temperature than the decomposition
temperature of the polymer (Babrauskas, 1984 and 1987).
Useful materials incorporating fire-retardant additives are not always
straightforward to produce. Loadings of 10% are common, and far higher levels of
flame retardants are used in some formulations.
Nonetheless a large number of fire-retardant additives are possible.
I. Phosphate esters,
II. Halogenated phosphates,
III. Chlorinated hydrocarbons,
IV. Brominated hydrocarbons,
V. Brominated bisphenol-A
VI. Antimony trioxide,
VII. Borates,
VIII. Aluminium trihydrate,
IX. Magnesium hydroxide.
3.4 Fire Retardants for PVC
PVC is a hard, brittle polymer that is self-extinguishing. In order to make PVC
useful and more pliable, plasticizers are added. More often than not the plasticizers are
flammable and make the formulation less flame resistant. Flammability increases as the
plasticizer is increased and the relative amount of chlorine decreased. The flame
resistance of the poly (vinyl chloride) can be increased by the addition of an inorganic
flame retardant synergist.
I. Antimony oxide
II. Molybdenum oxide
III. Zinc stannates
IV. Aluminum trihydrate
V. Zinc borate
(Peacock et.al., 1991 in Kirk-Othmer, 1994).
Page 31
15
3.4.1. Antimony Oxide
The effect of antimony oxide and ZB on the oxygen index of flexible poly (vinyl
chloride) containing from 20 to 50 parts of plasticizer is shown in Figure 3.1.
Figure 3.1 A comparison of the effect of antimony oxide ( ) and ZB ( ---- ) on
the oxygen index of flexible PVC containing from 20 to 50 phr DOP
(Kirk-Othmer, 1994).
The flame resistance increases with the addition of antimony oxide until the oxygen
index appears to reach a maximum at about 8 parts of Sb2O3. Further addition does not
have any increased beneficial amount (Kirk-Othmer, 1994).
3.4.2. Molybdenum Oxide
Molybdenum compounds incorporated into flexible PVC not only increases flame
resistance, but also decrease smoke evolution. In Table 3.1, the effect of molybdenum
oxide on the oxygen index of flexible PVC containing 50 parts of a plasticizer is
compared with antimony oxide. Antimony oxide is superior synergist for flame
retardancy but has little or no effect on smoke evolution. However, combinations of
molybdenum oxide and antimony trioxide may be used to reduce the total inorganic
flame retardant additive package, and obtain improved flame resistance and reduce
smoke (Kirk-Othmer, 1994).
Page 32
16
Table 3.1 Effect of flame retardancy of molybdenum oxide and antimony oxide
(Kirk-Othmer, 1994).
Sb2O3 MbO3 Oxygen Index Smoke - - 24.5 10.7 2.0 - 27.5 9.2 - 2.0 26.0 6.8 2.0 2.0 29.5 6.0
3.4.3. Zinc Stannates
The zinc stannates are also effective synergists for flexible PVC; however, antimony
oxide is more effective. If more chlorine such as in chlorinated paraffin is added, the
stannates become more effective and outperform antimony oxide (Kirk-Othmer, 1994).
3.4.4 Aluminium Trihydrate
Aluminium trihydrate, Al2O33H2O, (ATH) is manufactured from either bauxite ore
or recovered aluminium by either the Bayer or sinter process. It is generally used as a
secondary flame retardant in flexible PVC because of the high concentration needed to
be effective.
It is the least expensive and least effective of the flame retarders. It is only about
one-fourth to one-half as effective as the halogens. Usually about 50 – 60% of
aluminium trihydrate is needed to obtain some acceptable degree of flame retardancy. It
is also limited to plastics processed higher than 220°C (Kirk-Othmer, 1994).
Page 33
17 17
CHAPTER 4
ZINC BORATE AND ZINC PHOSPHATE
4.1 Zinc Borate
The most widely used flame retardant is zinc borate [CAS No.1332-07-6], prepared
as an insoluble double salt from water-soluble zinc and boron compounds. Compounds
having varying amounts of zinc, boron, and water of hydration are available. The
general molecular formula of zinc borate is
OZHOYBXZnO 232 ••
And some examples for X, Y and Z are
X=4, Y=1, Z=1
X=2, Y=3, Z=3.5
X=2, Y=3, Z=7.5
X=2, Y=3, Z=5
X=2, Y=3, Z=7
The ratio of these components affects the temperature at which the flame-inhibiting
powers are activated, as well as the temperature at which they can be processed. Zinc
borates can either be used alone or in combination with other halogen synergists, such
as antimony trioxide. In some instances zinc borate is used with alumina trihydrate to
form a glass-like substance that inhibits polymer degradation.
Zinc borate is also effective in enhancing the flame-inhibiting powers of chlorine.
Although zinc borate increases flame resistance, it is not as effective as antimony oxide,
as is illustrated in the Figure 3.1.
However zinc borate can be used in combination with antimony oxide to obtain
equivalent and in some instances enhance effects over what can be obtained using either
of the two synergists alone (Kirk-Othmer, 1970).
Page 34
18 18
4.1.1 Production of ZB
In general, an aqueous solution was prepared by dissolving boric acid in pure water
in the stoichiometric amount which is compatible with the desired final zinc borate
crystal structure. Zinc oxide and boric acid are later added to this solution and stirred
and mixed together and kept on reacting at temperatures between 70 – 100°C. The
temperature and time values change according to the final desired structure also. The
obtained product is filtered, washed with water, dried at 105°C and ground.
For example, Zinc Borate 2ZnO3B2O37H2O is formed when borax is added to
aqueous solutions of soluble zinc salts at temperatures below about 70°C.
A different crystalline hydrate, 2ZnO3B2O33.5H2O, equivalent to
4ZnO6B2O37H2O, is produced when the reaction between zinc oxide and boric acid is
carried out at temperatures of 90 – 100°C. This compound has the unusual property of
retaining its water of hydration at temperatures up to 290°C. This thermal stability
makes it attractive as a fire retardant additive for plastics and rubbers that require high
processing temperatures. It is also used as an anticorrosive pigment in coatings. Some of
the ZB producers are tabulated in Table 4.1.
Individual particles of ZB are independent rhombic hexahedrons, the length of a
side of each particle lying in a range of 0.3 to 7 µm (Sawada H., 2002).
Fig.4.1 Scanning-type electron microphotograph (Mag.: x5000) of Zinc
Borate(Sawada H., 2002).
Page 35
19 19
4.1.2 Boron Mechanism
Boron functions as a flame retardant in both the condensed and vapour phases.
Under flaming conditions boron and halogens form the corresponding trihalide. Because
boron trihalides are effective Lewis acids, they promote cross-linking, minimizing
decomposition of the polymer into volatile flammable gases. These trihalides are also
volatile; thus they vaporize into the flame and release halogen which then functions as a
flame inhibitor (Shen et.al., 1990).
Borons also react with hydroxyl-containing polymers such as cellulose. When
exposed to a flame the boron and hydroxyl groups form a glassy ester that coats the
substrate and reduces the polymer degradation. A similar type of action has been
observed in the boron-alumina trihydrate system (Shen et.al., 1990; Hilado, 1974;
Byrne,et.al., 1966).
Table 4.1 Manufacturers and Trade Names of some ZB Flame Retardants (Kirk-
Othmer, 1994).
Manufacturer Trade
Name
Composition CAS No
ZB 467 4ZnO6B2O37H2O [12513-27-8] ZB 223 2ZnO3B2O33H2O ZB 113 ZnOB2O33H2O ZB 237 2ZnO3B2O37H2O
Climax Performance Materials
ZB 325 3ZnO2B2O35H2O
2ZnO3B2O35H2O [13701-59-2] U.S.Borax Firebrake ZB
Zn(BO2)2
Hebei Hongxing Chemicals Co. 2ZnO3B2O33.5H2O [12513-27-8]
Waardals 2ZnO3B2O33.5H2O [12351-27-8]
Heron Chemicals Storflam 2ZnO3B2O33.5H2O [12513-27-8]
Page 36
20 20
4.1.3 Flame Retardant Effect of ZB
Ning and Guo [2000] have studied the effects of zinc borate and aluminium
trihydrate (ATH) and their mixtures on the flame retardant and smoke suppressant
properties of PVC as well as their mechanism for flame retardancy and smoke
suppression through LOI, smoke density test, TGA, GC-MS, and SEM. They have
found that small amounts of ZB, ATH and their mixture can greatly increase the LOI of
PVC and reduce the smoke density, hazardous gases released and char formation of
PVC. The mixture of ZB and ATH had a good synergistic effect on the flame
retardancy and smoke suppression of PVC. TGA and GC – MS results showed that
incorporation of a small amount of ZB, ATH, and their mixture greatly promoted the
char formation of PVC and decreased the amount of hazardous gases such as benzene
and toluene released in PVC during combustion. Their mechanism was also proposed.
As shown in the Figure 4.2 a and b, the LOI of PVC increased and smoke density
decreased with increase of the amount of ZB, ATH and ZB – ATH. The LOI of
PVC/ZB – ATH is much higher than that of PVC/ZB and PVC/ATH. The smoke
density of PVC/ZB – ATH is much lower than that of PVC/ZB and PVC/ATH, which
indicated that ZB and ATH have a good synergistic effect on the flame retardancy and
smoke density of PVC.
Page 37
21 21
(a)
(b)
Figure 4.2 a) Effects of ATH (1), ZB (2) and ZB – ATH (3) contents on LOI of
PVC.
b) Effects of ATH (1), ZB (2), and ZB – ATH (3) contents of smoke
density of PVC (Ning and Guo, 2000).
As shown in Figure 4.3 (a) and (b), the thermal decomposition of PVC was divided
into two stages: The thermal decomposition in the first stage was mainly the evolution
of HCl. The thermal decomposition in the second stage was mainly cyclization of
conjugated polyene sequences to form aromatic compounds. The incorporation of small
amount of ZB and ZB – ATH greatly decreased the weight loss of the PVC thermal
Page 38
22 22
decomposition. The char residue of PVC increased about 130% after incorporation of 5
pph of ZB and ZB – ATH, respectively, also indicating that ZB and ZB – ATH are good
smoke suppressants for PVC.
PVC, PVC/ZB, PVC/ATH, and PVC/ZB – ATH samples were burned in air in a
spirit lamp and the char residue calculated (Fig.4.3). The char residue increased as the
contents of ZB, ATH and ZB – ATH increased.
(a)
(b)
Figure 4.3 a) TGA curves of PVC and PVC/ZB – ATH,
b) Effects of ATH (1), ZB (2), and ZB – ATH (3)contents on char
residue of PVC (Ning and Guo, 2000).
Page 39
23 23
Mechanochemical modification of ZB and ATH in PVC by high-energy
mechanical milling and their mechanical properties were studied by Pi et.al. (2002). The
effect of mechanochemical improvement of these additives on the release of aromatic
compounds during burning of PVC was characterized by ultraviolet spectroscopy (UV),
Gas chromatography mass spectrometry (GC-MS), Limiting oxygen index (LOI),
stress-strain behaviour, and SEM. The chemical bonding of PVC with ZB or ZB – ATH
was generated during mechanical milling. The incorporation of ZB and ATH can
greatly increased the LOI of PVC and suppressed the release of aromatic compounds
during burning of PVC. The mechanochemical modification increased the impact and
yield strengths and elongation at break of PVC/ZB and ATH and also increased the
LOI.
As shown in Figure 4.4, the LOI of PVC/ZB and PVC/ZB – ATH went up with
increasing ZB and ZB – ATH content. The LOI of PVC/ZB-2 and PVC/ZB – ATH-2,
treated, was much higher than that of corresponding PVC/ZB-1 and PVC/ZB – ATH-1,
untreated due to the decrease in the particle sizes, the increase in surface areas and the
chemically bonding between PVC and ZB or ZB – ATH.
Figure 4.4 Effects of ZB and ZB – ATH content on the LOI of PVC (Ning and
Guo, 2002) 1 : Untreated, 2 : Treated.
As shown in Figure 4.5, the impact strength of PVC/ZB – ATH-1 almost remained
unchanged with increasing ZB – ATH-1 content, whereas the impact strength of
Page 40
24 24
PVC/ZB – ATH-2 increased with rising ZB – ATH-2 content, and the impact strength
of PVC/ZB – ATH-2 was higher than that of PVC/ZB – ATH-1.
Figure 4.5 Effects of the ZB and ZB – ATH content on the impact strength of PVC
(Ning and Guo, 2002) 1 : Untreated, 2 : Treated.
Figure 4.6 shows that the yield strength of PVC decreased with increasing ZB and
ZB – ATH content but the treated ones have higher yield strength.
Figure 4.6 Effects of ZB and ZB – ATH content on the yield strength of PVC (Ning
and Guo, 2002) 1 : Untreated, 2 : Treated.
Page 41
25 25
Giudice and Benitez, [2001] discussed the influence of ZB having 3.5 H2O and 7.5
H2O. Eight different paint compositions were prepared. LOI, and flame spread index
(FSI) tests were carried out to test the flame retardancy. As shown in Figure 4.7, results
of LOI tests indicate that the compositions having both ZB’s (No.5) and having only 7.5
H2O (No.3) with antimony trioxide have the maximum values. All sample compositions
are given in Table 4.2.
Table 4.2. Composition of flame-retardant coatings, % by volume on solidsa (Guidice and Benitez, 2001).
Component 1 2 3 4 5 6 7 8
Titanium dioxide 11.5 11.5 11.5 11.5 11.5 11.5 11.5 11.5 Antimony trioxide 9.0 6.0 6.0 6.0 3.0 - - - Zinc borateb - 3.0 - 1.5 3.0 4.5 9.0 - Zinc boratec - - 3.0 1.5 3.0 4.5 - 9.0 Micronized talc 22.4 22.4 22.4 22.4 22.4 22.4 22.4 22.4 Chlorinated alkyd resin 52.4 52.4 52.4 52.4 52.4 52.4 52.4 52.4 Bentone (gel) 2.8 2.8 2.8 2.8 2.8 2.8 2.8 2.8 Additives 1.9 1.9 1.9 1.9 1.9 1.9 1.9 1.9
a PVC (pigment volume concentration), 42.9% b 2ZnO3B2O33.5H2O, c 2ZnO3B2O37.5H2O, d 24.9% chlorine content.
Samples No.6 – 8 had the lowest LOI values with no antimony trioxide in their
compositions.
0
10
20
30
40
50
60
No.1 No.2 No.3 No.4 No.5 No.6 No.7 No.8
LOI Values, %
Figure 4.7 LOI Values (%) of the compositions(Guidice and Benitez, 2001).
The UL94 tests carried out also have shown that all of the compositions passed the
tests in Class A.
Page 42
26 26
Xie et.al., [2000] have studied the flammability characterization and the flame
retarding mechanism of expandable graphite (EG) combined with other halogen-free
flame retardants (HFFR) such as phosphorus-nitrogen compound, ammonium
polyphosphate, red phosphorus and zinc borate, in polyolefins (PO) blends, in which the
intumescent charred layers, as good heat-insulation materials, played a crucial role in
increasing the thermo-oxidative temperature and decreasing the thermo-oxidation heat.
Thus they have traced dynamic thermo-oxidative degradation of various
LLDPE/EG/HFFR systems by real time Fourier transform infrared spectroscopy.
Figure 4.8 (a) and (b) show the dynamic FTIR spectra from the thermo-oxidative
degradation of LLDPE/EG/ZB blends at 300 and 400°C, respectively. The small peak at
3227 cm-1 and several peaks between 900 and 1300 cm-1 are characteristics of zinc
borate additive. It can be seen from Fig.4.8 that the decreases of main peak intensities at
2916, 2854, 1610, 1455 and 720 cm-1 with increasing Thermo-oxidative Degradation
(TOD) times indicate the breakdown of LLDPE main chains. It can be noticed that the
intensities of several peaks between 900 and 1300 cm-1 decrease slowly with increasing
TOD times. This might be due to the dehydration or breakdown of ZB on heating in the
temperature range of 300 – 400 °C and the formation of boric acid to promote the
formation of surface expanded carbonaceous char structures between flame and
polyolefins in the condition of fire.
(a) (b)
Fig.4.8 Changes of dynamic FTIR spectra obtained from the thermo-oxidative
degradation of LLDPE/10% EG/20% ZB blends in the condensed phase
with different pyrolysis times. (a): 300°C, (b): 400°C (Xie et.al.,2000).
Page 43
27 27
In a US.Patent taken by Linsky, [1999] several flame retardant compositions for
cable jacketing and wire insulation that contain ATH and ZB were studied. The
compositions were tested according to oxygen index, smoke density, elongation stress,
brittle point and tensile strength. The composition was prepared according to the
compositions shown in Table 4.3.
This composition exhibited an oxygen index of 49 which was very high and smoke
char test of 1.8% which was very low. Elongation, brittle point, tensile strength tests
gave values of 225%, 0°C and 2515 lbs/in², respectively.
In a US.Patent taken by Chaplin, [1994] relates to fire-retardant compositions. ZB
and divalent metallic stannate, zinc stannate (ZS), in halogen containing compositions
provides an increased fire-retardant effect, which is greater than that expected from the
use of either ZB or ZS alone. The combination also suppresses smoke production.
In order to test the fire-retardant characteristics of the compositions having 10 parts
per hundered (phr) of fire-retardant totally, each sample was flame tested and
Concentration of Oxygen Index (COI) amounts of smoke and carbon monoxide (CO)
measured. The studied compositions are tabulated in Table 4.4 and the results in Table
4.5.
The results presented in Table 4.5 show that better fire-retardant properties were
obtained from the samples containing both ZB and ZS than would have been used
individually. As well as resulting in a synergistic fire-retardant effect, the study also
showed that the use of a decreased amount of ZB and ZS relative to the amount used
when either component was used on its own was possible.
Page 44
28 28
Table 4.3 The Composition in US.Patent by Linsky [1999].
Ingredient Amount, phr
PVC resin 100
Pentaerythritol ester plasticizer 33
Calcined clay 5
Aluminium trihydrate 70
Basic lead heat stabilizer 6
Stearic acid lubricant 0.25
Antimony trioxide 5
Brominated phthalate ester 10
Isodecyl diphenyl phosphate 5
Ammonium octamolybdate 10
Zinc borate 2
Table 4.4 The compositions of US.Patent by Chaplin [1994].
Amounts in phr Component Product Name Manufacturer
100 PVC VY 110/51 Hydro Polymer
50 DOP Reomol Ciba Geigy
4 Stabiliser Irgastab BC26 Ciba Geigy
0.7 Wax Irgawax Ciba Geigy
Table 4.5 The results of US.Patent by Chaplin [1994].
Sample ZB, phr ZS, phr COI Smoke, Dm CO, ppm
1 10 - 24.7 386 548
2 8 2 26.3 374 661
3 6 4 26.6 365 720
4 4 6 28.3 378 780
5 2 8 28.5 355 820
6 - 10 28.8 391 857
Page 45
29 29
4.2 Zinc Phosphate
The most important phosphate containing anticorrosive pigment is zinc phosphate
[CAS No.7779-90-0], Zn3(PO4)2, MW = 385. It can be used with a large number of
binders and has a very wide range of uses. Zinc phosphate is usually produced on an
industrial scale from zinc oxide and phosphoric acid, or from zinc salts and phosphates.
4.2.1 Synergism in Nickel Oxide and Zinc Phosphate
Dickens, [1976] calculated the smoke density of smoke retardant PVC
compositions of Ni and Zinc salts in US.Patent No 3,965,068; such as Nickel oxide and
Nickel carbonate with Zinc Phosphate(ZP) and Zinc Sulphate and the results were
evaluated according to their smoke formation during burning in NBS Smoke Chamber.
It has been clearly stated out that the compositions with NiO and ZP has reduced the
smoke generation. As shown in Table 4.6, NiO – ZP synergistically produced lower
maximum rate of smoke generation, maximum smoke density and smoke reduction
when compared with only NiO and ZP.
Table 4.6 Test results and compositions of US.Patent No.3,965,068 (Dickens,
1976).
NiO, phr
Zn3(PO4)2, phr
Maximum Rate of Smoke
Generation, min-1
Maximum Smoke Density per gram
sample, Dm/g
Smoke Reduction,
% - - 428 54.2 -
2 - 285 50.7 6.5
- 2 240 24.7 54.4
1 1 132 21.4 60.5
5 - 198 43.0 20.7
- 5 228 27.7 48.9
4 1 124 15.9 70.7
5 - 247 48.9 28.7
Page 46
30 30
4.2.2 IR Spectroscopic Study of Phosphate Minerals
Frost, [2003] studied the characterization of natural zinc phosphates including
hopeite and parahopeite (Zn3(PO4)24H2O), spencerite (Zn2PO4(OH)1.5H2O), tarbuttite
(Zn2PO4OH), scholzite (CaZn2(PO4)23H2O) and paraschozite (CaZn2(PO4)22H2O) by
the use of Raman and infrared spectroscopy. Zinc phosphates are important in the study
of the phosphatisation of metals. Raman spectroscopy in combination with infrared
spectroscopy has been used to characterise the zinc phosphate minerals. The minerals
may be characterised by the patterns of the hydroxyl stretching vibrations in both the
Raman and infrared spectra. Each mineral is identified by its own characteristic Raman
spectrum. The use of Raman spectroscopy has serious implications for the study of zinc
phosphate coatings, secondary mineral formation involving zinc phosphates and the use
of zinc phosphates in dental applications.
For hopeite, four infrared bands are observed at 3542, 3473, 3338 and 3149 cm-1. In
a previous study by Pawling et.al [2001], reported infrared bands at 3537, 3410, 3263
and 3181 cm-1.
The crystal structure of parahopeite is Zn3(PO4)24H2O and four bands are observed
in the infrared spectrum of parahopeite at 3451, 3311, 3143 and 3043 cm-1 as shown in
Fig.4.9. It is depicted that there are two non-equivalent water molecules in the unit cell
of parahopeite. These water OH stretching vibrations will show in-phase and out-of-
phase behaviour resulting in the prediction of four bands in infrared spectrum.
Page 47
31 31
Figure.4.9. Infrared spectroscopic results for parahopeite (Frost, 2003).
Spencerite differs from hopeite and parahopeite in that phosphate has been replace
by OH units. A similar structure exists for spencerite as for parahopeite. Spencerite has
one hydroxyl unit and consequently the higher wave number band at 3520 cm-1 in the
infrared spectrum is assigned to the symmetric stretching vibration.
The infrared spectrum of the hydroxyl stretching region of tarbuttite shows single
intense band at 3428 cm-1 with a tail extending to lower wave numbers.
Scholzites have apparent stacking disorders. Thus, several polytypes can exist and
one of these is paraschozite. It is no doubt caused by variation in the moles of water of
crystallization. Three bands were observed in the infrared spectrum of the hydroxyl
stretching region at 3425, 3310 and 3204 cm-1. The Raman spectrum of scholzite in the
hydroxyl stretching region shows four bands at 3437, 3343, 3283 and 3185 cm-1 and
three bands of infrared spectrum at 3425, 3310 and 3204 cm-1.
In the infrared spectra component bands are curve resolved at 1137, 1096, 1059,
1019 and 995 cm-1 for the PO4 stretching vibrations of hopeite.
Page 48
32 32
The infrared spectrum of parahopeite shows two bands of PO4 stretching vibrations
at 951 and 919 cm-1.
In the infrared spectrum of spencerite there are two bands of PO4 stretching
vibrations at 940 (ν1), 1048, 1010 and 987 cm-1 (ν3). An infrared band is observed at
842 cm-1 and may be attributed to water liberation mode.
The infrared spectrum of tarbuttite shows two bands at 954 and 902 cm-1 and also at
1088, 1056 and 990 cm-1.
The pattern of the infrared spectrum of scholzite shows a complex profile of
overlapping bands. The infrared spectrum shows bands at 1107, 1047 and 999 cm-1
assigned to ν3 PO4 antisymmetric stretching modes and at 956 and 929 cm-1 assigned to
ν1 PO4 symmetric stretching modes.
Page 49
33 33 33
CHAPTER 5
EXPERIMENTAL
5.1 Materials Used
The PVC used was PVC – Petvinil P.38/74 (Emulsion type PVC) from Petkim –
Aliaa, zmir. The Dioctyl Phthalate (DOP) used as plasticizer throughout the
experiments was from Merck with a molecular formula as C24H38O4 and MW = 390.54
with a purity of 98% min. and a density of 0.98 g/ml. Its molecular structure is given in
Figure 5.1.
Fig.5.1 Dioctyl Phthalate Molecule
Viscobyk 5025 (carboxylic acid derivative) was used obtained from BYK Chemie
as a wetting agent. The technical specs of Viscobyk 5025 is given in Table 5.1.
Table 5.1 The general product specifications of Viscobyk 5025
Density at 20°C, g/ml 0,88
Refractive Index 1,452
Flash Point, °C 170
Solidification Point, °C -15
The zinc borate used was STORFLAM ZB 2335[CAS No.1332-07-6] having the
molecular formula of 2ZnO3B2O33.5H2O from Heron Chemicals. The specification of
the zinc borate has given in Table 5.2.
O
O
O
O
Page 50
34 34 34
The zinc phosphate pigment used was ZP – 46 from Pigment Sanayi A..,
Kemalpaa – zmir. The general formula of the zinc phosphate [CAS No.7779-90-0],
was Zn3(PO4)2, MW = 385. The specification of zinc phosphate used has given in Table
5.3.
Table 5.2. The general product specifications of STORFLAM ZB 2335
Appearance White amorphous powder
ZnO Content, % min. 37.0
B2O3 Content, % min. 47.0
Water of Crystallisation, % min 16.0
Volatile Loss 1 hour at 105°C, % max. 1.5
Bulk Density, g/cm³ 0.3 – 0.5
pH on Filtrate of 20% aqueous solution 7.0 – 8.0
Sieve Residue (200 mesh – 75 micron), % max. 0.2
Ignition Loss at 950°C, % max. 15.5
Table 5.3. The general product specifications of ZP – 46.
Specific Gravity 3.3
Bulk Density, g/cm³ 0.3
Tamped Appearent Density, kg/cm³ 0.5
Oil Absorption, g/100g 40
pH 7.0
Moisture and Volatile Matter at 105°C, % max 1.0
44µm Sieve Residue, % max. 0.5
Matter Soluble in Water, % max. 0.5
Page 51
35 35 35
5.2 Methods
5.2.1 Film Preparation
Dioctyl phthalate (DOP) plasticizer in 80 parts per hundred (phr) (43.2 wt %) was
mixed by every 100 phr (54.1 wt%) PVC thoroughly with the addition of 5 phr (2.7 wt
%) of wetting agent Viscobyk 5025 in a mechanical mixer (IKA Labortechnik) at room
temperature for 30 minutes to prepare the PVC resin or plastisols to be used all through
the experiment. At room temperature the plastisols have little or no solvating effect on
the resins. The dissolving action of the plastisols progresses due to the temperature
increase (Titow et.al., 1985).
Samples were prepared by adding zinc borate and zinc phosphate in proposed
compositions weighed in a balance. The referred compositions are given in Table 5.4.
They were then mixed thoroughly by a glass rod until obtaining completely uniform
mixture by the PVC particles in DOP. Subsequent to the mixing, the resulting
compositions were then poured onto gloss cardboard papers which were then passed
through a film applicator (Sheen 113N) which is capable of sheeting them into forms of
thin, self-supporting films. The blade of film applicator used has a thickness of 90 µm
being optimum for almost all purposes. At an intermediate temperature enough
solvation occurs for the plastisols to solidify or to gel (Titow et.al., 1985). Therefore the
filmed samples were heated in a vacuum oven (EV 018 by Nüve) at 140°C ± 3°C for 15
minutes. As the temperature increases, solvation continues until the mass becomes more
or less homogeneous. The physical properties depend greatly upon the composition of
plastisols.
The compositions used in this thesis are given in Table 5.4.
Fig.5.2 Blade of Film Applicator and Film Applicator.
Page 52
36 36 36
Table 5.4. The compositions used in the experiments (Values in phr) (wt/wt).
Sample No. PVC DOP Viscobyk 5025 ZB ZP
No.1 100 80 5 - -
No.2 100 80 5 - 2.5
No.3 100 80 5 0.5 2.0
No.4 100 80 5 1.0 1.5
No.5 100 80 5 1.25 1.25
No.6 100 80 5 1.5 1.0
No.7 100 80 5 2.0 0.5
No.8 100 80 5 2.5 -
5.2.2 Film Characterization
Films were characterized by using Scanning Electron Microscope (SEM) and
Energy Dispersive X-Ray (EDX).
5.2.2.1 Scanning Electron Microscope, SEM
Microstructural characterization of the filmed samples was done by X-Ray energy
spectrometer (the XL-305 FEG SEM instrument by Philips).
The films of eight different compositions heated at 160°C for 90 minutes and at
140°C for 15 minutes were tested with this instrument to see the effects of heated and
unheated samples. At least three different microphotographs were taken at different
magnifications; 150x, 250x and 350x.
5.2.2.2 Energy Dispersive X-Ray, EDX
The filmed samples were characterized by an Energy Dispersive X-ray (EDX)
instrument (the XL-305 FEG SEM instrument by Philips) to investigate the effect of
heating temperature and heating time on the microstructural properties of the samples.
The samples were heated at 140°C for 15 minutes and at 160°C for 90 minutes. The
films heated (at 160°C for 90 minutes) and unheated (at 140°C for 15 minutes) were
examined and compared with this instrument. Either two or three points from particles
Page 53
37 37 37
and polymer phases were chosen and investigated from the cross section areas of PVC
films and finally average values were obtained.
5.2.3 Thermal Stability Tests
The thermal stability tests were carried out to investigate the heating effects on the
thermal stability of the films. To establish these tests, static oven test, PVC Thermomat
tests and Thermogravimetric (TGA) tests were done.
5.2.3.1 Static Oven Tests
To investigate the effects of heating at high temperatures, each film was first of all
heated at 140°C and then at 160°C up to 90 minutes in a vacuum oven (EV 018 by
Nüve) and six samples were taken at 15 minute intervals from the samples to establish
further tests of TGA, PVC Thermomat, FT-IR and colour tests.
The static oven tests were performed in a vacuum oven. The films were cut into 6
pieces of 5 x 1 cm. and properly labelled as 15 min., 30 min., 45 min., 60 min., 75 min.
and 90 min placed onto a glass plate. These films were placed in the oven and heated at
140°C and 160°C for 90 minutes. At the end of the proposed time, each sample was
taken out of the oven for further tests of physical deterioration and colour change. The
colour tests were evaluated both visually and by a spectrophotometer. The heated
samples were also examined by a FT-IR, TGA, PVC Thermomat, SEM, and EDX.
5.2.3.2 PVC Thermomat
The heated samples both at 140°C and at 160°C were examined in the PVC
Thermomat instrument (763 PVC Thermomat, Metrohm) to propose a general
mechanism of PVC degradation at high temperatures. A general view of PVC
Thermomat is shown in Fig.5.3 below.
Fig.5.3. PVC Thermomat Instrument.
Page 54
38 38 38
The 763 PVC Thermomat is a PC-controlled instrument used to study the
degradation kinetics of PVC. PVC Thermomat is equipped with two heating blocks
each with four measuring positions. Two sets of four samples can be heated and
measured at two different temperatures at each block individually or namely, eight
samples can be measured at the same temperature which can be seen in Figure 5.4
below.
Figure 5.4 Top view of PVC Thermomat instrument 1: Measuring cells at 25°C,
2:Sample cells (heated cells).
The evaluation algorithm of program determines the point of induction and
stability time where induction time is the time elapsed before the conductivity starts to
rise sharply and stability time is the time required to achieve a given conductivity
alteration (In this thesis 50 µS is used).
The determination of thermal stability of PVC is based on the fact that PVC
decomposes at higher temperatures with the release of HCl. The HCl formed is taken up
by N2 gas stream and transferred into the measuring vessel where it is absorbed in the
distilled water. The decomposition process is monitored by measuring the conductivity
of the aqueous HCl solution. Both the stability and the induction time are determined.
Hence the PVC decomposition mechanism is proposed.
The samples were cut into small squares of 5 mm. and having a weight of 0.5 g ±
0.01 and later they were put into the sample cells of the instrument. Into measuring
1 2
1 2
1 2
1 2
1 2
1 2
1 2
1 2
N2
Page 55
39 39 39
cells, distilled water was put at 25°C to be able to measure the conductivity change of
water. The sample cells were heated at 140°C and 160°C. The instrument kept on
running until all of the samples have reached their stability and induction times.
The measuring blocks of this instrument can be viewed in Fig. 5.5
Fig.5.5. The measuring blocks of 763 PVC Thermomat instrument.
5.2.3.3. Thermogravimetric Analyses (TGA)
To learn the thermal behaviour of the films, TGA instrument was also used. PVC
films gelled at 140°C for 15 minutes were tested in this instrument (Instrument Setaram
Labsys) under N2 atmosphere at a heating rate of 10°C per minute. The graphs of mass
loss versus temperature were obtained to determine the char residue and the heat
stability. The tests were carried out up to 600°C.
Heating block
Samples
N2 N2 + HCl
Deionized Water
Measuring Cell
Computer
Conductimeter
Page 56
40 40 40
5.2.4 Fourier Transform Infrared Analyses by Transmission
To determine which functional groups are present in the films, FT – IR instrument
(the FT-IR 8601 by Shimadzou) was used. The heated and unheated films prepared
previously were tested in this instrument. The resultant FT – IR spectra were used to
determine the atomic and atomic – atomic structures. From this point, one can
determine the effects of heating at high temperature on the films. KBr disc technique
was used for ZB and ZP.
5.2.5 Fourier Transform Infrared Analyses by ATR method
FTS 3000 MX by Digilab was used to determine the functional groups at the
surface of the PVC films. Transmission IR spectrum of films gives ideas about bulk of
the PVC films, but ATR spectrum gives information about the surface of the films
therefore ATR attachment was used for this purpose.
5.2.6 Colour Measurement
Both the heated and unheated films were investigated by a colour
spectrophotometer instrument (Spectrocam, Avantes) to find out their yellowness index
values. The yellowness index is a measure to have an idea on the physical deterioration
of the heated films when comparing with the unheated ones. The change in colour due
to high temperature will be differentiating point in this test. During the calculation of
yellowness index, the tristimulus values according to illuminant C and 2° observer are
used as a standard according to the formula in Eqn.5.1.
( )Y
ZXYI
106128 −=
where X, Y and Z are tristimulus values according to 2° observer and C illuminant.
Another way of measuring the colour differences between two films is calculating
∆E value of which its formula is given as;
( ) ( ) ( )212
212
212 bbaaLLE −+−+−=∆
where L is the lightness value, a is the value of green – red and b is the value of
blue – yellow scales. This is a scale formed in 3-D sphere system. These values are also
calculated from the X, Y and Z tristimulus values.
(5.1)
(5.2)
Page 57
41
CHAPTER 6
RESULTS AND DISCUSSION
6.1 Characterization of Zinc Borate and Zinc Phosphate
The Thermogravimetric analyses curves of ZB and ZP in powder forms are
investigated in Fig.6.1 and Fig.6.2, respectively.
8,80
9,00
9,20
9,40
9,60
9,80
10,00
10,20
10,40
0 100 200 300 400 500 600 700
Temperature, °C
Mas
s L
oss,
mg
Figure 6.1 TGA curve of ZB powder.
Page 58
42
0,0
2,0
4,0
6,0
8,0
10,0
0 100 200 300 400 500 600 700
Temperature, °C
Mas
s Los
s, m
g
Figure 6.2 TGA curve of ZP powder.
It can be concluded that ZB starts to loose its crystal water at around 315 – 320°C.
When the TGA curve of ZP is analyzed, it is clear that it does not loose much of its
mass.
FTIR spectra of ZB and ZP in powder forms are given in Figures 6.3 and 6.4,
respectively. The peak at 3227 cm-1 in Fig.6.3 belongs to ZnO•B2O3. Also there are
several peaks between 900 and 1300 cm-1 which are characteristics of ZB (Xie et.al,
2000). There is also OH stretching at 3200 cm-1.The peaks belonging to ZP are also
clear in Fig.6.4; the peaks observed at 1080 and 890 cm-1 are the P-O symmetric
and asymmetric vibration in P-O-P chains; respectively. There is also OH stretching
and water bending at 3200 and 1600 cm-1. These are consistent with a previous
study by Xie et.al, 2000.
Page 59
43
500.0750.01000.01250.01500.01750.02000.02500.03000.03500.04000.04500.01/cm
0.5
1.0
1.5
2.0
Abs
Fig.6.3 FT-IR spectra of ZB powder sample.
500.0750.01000.01250.01500.01750.02000.02500.03000.03500.04000.04500.01/cm
0.5
1.0
1.5
2.0
Abs
Fig.6.4 FT-IR spectra of ZP powder sample.
Scanning electron micrographs of the ZB and ZP were also taken and they are
given in Figure 6.5. The average particle sizes of ZB and ZP were 3 µm and 5 µm,
respectively.
Page 60
44
a.
b.
c.
d.
Figure 6.5 The Scanning electron micrographs of the ZB and ZP powders
a.) ZB, 10000x magnified. b.) ZB, 3500x magnified.
c.) ZP, 3500x magnified. d.) ZP, 1000x magnified.
The EDX analyses of the powder samples are tabulated in Table 6.1. The EDX
analyses indicated molar Zn/B ratio was 0.34 for ZB which was very close to
0.33of 2ZnO•3B2O3. Similarly, molar Zn/P ratio was found to be 1.86 which was
close to 1.5 of Zn3(PO4)2.
Table 6.1 Elemental composition of the ZB and ZP powder.
Elements ZB-2335 ZP-46 Zn 33.2 53.1 O 50.4 31.1 P - 15.9 B 16.4 -
Page 61
45
6.2 Kinetic Study of Dehydrochlorination of PVC Plastigels
In these tests, kinetic parameters such as activation energies, rates and rate
constants and frequencies of the plastigels were evaluated in PVC Thermomat. Chopped
films were put into the test tubes of Thermomat. On the other side, deionized water
poured into test tubes was used to record the conductivity change. The HCl gas evolved
from the heated samples were carried out by N2 gas stream into the tubes filled with
deionized water. In the tubes filled with deionized water, the conductivity change was
recorded with respect to time according to the HCl gas evolved. This test was carried
out at both 140°C and at 160°C for every composition prepared.
6.2.1 Kinetic Theory of degradation of PVC Plastigels
The slopes ( α ) of the curves showing the conductivity ( κ ) changes with respect
to time ( t ) were used to calculate the reaction rate constants and reaction rates ( 6.1 ).
From these figures the induction and stability time values were also obtained.
dtdκα =
The current in an electrolyte solution is the sum of the currents carried by the
individual ions. The conductivity of the solution is
=i
iii cFuzκ
where
κ is the conductivity
ui is the mobility of ion i (m2/V.s),
F is the Faraday’s constant (F = 96485 °C/mol),
zi= Total charge number,
ci. = Concentration of the solution (mol/m3),
The mobility of the ions is the sum of the mobility of cations and anions.
(6.2)
(6.1)
Page 62
46
−−−+++ += cFuzcFuzκ
Hence, if the Equation 6.2 is derivated with respect to time, rate of
dehydrochlorination of PVC can be calculated with respect to time.
( )
== i
iii CFuzdtd
dtd
slope κ (6.4)
The rate of dehydrochlorination of PVC is dependent on the concentration of
unreacted HCl present in the PVC.
Rate of dehydrochlorination can be written as follows
( )HClHCl CCk
dtdC
−= 0
where dCHCl/dt is the rate of dehydrochlorination (µmol/g PVCs),
k is the reaction rate constant (s-1),
Co is potential double bonds to be formed when 100% of HCl is eliminated per 1 g
of PVC (µmol/g PVC),
CHCl is the concentration of evolved HCl (µmol/g PVC).
C0 = 16.5x10³ µmol/g PVC (Atakul, 2004).
At initial stage of dehydrochlorination CHCl <<< C0, we can assume that C0 – CHCl =
16.5x10³ µmol/g PVC.
Then the Equation 6.4 becomes as follows,
( ) 0kCCdtd
HCl =
The rate of dehydrochlorination can be calculated from the slopes of the
conductivity change versus time graphs.
(6.3)
(6.5)
(6.6)
Page 63
47
HClwHCl
i Udt
dCZF
dtd
... ,Σ=κ
where;
CHCl,w is the concentration of HCl in water.
Assumption; all HCl evolved from PVC was absorbed by water.
dt
dnV
dt
dCHCl
wwHCl =.,
nHCl =Moles of evolved HCl gas.
Vw= Volume of water in measuring vessel
Vw= 6x10⁻⁵ m3
CFmdtdn
dtdC HClHCl
.1
.=
m=Mass of plastisol in reaction vessel
CF= Correction factor which is fraction of PVC in PVC plastisol
o
HCl
o
HCl
CCFmdtdn
CdtdC
k1
..1
.1
. ==
(Atakul, 2004).
The dehydrochlorination curves can be separated into two parts; initial region and
linear region. Therefore, two rate constants can be evaluated for each reaction. Initial
rate constants are obtained from the slopes of initial region of the curves where the
release of HCl gas started to release; whereas linear region rate constant are obtained
from the slopes of linear region where the release of HCl gas accelerates.
In this study, two temperatures were used to evaluate the kinetic parameters; 140°C
and 160°C.
(6.7)
(6.8)
(6.9)
(6.10)
Page 64
48
6.2.2 Kinetic Study of PVC plastigel films
The PVC plastigel films containing zinc borate and zinc phosphate were studied in
PVC Thermomat instrument to calculate the reaction rates and reaction rate constants at
140°C and at 160°C. A representative PVC Thermomat curve is given in Figure 6.6. As
it is seen in the figure, the time value where the conductivity begins to increase is the
visual induction time, the time at the intersection between the tangent line of linear
region and the x-axis is the evaluated induction time, the time value at the 50µS
conductivity is the stability time.
Figure 6.6 A representative curve for PVC Thermomat results.
The conductivity versus time curves of one run are represented for 140°C and
160°C, in Fig.6.7 and Fig.6.8; respectively. The calculated average rate constants and
rates as well as induction and stability time are shown in Table 6.2 and 6.3.
Induction Time
Stability Time
50 µS/cm
Conductivity, µS/cm²
Time, h
Page 65
49
0
20
40
60
80
100
120
140
160
0 1 2 3 4 5 6 7 8 9 10
Time, h
Con
duct
ivity
, µ µ µ µS/
cm
(All values below are wt%).
PVC Control, 1.36 % ZB, 1.36% ZP,
0.68%ZB+ 0.68% ZP, 0.54% ZB+ 0.81% ZP,
0.81% ZB + 0.54% ZP, 0.27% ZB + 1.29% ZP,
1.29% ZB + 0.27% ZP, 50 µS/cm Stability Time Limit.
Figure.6.7. PVC Thermomat Results of PVC films heated at 140°C.
Page 66
50
0
20
40
60
80
100
120
140
160
180
200
0 1 2 3
Time, h
Con
duct
ivity
, µµ µµS/
cm
(All values below are wt%).
PVC Control, 1.36 % ZB, 1.36% ZP,
0.68%ZB+ 0.68% ZP, 0.54% ZB+ 0.81% ZP,
0.81% ZB + 0.54% ZP, 0.27% ZB + 1.29% ZP,
1.29% ZB + 0.27% ZP, 50 µS/cm Stability Time Limit.
Figure.6.8. PVC Thermomat Results of PVC films heated at 160°C.
As shown in Figs.6.7 and 6.8, the kinetic curves are composed of two sections; an
initial slowly increasing section followed by a rapid increasing curve. The former is
called as initial region while the latter as linear region. The lesser slopes of curve of the
conductivity in the initial section can be explained through the slower release of HCl
gas due to the presence of additives and the higher slopes of the curve of conductivity in
the linear region can be explained by the rapid release of HCl gas.
When the curves of the PVC films at seven different compositions were compared
with pure PVC as a control, it is obvious that PVC control sample has the longest
Page 67
51
stability time of 15 hours. However, if the induction times are examined, film having
only 1.36% of ZB only has a higher value than the control sample but the composition
having only ZP does not have. Sample having 0.54% ZB and 0.81% ZP, sample having
0.81% ZB and 0.54% ZP and sample having 0.27% ZB and 1.29% ZP had also higher
values than the control sample.
If the PVC Thermomat data for 160°C are analysed first of all it is clear that the
both induction and stability time values were decreased by 1:5 of their previous values.
Again here PVC control sample had the highest stability time with a steep long lasting
slope. However, samples having 0.54% ZB and 0.81% ZP and 0.81% ZB and 0.54% ZP
and also 0.27% ZB and 1.29% ZP had the highest values, but in general all of the
compositions had better results then PVC control sample.
As shown in Table 6.4, the activation energies of the initial regions have higher
values than the activation energies of the linear region except in Sample No.6. This can
be explained by the rapid dehydrochlorination reactions occurring in the linear region.
Due to the presence of zinc borate and zinc phosphate in the initial region, the activation
energies are higher which means that there must be more energy applied to the system
to initiate the reaction when compared with the linear region. When linear region values
are examined, lower values indicate an acceleration of the HCl release.
When the induction and stability time values at 160°C are compared with each
other, the decrease in the values are clearly noticeable. Sample having 0.54% ZB and
0.81% ZP composition has especially showed synergism compared to the sample
having only 1.36% ZB or 1.36% ZP only in its composition. But also samples having
composition of 0.81% ZB and 0.54% ZP and 0.27% ZB and 1.29% ZP have also had
higher induction times indicating synergistic results compared with the former at 140°C.
The induction time of PVC control sample at 160°C had a lower value than its
counter. However all of the film compositions had shown similar results due to the
release of HCl gas. Similar to the former case, again 0.54% ZB and 0.81% ZP
composition has especially showed synergism compared to the sample having only
1.36% ZB or 1.36% ZP only in its composition.
According to Frye – Horst mechanism, anions exchange with labile chlorine atoms
next to double bonds or carbonyl substituents. The ZB and ZP in the system react with
the HCl released from the system during heating by exchanging their borate and
phosphate ions, respectively.
Page 68
52
MX CH
Cl
CH
H
ClMX CH
C-H
X
H
2 + +-6.11-
where X: Phosphate or borate anion. The bond between C and phosphate or borate
anions are more stable than C – Cl bond. At long heating times, this bond will be broken
also and HCl gas will be released.
The reactions occurring in the PVC system is as follows;
Table 6.2 PVC Thermomat Results at 140°C of PVC plastigels.
No ZB, wt%
ZP, wt%
Induction Time, h
(Evaluated)
Induction Time, h (Visual)
Stability Time, h
Initial Rate Constantx107,
min-1
Linear Rate Constantx104,
min-1
1 0.00 0.00 2.99 3.00 15.21 4.02 0.05
2 0.00 1.36 3.28 2.30 3.22 23.09 1.85
3 0.27 1.29 6.72 5.80 6.76 7.67 3.14
4 0.54 0.81 7.86 6.80 7.91 15.42 2.96
5 0.68 0.68 3.53 1.10 3.84 13.85 1.32
6 0.81 0.54 6.37 5.20 6.36 27.71 2.40
7 1.29 0.27 6.25 4.70 6.38 5.26 1.61
8 1.36 0.00 7.04 5.40 7.18 5.36 1.89
( ) ( )( ) ( ) 2242243
24243
223232
24
ZnClHPOZn22HClPOZn
O4H3HBOBClZnClZn(HO)Cl12HClO3B2ZnO
ZnClPOHZnHClPOZn +→++→+
++++→+• -6.12-
-6.13- -6.14-
Page 69
53
Table 6.3. PVC Thermomat Results at 160°C of PVC plastigels.
No. ZB, wt%
ZP, wt%
Induction Time, h
(Evaluated)
Induction Time, h (Visual)
Stability Time, h
Initial Rate Constantx106,
min-1
Linear Rate Constantx104,
min-1
1 0.00 0.00 1.49 0.7 3.35 4.86 0.3
2 0.00 1.36 1.22 0.95 1.25 9.24 7.31
3 0.27 1.29 1.59 1.38 1.64 2.72 8.72
4 0.54 0.81 1.87 1.80 1.93 12.15 10.28
5 0.68 0.68 1.20 1.07 1.25 12.31 9.51
6 0.81 0.54 1.69 1.55 1.75 10.26 11.08
7 1.29 0.27 1.66 1.56 1.72 5.14 8.15
8 1.36 0.00 1.77 1.60 1.81 4.62 7.48
To show the synergism with the help of induction time, Figures 6.9 to Figure 6.12
were given at seven different compositions and compared with PVC control sample at
140 and 160°C. Evaluated induction time is the induction time at the intersection point
of the slopes of initial and linear regions measured by the software of PVC Thermomat
instrument; while visual induction time is the induction time defined by the operator at
the beginning of the increase of conductivity with time in the initial region.
As shown in these figures, the compositions show a higher induction time value
meaning a synergism between them. Because not only the induction time values of the
samples having only ZB or only ZP but also the induction time values of the PVC
control sample are lower than the values of the compositions having both ZB and ZP.
Page 70
54
PVC Control0.00; ZB, wt%
0.00 ZB, wt%1.36 ZP, wt%
0.27; ZB, wt%1.29 ZP, wt%
0.54; ZB, wt%0.81 ZP, wt%
0.68; ZB, wt%0.68 ZP, wt%
0.81; ZB, wt%0.54 ZP, wt%
1.29; ZB, wt%0.27 ZP, wt%
1.36; ZB, wt%0.00 ZP, wt%
0,00
1,00
2,00
3,00
4,00
5,00
6,00
7,00
8,00
9,00
ZB, wt%
Zinc Borate, wt%
Eva
luat
ed In
duct
ion
Tim
e, h
Fig.6.9 The bar graph of evaluated induction time for zinc borate at 140°C.
PVC Control0.00; ZB, wt%
0.00; ZB, wt%1.36; ZP, wt%
0.27; ZB, wt%1.29; ZP, wt%
0.54; ZB, wt%0.81; ZP, wt%
0.68; ZB, wt%0.68; ZP, wt%
0.81; ZB, wt%0.54; ZP, wt%
1.29; ZB, wt%0.27; ZP, wt%
1.36; ZB, wt%0.00; ZP, wt%
0,00
1,00
2,00
3,00
4,00
5,00
6,00
7,00
8,00
ZB, wt%
Zinc Borate, wt%
Vis
ual I
nduc
tion
Tim
e, h
Fig.6.10 The bar graph of visual induction time for zinc borate at 140°C.
Page 71
55
PVC Control0.00; ZB, wt%
0,00; ZB, wt%1.36 ZP, wt%
0.27; ZB, wt%1.29 ZP, wt%
0.54; ZB, wt%0.81 ZP, wt%
0.68; ZB, wt%0.68 ZP, wt%
0.81; ZB, wt%0.54 ZP, wt%
1.29; ZB, wt%0.27 ZP, wt%
1.36; ZB, wt%0.00 ZP, wt%
0
0,2
0,4
0,6
0,8
1
1,2
1,4
1,6
1,8
2
ZB, wt%
Zinc Borate, wt%
Eva
luat
ed In
duct
ion
Tim
e, h
Fig.6.11 The bar graph of evaluated induction time for zinc borate at 160°C.
PVC Control0.00; ZB, wt%
0.00; ZB, wt%1.36 ZP, wt%
0.27; ZB, wt%1.29 ZP, wt%
0.54; ZB, wt%0.81 ZP, wt%
0.68; ZB, wt%0.68 ZP, wt%
0.81; ZB, wt%0.54 ZP, wt%
1.29; ZB, wt%0.27 ZP, wt%
1.36; ZB, wt%0.00 ZP, wt%
0
0,2
0,4
0,6
0,8
1
1,2
1,4
1,6
1,8
2
ZB, wt%
Zinc Borate, wt%
Vis
ual I
nduc
tion
Tim
e, h
Fig.6.12 The bar graph of visual induction time for zinc borate at 160°C.
Page 72
56
6.2.3 Activation Energies of Dehydrochlorination Reactions
The activation energies of dehydrochlorination reactions were calculated for the
films heated at 140°C and at 160°C by use of Arrhenius equation. The preexponential
factors were also evaluated from rate constant at two different temperatures.
k Ae E RT
where;
k = rate constant,
A = Preexponential factor or frequency.
E = Activation energy in J/mole
R = Universal gas constant (R = 8.314 J/molxK )
T = Temperature in K.
Activation energy is evaluated by the use of Arrhenius equation at two different
temperatures;
−−=
121
2 11ln
TTRE
kk
The activation energies of dehydrochlorination of PVC control sample with 29.7%
DOP in initial and linear regions were found to be 185.3 and 135.4 kJ/mol, respectively.
Atakul, 2004 has reported the degradation of PVC with 43% DOP as 129.7 and 111.3
kJ/mol.
The resultant activation energies were tabulated in Table 6.4. As can be noticed in
Table 6.4, generally the values in the linear region are lower than the initial region due
to the higher consumption of the additives in the initial region and therefore lack of
material in the linear region. After the consumption of materials in the initial region, the
effect of heating accelerates the release of HCl.
When the activation energies are compared with each other according to the sample
compositions, the highest values were found in Sample having 0.81% ZB + 0.54% ZP
(6.15)
(6.16)
Page 73
57
and Sample having 0.27% ZB + 1.29% ZP. These values are also consistent with the
values in linear region. The value of the Control Sample should also be taken into
account carefully. The PVC control sample has higher values than all of the
compositions; and Sample having 0.27% ZB + 1.29% ZP has the lowest values
indicating that it decreases the required energy for the release of HCl. But this result
does not agree with induction time values. The effectiveness of the additives in the
initial region causes the barrier energy to decrease leading to general lower values.
Table 6.4 Activation energies of PVC plastigels heated at 140° and 160°C.
No ZB, wt% ZP, wt% Activation Energy of Initial Region, kJ/mol
Activation Energy of Linear Region, kJ/mol
1 0.00 0.00 185.3 135.4
2 0.00 1.36 103.1 102.2
3 0.27 1.29 94.0 75.9
4 0.54 0.81 153.4 92.7
5 0.68 0.68 162.4 146.8
6 0.81 0.54 97.3 113.7
7 1.29 0.27 169.3 120.5
8 1.36 0.00 160.1 102.3
6.2.4 Preexponential Factors of Dehydrochlorination Reactions
Preexponential factors (A) of initial and linear regions of the kinetic curves for
PVC plastigels were evaluated by using the Eq. 6.14. These values were reported in
Table 6.5.
Page 74
58
Table 6.5 Preexponential factors of PVC plastigels heated at 140° and 160°C.
No ZB, wt% ZP, wt% Preexponential Factor of Initial
Region, s-1
Preexponential Factor of Linear
Region, s-1
1 0.00 0.00 2.15x10⁻²⁸ 1.42x10⁻²¹
3 0.00 1.36 3.41x10⁻¹⁸ 3.38x10⁻¹⁶
7 0.27 1.29 1.23x10⁻¹⁷ 6.01x10⁻¹³
5 0.54 0.81 3.78x10⁻²⁴ 6.77x10⁻¹⁵
4 0.68 0.68 3.15x10⁻²⁵ 1.85x10⁻²¹
6 0.81 0.54 1.86x10⁻¹⁷ 2.13x10⁻¹⁷
8 1.29 0.27 1.92x10⁻²⁶ 2.38x10⁻¹⁸
2 1.36 0.00 2.22x10⁻²⁵ 3.38x10⁻¹⁶
As seen in Table 6.4 and 6.5, the activation energy and preexponential factor
values are very different from each other. Therefore, kinetic compensation effect is to
be calculated by plotting lnA vs. E curves as shown in Fig.6.13. The effect of reaction
mechanisms becomes obvious by investigating these curves.
Atakul, 2004 has reported a linear relationship between lnA and E values of the
samples having 33% DOP as;
lnA=0.2778E-10.682 (initial region)
lnA=0.2882E-9.9506 (linear region),
and the samples having 43% DOP, ZnSt2 and zeolite as;
lnA=0.2795E-9.6722 (initial region)
lnA=0.2726E-9.9506 (linear region),
which were consistent with the literature.
A linear relationship was also observed in this study. Linear relationship of the
lines both at initial and linear regions can be noticed in Figure 6.13.
Page 75
59
y = 0,2781x - 11,95R2 = 0,997
y = 0,2566x - 5,0962R2 = 0,9664
0,00
5,00
10,00
15,00
20,00
25,00
30,00
35,00
40,00
45,00
70,0 90,0 110,0 130,0 150,0 170,0 190,0 210,0
E, kJ/mol
lnA
Fig.6.13. Kinetic compensation effect curve for the samples having different
compositions ( : initial region, : linear region).
The equations for the lines are as follows;
lnA = 0.2781E – 11.95 (initial region)
lnA = 0.2566E – 5.0962 (linear region)
While the initial region equation is consistent with the previous study, the linear
region equation has nearly the same slope with initial region equation as found by
Atakul [2004].
Page 76
60
6.3 Characterization of PVC Plastisols and PVC Plastigels
6.3.1 Thermogravimetric Study of PVC Films
To have an idea about the thermal behaviour of the PVC films, TGA instrument
was used to investigate by studying the mass losses of PVC due to HCl release.
As it was clearly noted in the previous study by Ning and Guo [2000], the thermal
decomposition of PVC is a two-stage process; thermal decomposition in the first stage
is mainly the evolution of HCl and the thermal decomposition in the second stage is
mainly the cyclization of conjugated polyene sequences to form aromatic compounds.
Incorporation of small amounts of ZB and ZP reduces the thermal decomposition
temperature in the first stage, while it increases the thermal decomposition temperature
in the second stage.
Two main kinds of mechanism of smoke suppression in PVC for metal containing
compounds were proposed: One is Lewis acid mechanism and the other is reductive
coupling mechanism (Starnes,et.al., 1979; Lattimer and Kroenke, 1981). They are all
supported by some experimental results. But the final results for these mechanisms are
that all the metal compounds promote early crosslinking of PVC during decomposition
to increase char formation. It is due to Lewis acid mechanism that zinc containing
compounds can greatly reduce smoke formation. ZnCl2, which formed along with the
thermal decomposition of PVC, acts as an effective catalyst for the ionic
dehydrochlorination of PVC due to its strong Lewis acidity. Dehydrochlorination of
PVC under the influence of ZnCl2 occurs with a formation of trans-polyene structures
followed by intermolecular cyclization, resulting in increased char formation and a
decrease in smoke production (Ning and Guo, 2000).
Therefore by the mechanism described so far, the ZnCl2 formed decreases the
smoke formation and increases char formation. When ZB and ZP is heated, small
amounts of ZnCl2 are formed according to Eqn.6.12 through Eqn.6.14 by the effect of
heat. The char residue values are evaluated and discussed for the samples in Tables 6.6
through 6.8 as residual mass percentage values.
Mass loss versus temperature graphs can be seen in Figure 6.14 (a) and (b).
Thermal degradation behaviour of the samples was measured under N2 atmosphere at a
heating rate of 10°C/minute and recorded from room temperature to 600°C. To
determine the thermal degradation and stability of the films according to the two stage
Page 77
61
process, the curves are evaluated at 225 and 600°C. The results are evaluated in Table
6.6, 6.7 and 6.8, respectively.
These results show a beneficial interaction between ZB and ZP. It is not so clear in
Table 6.6 (at 225°C) but it becomes obvious in the later two tables. The mass losses of
PVC control sample and sample having 0.54% ZB + 0.81% ZP are 0% at 225°C.
However, the mass losses in the rest of the samples are noticeable although they are
small. When the values at 400°C are examined, the mass loss in PVC control sample
had the highest value of 73.6% among other samples. Sample having 1.29% ZB +
0.271% ZP has the lowest value of 64.80%. Sample having only 1.36% ZB and the
sample having only 1.36% ZP has higher values but these values are again smaller than
control sample. It may be concluded that they had also lowered the degradation of PVC
by themselves, however as it is clear with the results of other samples, they have lower
mass loss values by the combination compositions.
When the final losses at 600°C are examined, control sample has the highest loss
value of 87.5%. Sample having equivalent amounts of ZB and ZP (0.68%) comes next.
At this temperature sample having 1.29% ZB + 0.27% ZP and sample having 0.54% ZB
+ 0.81% ZP has again the lowest value of 73.7% and 76.15%; respectively.
As shown in Fig.6.14 (a), PVC control sample started to loose its mass at 180°C.
While sample having only 1.36% ZB has a higher onset temperature of 214°C and
sample having only 1.36% ZP has a lower onset temperature of 185°C when compared
with the control sample. Foregoing mass losses of these samples takes place at the same
temperature value of 304°C but with different mass losses and then same temperature of
418°C. This temperature is also higher than the control sample. Off the remaining
samples, the highest onset temperature is 214°C with sample having only 1.36% ZB
only and 210°C with sample having 0.27% ZB and 1.29% ZP, respectively.
The char residues of the samples, which are residual mass values, are tabulated in
Tables 6.6 through 6.8. The highest char residue giving samples are samples having
0.54% ZB + 0.81% ZP (26.36%), and 1.29% ZB + 0.27% ZP (23.85%). But in a general
view, all of the compositions give higher char residues when compared with the control
sample (12.5%). This result is consistent with the mechanism proposed in the previous
section (Eqn.6.11-6.14). ZnCl2 formed suppressed the formation of smoke and catalysed
the char formation which is clearly obvious in the values when compared with the PVC
control.
Page 78
62
0,00
2,00
4,00
6,00
8,00
10,00
12,00
0,0 100,0 200,0 300,0 400,0 500,0 600,0
Temperature, °C
Mas
s, m
g
0,0
2,0
4,0
6,0
8,0
10,0
12,0
0 100 200 300 400 500 600
Temperature, °C
Mas
s, m
g
1: PVC Control Sample, 2: 1.36 wt% ZB, 3: 1.36 wt% ZP, 4: 0.68 wt% ZB and 0.68 wt% ZP
Figure 6.14 (a) TGA curves of Sample Nos.1 – 4.
5: 0.54 wt% ZB and 0.81 wt% ZP, 6: 0.81 wt% ZB and 0.54wt% ZP,
7: 0.27 wt% ZB and 1.29 wt%ZP, 8: 1.29 wt% ZB and 0.27 wt% ZP
Figure 6.14 (b) TGA curves of Sample Nos.5 – 8.
Page 79
63
The onset temperatures tabulated in Table 6.9 are also graphed in Figure 6.15
according to the ZB wt %. For a comparison, PVC control sample is also added in this
bar chart. As can be concluded in this bar chart, nearly all of the onset temperatures of
the samples are higher than the control sample, especially the composition with 1.36%
ZB only and 0.27% ZB + 1.29% ZP have got higher values compared with the control
sample.
Table 6.6. Mass loss of PVC plastigel films at 225°C
No ZB, wt% ZP, wt% Mass Loss, % Residual Mass, %
1 0.00 0.00 1.44 98.56
2 0.00 1.36 9.07 90.93
3 0.27 1.29 4.00 96,00
4 0.54 0.81 0.00 100.00
5 0.68 0.68 6.91 93.09
6 0.81 0.54 8.19 91,81
7 1.29 0.27 3.70 96.30
8 1.36 0.00 7.21 92.79
Table 6.7. Mass loss of PVC plastigel films at 400°C.
No ZB, wt% ZP, wt% Mass Loss, % Residual Mass, %
1 0.00 0.00 73.60 26.64
2 0.00 1.36 67.10 32.90
3 0.27 1.29 69.50 30.5
4 0.54 0.81 66.15 33.85
5 0.68 0.68 70.65 29.35
6 0.81 0.54 71.10 28.9
7 1.29 0.27 64.80 35.20
8 1.36 0.00 65.00 35.00
Page 80
64
Table 6.8. Mass loss of PVC plastigel films at 600°C.
No ZB, wt% ZP, wt% Mass Loss, % Residual Mass, %
1 0.00 0.00 87.50 12.50
2 0.00 1.36 77.20 22.80
3 0.27 1.29 80.40 19.60
4 0.54 0.81 76.15 23.85
5 0.68 0.68 81.90 18.10
6 0.81 0.54 80.90 19.10
7 1.29 0.27 73.70 26.30
8 1.36 0.00 74.20 25.80
Table 6.9 Onset temperatures of PVC plastigel films.
No ZB, wt% ZP, wt% Onset Temperatures , °C
1 0.00 0.00 180
2 0.00 1.36 185
3 0.27 1.29 210
4 0.54 0.81 185
5 0.68 0.68 190
6 0.81 0.54 200
7 1.29 0.27 183
8 1.36 0.00 214
Page 81
65
PVC Control0.00; ZB wt%
0.00; ZB wt%1.36; ZP wt%
0.27; ZB wt%1.29; ZP wt%
0.54; ZB wt%0.81; ZP wt%
0.68; ZB wt%0.68; ZP wt%
0.81; ZB wt%0.54; ZP wt%
1.29; ZB wt%0.27; ZP wt%
1.36; ZB wt%0.00; ZP wt%
160
170
180
190
200
210
220
Zinc Borate, wt%
Ons
et T
empe
ratu
res,
°C
Fig.6.15. The onset temperature bar graph of the samples.
Page 82
66
6.4 Colour Tests of PVC Plastigels
6.4.1 Static Oven Test
When PVC is heated its colour changes due to the conjugated double bonds and the
polyene sequences formed. The colour varies from light brown to dark brown and even
black in severe cases.
The gelled PVC films were cut into 6 pieces of 5 x 1 cm. and properly labelled as
15 min., 30 min., 45 min., 60 min., 75 min. and 90 min placed onto a glass plate. These
films were then placed in a vacuum static oven and heated first of all at 140°C and then
at 160°C for the time periods mentioned before. A sample film was taken out of the
oven at every 15 minute interval and the appearance of the films was recorded at these
intervals. All other thermal stability tests were evaluated according to these films.
The appearances of the films heated at 140°C and 160°C were tabulated in Table
6.10 and 6.11, respectively. As it is also clear in the tables, the PVC control sample at
160°C is especially degraded very easily beginning from 45 minutes with a pale brown
colour and getting a brown colour at 90 minutes. But in the samples having only ZB or
only ZP, although the degradation is apparent it is not as fast as in PVC control sample;
especially in the composition having only ZP. The colour begins to change at 75
minutes for the sample having ZB only but the colour of the sample having ZP only
does not change. The synergistic effect of ZB and ZP can be observed in the results of
this test. Sample having 0.54% ZB + 0.81% ZP, sample having 0.81% ZB + 0.54% ZP
and sample having 1.29% ZB + 0.27% ZP have all colours between white and yellowish
meaning that they did not degrade so easily such as in the control sample and the
samples having only ZB or only ZP. Their colour did not change even at 160°C at 90
minutes but the films have become opaque and slippery.
Page 83
67
Table 6.10 The appearance of the film samples heated at 140°C for different time
periods.
ZB, % ZP, % 15 min. 30 min. 45 min. 60 min. 75 min. 90 min.
0.00 0.00 White White White White White White
0.00 1.36 White White White White White White
0.27 1.29 White White White White Yellowish Yellowish
0.54 0.81 White White White White White White
0.68 0.68 White White White White White White
0.81 0.54 White White Yellowish Yellowish Yellowish Yellowish
1.29 0.27 White White Yellowish Yellowish Yellowish Yellowish
1.36 0.00 White White White White White Light yellow
Table 6.11 The appearance of the film samples heated at 160°C for different time
periods.
ZB, % ZP, % 15 min. 30 min. 45 min. 60 min. 75 min. 90 min.
0.00 0.00 White White Yellowish Light
yellow
Light
yellow Light brown
0.00 1.36 White White White White White White
0.27 1.29 White White White Yellowish Yellowish Light brown
0.54 0.81 White White White White White White
0.68 0.68 White White Light
brown
Light
brown
Light
brown Brown
0.81 0.54 White White White White White White
1.29 0.27 White White White White White White
1.36 0.00 White White White White Light
brown Light brown
Page 84
68
6.5 Colour Measurement
The colour measurements were evaluated also by using a spectrometer. The X, Y
and Z tristimulus values read by Avantes Spectrocam spectrophotometer were used to
calculate the yellowness indexes of the films from Eqn.5.1 and the values both in L, a, b
and X, Y and Z tristimulus are reported in Table A.17 to A.19 in Appendix. Yellowness
index is a measure of the extent of degradation of the films as there is a colour change
on the films due to heat.
Table 6.12 lists the values of yellowness index of the samples heated at 140°C
while Table 6.13 lists the values of 160°C.
Table 6.12 Yellowness Index values of the PVC Films heated at 140°C.
Sample No. ZB, % ZP, % 15 min. 30 min. 45 min. 60 min. 75 min. 90 min.
1 0.00 0.00 6.4 11.8 10.6 8.2 9.9 7.8
2 0.00 1.36 -5.5 -2.2 -1.2 -1.4 0.1 -0.7
3 0.27 1.29 -3.5 3.7 4.3 6.9 10.3 11.6
4 0.54 0.81 -4.4 -5.2 3.1 -0.5 2.8 3.6
5 0.68 0.68 -2.5 -4.2 -4.9 -3.6 -0.7 -2.6
6 0.81 0.54 -5.0 0.2 0.7 6.6 6.9 5.7
7 1.29 0.27 -7.4 4.8 5.4 8.1 8.7 10.5
8 1.36 0.00 -6.0 -9.2 -5.9 -4.6 -5.2 41.2
Table 6.13 Yellowness Index values of the PVC Films heated at 160°C.
Sample No. ZB, % ZP, % 15 min. 30 min. 45 min. 60 min. 75 min. 90 min.
1 0.00 0.00 0.5 2.8 1.6 1.7 -5.1 1.6
2 0.00 1.36 -0.2 -0.1 -1.5 3.7 38.1 -5.2
3 0.27 1.29 -2.9 -4.6 -6.3 2.6 27.3 36.8
4 0.54 0.81 -2.2 0.0 2.2 0.6 3.0 -4.9
5 0.68 0.68 -1.8 -5.9 71.9 94.9 108.6 106.8
6 0.81 0.54 -3.9 -3.9 -4.7 -2.8 -1.8 -6.0
7 1.29 0.27 -3.5 -1.7 -1.0 2.4 1.1 -3.7
8 1.36 0.00 -2.3 -0.4 -3.9 0.1 20.7 82.1
Page 85
69
Higher or positive numbers of yellowness index indicate that the sample is
degraded while negative numbers indicate that thermal stability or degradation is better.
When the results of 140°C are examined, sample having 0.68% ZB and ZP each,
having equal amounts of ZB and ZP of 0.68%, had the best result but when it is heated
at 160°C it has degraded very much leading to the highest number of 106.8. The sample
having 0.81% ZB and 0.54% ZP has got the whitest value of -6.0 but also the sample
having 0.54% ZB and 0.81% ZP has got also a whiter value of -4.9.
In general all of these numbers are consistent with the previous Tables 6.10 and
6.11 of appearances of the PVC plastigels. As a reference, a white gloss paper was put
behind the films as the films were transparent. Therefore the yellowness index of the
white paper was also calculated as -8.9 from its tristimulus values as 74, 77 and 95.8,
respectively. The values are tabulated in Table A.17 in Appendix.
To have a better idea about the tendency of the yellowness index of the films,
Figures 6.16 and 6.17 are given. These figures are specifically important due to
minimizing the effect of maximum ∆E value between two measurements. The formula
for ∆E is given in Eqn.5.2.
The instrument has an error tolerance of 0.4 ∆E between two adjacent
measurements. Therefore construction of linear equations between the data points will
linearize the yellowness index versus time minimizing the error between measurements.
For the values at 140°C, all of them are in an increasing trend. However, at 160°C the
samples having only 1.36% ZP and 0.54% ZB and 0.81% ZP have a decreasing trend
leading to whiter results.
Page 86
70
y = -0,002x + 9,2094
y = 0,0578x - 4,841
y = 0,041x - 8,0276
y = 0,1156x - 6,1623
-15,0
-10,0
-5,0
0,0
5,0
10,0
15,0
20,0
25,0
30,0
0 10 20 30 40 50 60 70 80 90 100
Time, minutes
Yel
low
ness
Inde
x
y = -0,0345x + 2,3327
y = 0,1806x - 3,6744
-10,0
-5,0
0,0
5,0
10,0
15,0
20,0
0 10 20 30 40 50 60 70 80 90 100
Time, minutes
Yel
low
ness
Inde
x
PVC Control Sample, 1.36 % ZB, 1.36 % ZP, 0.68 % ZB and 0.68 % ZP 0.54% ZB and 0.81% ZP Fig.6.16. The change of yellowness index tendency of the PVC plastigel
films with time at 140°C.
PVC Control Sample, 1.36 % ZB, 1.36 % ZP, 0.54% ZB and 0.81% ZP Fig.6.17. The change of yellowness index tendency of the PVC plastigel
films with time at 160°C.
Page 87
71
6.6 Spectroscopic Analyses of the Films
6.6.1 Fourier Transmission InfraRed (FTIR) Spectra Tests
FTIR spectrum of PVC control sample is given in Figure 6.18. The IR spectrum
showed bands related with CH2 stretch at approximately 2910 cm-1 and CH stretching
vibration at 2965 cm-1, CH2 bending vibration at 1425 cm-1, CH bending in CHCl
vibrations at 1250 cm-1 and 1333 cm-1, C-C vibration at 1098 cm-1, CH2
bending(Rocking) vibration at 970 cm-1, and C-Cl stretch vibration at 690 cm-1.
Between 1580 and 1600 cm-1 typical peaks of aromatic rings of the plasticizer is seen.
At 1715 cm-1 there is C = O stretching vibration of plasticizer. These results are also
consistent with previous studies (Atakul, 2004; Gökçel and Balköse, 1996).
As mentioned before, the peaks belonging to ZP are clear in Fig.6.4 and that the
peaks observed at 1080 and 890 cm-1 are the P-O symmetric and asymmetric vibration
in P-O-P chains; respectively. But in the Figures between 6.19 and 6.25, these peaks are
overlapped due to the bands of PVC which will be explained later.
FTIR spectra of the sample having 1.36% ZP only are given in Fig.6.19. In these
spectra, the bands due to P-O symmetric vibration in P-O-P chain at 1080 cm-1 and P-O
asymmetric vibration in P-O-P chain at 890 cm-1 are invisible because they are
overlapped by the C-O-C stretching vibration bands of the DOP plasticizer.
FTIR spectra of the composition having 0.27% ZB + 1.29% ZP, 0.54% ZB +
0.81% ZP, 0.81% ZB + 0.54% ZP and 1.29% ZB + 0.27% ZP are given in Figures
6.20, Figure 6.21, Figure 6.23 and Figure 6.24, respectively. For all of these spectra,
again the peaks at 160°C belonging to the plasticizer between 970 and 1500 cm-1 gave
lower absorbance values than at 140°C. This is due to the evaporation of DOP at 160°C
causes the absorbance values to lower down. This becomes clearer in the control
sample. As there is only PVC and DOP without any additives in the control sample, the
same lower absorbance values indicate partial evaporation of DOP. This result was also
reported in a previous study by Atakul, 2004.
FTIR spectra of the composition having equivalent 0.68% ZB and ZP heated at 140
and 160°C are given in Fig.6.22. Between peaks 705 cm-1 and 1600 cm-1 at 160°C, the
absorbance values were lowered because of the high thicknesses of the films. The high
thickness prevents the light pass through the films causing the absorbance values to be
low.
Page 88
72
In Fig.6.25, the FTIR spectra of the sample having 1.36% ZB only are given. At
3227 cm-1 the peak of ZnO•B2O3 is clearly seen due to the zinc borate in its structure.
The peak of ZB did not change due to heating at 160°C and have nearly the same
absorbance value with the value at 140°C.
The absorbance values of the samples versus ZB percentage values in the films
were graphed in Figures 6.26 and 6.27. These figures were given to have a general idea
on change of amount of DOP and ZB by heating the films. Figure 6.26 is evaluated on
the 1580cm-1 which is the characteristic peak of DOP, and Figure 6.27 is evaluated on
the 3227cm-1 which is the characteristic peak of ZB. These two figures consist of the
values both at 140 and 160°C to be able to make a comparison on the effects of heating.
The values of 1580 cm-1 at both 140°C and 160°C show a decreasing trend in
absorbance with ZB weight percentage. Higher the absorbance value of 1580 cm-1 band
indicated higher transparency at 160°C heated sample. The values of 3227cm-1 both at
140 and 160°C show an increasing trend in absorbance, having a sharper slope at 160°C
for this band. The correlations coefficient of 140°C heated sample was 0.91 confirming
Lamberts Beer Law was obeyed.
cxlxA ε=
where A is absorbance, ε extinction coefficient, l film thickness or path length and c
is concentration of active species.
Fig.6.18 FT-IR spectra of PVC control sample at 140°C and 160°C. ( 140°C at
15 min., 160°C at 90 min.).
50075010001250150017502000250030003500400045001/cm
1.0
2.0
3.0
4.0
5.0
6.0
Abs
(6.17)
Page 89
73
500.0750.01000.01250.01500.01750.02000.02500.03000.03500.04000.04500.01/cm
1.0
2.0
3.0
4.0
5.0
6.0
Abs
Fig.6.19 FT-IR spectra of sample having 1.36% ZP at 140°C and 160°C. (
140°C at 15 min., 160°C at 90 min).
500.0750.01000.01250.01500.01750.02000.02500.03000.03500.04000.04500.01/cm
1.0
2.0
3.0
4.0
5.0
6.0
7.0
Abs
Fig.6.20 FT-IR spectra of sample having 0.27% ZB and 1.29% ZP at 140°C and
160°C. ( 140°C at 15 min., 160°C at 90 min.).
Page 90
74
500.0750.01000.01250.01500.01750.02000.02500.03000.03500.04000.04500.01/cm
1.0
2.0
3.0
4.0
5.0
6.0
Abs
Fig.6.21 FT-IR spectra of sample having 0.54% ZB and 0.81% ZP at 140°C and
160°C. ( 140°C at 15 min., 160°C at 90 min.).
500.0750.01000.01250.01500.01750.02000.02500.03000.03500.04000.04500.01/cm
1.0
2.0
3.0
4.0
5.0
Abs
Fig.6.22 FT-IR spectra of sample having 0.68% ZB and 0.68% ZP at 140°C and
160°C. ( 140°C at 15 min., 160°C at 90 min.).
Page 91
75
500.0750.01000.01250.01500.01750.02000.02500.03000.03500.04000.04500.01/cm
2.0
4.0
6.0
Abs
Fig.6.23 FT-IR spectra of sample having 0.81% ZB and 0.54% ZP at 140°C and
160°C. ( 140°C at 15 min., 160°C at 90 min.).
500.0750.01000.01250.01500.01750.02000.02500.03000.03500.04000.04500.01/cm
1.0
2.0
3.0
4.0
5.0
Abs
Fig.6.24 FT-IR spectra of sample having 1.29% ZB and 0.27% ZP at 140°C and
160°C. ( 140°C at 15 min., 160°C at 90 min.).
Page 92
76
500.0750.01000.01250.01500.01750.02000.02500.03000.03500.04000.04500.01/cm
1.0
2.0
3.0
4.0
5.0
Abs
Fig.6.25 FT-IR spectra of sample having 1.36% ZB at 140°C and 160°C. (
140°C at 15 min., 160°C at 90 min.).
y = -0,0762x + 1,8429R2 = 0,2344
y = -0,0119x + 0,9536R2 = 0,0054
0,0
0,5
1,0
1,5
2,0
2,5
PVC 0.00% ZB 0.27% ZB 0.54% ZB 0.68% ZB 0.81% ZB 1.29% ZB 1.36% ZB
ZB wt%
Abs
orba
nce
valu
es
Figure 6.26 Absorbance versus ZB wt% at 1580cm-1 at 140 and 160°C.
140°C, 160°C.
Page 93
77
y = 0,0255x - 0,028
R2 = 0,913
y = 0,041x - 0,0818R2 = 0,6149
-0,1
-0,05
0
0,05
0,1
0,15
0,2
0,25
0,3
0,35
0,4
0,45
PVC 0.00% ZB 0.27% ZB 0.54% ZB 0.68% ZB 0.81% ZB 1.29% ZB 1.36% ZB
ZB wt%
Abs
orba
nce
valu
es, %
Figure 6.27 Absorbance versus ZB wt% at 3227cm-1 at 140 and 160°C.
140°C, 160°C.
6.6.2 Attenuated Total Reflection (ATR) Spectra Tests
Transmission IR spectrum of films gives ideas about bulk of the PVC films, but
ATR spectrum gives information about the surface of the films. As the temperature of
the films increases, DOP is transferred to the surface of the films. Therefore with the
help of the results achieved from ATR spectra, the change in surface characteristics of
the films due to heating can be evaluated.
ATR IR spectra are given through Figures 6.28 and 6.35. The peak at 1540 cm-1 is a
characteristic band of COO- belonging to the emulsifier present in emulsion PVC. In
general, the absorbance value of this peak is observed to be increasing when films were
heated. This can be explained again due to the fact that the migration of the carboxylate
groups from the interior of the film to the surface is increasing.
Another point to be discussed is the presence of ZB peak at 3227 cm1 in the figures
both at 140 and 160°C which show that ZB does not decompose by the effect of
heating. The presence of this peak is valid for all of the samples having ZB but its
absorbance value changes by the ZB mass added according to the composition. The
Page 94
78
peaks for ZP previously mentioned are also overlapped in these figures.
The absorbance values of the samples versus ZB percentage values in the films
were graphed in Figures 6.36 and 6.37. These figures were given to have a general idea
on the tendency of the absorbance values. The first figure is evaluated on the 1540cm-1
which is the characteristic peak of emulsifier present in PVC, and the second figure is
evaluated on the 3227cm-1 which is the characteristic peak of ZB. These two figures
again consist of the values both at 140 and 160°C to be able to make a comparison on
the effects of heating. The values of 1540 cm-1 both at 140°C and 160°C show a small
decreasing trend with ZB weight percentage in absorbance. The higher absorbance
values at 160°C indicated emulsifier migrated to the surface of the film from the bulk of
the films. The values of 3227cm-1 both at 140 and 160°C show a random change with
ZB wt% indicating the surface of the film did not have the same composition with bulk.
As seen in Fig.6.27 the transmission spectra showing the state of bulk had an increasing
absorbance at 3227 cm-1 with ZB wt%.
0,00
0,20
0,40
0,60
0,80
1,00
1,20
500,00 1000,00 1500,00 2000,00 2500,00 3000,00 3500,00 4000,00
Wavenumber
Abs
orba
nce,
%
Fig.6.28 FT-IR spectra of PVC Control sample at 140°C and 160°C. (
140°C at 15 min., 160°C at 90 min.).
Page 95
79
0,00
0,10
0,20
0,30
0,40
0,50
0,60
0,70
0,80
0,90
1,00
500,00 1000,00 1500,00 2000,00 2500,00 3000,00 3500,00 4000,00
Wave number
Abs
orba
nce,
%
Fig.6.29 FT-IR spectra of sample having 0.00% ZB and 1.36% ZP at 140°C and
160°C. ( 140°C at 15 min., 160°C at 90 min.).
0,00
0,20
0,40
0,60
0,80
1,00
1,20
1,40
500,00 1000,00 1500,00 2000,00 2500,00 3000,00 3500,00 4000,00
Wave number
Abs
orba
nce,
%
Fig.6.30 FT-IR spectra of sample having 0.27% ZB and 1.29% ZP at 140°C and
160°C. ( 140°C at 15 min., 160°C at 90 min.).
Page 96
80
0,00
0,20
0,40
0,60
0,80
1,00
1,20
1,40
1,60
1,80
2,00
500,00 1000,00 1500,00 2000,00 2500,00 3000,00 3500,00 4000,00
Wave number
Abs
orba
nce,
%
Fig.6.31 FT-IR spectra of sample having 0.54% ZB and 0.81% ZP at 140°C and
160°C. ( 140°C at 15 min., 160°C at 90 min.).
0,00
0,10
0,20
0,30
0,40
0,50
0,60
0,70
0,80
0,90
1,00
500,00 1000,00 1500,00 2000,00 2500,00 3000,00 3500,00 4000,00
Wave number
Abs
orba
nce,
%
Fig.6.32 FT-IR spectra of sample having 0.68% ZB and 0.68% ZP at 140°C and
160°C. ( 140°C at 15 min., 160°C at 90 min.).
Page 97
81
0,00
0,20
0,40
0,60
0,80
1,00
1,20
500,00 1000,00 1500,00 2000,00 2500,00 3000,00 3500,00 4000,00
Wave number
Abs
orba
nce,
%
Fig.6.33 FT-IR spectra of sample having 0.81% ZB and 0.54% ZP at 140°C and
160°C. ( 140°C at 15 min., 160°C at 90 min.).
0,00
0,20
0,40
0,60
0,80
1,00
1,20
500,00 1000,00 1500,00 2000,00 2500,00 3000,00 3500,00 4000,00
Wave number
Abs
orba
nce,
%
Fig.6.34 FT-IR spectra of sample having 1.29% ZB and 0.27% ZP at 140°C and
160°C. ( 140°C at 15 min., 160°C at 90 min.).
Page 98
82
0,00
0,10
0,20
0,30
0,40
0,50
0,60
0,70
0,80
0,90
1,00
500,00 1000,00 1500,00 2000,00 2500,00 3000,00 3500,00 4000,00
Wavenumber
Abs
orba
nce,
%
Fig.6.35 FT-IR spectra of sample having 1.36% ZB and 0.00% ZP at 140°C and
160°C. ( 140°C at 15 min., 160°C at 90 min.).
y = 1E-17x + 0,0775R2 = 2E-31
y = -0,0042x + 0,025
R2 = 0,3333
-0,050
0,000
0,050
0,100
0,150
0,200
0,250
PVC 0.00% ZB 0.27% ZB 0.54% ZB 0.68% ZB 0.81% ZB 1.29% ZB 1.36% ZB
ZB wt %
Abs
orba
nce
valu
es
Figure 6.36 Absorbance versus ZB wt% at 1540cm-1 at 140 and 160°C.
140°C, 160°C.
Page 99
83
0,0000
0,0005
0,0010
PVC 0.00% ZB 0.27% ZB 0.54% ZB 0.68% ZB 0.81% ZB 1.29% ZB 1.36% ZB
ZB wt%
Abs
orba
nce
valu
es
Figure 6.37 Absorbance versus ZB wt% at 3227cm-1 at 140 and 160°C.
140°C, 160°C.
6.7 Morphology of PVC Plastigels
SEM micrographs of PVC plastigels with different compositions were taken to
investigate the heat effects on the micro scale. Although there are pores in the
micrographs, it is obvious that when the temperature is increased up to 160°C, the
number of air bubbles and particles appearing decrease and a more homogeneous
plastigel is achieved.
In all of the micrographs it can be concluded that the mixing is done thoroughly and
the sedimentation of the particles is not observed. The plasticizer DOP has solvated the
PVC and additive particles thoroughly and with the functionality of wetting agent, the
particles has been wetted well sticking the particles to each other (Fig.6.38a, Fig.6.40a,
Fig.6.41a since the white parts represent both PVC and the plasticizer).
Page 100
84
(a)
(b)
Figure 6.38. SEM microphotographs of PVC control samples a) Heated at 140°C for 15 min. b) Heated at 160°C for 90 min.
In general, the microphotographs of the PVC plastigel films heated at 160°C for 90
minutes have got less air bubbles entrapped in their structures and the number of
observed additive particles decreased due to better gel formation (Fig.6.40a and 6.40b,
Fig.6.42a and 6.42b and Fig.6.45a and 6.45b are some examples).
SEM microphotographs with different compositions of ZB and ZP are given
between Figures 6.38 and Figure 6.45.
(a)
(b)
Figure 6.39. SEM microphotographs of sample having 1.36% ZP only. a) Heated at 140°C for 15 min. b) Heated at 160°C for 90 min.
Page 101
85
(a)
(b)
Figure 6.40. SEM microphotographs of sample having 0.27% ZB and 1.29% ZP. a) Heated at 140°C for 15 min. b) Heated at 160°C for 90 min.
(a)
(b)
Figure 6.41. SEM microphotographs of sample having 0.54% ZB and 0.81% ZP. a) Heated at 140°C for 15 min. b) Heated at 160°C for 90 min.
Page 102
86
(a)
(b)
Figure 6.42. SEM microphotographs of sample having 0.68% ZB and 0.68% ZP. a) Heated at 140°C for 15 min. b) Heated at 160°C for 90 min.
(a)
(b)
Figure 6.43. SEM microphotographs of sample having 0.81% ZB and 0.54% ZP. a) Heated at 140°C for 15 min. b) Heated at 160°C for 90 min.
Page 103
87
(a)
(b)
Figure 6.44. SEM microphotographs of sample having 1.29% ZB and 0.27% ZP. a) Heated at 140°C for 15 min. b) Heated at 160°C for 90 min.
(a)
(b)
Figure 6.45 SEM microphotographs of sample having 1.36% ZB only. a) Heated at 140°C for 15 min. b) Heated at 160°C for 90 min.
Page 104
88
6.8 Elemental Analyses of PVC Plastigels
PVC plastigels were analyzed by EDX coupled with a scanning electron
microscope (SEM) to have an idea on the elemental compositions of the films
composed so far. Both PVC polymer and particle phases were investigated by using this
instrument. Two or three different points on the polymer and particles were chosen and
evaluated. The weight percentage of each element in the compositions was calculated
with average values. Standard deviations were also calculated. A sample EDX
photograph is also given in Figure 6.46 as an example. All of the values are given
between Tables A.1 and A.16 in Appendix.
The theoretical values were calculated and reported in Table 6.14 (Atakul, 2004).
Elemental analyses of the polymer phase and particles at 140°C and 160°C are reported
in Tables 6.15 through 6.18. Carbon (C) content for all analyses except polymer phase
at 140°C is reported between 57% and 75% which is lower than but close to the
theoretical weight percentage of carbon in DOP (73.81%) (Atakul, 2004). The carbon
content in the particles at 140°C is reported to be low. This shows that the particles were
coated with the polymer phase. The chlorine (Cl) content of the films at 140°C is
reported between 11.2% and 27.6% which is lower than the value in PVC plastigel
(31.52%). These values decrease to 3.8% - 16.5% when heated at 160°C which
indicates that the dehydrochlorination occurred. The oxygen content (O) in the films is
reported to be nearly same with the value of PVC plastigel films; between 7 and 9%,
which is nearly same as theoretical value of 9% (Atakul, 2004). This value decreased
down to 6 to 8 % when heated at 160°C. There is not any phosphate content in the
composition with no ZP and there is not any borate content in the composition with no
ZB.
For the particles, it may be concluded that the chlorine content was increased at
160°C. This can be because of the increased rate of release of ZnCl2 formed by the
reaction between HCl released as a result of dehydrochlorination and ZB and ZP in the
system. The chlorine content is between 0.7% – 5.2% at 140°C while it is between 1.3%
– 7.9% at 160°C.
Page 105
89
(a)
(b)
(c)
(d)
Figure 6.46 a) EDX analysis of elements of PVC plastigel having 1.36% ZP only.
b) SEM micrograph of PVC plastigel having 1.36% ZP only.
c) EDX analysis of elements of PVC plastigel having 0.27% ZB +
1.29% ZP.
d) SEM micrograph of PVC plastigel having 0.27% ZB + 1.29% ZP.
Table 6.14 The theoretical compositions of components(Atakul, 2004).
Elements PVC DOP PVC plastigel
C 38.44 73.81 60.36
O - 16.40 9.11
Cl 56.74 - 31.52
Page 106
90
Table 6.15 Elemental analyses of particles at 140°C for 15 minutes (Average
values).
PVC 1.36%
ZP
0.27% ZB
+ 1.29%
ZP
0.54% ZB
+ 0.81%
ZP
0.68% ZB
+ 0.68%
ZP
0.81% ZB
+ 0.54%
ZP
1.29% ZB
+ 0.27%
ZP
1.36% ZB
+ 0.00%
ZP
C - 19.2 18.0 24.9 63.3 40.5 22.4 51.7
O - 26.3 18.8 25.3 12.7 17.3 27.4 21.8
Cl - 0.7 2.0 2.8 3.0 5.2 2.6 4.7
Zn - 42.7 38.3 34.7 10.6 26.2 36.6 11.5
P - 11.2 14.5 9.2 3.4 7.3 8.5 -
B - - 8.4 3.1 7.0 3.4 2.5 10.3
Table 6.16 Elemental analyses of polymer phase at 140°C for 15 minutes (Average
values).
PVC 1.36%
ZP
0.27% ZB
+ 1.29%
ZP
0.54% ZB
+ 0.81%
ZP
0.68% ZB
+ 0.68%
ZP
0.81% ZB
+ 0.54%
ZP
1.29% ZB
+ 0.27%
ZP
1.36% ZB
+ 0.00%
ZP
C 69.1 75.0 57.0 66.0 73.1 67.5 72.5 70.9
O 2.9 7.8 5.4 8.9 9.0 6.6 7.5 7.7
Cl 13.0 15.5 27.6 18.8 12.3 18.4 11.2 12.4
Zn - 1.4 1.8 1.0 0.5 0.7 0.5 0.7
P - 0.2 0.4 0.0 0.0 0.1 0.0 -
B - - 7.8 5.3 5.1 6.9 8.2 8.3
Page 107
91
Table 6.17 Elemental analyses of particles at 160°C for 90 minutes (Average
values).
PVC 1.36%
ZP
0.27% ZB
+ 1.29%
ZP
0.54% ZB
+ 0.81%
ZP
0.68% ZB
+ 0.68%
ZP
0.81% ZB
+ 0.54%
ZP
1.29% ZB
+ 0.27%
ZP
1.36% ZB
+ 0.00%
ZP
C - 64.0 54.8 33.0 56.9 23.6 39.6 67.4
O - 13.7 11.4 21.8 14.2 23.9 23.8 9.7
Cl - 4.1 3.8 2.4 1.8 1.3 2.3 7.9
Zn - 14.4 14.7 29.3 16.2 39.9 25.4 3.4
P - 3.8 4.9 9.5 3.8 6.2 5.6 -
B - - 10.5 4.0 7.1 5.0 3.3 11.6
Table 6.18 Elemental analyses of polymer phase at 160°C for 90 minutes (Average
values).
PVC 1.36%
ZP
0.27% ZB
+ 1.29%
ZP
0.54% ZB
+ 0.81%
ZP
0.68% ZB
+ 0.68%
ZP
0.81% ZB
+ 0.54%
ZP
1.29% ZB
+ 0.27%
ZP
1.36% ZB
+ 0.00%
ZP
C 38.8 77.8 69.1 82.1 84.6 88.9 79.9 77.6
O 3.7 5.1 2.9 6.0 10.2 7.5 8.6 7.9
Cl 7.5 16.5 13.0 6.6 5.1 3.7 11.5 3.8
Zn - 0.5 0.2 0.0 0.0 0.0 0.0 0.5
P - 0.1 0.2 0.0 0.0 0.0 0.0 -
B - - 14.7 5.3 0.0 0.0 0.0 10.2
Page 108
92
CHAPTER 7
CONCLUSIONS
In this study the development of heat stabilizers for PVC from zinc borate and zinc
phosphate was investigated.
Thermogravimetric analyses were done to investigate the mass loss due to the
release of HCl and evaporation of plasticizer DOP. The sample having only 1.36% ZB
and the sample having 0.81% ZB and 0.54% ZP had the highest onset temperatures of
214 and 200°C which are higher than the onset temperature of 180°C of PVC control
sample. The maximum residual mass value of the composition having 1.29% ZB and
0.27% ZP was 26.3% but it is clear that all of the compositions were higher than the
value of the PVC control sample (12.5%).
The thermal stability of the prepared PVC plastigels by means of colour was
determined by static oven test and colour spectrophotometer. It has been observed that
more than one composition has been approved to be synergistic composition according
to the results of static oven test. These colours of the final state of these compositions
were lighter in colour which means a retarded degradation of PVC. Because when PVC
is heated, its colour changes due to the formation of polyene structures. To show this
quantitatively, a spectrophotometer was also used leading to the same result. The
yellowness index is a measure of this concept. The higher or positive numbers indicate
that the sample is going away from whiteness.
The morphology and composition of PVC plastigel films were analyzed in a
scanning electron microscope and energy dispersive X-ray instruments, respectively.
Although there are pores in the micrographs, it is obvious that when the temperature is
increased up to 160°C, the holes disappear and a more homogeneous plastigel is
achieved. It has been observed that the mixing was done thoroughly and the
sedimentation of the particles was not observed. Both PVC polymer and particle phases
were investigated by using EDX. Carbon (C) is reported between 57% and 75% which
is lower than but close to the theoretical weight percentage of carbon in DOP (73.81%)
due to incomplete gelation. A low C content observed for particle phase at 140°C
showed that the particles were coated with the polymer phase. The chlorine (Cl) content
Page 109
93
of the particle phase of films at 140°C was reported between 11.2% and 27.6% which
was lower than the value in PVC (56.74%). These values become lower down to 3.7% -
16.5% when heated at 160°C which indicated dehydrochlorination occurs.
FTIR spectra of the PVC plastigel films were analyzed both at the surface and bulk
phase by transmission and ATR spectroscopy. In all of the spectra it is clear that neither
unheated samples at 140°C for 15 minutes nor heated samples at 160°C for 90 minutes
have lost the peak at 3227 cm-1 which belongs to ZnO•B2O3 meaning that the zinc
borate in the composition has not been changed. The peaks belonging to zinc phosphate
were overlapped by the peaks of PVC.
The PVC plastigel films containing zinc borate and zinc phosphate were studied in
PVC Thermomat instrument to calculate the reaction rates and reaction rate constants at
140°C and at 160°C to evaluate the kinetics of this reaction. The induction time and
stability time values were measured by the help of this instrument. The sample having
0.54% ZB and 0.81% ZP had the highest value of 1.87 h, while the induction time value
of PVC control sample is 1.49 h at 160°C. However the stability time values of PVC
control sample at 140 and 160°C have got higher values when compared with the
compositions which mean that the additives can retard the degradation of PVC in the
beginning but they cannot be able to do so when it begins to degrade. In fact, they
accelerate this reaction. The initial and linear rate constants of the PVC control sample
have got lower values indicating that the reaction is slower in the control sample. The
activation energies of the initial regions have higher values than the activation energies
of the linear region which can be explained by the rapid dehydrochlorination reactions
occurring in the linear region. Due to the presence of zinc borate and zinc phosphate in
the initial region, the activation energies are higher which means that there must be
more energy applied to the system to initiate the reaction when compared with the linear
region.
As a future study, the limiting oxygen index (LOI), mechanical tests and analyses of
gaseous products of degradation by TGA – MS may be carried out to investigate the fire
retardancy of these compositions.
Page 110
APPENDIX
Table A.1 The EDX results of PVC control sample at 140°C for 15 minutes.
No.1 No.2 No.3 Average Standart Deviation C 70.4 82.39 81.26 78.02 6.62 O 6.85 13.60 11.28 10.58 3.43 Cl 15 12.00 7.46 11.49 3.80 Zn 0 0.00 0.00 0.00 0.00 P 0 0.00 0.00 0.00 0.00 B 0 0.00 0.00 0.00 0.00
Table A.2 The EDX results of sample 1.36% ZP only at 140°C for 15 minutes.
Particle Phase Polymer Phase No.1 No.2 Average Standart
Deviation Matrix. 1 Matrix. 2 Average Standart Deviation
C 26.26 12.10 19.18 10.01 75.86 74.18 75.02 1.2 O 24.26 28.24 26.25 2.81 7.91 7.72 7.82 0.1 Cl 0.85 0.52 0.69 0.23 14.12 16.86 15.49 1.9 Zn 37.65 47.79 42.72 7.17 1.76 1.11 1.44 0.5 P 10.98 11.35 11.17 0.26 0.35 0.13 0.24 0.2 B 0.00 0.00 0.00 0.00 0.00 0.00 0.00 0.0
Table A.3 The EDX results of sample 0.27% ZB + 1.29% ZP at 140°C for 15 minutes.
Particle Phase Polymer Phase
No.1 No.2 Average Standart Deviation Matrix. 1 Matrix. 2 Average Standart
Deviation C 15.14 20.90 18.02 4.07 51.81 62.26 57.04 7.4 O 28.83 8.69 18.76 14.24 5.60 5.14 5.37 0.3 Cl 1.00 3.06 2.03 1.46 33.32 21.86 27.59 8.1 Zn 39.99 36.53 38.26 2.45 1.86 1.66 1.76 0.1 P 9.18 19.90 14.54 7.58 0.44 0.36 0.40 0.1 B 5.86 10.92 8.39 3.58 6.97 8.72 7.85 1.2
Table A.4 The EDX results of sample 0.54% ZB + 0.81% ZP at 140°C for 15 minutes.
Particle Phase Polymer Phase
No.1 No.2 Average Standart Deviation Matrix. 1 Matrix. 2 Average Standart
Deviation C 11.85 37.89 24.87 18.41 65.67 66.35 66.01 0.5 O 28.27 22.26 25.27 4.25 7.48 10.32 8.90 2.0 Cl 1.17 4.49 2.83 2.35 20.08 17.45 18.77 1.9 Zn 44.03 25.44 34.74 13.15 0.99 0.91 0.95 0.1 P 12.61 5.79 9.20 4.82 0.00 0.09 0.05 0.1 B 2.07 4.16 3.12 1.48 5.78 4.88 5.33 0.6
94
Page 111
Table A.5 The EDX results of sample 0.68% ZB + 0.68% ZP at 140°C for 15 minutes.
Particle Phase Polymer Phase
No.1 No.2 Average Standart Deviation
Matrix. 1 Matrix. 2 Average Standart
Deviation C 53.54 73.01 63.28 13.77 73.93 72.33 73.13 1.1 O 19.33 6.10 12.72 9.36 8.70 9.25 8.98 0.4 Cl 1.50 4.58 3.04 2.18 12.17 12.48 12.33 0.2 Zn 18.36 2.88 10.62 10.95 0.47 0.49 0.48 0.0 P 3.65 3.06 3.36 0.42 0.00 0.00 0.00 0.0 B 3.62 10.37 7.00 4.77 4.74 5.45 5.10 0.5
Table A.6 The EDX results of sample 0.81% ZB + 0.54% ZP at 140°C for 15 minutes.
Particle Phase Polymer Phase
No.1 No.2 Average Standart Deviation
Matrix. 1 Matrix. 2 Average Standart
Deviation C 63.95 17.10 40.53 33.13 69.47 65.43 67.45 2.9 O 6.57 28.07 17.32 15.20 6.81 6.29 6.55 0.4 Cl 7.44 2.97 5.21 3.16 15.80 20.99 18.40 3.7 Zn 12.34 40.10 26.22 19.63 0.82 0.51 0.67 0.2 P 5.01 9.61 7.31 3.25 0.09 0.08 0.09 0.0 B 4.68 2.15 3.42 1.79 7.01 6.69 6.85 0.2
Table A.7 The EDX results of sample 1.27% ZB + 0.29% ZP at 140°C for 15 minutes.
Particle Phase Polymer Phase
No.1 No.2 No.3 Average Standart Deviation
Matrix. 1 Matrix. 2 Average Standart
Deviation C 11.44 24.59 31.16 22.40 10.04 72.34 72.67 72.51 0.2 O 30.76 25.86 25.65 27.42 2.89 7.55 7.46 7.51 0.1 Cl 0.64 6.04 1.16 2.61 2.98 11.26 11.14 11.20 0.1 Zn 45.51 31.69 32.54 36.58 7.75 0.47 0.61 0.54 0.1 P 11.65 7.15 6.69 8.50 2.74 0.00 0.04 0.02 0.0 B 0.00 4.70 2.81 2.50 2.36 8.37 8.08 8.23 0.2
Table A.8 The EDX results of sample 1.27% ZB + 0.29% ZP at 140°C for 15 minutes.
Particle Phase Polymer Phase
No.1 No.2 Average Standart Deviation
Matrix. 1 Matrix. 2 Average Standart
Deviation C 45.27 58.07 51.67 9.05 70.06 71.81 70.94 1.2 O 27.09 16.55 21.82 7.45 7.45 8.01 7.73 0.4 Cl 2.13 7.18 4.66 3.57 11.97 12.80 12.39 0.6 Zn 15.96 7.11 11.54 6.26 0.87 0.53 0.70 0.2 P 0.00 0.00 0.00 0.00 0.00 0.00 0.00 0.0 B 9.55 11.10 10.33 1.10 9.66 6.84 8.25 2.0
95
Page 112
Table A.9 The EDX results of PVC control sample at 160°C for 90 minutes.
Particle Phase Polymer Phase
No.1 No.2 No.3 Avg. Std.Dev. Matrix. 1
Matrix. 2 Avg. Std.Dev.
C 79.68 73.11 74.21 45.40 41.5 77.61 0.00 38.81 54.9 O 6.79 5.08 4.74 3.32 3.1 7.37 0.00 3.69 5.2 Cl 13.52 21.81 21.06 11.28 10.8 15.02 0.00 7.51 10.6 Zn 0.00 0.00 0.00 0.00 0.0 0.00 0.00 0.00 0.0 P 0.00 0.00 0.00 0.00 0.0 0.00 0.00 0.00 0.0 B 0.00 0.00 0.00 0.00 0.0 0.00 0.00 0.00 0.0
Table A.10 The EDX results of sample having 1.36% ZP only at 160°C for 90 minutes.
Particle Phase Polymer Phase
No.1 No.2 No.3 No.4 No.5 Avg. Std. Dev.
Matrix. 1
Matrix. 2 Avg. Std.Dev.
C 63.65 41.70 37.69 87.58 89.15 63.95 24.4 77.79 78.9 78.35 0.8 O 15.32 20.78 22.51 8.42 1.51 13.71 8.8 5.11 17.59 11.35 8.8 Cl 1.94 5.17 1.80 3.12 8.60 4.13 2.8 16.51 3.34 9.93 9.3 Zn 15.72 25.06 30.31 0.83 0.26 14.44 13.7 0.46 0.17 0.32 0.2 P 3.37 7.29 7.69 0.06 0.49 3.78 3.6 0.13 0 0.07 0.1 B 0.00 0.00 0.00 0.00 0.00 0.00 0.0 0 0 0.00 0.0
Table A.11 The EDX results of sample having 0.27% ZB + 1.29% ZP at 160°C for 90
minutes.
Particle Phase Polymer Phase
No.1 No.2 No.3 No.4 No.5 Avg. Std. Dev.
Matrix. 1
Matrix. 2
Matrix. 3 Avg. Std.Dev.
C 37.71 78.86 77.12 45.60 34.60 54.78 21.6 69.05 76.69 75.22 73.65 4.1 O 22.81 3.48 6.17 3.67 20.71 11.37 9.6 2.85 6.25 6.34 5.15 2.0 Cl 2.04 8.09 2.63 4.17 1.99 3.78 2.6 13.04 4.93 6.22 8.06 4.4 Zn 25.95 0.34 0.27 17.34 29.36 14.65 13.8 0.19 0.29 1.07 0.52 0.5 P 5.31 0.21 0.00 12.03 7.19 4.95 5.1 0.16 0.07 0.14 0.12 0.0 B 6.19 9.01 13.81 17.19 6.15 10.47 4.9 14.72 11.76 11 12.49 2.0
96
Page 113
Table A.12 The EDX results of sample having 0.54% ZB + 0.81% ZP at 160°C for 90 minutes.
Particle Phase Polymer Phase
No.1 No.2 No.3 Avg. Std. Dev. Matrix. 1
Matrix. 2 Avg. Std.Dev.
C 27.12 47.80 24.00 32.97 12.9 82.18 81.98 82.08 0.1 O 22.78 18.49 24.20 21.82 3.0 6.43 5.66 6.05 0.5 Cl 0.82 4.56 1.79 2.39 1.9 5.96 7.21 6.59 0.9 Zn 33.11 18.73 36.04 29.29 9.3 0.00 0.00 0.00 0.0 P 11.47 5.94 11.10 9.50 3.1 0.00 0.00 0.00 0.0 B 4.71 4.48 2.87 4.02 1.0 5.42 5.15 5.29 0.2
Table A.13 The EDX results of sample having 0.68% ZB + 0.68% ZP at 160°C for 90 minutes.
Particle Phase Polymer Phase
No.1 No.2 No.3 No.4 Avg. Std. Dev.
Matrix. 1
Matrix. 2 Avg. Std.Dev.
C 83.17 82.14 33.47 28.73 56.88 29.8 86.89 82.40 84.65 3.2 O 5.83 6.22 23.11 21.81 14.24 9.5 9.72 10.72 10.22 0.7 Cl 1.29 1.65 1.15 3.09 1.80 0.9 3.40 6.88 5.14 2.5 Zn 0.86 0.58 31.98 31.51 16.23 17.9 0.00 0.00 0.00 0.0 P 0.07 0.06 6.94 8.12 3.80 4.3 0.00 0.00 0.00 0.0 B 8.79 9.36 3.36 6.74 7.06 2.7 0.00 0.00 0.00 0.0
Table A.14 The EDX results of sample having 0.81% ZB + 0.54% ZP at 160°C for 90 minutes.
Particle Phase Polymer Phase
No.1 No.2 No.3 Avg. Std. Dev. Matrix. 1
Matrix. 2 Avg. Std.Dev.
C 25.92 30.67 14.24 23.61 8.5 88.99 88.72 88.86 0.2 O 22.90 20.42 28.45 23.92 4.1 7.52 7.45 7.49 0.0 Cl 1.42 1.50 0.99 1.30 0.3 3.49 3.83 3.66 0.2 Zn 30.89 39.86 49.09 39.95 9.1 0.00 0.00 0.00 0.0 P 6.45 4.93 7.22 6.20 1.2 0.00 0.00 0.00 0.0 B 12.43 2.62 0.00 5.02 6.6 0.00 0.00 0.00 0.0
97
Page 114
Table A.15 The EDX results of sample having 1.29% ZB + 0.27% ZP at 160°C for 90 minutes.
Particle Phase Polymer Phase
No.1 No.2 No.3 Avg. Std. Dev. Matrix. 1
Matrix. 2 Avg. Std.Dev.
C 25.62 38.71 54.33 39.55 14.4 81.62 78.21 79.92 2.4 O 29.50 25.12 16.89 23.84 6.4 9.03 8.09 8.56 0.7 Cl 3.21 1.11 2.65 2.32 1.1 9.34 13.70 11.52 3.1 Zn 33.83 26.62 15.62 25.36 9.2 0.00 0.00 0.00 0.0 P 7.84 5.94 3.15 5.64 2.4 0.00 0.00 0.00 0.0 B 0.00 2.50 7.36 3.29 3.7 0.00 0.00 0.00 0.0
Table A.16 The EDX results of sample having 1.36% ZB at 160°C for 90 minutes.
Particle Phase Polymer Phase
No.1 No.2 No.3 No.4 No.5 Avg. Std. dev.
Matrix. 1
Matrix. 2
Matrix. 3 Avg. Std.Dev.
C 70.14 69.92 58.87 65.25 72.97 67.43 5.5 82.61 71.25 79.04 77.6 5.8 O 6.72 8.64 14.19 11.63 7.07 9.65 3.2 8.59 8.45 6.7 7.9 1.1 Cl 11.00 1.19 6.34 11.36 9.84 7.95 4.3 1.81 7.4 2.19 3.8 3.1 Zn 0.46 0.22 12.09 3.66 0.42 3.37 5.1 0.38 0.86 0.12 0.5 0.4 P 0.00 0.00 0.00 0.00 0.00 0.00 0.0 0.0 0.0 0.0 0.0 0.0 B 11.67 20.04 8.51 8.08 9.70 11.60 4.9 6.61 12.04 11.96 10.2 3.1
Table A.17 CIE XYZ and Lab* values of white paper. XYZ values Lab* values 74 90.34 77 2.00 95.8 -9.23
98
Page 115
Table A.18 CIE XYZ and Lab* values of the PVC plastigel films heated at 140°C for 15 minutes.
XYZ Lab XYZ Lab XYZ Lab XYZ Lab XYZ Lab XYZ Lab49,2 76,0 45,6 73,9 48,3 75,7 51,9 77,7 47,9 75,4 48,3 75,649,9 0,7 46,5 -0,1 49,3 -0,1 52,7 0,4 48,8 -0,1 49,2 0,256,4 2,4 49,9 5,0 53,4 4,6 58,6 3,3 53,3 4,2 54,7 3,262,5 83,2 60,4 82,5 57,6 81,0 63,4 84,3 61,5 83,3 62,9 84,162,6 2,5 61,1 1,0 58,5 0,5 64,6 -0,1 62,8 -0,2 64,2 -0,278,7 -3,5 74,2 -1,5 70,2 -0,9 77,4 -0,7 74,2 0,1 76,4 -0,359,4 81,6 54,6 80,6 59,6 83,4 57,8 82,5 56,6 81,9 51,7 79,059,6 2,3 57,7 -0,1 62,9 -0,1 61,6 -0,5 60,0 -0,8 54,9 -1,073,7 -2,6 63,9 -1,8 69,4 -1,6 65,8 -0,1 62,5 1,7 56,4 2,462,9 83,6 59,9 82,3 56,8 80,8 58,9 82,0 57,2 81,1 59,1 82,263,2 2,1 60,9 0,4 58,1 -0,4 60,2 -0,3 58,7 -0,8 60,6 -0,878,6 -2,9 75,3 -2,6 66,9 1,5 71,4 -0,2 67,5 1,5 69,3 1,958,8 81,4 62,2 83,4 62,6 83,6 61,9 83,3 60,7 82,7 62,3 83,759,2 1,8 62,8 1,4 63,2 1,4 62,6 1,2 61,7 0,5 63,5 0,272,4 -1,9 77,6 -2,6 78,5 -2,8 76,9 -2,2 73,7 -0,6 76,8 -1,358,4 81,1 52,9 79,5 53,8 80,0 55,0 80,8 55,7 81,3 53,2 79,858,6 2,3 55,7 0,1 56,8 -0,1 58,1 -0,3 59,0 -0,6 56,3 -0,473,3 -3,2 63,8 -3,6 64,6 -3,3 62,8 -0,4 63,4 0,0 61,2 -0,765,6 84,7 55,9 81,3 58,6 82,8 54,6 80,6 53,9 80,3 55,7 81,465,5 3,2 59,1 -0,2 61,7 0,1 57,8 -0,4 57,1 -0,7 59,3 -1,383,8 -4,7 64,8 -1,2 67,6 -1,1 61,5 0,5 60,4 0,8 61,4 2,067,0 85,5 62,3 83,5 65,1 85,0 61,3 83,1 64,4 84,7 54,2 80,267,0 2,8 63,1 1,0 66,1 0,7 62,3 0,4 65,4 0,6 57,0 -4,184,7 -3,9 80,7 -4,5 82,3 -3,1 76,7 -2,3 81,0 -2,7 43,3 22,7
0.68
%
ZB
+ 0.
68 Z
P
0.81
%
ZB
+ 0.
54%
Z
P
1.29
%
ZB
+ 0.
27%
Z
p
1.36
%
ZB
PVC
C
ontr
ol1.
36%
Z
P
0.27
%
ZB
+ 1.
29%
Z
P
0.54
%
ZB
+ 0.
81%
Z
P
75' 90'15' 30' 45' 60'
99
Page 116
Table A.19 CIE XYZ and Lab* values of the PVC plastigel films heated at 160°C for 90 minutes.
XYZ Lab XYZ Lab XYZ Lab XYZ Lab XYZ Lab XYZ Lab54,8 80,58 59,1 83,02 59,4 83,17 60,2 83,61 52,7 79,46 62,9 83,5257,7 0,19 62,2 0,37 62,5 0,4 63,3 0,38 55,7 -0,42 63,2 2,3
65,9 -3,44 69,7 -2,48 70,8 -3,11 71,7 -3,07 66,3 -5,74 75 -0,2361,2 84,29 59,8 83,47 59,9 83,38 58 82,62 48,8 77,53 59,9 82,364,6 -0,13 63,1 0,02 62,9 0,58 61,4 -0,58 52,4 -2,37 60,8 0,59
74 -3,8 72,3 -3,83 73,2 -4,71 67,9 -1,66 40,1 17,17 75,3 -2,5666,9 87,06 65,5 86,35 68,3 87,66 43,6 73,65 60,1 83,96 53,4 79,4170,1 0,85 68,7 0,74 71,4 1,4 46,2 -0,34 64 -1,42 55,6 -2,94
82,7 -5,67 82,1 -6,43 86,7 -7,56 51,5 -2 56,1 11,19 45,2 19,3258,3 82,57 57,4 82,1 55,9 81,3 57,6 82,22 55,3 80,95 60,5 82,6861,4 0,34 60,5 0,14 59 -0,1 60,7 0,04 58,4 -0,19 61,6 0,471,7 -4,85 69,3 -3,7 66,3 -2,6 69,2 -3,47 65,1 -2,13 75,9 -2,3763,8 85,38 69,7 88,31 45,5 74,89 37,4 67,81 30,4 61,15 28,5 59,3866,8 1,27 72,7 1,55 48,1 -0,27 37,7 5,51 29,4 9,86 27,4 6,3778,2 -5,2 88,2 -7,52 22,3 38,28 11,4 49,79 6,6 54,25 6,8 52,8362,9 85,05 61,4 84,21 51,1 78,24 60,9 83,91 61,1 84,09 60,1 82,3266,1 0,57 64,5 0,76 53,6 0,78 63,9 0,67 64,2 0,39 60,9 0,8778,4 -5,92 76,5 -5,9 64,1 -5,93 75,2 -5,38 74,9 -4,82 76 -3,08
61 83,94 61,5 84,3 57,6 82,15 59,9 83,57 57,4 82,1 59,7 82,2364 0,76 64,6 0,48 60,6 0,37 63,2 -0,09 60,5 0,12 60,7 0,42
75,8 -5,79 75,3 -4,81 70,1 -4,33 70,9 -2,5 68,7 -3,19 74,2 -1,961,6 84,39 58,5 82,73 61,3 84,08 60,9 84,09 65,8 86,96 37,3 67,9264,8 0,28 61,7 0,11 64,2 0,95 64,2 -0,11 69,9 -1,06 37,9 0,5675,8 -5,04 70,9 -3,97 76,4 -6 73,5 -3,7 65,8 7,62 15,7 42,7
0.68
%
ZB
+ 0.
68 Z
P
0.81
%
ZB
+ 0.
54%
Z
P
1.29
%
ZB
+ 0.
27%
Z
p
1.36
%
ZB
PVC
C
ontr
ol1.
36%
Z
P
0.27
%
ZB
+ 1.
29%
Z
P
0.54
%
ZB
+ 0.
81%
Z
P
75' 90'15' 30' 45' 60'
100
Page 117
101
REFERENCES
• Atakul S., “Synergistic Effect of Zinc Stearate and Natural Zeolite on PVC
Thermal Stability”, 2004.
• Babrauskas V., SFPE Technology Report 84-10, Society of Fire Protection
Engineers, Boston, Mass., 1984 in Kirk-Othmer Encyclopedia of Chemical
Technology, 1994.
• Baltacıolu H., Balköse D., “Effect Of Zinc Stearate And/Or Epoxidized
Soybean Oil On Gelation And Thermal Stability of PVC-DOP Plastigels”,
Journal of Applied Polymer Science, Vol.74, 2488 – 2498, 1999.
• Basfar, A.A., “Flame Retardancy Of Radiation Cross-Linked Poly(Vinyl
Chloride) (PVC) Used As An Insulating Material For Wire And Cable”,
Polymer Degradation and Stability, 77, 221 – 226, 2002.
• Beltran M.I., Garcia J.C., Marcilla A., Hidalgo M., Mijangos C., “Thermal
Decomposition Behaviour of Crosslinked Plasticized PVC”, Polymer
Degradation and Stability, 65, 65 -73, 1999.
• Bowen, 1985; Jenkner et.al., 1985 in Encyclopedia of Industrial Chemistry,
1988.
• Byrne G.A., Gardiner D., Holmes F.H., Journal of Applied Chemistry, 16, p.81
1966 in Kirk-Othmer Encyclopedia of Chemical Technology, 1994.
• Carty S., White S., “Flammability Studies On Plasticized Chlorinated
Poly(Vinyl Chloride)”, Polymer Degradation And Stability, 63, 455 – 463, 1999.
• Cella J.A., “Zinc Borate As A Smoke Suppressant”, UK.Patent No.2193216 A,
1986.
• Chaplin D., “Fire-retardant Compositions”, US.Patent No.5338791, 1994.
• Chauffoureaux J.C., Dehennau C, Journal of Rheology, 23(1), 1-24, 1979.
• Dickens E.D., “Smoke Retardant Vinyl Chloride And Vinylidene Chloride
Polymer Compositions”, US.Patent No.3965068, 1976.
• Elcik R.G., “Fire Retardant Polyvinyl Chloride Containing Compositions”,
US.Patent No.3983290, 1976.
Page 118
102
• Ferm D.J., Shen, K.K., “The Effect of Zinc Borate in Combination with
Ammonium Octamolybdate or Zinc Stannate on Smoke Suppression in Flexible
PVC”, Journal of Vinyl & Additive Technology, Vol.3, No.1, 33 – 41, 1997.
• Frost R.L., “An Infrared and Raman Spectroscopic Study of Natural Zinc
Phosphates”, Spectrochimica Acta, Elsevier, 2003.
• Giudice C.A., Benitez J.C., “Zinc Borates As Flame-retardant Pigments In
Chlorine-containing Coatings”, Progress In Organic Coatings, 42, 82 – 88, 2001.
• Gökçel H.., Balköse D., “Thermal Degradation of Poly(Vinyl Chloride)
Plastigels”, Advances In Polymer Technology Vol.17, No.1, 63 – 71, 1998.
• Hilado C.J., Flammability Handbook for Plastics, 2nd ed., Technomic
Publications, Lancaster, Pa., 1974 in Kirk-Othmer Encyclopedia of Chemical
Technology, 1994.
• Jimenez A., Iannoni A., Torre L.and Kenny J.M., “Kinetic Modelling Of The
Thermal Degradation of Stabilized PVC Plastisols”, Journal of Thermal analysis
and calorimetry,Vol.61, 483 – 491, 2000.
• Jimenez A., Torre L., Kenny J.M., “Thermal Degradation of Poly(Vinyl
Chloride) Plastisols Based On Low-migration Polymeric Plasticizers”, Polymer
Degradation And Stability, 73, 447 – 453, 2001.
• Kirk-Othmer Encyclopedia of Chemical Technology, Vol.10 and Vol.4, 4th ed.,
John Wiley and Sons, 910 – 961 and 407 – 408,1994, N.Y.
• Kirk-Othmer Encyclopedia of Chemical Technology, Vol.22, 2nd ed., John
Wiley and Sons, 606, 1970, N.Y.
• Levine I.N., “Physical Chemistry”, 4th ed.,McGraw Hill, Singapore, 1995.
• Li B., “An Investigation of The Smoke Suppression and The Thermal
Degradation In The Smouldering Mode of Poly(Vinyl Chloride) Containing A
Combination of Cuprous Oxide And Molybdenum Trioxide”, Polymer
Degradation And Stability, 74, 195 – 199, 2001.
• Linsky L.A., “Flame Retardant Compositions”, US.Patent No.5886072, 1999.
Page 119
103
• Ning Y., Guo S.,”Flame-retardant and smoke suppressant properties of zinc
borate and aluminium trihydrate-filled rigid PVC”, Journal of Applied Polymer
Science, Vol.77, 3119 – 3127, 2000.
• Pi H., Guo S., Ning Y., “Mechanochemical improvement of the flame-retardant
and mechanical properties of zinc borate and zinc borate-aluminium trihydrate-
filled poly(vinyl chloride).”, Journal of Applied Polymer Science, Vol.89, 753 –
762, 2002.
• Rice P. and Adam H., “Developments in PVC Production and Processing”,
Applied Science Publishers, London, Ch.5, 1977.
• Sawada H., “Zinc Borate, and Production Method and Use Thereof”, European
Patent Application No.EP 1 205 439 A1, 2002.
• Schubert D.M., “Zinc Borate”, US.Patent No.5472644, 1995.
• Schubert D.M., “Process of Making Zinc Borate and Fire-retardant
Compositions Thereof”, US.Patent No.5342553, 1994.
• Shen K.K., Griffen T.S., Nelson G.L., Fire and Polymers ACS Symposium
Series 245, American Chemical Society, Washington D.C., p.157, 1990 in Kirk-
Othmer Encyclopedia of Chemical Technology, 1994.
• Tekta E., Mergen A., “Çinko Borat”, Etibank, 10 – 12, 2003.
• Titow W.V., “PVC Technology”, 4th Edition, Elsevier Applied Science
Publishers, London and New York, 1985.
• Ullmann’s Encyclopedia of Industrial Chemistry, Vol.A11, 5th ed., VCH
Publication, 123 – 139,1988, Weinherm
• Vrandecic N.S., Klaric I., Roje U., “Effect of Ca/Zn Stabiliser On Thermal
Degradation of Poly(Vinyl Chloride)/Chlorinated Polyethylene Blends”,
Polymer Degradation And Stability, 74, 203 – 212, 2001.
• Woods W.G., “Halogenated Polymeric Compositions Containing Zinc Borate”,
US.Patent No.3718615, 1973,
• Xie R., Qu B., Hu K., “Dynamic FTIR Studies of Thermo Oxidation of
Expandable Graphite-based Halogen-free Flame Retardant LLDPE Blends”,
Polymer Degradation and Stability, 72, 313 – 321, 2001.


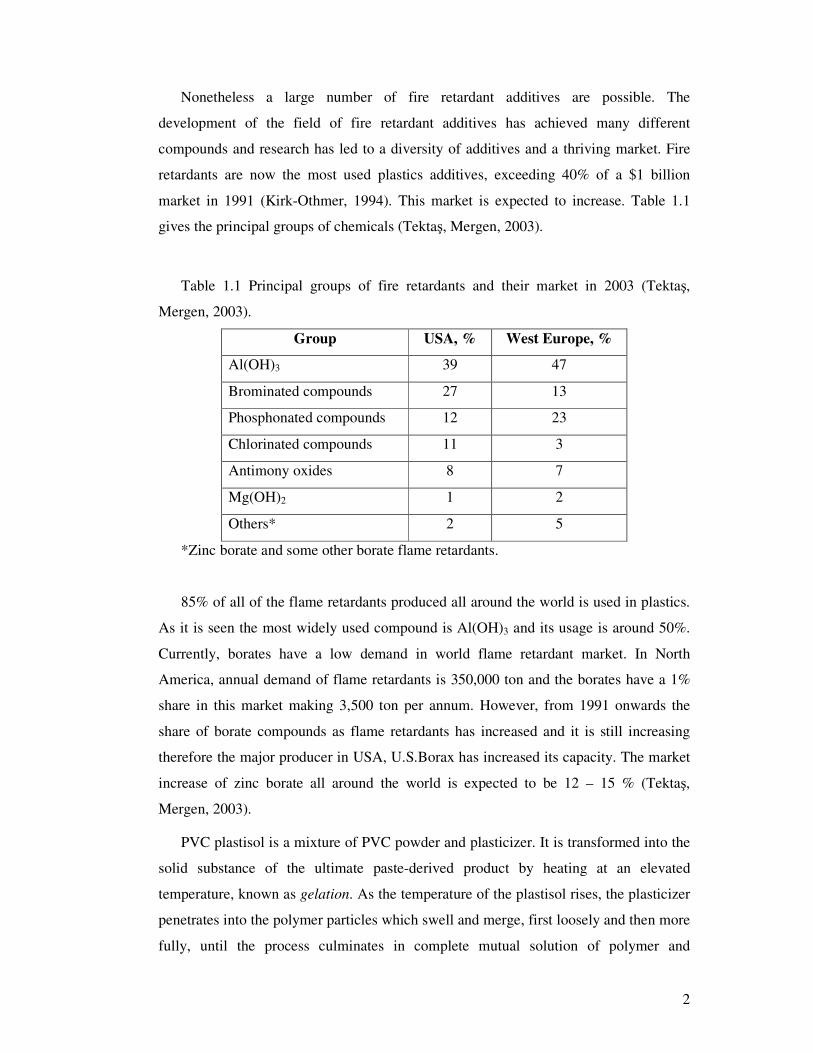


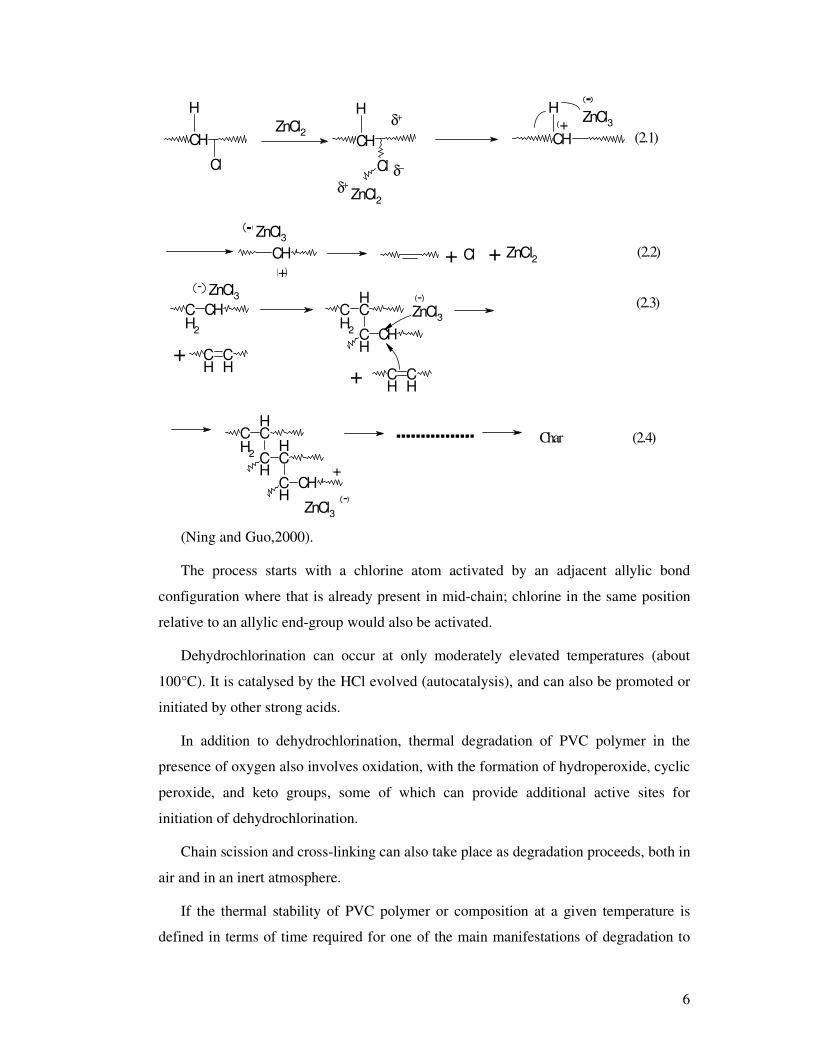

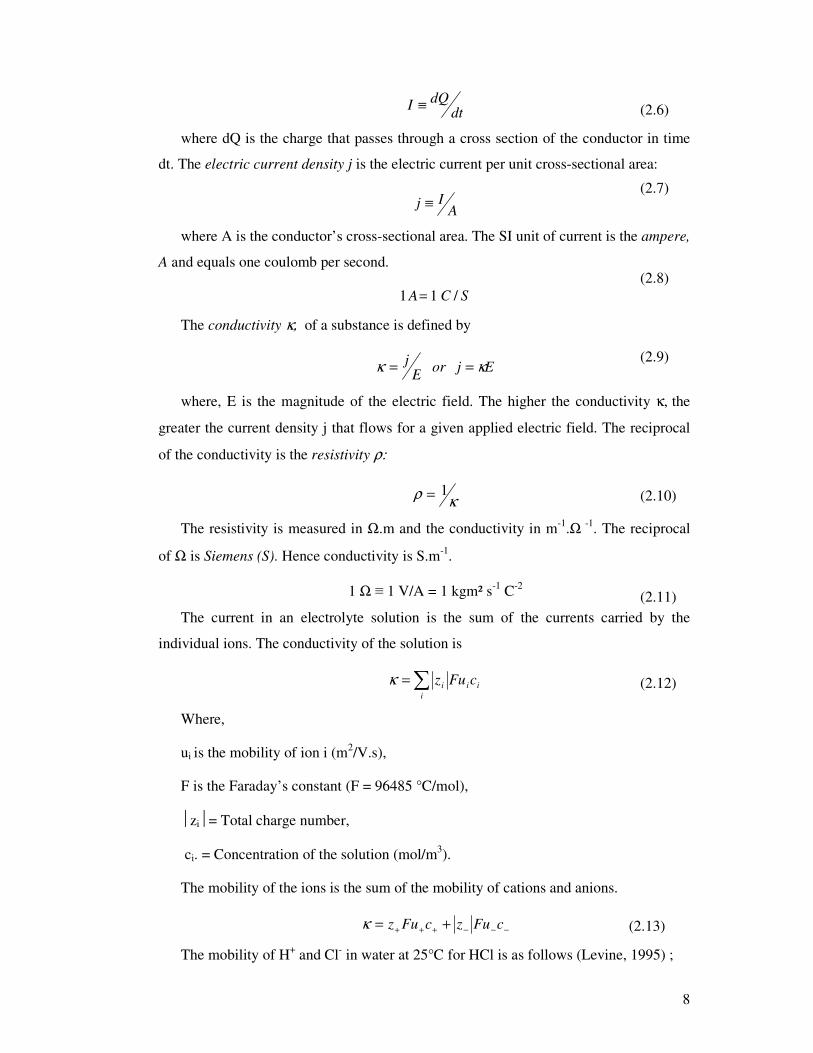

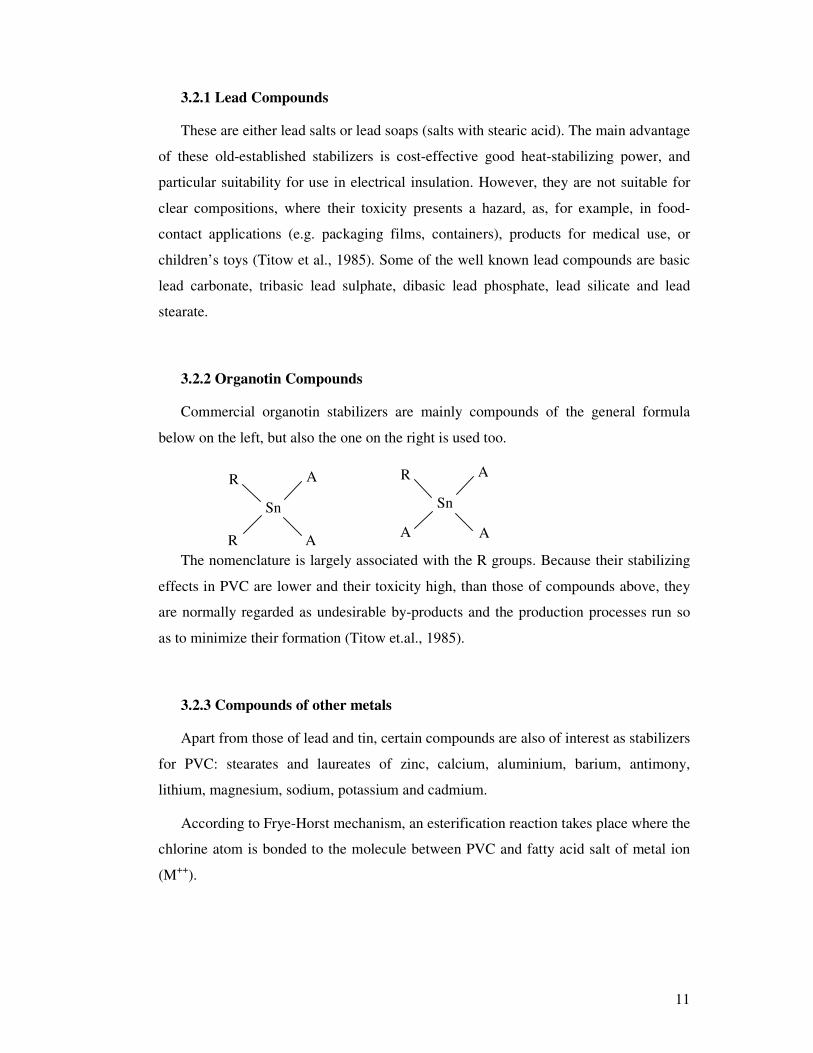
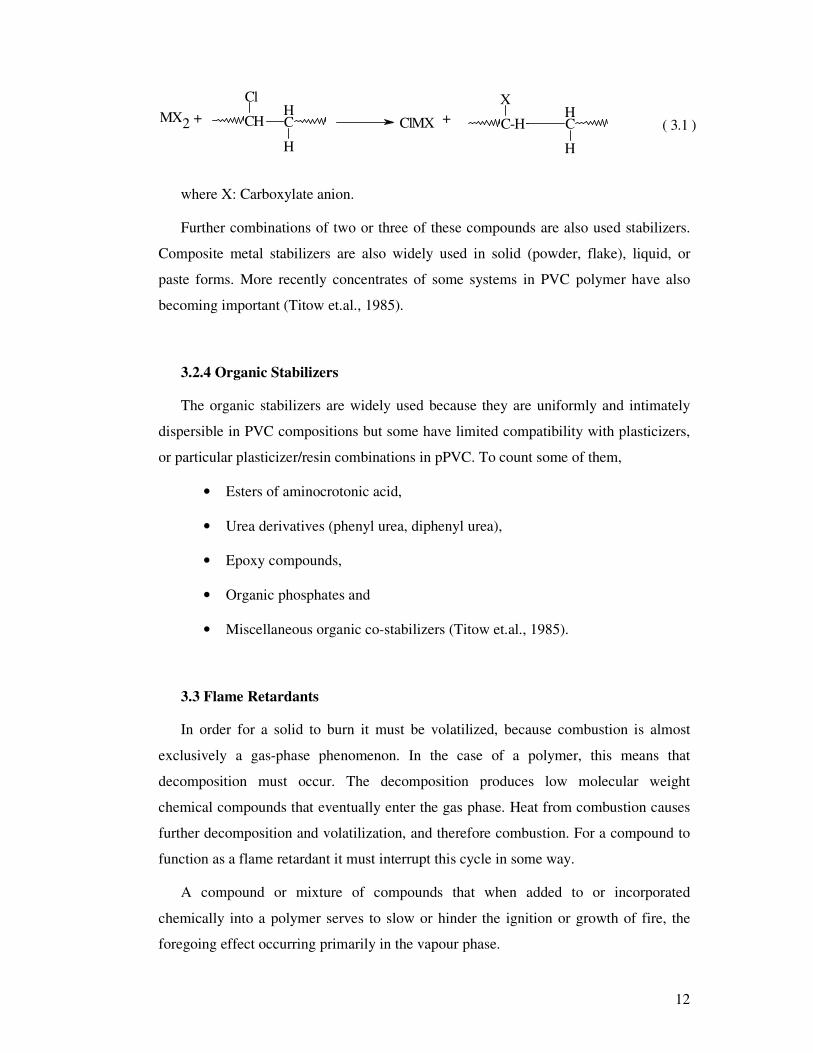


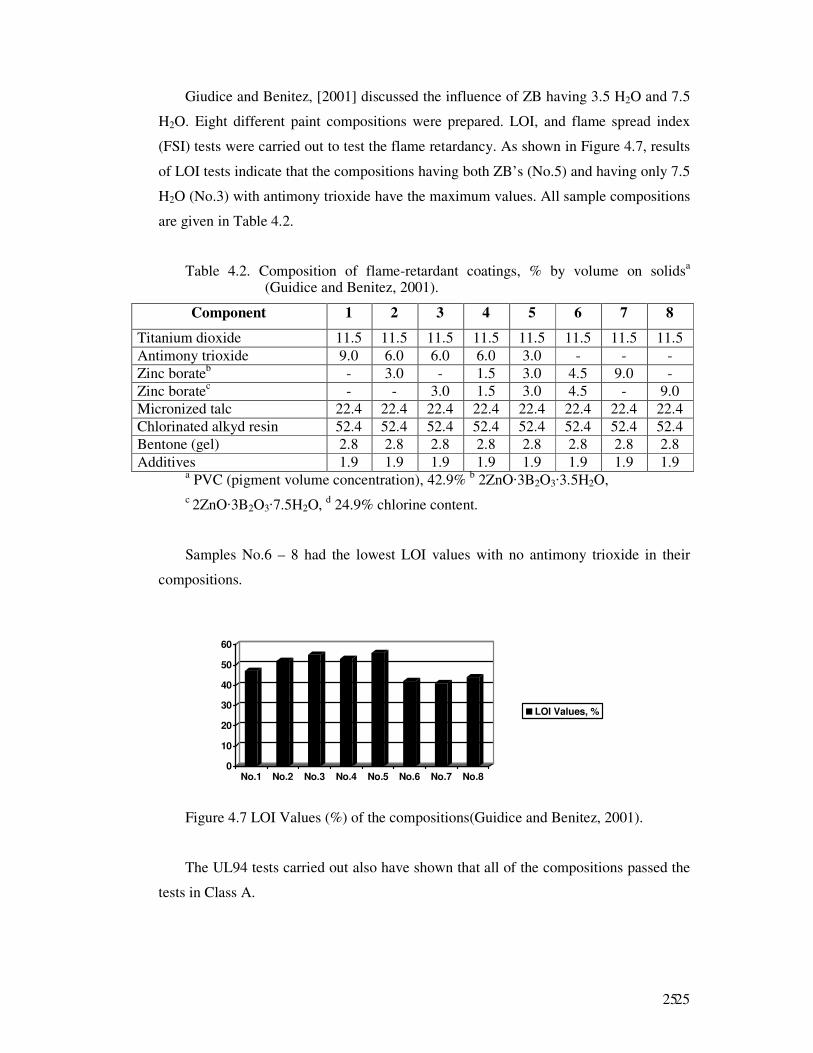


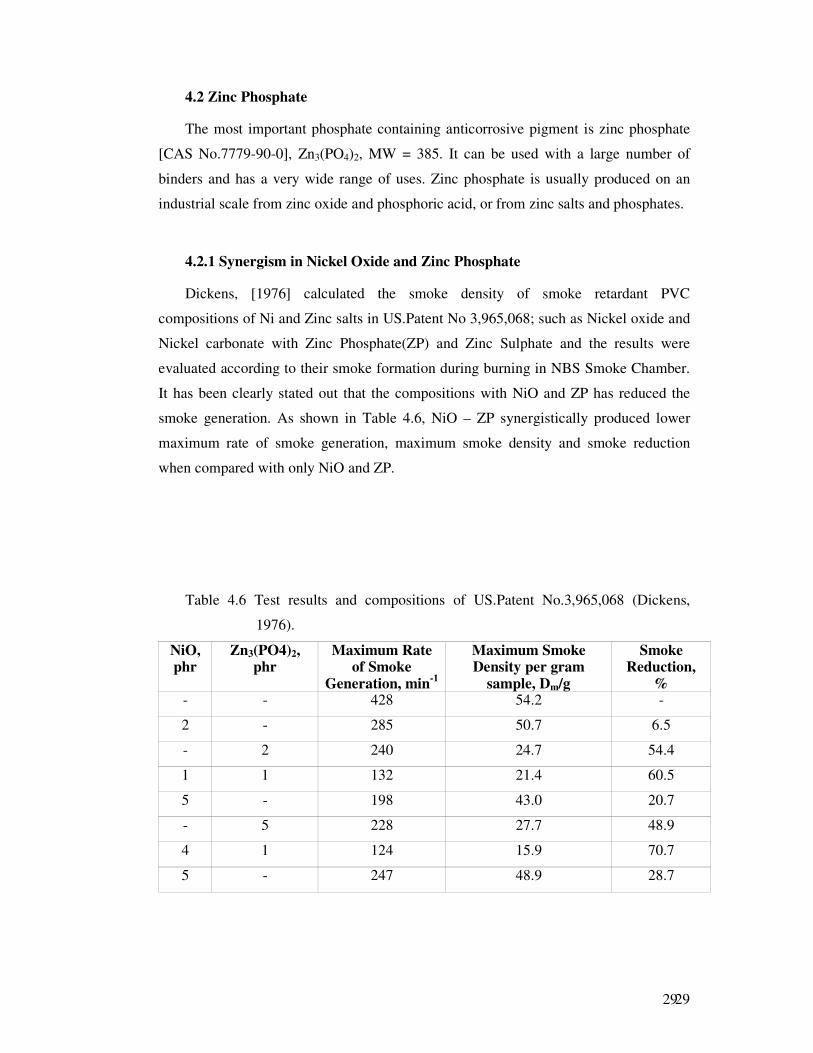
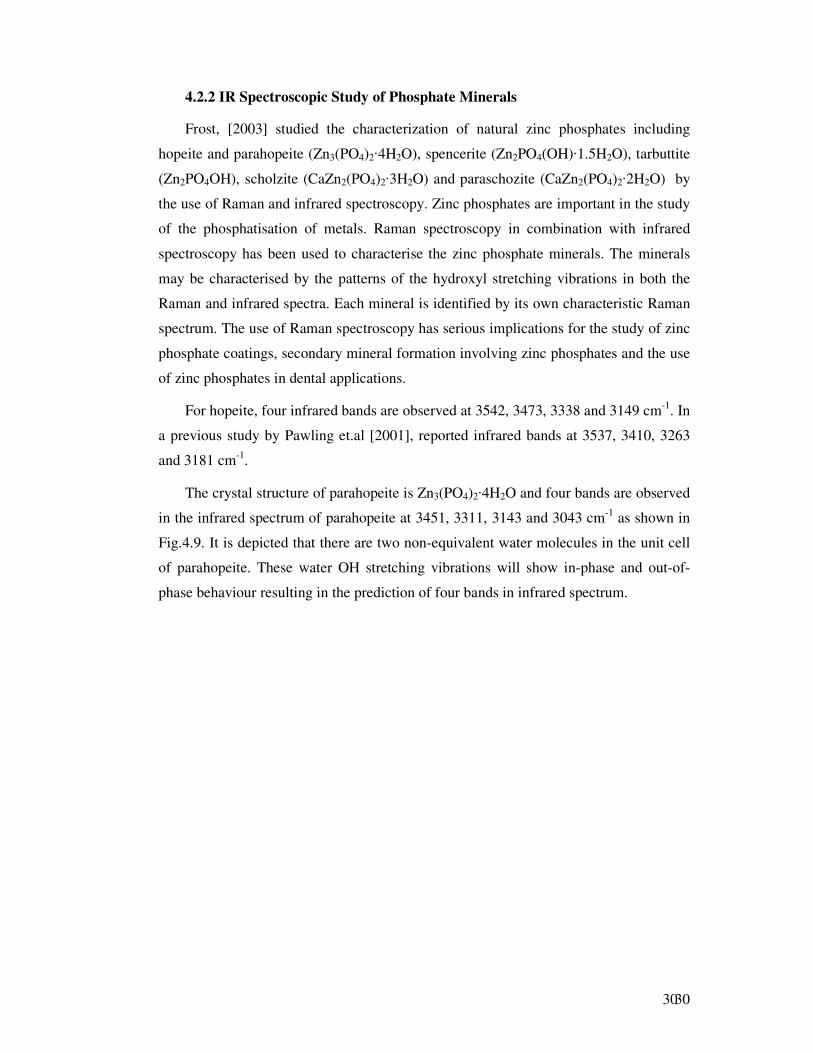


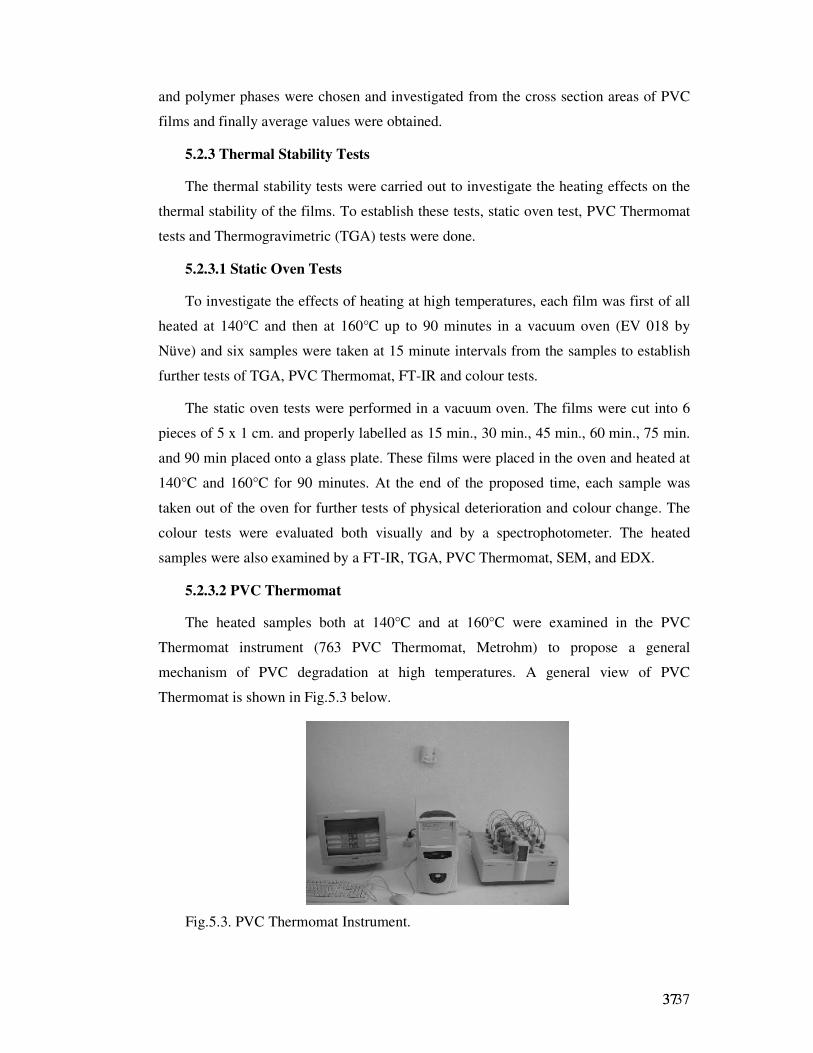


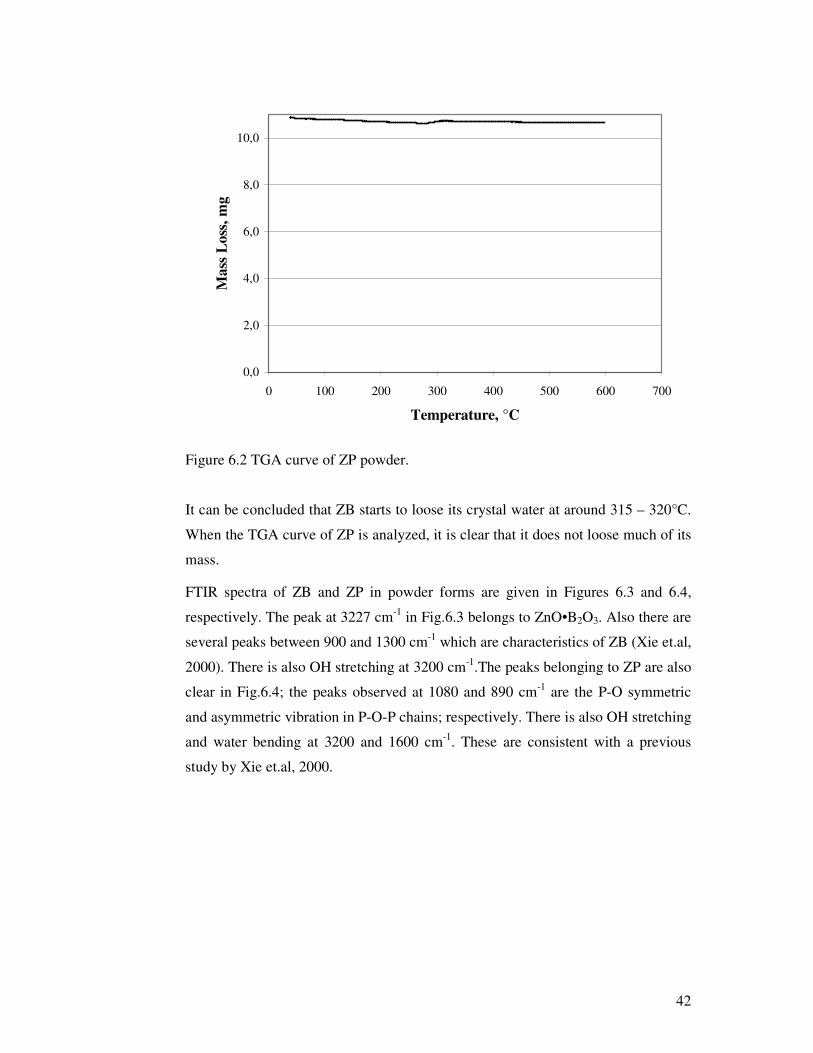


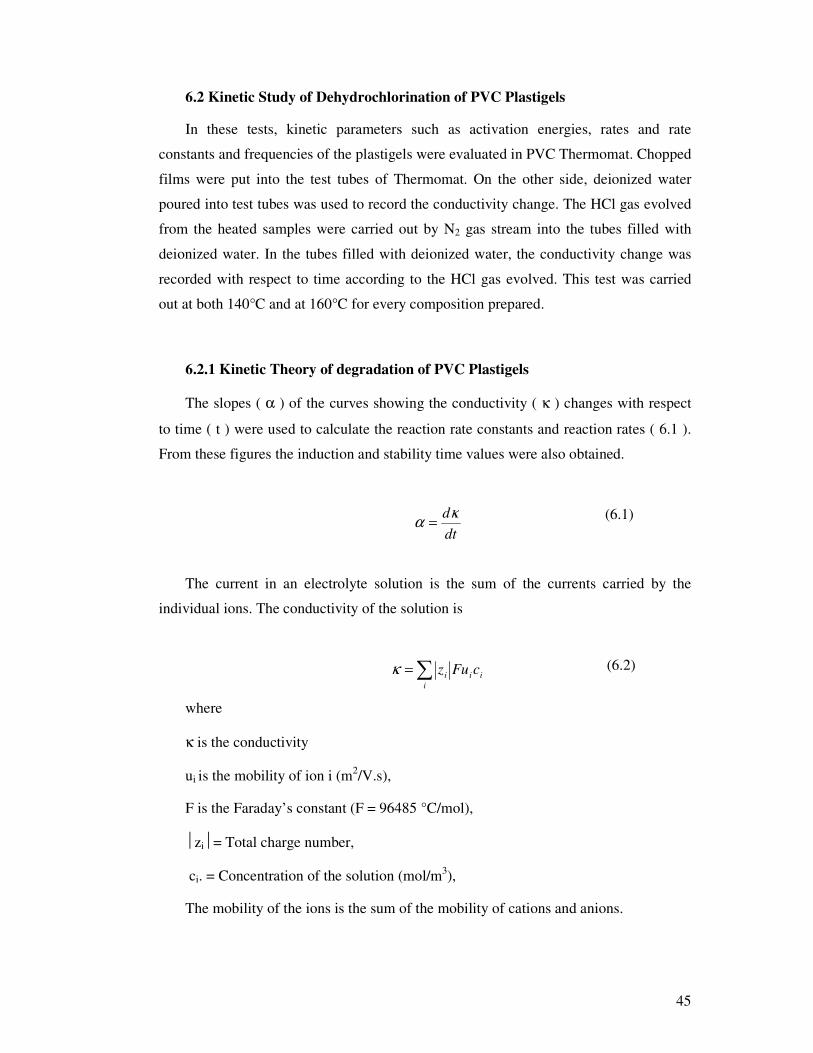


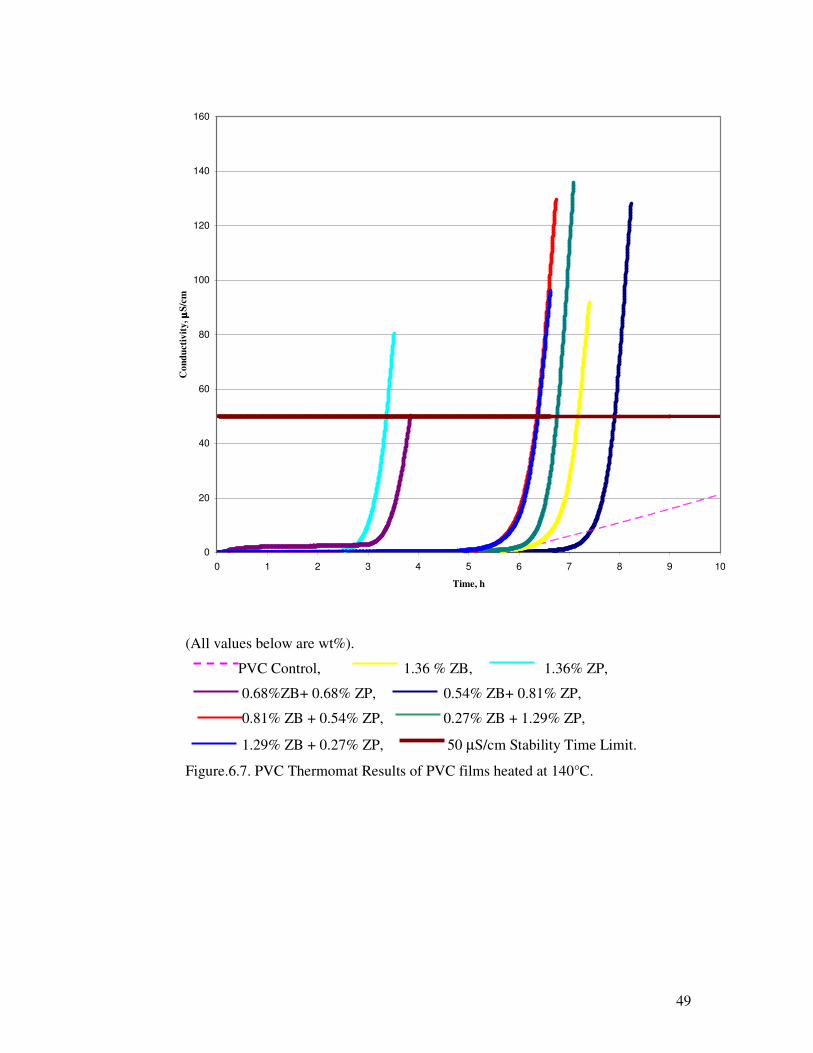

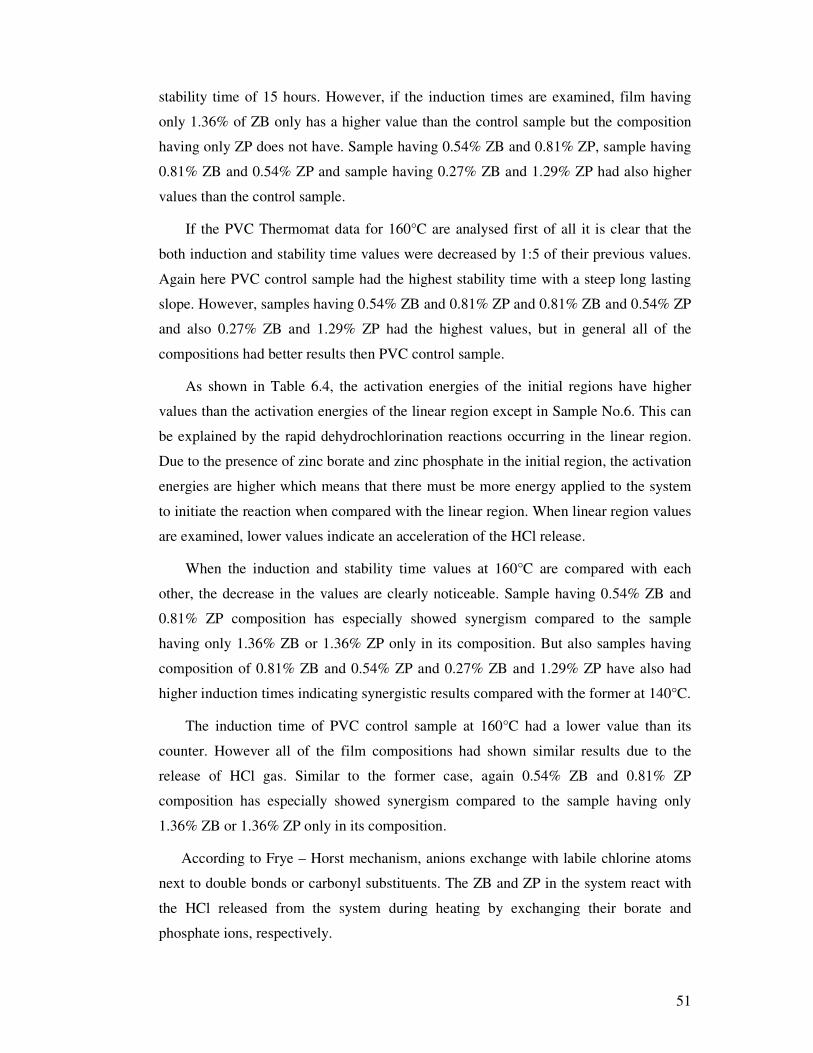


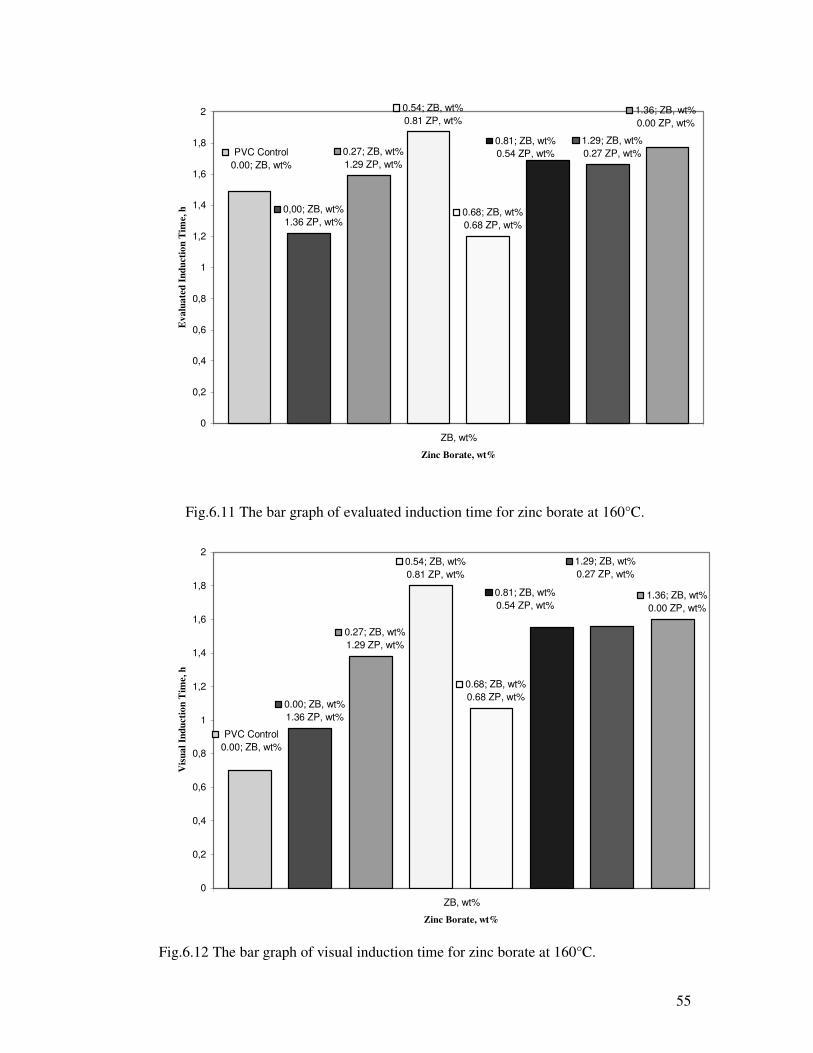


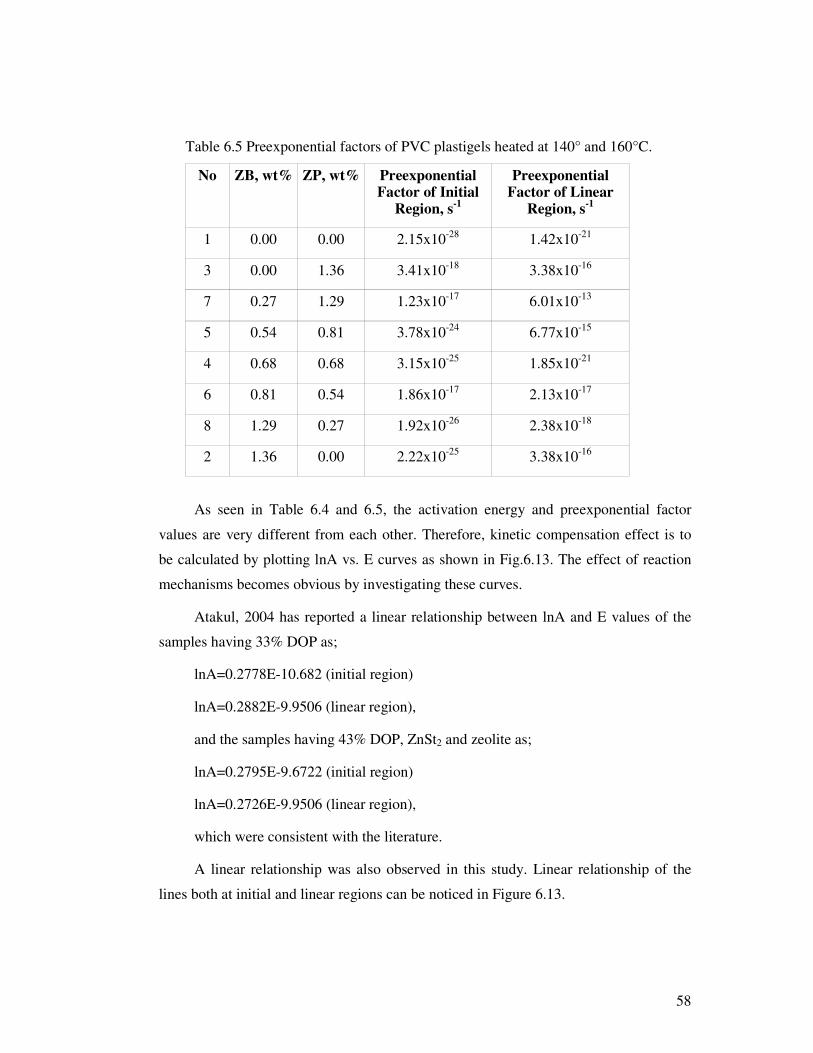


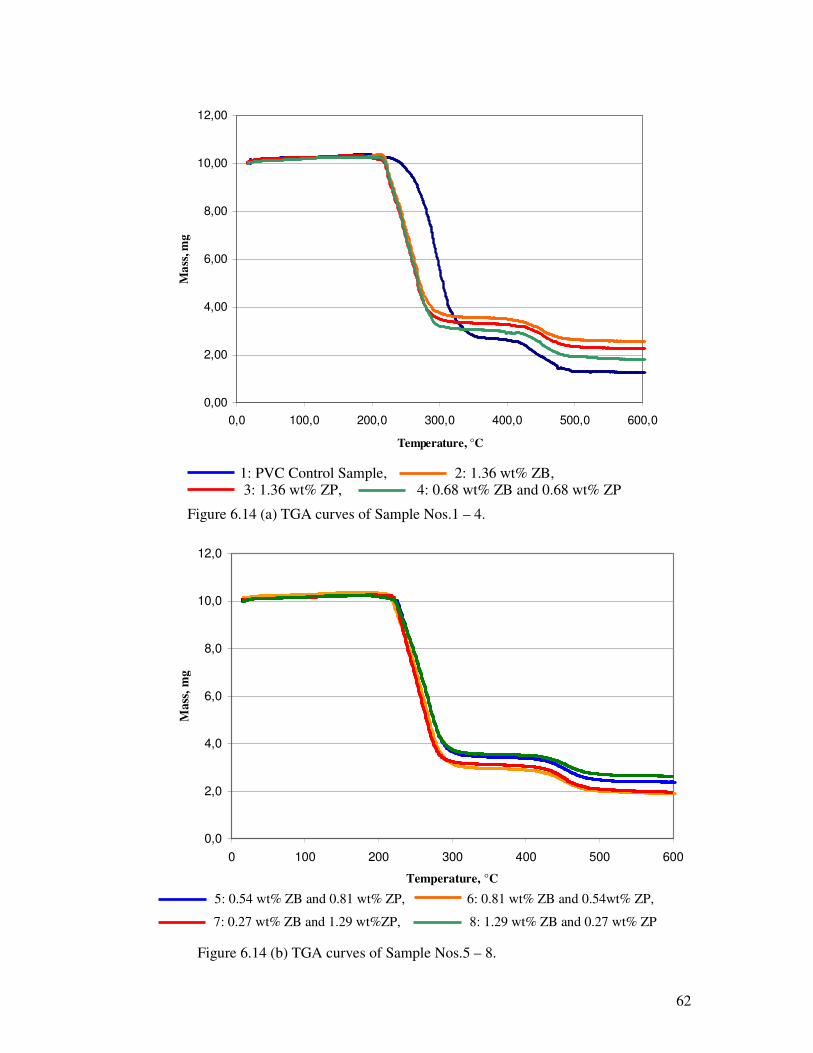
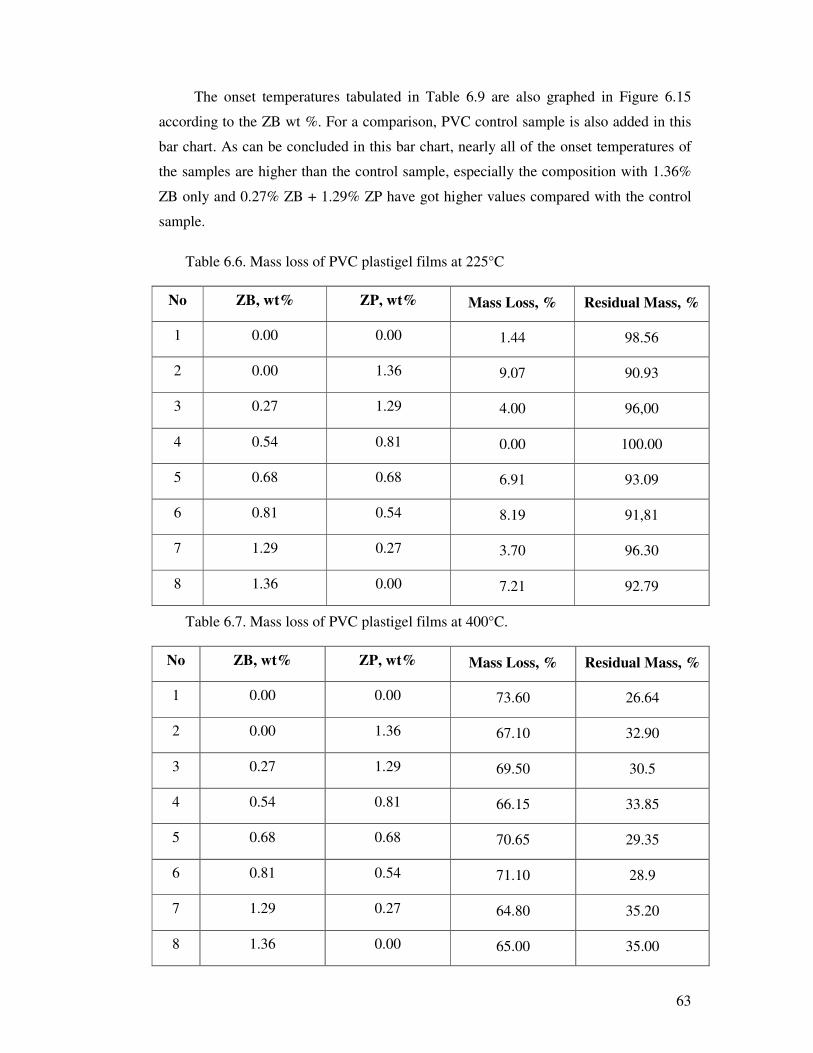
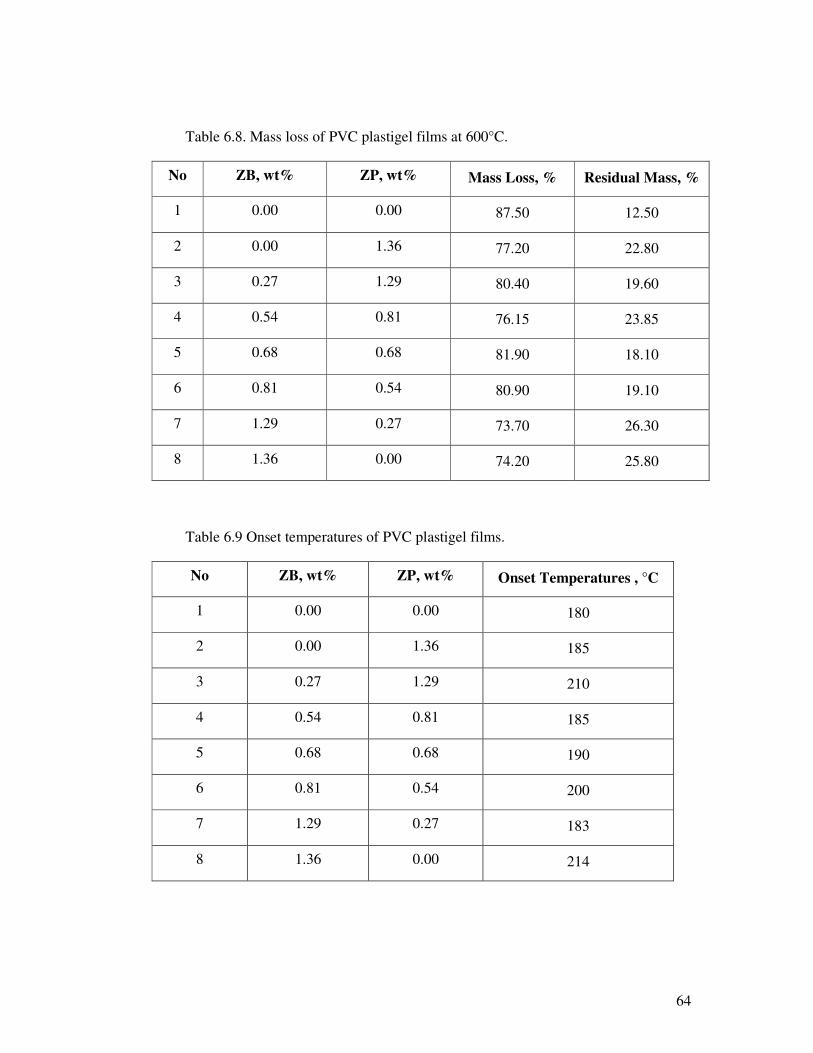


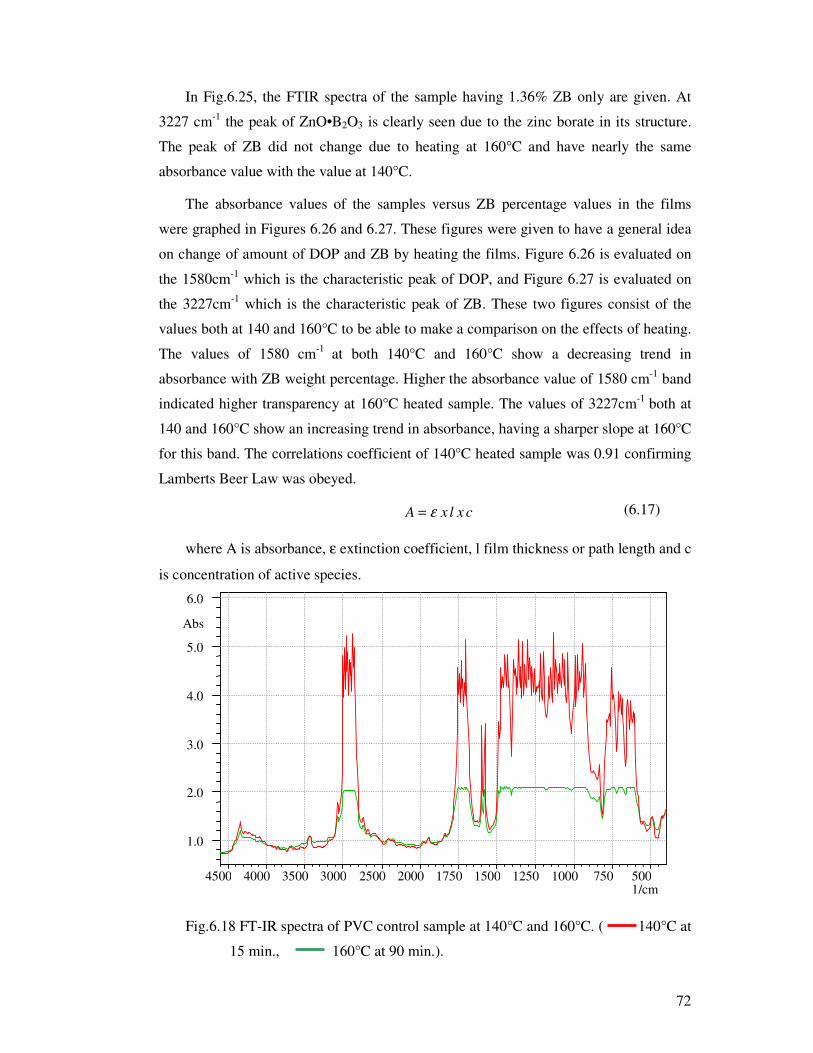

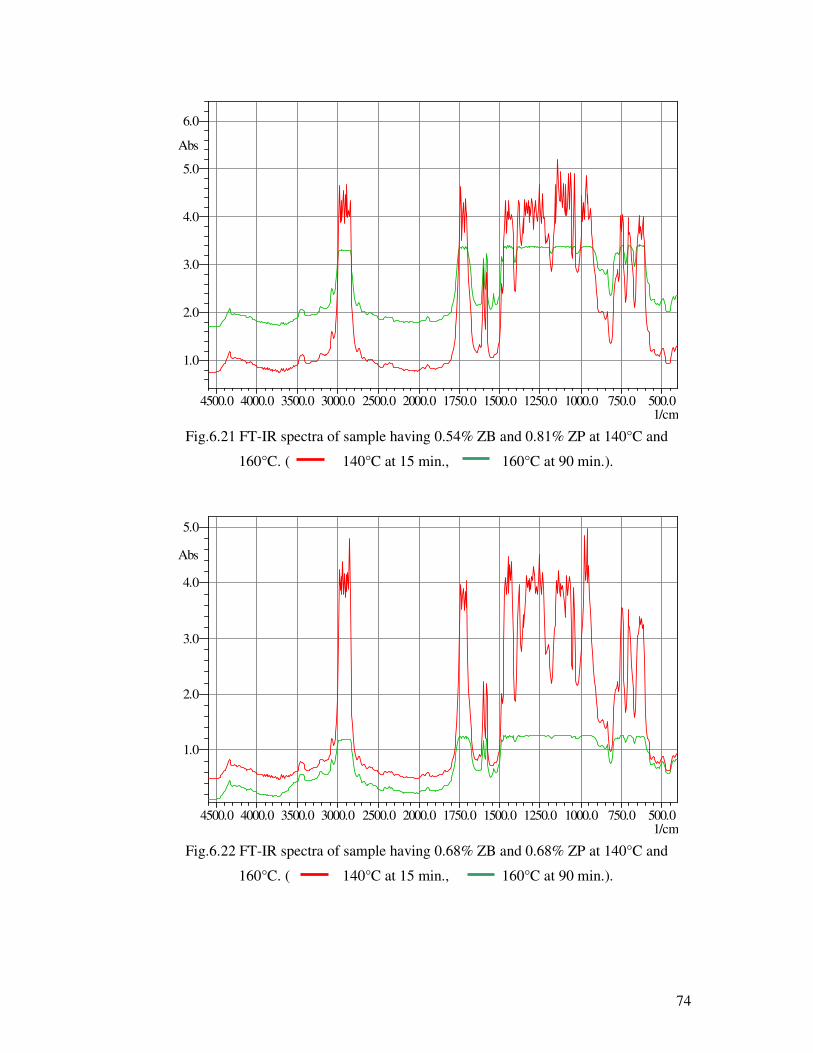

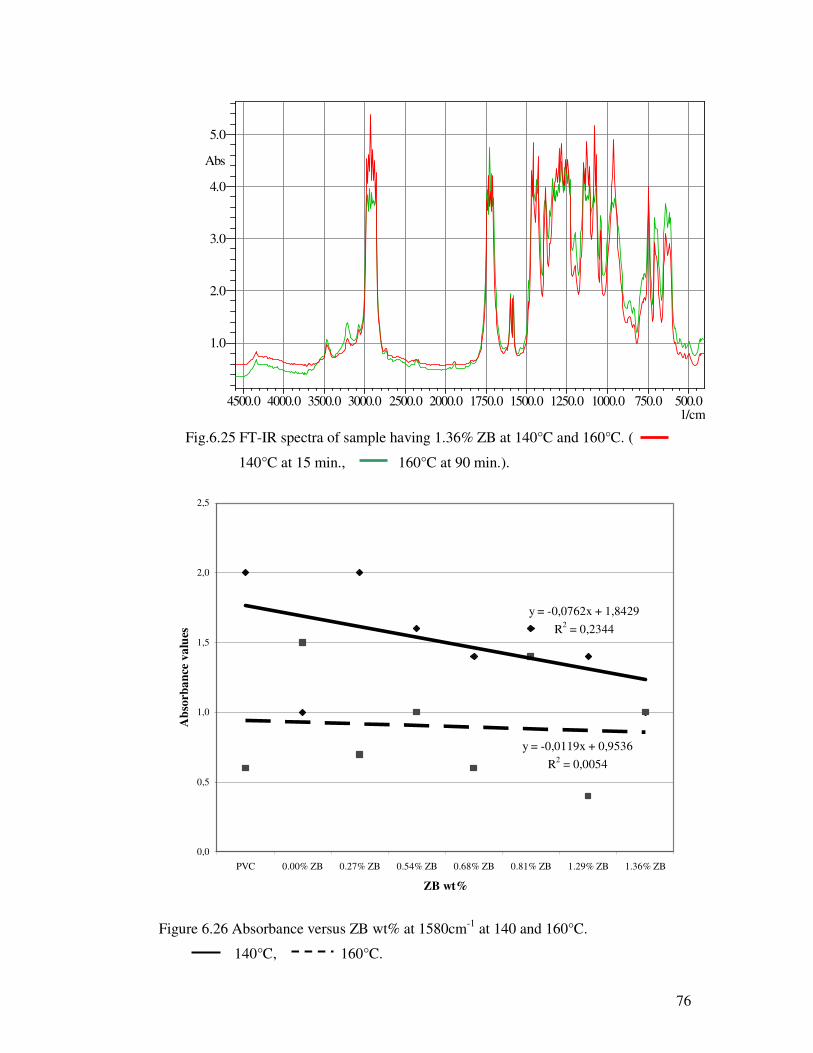
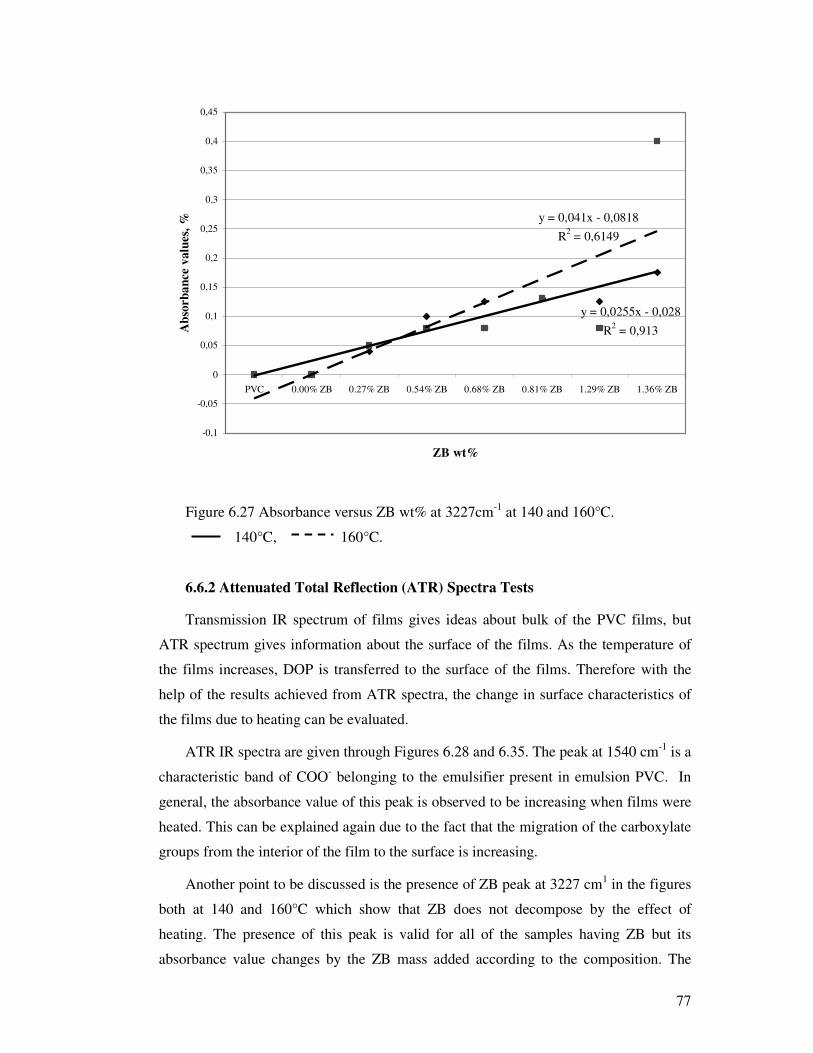


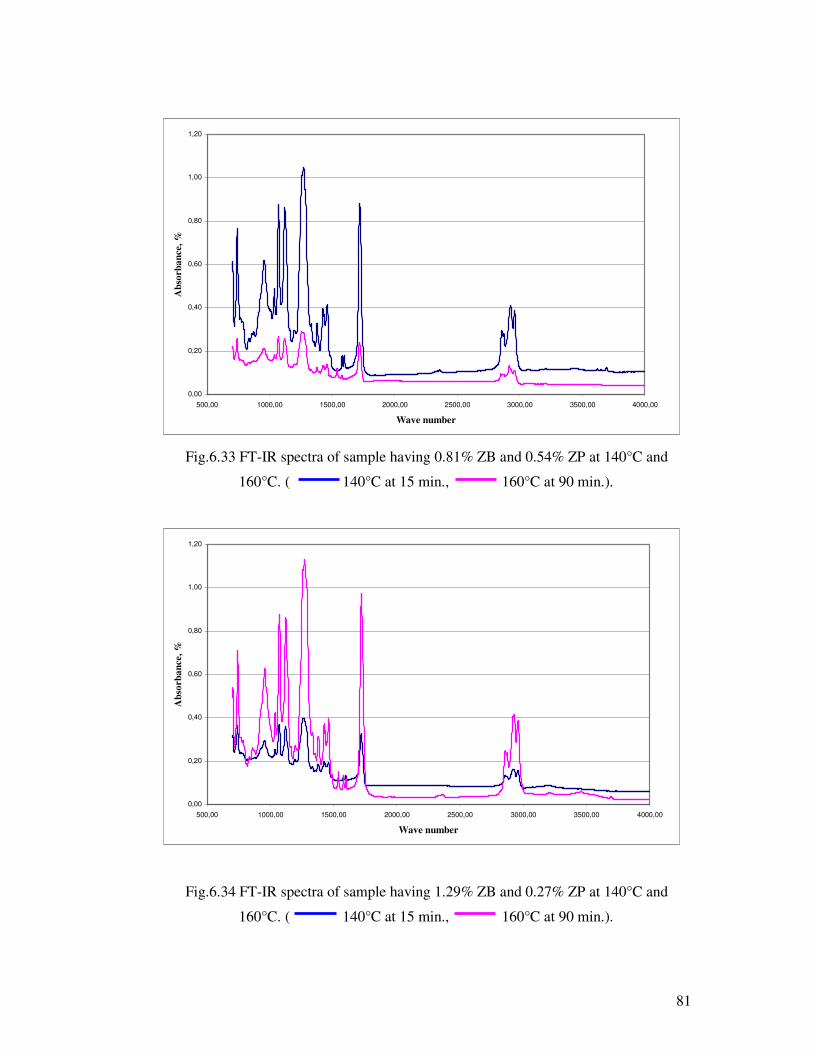
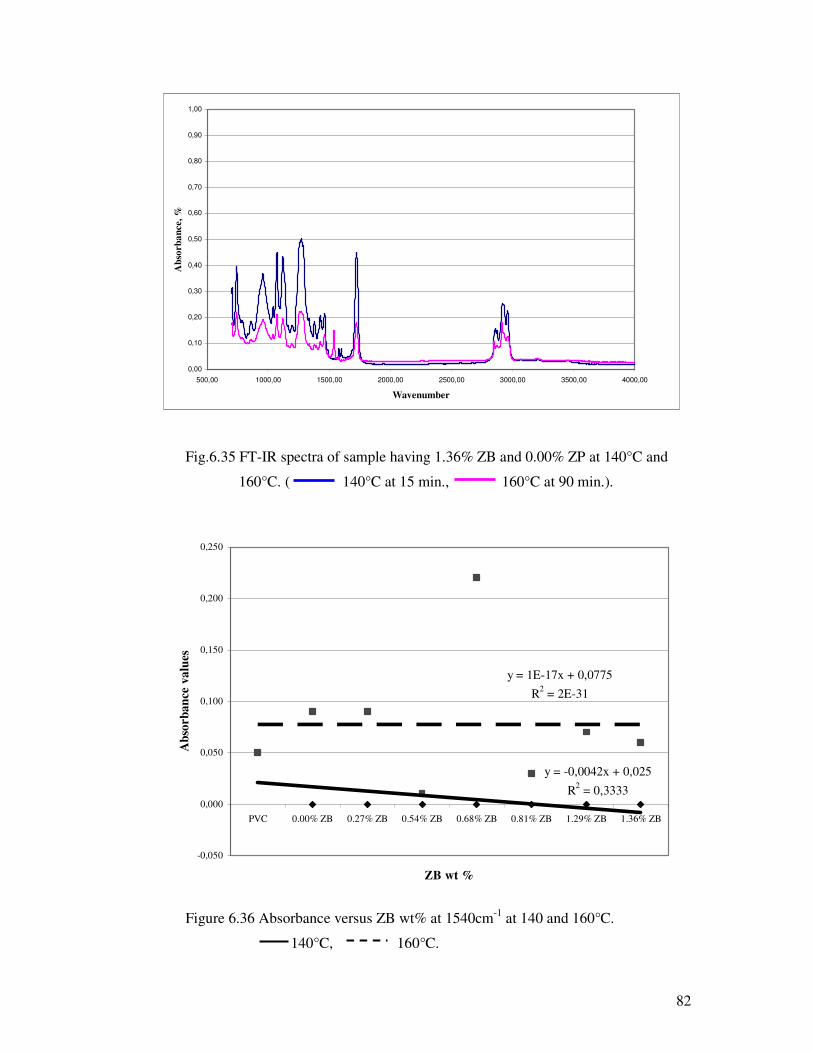


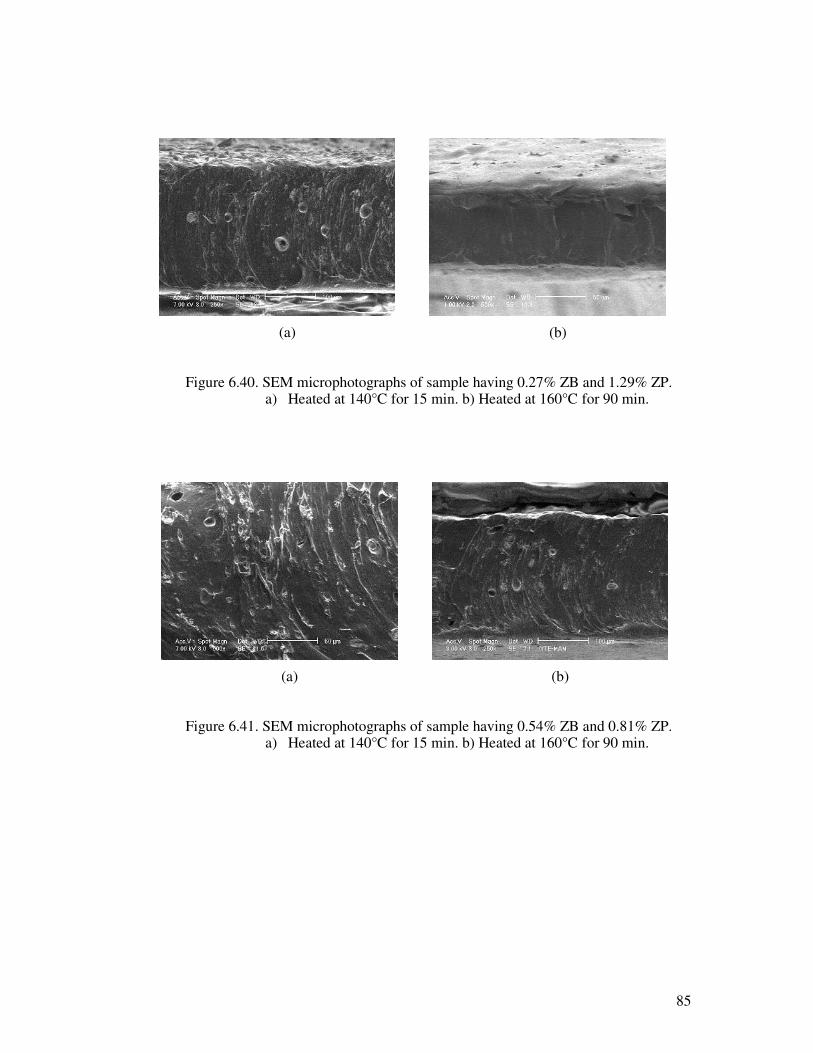

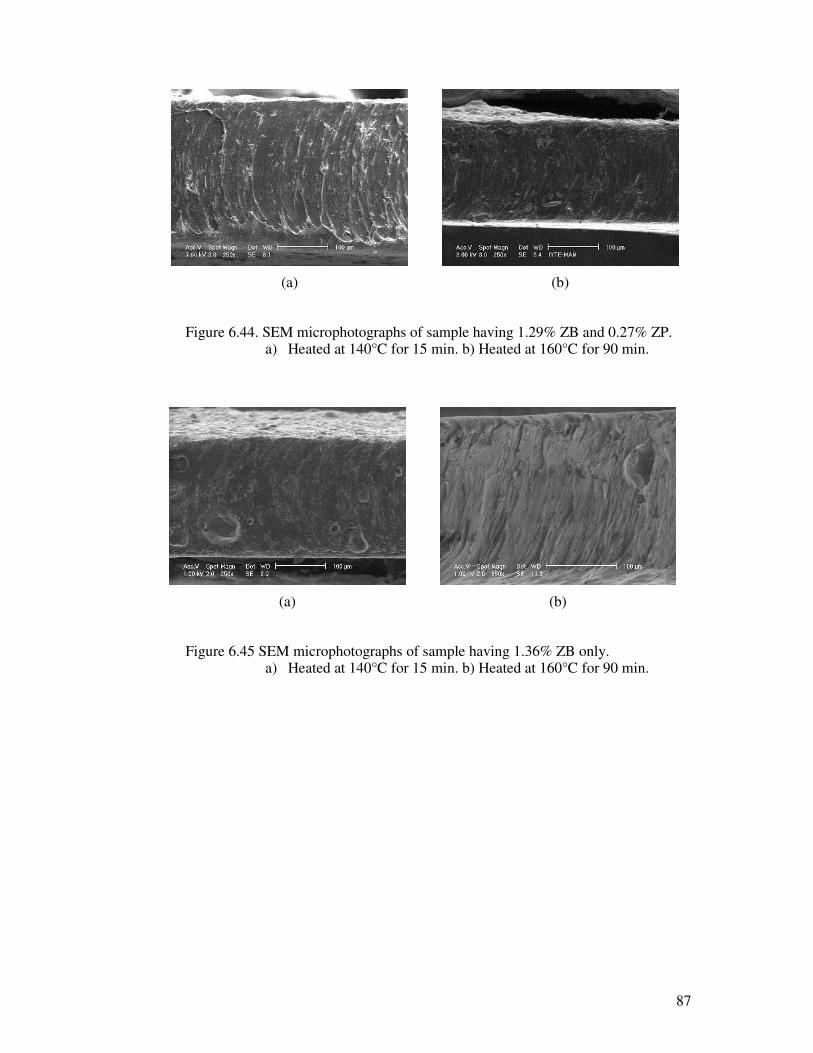


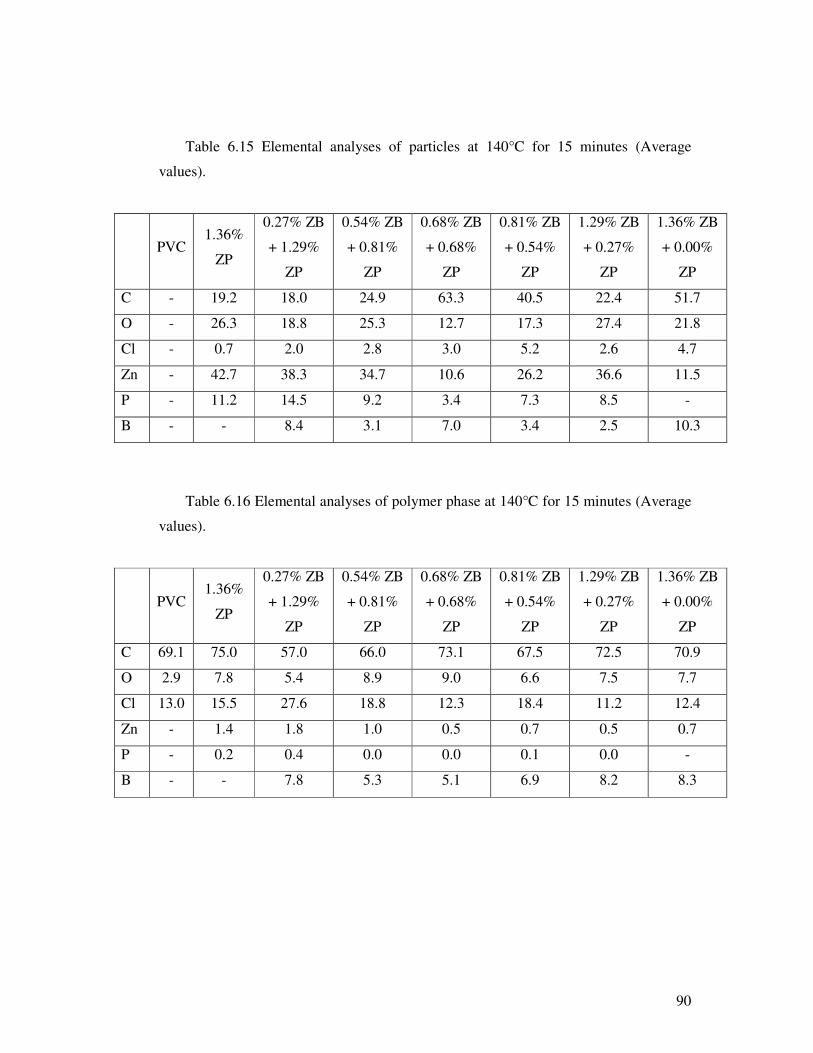


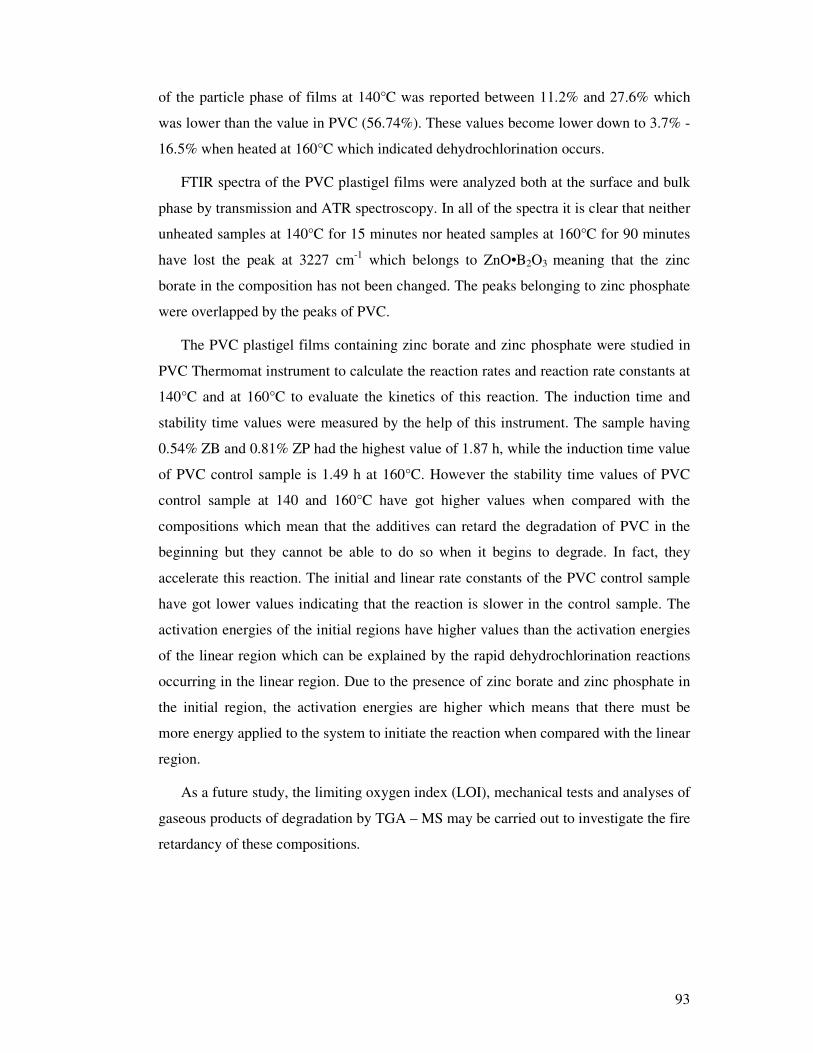
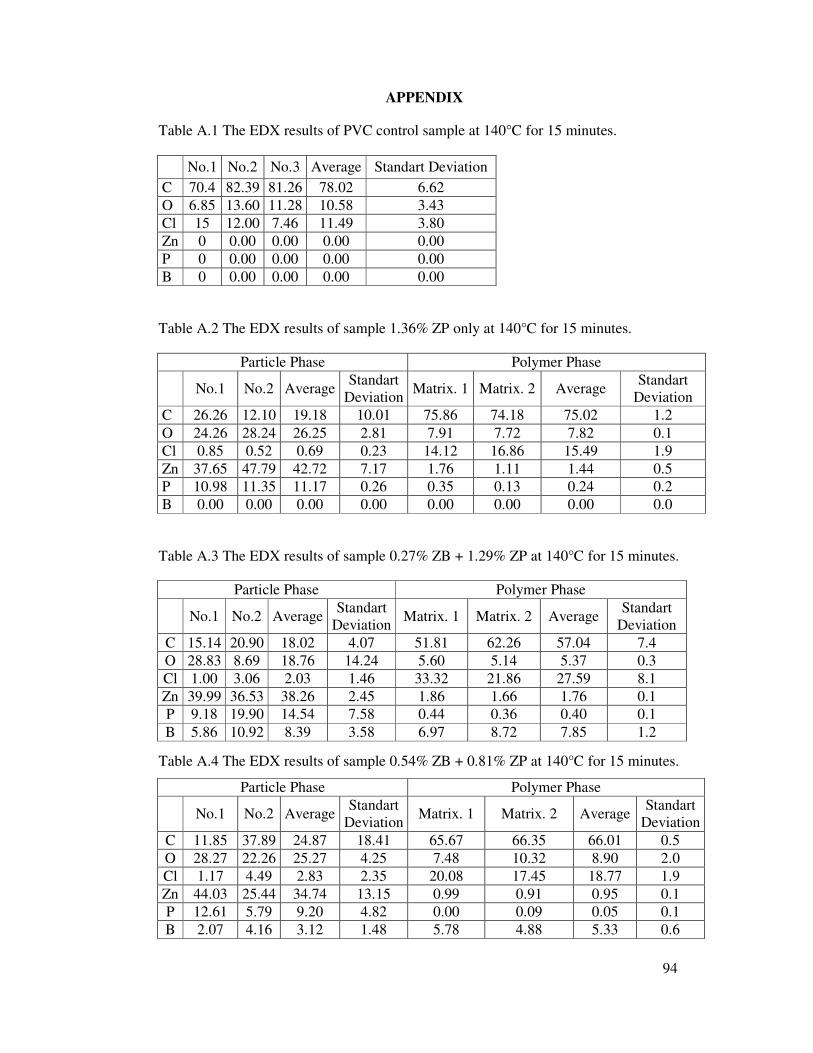
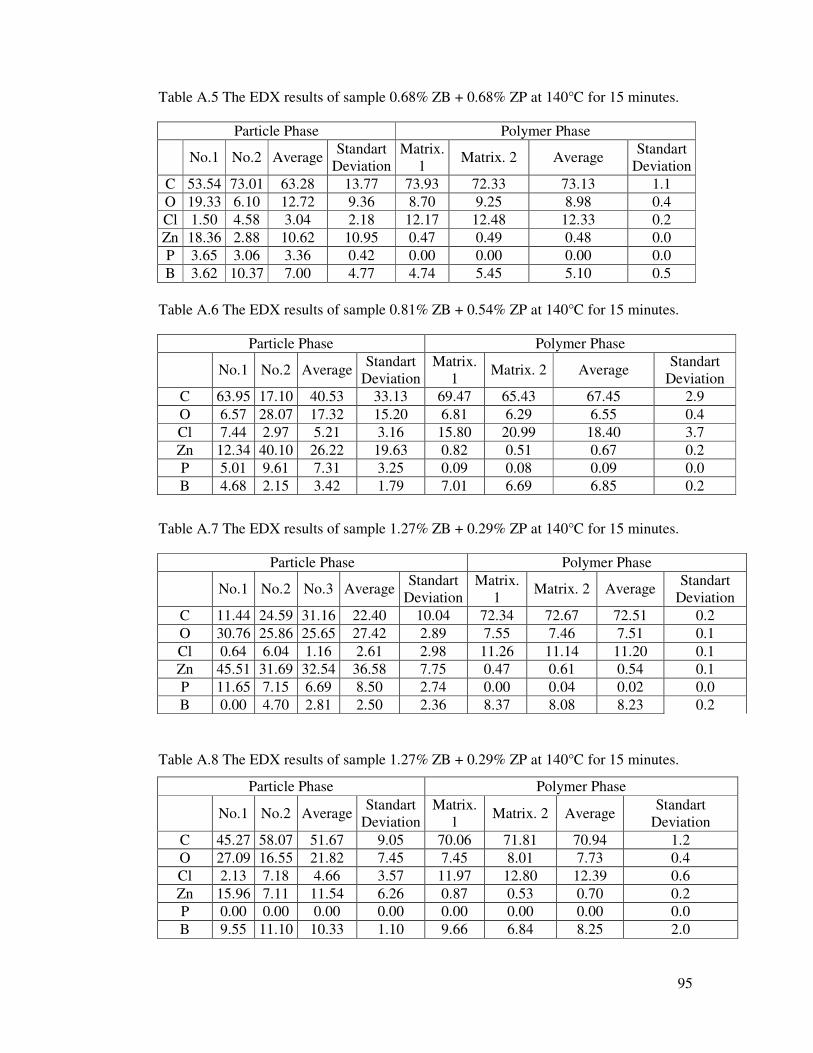
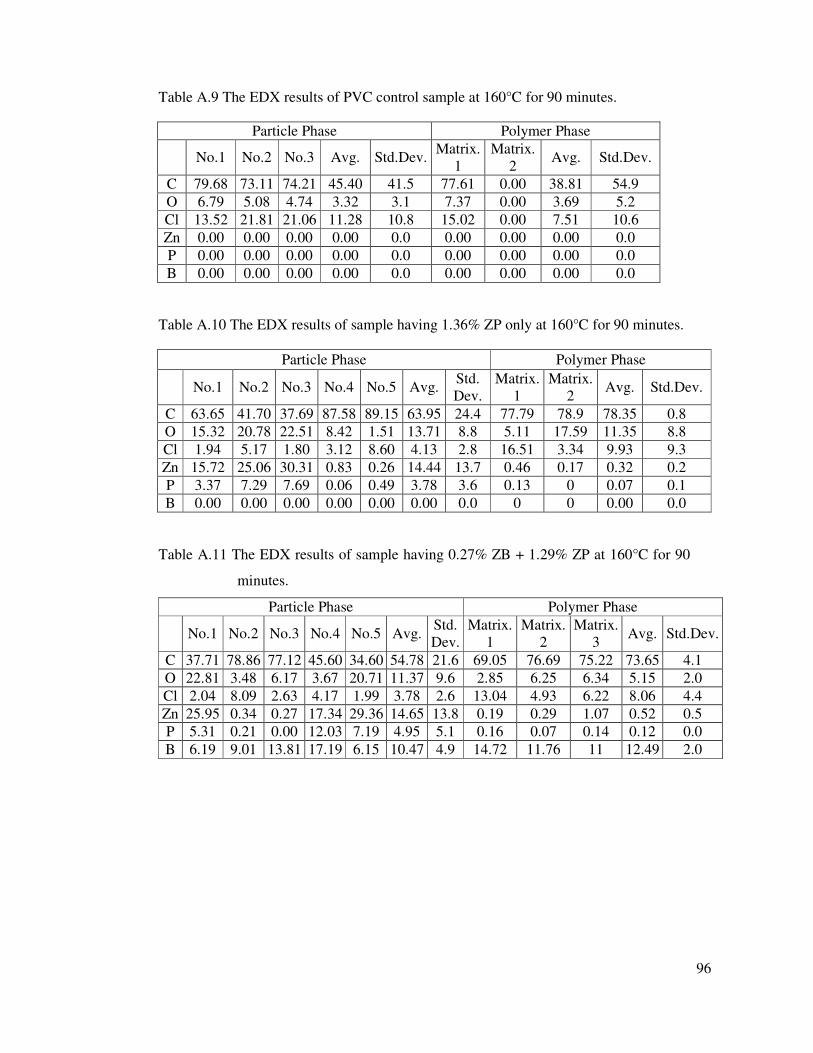
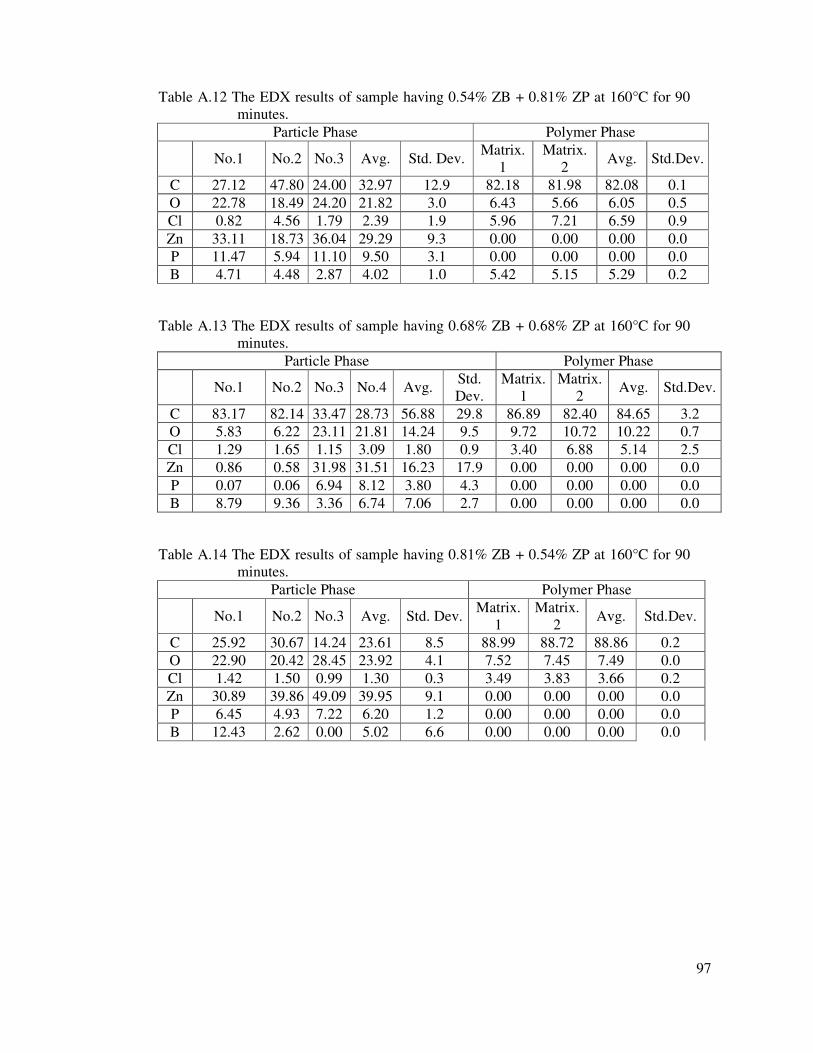
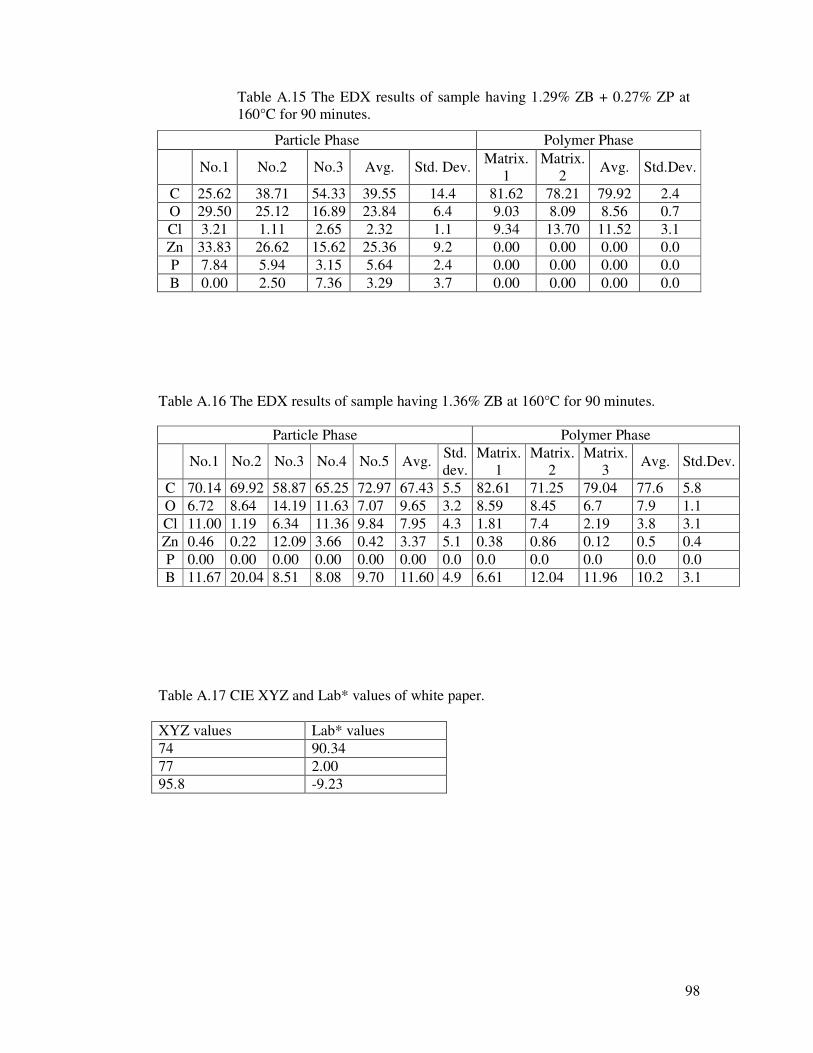


![[library.iyte.edu.tr] - İYTE Kütüphanesi - Ana Sayfalibrary.iyte.edu.tr/tezler/master/makinamuh/T000515.pdf · 2012-01-05[library.iyte.edu.tr] - İYTE Kütüphanesi - Ana Sayfa](https://static.documents.pub/doc/80x56/5ab633697f8b9a1a048d927e/-iyte-ktphanesi-ana-sayfa-iyte-ktphanesi-ana-sayfa.jpg)


