Cite this: CrystEngComm, 2013, 15, 2275 The development of the depletion zone during ceiling crystallization: phase shifting interferometry and simulation results3 Received 2nd October 2012, Accepted 28th November 2012 DOI: 10.1039/c2ce26607e www.rsc.org/crystengcomm Alaa Adawy,* a Kess Marks, a Willem J. de Grip, b Willem J. P. van Enckevort* a and Elias Vlieg a The growth of high quality protein crystals is essential for the determination of their structure. This process is governed by many physical factors such as mass transport and solution flow. The quality of the crystals is usually better under diffusion-limited growth conditions, where a depleted zone of the solution encapsulates the crystal. We developed a Mach–Zehnder-based phase shifting interferometer coupled to image processing software to study the concentration gradients which develop around a crystal during its growth or dissolution. The depletion zones and the diffusion boundary layers around growing and dissolving KH 2 PO 4 crystals are monitored and processed by a MATLAB based algorithm. Our main emphasis was to analyze the ceiling crystallization conditions in which the crystal is placed at the very top of the growth cell and therefore the solute transport is largely diffusion-limited. The experimental results are compared with simulations using finite element-based numerical calculations. The combined results clearly demonstrate the positive effect of the ceiling crystallization approach on crystal growth. Introduction Crystal growth takes place at the crystal–solution interface, involving both solute mass transport and growth kinetics. As a consequence, the solution in the direct vicinity of the crystal generally undergoes a decrease in density. 1 This is due to the incorporation of solutes into the crystal from the surrounding solution and, to a lesser extent, the release of thermal energy. This low density portion of the solution can either settle around the growing crystal (diffusion-limited growth), or it can undergo a rapid exchange with its surroundings by gravity- induced natural convection. From the two regimes, diffusion-limited crystal growth is an amenity in obtaining high quality protein crystals. 2 Many methods were developed in order to provide convection-free growth conditions such as the counter diffusion method, 3 exploiting magnetic fields to counter the gravitational field, 4 or space microgravity experiments. 5 In these methods and after nucleation, crystal growth induces the development of a depletion zone, which is not disturbed by natural convection. The developing concentration gradient limits the mass transport of growth units towards the growing crystal to be solely diffusive. This has a positive impact on the crystal quality because the growth rate slows down, allowing the crystal to embed growth units at the right orientation on the crystal surface. In addition, sedimentation of small crystals and incorporation of impurities are reduced. 6 In a previous paper it was shown that diffusive crystal growth can also be accomplished in a simple terrestrial setup by using an upside-down geometry which exploits gravity. 7 In this setup, the crystals at the top (ceiling) of a growth cell grow in a diffusion-limited crystallization environment. Ceiling crystals grow slowly and because of the ‘‘upside-down’’ geometry, the growing crystals are not affected by sedimenta- tion. This eventually results in better diffracting crystals with lower impurity content when compared with those grown at the bottom of the same setup. 8 This was clearly demonstrated by statistical analysis, which showed that the resolution limit of ceiling crystals (diffusive growth) is significantly improved over that of the batch crystals (convective growth) at a high confidence level. Quantitative experimental data are beyond the scope of the present paper and are presented elsewhere. 8 To examine the different hydrodynamics during ceiling and batch crystallization, we used tetragonal crystals of potassium dihydrogen phosphate (KDP) as a model compound. 9 We used aqueous KDP solutions of either 10% and 20% supersatura- tion or 10% and 20% undersaturation level to study both the growth and the dissolution processes. Emphasis is laid on a Institute for Molecules and Materials, Radboud University Nijmegen, The Netherlands. E-mail: [email protected]; [email protected]; Fax: +31 (0)24 3653067; Tel: +31 (0)24 3653365 b Department of Biochemistry, Nijmegen Centre for Molecular Life Sciences, Radboud University Nijmegen Medical Centre, The Netherlands 3 Electronic supplementary information (ESI) available: Table of the physical constants used in the numerical simulations, movie showing the interferograms of the growth of tetragonal HEWL crystals during the first day after the onset of the experiment. See DOI: 10.1039/c2ce26607e CrystEngComm PAPER This journal is ß The Royal Society of Chemistry 2013 CrystEngComm, 2013, 15, 2275–2286 | 2275 Downloaded by OHIO STATE UNIVERSITY on 01 March 2013 Published on 29 November 2012 on http://pubs.rsc.org | doi:10.1039/C2CE26607E View Article Online View Journal | View Issue
Transcript
Cite this: CrystEngComm, 2013, 15,2275
The development of the depletion zone during ceilingcrystallization: phase shifting interferometry andsimulation results3
Received 2nd October 2012,Accepted 28th November 2012
DOI: 10.1039/c2ce26607e
www.rsc.org/crystengcomm
Alaa Adawy,*a Kess Marks,a Willem J. de Grip,b Willem J. P. van Enckevort*a
and Elias Vliega
The growth of high quality protein crystals is essential for the determination of their structure. This process
is governed by many physical factors such as mass transport and solution flow. The quality of the crystals is
usually better under diffusion-limited growth conditions, where a depleted zone of the solution
encapsulates the crystal. We developed a Mach–Zehnder-based phase shifting interferometer coupled to
image processing software to study the concentration gradients which develop around a crystal during its
growth or dissolution. The depletion zones and the diffusion boundary layers around growing and
dissolving KH2PO4 crystals are monitored and processed by a MATLAB based algorithm. Our main
emphasis was to analyze the ceiling crystallization conditions in which the crystal is placed at the very top
of the growth cell and therefore the solute transport is largely diffusion-limited. The experimental results
are compared with simulations using finite element-based numerical calculations. The combined results
clearly demonstrate the positive effect of the ceiling crystallization approach on crystal growth.
Introduction
Crystal growth takes place at the crystal–solution interface,involving both solute mass transport and growth kinetics. As aconsequence, the solution in the direct vicinity of the crystalgenerally undergoes a decrease in density.1 This is due to theincorporation of solutes into the crystal from the surroundingsolution and, to a lesser extent, the release of thermal energy.This low density portion of the solution can either settlearound the growing crystal (diffusion-limited growth), or it canundergo a rapid exchange with its surroundings by gravity-induced natural convection.
From the two regimes, diffusion-limited crystal growth isan amenity in obtaining high quality protein crystals.2 Manymethods were developed in order to provide convection-freegrowth conditions such as the counter diffusion method,3
exploiting magnetic fields to counter the gravitational field,4
or space microgravity experiments.5 In these methods andafter nucleation, crystal growth induces the development of adepletion zone, which is not disturbed by natural convection.
The developing concentration gradient limits the masstransport of growth units towards the growing crystal to besolely diffusive. This has a positive impact on the crystalquality because the growth rate slows down, allowing thecrystal to embed growth units at the right orientation on thecrystal surface. In addition, sedimentation of small crystalsand incorporation of impurities are reduced.6
In a previous paper it was shown that diffusive crystalgrowth can also be accomplished in a simple terrestrial setupby using an upside-down geometry which exploits gravity.7 Inthis setup, the crystals at the top (ceiling) of a growth cell growin a diffusion-limited crystallization environment. Ceilingcrystals grow slowly and because of the ‘‘upside-down’’geometry, the growing crystals are not affected by sedimenta-tion. This eventually results in better diffracting crystals withlower impurity content when compared with those grown atthe bottom of the same setup.8 This was clearly demonstratedby statistical analysis, which showed that the resolution limitof ceiling crystals (diffusive growth) is significantly improvedover that of the batch crystals (convective growth) at a highconfidence level. Quantitative experimental data are beyondthe scope of the present paper and are presented elsewhere.8
To examine the different hydrodynamics during ceiling andbatch crystallization, we used tetragonal crystals of potassiumdihydrogen phosphate (KDP) as a model compound.9 We usedaqueous KDP solutions of either 10% and 20% supersatura-tion or 10% and 20% undersaturation level to study both thegrowth and the dissolution processes. Emphasis is laid on
aInstitute for Molecules and Materials, Radboud University Nijmegen, The
Fax: +31 (0)24 3653067; Tel: +31 (0)24 3653365bDepartment of Biochemistry, Nijmegen Centre for Molecular Life Sciences, Radboud
University Nijmegen Medical Centre, The Netherlands
3 Electronic supplementary information (ESI) available: Table of the physicalconstants used in the numerical simulations, movie showing the interferogramsof the growth of tetragonal HEWL crystals during the first day after the onset ofthe experiment. See DOI: 10.1039/c2ce26607e
CrystEngComm
PAPER
This journal is � The Royal Society of Chemistry 2013 CrystEngComm, 2013, 15, 2275–2286 | 2275
monitoring the development of the depletion zone duringceiling growth.
To visualize the buoyancy-driven convection plumes (batchgrowth) or the development of the depletion zone (ceilinggrowth), we relied on optical interferometry to map the soluteconcentration profile in the solution.10 The concentrationprofile around the growing crystal can be monitored as a localchange in the refractive index of the crystallization solution,which is a function of solute concentration. Interferometrictechniques provide a route to map these differences in therefractive index in terms of changes in the optical pathlength.11 We designed a Mach–Zehnder-based phase shiftinginterferometer and used a five frame algorithm in order tostudy the changes in the spatial distribution of soluteconcentration, which take place during the growth or dissolu-tion of KDP. These observations are supplemented by finiteelement-based numerical simulations for the same dissolutionor growth conditions. Some conclusions from this study arevalidated by comparing the morphological quality of ceilingand batch grown hen egg-white lysozyme (HEWL) crystalsgrown in cells of different sizes.
Concentration profile measurements
Mach–Zehnder phase shifting interferometer (PSI)
To map the concentration profiles, we used a Mach–Zehnderphase shifting interferometer (Fig. 1). This two-beam inter-ferometer for transmitted light favours high accuracy and easyquantitative interpretation. The incident monochromatic laserbeam is split into two coherent beams, one of which passes thetransparent specimen, i.e. the growth cell which contains thecrystal and the solution, and the other acts as a referencebeam. The two beams superimpose after travelling approxi-mately the same geometrical distance resulting in an inter-ference pattern I(x, y), which embeds the information of theamplitude and phase,12 such that:
I(x,y)~IozIrz2ffiffiffiffiffiffiffiffi
IoIr
p
cos Q(x,y) (1)
where I, Ir and Io are the intensities of the resultant, referenceand object beam, respectively and w(x,y) is the positiondependent phase difference of both beams.
In order to retrieve the object phase information, physicalshifts are introduced between the two beams. This isaccomplished by recording a sequence of interferograms,each with the object beam displaced by a phase shift of p/2 (3l/4). In this way, the phase information can be retrieved byusing the appropriate algorithm to process the consecutivelyrecorded interferograms. Here, we adopted the 5B-framealgorithm introduced by Schmidt and Creath,13 because it isthe most efficient in obtaining a high accuracy. In this case,the total phase shift after the acquisition of the fiveinterferograms is 2p, and the algorithm yields
Q(x,y)~{ tan{1 3I2{3I3{I4zI5
I1{I2{3I3z3I4
� �
(2)
with Ij = 1–5 the intensity of the five interferograms at point (x,y). The phase information reveals the spatial changes in therefractive index and thus, the concentration profile. Based onthis algorithm, a MATLAB script was written, which combinesthe five p/2-phase shifted interferograms and a mask frame(representing the crystal body) to give a discontinuous phaseprofile disregarding the body of the crystal. The discontinu-ities in the calculated phase profile, owing to the nature of thearctangent function, introduce errors in the calculated phase.In order to remove these errors, we developed a correctionscript, which compares the phase value at each pixel with thatof the previous neighbouring vertical or horizontal pixel. If thedifference is ,23p/4, p is added to the pixel and if thisdifference is .3p/4, p is subtracted from this pixel, otherwisethe phase value is not changed. Finally, the corrected phaseprofile is used to compute the concentration profile. This isdone by exploiting the relation between the refractive indexand the resultant phase difference
Fig. 1 Schematic diagram of Mach–Zehnder phase shift interferometer. A piezo electric transducer (PZT) accomplishes the phase shifts, while the beam splitters (BS1and BS2) and the mirrors (M1 and M2) are arranged in a two beam interferometer configuration.
2276 | CrystEngComm, 2013, 15, 2275–2286 This journal is � The Royal Society of Chemistry 2013
where n(x, y, z) is the position dependent refractive index ofthe solution in the growth cell, d is the thickness of the celland l is the wavelength of the laser light used. The constant Ccomprises the resultant phase difference of the object andreference beam excluding the solution in the cell. Using therelation between the refractive index and the difference Dc(x, y,z) in solute concentration with respect to the equilibriumconcentration, which corresponds to a refractive index no,
n(x, y, z) = no + n1Dc(x, y, z) (4)
an expression for the average solute concentration differenceas a function of the phase difference is obtained
1
d
ð
d
0
Dc(x,y,z)dz~l
2pn1Q(x,y)zD (5)
where D is a constant, which can be set to zero.A schematic diagram of the PSI is shown in Fig. 1. The whole
optical setup is based upon the one that was introduced earlierby Duan and Shu14 and is mounted on a vibration-free table. AHeNe laser source of wavelength 632 nm is passed through abeam expander and the resultant beam diameter is controlledby a diaphragm. The beam is incident on a beam splitter (BS1)and divided into two equal beams: one functions as thereference beam and the other as the object beam. Both arethen reflected by the mirrors (M1 and M2). In order to applythe consecutive phase shifts, we used an ultra-precise piezoelectric transducer (S-303, Physik Instrumente (PI), Germany)(PZT) connected with a digital piezo transducer controller (E-750, PI Germany). The PZT was mounted vertically at the backof M2. The controller in the ‘‘servo mode’’ was used such thata series of interferograms is collected by successively displa-cing M2 over 112 nm (corresponding to a phase shift of 112!2nm = l/4 or p/2). The reference and the object beams are thensuperimposed by the second beam splitter (BS2) and directedthrough two consecutive achromatic lenses (L1 and L2) to theCCD camera (PS 4 – 205 GigE, Kappa). The images arerecorded, digitized and processed using the MATLAB script.
Results and analysis
Dissolution of batch crystals. To validate the PSI approach,we started with dissolution experiments. A KDP seed crystalwith dimensions of 0.1 6 0.1 6 0.7 cm3 was placed with itsc-axis parallel to the bottom of a 0.1 6 1 6 4 cm3 growth cellfilled with 10% or 20% undersaturated solution. A time seriesof concentration profiles around a KDP crystal dissolving in20% undersaturated solution measured by PSI is shown inFig. 2. As follows from this figure, the concentration of thesolution near the dissolving crystal is higher than that of theundersaturated bulk solution far from the crystal surface.Because of its higher density, this enriched part of the solutionremains at the bottom of the growth cell due to gravity and the
solute transport to the rest of the solution (upwards) isgoverned by diffusion rather than natural convection. It can beshown that if the dissolution of a planar crystal surface iscompletely determined by volume diffusion, the dissolutionrate, Rd, decreases with time, t, according to
Rd(t)~DV(cs{cb)
ffiffiffiffiffiffiffiffi
pDtp !
1ffiffi
tp (6)
where D is the diffusion coefficient and V is the molecularvolume of the dissolving units; cs(# ceq) and cb are the soluteconcentrations at the crystal surface and the bulk solution,respectively. The dissolution rate of the crystal is equal to theflux of the dissolving units away from its surface. This impliesthat the dissolution rate can be derived from the soluteconcentration gradient near the crystal surface, using
Rd~VDdc
dy
�
�
�
�
crystal surface
(7)
where y is the vertical coordinate of the growth cell.Fig. 3 shows the solute concentration profiles perpendicular
to the crystal surface as a function of time, derived from PSImeasurements shown in Fig. 2. Taking the derivatives dc/dy atthe crystal surface for different times indeed shows lineardependence on the inverse of the square root of time (Fig. 3,inset). This demonstrates that the mass transport in this caseis controlled primarily by diffusion. Hence, these phenomenacan be successfully monitored using PSI.
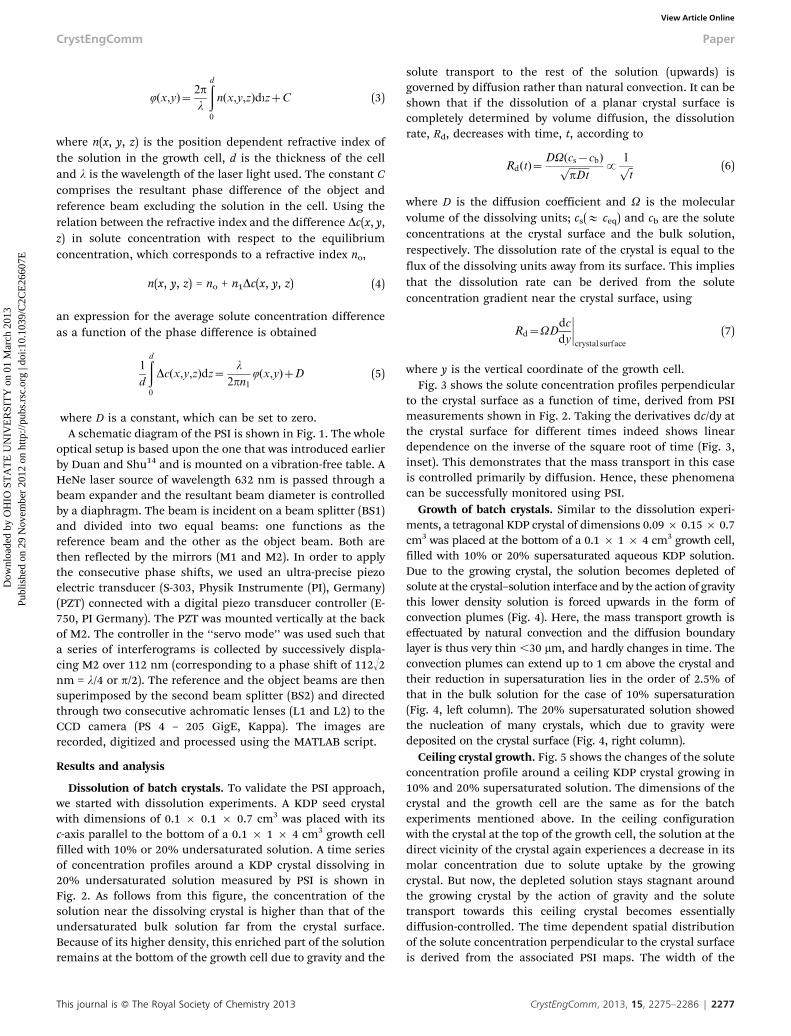
Growth of batch crystals. Similar to the dissolution experi-ments, a tetragonal KDP crystal of dimensions 0.09 6 0.15 6 0.7cm3 was placed at the bottom of a 0.1 6 1 6 4 cm3 growth cell,filled with 10% or 20% supersaturated aqueous KDP solution.Due to the growing crystal, the solution becomes depleted ofsolute at the crystal–solution interface and by the action of gravitythis lower density solution is forced upwards in the form ofconvection plumes (Fig. 4). Here, the mass transport growth iseffectuated by natural convection and the diffusion boundarylayer is thus very thin ,30 mm, and hardly changes in time. Theconvection plumes can extend up to 1 cm above the crystal andtheir reduction in supersaturation lies in the order of 2.5% ofthat in the bulk solution for the case of 10% supersaturation(Fig. 4, left column). The 20% supersaturated solution showedthe nucleation of many crystals, which due to gravity weredeposited on the crystal surface (Fig. 4, right column).
Ceiling crystal growth. Fig. 5 shows the changes of the soluteconcentration profile around a ceiling KDP crystal growing in10% and 20% supersaturated solution. The dimensions of thecrystal and the growth cell are the same as for the batchexperiments mentioned above. In the ceiling configurationwith the crystal at the top of the growth cell, the solution at thedirect vicinity of the crystal again experiences a decrease in itsmolar concentration due to solute uptake by the growingcrystal. But now, the depleted solution stays stagnant aroundthe growing crystal by the action of gravity and the solutetransport towards this ceiling crystal becomes essentiallydiffusion-controlled. The time dependent spatial distributionof the solute concentration perpendicular to the crystal surfaceis derived from the associated PSI maps. The width of the
This journal is � The Royal Society of Chemistry 2013 CrystEngComm, 2013, 15, 2275–2286 | 2277
depletion zone clearly increases in time (Fig. 5 and 6). Thewidth and flow of the depletion zone (d), as shown in theinterferograms, varies directly with the concentration differ-ence, between the bulk solution and that at the crystalinterface (cb 2 cs), and inversely with the flux (JD) such that:
d~{D
JD(cb{cs) (8)
Fig. 2 The change of the concentration as a function of time for a KDP crystal in a 20% undersaturated solution. The concentration differences are expressed in massfractions.
Fig. 3 The spatial distribution of concentration during the dissolution of a KDP crystal in a 20% undersaturated solution. The upper frame shows the linear relationbetween the dissolution rate and the inverse of the square root of time.
2278 | CrystEngComm, 2013, 15, 2275–2286 This journal is � The Royal Society of Chemistry 2013
This can be explained as a decrease of the flux occurring in astagnant solution (Fig. 6, inset) with the consequence that d
extends setting mass transport to the crystal in the diffusivemode. When the oblong crystal was mounted with its c-axisparallel to the ceiling, the space around the crystal was filledwith depleted solution within two minutes by naturalconvection (Fig. 5). After this stage, the diffusion layer startsto develop. This early phenomenon may account for thedifferent spatial concentration profile of the solution near thecrystal surface after two minutes (Fig. 6). This phenomenon iseven more obvious if the oblong crystal is mounted to theceiling with its long axis (the c-axis) perpendicular to the planeof the ceiling plate (Fig. 7). Due to the natural convection, thedepleted solution flows upwards towards the ceiling and thedevelopment of the depletion zone to enclose the whole crystaltook close to one hour (Fig. 7). Only then, the solute transportto the entire crystal is mediated by diffusion.
Interestingly, when we use the ceiling method to inducenucleation and crystal growth of KDP as well as a variety ofproteins we always observe that the crystals nucleate and growsuch that their longest axis is parallel to the plane of theceiling plate of the growth cell. Under these conditions, whenstarting from small nuclei, this initial convection hardlyoccurs, in particular when several ceiling crystals growsimultaneously.
In the case of 20% supersaturation many crystallitesnucleated at the bottom and on the side walls of the growthcell. Fortunately, the convection plumes of these crystals did
not disrupt the depletion zone around the ceiling crystal. Dueto convective mixing of the bulk solution, its concentrationdropped significantly during the progress of the experiment(Fig. 5 and 7).
Deriving crystal growth rates from the time dependentconcentration profiles in Fig. 6, using eqn (7), gives asomewhat irregular dependence as a function of 1/!t (Fig. 6,inset). This indicates that, in contrast to dissolution, eqn (6) isless applicable. This may be accounted for by the initialconvective stage of growth, the nucleation and growth ofcrystallites at the bottom and the walls of the growth cell andby the influence of surface kinetics. It is well known thatsurface kinetics often plays a far more important role in thegrowth of crystals than in their dissolution.
Numerical simulation
Method
As shown in the previous section, the growth or dissolution ofcrystals is largely controlled by the concentration dependentsolute flux at the crystal surface. This process of unit migrationtowards (growth) or away (dissolution) from the crystal, isdescribed by fluid mechanics involving the concepts ofcontinuity, flow motion and solute diffusion.15
The continuity describes the transport of a conservedquantity of fluid and can be expressed as:
Fig. 4 Left column shows the change of the concentration profile around a batch KDP crystal growing in a 10% supersaturated solution. The interferograms of a KDPcrystal growing at 20% supersaturation are shown in the right column. Sedimentations on the crystal completely covered its surface.
This journal is � The Royal Society of Chemistry 2013 CrystEngComm, 2013, 15, 2275–2286 | 2279
where v is the vorticity and y is the potential stream function.Because our quantitative experiments were done in a thingrowth cell (1 mm), we chose a 2D model and performed thecalculations by using Cartesian (x, y) coordinates. CombiningEuler’s and Navier–Stokes’ equations of motion and takingtheir curl, the motion of the fluid can be described by theNavier–Stokes stream function vorticity equation:
Lv
Lt{
Ly
Lx
Lv
Lyz
Ly
Ly
Lv
Lx~m+2vzg
L(r{ro)
Lx(10)
In this partial differential equation, m+2v is the viscositycomponent with m the kinematic viscosity; gh(r 2 ro)/hx isdefined as the force vector with g the acceleration due to
gravity and r and ro are the actual and the offset value of thefluid density, respectively.
Because in our case the fluid is a solution containing thegrowth units, diffusive solute mass transport is a function ofconcentration (c) and local flow position such that;
D+2c~Lc
Lt{
Ly
Lx
Lc
Lyz
Ly
Ly
Lc
Lx(11)
where D is the solute diffusion coefficient.Eqn (9)–(11) are partial differential equations, which can be
solved by finite element analysis. Our aim here was to developa numerical simulation in order to determine the streamfunction, vorticity and concentration for growth or dissolutionprocesses, by providing known values for the kinematicviscosity, off-set density, gravitational acceleration, and thediffusion coefficient of the compound under study. For this,we used FlexPDE software, version 6.20, which is a multi-purpose finite element analysis package capable of simulatingcomplex physical processes.16 We applied a non-slip condition
Fig. 5 The change of the concentration profile as a function of time around a ceiling KDP crystal growing in 10% (left) and 20% (right) supersaturated solutions.
2280 | CrystEngComm, 2013, 15, 2275–2286 This journal is � The Royal Society of Chemistry 2013
at the crystal interface and the cell walls by using a penaltymethod.17 The crystal was assumed to be either situated at theceiling, the bottom or at both locations simultaneously in thegrowth cell. We assumed that the crystal does not show anapparent change in size during growth. The boundaryconditions were defined with respect to the crystal surfaceand the growth cell walls such that:
i) Y = 0 at the growth cell walls and crystal faces.
ii)Lc
Ln~
0 at the growth cell walls
{k(c{ceq) at the crystal faces
�
In eqn (12) k is the kinetic coefficient and c and ceq are theconcentrations at the crystal surface and at equilibrium,respectively. The physical constants for the compounds usedin this study are given in the ESI.3
Results and analysis
Fig. 8 shows the simulations for the ceiling growth of adownwards pointing oblong KDP crystal from a 20% super-saturated solution. There is an obvious clear agreement withthe experimental data in Fig. 7. The simulated time seriesclearly shows the two stages in the development of thedepletion layer. After 100 seconds, a thin concentrationgradient normal to the crystal surface is formed by soluteuptake at the crystal surface. The width of the boundary layer(45 mm) is quite similar to that observed experimentally. As canbe seen in the subsequent images, the depleted solution ispushed upwards by buoyant forces until the flow is prohibitedany further at the ‘‘ceiling’’ of the growth cell. After about 5000seconds the depleted solution encloses the whole crystal andthe second stage sets in, expansion downwards by diffusion-limited mass transport.
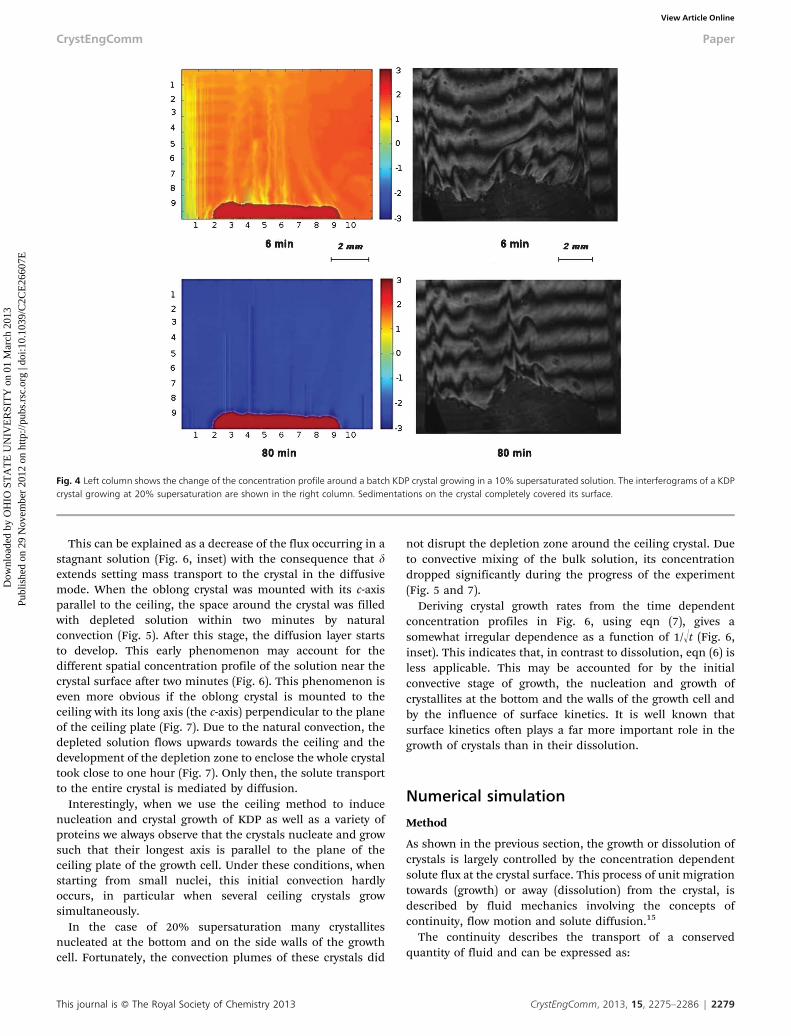
The simulations show that the second stage of the depletionzone development, apart from a scaling factor (cb 2 ceq), isindependent of supersaturation (Fig. 9, upper row, right). Thisreadily follows from the equation of the development of thesolute concentration profile, c(x, y, t), during growth in a onedimensional system limited by mass transport:
c(x,y,t)~{(cb{ceq)erfc ½y=2ffiffiffiffiffiffi
Dtp�zcb (13)
where erfc is the complementary error function. In contrast,the dissolution of a ceiling crystal is governed by naturalconvection, leading to a thin boundary layer around the crystaland a downward directed convection plume. As seen in Fig. 9(upper row, left) the diffusion boundary layer gets thinner forincreasing undersaturation.
Because in practice it is very difficult to avoid nucleation atthe bottom of the growth cell, in particular at high super-saturation, which is the optimal condition for most proteincrystallization protocols, we also simulated the conditionwhere two crystals grow or dissolve at both locationssimultaneously (Fig. 9, lower row). At higher supersaturation,the developed convection plumes are able to reach thedepletion zone around the ceiling crystal, still the latter ishardly distorted. In the presence of more batch and ceilingcrystals the solution depletes faster, but the overall mechan-ism remains the same. Another effect that can be easilyspotted is that the concentration of the bulk solutiondecreases rapidly, due to the faster growth of the batchcrystals and the continuous mixing of the solution by theaction of natural convection. As a consequence, the depletionzone of the ceiling crystals, despite being intact, fades away inthe course of time. This was also observed in our KDP growthexperiments (Fig. 7). The simulation of two crystals simulta-
Fig. 6 The spatial distribution of the solute concentration during the ceiling growth of a KDP crystal in a 20% supersaturated solution, The inset shows the relationbetween the crystal growth rate and the inverse of the square root of time. The dashed line provides a good fitting disregarding the initial convection mediated stage.
(12)
This journal is � The Royal Society of Chemistry 2013 CrystEngComm, 2013, 15, 2275–2286 | 2281
Fig. 7 Timelines of the interferograms of ceiling KDP crystals which extends deeply in the growth solution and grows in 20% supersaturated solutions. Theconcentration profiles at the centre of the figure are deduced from the left column of the interferograms. The profiles are calculated by using eqn (5) and the fact thatthe distance between two interference lines corresponds to a phase difference of w = 2p.
Fig. 8 Time series of the development of the vertical solute concentration gradient in the case of ceiling KDP crystal growth in a 20% supersaturated solution. Thecalibration bar accounts to the concentration profile (in gm%) and the time is counted in seconds after the initiation of growth.
2282 | CrystEngComm, 2013, 15, 2275–2286 This journal is � The Royal Society of Chemistry 2013
neously dissolving at the top and bottom of the cell yielded thesame results, but in opposite directions (Fig. 9, lower row, left).
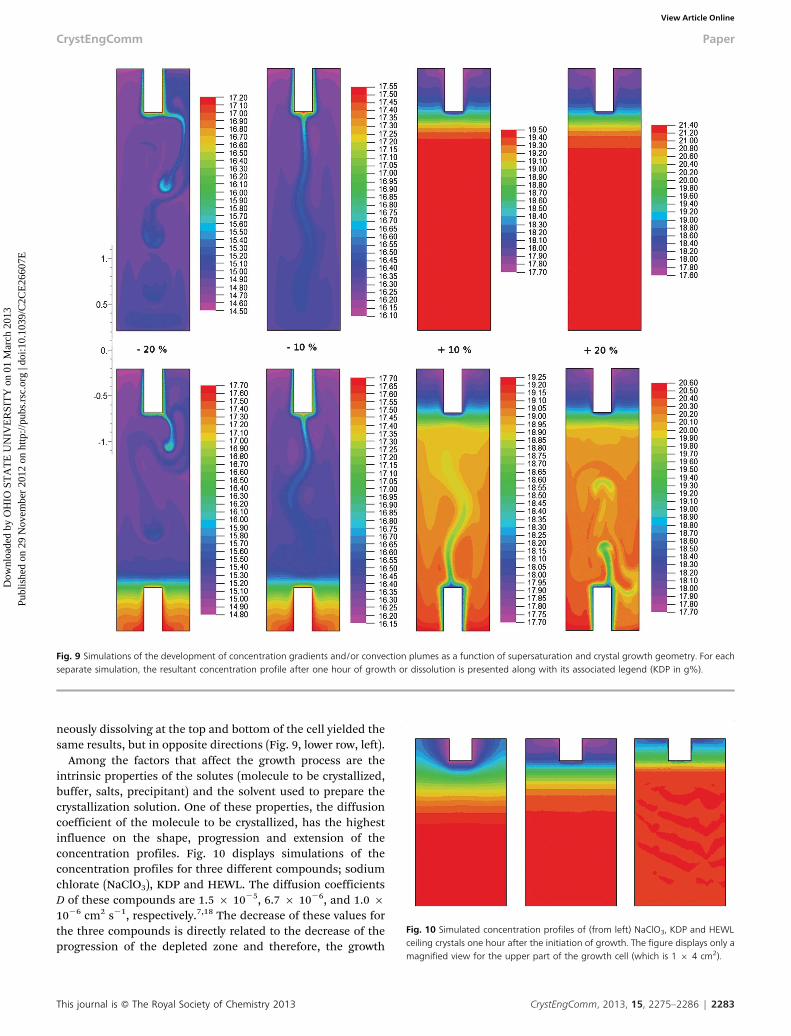
Among the factors that affect the growth process are theintrinsic properties of the solutes (molecule to be crystallized,buffer, salts, precipitant) and the solvent used to prepare thecrystallization solution. One of these properties, the diffusioncoefficient of the molecule to be crystallized, has the highestinfluence on the shape, progression and extension of theconcentration profiles. Fig. 10 displays simulations of theconcentration profiles for three different compounds; sodiumchlorate (NaClO3), KDP and HEWL. The diffusion coefficientsD of these compounds are 1.5 6 1025, 6.7 6 1026, and 1.0 61026 cm2 s21, respectively.7,18 The decrease of these values forthe three compounds is directly related to the decrease of theprogression of the depleted zone and therefore, the growth
Fig. 9 Simulations of the development of concentration gradients and/or convection plumes as a function of supersaturation and crystal growth geometry. For eachseparate simulation, the resultant concentration profile after one hour of growth or dissolution is presented along with its associated legend (KDP in g%).
Fig. 10 Simulated concentration profiles of (from left) NaClO3, KDP and HEWLceiling crystals one hour after the initiation of growth. The figure displays only amagnified view for the upper part of the growth cell (which is 1 6 4 cm2).
This journal is � The Royal Society of Chemistry 2013 CrystEngComm, 2013, 15, 2275–2286 | 2283
rate of the three types of crystals as follows from eqn (5) and(11). Experimentally, at the same starting supersaturationunder diffusion-limited crystal growth conditions, the finalcrystal size of an average HEWL crystal is about five timessmaller than that of KDP, which again is smaller than NaClO3.In our simulations, starting from the same size of seedingcrystals, the development of the depletion zone is the slowestfor HEWL and the fastest for NaClO3, in accordance with theircrystal growth rate and diffusion coefficient. This rate ofdevelopment can be enhanced by the nucleation of severalcrystals at the ceiling of the growth cell as discussed below,which generally is the case for ceiling growth. In comparisonwith other proteins, HEWL has one of the highest values for itsdiffusion coefficient (e.g. BSA = 6.09 6 1027 cm2 s21, bovineinsulin = 7.3 6 1027 cm2 s21). This makes the method broadlyapplicable as long as certain dimensional ratios are preserved,as discussed below. In such a case, the size of the growth cellscan be much reduced and still the buoyancy-assisted diffusionand the depleted zone of the ceiling crystals will not bedisturbed by the convection plumes rising from any batchcrystals which happen to grow at the bottom.
Dimensions of the growth cell
As follows from the experimental and simulation results,successful ceiling crystallization depends on many factors.One of the most important points for protein crystallographersis the achievable sample volume per trial. Nowadays, manycommercially available crystallization set-ups adopt vapourdiffusion and micro-batch platforms in the nano- to microliterrange for both globular and membrane proteins. The ceilingmethod is not suitable for broad initial screening of crystal-lization conditions, because of the minimal volume require-ment of about 10 ml per trial, but rather for improving crystalquality under preselected conditions. In this context it isimportant to consider the dimensions of the growth cells, inorder to achieve diffusion-limited mass transport.Experimentally, we examined this by performing two sets oftrials using differently sized growth cells of 7 mm radius and 2mm height (group 1) and 3.5 mm radius and 2 mm height(group 2) in which tetragonal HEWL crystals were grown. Theeffect of adding impurities with different segregation coeffi-cients (k)19 to the mother liquor, i.e. bovine insulin and bovineserum albumin (BSA), was also studied. As shown in Fig. 11,the ceiling crystals grown in the narrower vials (right column)in all cases are morphologically defect-free when compared totheir counterparts in the wider vials (left column) and also arehardly affected by any impurities present [k , 1]. Similarresults were reported earlier in a space microgravity experi-ment.20 In addition, preliminary SDS PAGE analysis indeedconfirmed the optical data, indicating lower incorporation ofBSA in ceiling crystals grown in the narrower cells (not shown).This demonstrates that the ceiling method succeeds toaccomplish a similar diffusion-limited growth conditions.
In order to understand this effect of the vessel width, wesimulated the growth cells by considering crystals on the
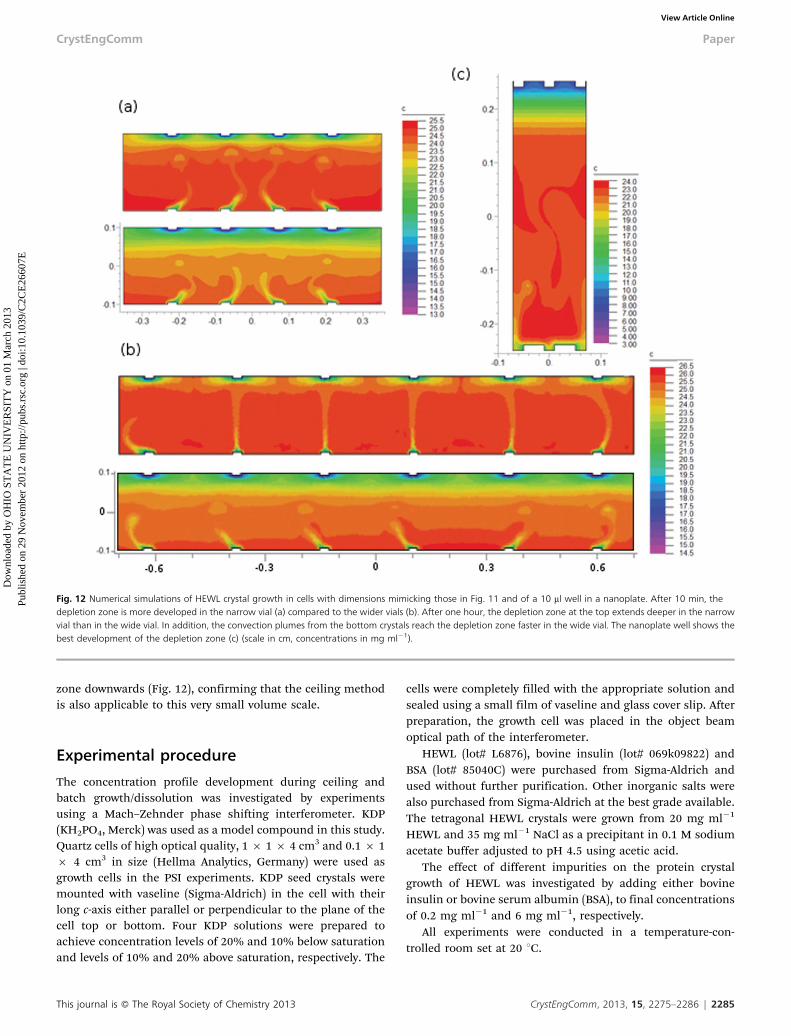
ceiling and at the bottom simultaneously (Fig. 12). Obviously,the depth of the depletion zone varies inversely with the widthof the growth cell at constant height of the growth cell. Thisprobably is because it takes longer time in the wider cell to fillthe horizontal layers with depleted solution and hence to startdiffusion limited growth.
At the early convection mediated stage, the probability ofimpurity incorporation is relatively high. Therefore, regardlessof the value of the segregation coefficient, the impurities willfind their way to the tetragonal HEWL crystal nuclei (in case ofBSA), inducing more nucleation and twinning, or duringcrystal growth (in case of bovine insulin) leading to crystalspossessing rougher surfaces. Thus, we surmise that rapidenclosure of growing ceiling crystals by the depletion zone willresult in better quality crystals. Further, we anticipate that thiswill be enhanced by simultaneous growth of a relatively largenumber of ceiling crystals and by a not too small ratio of theheight of the growth cell relative to its width (e.g. in the orderof 3 to 4, as used routinely and also in accordance with the 10ml nanoplate wells). This was indeed borne out by furthersimulations, showing that the presence of many nucleationsites improves the solute depletion pattern of every individualceiling crystal (not shown). We also simulated a nanoplatewell, and although it provides limited space for nucleation, itdoes show rapid development and extension of the depletion
Fig. 11 Ceiling (insets) and batch HEWL crystals grown in wide (left column,top) and narrow (right column, top) growth cells. The second and third rowsdisplay HEWL crystals grown in the presence of bovine insulin and BSA as animpurity, respectively. Often ceiling crystals were fewer. All images are displayedat the same scale. Pictures are representative for the entire population.
2284 | CrystEngComm, 2013, 15, 2275–2286 This journal is � The Royal Society of Chemistry 2013
zone downwards (Fig. 12), confirming that the ceiling methodis also applicable to this very small volume scale.
Experimental procedure
The concentration profile development during ceiling andbatch growth/dissolution was investigated by experimentsusing a Mach–Zehnder phase shifting interferometer. KDP(KH2PO4, Merck) was used as a model compound in this study.Quartz cells of high optical quality, 1 6 1 6 4 cm3 and 0.1 6 16 4 cm3 in size (Hellma Analytics, Germany) were used asgrowth cells in the PSI experiments. KDP seed crystals weremounted with vaseline (Sigma-Aldrich) in the cell with theirlong c-axis either parallel or perpendicular to the plane of thecell top or bottom. Four KDP solutions were prepared toachieve concentration levels of 20% and 10% below saturationand levels of 10% and 20% above saturation, respectively. The
cells were completely filled with the appropriate solution andsealed using a small film of vaseline and glass cover slip. Afterpreparation, the growth cell was placed in the object beamoptical path of the interferometer.
HEWL (lot# L6876), bovine insulin (lot# 069k09822) andBSA (lot# 85040C) were purchased from Sigma-Aldrich andused without further purification. Other inorganic salts werealso purchased from Sigma-Aldrich at the best grade available.The tetragonal HEWL crystals were grown from 20 mg ml21
HEWL and 35 mg ml21 NaCl as a precipitant in 0.1 M sodiumacetate buffer adjusted to pH 4.5 using acetic acid.
The effect of different impurities on the protein crystalgrowth of HEWL was investigated by adding either bovineinsulin or bovine serum albumin (BSA), to final concentrationsof 0.2 mg ml21 and 6 mg ml21, respectively.
All experiments were conducted in a temperature-con-trolled room set at 20 uC.
Fig. 12 Numerical simulations of HEWL crystal growth in cells with dimensions mimicking those in Fig. 11 and of a 10 ml well in a nanoplate. After 10 min, thedepletion zone is more developed in the narrow vial (a) compared to the wider vials (b). After one hour, the depletion zone at the top extends deeper in the narrowvial than in the wide vial. In addition, the convection plumes from the bottom crystals reach the depletion zone faster in the wide vial. The nanoplate well shows thebest development of the depletion zone (c) (scale in cm, concentrations in mg ml21).
This journal is � The Royal Society of Chemistry 2013 CrystEngComm, 2013, 15, 2275–2286 | 2285
We studied the solute concentration profiles developingduring growth as well as dissolution of crystals mounted atthe top (ceiling method) and/or at the bottom of the growthcell (batch method). Through a Mach–Zehnder phase shiftinginterferometer (PSI) and a five-frame algorithm, we success-fully monitored these profiles which develop during dissolu-tion and growth of KDP crystals. The PSI data aresubstantiated by finite element based numerical simulation.
The profiles resulting from dissolving batch crystalsshowed a morphological resemblance to that from growingceiling crystals. In both cases, after an initial period offormation of an expanding enrichment/depletion zone (gov-erned by natural convection), the process becomes largelycontrolled by diffusion-limited solute transport. Yet, theobserved differences between dissolution and growth provideevidence that in the latter case the surface kinetics and, athigher supersaturation, the nucleation of crystallites play anon-negligible role.
In addition, the growth of ceiling HEWL crystals and thesimulation of this process reveal that the cell dimensions arecritical for effective ceiling crystallization. At a low height towidth ratio, diffusion controlled mass transport developsslower, giving more chances for the rising convection plumesto perturb the growth of ceiling crystals and thus making themerits of the method less favorable. The simulations alsoshowed that the ceiling method can be effective at a very smallscale, given that the cell aspect ratios are such that the initialconvection stage is as short as possible.
In short, our investigations generally confirm that theceiling approach affords a simple and economical set-up torealize fully convection-free mass transport and thereforediffusion-limited crystal growth.
Extrapolation of the finite element simulation to cylindricalcoordinates and using moving boundary conditions in order toexpand this analysis to the nucleation step and impurityincorporation are in progress.
Acknowledgements
The authors would like to sincerely thank Wil Corbeek, Jan vanKessel, Wiesiek Szweryn and Erik de Ronde for the technical
support. This project is funded by The NetherlandsFoundation for Scientific Research through its ChemicalCouncil (NWO-CW, project 700.57.022).
Notes and references
1 A. A. Chernov and E. I. Givargizov, Modern CrystallographyIII: Crystal Growth, Springer-Verlag, Berlin, 1984.
2 A. McPherson, Crystallization of Biological Macromolecules,Cold Spring Harbor Laboratory Press, New York, 1999.
3 J. M. Garcıa-Ruiz, Key Eng. Mater., 1991, 58, 87–106.4 P. W. G. Poodt, M. C. R. Heijna, P. C. M. Christianen, W. J.
P. van Enckevort, W. J. de Grip, K. Tsukamoto, J. C. Maanand E. Vlieg, Cryst. Growth Des., 2006, 6, 2275–2280.
5 A. McPherson, A. Greenwood and J. Day, Adv. Space Res.,1991, 11, 343–356.
6 H. Lin, D. N. Petsev, S. T. Yau, B. R. Thomas and P.G. Vekilov, Cryst. Growth Des., 2001, 1, 73–79.
7 P. W. G. Poodt, M. C. R. Heijna, A. Schouten, P. Gros, W. J.P. van Enckevort and E. Vlieg, Cryst. Growth Des., 2009, 9,885–888.
8 A. Adawy, S. Tornroth-Horsefield, W. J. De Grip, W. VanEnckevort and E. Vlieg, Cryst. Growth Des., 2012, DOI:10.1021/cg301497t.
9 G. Dhanaraj, K. Byrappa, V. Prasad and M. Dudley, SpringerHandbook of Crystal Growth, 2010, 759–794.
10 F. A. Jenkins and H. E. White, in Fundamentals of Optics,McGraw-Hill, Inc., 1976.
11 S. Verma and P. J. Shlichta, Prog. Cryst. Growth Charact.Mater., 2008, 54, 1–120.
12 A. V. Lugt, IEEE Trans. Inf. Theory, 1964, 10, 139–145.13 J. Schmit and K. Creath, Appl. Opt., 1995, 34, 3610–3619.14 L. Duan and J. Shu, J. Cryst. Growth, 2001, 223, 181–188.15 T. Kambe, Elementary Fluid Mechanics, World Scientific Pub
Co Inc., 2007.16 T. FlexPDE, PDESolutions Inc., http:\\www.pdesolutions.
com.17 F. C. G. De Marco, C. R. De Andrade and E. L. Zaparoli, Int.
Commun. Heat Mass Transfer, 2003, 30, 495–504.18 P. W. G. Poodt, M. C. R. Heijna, P. C. M. Christianen, W. J.
P. van Enckevort, J. C. Maan and E. Vlieg, Cryst. GrowthDes., 2008, 8, 2200–2204.
19 R. A. Judge, E. L. Forsythe and M. L. Pusey, Biotechnol.Bioeng., 1998, 59, 776–785.
20 B. R. Thomas, A. A. Chernov, P. G. Vekilov and D. C. Carter,J. Cryst. Growth, 2000, 211, 149–156.
2286 | CrystEngComm, 2013, 15, 2275–2286 This journal is � The Royal Society of Chemistry 2013