The author hereby grants to MUST permission to reproduce and to distribute publicly paper and electronic copies of this thesis document in whole or in part.
Signature of Author __________________________________________________________ Department of Transportation
August 2004
Certified by ______________________________________________________________ Dr. Leong Choon Heng
Accepted by ________________________________________________________________ Dr. Leong Choon Heng
Department of Transportation Head of MSc Transportation and Logistics
- i -
The Development of Third Party Logistics in Malaysia: An Overview
By
Salina binti Umar
Submitted to the Department of Transportation and Logistics in Partial Fulfillment of the requirements for the Degree of Master of Science in
Transportation and Logistics
Abstract The main objective of this thesis is to study the progress of local third party logistics (3PL) providers and analyze its development in Malaysia. The study takes into account the increasing demand for comprehensive 3PL services and capable 3PL providers, responses by 3PL providers to that demand, problems faced by the logistics industry and incentives provided by the Malaysian Government to promote the industry. The approach, concept and framework for this thesis are developed and based principally on the works of Susanne Hertz and Monica Alfredsson (2003), and M. S. Sohail and A. S. Sohal (2003). Based on the findings of the case studies, comparisons were made on 3PL classifications, relationships between 3PL providers and users and services offered. A mail survey was also carried out to strengthen the findings from the case studies. The study found that the majority of 3PL providers in Malaysia are still of the standard 3PL type, offering mainly traditional services such as transportation, warehousing and customs clearance.
ii
Acknowledgement I wish to thank everyone who helped me go through the Master of Science in Transportation and Logistics program for the past 2 years. Special thanks to Dr. Leong Choon Heng for pushing me to complete this thesis and to Chin, Sook Yeen, Saravanan, Chew, Visha and Yanti for sharing my anxiety. I would also like to express my appreciation to the Ministry of Science, Technology and Innovation for giving me the opportunity to gain invaluable knowledge in this field. Thank you so much! Sincerely, Salina Umar CA, CPA (Malaysia & Australia), CFP.
Table of Contents..........................................................................................................iii
List of Figures ...............................................................................................................vi
List of Tables ...............................................................................................................vii
1 Introduction........................................................................................................1 1.1 Malaysian Economy............................................................................2 1.2 Thesis Approach .................................................................................4 1.3 3PL Issues in Malaysia .......................................................................6
2 The Research Methodology and Theoretical Framework..................................8 2.1 The Research Approach......................................................................8 2.1.1 Qualitative Study ................................................................................8 2.1.2 Methods for Collecting Data...............................................................8 2.1.2.1 Literature Review................................................................................8 2.1.2.2 Interviews............................................................................................9 2.1.2.3 Survey ...............................................................................................10 2.2 Theoretical Framework.....................................................................14 2.3 Financial Performance ......................................................................14 2.4 Definitions of Central Concepts and Terms......................................14
3 Literature Review.............................................................................................19 3.1 Industry Environment .......................................................................19 3.2 Third Party Logistics Development in Europe .................................20 3.3 Third Party Logistics Development in the USA...............................24 3.4 Studies on Malaysia ..........................................................................30 3.4.1 Review of Commissioned Studies ....................................................30 3.4.2 Review of Other Studies and Journal Articles..................................34 3.4.3 Sea.....................................................................................................38 3.4.4 Land Transport..................................................................................40 3.4.4.1 Conventional Truck ..........................................................................40 3.4.4.2 Container Haulage ............................................................................41 3.4.4.3 Rail....................................................................................................43 3.4.5 Air Cargo ..........................................................................................44 3.4.6 Freight Forwarding Services.............................................................46 3.4.6.1 Government-Appointed Multimodal Transport Operators (MTO)...47 3.4.7 Licensing Requirements....................................................................50
4 Case Study Analysis of 3PL Development......................................................51
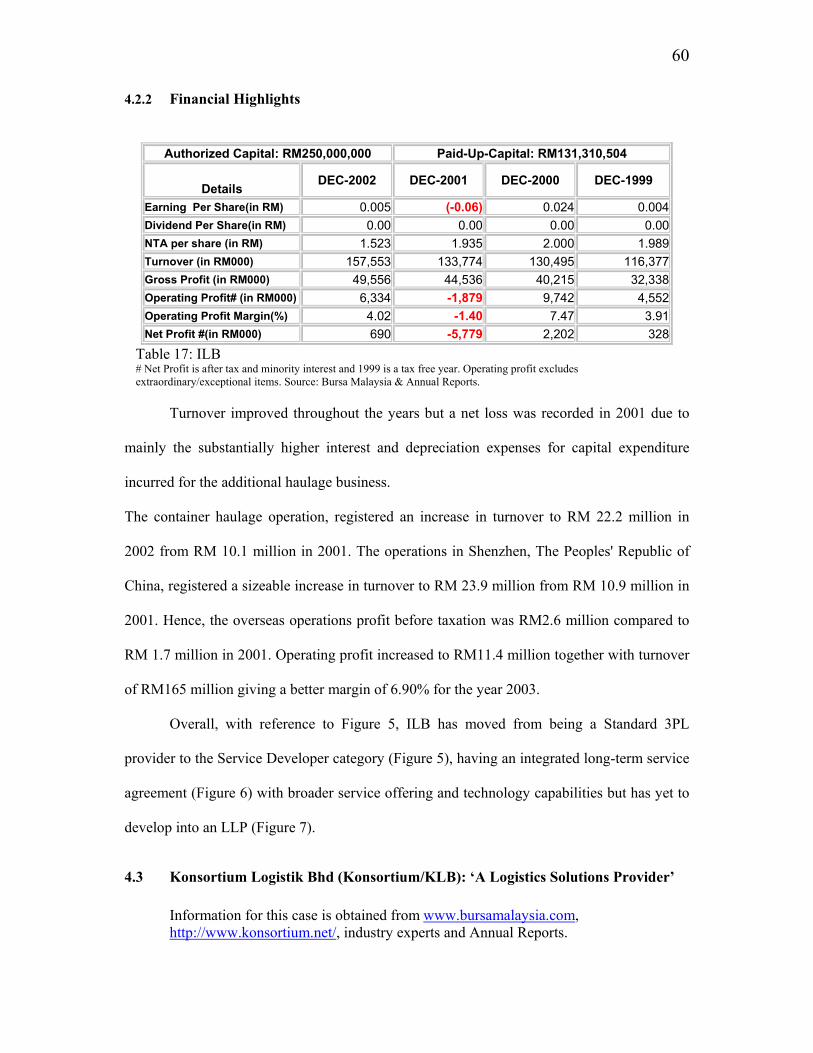
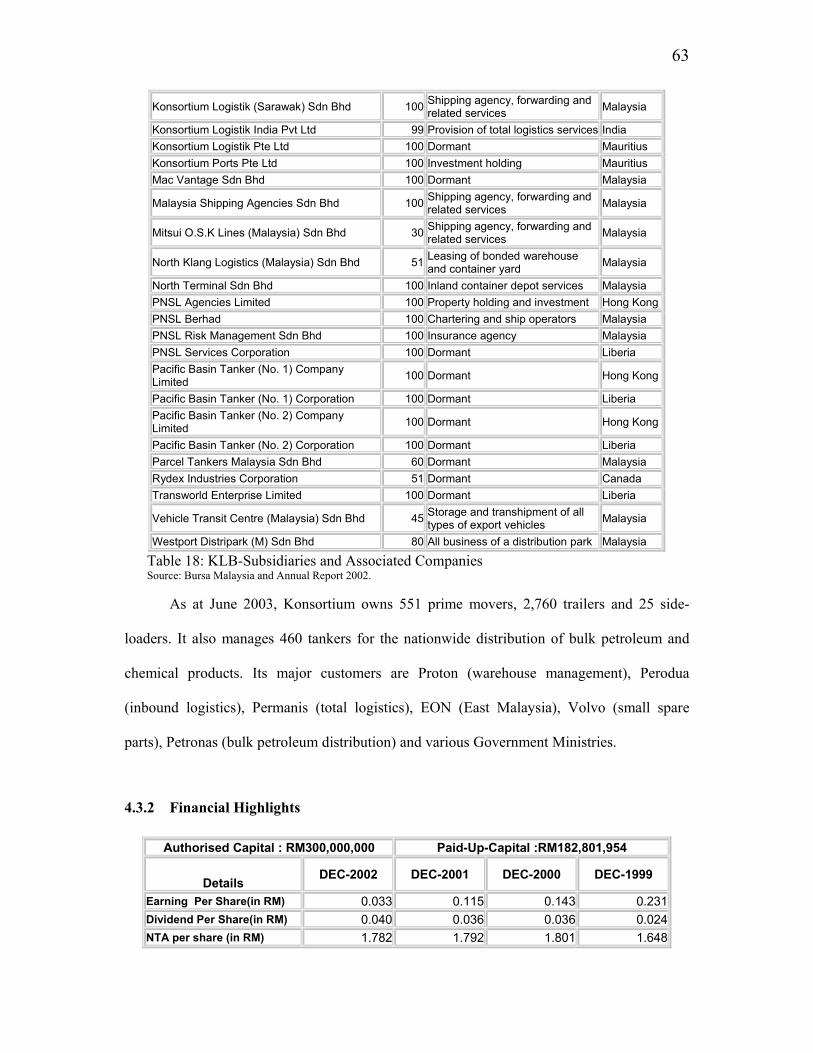
4.1.1 History and Business.........................................................................55 4.1.2 Financial Highlights..........................................................................57 4.2 Integrated Logistics Berhad (ILB): ‘A Leader in Total Logistics’ ...57 4.2.1 History and Business.........................................................................58 4.2.2 Financial Highlights..........................................................................60 4.3 Konsortium Logistik Bhd (Konsortium/KLB): ‘A Logistics
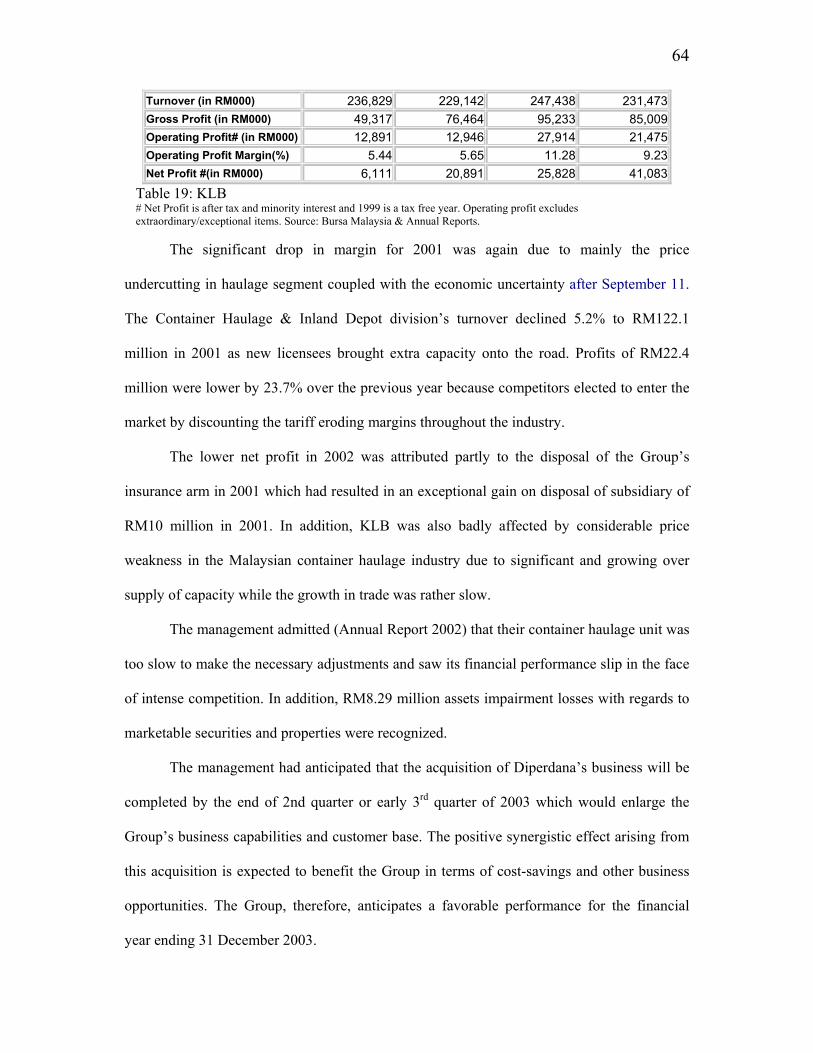
Solutions Provider’ ...........................................................................60 4.3.1 History and Business.........................................................................61 4.3.2 Financial Highlights..........................................................................63 4.4 Malaysia International Shipping Corporation Berhad (MISC):
‘The Preferred Provider of World-Class Maritime Transportation and Logistics Services’ .....................................................................65
4.4.1 History and Business.........................................................................65 4.4.2 Financial Highlights..........................................................................68 4.5 Tiong Nam Transport Holdings Berhad (TiongNam/TNH):
‘Total Logistics Provider’ .................................................................69 4.5.1 History and Business.........................................................................69 4.5.2 Financial Highlights..........................................................................70 4.6 Century Logistics Holdings Bhd (Century/CLB): ‘Your Total
Logistics Partner’ ..............................................................................71 4.6.1 History and Business.........................................................................71 4.6.2 Financial Highlights..........................................................................73 4.7 Nationwide Express Courier Services Berhad (Nationwide/NW):
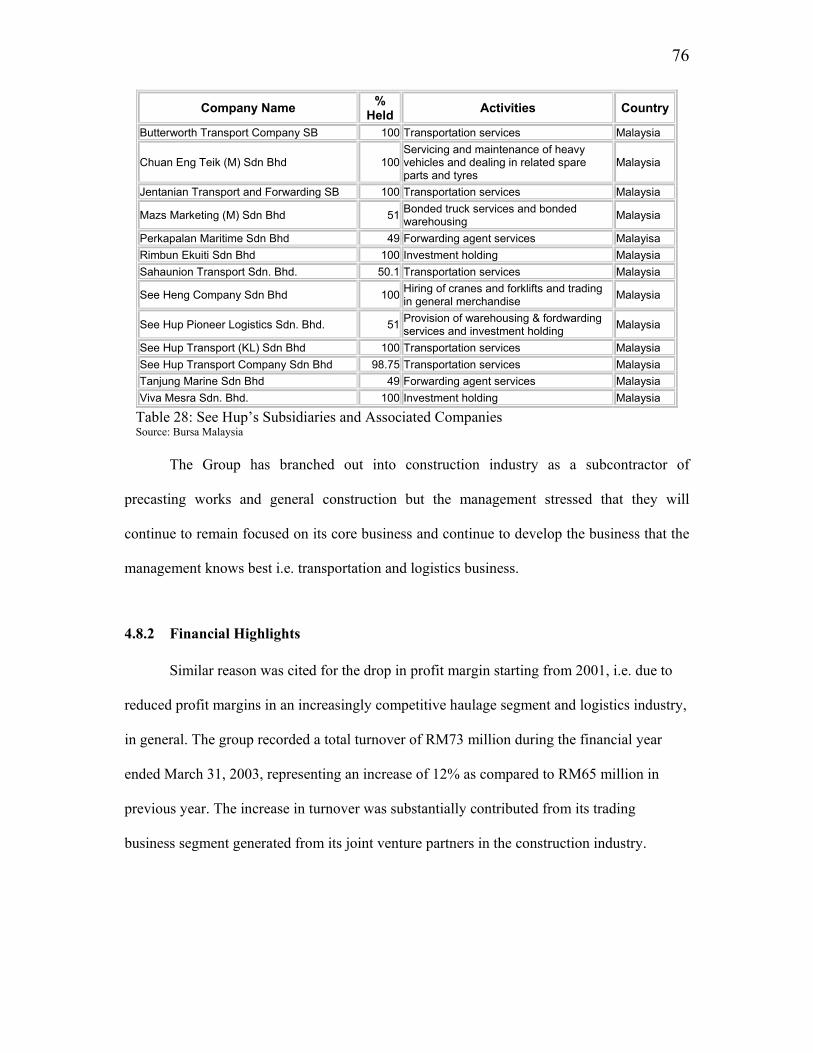
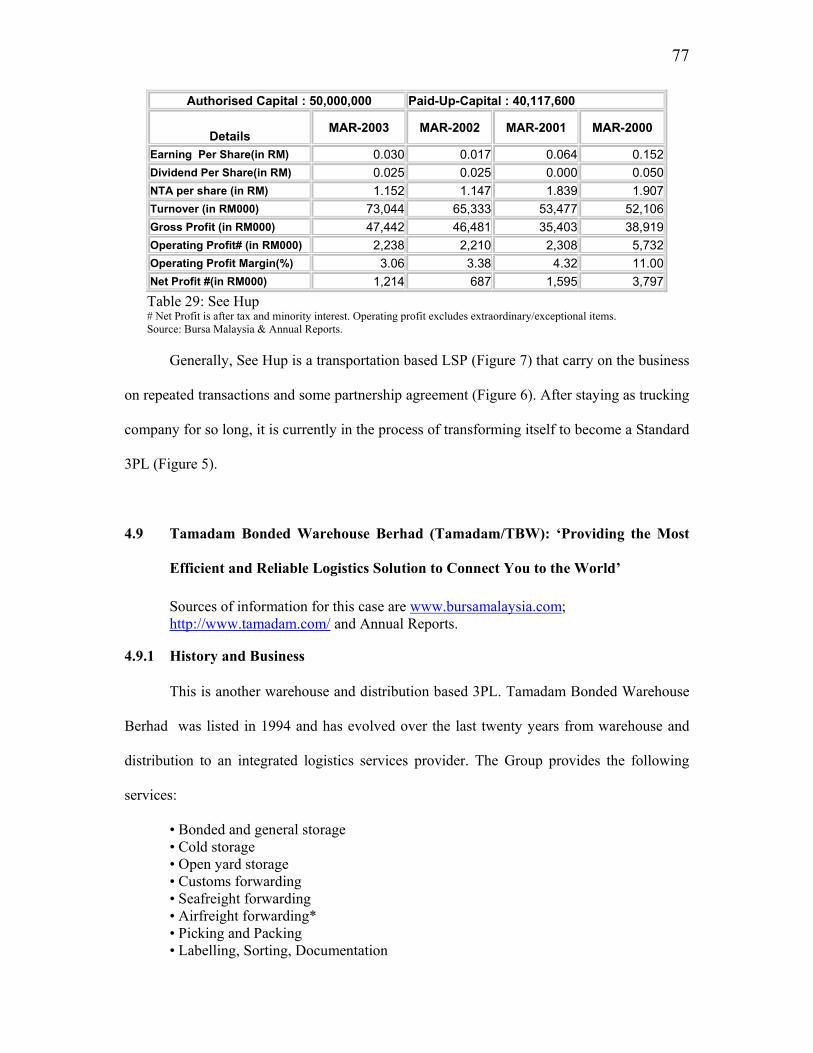
‘We Are More Than A Courier Company’.......................................73 4.7.1 History and Business.........................................................................73 4.7.2 Financial Highlights..........................................................................75 4.8 See Hup Consolidated Berhad (See Hup/SHC). ...............................75 4.8.1 History and Business.........................................................................75 4.8.2 Financial Highlights..........................................................................76 4.9 Tamadam Bonded Warehouse Berhad (Tamadam/TBW):
‘Providing the Most Efficient and Reliable Logistics Solution to Connect You to the World’...............................................................77
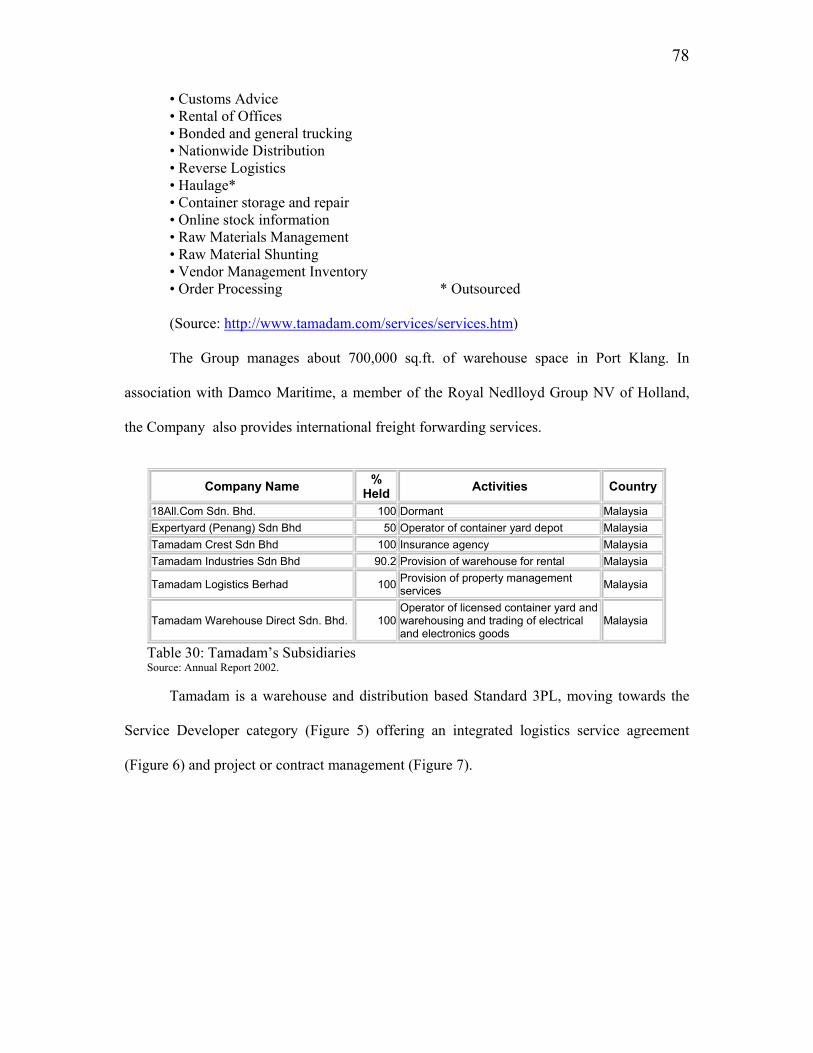
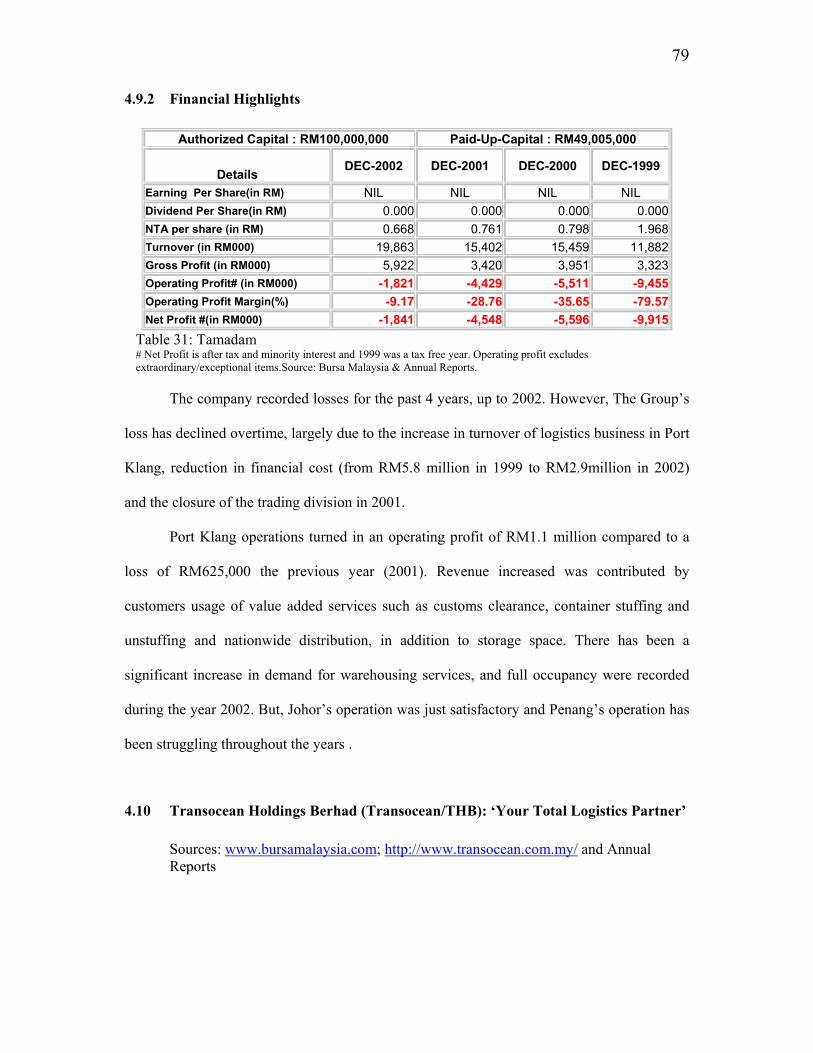
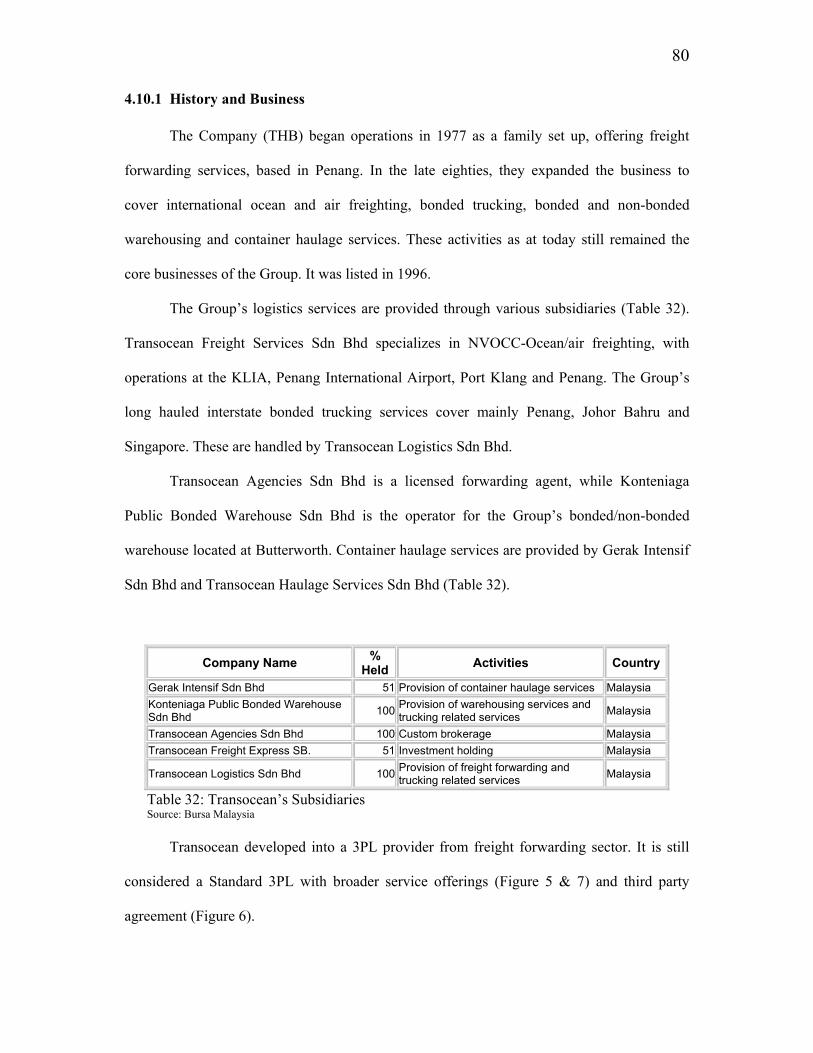
4.9.1 History and Business.........................................................................77 4.9.2 Financial Highlights..........................................................................79 4.10 Transocean Holdings Berhad (Transocean/THB): ‘Your Total
Logistics Partner’ ..............................................................................79 4.10.1 History and Business.........................................................................80 4.10.2 Financial Highlights..........................................................................81 4.11 Summary ...........................................................................................81
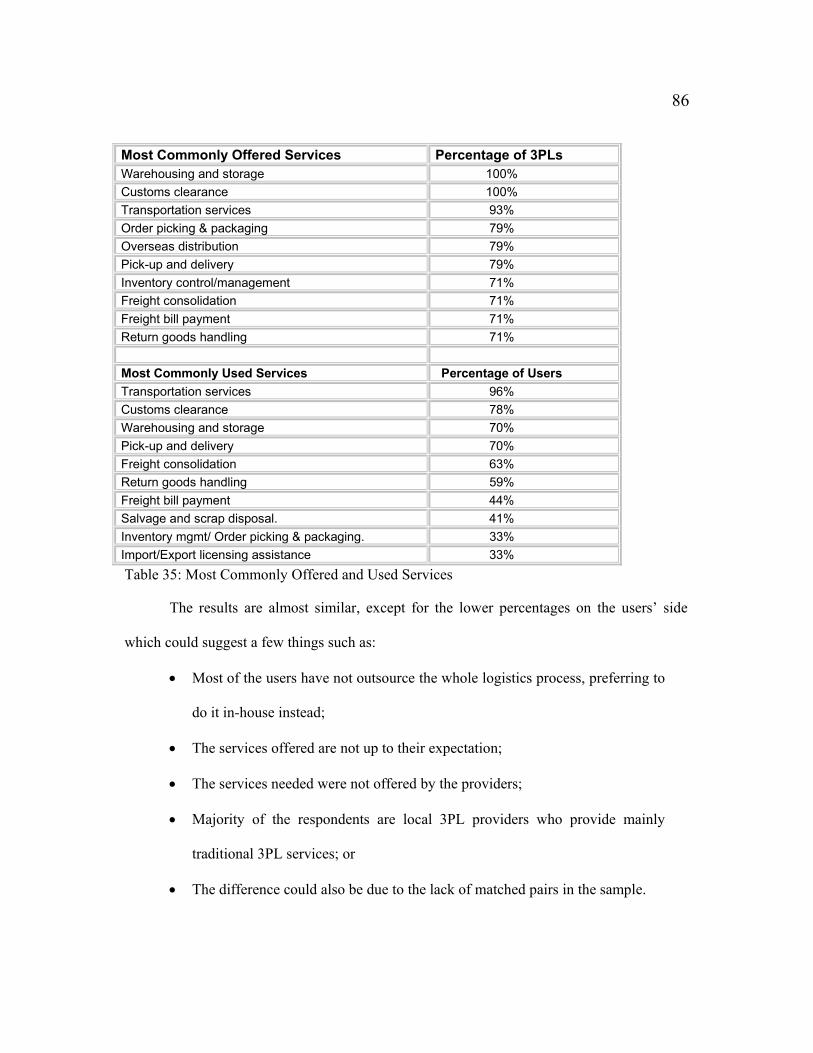
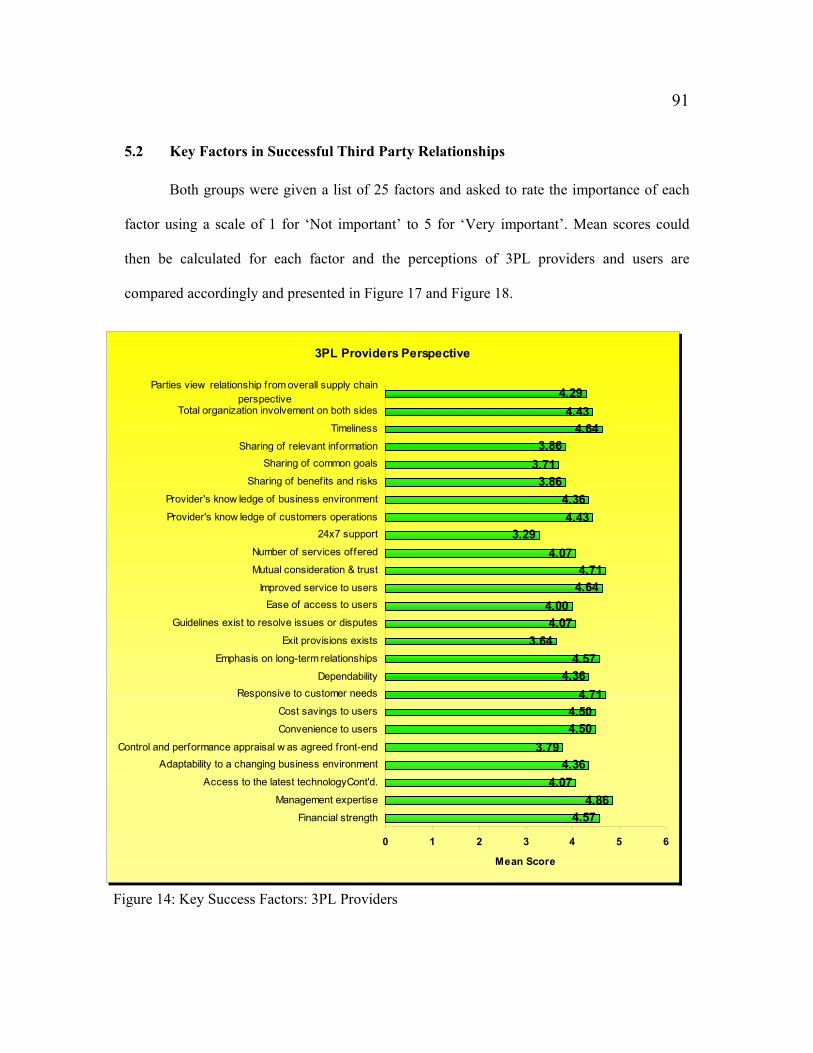
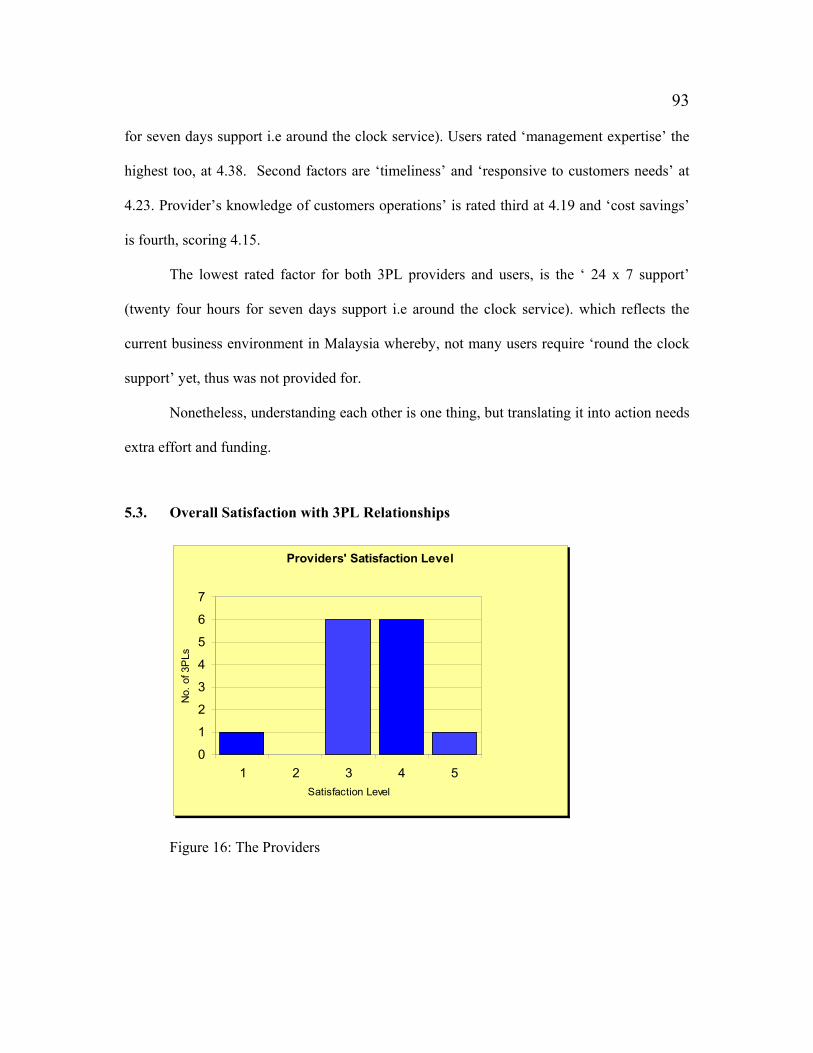
5. The Survey of 3PL Users and Providers..........................................................84 5.1 Services Offered and Used................................................................85 5.2 Key Factors in Successful Third Party Relationships.......................91 5.3. Overall Satisfaction with 3PL Relationships ....................................93
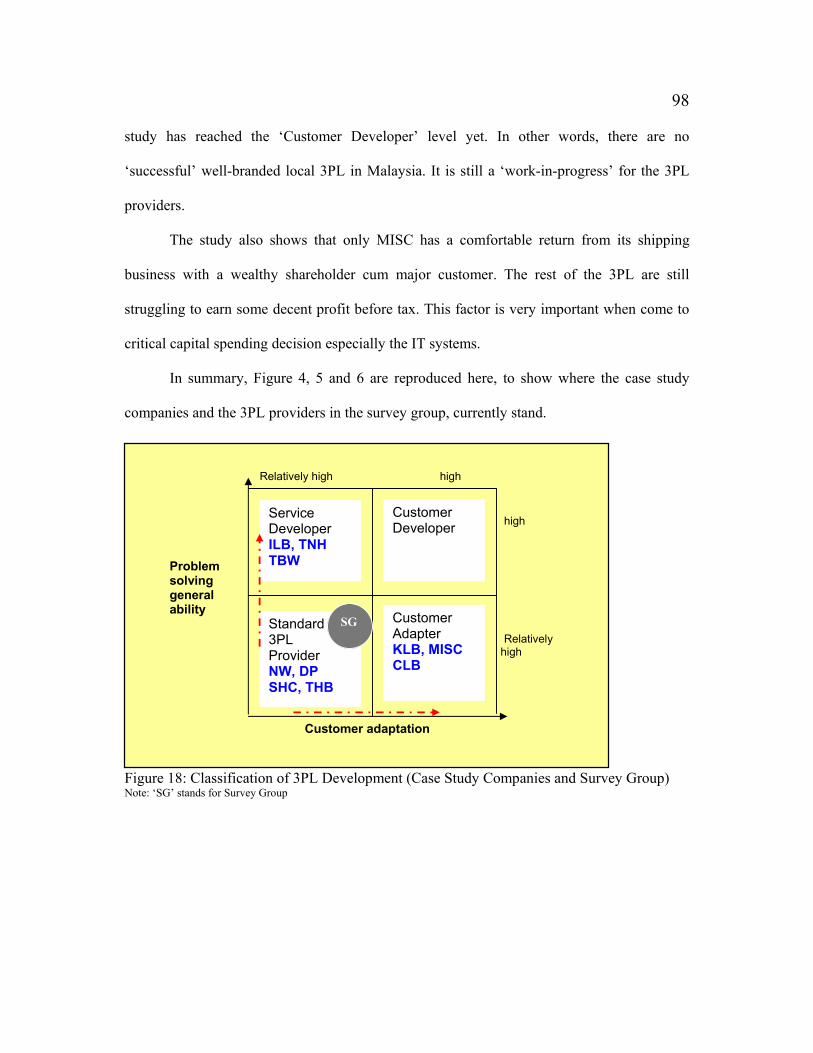
6. Conclusion .......................................................................................................95 6.1 Current Industry Scenario .................................................................95
v
6.1.1 The Evolution....................................................................................95 6.1.2 Services Provided..............................................................................97 6.1.3 Challenges.......................................................................................100 6.1.4 The New Road to Success...............................................................101
Bibliography ..............................................................................................................102 APPENDIX A: Tax Incentives for Integrated Logistics Service Providers APPENDIX B: Survey Listing for 3PL Users APPENDIX C: Survey Listing for 3PL Providers APPENDIX D: Survey Questionnaires APPENDIX E: Cover Letters
vi
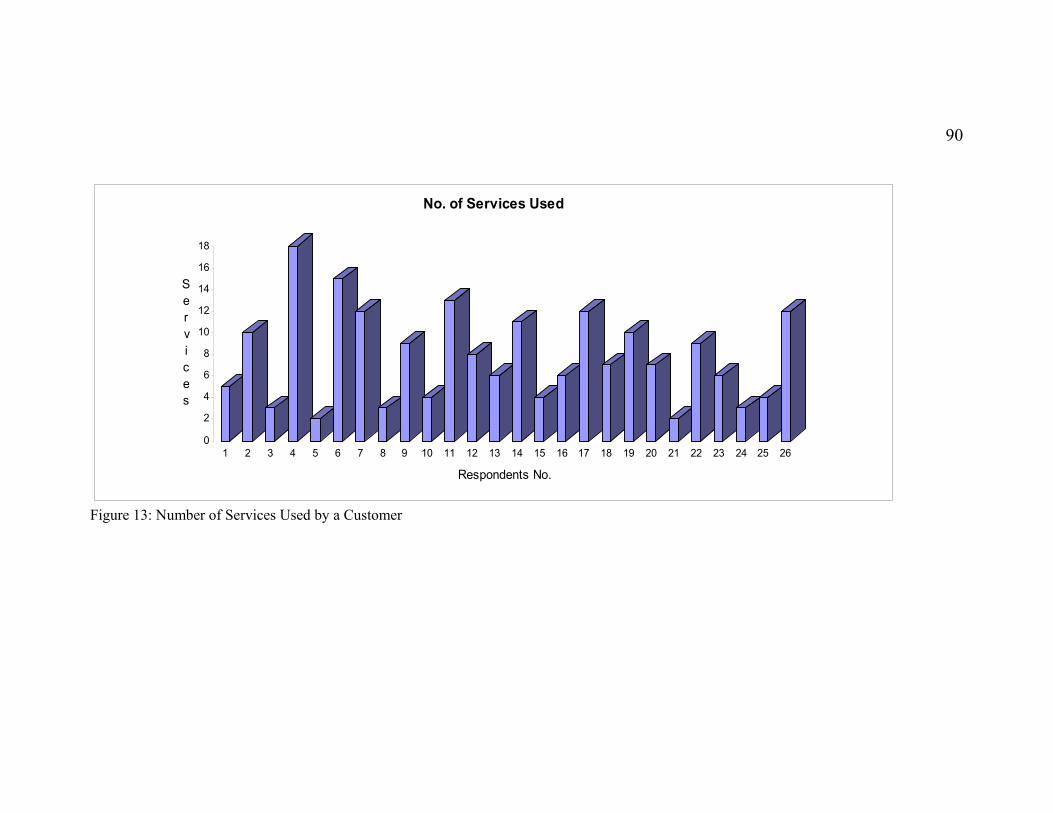
List of Figures FIGURE 1: MAP OF MALAYSIA ....................................................................................................1 FIGURE 2: THE APPROACH ..........................................................................................................5 FIGURE 3: GROSS REVENUE BY INDUSTRY - 3PL IN THE USA ..................................................11 FIGURE 4: EUROPE 1996 - OUTSOURCED LOGISTICS .................................................................20 FIGURE 5: 3PL CLASSIFICATIONS .............................................................................................22 FIGURE 6: RELATIONSHIPS BETWEEN 3PL PROVIDERS AND USERS............................................25 FIGURE 7: THIRD PARTY LOGISTICS’ VARIANCES.....................................................................26 FIGURE 8: 3PL MARKET GROSS REVENUE GROWTH (USD BILLION).......................................27 FIGURE 9: LOGISTICS FLOW ......................................................................................................37 FIGURE 10: RESPONDENTS’ CHOICE..........................................................................................85 FIGURE 11: PROVISION OF 3PLS SERVICES ...............................................................................88 FIGURE 12: USAGE OF 3PLS SERVICES .....................................................................................89 FIGURE 13: NUMBER OF SERVICES USED BY A CUSTOMER .......................................................90 FIGURE 14: KEY SUCCESS FACTORS: 3PL PROVIDERS..............................................................91 FIGURE 15: KEY SUCCESS FACTORS: 3PL USERS .....................................................................92 FIGURE 17: THE USERS .............................................................................................................94 FIGURE 18: CLASSIFICATION OF 3PL DEVELOPMENT (CASE STUDY COMPANIES AND SURVEY
GROUP)...................................................................................................................98 FIGURE 19: RELATIONSHIPS BETWEEN 3PL PROVIDERS AND USERS OF THE CASE STUDY
COMPANIES AND SURVEY GROUP. ..........................................................................99 FIGURE 20: SERVICE OFFERINGS OF THE CASE STUDY COMPANIES AND SURVEY GROUP ........99
vii
List of Tables Table 1: Previous 3PL Surveys..................................................................................13 Table 2: Types Of 3PL Providers...............................................................................25 Table 3: 3PL By The Numbers In The USA For 2002 ..............................................28 Table 4: North American-Based 3PL Revenues: Net Revenue For 2002 Of More
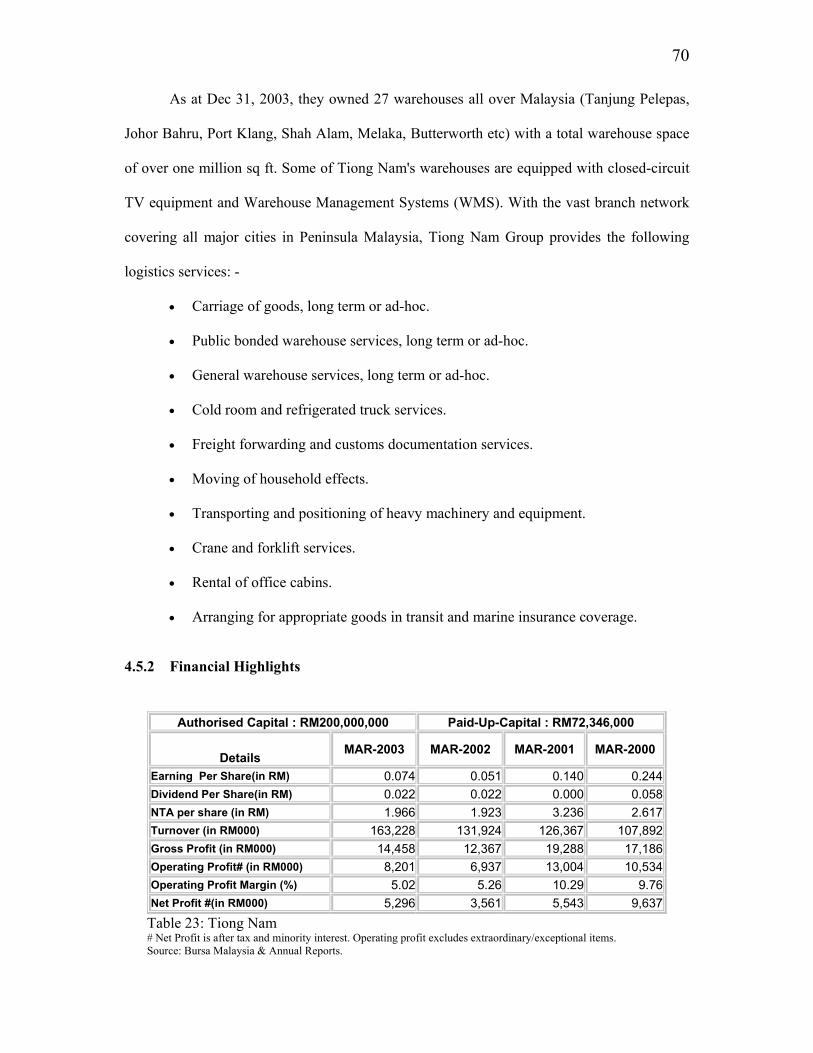
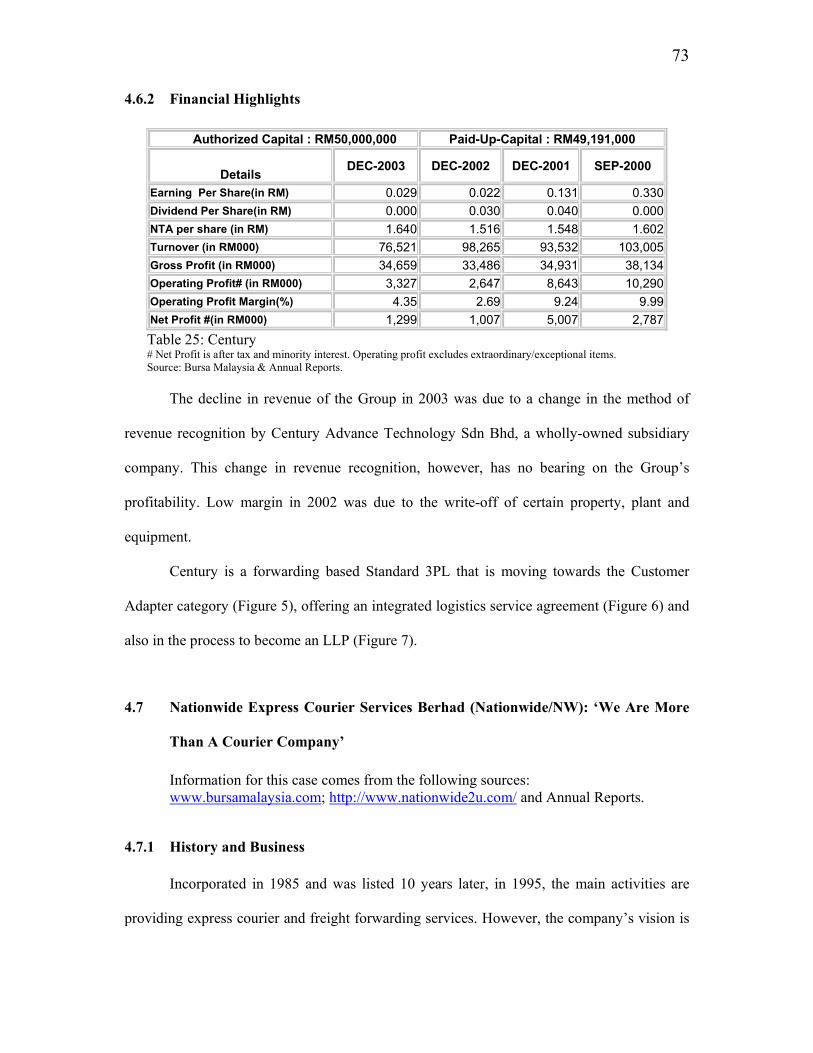
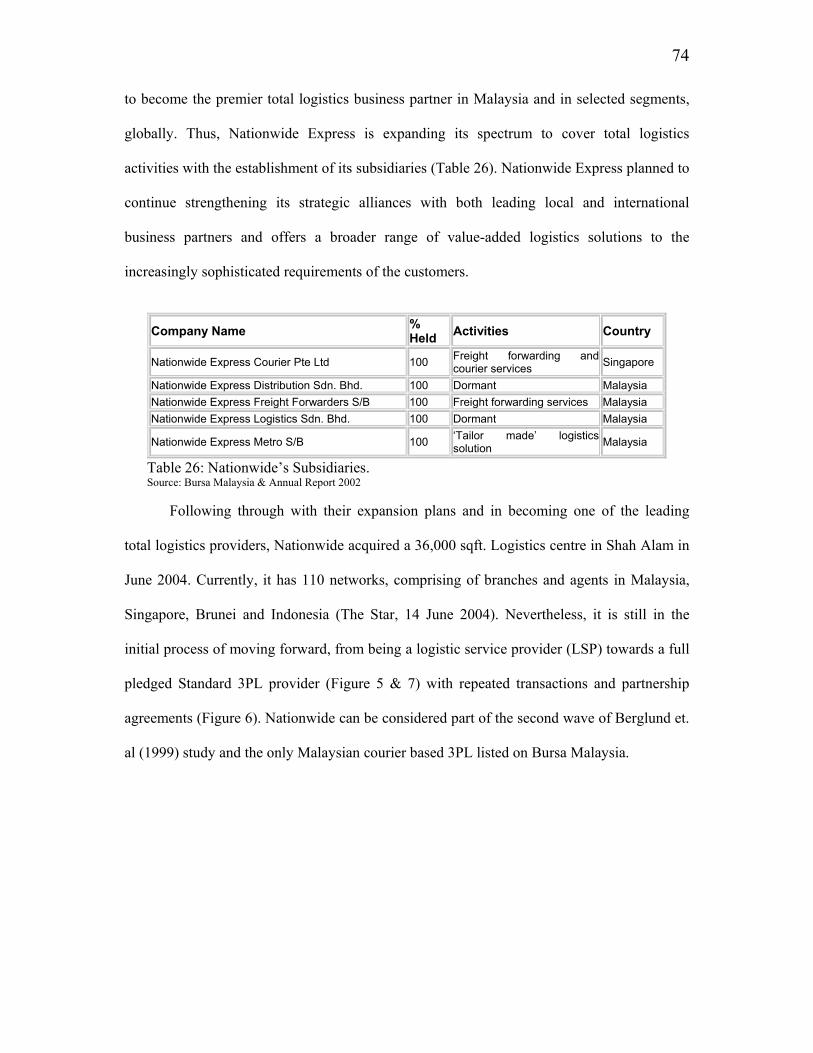
Than Usd500 Millions..................................................................................29 Table 5: Container Transportation Chain Study 1996-Summary Of Findings ..........32 Table 6: Top 10 Malaysian Shipowners.....................................................................39 Table 7: The 5 Major Container Haulage Providers ..................................................41 Table 8 : Roles And Functions Of CHAM .................................................................41 Table 9: Number Of Licensed Container Haulage Companies..................................42 Table 10: Number Of Permits Issued For Prime-Movers And Trailers.......................42 Table 11: Total Containers Hauled (In Teus) ..............................................................43 Table 12: Government Appointed Mtos ......................................................................50 Table 13: Licensing Requirements ..............................................................................51 Table 14: Diperdana - Subsidiaries..............................................................................56 Table 15: Diperdana.....................................................................................................57 Table 16: Ilb-Subsidiaries ............................................................................................59 Table 17: Ilb.................................................................................................................60 Table 18: Klb-Subsidiaries And Associated Companies .............................................63 Table 19: Klb ...............................................................................................................64 Table 20: Misc-Subsidiaries And Associated Companies ...........................................68 Table 21: Misc .............................................................................................................68 Table 22: Tiong Nam’s Subsidiaries & Associate Companies....................................69 Table 23: Tiong Nam...................................................................................................70 Table 24: Century’s Subsidiaries And Associated Companies....................................72 Table 25: Century ........................................................................................................73 Table 26: Nationwide’s Subsidiaries. ..........................................................................74 Table 27: Nationwide...................................................................................................75 Table 28: See Hup’s Subsidiaries And Associated Companies...................................76 Table 29: See Hup........................................................................................................77 Table 30: Tamadam’s Subsidiaries..............................................................................78 Table 31: Tamadam .....................................................................................................79 Table 32: Transocean’s Subsidiaries ...........................................................................80 Table 33: Transocean...................................................................................................81 Table 34: Services Provided By Local 3PL Providers In Malaysia.............................83 Table 35: Most Commonly Offered And Used Services .............................................86 Table 36 : Evolution Of 3PLs In Malaysia ..................................................................97
1
1 Introduction
Malaya acquired its independence from Britain in 1957. In 1963, Malaysia was
created through the merging of Malaya and the former British Singapore, Sabah and
Sarawak. However, Singapore separated from the union in 1965. Economically, it has a
strategic location along the Straits of Malacca and the southern part of the South China Sea.
Figure 1: Map of Malaysia Source: website of the United Nations Development Programme (UNDP).
The transport industry in Malaysia, comprising of land, sea, air and pipelines has gone
through numerous changes especially in the 1990s in terms of infrastructure facilities,
operators, equipment, manpower and operating systems. Nevertheless, there was no cohesive
and comprehensive transport policy guiding the industry, but some mode-specific policy
statements were made on ad hoc basis. Two main contributors to the development of the local
transport industry are industrialization and international trade. These two key factors are
complementary in nature and created the necessary demand for transportation and logistics
services.
2
1.1 Malaysian Economy
The Malaysian economy in the 1950s and 1960s was agro-based, dominated by
rubber, palm oil, pepper and timber. In 1970, the agricultural sector contributed 30.9% to the
GDP compared to only 14.8% from manufacturing. The growth in manufacturing sector
began in the sixties and accelerated with introduction of the Investment Incentives Act, 1968
and promotion of the free trade zones (FTZ) in 1971. These incentives managed to attract
many multinational corporations (MNC) to establish export oriented operations supported by
competitive wage, good infrastructure facilities and economically and politically stable
environment.
In the early 1980s, the Government took several measures to develop selected heavy
industries such as iron and steel, petrochemicals, cement and automobile with the objective of
strengthening the industrial base and further develop our capabilities in manufacturing sector.
As a result, the manufacturing sector’s share in GDP rose to 33.1% in 1995.
The policy framework laid by the Industrial Master Plan (IMP) and the subsequent
liberation and deregulation of the economy after the recession in mid 1980s, provided the
foundation for rapid growth of manufacturing sector. It became the lead sector in 1987 when
its’ share of GDP rose to 22.6%, surpassing agricultural sector’s share of 21.7%. In 2003, it
has stabilized around 30% and estimated to stay between 30 to 31 percent for 2004. (Bank
Negara Malaysia, 2003)
It is difficult to foresee a far greater share of the economy, coming from
manufacturing. Based on the economic structure of developed countries, the next phase of
economic expansion has to come from the service sector that includes transportation and
logistics. Between 1990 and 2000, world services output was reported to have grown by 2.9%
and the share of services in world GDP expanded from 57% to 64% over the decade (World
3
Bank, 2001). In the case of Malaysia, the services sector expanded to 57% of GDP in 2002
(Ministry of Finance, 2003).
With the progressive realization of ASEAN Free Trade Area (AFTA), economic
integration in Southeast Asia and in the broader East Asia Region is making headway.
Companies have started establishing their manufacturing facilities in one or several ASEAN
countries and developing their distribution channels throughout ASEAN. For example, in
order to capture and support the ASEAN market, Volvo has set-up two plants in the region.
Both plants assemble similar models but some of the ‘work-in-progress’ cars from Volvo
Malaysia are sent to Volvo Thailand to be completed (The Star, 14 June 2004). As a result,
they require increasingly complex cross border supply chain management capabilities i.e.
financially strong and capable third party logistics (3PL) providers.
Moreover, “a new set of international trading disciplines for services under the
General Agreement on Trade in Services (GATS) and the World Trade Organization (WTO)
would make ASEAN, in general, and Malaysia, specifically, a target for investments as well
as an export market for multinational and global providers of services, including logistics
services. These global providers are highly competitive. On the other hand, Malaysian
services industries have not been brilliant as exporters due to capacity constraints,
technological backwardness and insufficient capitalization” (Sieh Lee, 2003).
The Government1 is aware of these increasing demands, competition and problems
faced by the logistics industry and have put in place the necessary infrastructure and
incentives to stimulate greater private sector initiatives to spearhead the logistics industry.
For example, apart from improving the basic logistics infrastructure such as roads, highways,
seaports and airports, the government initiated the multimodal transport operator (MTO)
status with the view of creating Malaysian 3PL providers. (This will be elaborated in Chapter
3).
4
Additionally, it provides tax incentives with a view of creating a more business-friendly
environment as well as facilitating the private sector to reduce their cost of doing business.
(Please refer to Appendix I for details). Given the context of the globalization of services and
growing competition in the logistics sector, this thesis aims to study the progress of local 3PL
and analyze its development in Malaysia and ability to compete, taking into account the
above-mentioned scenario.
1.2 Thesis Approach
There are numerous studies conducted and papers written on the development of
logistics industry and, specifically, the 3PL industry in the USA and Europe. Based on the
studies, we can conclude that the 3PL industry has gone through an evolution path. (This will
be covered under the literature review section later). Third party logistics (definitions are
given in the next chapter) form part of the Malaysian transportation industry. Like other
sectors, it is currently undergoing intense competition. Hence, the purpose of this thesis is to
explore the 3PL development in Malaysia and to examine whether the current environment
and strategies contribute positively to the development of 3PL. A comparison will also be
made with the USA and European experience.
In order to understand the concepts of 3PL and the global and local logistics scenario,
extensive literature review was done prior to the thesis proposal. The sources include
transportation journals2, global and local 3PL providers’ annual reports, theses on logistics
done at MIT and other universities, news articles in magazines and newspapers, websites and
a number of logistics and research books. In addition, a site visit to the IKEA Distribution
Center in Shah Alam, Selangor, was made to learn about the advantages and disadvantages of
using a 3PL provider as well as looking at the warehouse operation. Maersk Logistics
Malaysia Sdn Bhd is the 3PL provider for IKEA. It has operated IKEA’s Asia Distribution
Centers since 1999. A seminar given by Mr. J.J Ong from MasKargo, the freighting arm of
5
Chapter 1 STUDY OBJECTIVES & PROBLEM ANALYSIS
Chapter 2 RESEARCH
METHODOLOGY, DATA COLLECTION & THEORETICAL FRAMEWORK
Chapter 3 LITERATURE
REVIEW
Chapter 4 CASE
STUDIES
Chapter 6 CONCLUSION
Chapter 5 THE SURVEY
RESULT
Malaysia Airlines Berhad, provided useful insights into 3PL operations for air cargo. These
site visits and seminar contributed positively to the understanding of 3PL’s operations in
Malaysia.
This thesis is structured as follows: Chapter one deals with the introduction to
Malaysia, study objectives and problem analysis. The research methods, theoretical
framework and definitions of relevant concepts and terms are presented in chapter two.
Following that, the third chapter covers literature review on global scenario of 3PL industry,
specifically looking at Europe and the USA scenario and trends and issues in the Malaysian
3PL industry. The fourth chapter put forward the Malaysian case studies, and the fifth,
analyzes the survey result. Finally, the observations and conclusion of the paper are presented
in the last chapter. For easier understanding, a diagram for the thesis approach is presented
below:
Figure 2: The Approach
6
1.3 3PL Issues in Malaysia
Nowadays, managing change is the name of the game. Managers and owners of 3PL
providers need to be on alert and flexible enough to maneuver in a new direction when
challenged by changing market conditions, customers’ behavior and global or internal
business rulings, to name a few.
The introduction of ‘outsourcing’ concept had uplifted the importance of 3PL
industry. The manufacturers, especially, had realized the need to focus on their principal
activities and let the 3PL providers handle the logistics activities. At the start, only
transportation was outsourced but, nowadays, the whole logistics activities can be outsourced.
Majority of 3PL providers in Malaysia are small and medium sizes operators,
servicing the local area around major ports in Malaysia such as Port Klang, Port of Tanjung
Pelepas and Pasir Gudang, Penang Port, Kuantan Port and Bintulu Port. Co-existing with
these 3PL providers are the larger players listed on Bursa Malaysia (formerly known as Kuala
Lumpur Stock Exchange) and the global providers. Majority of the big local 3PL providers
are subcontracting to the smaller players some part of the logistics services e.g. conventional
transportation, warehousing service and equipments. This arrangement will provide
additional capacity to 3PL providers without having to spend substantial capital outlay and at
the same time provide a steady income to the subcontractors.
The main question that will be explored here is whether the 3PL development in
Malaysia will produce a strong 3PL sector or not. Associated with this central theme are the
following questions:
• What has been the trend in 3PL development in Malaysia?
• Was the development comparable to the USA and Europe?
• Which approach has the 3PL providers chosen in order to grow?
7
• Were they influenced by their customers in implementing their strategy of expanding
their business?
• Are there any local 3PL providers that will emerge as global players?
The thesis will address these issues.
8
2 The Research Methodology and Theoretical Framework
2.1 The Research Approach
The study relies heavily on disclosed and published materials such as logistics firms’
annual reports, journals, newspapers and business magazines articles, published reports
produced by consultants and special studies and reports commissioned by the Malaysian
Government. In addition, the study also relies on information provided by the 3PL users, 3PL
providers, industry experts and practitioners by means of survey and unstructured interviews.
2.1.1 Qualitative Study
Qualitative study is more appropriate for this research because the main research
problem of this thesis involves a lot of information that cannot be quantified such as the
companies’ strategies, differentiation of services offered and unique features of companies.
Nevertheless, some quantitative comparison will be made wherever possible using data
obtained from the questionnaire survey.
2.1.2 Methods for Collecting Data
The main methods used to collect data are literature review, interviews and a postal
survey.
2.1.2.1 Literature Review
Collecting vast amounts of information regarding global and local 3PLs through
literature review and compiling it into a meaningful form, which create the foundation for
further analysis, is almost the only way to cover such a broad subject in the allotted time.
Unpublished information and financial data needed for this thesis are hard to obtain directly
from the companies and are confidential in nature for commercial reasons.
9
Furthermore, gaining access to key decision makers and management in the 3PLs
across Malaysia is not feasible due to the time and economic constraint of this study. Even if
it might be possible to gain access to this level of personnel, it is certain that their corporate
positions will influence their views. Here, the data collected give a much more objective view
based on information that is publicly available and can be compared with various additional
sources to ensure its soundness and reliability.
Due to the time and cost factors and not to mention its convenience, government and
company websites as well as news information on the internet are important sources of data
throughout this study. Business magazines, newspapers and personal websites on related
subjects also provided differing views from various perspectives, which at times questioned
the corporate reasoning behind a certain decision taken up by companies concerned. Overall,
the collection of facts and figures from the annual reports of companies, their websites,
interviews, journals, newspaper and magazine articles form the backbone of the research and
the profiling of 3PL cases.
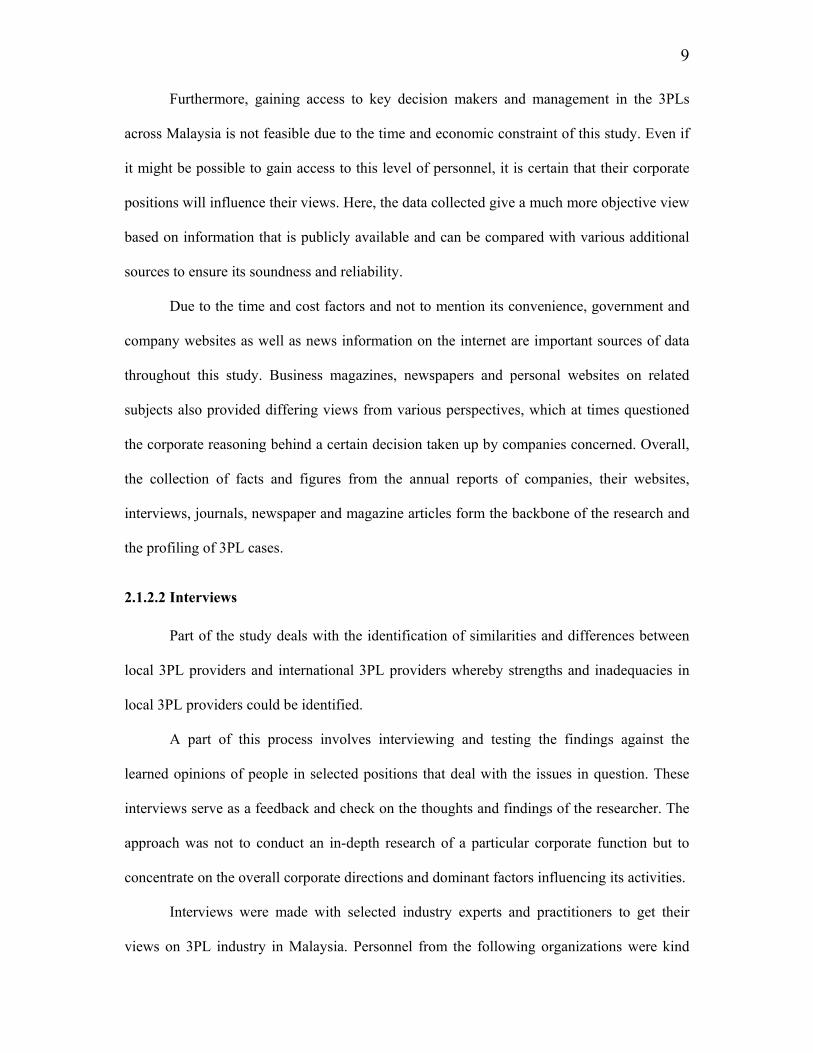
2.1.2.2 Interviews
Part of the study deals with the identification of similarities and differences between
local 3PL providers and international 3PL providers whereby strengths and inadequacies in
local 3PL providers could be identified.
A part of this process involves interviewing and testing the findings against the
learned opinions of people in selected positions that deal with the issues in question. These
interviews serve as a feedback and check on the thoughts and findings of the researcher. The
approach was not to conduct an in-depth research of a particular corporate function but to
concentrate on the overall corporate directions and dominant factors influencing its activities.
Interviews were made with selected industry experts and practitioners to get their
views on 3PL industry in Malaysia. Personnel from the following organizations were kind
10
enough to be interviewed on an informal basis (the information given was general industry-
wide comments and not company-specific):
1. Container Hauliers Association of Malaysia (CHAM);
2. Konsortium Logistik Berhad (KLB);
3. DHL Malaysia;
4. Westprise Sdn Bhd which provides trucking and haulage services to 3PL
providers (a subcontractor);
5. Multimodal Freight Sdn Bhd;
6. TNT;
7. BAX Global;
8. Linfox Logistics Sdn Bhd; and
9. MISC Agency Sdn Bhd.
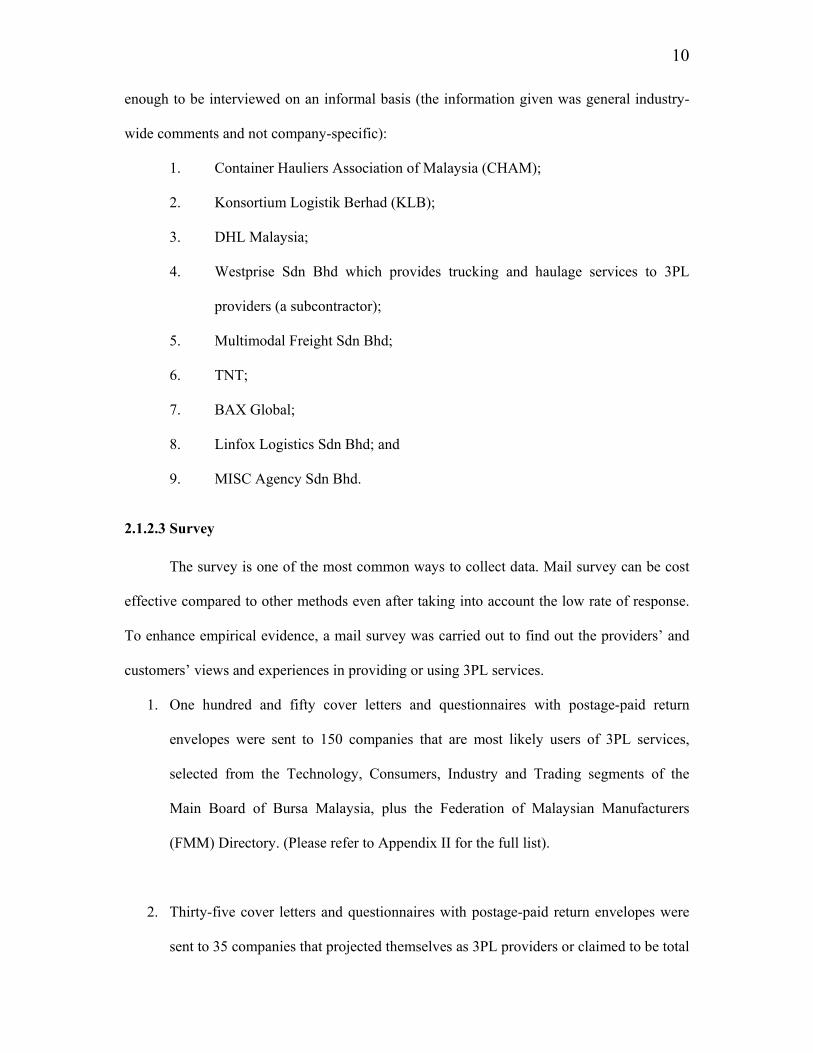
2.1.2.3 Survey
The survey is one of the most common ways to collect data. Mail survey can be cost
effective compared to other methods even after taking into account the low rate of response.
To enhance empirical evidence, a mail survey was carried out to find out the providers’ and
customers’ views and experiences in providing or using 3PL services.
1. One hundred and fifty cover letters and questionnaires with postage-paid return
envelopes were sent to 150 companies that are most likely users of 3PL services,
selected from the Technology, Consumers, Industry and Trading segments of the
Main Board of Bursa Malaysia, plus the Federation of Malaysian Manufacturers
(FMM) Directory. (Please refer to Appendix II for the full list).
2. Thirty-five cover letters and questionnaires with postage-paid return envelopes were
sent to 35 companies that projected themselves as 3PL providers or claimed to be total
11
and/or integrated logistics providers. The list includes international and local
providers, which was compiled based on information available on their websites and
their latest Annual Reports. The local providers list was gathered from Bursa
Malaysia and the FMM Directory of service providers. As for the international
providers, an internet search was done to find the Malaysian offices or affiliated
companies of the well-known global providers such as DHL, UPS and Schenker.
(Please refer to Appendix III for the survey list).
The search for users started from the website of Bursa Malaysia ( the Kuala Lumpur Stock
As a starting point for sample selection and in order to ensure a high possibility that the
companies chosen are users of 3PLs, selection of the samples was guided by Cass Logistics’
percentage of 3PL gross revenue by industry for 2002 in the USA (Armstrong, 2003), as per
Figure 3 below.
Figure 3: Gross Revenue by Industry - 3PL in the USA
Food & Groceries 17%
Other 9%
Automotive 12%
Chemical & Utilities 12%
Industrial 12%
Healthcare 5%Consumer
Goods 13%
Retailing 13%Technology
13%
Source: Cass Logistics
12
The figure shows that 30% of the gross revenue came from food & groceries and
consumer goods industries. Technology, retailing, automotive, industrial, chemical & utilities
and healthcare contributed 61% and the rest were from other industries. Similar condition is
expected to be observed in Malaysia due to equivalent logistics needs of these industries.
Thus, the Technology, Consumers, Industry and Trading & Services segments of
Bursa Malaysia were selected. First, a check on the profiles of all the companies in those
segments was carried out to ascertain the companies’ activities. Those involved in IT
consultancy business, engineering or anything that do not depend on logistics or
transportation were removed from the list. Second, the addresses were copied from either
respective websites or the Listed Companies’ Profile page in the Bursa Malaysia’s website.
Third, the contact persons of companies, i.e. directors/executives chosen for the
survey were then extracted from its latest available Annual Report and at the same time the
address was also verified. Lastly, with the data collected, a final verification was done by
scrutinizing the announcements made for changes in address, directorship and management
by the companies to Bursa Malaysia after their Annual Report dates. This step is crucial in
order to reduce the probability of ‘return to sender’ incidence.
A total of 86 samples were selected through the above procedure. A further 64
samples were then selected from the FMM Directory to take into account the private limited
companies and manufacturers involved in the above-mentioned industries. The process was
much easier compared to the earlier one because all the relevant data of a company is
presented on the same page and the website, i.e. http://www.fmm.org.my/, is up to date.
For this reason, the initial search for the 3PL providers’ samples was done at the
FMM Directory but, unfortunately, not many 3PL providers are registered with FMM.
Accordingly, beside the Trading & Services segment of the Bursa Malaysia, the Northport’s
13
list of registered service providers in http://www.northport.com.my/servicedir_main.asp was
also used.
They were given a month to return the completed questionnaires. No follow-up was
done because the survey was arranged in such a way that the identities of respondents are
anonymous in a hope that they would be more willing to reply without fear or favor.
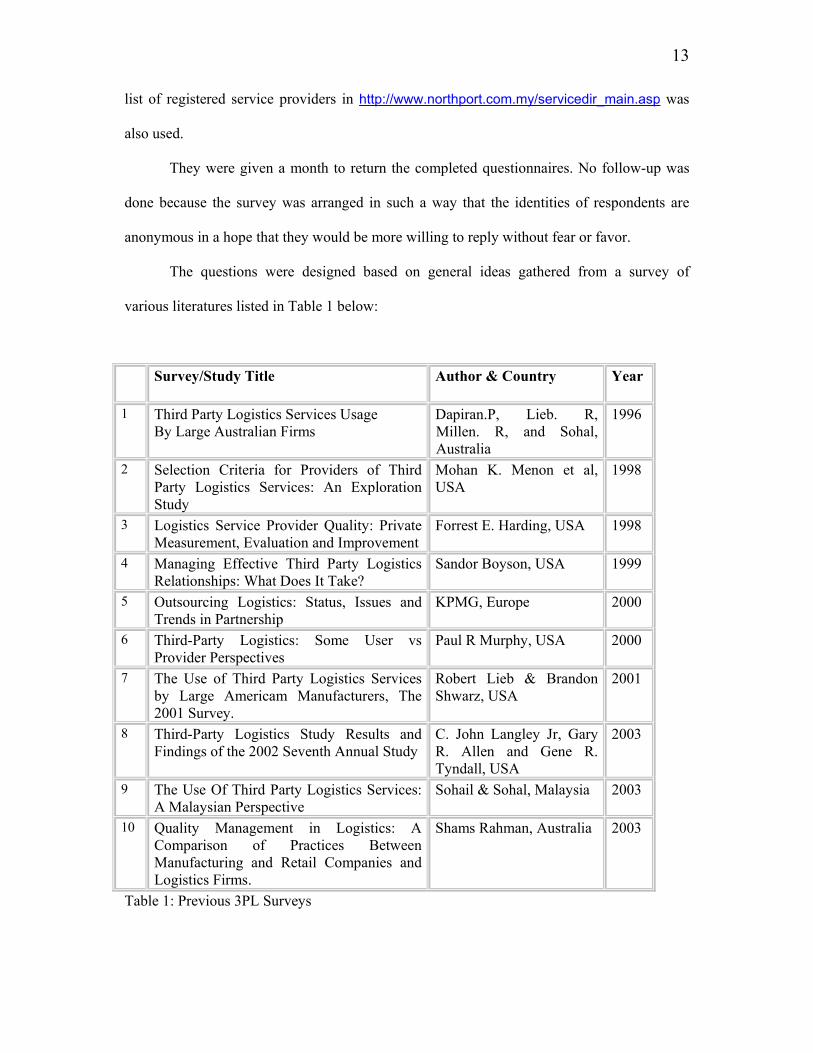
The questions were designed based on general ideas gathered from a survey of
various literatures listed in Table 1 below:
Survey/Study Title Author & Country Year
1 Third Party Logistics Services Usage By Large Australian Firms
Dapiran.P, Lieb. R, Millen. R, and Sohal, Australia
1996
2 Selection Criteria for Providers of Third Party Logistics Services: An Exploration Study
Mohan K. Menon et al, USA
1998
3 Logistics Service Provider Quality: Private Measurement, Evaluation and Improvement
Forrest E. Harding, USA 1998
4 Managing Effective Third Party Logistics Relationships: What Does It Take?
Sandor Boyson, USA 1999
5 Outsourcing Logistics: Status, Issues and Trends in Partnership
KPMG, Europe 2000
6 Third-Party Logistics: Some User vs Provider Perspectives
Paul R Murphy, USA 2000
7 The Use of Third Party Logistics Services by Large Americam Manufacturers, The 2001 Survey.
Robert Lieb & Brandon Shwarz, USA
2001
8 Third-Party Logistics Study Results and Findings of the 2002 Seventh Annual Study
C. John Langley Jr, Gary R. Allen and Gene R. Tyndall, USA
2003
9 The Use Of Third Party Logistics Services: A Malaysian Perspective
Sohail & Sohal, Malaysia 2003
10 Quality Management in Logistics: A Comparison of Practices Between Manufacturing and Retail Companies and Logistics Firms.
Shams Rahman, Australia
2003
Table 1: Previous 3PL Surveys
14
2.2 Theoretical Framework
The concept and framework for this thesis was developed principally based on the
works of Susanne Hertz and Monica Alfredsson (2003) and M.S. Sohail and A.S. Sohal
(2003). Hertz and Alfredsson studied the development of 3PL in Europe via case studies and
Sohail and Sohal explored the usage of 3PL services in Malaysia by means of mail survey in
year 2000. Concepts from these studies are used to delve into the development of 3PL
providers in Malaysia.
2.3 Financial Performance
Historical data from annual reports of a company measure its past performance
rather than its future plan and strategy. Yet, the previous financial performance does help in
giving indication of the company’s ability to move forward without incurring extra debts.
A long-term perspective needs to be taken to measure strategic and financial
performances (Algera & Paring, 2001). Hence, for the case studies, four-year results were
obtained from their Annual Reports submitted to Bursa Malaysia that was tabled during the
companies past Annual General Meetings and the reports were audited by licensed
accounting firms, in some cases by the big four accounting firms in the world, i.e. KPMG,
Ernst & Young, PWC and Deloitte.
2.4 Definitions of Central Concepts and Terms
This thesis will employ the following central concepts and terms according to the
meaning described.
15
Multinational Corporations (MNC)
A multinational corporation is a firm that operates in more than one country. The
United Nations defines MNC as a corporation that comprises entities in two or more
countries, regardless of legal form and field of activity. It operates under a coherent system of
decision making and common strategy and linked by ownership or otherwise that one or more
entities exercise significant influence over the activities of others.
Logistics
Broadly defined, logistics is the management of a process of a supply chain. It
comprises a number of interrelated and interactive activities covering procurement,
production and distribution. It is concerned with physical and information flows from raw
material through to the final distribution of finished product. (Langley, Allen & Tyndall,
2003).
The most quoted definition is by the Council of Logistics Management, which stated
that:
Logistics is the process of planning, implementing and controlling the efficient,
effective flow and storage of raw materials, in-process inventory, finished goods,
services, and related information from point of origin to point of consumption for
the purpose of conforming to customer requirements.
Contract Logistics
A contractual agreement to provide logistics services. Usually prices, length of
contract (term), services required and other considerations are defined and agreed to by the
parties.
16
Supply Chain Management (SCM)
The definition of ‘supply chain’ seems to be more common across authors than the
definition of SCM. Christopher (1992) define a supply chain as the network of organizations
that are involved, through upstream and downstream linkages, in the different processes and
activities that produce value in the form of product and services delivered to the ultimate
customer.
After studying a number of previous definitions, Mentzer et al. (2001) provide a more
refined definition from both ‘supply chain’ and SCM. Supply chain is a set of three or more
entities (organizations or individuals) directly involved in the upstream and downstream
flows of products, services, finances, and/or information from a source to a customer.
SCM is then defined as the systemic, strategic coordination of the traditional business
functions and the tactics across these business functions within a particular company and
across businesses within the supply chain, for the purposes of improving the long-term
performance of the individual companies and the supply chain as a whole.
Integrated Logistics
Integrated logistics is the process of anticipating customer needs and wants; acquiring
the capital, materials, people, technologies and information necessary to meet those needs
and wants; optimizing the goods or service producing network to fulfill customer requests;
and utilizing the networks to fulfill customer requests in a timely manner (Little, 1991).
Third Party Logistics (3PL)
Third-party logistics involves the use of external companies to perform logistics
functions that have traditionally been performed within an organization. The functions
17
performed by the third party can encompass the entire logistics process or selected activities
within that process. (Lieb, Millen & Wassenhove, 1993)
According to this definition, third party logistics includes any form of externalization
of logistics activities previously performed ``in-house''. If, for example, a company with its
own transport facilities decides to employ external transporters, this would, according to the
above definition, be an example of third party logistics. The same applies to a company
which closes its warehouse and instead uses an external warehouse.
Berglund (2000) in his doctoral dissertation describes 3PL as an external provider
who manages, controls and delivers logistics activities on behalf of a shipper. The
relationship can be formal or informal and should be mutually beneficial and a continuous
one. The activities performed can include all or a part of the logistics activities but at least
should include the management and execution of transport and warehousing activities.
A similar definition was offered by Coyle, Bardi and Langley (2003) i.e. ‘Essentially,
a third party logistics firm may be defined as an external supplier that performs all or part of a
company’s logistics functions’. However, they also pointed out that a ‘true’ 3PL providers
offer an integrated multiple logistics activities with solutions to logistics or supply chain
problems.
Lead Logistics Provider (LLP)
A value-added logistics provider, who manages other contract logistics operators and
provides supply chain consulting services for his customer (Armstrong, 2003).
Lead Logistics Manager (LLM)
A value-added lead logistics provider, who designs, builds and manages supply chain
assets, processes, people and technology (Armstrong, 2003).
18
Fourth Party Logistics (4PL)
Accenture, Inc. came up with the 4PL concept and bought the right to it. They defined
4PL as being a firm that assembles and manages the resources, capabilities and technology of
its own organization with those of complementary service providers to deliver a
comprehensive supply chain solution. 4PL leverages the capabilities of 3PLs and IT service
providers through centralize contact. It serves as an integrator that brings together customer
needs and resources available. (Langley et al., 2003).
Armstrong (2003) summed it up as a consultant operating in the capacity of an LLP,
LLM or Supply Chain Integrator.
19
3 Literature Review
3.1 Industry Environment
This literature review will look at how scholars have understood the development of
3PL in Europe and the USA. The progress of the 3PL industry is shaped by developments in
the world economy that are moving from being protected with trade barriers towards
liberalization. The introduction of Euro currency, the deregulation of truck and railway
industries in Europe and the USA for example, has changed the business environment
considerably (Algera & Paring, 2001).
A good model of a 3PL that move in tandem with the economic expansion is DHL's (with its
current advertisement slogan of ‘Moves the World’) move to become a leading 3PL provider
worldwide. It provides a wide range of activities from simple air, sea, road and rail
transportation, to warehousing, inventory management and distribution, supply chain
management, specialty services, and IT services (DHL, in press). A study done by Berglund,
van Laarhoven, Sharman and Wandel (1999) discovered that there were 3 waves of 3PL
development.
"The first wave happened in the 1980s when the traditional transport firms developed
into 3PL while the second wave started in early 1990s when courier firms such as TNT,
DHL, FedEx, etc. entered. In the last wave (late 1990s) the players entering have been
consultancy, financial firms and IT management firms such as Anderson Consulting, GE
capital and Manugistics" (Hertz & Alfredsson, 2003). Consequently, Gordon (2003) found
that the market is very fragmented, and there is a wide recognition that the service range
needs to be enhanced and technology processes optimized. Additionally, international
20
presence is necessary to meet shorter delivery time and value added services demanded by
customers.
3.2 Third Party Logistics Development in Europe
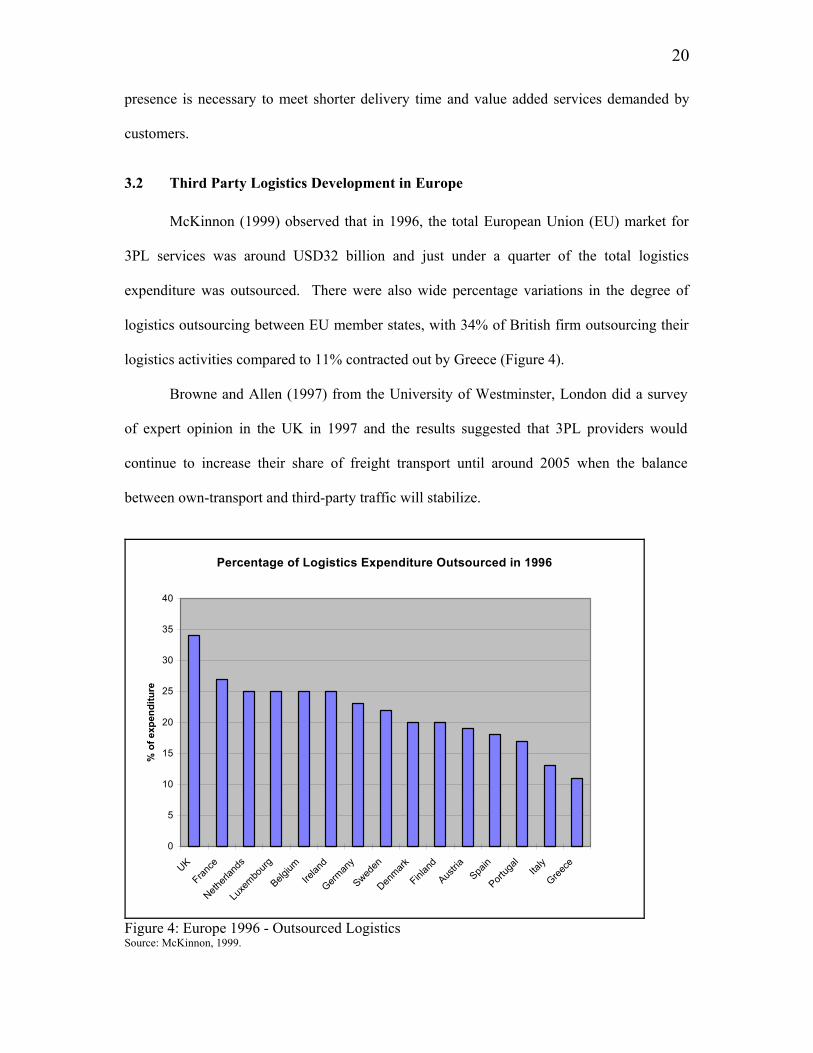
McKinnon (1999) observed that in 1996, the total European Union (EU) market for
3PL services was around USD32 billion and just under a quarter of the total logistics
expenditure was outsourced. There were also wide percentage variations in the degree of
logistics outsourcing between EU member states, with 34% of British firm outsourcing their
logistics activities compared to 11% contracted out by Greece (Figure 4).
Browne and Allen (1997) from the University of Westminster, London did a survey
of expert opinion in the UK in 1997 and the results suggested that 3PL providers would
continue to increase their share of freight transport until around 2005 when the balance
between own-transport and third-party traffic will stabilize.
Percentage of Logistics Expenditure Outsourced in 1996
0
5
10
15
20
25
30
35
40
UK
France
Netherl
ands
Luxe
mbourg
Belgium
Irelan
d
German
y
Sweden
Denmark
Finlan
d
Austria
Spain
Portug
alIta
ly
Greece
% o
f exp
endi
ture
Figure 4: Europe 1996 - Outsourced Logistics Source: McKinnon, 1999.
21
Hertz and Alfredsson (2003) felt that the main challenge for a 3PL provider is to
balance between the ability to adapt to individual customers and to create and develop a more
general ability of solving problems for many customers. The resources requirement and
activities will differ, depending on the strategy chosen by the 3PL provider and its core
competency. For example, a high degree of general problem solving ability implies a
different type of management and network than a high degree of customer adaptation. Thus,
they opined that designing international logistics systems are both complex and demanding.
They analyzed different types of 3PLs for the Scandinavian market, to see how their
customers and customers´ customer, suppliers and partners affect their choice of strategy and
the shifts made overtime. The matrix model of general problem-solving ability and the ability
of customer adaptation (Figure 5) was used to identify the following 4 categories of 3PL: -
I. The Standard 3PL Provider offers the standardized warehousing, distribution,
pick and pack;
II. The Service Developer provides advanced value-added services, differentiated
services for different customers, specific packaging, cross docking, track and
trace, security systems etc. They focus on creating economies of scale and
scope;
III. The Customer Adapter takes over customers’ existing total logistics and
warehousing activities, improves the efficiency in handling but doesn’t
develop the service further. They also relies on a few very close customers;
and
IV. The Customer Developer often takes over its customers’ whole logistics
operation and develops advanced customer solutions for each customer. They
share the risk and rewards of the logistics management with the customer.
(Source: Hertz and Alfredsson (2003))
22
Relatively high high high Problem solving general ability Relatively high
Customer adaptation Figure 5: 3PL Classifications Adapted from Hertz and Alfredsson (2003)
ASG Logistics, Transfargo, DHL and Cat Logistics were taken as their case studies to
illustrate the influence of the above-mentioned parties. In those cases, all of them took on
more advanced activities and increased integration with customers and continue their
development into Customer Developer category, as indicated by the three bold arrows in
Figure 5. They concluded that not only customers but also the customers’ customers and
partners have a heavy influence on 3PL providers’ strategic development since the 3PL
providers have a rather high degree of customer adaptation.
“In 2001, the European logistics industry is characterized by fragmentation where the
eight largest companies together have a market share of around 20%. The two largest
companies, Danzas and Schenker have each around 6%” (Algera & Paring, 2001).
In terms of consolidation, the 3PL industry in Europe was relatively late to initiate the
merger and acquisitions process (compared to the USA) because the big providers were
initially skeptical of the idea. But, they managed to catch up quickly with Deutsche Post
leading the pack.
Service Developer
Customer Developer
Customer Adapter
Standard 3PL Provider
23
Andersson and Norrman (2002) concluded that the globalization and its consequences
have forced the European logistics industry to consolidate, resulting in many mergers and
alliances in recent years. For instance, the former two largest transport and logistics
companies in the Nordic countries, BTL and ASG, were bought and incorporated into large
networks by Schenker, (May 1999) and Danzas, (April 1999) respectively. This trend has
brought into being, bigger and more powerful global logistics service providers as the number
of competitors declined.
In an analysis based on a client survey covering 1000 manufacturers and retailers
throughout a range of industry sectors, Datamonitor (2002) identified the following key
points in its ‘European Logistics Spend 2002– 3PL Potential’ study:
• “The largest 3PLs will remain strong in the consumer and retail sector while smaller
players will struggle. This is especially true for the UK market. Smaller players may
have to direct their business towards niche operations within this sector to remain
competitive.
• Road haulage still dominates the transport of goods in all industry sectors. As 3PL’s
market share grows, this could reduce the business being won by road haulage
companies and these players may have to enhance their service offering to remain
competitive in the long run.
• It may not be enough for 3PLs to regard the industry sectors with the largest logistics
spend dedicated to 3PLs as those with the greatest potential. Sometimes this will not
be the case and can be quite the opposite as markets become saturated with players
competing for the same business.
• Logistics providers will be looking to focus towards markets that are not only willing
to out-source their logistics requirements but also to develop relationships that involve
high levels of management and value added service. 3PL penetration in all industry
24
sectors will certainly grow, and providers must be aware of how and where to direct
their business.” (Source: Datamonitor (2002)
Furthermore, Datamonitor also established that there was a significant migration from
asset-based logistics to value added and integrated contract logistics solutions.
Total logistics spending in Europe for 2003 is estimated to be around the regions of
USD140-160billion per annum, of which USD35-40billion (25%) is directly contracted out to
3PL providers. Distributors, warehousing and transportation infrastructure companies such as
Spiegel and JC Penney have started offering 3PL services too (www.eyefortransport.com ,
Sept 2003).
3.3 Third Party Logistics Development in the USA
Bowersox, Daugherty, Droge, Rogers and Wardlow (1989) looked at the development
of logistics from the inter-organizational point of view, i.e. the relationship between provider
and user of logistics functions on a continuous scale, going from single transaction to
integrated service agreements, as shown in Figure 6.
This progress in terms of integration and commitment was mainly due to customers’
requirement, which the logistics providers willingly complied with because it provided them
with long-term flow of income and hopefully additional service agreements. This is similar to
the customer adaptation case mentioned earlier.
25
Figure 6: Relationships between 3PL providers and users Source: International Journal of Physical Distribution & Logistics Management, 2000. The logistics services are intended to encompass transportation, warehousing, distribution,
financial services, etc. Many of the 3PLs were formerly carriers, hauliers, warehouse owners,
freight forwarders and courier companies but some IT companies have started to offer
logistics services too (Langley et al., 2003). Table 2 summarizes the types of 3PL providers
in the USA.
Type Companies based in the USA Transportation based Ryder, Menlo Logistics, Schneider Logistics,
FedEx Logistics, UPS Logistics. Warehouse/Distribution based Exel Logistics, USCO, DSC Logistics Forwarder based Kuehne & Nagel, Fritz Financial based GE Information Services IT based Transplace, Nistero
Table 2: Types of 3PL Providers. Source: Langley et al., 2003.
Transportation companies extend beyond their traditional activities to provide a more
comprehensive service. Some of them are subsidiaries or division of large transportation
firms that utilize the parent company’s assets. Normally, distribution and warehouse
26
providers have already been offering inventory management, which make the transition to
integrated logistics services less complex.
By putting together packages of logistics services that is a mere extension of their
middleman role, the freight forwarders can promote themselves as non-assets based 3PL.
Financial based 3PL provides freight payment services, auditing, cost accounting control and
logistics management tools to monitor, book, track and manage inventory. IT based 3PL
offers web-enabled platform to bring together shippers and carriers worldwide to collaborate
on their transportation planning and execution.
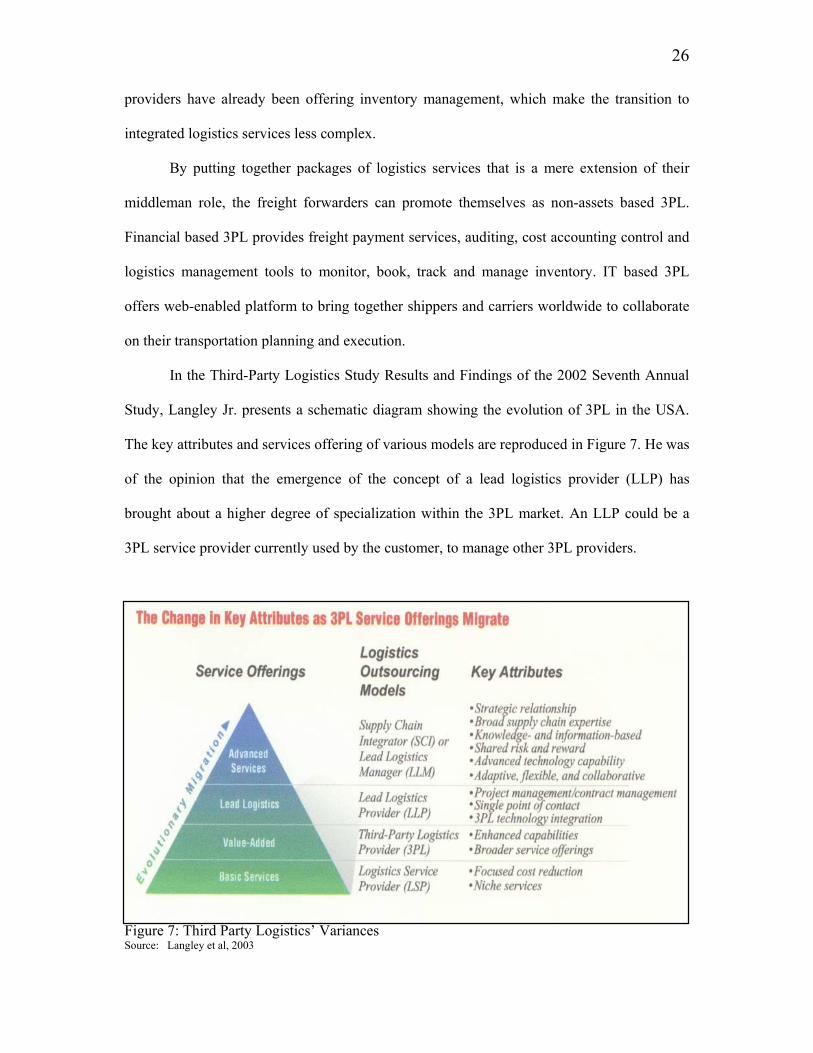
In the Third-Party Logistics Study Results and Findings of the 2002 Seventh Annual
Study, Langley Jr. presents a schematic diagram showing the evolution of 3PL in the USA.
The key attributes and services offering of various models are reproduced in Figure 7. He was
of the opinion that the emergence of the concept of a lead logistics provider (LLP) has
brought about a higher degree of specialization within the 3PL market. An LLP could be a
3PL service provider currently used by the customer, to manage other 3PL providers.
Figure 7: Third Party Logistics’ Variances Source: Langley et al, 2003
27
Nowadays, there is also an emerging trend of logistics consultants that provide
logistics advisory services focusing on strategy to develop and implement supply chain,
finance and technology selection such as Armstrong & Associates and BG Strategic Advisors
in the USA. Benjamin Gordon of BG Strategic Advisors noted that the 3PL industry is
extremely fragmented. Based on 2002 estimated revenue, there was no 3PL provider that
controls more than 6% of the total logistics market. The top 50 companies total revenue was
only USD27 billion compared to the total U.S. logistics market that was estimated to be over
USD65 billion which includes air and ocean freight, asset-based transportation, non-asset-
based surface transportation, value added warehousing and warehouse.
Each year, Armstrong & Associates Inc, a 3PL consulting firm, tracks the growth of
the industry while Accenture and Northeastern University in Boston survey 3PL executives
and the Fortune 500 manufacturers on their use of 3PL services. Figure 8 below summarizes
The survey results showed that the 3PL industry continues to grow and value-added
warehousing and distribution was the fastest growing segment of the industry, with $16.9
billion in revenues, up 10.5% (Table 3). Warehouse management is not only the fastest
growing segment of the industry but it is also the segment that yields the greatest cost
benefits to 3PL users and results in the greatest logistics service improvements to users.
Total 3PL gross revenues USD65 billion* Total 3PL gross revenues for value-added warehousing and distribution
USD16.9 billion*
Fortune 500 manufacturers using 3PLs 80%** Fortune 500 manufacturers using 3PLs for more than 5 years 72%** Fortune 500 manufacturers using 3PLs on a global basis 69%** Users who by from multiple providers 58%** Users who plan to increase their use of 3PLs 51%** Users who plan to decrease their use of 3PLs 13%** Users annual logistics budget paid to 3PLs 33%** 3PLs yielding greatest benefit to users Warehouse Mgmt
Service**
Table 3: 3PL by the Numbers in the USA for 2002 Sources: Armstrong & Associates and Accenture/Northeastern University
Several trends are driving the continued growth of the industry. Demand of total
logistics solution from 3PL providers and the increase of shipments to and from emerging
markets like eastern Europe, China, and South America led to the birth of large providers
like Fedex, APL Logistics, Excel and Maersk which are developing strong global logistics
solutions.
Gordon (2003) observed that the 3PL industry started to consolidate across modes and
geographies because there was an increasing preference among Fortune 1000 firms to deal
with one 3PL that could manage the entire logistics process. An example of multimodal
consolidation was UPS’ purchase of Fritz while examples of geographic consolidation were
Deutsche Post’s acquisition of AEI (Airborne Express Iberica) and Danzas’ and APL’s
purchase of GATX.
29
The Accenture survey also found increased interest in 4PL services offered by
providers whose specialty is designing, implementing, and managing total supply chain
solutions using capable 3PLs to execute the parts. As supply chains become more complex,
the integration of those solutions becomes more complex and a 4PL has the broad skills to do
that integration.
Unlike a 3PL provider who’s traditional focus has been on the organization and
management of assets such as facilities, vehicles and inventory, the 4PL providers’ focus is
towards the collection, coordination and management of information; leaving asset
management to the 3PL providers.
Table 4 shows us the US-Based 3PL providers which earned more than USD500
millions in net logistics revenue for 2002. Note that the first and second waves firms
mentioned by Berglund et al.(1999) are in the top ten lists but the third is yet to make an
impact.
In his thesis, Chew also noted that majority of these companies are also global
logistics providers with branches in 100 to 200 countries (Chew, 2003).
3PL Providers Net Logistics Revenue USDmil Exel Plc - Americas 1499 Ryder 1492 UPS Supply Chain Solutions 1402 Danzas Management Ltd. (DHL Danzas Air & Ocean) 1386 Schneider Dedicated Operations 1134 Penske Logistics 1054 Caterpillar Logistics Services, Inc. 1000 Tibbett & Britten Group Americas, Inc. 908 APL Logistics 723 Expeditors Int'l of Washington, Inc. 682 EGL, Inc.(Eagle) 672 TNT Logistics North America/CTI 635 J. B. Hunt Dedicated Contract Services 628 AmeriCold Logistics, Inc. 550 Table 4: North American-Based 3PL Revenues: Net Revenue for 2002 of more than USD500 million.
Source: website of Armstrong & Associates, Inc
30
3.4 Studies on Malaysia
Apart from short logistics articles written in local newspapers and business
magazines, this research could not find specific studies on the 3PL industry in Malaysia
except for a study on the usage of 3PL providers in Malaysia, done by Sohail and Sohal in
2003. It was published in Technovation Journal and the authors also confirmed that there
were no comprehensive studies reported in the literature focusing on the extent of 3PL by
firms in Malaysia (Sohail & Sohal, 2003).
3.4.1 Review of Commissioned Studies
Although several studies commissioned by the Government were not specifically
meant for 3PL, they help in understanding the conditions that affected its development. There
were a number of transportation and logistics related studies done by consultants appointed
by the Malaysian government when the country faced a crisis or whenever a drastic change of
policy was needed.
For instance, in 1988, the Government was aiming to minimize investments and
maximize the utilization of the existing system and infrastructure so the Malaysia National
Transport Policy Review was carried out to identify the critical bottlenecks to transport
efficiency. Among the key findings were that transport planning and coordination was
generally weak, with an overall plan not fully or effectively integrating the individual
components. Moreover, investment proposals were not always economically justified, with
inconsistent treatment of various modes.
It was recommended that a National Transport Act be drawn up to act as an umbrella
for all transport legislation and clearly outline the role of the Ministry of Transport. A strong
central planning unit should then be set up to guide overall transportation sector development.
31
Every transportation investment should be accompanied by economic analysis so as to allow
the Government to prioritize investments in times of resource constraint.
One of the studies that is relevant to this thesis is the ‘Container Transportation Chain
Study’ done by Coopers and Lybrand (C&L) in 1996 when there was a backlog of containers
movement at the ports. The objective of the study was to assist the Government in assessing
the overall efficiency of the logistics value chain and to recommend measures for
improvements. The findings are listed in Table 5.
32
Process Weakness/Inefficiency Importers submit documents to Forwarding Agents (FA)
Incomplete, inaccurate and delay in submission of source documents. Importers’ poor knowledge of pre-clearance.
FA makes Customs declaration/SA submits inward manifest.
FA not pro-active in pre-clearance High variance in set up & operational standards FA lacked professionalism Short transit time of voyage Last minute amendments by SA SA not computerized
Custom clearance, duty payment and Customs release
Outdated Customs Act and clearance system which does not support pre-clearance. Different legislations e.g Customs Act for manifest submission and Road Transport Act & CVLB Act for vehicle inspections. Late duty payment, haulage payment, Shipping Agent (SA) and handling charges payment.
FA obtains release documents and hand to Hauliers
Inadequacy in equipments especially during peak periods
Hauliers request for mounting
Inadequate prime movers and trailers, especially at Central and Southern regions Inefficient process Trailer detention Importers short opening hours
Terminal operator loads container
Inadequate equipments Time zone restrictions Free storage days
Container leaves gate Poor condition of roads/bridges around port Delays in EDI rollout Few ICDs Many short haul voyages Rapid growth of containers
Consignee receives container
Incomplete information No acceptance of service standards Complex processes
Table 5: Container Transportation Chain Study 1996-Summary of Findings
In summary, the logistics value chain in Malaysia has been found to be dynamic and
complex. The weaknesses and efficiencies of individual parties affect each other and have
negative impact on the overall performance. Significant improvement in performance will
require the introduction of new practices and a reduction in constraints currently faced by
33
individual parties within the value chain. Five key principles were proposed by Coopers and
Lybrand , i.e.
i. “Standardized monitoring system for performance measurement and control.
ii. More efficient regulated clearance process by amending the Customs Act to allow
clearance prior to manifest arrival and accepts House Bill of Lading for
consolidated freight.
iii. Upgrading professionalism of players within the transport chain by requiring
compliance to service standards before renewal of license.
iv. Ensuring appropriate investments and efficiency in the physical delivery process.
• Independent Total Logistics Service Providers/3PLs; and
• Other Significant Trade Facilitators.
37
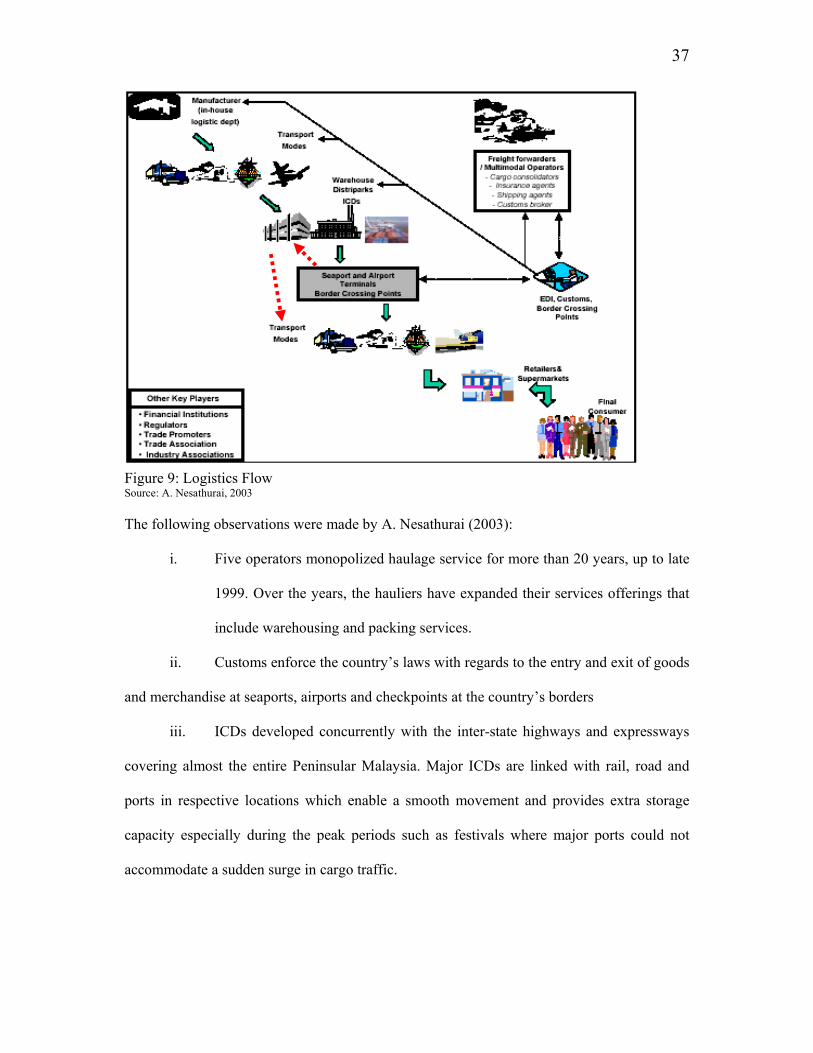
Figure 9: Logistics Flow Source: A. Nesathurai, 2003 The following observations were made by A. Nesathurai (2003):
i. Five operators monopolized haulage service for more than 20 years, up to late
1999. Over the years, the hauliers have expanded their services offerings that
include warehousing and packing services.
ii. Customs enforce the country’s laws with regards to the entry and exit of goods
and merchandise at seaports, airports and checkpoints at the country’s borders
iii. ICDs developed concurrently with the inter-state highways and expressways
covering almost the entire Peninsular Malaysia. Major ICDs are linked with rail, road and
ports in respective locations which enable a smooth movement and provides extra storage
capacity especially during the peak periods such as festivals where major ports could not
accommodate a sudden surge in cargo traffic.
38
iv. The distriparks provide value-added facilities such as packing and repacking,
labeling and assembling, sorting and consolidation and are located within the port’s Free
Commercial Zone (FCZ).
v. EDI systems linked the forwarding and shipping agents, port operators,
commercial banks, government agencies and customs to enable them to exchange data and
expedite the clearance of goods.
vi. Other facilitators comprise banks, insurance companies, licensing boards,
industry and trade associations. The banks and insurance companies provide a secured
business environment via credit and insurance facilities that guarantee the seller and buyer to
get the sale proceeds and the merchandise, safely.
The licensing boards control and monitor the performance of the logistics
sectors and finally, the industry and trade associations may influence the
Government’s policy direction with regard to trade and logistics matters.
A. Nesathurai (2003) was of the opinion that the fragmentation of modes of transport
(road, sea, rail, air) is costly because it led to barriers to transporters that have to change
mode, economic inefficiency and high social and environmental cost. For these reasons, he
proposed for a cohesive and unified transport policy for the whole transport systems. In view
of the fact that the industry is compartmentalized according to mode i.e. sea, land and air, and
the industry players are divided into various associations, this study will go through them
accordingly in order to track the development of 3PL in Malaysia.
3.4.3 Sea
As of December 2002, there were 63 shipowners represented by the Malaysian
Shipowners’ Association (MASA), which collectively own 451 vessels with a combined
gross tonnage of 4.7 million tons (MASA’s website- http://www.malaysianshipowners.org/).
39
Table 6 lists the major owners with more than 10 ships.
Company No. of ships 1 MISC Berhad 125 2 Bumi Armada Navigation Sdn Bhd 33 3 Perkapalan Mesra Sdn Bhd 33 4 Sykt Borcos Shipping Sdn Berhad 26 5 Highline Shipping Sdn Bhd 18 6 PDZ Holdings Bhd 13 7 Anjang Shipping Sdn Bhd 13 8 See Song & Sons Sdn Bhd 12 9 Malaysian Merchant Marine Bhd 11 10 Johan Shipping Sdn Bhd 11
Table 6: Top 10 Malaysian Shipowners Source: MASA’s website
However, only those highlighted provide cargo shipment (container, bulk, car carrier),
the rest cater for the oil industry (crew, tugboat, landing, etc).
Ever since the September 11 attacks, there has been a great deal of uncertainty in the
world market, and this has contributed to weakening of demand. The late chairman of the
MASA, Datuk Hj Mohd Ali Yasin noted that the incident has precipitated a chain of events
that have negative impact on shipping industry, globally. Malaysian shipowners are
anticipating slower growth in 2004 and the liner trade will be especially difficult. Local
shipowners were further grappling with increased costs and had to contend with severe
imbalance in demand and supply as a result of the recently concluded war in Iraq.
The new International Ship and Port Facility Security Code and security measures
such as the container security initiative, US Customs Trade Partnership Against Terrorism
and 24-hour advance manifest submission would also have an impact on Malaysian
shipowners operations and costs.
Ships require seaports to interface with inland modes of transportation. There are
multi-dimensional activities that are integrated within the logistics chain, provided at the
seaports to facilitate maritime trade. Thus, port is considered as a ‘trade facilitator’, i.e. a
linking point between sea and land transport in the logistics chain (Song, 2002).
40
More than 90% of the nation’s international trade was handled through seaport with
total tonnage cargo rising by 8.3% pa from 98.9 million tones in 1990 to 220.8 million tones
in 2000. At the same time, petroleum and gas increased its share from 11.8% to 30.5% of
total cargo handled by ports (NTPSS, 2003).
The Ministry of Transport has under its jurisdiction seven major federal international
ports - six ports located in Peninsular Malaysia, namely, Port Klang, Penang Port, Johor Port
at Pasir Gudang, Port of Tanjung Pelepas, Kuantan Port and Kemaman Port, and one in
Sarawak, i.e., Bintulu Port (http://www.mot.gov.my/english/Divisi_maritime.htm)
3.4.4 Land Transport
The demand for transportation, especially land transport has increased in tandem with
the growth in manufacturing. Land transportation comprises of the movement of general and
loose cargo by conventional lorries or trucks, containerized cargo by prime movers and
mixed cargo by rail. Road transport accounts for 90% of total freight movement which was
predominantly used for general cargo (45%), palm oil, logs and grains (NEAC 2003).
3.4.4.1 Conventional Truck
The size of the conventional lorry transport industry in terms of number of operators,
total fleet strength and tonnage handled is difficult to gauge as there is no regulatory body
monitoring the flow of all types of cargo within the country. Based on the Ministry of
Transport and the Malaysian Motor Traders Association, a total of 358,656 commercial
goods vehicles were registered in West Malaysia between 1988 and 1997. The average
growth was 30% between 1994 and 1997.
41
3.4.4.2 Container Haulage
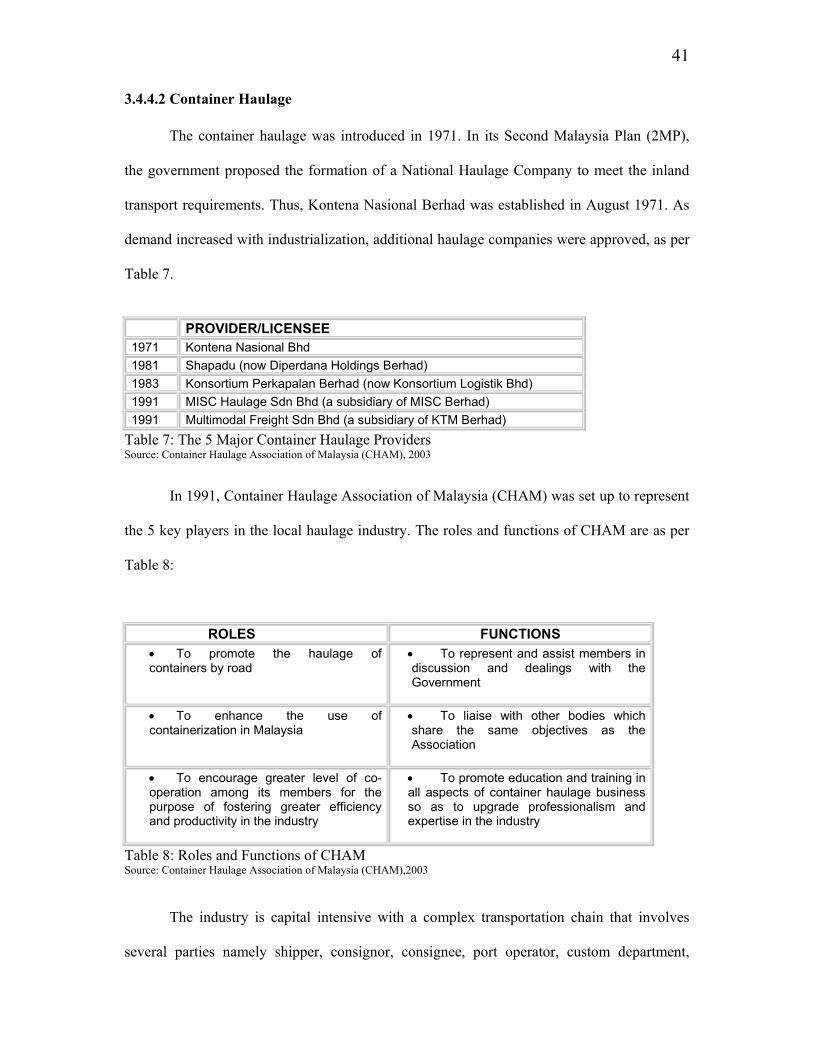
The container haulage was introduced in 1971. In its Second Malaysia Plan (2MP),
the government proposed the formation of a National Haulage Company to meet the inland
transport requirements. Thus, Kontena Nasional Berhad was established in August 1971. As
demand increased with industrialization, additional haulage companies were approved, as per
Table 7.
PROVIDER/LICENSEE
1971 Kontena Nasional Bhd 1981 Shapadu (now Diperdana Holdings Berhad) 1983 Konsortium Perkapalan Berhad (now Konsortium Logistik Bhd) 1991 MISC Haulage Sdn Bhd (a subsidiary of MISC Berhad) 1991 Multimodal Freight Sdn Bhd (a subsidiary of KTM Berhad)
Table 7: The 5 Major Container Haulage Providers Source: Container Haulage Association of Malaysia (CHAM), 2003
In 1991, Container Haulage Association of Malaysia (CHAM) was set up to represent
the 5 key players in the local haulage industry. The roles and functions of CHAM are as per
Table 8:
ROLES FUNCTIONS • To promote the haulage of containers by road
• To represent and assist members in discussion and dealings with the Government
• To enhance the use of containerization in Malaysia
• To liaise with other bodies which share the same objectives as the Association
• To encourage greater level of co-operation among its members for the purpose of fostering greater efficiency and productivity in the industry
• To promote education and training in all aspects of container haulage business so as to upgrade professionalism and expertise in the industry
Table 8: Roles and Functions of CHAM Source: Container Haulage Association of Malaysia (CHAM),2003
The industry is capital intensive with a complex transportation chain that involves
several parties namely shipper, consignor, consignee, port operator, custom department,
42
warehouse operator and others. Conservatively, the 5 hauliers spent at least RM3 billion by
the year 1999 on prime movers, trailers, land, buildings, equipments, depots and containers
monitoring systems (CHAM, in press).
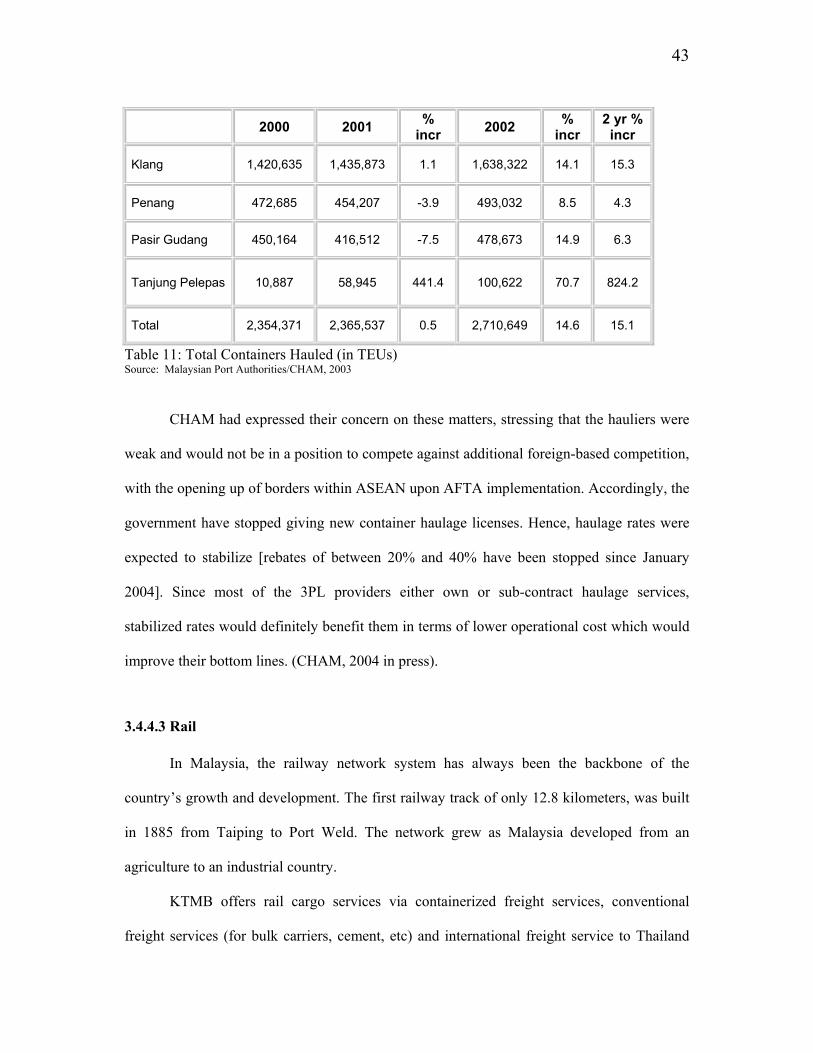
Due to the continuing bottleneck crisis at the ports throughout Peninsular Malaysia up
to the year 2000 that resulted in customers paying extra port charges and demurrage for their
containers, the Government decided to deregulate the haulage industry and give more
licenses to new players4. Table 9 shows the increase in the number of licenses issued
throughout the years and Table 10 lists the increase in the number of permits issued for prime
movers and trailers.
2000 2001 % increase 2002 %
incr 2 yr % incr
Licensees 5 52 940 68 31 1,260
Table 9: Number of Licensed Container Haulage Companies Source: CHAM, 2003 YEAR PRIME-
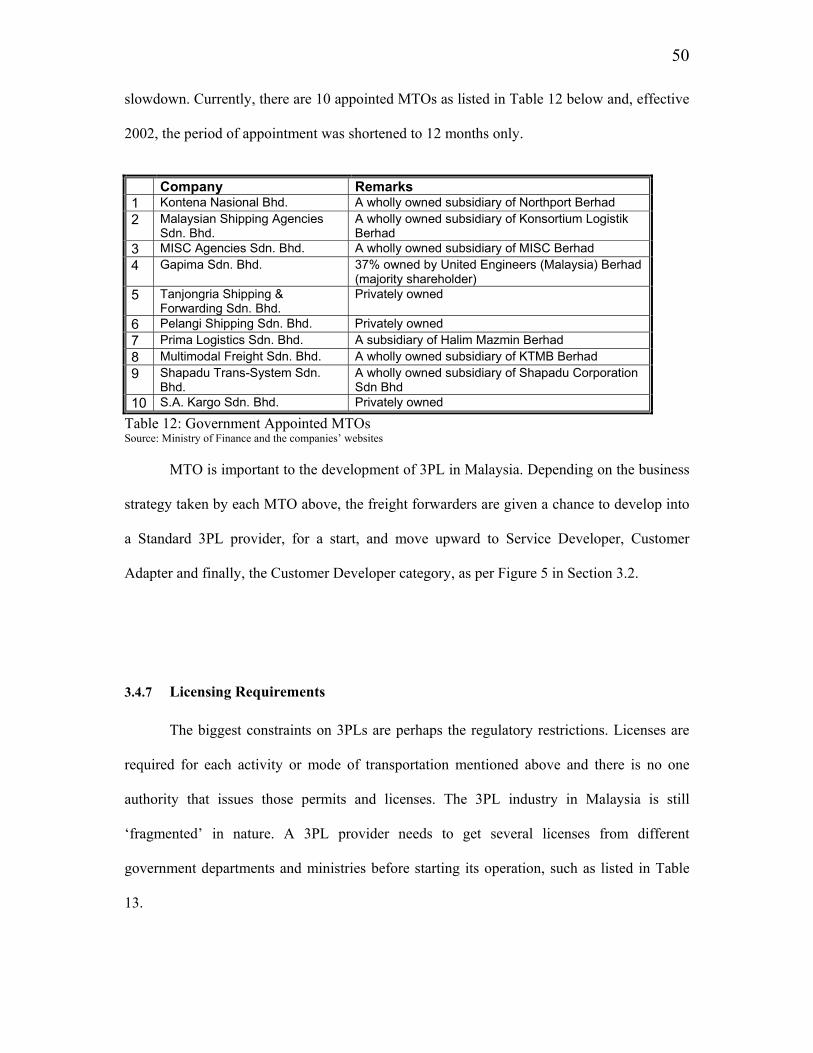
In commercial definition, MTOs are actually international freight forwarders. The
operators are actually licensed freight forwarders and shipping agencies that are appointed to
carry out the responsibility for the transportation of goods from point of receipt in one
country to point of destination in another country. Thus, all Government entities must use the
service of the appointed MTOs for all their shipments through tender process.
In return, the MTOs must undertake that:
(a) “It shall, at all times, be registered with the Ministry of Finance, Malaysia;
(b) It shall promptly obtain and maintain in full force and effect any relevant
authorization or registration which may become necessary to obtain to enable it to
perform any of the required service;
(c) It shall comply with any laws, rules or regulations of any organization on
multimodal transportation;
49
(d) It shall not engage in any unethical business practices in order to secure the award
of the Letter of Acceptance or in its conduct or performance of the service;
(e) It shall, within twenty-four (24) months from the effective date of the Contract,
execute the following:
• the company shall increase its minimum paid-up capital to Ringgit
Malaysia One Million (RM1,000,000.00);
• the company shall establish not less than three offices overseas to supply
and carry out the service. An office shall mean a branch of the company or
a joint-venture company in which the company holds an equity of fifty one
percent (51%);
• the company shall restructure its organization in order to establish a
specific Department or Division which shall be responsible to carry out
the service; and
• the company shall provide its personnel with the necessary training
relating to the service to further enhance the professionalism of such
personnel.”
(Source: Treasury Circular No. 6, 2000; www.treasury.gov.my/domhost/mof/circular.nsf/) In its own way, the government has been trying to nurture these companies to become
international 3PL providers. They are also required to set up offices in other countries.
However, to date, none of them had really ‘established’ themselves globally.
MISC has 10 overseas offices, not as a full-pledged 3PL but more for their ship and
subcontracting management, employing only 1 or 2 staff. Instead of setting-up their own
joint-venture (JV), the majority of the MTOs prefer to utilize other established international
forwarders service, quoting various reasons such as short of capital, manpower and economic
50
slowdown. Currently, there are 10 appointed MTOs as listed in Table 12 below and, effective
2002, the period of appointment was shortened to 12 months only.
Company Remarks 1 Kontena Nasional Bhd. A wholly owned subsidiary of Northport Berhad 2 Malaysian Shipping Agencies
Sdn. Bhd. A wholly owned subsidiary of Konsortium Logistik Berhad
3 MISC Agencies Sdn. Bhd. A wholly owned subsidiary of MISC Berhad 4 Gapima Sdn. Bhd. 37% owned by United Engineers (Malaysia) Berhad
(majority shareholder) 5 Tanjongria Shipping &
Forwarding Sdn. Bhd. Privately owned
6 Pelangi Shipping Sdn. Bhd. Privately owned 7 Prima Logistics Sdn. Bhd. A subsidiary of Halim Mazmin Berhad 8 Multimodal Freight Sdn. Bhd. A wholly owned subsidiary of KTMB Berhad 9 Shapadu Trans-System Sdn.
Bhd. A wholly owned subsidiary of Shapadu Corporation Sdn Bhd
10 S.A. Kargo Sdn. Bhd. Privately owned
Table 12: Government Appointed MTOs Source: Ministry of Finance and the companies’ websites
MTO is important to the development of 3PL in Malaysia. Depending on the business
strategy taken by each MTO above, the freight forwarders are given a chance to develop into
a Standard 3PL provider, for a start, and move upward to Service Developer, Customer
Adapter and finally, the Customer Developer category, as per Figure 5 in Section 3.2.
3.4.7 Licensing Requirements
The biggest constraints on 3PLs are perhaps the regulatory restrictions. Licenses are
required for each activity or mode of transportation mentioned above and there is no one
authority that issues those permits and licenses. The 3PL industry in Malaysia is still
‘fragmented’ in nature. A 3PL provider needs to get several licenses from different
government departments and ministries before starting its operation, such as listed in Table
13.
51
License Department/Ministry Company Companies Commission of Malaysia, Ministry of
Domestic Affairs Commercial transport & container haulage
Commercial Vehicles Licensing Board (CVLB), Ministry of Entrepreneurship
Warehouse Local Council, State Department Bonded warehouse Custom Department of each State in Malaysia Freight forwarding license Custom Department of each State in Malaysia *Road tax & compliance with Road Traffic Ordinance, 1957
Road & Transport Department, Ministry of Transport
*Periodic Vehicle Inspection PUSPAKOM, the Computerized Vehicle Inspection Center
*Noise and emission pollution Department of Environment *Road Traffic Regulations Traffic Police Depatment Government MTO Ministry of Finance * Prior to getting operation permit from CVLB Table 13: Licensing Requirements Source: Based on working knowledge of people in the industry.
There is no specific department regulating the entire range of logistics activities in
Malaysia. Moreover, the Ministry of Finance, the Bank Negara Malaysia and Statistics
Department still classify transportation and storage together with communication which
becomes part of the service industry, to compute the GDP which makes it quite impossible to
know the exact percentage contribution of logistics, in general, and 3PL industry,
specifically.
4 Case Study Analysis of 3PL Development
This chapter analyzes selected logistics cases as a way to gauge the extent of 3PL
development in Malaysia. The facts and figures collected were mainly from publicly
available information. The main sources are annual reports, companies’ websites, Bursa
Malaysia’s website, articles in newspapers and business magazines. Unlike USA and Europe,
there are hardly any published study done on Malaysian Logistics in general and 3PL
providers, in particular. Thus, the research has to rely on analysis of selected cases.
The companies selected as case studies are those listed on Bursa Malaysia, under the
Trading & Services segment of both Main and Second Boards. Their principal activities are
52
stated as freight-related, transportation and logistics. There are also many private limited 3PL
providers. An initial study shows that they are either niche players in certain segment of
logistics or affiliates of global 3PL providers. This study opted for listed companies simply
because it is one of the ways to measure the success of a company. It can be assumed that the
publicly listed companies represent the leading local companies in the industry. As study of
such companies can suggest the state of development of the entire industry. To be listed, the
company should at least make a reasonable profit for 3 years prior to listing (among other
requirements) and must have financial stability to stay on the listing. Otherwise, it will be
suspended and required to submit its restructuring plan or will be de-listed. Plus, it is much
easier to get information on the listed companies compared to the private limited companies.
After a preliminary review was done, based on the principal activities, the followings
companies were short-listed:
Bursa Malaysia-Main Board 1. Diperdana Holdings Berhad (Diperdana/DP) 2. Halim Mazmin Berhad (Halim Mazmin) 3. Harbour-Link Group Berhad (Harbour-Link) 4. Integrated Logistics Berhad (ILB) 5. Konsortium Logistik Berhad (KLB/Konsortium) 6. Malaysia International Shipping Corporation Berhad (MISC) 7. Malaysian Merchant Marine Berhad (MMM) 8. PDZ Holdings Berhad (PDZ) 9. Tiong Nam Transport Holdings Berhad (Tiong Nam/TNH) 10. Transmile Group Berhad (Transmile)
Bursa Malaysia-Second Board 11. Century Logistics Holdings Bhd (Century/CLB) 12. Nationwide Express Courier Services Berhad (Nationwide/NW) 13. See Hup Consolidated Berhad (See Hup/SHC) 14. Tamadam Bonded Warehouse Berhad (Tamadam/TBW) 15. Transocean Holdings Berhad (Transocean/TNH)
53
A further assessment was carried out and the following companies were later
excluded due to several reasons given below:
i. Halim Mazmin: The principal business activities of the company is in ship owning
and operations. No other mode of transport is involved and no freight forwarding
service is offered. Besides, the management clearly considered the company as a
leading player in the Malaysian shipping industry.
ii. Harbour-Link: The Group originated from Sarawak is a 3PL provider, involve in
freight forwarding, air freight, project cargoes freight management and logistics
studies, container haulage, supply and rental of materials handling equipment,
The principal sources of information for this company are: www.bursamalaysia.com; www.diperdana.com.my; Diperdana’s Annual Reports; Industry Experts and the mass media.
4.1.1 History and Business
Shapadu Kontena Bhd was incorporated in 1980 as a private company and converted
to a public company in 1991 before the listing in 1992. The name was changed to Diperdana
Holdings Berhad in 1995. Diperdana started its operations as a haulage company in Port
Klang and it is one of the first 5 container hauliers in the country. Overtime, it has expanded
the services offered to include freight forwarding & distribution, trucking, container depot
management, repair and service of containers and warehousing services. Geographically, the
operation was extended to 3 regional centers, i.e. the Central region at Port Klang, the
Northern Region through Penang Port and Southern Region through Pasir Gudang, Johor.
Then, in 1996, another logistics provider, Konsortium Perkapalan Berhad acquired
63.1% of Diperdana and planned to combine and restructure the logistics activities of both
companies. Konsortium wanted to swap its shipping businesses with Diperdana's haulage
operations and turned Diperdana into the shipping arm of Konsortium. However, the deal was
aborted at the very last minute due to the worldwide economic crisis in 1997. Subsequently,
the container haulage sector remains the core activity that contributed more than 80% of the
Group’s revenue, although the company is projecting itself as a total logistics service
provider.
In late 2001, Konsortium, once again announced its plan to take over Diperdana’s
entire existing business. In exchange, Diperdana, will get a controlling stake in Pelikan
Holding AG from Pelikan Holdings Sdn Bhd which holds the franchise to supply the Pelikan
stationery products worldwide through associates and subsidiary companies.
56
The exchange is expected to strengthen Konsortium over all other haulage operators
in the country and enhance its capability to serve a larger and an increasingly competitive
market although the same cannot be said of Diperdana because it will be in a totally different
business altogether. Nevertheless, as at October 23, 2004, the deal is yet to be finalized
which to a certain extent had a negative impact on Diperdana’s business and bottom line, due
to its uncertainty. For the financial year ended 31 December, 2002, backed by a fleet of 431
prime movers, 35 side-loaders, 822 trailers-20’, 1,794 trailers-40’ and 5 tippers, the container
haulage sector contributed 86% to the Group’s revenue. The company has 6 active
subsidiaries whose principal activities are providing logistics and related services in Malaysia
(Table 14).
Company Name % Held Activities Country
Diperdana Indah Sdn Bhd 100 Logistics and related services Malaysia Diperdana Kontena Sdn Bhd 100 Logistics and related services Malaysia Diperdana Logistics Sdn Bhd 100 Logistik and related services Malaysia Diperdana Selatan Sdn Bhd 100 Logistics and related services Malaysia Diperdana Terminal Services Sdn Bhd 97 Haulage and forwarding services Malaysia Diperdana Utara Sdn Bhd 100 Logistics and related servises Malaysia
Earning Per Share(in RM) (0.41) 0.25 0.44 0.41Dividend Per Share(in RM) 0.01 0.05 0.108 0.05NTA per share (in RM) 2.345 2.528 2.331 1.994Turnover (in RM000) 119,705 126,307 135,843 107,605Gross Profit (in RM000) 24,159 35,750 37,964 27,146Operating Profit# (in RM000) 3,247 13,614 21,641 15,635Operating Profit Margin(%) 2.71 10.78 15.93 14.53Net Profit #(in RM000) -14,429 8,647 15,549 14,324Table 15: Diperdana # Net Profit is after tax and minority interest and 1999 is a tax free year. Operating profit excludes extraordinary items.
. Source: Bursa Malaysia & Annual Reports.
Turnover and profit declined in 2001 following the effects of the global economic
slowdown and September 11 incident which resulted in lower export activities. The
deregulation of haulage business also led to increase competition, price undercutting and
reduced operating margins, which continued in 2002. The loss recorded in 2002 was due to
the impairment of assets totaling RM18.7million.
An operating loss of RM 2.3million was recorded for the year ended December 2003.
Reason given by the management was that the supply of haulage services in the Malaysian
market has exceeded demand by at least 30% and as such, prices for such services have been
affected resulting in negative profit margins (-2.1%).
Diperdana is a transportation based 3PL and in terms of classification as per Figure 5,
it is still at the Standard 3PL Provider category, having a third party agreement (Figure 6) that
provides basic services with minimal value added services (Figure 7). The logistics business
strategy is badly affected by future uncertainty.
4.2 Integrated Logistics Berhad (ILB): ‘A Leader in Total Logistics’
The information for this case is obtained largely from the following sources: www.bursamalaysia.com; http://www.ilb.com.my/; Company Prospectus dated 24 April 2002; and Annual Reports.
58
4.2.1 History and Business
The Integrated Group started operation in 1973 and it is a warehouse and distribution
based 3PL. ILB was formed to implement a restructuring to facilitate flotation of Integrated
Earning Per Share(in RM) 0.005 (-0.06) 0.024 0.004Dividend Per Share(in RM) 0.00 0.00 0.00 0.00NTA per share (in RM) 1.523 1.935 2.000 1.989Turnover (in RM000) 157,553 133,774 130,495 116,377Gross Profit (in RM000) 49,556 44,536 40,215 32,338Operating Profit# (in RM000) 6,334 -1,879 9,742 4,552Operating Profit Margin(%) 4.02 -1.40 7.47 3.91Net Profit #(in RM000) 690 -5,779 2,202 328
Table 17: ILB # Net Profit is after tax and minority interest and 1999 is a tax free year. Operating profit excludes extraordinary/exceptional items. Source: Bursa Malaysia & Annual Reports.
Turnover improved throughout the years but a net loss was recorded in 2001 due to
mainly the substantially higher interest and depreciation expenses for capital expenditure
incurred for the additional haulage business.
The container haulage operation, registered an increase in turnover to RM 22.2 million in
2002 from RM 10.1 million in 2001. The operations in Shenzhen, The Peoples' Republic of
China, registered a sizeable increase in turnover to RM 23.9 million from RM 10.9 million in
2001. Hence, the overseas operations profit before taxation was RM2.6 million compared to
RM 1.7 million in 2001. Operating profit increased to RM11.4 million together with turnover
of RM165 million giving a better margin of 6.90% for the year 2003.
Overall, with reference to Figure 5, ILB has moved from being a Standard 3PL
provider to the Service Developer category (Figure 5), having an integrated long-term service
agreement (Figure 6) with broader service offering and technology capabilities but has yet to
develop into an LLP (Figure 7).
4.3 Konsortium Logistik Bhd (Konsortium/KLB): ‘A Logistics Solutions Provider’
Information for this case is obtained from www.bursamalaysia.com, http://www.konsortium.net/, industry experts and Annual Reports.
61
4.3.1 History and Business
KLB was incorporated in 1982 as Konsortium Perkapalan Sdn Bhd. It was one of the
major haulage providers in the northern region. Konsortium acquired Perbadanan Nasional
Shipping Line (PNSL) for RM250 million (USD99 million) from state investment company
Pernas and was listed on KLSE in January 1996. Later that year, Konsortium took over a
Hong Kong based shipping company, Pacific Basin, for more than RM500 million (USD230
million). Pacific Basin has a fleet of 23 relatively small dry bulk carriers and two tankers,
which transport minor cargo within Asia.
The management planned to restructure the company and turned it into an integrated
regional logistics provider. Konsortium was supposed to provide haulage and shipping
services from factory to port. Cognizant of the fact that it would not be able to compete with
the world's shipping giants on international routes, Konsortium wanted to concentrate its
activities in Southeast Asia, in the lesser developed ports of Indonesia, the Philippines,
Myanmar and Indochina.
The management proposed to inject PNSL and Pacific Basin into Diperdana. If
completed, the deal would give Konsortium 40% of Malaysia's haulage market, surpassing
rival Kontena Nasional's 34%, at that time. At the same time, Konsortium was also said to be
looking at Nepline Bhd, a shipping firm listed on the KLSE's Second Board, interested in
Tiong Nam Transport Holdings and eyeing a stake in privately owned Westport container
terminal.
However, everything did not materialize as planned due to the 1997’s economic crisis.
Konsortium would have incurred a significant loss of RM1.1billion if it had gone ahead with
the restructuring exercise that involved shares swaps. Pacific Basin's worth had fallen to
USD200million (Chairman’s Press Statement, 1998).
62
Consequently, Konsortium was forced to sell the shipping business (PNSL & Pacific
Basin) to Petronas via MISC, to reduce borrowings. Without its shipping business, which was
its biggest income generator in 1997, Konsortium was reduced to a land-based logistics
company with activities in haulage, freight forwarding, warehousing and insurance. The
company then changed its name to Konsortium Logistik Berhad in August 1999 to reflect
these activities.
These days, Konsortium projected itself as a total logistics solution provider and
offers the traditional logistics/inventory services. KLB also has business operations in
Thailand, India and Indonesia but they have yet to generate any profit.
Konsortium had transformed the logistics activities according to business sector, i.e.
automobile, oil and gas, retail & industrial distribution and infrastructure & project
development. It has many subsidiaries, as per Table 18 but some of them are dormant.
Diperdana’s acquisition is still pending and the Security Commission has approved an
extension until the end of 2004.
Company Name % Held Activities Country
Asia Gas Transport Sdn Bhd 100 Dormant Malaysia Asia Vehicle Transport Sdn Bhd 100 Dormant Malaysia Associated Container Terminals Limited 40 Container freight station India CEN Sdn Bhd 20 Investment holding Malaysia City Honour Investments Ltd 100 Dormant Liberia
Cougar Logistics (Malaysia) Sdn Bhd 51Shipping agencies, forwarding, warehousing and other related services
Malaysia
Eminent Sail Shipping Ltd 100 Dormant Liberia Fleet Engineering Services Sdn Bhd 100 Engineering services Malaysia Inter-fleet Engineering Services (M) Sdn Bhd 100 Engineering services Malaysia
KP Asia Auto Logistics Sdn Bhd 51 Forwarding, shipping, warehousing and transport agent Malaysia
KP Distribution Services Sdn Bhd 100 Cargo distribution services Malaysia
KP Integrated Sdn Bhd 50 Inland container depot, haulage and warehousing Malaysia
KPB Sadao ICD Co Ltd 40 Inland container depot and haulage services Thailand
Kaypi Logistics Depot Sdn Bhd 100 Inland container depot Malaysia Kaypi Southern Terminal Sdn Bhd 100 Inland container depot Malaysia
Konsortium Logistik (Sabah) Sdn Bhd 100 Shipping agency, forwarding and related services Malaysia
63
Konsortium Logistik (Sarawak) Sdn Bhd 100 Shipping agency, forwarding and related services Malaysia
Konsortium Logistik India Pvt Ltd 99 Provision of total logistics services India Konsortium Logistik Pte Ltd 100 Dormant Mauritius Konsortium Ports Pte Ltd 100 Investment holding Mauritius Mac Vantage Sdn Bhd 100 Dormant Malaysia
Malaysia Shipping Agencies Sdn Bhd 100 Shipping agency, forwarding and related services Malaysia
Mitsui O.S.K Lines (Malaysia) Sdn Bhd 30 Shipping agency, forwarding and related services Malaysia
North Klang Logistics (Malaysia) Sdn Bhd 51 Leasing of bonded warehouse and container yard Malaysia
North Terminal Sdn Bhd 100 Inland container depot services Malaysia PNSL Agencies Limited 100 Property holding and investment Hong KongPNSL Berhad 100 Chartering and ship operators Malaysia PNSL Risk Management Sdn Bhd 100 Insurance agency Malaysia PNSL Services Corporation 100 Dormant Liberia Pacific Basin Tanker (No. 1) Company Limited 100 Dormant Hong Kong
Pacific Basin Tanker (No. 1) Corporation 100 Dormant Liberia Pacific Basin Tanker (No. 2) Company Limited 100 Dormant Hong Kong
Pacific Basin Tanker (No. 2) Corporation 100 Dormant Liberia Parcel Tankers Malaysia Sdn Bhd 60 Dormant Malaysia Rydex Industries Corporation 51 Dormant Canada Transworld Enterprise Limited 100 Dormant Liberia
Vehicle Transit Centre (Malaysia) Sdn Bhd 45 Storage and transhipment of all types of export vehicles Malaysia
Westport Distripark (M) Sdn Bhd 80 All business of a distribution park Malaysia
Table 18: KLB-Subsidiaries and Associated Companies Source: Bursa Malaysia and Annual Report 2002.
As at June 2003, Konsortium owns 551 prime movers, 2,760 trailers and 25 side-
loaders. It also manages 460 tankers for the nationwide distribution of bulk petroleum and
chemical products. Its major customers are Proton (warehouse management), Perodua
Table 19: KLB # Net Profit is after tax and minority interest and 1999 is a tax free year. Operating profit excludes extraordinary/exceptional items. Source: Bursa Malaysia & Annual Reports.
The significant drop in margin for 2001 was again due to mainly the price
undercutting in haulage segment coupled with the economic uncertainty after September 11.
The Container Haulage & Inland Depot division’s turnover declined 5.2% to RM122.1
million in 2001 as new licensees brought extra capacity onto the road. Profits of RM22.4
million were lower by 23.7% over the previous year because competitors elected to enter the
market by discounting the tariff eroding margins throughout the industry.
The lower net profit in 2002 was attributed partly to the disposal of the Group’s
insurance arm in 2001 which had resulted in an exceptional gain on disposal of subsidiary of
RM10 million in 2001. In addition, KLB was also badly affected by considerable price
weakness in the Malaysian container haulage industry due to significant and growing over
supply of capacity while the growth in trade was rather slow.
The management admitted (Annual Report 2002) that their container haulage unit was
too slow to make the necessary adjustments and saw its financial performance slip in the face
of intense competition. In addition, RM8.29 million assets impairment losses with regards to
marketable securities and properties were recognized.
The management had anticipated that the acquisition of Diperdana’s business will be
completed by the end of 2nd quarter or early 3rd quarter of 2003 which would enlarge the
Group’s business capabilities and customer base. The positive synergistic effect arising from
this acquisition is expected to benefit the Group in terms of cost-savings and other business
opportunities. The Group, therefore, anticipates a favorable performance for the financial
year ending 31 December 2003.
65
However, that did not happen. The latest audited report for December 2003 recorded
an operating loss of RM35 million against a turnover of RM211 million. This was mainly due
diminution in value of investment in subsidiaries, associates and properties, plus RM12.5
million doubtful debts provision & write-off and RM23 million provision for advanced to
associate companies.
KLB is a transportation based 3PL provider. It has slowly moved towards the
Customer Adapter category (Figure 5) by taking over some of its customers’ total logistics
requirement such as Perodua and Permanis, with an integrated service agreement (Figure 6)
and becomes the LLP, coordinating other 3PL providers’ activities (Figure 7).
4.4 Malaysia International Shipping Corporation Berhad (MISC): ‘The Preferred
Provider of World-Class Maritime Transportation and Logistics Services’
Sources of information for this case include: www.bursamalaysia.com; http://www.misc-bhd.com/; industry experts and Annual Reports.
4.4.1 History and Business
MISC is the national shipping line of Malaysia and was incorporated on 06.11.1968.
It is a subsidiary of PETRONAS (62% equity), the national petroleum company and listed on
the Main Board of the Bursa Malaysia. Initially, the principal businesses of the corporation
were ship owning, ship operating and other maritime transportation related services.
Naturally, MISC branched out into other logistics’ segments for the benefit of their customers
and shareholders.
MISC Agencies Sdn. Bhd (MISA), the freight forwarding arm and shipping agent for
MISC was incorporated in 1975. MISC Haulage Services Sdn. Bhd (MHS) was then set up in
March 1991, to provide haulage services for its existing customers at that time. The company
is currently operating 400 prime movers and 2,600 trailers and 12 side loaders.
66
Similar to other players, the company has expanded its operations from Port Klang to Penang,
Pasir Gudang, Malacca, Kuantan and Ipoh with market shares around 20% in Port Klang,
14% in Penang and 20% in Johor. MISC Trucking and Warehousing Services Sdn. Bhd.
(MTW) started its operation in 1992 from 90,000 sq. ft. warehouse complex at Port Klang
and offers integrated one-stop service cargo handling, storage, consolidation, distribution and
other warehouse-related services and door-to-door cargo transportation. MTW is also
operating in Penang and Johor.
To strengthen its position in the land logistics market, MISC Integrated Logistics Sdn
Bhd (MILs) was set up to integrate the freight forwarding and warehousing facilities of MISC
Trucking and Warehousing Services Sdn Bhd (MTW) with the distribution capabilities of
MISC Haulage Services Sdn Bhd (MHS) to offer clients customized logistics service
business solutions in Malaysia.
MILs managed to get contracts for integrated logistics services from BP Amoco
Chemicals Malaysia Sdn Bhd, Polyethylene (M) Sdn Bhd, MITCO Japan, Tuanku Jaafar Port
Dickson Power Station, Samsung and British American Tobacco in the financial year 2003.
MIL planned to focus on the Energy and Consumer Product Group by developing
market intelligence, human capital and strengthening Health, Safety and Environment (HSE)
capabilities to meet internationally recognized standard.
As part of MISC’s strategy of strengthening its logistics business, they planned to
form alliances with international logistics service providers and/or consulting houses
specializing in supply chain management in the near future.
Company Name % Held Activities Country
Affin Merchant Bank Berhad 37 Merchant banking Malaysia Asia LNG Transport Dua Sdn Bhd 51 Shipping Malaysia Asia LNG Transport Sdn. Bhd. 51 Shipping Malaysia
EBC Limited 100 Investment holding British Virgin Islands
Esperance Shipping Limited 100 Shipping Liberia
67
Fantasy Shipping Limited 100 Shipping Liberia Growth Shipping Limited 100 Shipping Liberia Hubei Zhong Chang Vegetable Oil Co. Ltd. 15 Vegetable oil refinery China Leo Shipping Private Limited 100 Shipping agent Singapore MISA (B) Sdn Bhd 100 Shipping agent Brunei DarussalamMISC (Japan) Ltd 100 Port and general agent Japan MISC Agencies (Australia) Pty Ltd 100 Shipping agent Australia MISC Agencies (Netherlands) B.V. 100 Shipping agent Netherlands MISC Agencies (Sarawak) Sdn Bhd 65 Shipping agent Malaysia MISC Agencies (Thailand) Company Limited 49 Shipping agent Thailand MISC Agencies (Trengganu) Sdn Bhd 100 In liquidation Malaysia
MISC Agencies Lanka (Pte) Ltd 40 Shipping agent and freight forwarding services Sri Lanka
MISC Agencies Sdn Bhd 100 Shipping agent and warehousing Malaysia
MISC Enterprises Holdings Sdn Bhd 100 Investment holding Malaysia MISC Haulage Services Sdn Bhd 75 Container haulage Malaysia MISC Information Technology Sdn Bhd 100 In liquidation Malaysia MISC Integrated Logistics Sdn. Bhd. 100 Integrated logistics services Malaysia MISC Trucking and Warehousing Services Sdn Bhd 100 Trucking, warehousing and
forwarding services Malaysia
MSE Corporation Sdn. Bhd. 43 Processing of copper grit Malaysia MSE Holdings Sdn Bhd 43 Investment holding Malaysia
MSE-ATB Sdn. Bhd. 26Process equipment for petrochemical, oil and gas and power generation plants
Malaysia
Malaysia International Shipping Corporation Agencies (U.K.) Ltd 100 Shipping agent United Kingdom
Malaysia Pakistan Venture Sdn Bhd 25 Investment holding Malaysia
Malaysia Shipyard and Engineering Sdn Bhd 43 Shipbuilding, ship repairing and heavy Malaysia
Malaysia Towage and Transport Sdn. Bhd. 43 Hiring and chartering of tugboat Malaysia
Malaysian Maritime Academy Sdn. Bhd. 70Education and training for seamen and maritime personnel
Malaysia
Moor Industrial Transport Limited 25 Investment holding Jersey,Channel Island
Oliver Shipping Ltd 50 Shipping Liberia
PETRONAS Tankers Sdn Bhd 100Investment holding and provision of management services
Malaysia
Puteri Delima Satu (L) Private Limited 100 Shipping Malaysia Puteri Firus Satu (L) Private Limited 100 Shipping Malaysia Puteri Intan Dua (L) Private Limited 100 Shipping Malaysia Puteri Intan Satu (L) Private Limited 100 Shipping Malaysia Puteri Nilam Satu (L) Private Limited 100 Shipping Malaysia Puteri Zamrud Satu (L) Private Limited 100 Shipping Malaysia
Techno Indah Sdn. Bhd 26 Sludge treatment and generation of energy Malaysia
Tianjin Voray Bulking Installation Co. Ltd. 13 Storage of vegetable oil China Titar Travel Sdn Bhd 50 Travel agent Malaysia Traiblazer Shipping Limited 100 Shipping Liberia Transware Distribution Services Pte Ltd 50 Warehousing Singapore Transware Logistics (Pvt) Ltd 25 Inland container depot Sri Lanka
68
Voray Holdings Limited 25 Investment holding China
Yuasa Investment Limited 50 Shipping British Virgin Islands
Table 20: MISC-Subsidiaries and Associated Companies Source: Bursa Malaysia.
Nevertheless, MISC derives the bulk of its earnings from long-term charter of
liquefied natural gas (LNG) and has a captive market in the form of its parent company,
Petronas.
4.4.2 Financial Highlights
Authorised Capital : RM2,500,000,001 Paid-Up-Capital : RM1,859,913,000
Details MAR-2003 MAR-2002 MAR-2001 MAR-2000
Earning Per Share(in RM) 0.705 0.720 0.743 0.746Dividend Per Share(in RM) 0.150 0.300 0.260 0.250NTA per share (in RM) 4.966 4.573 3.790 3.166Turnover (in RM000) 5,432,996 5,508,434 5,846,660 6,562,950Gross Profit (in RM000) 1,924,015 2,051,230 2,450,378 2,652,165Operating Profit# (in RM000) 1,310,300 1,415,609 1,426,159 1,422,471Operating Profit Margin(%) 24.11 25.71 24.39 21.67Net Profit #(in RM000) 1,310,663 1,339,337 1,382,738 1,387,640
Table 21: MISC # Net Profit is after tax and minority interest. Operating profit excludes extraordinary/exceptional items. Source: Bursa Malaysia & Annual Reports.
LNG transportation contributes up to 70% to MISC's bottom line despite only making
up 34% of the company's total revenue. Container and bulk cargo only contributes 6% of net
profit. The profits are stable overtime.
Evidently, MISC is a transportation based 3PL with financial capabilities to be a
‘true’ 3PL provider and a Customer Developer (Figure 6). However, instead of moving
directly to Customer Developer’s quadrangle, it has moved towards Customer Adapter,
concentrating on the Energy and Consumer Product Group but remains as 3PL with enhanced
capabilities and broad service offerings (Figure 7).
69
4.5 Tiong Nam Transport Holdings Berhad (TiongNam/TNH): ‘Total Logistics
Provider’
Information for this case comes from www.bursamalaysia.com; http://www.tiongnam.com/ and Annual Reports
4.5.1 History and Business
Tiong Nam Group has been in the logistics industry for over 25 years. The Johor
Bahru-based transport operator has extensive network in Peninsular Malaysia as well as
Sabah and Sarawak. The company and its subsidiaries (Table 22) service major customers
comprising manufacturing and trading companies in Johor, Klang Valley, Singapore and
Penang.
Company Name % Held Activities Country
Anugerah Sensasi Sdn Bhd 100 Transportation services Malaysia
Bechtrans International (S) Pte. Ltd. 26 Forwarding and transportation services Singapore
Belaian Pinang Sdn Bhd 100 Transportation services Malaysia Fair Vista Sdn Bhd 100 Property letting Malaysia Far East West Lands Sdn Bhd 100 Transportation services Malaysia Front Field Sdn Bhd 100 Transportation services Malaysia Jelas Bagus Sdn Bhd 100 Transportation services Malaysia
Pacific Transport Sdn Bhd 100 Transportation services and property letting Malaysia
Pengangkutan Enepec Sdn Bhd 100 Transportation services Malaysia Semangat Angkut Sdn Bhd 100 Transportation services Malaysia Tiong Nam Logistic (S) Pte. Ltd. 100 Property letting Singapore Tiong Nam Trading & Transport (M) Sdn Bhd 100 Transportation and related
services and property letting Malaysia
Table 22: Tiong Nam’s Subsidiaries & Associate Companies Source: Bursa Malaysia & Annual Report 2002.
It started of with conventional trucking and currently is the largest trucking company
with a fleet of more than 700 units and a niche container haulage operator in southern region,
Kuantan and the Klang Valley. The Group is also a strong player in Thailand-Malaysia-
Singapore cross-border trade and has extended it services to cover other logistics activities as
well. The Group claimed to be a total logistics provider for sea, air and land services.
70
As at Dec 31, 2003, they owned 27 warehouses all over Malaysia (Tanjung Pelepas,
Johor Bahru, Port Klang, Shah Alam, Melaka, Butterworth etc) with a total warehouse space
of over one million sq ft. Some of Tiong Nam's warehouses are equipped with closed-circuit
TV equipment and Warehouse Management Systems (WMS). With the vast branch network
covering all major cities in Peninsula Malaysia, Tiong Nam Group provides the following
logistics services: -
• Carriage of goods, long term or ad-hoc.
• Public bonded warehouse services, long term or ad-hoc.
• General warehouse services, long term or ad-hoc.
• Cold room and refrigerated truck services.
• Freight forwarding and customs documentation services.
• Moving of household effects.
• Transporting and positioning of heavy machinery and equipment.
• Crane and forklift services.
• Rental of office cabins.
• Arranging for appropriate goods in transit and marine insurance coverage.
4.5.2 Financial Highlights
Authorised Capital : RM200,000,000 Paid-Up-Capital : RM72,346,000
Details MAR-2003 MAR-2002 MAR-2001 MAR-2000
Earning Per Share(in RM) 0.074 0.051 0.140 0.244Dividend Per Share(in RM) 0.022 0.022 0.000 0.058NTA per share (in RM) 1.966 1.923 3.236 2.617Turnover (in RM000) 163,228 131,924 126,367 107,892Gross Profit (in RM000) 14,458 12,367 19,288 17,186Operating Profit# (in RM000) 8,201 6,937 13,004 10,534Operating Profit Margin (%) 5.02 5.26 10.29 9.76Net Profit #(in RM000) 5,296 3,561 5,543 9,637
Table 23: Tiong Nam # Net Profit is after tax and minority interest. Operating profit excludes extraordinary/exceptional items. Source: Bursa Malaysia & Annual Reports.
71
They managed to record some reasonable profits for the past 4 years despite the
economic slowdown after September 11 in 2001. This is another transportation based
Standard 3PL moving towards a Service Developer category (Figure 5) that has started to
offer an integrated service agreement (Figure 6) with the aim to be an LLP (Figure 7).
4.6 Century Logistics Holdings Bhd (Century/CLB): ‘Your Total Logistics Partner’
Sources of information for this case include www.bursamalaysia.com; http://www.century.com.my/ and Annual Reports.
4.6.1 History and Business
Century was listed quite recently on the Second Board of Bursa Malaysia, i.e. in June
2001. In terms of paid up capital and operation, it is rather small compared to the other
players. Nonetheless, the company also projected itself as a total logistics solutions provider.
The services provided include logistics project management, port and custom
clearance, cargo handling, inventory management, distribution centers, warehousing,
transshipment, ship husbanding and chartering, depot operations, fleet management,
international freight forwarding by air and sea and integrated multi-modal transportation
systems including container haulage.
72
Company Name % Held Activities Country
Best Heritage Sdn Bhd 100 Property investment Malaysia Century Advance Technology Sdn Bhd 100 IT services Malaysia
Century Advance Electronics Sdn Bhd 51 Value added services supporting the logistics operations Malaysia
Century Total Logistics Sdn Bhd 100 Total logistics services Malaysia
Century Forwarding Agency Sdn Bhd 70 Freight forwarding and shipping agency Malaysia
Century Global Logistics Sdn Bhd 70 International air and sea freight forwarding Malaysia
Century Logistics (Johore) Sdn Bhd 100Warehousing, freight forwarding, ship to ship transfer of bunker fuel and shipping agency
Malaysia
Century Logistics Sdn Bhd 100 Freiight forwarding, warehousing and container haulage Malaysia
Century Trucking Sdn Bhd 100 Transportation and open yard storage Malaysia
Storewell (M) Sdn Bhd 100 General, bonded and free commercial zone warehousing Malaysia
Storewell Realty Sdn Bhd 100 Property investment Malaysia
Nationwide Express Distribution Sdn. Bhd. 100 Dormant Malaysia Nationwide Express Freight Forwarders S/B 100 Freight forwarding services Malaysia Nationwide Express Logistics Sdn. Bhd. 100 Dormant Malaysia
Nationwide Express Metro S/B 100 ‘Tailor made’ logistics solution Malaysia
Table 26: Nationwide’s Subsidiaries. Source: Bursa Malaysia & Annual Report 2002
Following through with their expansion plans and in becoming one of the leading
total logistics providers, Nationwide acquired a 36,000 sqft. Logistics centre in Shah Alam in
June 2004. Currently, it has 110 networks, comprising of branches and agents in Malaysia,
Singapore, Brunei and Indonesia (The Star, 14 June 2004). Nevertheless, it is still in the
initial process of moving forward, from being a logistic service provider (LSP) towards a full
pledged Standard 3PL provider (Figure 5 & 7) with repeated transactions and partnership
agreements (Figure 6). Nationwide can be considered part of the second wave of Berglund et.
al (1999) study and the only Malaysian courier based 3PL listed on Bursa Malaysia.
75
4.7.2 Financial Highlights
Authorized Capital : 100,000,000 Paid-Up-Capital : 42,934,500
Details MAR-2003 MAR-2002 MAR-2001 MAR-2000
Earning Per Share(in RM) 0.164 0.127 0.338 0.448Dividend Per Share(in RM) 0.122 0.117 0.158 0.258NTA per share (in RM) 1.232 1.106 2.462 2.278Turnover (in RM000) 65,552 62,084 58,765 55,427Gross Profit (in RM000) 26,092 25,333 23,661 23,986Operating Profit# (in RM000) 8,860 8,032 9,021 11,616Operating Profit Margin(%) 13.52 12.94 15.35 20.96Net Profit #(in RM000) 7,049 5,448 6,458 8,547Table 27: Nationwide # Net Profit is after tax and minority interest. Operating profit excludes extraordinary/exceptional items. Source: Bursa Malaysia & Annual Reports.
Nationwide yearly performances reflect the business environment of the courier
services industry which was much better than the land logistics condition. The Group’s
margin was mainly affected by the increase in operational costs starting from 2001 and price
competition.
4.8 See Hup Consolidated Berhad (See Hup/SHC).
The information for See Hup is gathered from www.bursamalaysia.com; and Annual Reports.
4.8.1 History and Business The business started with just one lorry back in 1948, operating in the northern region of
Peninsular Malaysia. It has since diversified into transport-related businesses such as freight
forwarding, crane and forklift services and bonded warehousing and was listed in 1996. Its
business has also expanded into other states and across borders to Thailand and Singapore.
The Company offers general cargo transportation as well as transportation for heavy
equipment and project cargo which require specialized vehicles and skills.
76
Company Name % Held Activities Country
Butterworth Transport Company SB 100 Transportation services Malaysia
Chuan Eng Teik (M) Sdn Bhd 100Servicing and maintenance of heavy vehicles and dealing in related spare parts and tyres
Malaysia
Jentanian Transport and Forwarding SB 100 Transportation services Malaysia
Mazs Marketing (M) Sdn Bhd 51 Bonded truck services and bonded warehousing Malaysia
Perkapalan Maritime Sdn Bhd 49 Forwarding agent services Malayisa Rimbun Ekuiti Sdn Bhd 100 Investment holding Malaysia Sahaunion Transport Sdn. Bhd. 50.1 Transportation services Malaysia
See Heng Company Sdn Bhd 100 Hiring of cranes and forklifts and trading in general merchandise Malaysia
See Hup Pioneer Logistics Sdn. Bhd. 51 Provision of warehousing & fordwarding services and investment holding Malaysia
See Hup Transport (KL) Sdn Bhd 100 Transportation services Malaysia See Hup Transport Company Sdn Bhd 98.75 Transportation services Malaysia Tanjung Marine Sdn Bhd 49 Forwarding agent services Malaysia Viva Mesra Sdn. Bhd. 100 Investment holding Malaysia
Table 28: See Hup’s Subsidiaries and Associated Companies Source: Bursa Malaysia
The Group has branched out into construction industry as a subcontractor of
precasting works and general construction but the management stressed that they will
continue to remain focused on its core business and continue to develop the business that the
management knows best i.e. transportation and logistics business.
4.8.2 Financial Highlights
Similar reason was cited for the drop in profit margin starting from 2001, i.e. due to
reduced profit margins in an increasingly competitive haulage segment and logistics industry,
in general. The group recorded a total turnover of RM73 million during the financial year
ended March 31, 2003, representing an increase of 12% as compared to RM65 million in
previous year. The increase in turnover was substantially contributed from its trading
business segment generated from its joint venture partners in the construction industry.
77
Authorised Capital : 50,000,000 Paid-Up-Capital : 40,117,600
Details MAR-2003 MAR-2002 MAR-2001 MAR-2000
Earning Per Share(in RM) 0.030 0.017 0.064 0.152Dividend Per Share(in RM) 0.025 0.025 0.000 0.050NTA per share (in RM) 1.152 1.147 1.839 1.907Turnover (in RM000) 73,044 65,333 53,477 52,106Gross Profit (in RM000) 47,442 46,481 35,403 38,919Operating Profit# (in RM000) 2,238 2,210 2,308 5,732Operating Profit Margin(%) 3.06 3.38 4.32 11.00Net Profit #(in RM000) 1,214 687 1,595 3,797Table 29: See Hup # Net Profit is after tax and minority interest. Operating profit excludes extraordinary/exceptional items. Source: Bursa Malaysia & Annual Reports.
Generally, See Hup is a transportation based LSP (Figure 7) that carry on the business
on repeated transactions and some partnership agreement (Figure 6). After staying as trucking
company for so long, it is currently in the process of transforming itself to become a Standard
3PL (Figure 5).
4.9 Tamadam Bonded Warehouse Berhad (Tamadam/TBW): ‘Providing the Most
Efficient and Reliable Logistics Solution to Connect You to the World’
Sources of information for this case are www.bursamalaysia.com; http://www.tamadam.com/ and Annual Reports.
4.9.1 History and Business
This is another warehouse and distribution based 3PL. Tamadam Bonded Warehouse
Berhad was listed in 1994 and has evolved over the last twenty years from warehouse and
distribution to an integrated logistics services provider. The Group provides the following
services:
• Bonded and general storage • Cold storage • Open yard storage • Customs forwarding • Seafreight forwarding • Airfreight forwarding* • Picking and Packing • Labelling, Sorting, Documentation
78
• Customs Advice • Rental of Offices • Bonded and general trucking • Nationwide Distribution • Reverse Logistics • Haulage* • Container storage and repair • Online stock information • Raw Materials Management • Raw Material Shunting • Vendor Management Inventory • Order Processing * Outsourced
The Group manages about 700,000 sq.ft. of warehouse space in Port Klang. In
association with Damco Maritime, a member of the Royal Nedlloyd Group NV of Holland,
the Company also provides international freight forwarding services.
Company Name % Held Activities Country
18All.Com Sdn. Bhd. 100 Dormant Malaysia Expertyard (Penang) Sdn Bhd 50 Operator of container yard depot Malaysia Tamadam Crest Sdn Bhd 100 Insurance agency Malaysia Tamadam Industries Sdn Bhd 90.2 Provision of warehouse for rental Malaysia
Tamadam Logistics Berhad 100 Provision of property management services Malaysia
Tamadam Warehouse Direct Sdn. Bhd. 100Operator of licensed container yard and warehousing and trading of electrical and electronics goods
Tamadam is a warehouse and distribution based Standard 3PL, moving towards the
Service Developer category (Figure 5) offering an integrated logistics service agreement
(Figure 6) and project or contract management (Figure 7).
79
4.9.2 Financial Highlights
Authorized Capital : RM100,000,000 Paid-Up-Capital : RM49,005,000
Details DEC-2002 DEC-2001 DEC-2000 DEC-1999
Earning Per Share(in RM) NIL NIL NIL NIL Dividend Per Share(in RM) 0.000 0.000 0.000 0.000NTA per share (in RM) 0.668 0.761 0.798 1.968Turnover (in RM000) 19,863 15,402 15,459 11,882Gross Profit (in RM000) 5,922 3,420 3,951 3,323Operating Profit# (in RM000) -1,821 -4,429 -5,511 -9,455Operating Profit Margin(%) -9.17 -28.76 -35.65 -79.57Net Profit #(in RM000) -1,841 -4,548 -5,596 -9,915
Table 31: Tamadam # Net Profit is after tax and minority interest and 1999 was a tax free year. Operating profit excludes extraordinary/exceptional items.Source: Bursa Malaysia & Annual Reports.
The company recorded losses for the past 4 years, up to 2002. However, The Group’s
loss has declined overtime, largely due to the increase in turnover of logistics business in Port
Klang, reduction in financial cost (from RM5.8 million in 1999 to RM2.9million in 2002)
and the closure of the trading division in 2001.
Port Klang operations turned in an operating profit of RM1.1 million compared to a
loss of RM625,000 the previous year (2001). Revenue increased was contributed by
customers usage of value added services such as customs clearance, container stuffing and
unstuffing and nationwide distribution, in addition to storage space. There has been a
significant increase in demand for warehousing services, and full occupancy were recorded
during the year 2002. But, Johor’s operation was just satisfactory and Penang’s operation has
been struggling throughout the years .
4.10 Transocean Holdings Berhad (Transocean/THB): ‘Your Total Logistics Partner’
Sources: www.bursamalaysia.com; http://www.transocean.com.my/ and Annual Reports
80
4.10.1 History and Business
The Company (THB) began operations in 1977 as a family set up, offering freight
forwarding services, based in Penang. In the late eighties, they expanded the business to
cover international ocean and air freighting, bonded trucking, bonded and non-bonded
warehousing and container haulage services. These activities as at today still remained the
core businesses of the Group. It was listed in 1996.
The Group’s logistics services are provided through various subsidiaries (Table 32).
Transocean Freight Services Sdn Bhd specializes in NVOCC-Ocean/air freighting, with
operations at the KLIA, Penang International Airport, Port Klang and Penang. The Group’s
long hauled interstate bonded trucking services cover mainly Penang, Johor Bahru and
Singapore. These are handled by Transocean Logistics Sdn Bhd.
Transocean Agencies Sdn Bhd is a licensed forwarding agent, while Konteniaga
Public Bonded Warehouse Sdn Bhd is the operator for the Group’s bonded/non-bonded
warehouse located at Butterworth. Container haulage services are provided by Gerak Intensif
Sdn Bhd and Transocean Haulage Services Sdn Bhd (Table 32).
Company Name % Held Activities Country
Gerak Intensif Sdn Bhd 51 Provision of container haulage services Malaysia Konteniaga Public Bonded Warehouse Sdn Bhd 100 Provision of warehousing services and
trucking related services Malaysia
Transocean Agencies Sdn Bhd 100 Custom brokerage Malaysia Transocean Freight Express SB. 51 Investment holding Malaysia
Transocean Logistics Sdn Bhd 100 Provision of freight forwarding and trucking related services Malaysia
Table 32: Transocean’s Subsidiaries Source: Bursa Malaysia
Transocean developed into a 3PL provider from freight forwarding sector. It is still
considered a Standard 3PL with broader service offerings (Figure 5 & 7) and third party
agreement (Figure 6).
81
4.10.2 Financial Highlights
Authorised Capital :RM 50,000,000 Paid-Up-Capital : RM28,998,550
Details MAY-2003 MAY-2002 MAY-2001 MAY-2000
Earning Per Share(in RM) NIL NIL 0.094 0.086Dividend Per Share(in RM) 0.000 0.000 0.000 0.000NTA per share (in RM) 0.750 0.851 1.307 1.218Turnover (in RM000) 44,543 44,201 52,966 61,607Gross Profit (in RM000) 21,050 20,316 23,839 27,812Operating Profit# (in RM000) -3,577 -1,328 2,364 2,944Operating Profit Margin(%) -8.03 -3.00 4.46 4.78Net Profit #(in RM000) -3,150 -1,687 1,886 1,715
Table 33: Transocean # Net Profit is after tax and minority interest. Operating profit excludes extraordinary/exceptional items. Source: Bursa Malaysia & Annual Reports.
The unfavorable economic environment (after September 11) had a dampening impact
on the Group’s performance. The significant decline in the Group’s performance for year
ended May 2003 was attributed mainly to the higher depreciation and higher finance cost
which increased by 21.7% and 45.7% respectively as compared with the previous year. These
increases were the result of the expansion program of the Group’s haulage division. Other
notable increases were fuel charges which increased by 32.3% and repair and maintenance of
motor vehicles which increased by 66.0%.
In addition, a specific provision of bad and doubtful debts which amounted to
RM1.42million and impairment losses on investment in subsidiaries which amounted to
RM1.63million made it even worst.
4.11 Summary
Table 34 summarized the services provided by the local 3PL providers in the case
studies. The same list of services is used for the mail survey in Chapter 5. It is noted that
none of them is involved in demand forecasting and procurement for the customers. Only one
or two offer overseas sourcing, order processing, returns goods handling, parts and service
82
support and development of distribution strategy or system. Majority, offer the traditional
3PL services such as transportation and warehousing.
Quite a number of 3PL providers offer inventory management and information
management & reporting services that require a good and reliable IT system. However, based
on the industry sources, most of them are either still doing it manually or have a rather
unreliable IT system due to inadequate hardwares or support from the vendor and staff.
In contrast against the Hertz and Alfredsson (2003) study where the 3 case studies
started from 3 different quadrants, all the case study companies here started from 3PL
quadrant only and some of them have yet to fully developed as ‘true’ 3PL providers as
described by John Langley Jr. et al, 2003. As per the matrix in Figure 5, these companies are
either one of the following:
(a) Still remain a Standard 3PL provider;
(b) In the process of moving towards Service Developer or Customer Adapter
categories;
(c) Has moved up to be a Service Developer (as indicated by the dotted arrows in
Figure 5); or
(d) Has moved to the right to be a Customer Adapter (as indicated by the dotted
arrows in Figure 5).
However, none has become a full fledged Service Developer.
83
SERVICES PROVIDERS Diperdana ILB KLB MISC Tiong Nam Century Nationwide SeeHup TBW TN 1 Transportation servicesa X X X X X X X X X X 2 Warehousing and storageb X X X X X X X X X X 3 Order picking & packaging X X X X X 4 Overseas distribution X X X X X X X X X X 5 Overseas sourcing X X 6 Inventory control/management X X X X X X 7 Order processing X X 8 Pick-up and delivery X X X X X X 9 Freight consolidation X X X X X X X X X 10 Demand forecasting 11 Information management & reporting X X X X 12 Procurement 13 Distribution communications X X X X 14 Freight bill payment X X X X X X X X X X 15 Customs clearance X X X X X X X X X X 16 Return goods handling X X 17 Parts and service support X X 18 Salvage and scrap disposal. X X X X 19 Development of distribution strategy/system X X 20 Import/Export licensing assistance (FF) X X X X X X X X X X 21 Container depot management X X X 22 Property & equipment rental X X X X 23 Bulk liquid distribution services X X X 23 Shipping & chartering services X X Table 34: Services Provided By Local 3PL Providers in Malaysia Notes: a trucks, bonded trucks, reefer, haulage, heavy haulage, intermodal transportation etc
b bonded & non-bonded warehousing, coldroom, open yard and general warehousing The above is based on the author’s interpretation of available information.
84
5. The Survey of 3PL Users and Providers
A mail survey was carried out to uncover the 3PL providers’ and their customers’
views and experiences in providing or using 3PL services. The objective is to have a
comprehensive view on the dynamics of 3PL development in Malaysia. This chapter presents
the analysis of the responses to the mail survey sent to both 3PL providers and users as
explained in Chapter 2.
Fourteen usable responses were received from 3PL providers representing a response
rate of 40%. Another 26 usable responses, i.e. 17% response rate, came from users. Five
incomplete forms were returned buy a potential user and non-users. Altogether, the total
returns from users and non-users are 31 (21%).
The 40% response rate is considered very good if compared to an average mail survey
response of 5-10% (Alreck & Settle, 1995) and other recent surveys on 3PLs listed in
Chapter 2. The 17% response rate from users is slightly better than the 16% (124/800)
response rate received by Sohail and Sohal for their survey in the year 2000. The response
rate also upholds Alreck and Settle’s assertion that ordinarily those who are highly involved
with the topic are more likely to respond than those who aren’t.
85
Type of 3PL providers
Both12%
An international 3PL provider
31%
A local 3PL provider 57%
Figure 10: Respondents’ Choice.
Most of the users are very experience with the concept, with 42% stating that they
had been using 3PL services for 10 years and above and 27% between 5 to 9 years. Twelve
percent of them are using both international and local 3PLs at the same time; 57%
respondents use local 3PL and another 31% use international 3PLs (Figure 13).
5.1 Services Offered and Used
Both group were asked to choose from exactly the same list of 20 services and
indicate services currently offered or used. Respondents were also given an option to add
other services that they provide or use but not listed. Table 35 presents the ten 3PL services
most commonly offered and most frequently used.
86
Most Commonly Offered Services Percentage of 3PLs Warehousing and storage 100% Customs clearance 100% Transportation services 93% Order picking & packaging 79% Overseas distribution 79% Pick-up and delivery 79% Inventory control/management 71% Freight consolidation 71% Freight bill payment 71% Return goods handling 71% Most Commonly Used Services Percentage of Users Transportation services 96% Customs clearance 78% Warehousing and storage 70% Pick-up and delivery 70% Freight consolidation 63% Return goods handling 59% Freight bill payment 44% Salvage and scrap disposal. 41% Inventory mgmt/ Order picking & packaging. 33% Import/Export licensing assistance 33% Table 35: Most Commonly Offered and Used Services
The results are almost similar, except for the lower percentages on the users’ side
which could suggest a few things such as:
• Most of the users have not outsource the whole logistics process, preferring to
do it in-house instead;
• The services offered are not up to their expectation;
• The services needed were not offered by the providers;
• Majority of the respondents are local 3PL providers who provide mainly
traditional 3PL services; or
• The difference could also be due to the lack of matched pairs in the sample.
87
Only 2 providers added 2 services to the list: tax matters and electrical goods
assembly, and one user added an extra service, i.e. material handling equipment. Figure 14,
15 and 16 present the whole data in bar charts.
All 3PL respondents provide warehousing and custom clearance services. On the
other hand, only 73% of the users utilize warehousing services and another 77% make use of
custom clearance. In addition, all users outsource the transportation services. Nevertheless, it
was noted that all the 20 services listed were offered by at least one 3PL provider. In
contrast, no user respondent used the ‘oversea sourcing service’ offered by half of the 3PL
respondents.
Figure 16 shows that only 35% of the respondents used more than 9 services (33%),
the rest only used a few selected services. One user is using 90% (18 out of 20) of the
services offered from a local 3PL for over 5 years and rated the satisfaction level as ’4’. One
respondent had just outsourced 15 logistics activities to an international 3PL provider and
was very happy (level 4) with the service too.
88
Services Offered by 3PL Providers
64%43%
7%7%
7%21%
100%71%
71%
14%57%
7%71%
79%
50%
50%71%
50%79%79%
100%93%
0 2 4 6 8 10 12 14 16
Transportation servicesW arehousing and storage
Order pick ing & packagingOverseas distribution
Overseas sourcingInventory control/m anagem ent
Order processingPick-up and deliveryFreight consolidationDem and forecasting
Inform ation m anagem ent & reportingProcurem ent
Distribution com m unicationsFreight bill paym entCustom s clearance
Return goods handlingParts and service support
Salvage and scrap disposal.Developm ent of distribution strategy/system
Im port/Export licensing assistanceAssem bly -E lectrical products