Page 1
Providing research and information services to the Northern Ireland Assembly
Research and Library Service Briefing Note
1
Paper 15/11 17 January 2011 NIAR 551-10
Colin Pidgeon
The DHSSPS budget: where does the money go?
Key points
Staffing costs are the largest part of all HSC Trusts‟ expenditure;
Staffing costs rose in all HSC Trusts from 2008/09 to 2009/10. There was a
particularly notable increase in the Northern Trust;
Management costs also rose more in the Northern Trust than in the other HSC
Trusts;
Staffing costs in the core Department were nearly 15% higher in 2009/10 than in
2008/09;
Breakeven performance was much improved in 2009/10 compared to the previous
two years with no Trusts recording either large surpluses or deficits.
Page 2
NIAR 551-10 The DHSSPS budget: where does the money go?
Providing research and information services to the Northern Ireland Assembly 2
1. Introduction
According to the Health and Social Care Board (HSCB) almost £10 million per day is
spent on the health system in Northern Ireland.1 This equates to nearly £6 per person
in Northern Ireland every 24 hours. Tracking where that money is spent, by whom, and
on what is quite a complex task.
This paper provides some detail about how the budget is used. It provides detail on
expenditure by various bodies and also examines some elements of the Health and
Social Care (HSC)Trusts‟ accounts. Some figures on how they utilise the resources
allocated to them are presented.
Scope of this paper
This paper presents some analysis of DHSSPS expenditure. In the timescale available
it has not been possible to analyse all aspects of the budget. The focus of the paper
therefore is on the largest proportion of expenditure – that which is allocated by the
HSCB and the Public Health Agency (PHA) to HSC Trusts, and the Family Health
Services (FHS) Budget. This means that proportionately small areas like the Fire and
Rescue Service and the NI Medical & Dental Training Agency, for example, are not
covered – even though in expenditure terms those two organizations combined are
similar to the totality of the Department of Culture Arts and Leisure.
1 Health and Social Care Board (2010) „COMMISSIONING PLAN 2010/2011‟ available online at:
http://www.hscboard.hscni.net/lnews/21%20October%202010%20-%20Commissioning%20Plan%202010-
2011%20PDF%20974KB.pdf (accessed 24 November 2010) (see page 24)
Page 3
NIAR 551-10 The DHSSPS budget: where does the money go?
Providing research and information services to the Northern Ireland Assembly 3
2. How is the DHSSPS budget distributed?
For 2010/11, the Department received a budget of £4,307m. The following high-level
breakdown shows how that funding will be distributed this year:
Table 1 Distribution of DHSSPS budget for 2010/112
2010/11 £m
HSCB managed services – FHS, Running costs and services purchased from Trusts 3754
PHA running costs and services purchased from Trusts 70
Allocations to 6 Trusts from PHA and HSCB = £2,759million made up by Health Trust: Belfast Trust £930m South Eastern Trust £419m Southern Trust £437m Western Trust £416m Northern Trust £504m Ambulance Service £53m
Business Services Organisation 9
Patient Client Council 2
NI Practice & Education Council 1
NI Social Care Council 2
Regulation & Quality Improvement Authority 6
NI Medical & Dental Training Agency 53
NI Guardian Ad Litem Agency 4
NI Fire & Rescue Service 80
DHSSPS - Own Running Costs 32
DHSSPS – Centrally Managed budgets 112
DHSSPS – Education and Training 99
Depreciation 83
TOTAL 4,307
£3,824m (just under 89% of the total) is allocated to the HSCB and the Public Health
Agency (PHA). Of this, £2,759m is allocated to the six HSC Trusts. The remaining
£1,065m is spent directly by the HSCB and PHA – purchasing from external bodies
and managing the General Medical Services and Family Health Services budgets.
The remaining 11% is directly allocated by the Department to the various bodies listed
in the table, including its own running costs.
3. Expenditure by Programme of Care
A large proportion of HSC Trusts‟ expenditure in Northern Ireland is accounted for
under nine Programmes of Care. Costs and activities associated with the Family
2 Source: DHSSPS briefing paper for Committee for Health, Social Services and Public Safety, 21 October 2010.
Page 4
NIAR 551-10 The DHSSPS budget: where does the money go?
Providing research and information services to the Northern Ireland Assembly 4
Health Services Budget are not recorded under this framework. But this framework
nevertheless provides the clearest indication of how the DHSSPS budget is spent.
What are the programmes of care?
The nine programmes are:
Acute Services - includes all activity, and resources used, by any health
professional, relating to an inpatient episode where the consultant in charge of the
patient is a specialist in an acute specialty. It also includes all activity, and
resources used, by a hospital consultant in an acute specialty, in relation to an
outpatient episode, day case, or day care;
Maternity and Child Health – includes all activity related to obstetrics and child
health including community contacts in relation to maternity or child health. All
health-related community contacts for under-16s are included except in relation to
mental health, learning disability or physical and sensory disability;
Family and Child Care – includes activity and resources relating to social services
support of family and children, including children in care, child protection, family
centres, women‟s shelters for example and also community contacts by health
professionals where primary reason is family or childcare related;
Elderly Care - includes all activity, and resources used, by any health professional,
relating to an inpatient episode where the consultant in charge of the patient is a
specialist in geriatric medicine or old age psychiatry. Also includes community
contacts with those 65 or over (except in relation to mental illness or disability) and
includes dementia and all work relating to homes for the elderly;
Mental Health – includes all activity, and resources used, by any health
professional in relation to mental illness, child and adolescent psychiatry, forensic
psychiatry and psychotherapy. Note it does not include contact relating to dementia
which falls under Elderly Care;
Learning Disability - includes all activity, and resources used, by any health
professional in relation learning disabilities, including where patients with Down‟s
Syndrome develop dementia;
Physical and Sensory Disability – includes all contacts by a health professional
relating to physical or sensory disability (excluding patients over 65 which are
allocated to Elderly Care);
Health Promotion and Disease Prevention –all hospital, community and GP-
based activity relating to health promotion and disease prevention – including
screening, well woman/man clinics, child health surveillance, school health clinics,
vaccinations, community dental screening and so on; and,
Primary Health and Adult Community – includes contacts by health professionals
with community patients aged 16-64 where the primary reason is anything except
mental illness, learning disability or physical and sensory disability. It includes GP-
ordered diagnostic tests and treatments. Costs and activities associated with Family
Page 5
NIAR 551-10 The DHSSPS budget: where does the money go?
Providing research and information services to the Northern Ireland Assembly 5
Practitioner Services (GPs, Dentists, Pharmacists and General Ophthalmic
Practitioners) are considered outside the Programme of Care Framework – see
section 4 below.
Table 2 Actual Expenditure by Programme of Care by HSC Trusts 2005/06 to 2008/09
Actual Expenditure as per Trust Financial Returns %
change
05/06 to
08/09
2005/06 2006/07 2007/08 2008/09
Programme of Care £m £m £m £m
Acute Services 949.2 1,035.3 1,114.8 1,240.0 41.8%
Maternity and Child Health 110.9 117.9 121.8 138.2 36.7%
Family and Child Care 142.0 155.0 166.6 180.9 35.7%
Elderly Care 586.9 628.6 644.9 687.2 24.2%
Mental Health 182.4 190.8 197.0 222.7 28.7%
Learning Disability 175.6 185.6 200.2 215.3 33.0%
Physical and Sensory Disability 78.0 83.1 92.9 98.1 34.0%
Health Promotion and Disease
Prevention 38.1 42.0 46.6 47.1 35.3%
Primary Health and Adult
Community 68.1 77.1 98.1 120.4 105.5%
Total Expenditure 2,331.0 2,515.4 2,682.8 2,949.9 36.3%
Source: Department of Health Social Services and Public Safety
The following observations may be made in relation to this table:
Overall expenditure across all Programmes of Care increased by 36.3% between
2005/06 and 2008/09;
The largest increase in percentage terms was in „Primary Health and Adult
Community‟ (105.5%), however (as can be seen from Figure 1 below) this PoC
represented only around 4% of the total expenditure for 2008/09;
The second largest increase in percentage terms was in Acute Services (41.8%)
which (as can be seen from Figure 1 below) represented over 40% of the total
expenditure for 2008/09; and,
The smallest increase in percentage terms was in „Elderly Care‟ which (as can be
seen from Figure 1 below) represented just under a quarter of the total expenditure
for 2008/09.
Page 6
NIAR 551-10 The DHSSPS budget: where does the money go?
Providing research and information services to the Northern Ireland Assembly 6
Figure 1 Breakdown of HSC Trust Expenditure by Programme of Care 2008/09
This Figure shows that expenditure on „Acute Services‟ and „Elderly Care‟
accounted for about two thirds (65.3%) of the total expenditure recorded under the
PoC framework; and
Expenditure on „Health Promotion and Disease Prevention‟ accounted for the
smallest proportion (1.6%) of the total expenditure recorded under the PoC
framework.
42.0
4.7
6.1
23.3
7.5
7.3
3.33 1.60 4.08
Expenditure by Programme of Care (% of total) 2008/09
Acute Services
Maternity and Child Health
Family and Child Care
Elderly Care
Mental Health
Learning Disability
Physical and Sensory Disability
Health Promotion and Disease Prevention
Primary Health and Adult Community
Page 7
NIAR 551-10 The DHSSPS budget: where does the money go?
Providing research and information services to the Northern Ireland Assembly 7
4. Family Health Services
Responsibility for managing the Family Health Services Budget was devolved to the
HSCB on 1 July 2010. Over £0.8 billion was spent on Family Health Services in
2009/10 – 18.5% of total DHSSPS expenditure (£4.483m) in that year.
Expenditure under Family Health Services is accounted for under four headings:
General Medical Services;
General Dental Services;
General Pharmaceutical Services; and,
General Ophthalmic Services.
The table below provides actual expenditure for 2008/09 and 2009/10.
Table 3 Breakdown of Family Health Services Expenditure for 2008/09 and 2009/10.
£000s 2008/09 2009/10 % change 08/09 to 09/10
General Medical Services 220,201 223,605 1.55%
General Dental Services 92,098 100,514 9.14%
General Pharmaceutical
Services
461,016 483,872 4.96%
General Ophthalmic
Services
18,468 19,761 7.0%
Total 791,783 827,752 4.54%
Source: Assembly Research calculations from figures presented in HSBC Accounts for
year ending 31 March 2010
Figure 2 Breakdown of Family Health Services Expenditure for 2009/10
223,605
100,514483,872
19,761
Family Health Services Expenditure 09/10
General Medical Services
General Dental Services
General Pharmaceutical Services
General Ophthalmic Services
Page 8
NIAR 551-10 The DHSSPS budget: where does the money go?
Providing research and information services to the Northern Ireland Assembly 8
The following observations may be made from these data:
„General Pharmaceutical Services‟ constitutes the greatest proportion of expenditure
from the Family Health Services Budget (58.5% in 2009/10);
Expenditure on „General Dental Services‟ saw the largest growth from 2008/09 to
2009/10 in percentage terms; and,
Expenditure on „General Medical Services‟ saw the smallest growth from 2008/09 to
2009/10 in percentage terms.
Page 9
NIAR 551-10 The DHSSPS budget: where does the money go?
Providing research and information services to the Northern Ireland Assembly 9
5. HSC Trusts‟ expenditure.
Each of the HSC Trusts reports expenditure in its Net Expenditure Account under three
headings:
Staff costs;
Depreciation; and,
Other expenditure.
These are presented for the year ending 31 March 2010 in the charts below.
Figure 3 Belfast HSC Trust Expenditure 2009/10
Figure 4 Southern HSC Trust Expenditure 2009/10
687410
47241
583894
Belfast HSC trust expenditure 2009/10 (£000s)
staff costs
depreciation
other expenditure
303291
12009
216646
Southern HSC trust expenditure 2009/10 (£000s)
staff costs
depreciation
other expenditure
Page 10
NIAR 551-10 The DHSSPS budget: where does the money go?
Providing research and information services to the Northern Ireland Assembly 10
Figure 5 South Eastern HSC Trust Expenditure 2009/10
Figure 6 Northern HSC Trust Expenditure 2009/10
288021
14385
238846
South Eastern trust expenditure 2009/10(£000s)
staff costs
depreciation
other expenditure
367749
14816
236279
Northern trust expenditure 2009/10 (£000s)
staff costs
depreciation
other expenditure
Page 11
NIAR 551-10 The DHSSPS budget: where does the money go?
Providing research and information services to the Northern Ireland Assembly 11
Figure 7 Western HSC Trust Expenditure 2009/10
Figure 8 NI Ambulance HSC Trust Expenditure 2009/10
It is fairly immediately apparent that – aside from the NI Ambulance trust which is a
functionally different organisation – each of the charts shows a similar pattern:
Staff costs make up more than 50% of trust expenditure;
Depreciation makes up a similar – and in each case relatively small – proportion of
expenditure; and,
Other expenditure constitutes approximately 40% of trust expenditure.
298586
15204
226942
Western HSC trust expenditure 2009/10
(£000s)
staff costs
depreciation
other expenditure
44253
3851
11687
NI Ambulance trust expenditure 2009/10 (£000s)
staff costs
depreciation
other expenditure
Page 12
NIAR 551-10 The DHSSPS budget: where does the money go?
Providing research and information services to the Northern Ireland Assembly 12
As staff costs make up such a large proportion of the HSC Trusts‟ expenditure, more
detail is provided below (in sections 5.1, 5.2 and 5.3) in terms of average staffing
numbers and changes in staffing costs.
Section 5.4 provides more information on „other expenditure‟.
5.1. Average numbers of persons employed by the HSC Trusts
The Trusts‟ accounts for the year ending 31 March 2010 report the average number of
whole time equivalent persons employed during 2010 and the previous year. The
tables presented below show changes in staffing levels against the categorisations
reported.
Table 4 Average numbers of persons employed 2009 and 2010 by Belfast HSC Trust
2008/09 2009/10 % change 08/09 to
09/10
Staff as
proportion of
total staffing
Medical and dental 1559 1517 -2.69 8.58%
Nursing and
midwifery 6501 6473 -0.43 36.62%
Profession allied to
medicine 1221 1237 1.31 7.00%
Ancillaries 1759 1744 -0.85 9.87%
Administrative and
clerical 3536 3371 -4.67 19.07%
Works 217 197 -9.22 1.11%
Other professional
and technical 1157 1126 -2.68 6.37%
Social services 1890 2013 6.51 11.39%
Other 2 0 -100.00 0.00%
Total 17842 17678 -0.92
Source: Assembly Research calculations from figures presented in Trust Accounts for
year ending 31 March 2010
Page 13
NIAR 551-10 The DHSSPS budget: where does the money go?
Providing research and information services to the Northern Ireland Assembly 13
Table 5 Average numbers of persons employed 2009 and 2010 by Southern HSC Trust
2009 2010 % change 08/09 to
09/10
Staff as
proportion of
total staffing
Medical and dental 561 542 -3.39 6.63%
Nursing and
midwifery 2774 2818 1.59 34.48%
Profession allied to
medicine 744 779 4.70 9.53%
Ancillaries 803 792 -1.37 9.69%
Administrative and
clerical 1584 1688 6.57 20.66%
Works 74 61 -17.57 0.75%
Other professional
and technical 123 123 0.00 1.51%
Social services 1029 1034 0.49 12.65%
Other 349 335 -4.01 4.10%
Total 8041 8172 1.63
Source: Assembly Research calculations from figures presented in Trust Accounts for
year ending 31 March 2010
Table 6 Average numbers of persons employed 2009 and 2010 by South Eastern HSC
Trust
2009 2010 % change 08/09 to
09/10
Staff as
proportion of
total staffing
Medical and dental 522 514 -1.53 6.41%
Nursing and
midwifery 2660 2816 5.86 35.12%
Profession allied to
medicine 538 559 3.90 6.97%
Ancillaries 1216 1227 0.90 15.30%
Administrative and
clerical 1446 1395 -3.53 17.40%
Works 82 86 4.88 1.07%
Other professional
and technical 282 298 5.67 3.72%
Social services 1132 1123 -0.80 14.01%
Other 25 0 -100.00 0.00%
Total 7903 8018 1.46
Source: Assembly Research calculations from figures presented in Trust Accounts for
year ending 31 March 2010
Page 14
NIAR 551-10 The DHSSPS budget: where does the money go?
Providing research and information services to the Northern Ireland Assembly 14
Table 7 Average numbers of persons employed 2009 and 2010 by Northern HSC Trust
2009 2010 % change 08/09 to
09/10
Staff as
proportion of
total staffing
Medical and dental 575 556 -3.30 5.81%
Nursing and
midwifery 3100 3164 2.06 33.09%
Profession allied to
medicine 746 779 4.42 8.15%
Ancillaries 958 957 -0.10 10.01%
Administrative and
clerical 1832 1777 -3.00 18.58%
Works 118 120 1.69 1.25%
Other professional
and technical 298 306 2.68 3.20%
Social services 1887 1903 0.85 19.90%
Other 0 0 0.00%
Total 9514 9562 0.50
Source: Assembly Research calculations from figures presented in Trust Accounts for
year ending 31 March 2010
Table 8 Average numbers of persons employed 2009 and 2010 by Western HSC Trust
2009 2010 % change 08/09 to
09/10
Staff as
proportion of
total staffing
Medical and dental 483 478 -1.04 5.70%
Nursing and
midwifery 3104 3151 1.51 37.60%
Profession allied to
medicine 398 404 1.51 4.82%
Ancillaries 748 722 -3.48 8.62%
Administrative and
clerical 1556 1548 -0.51 18.47%
Works 165 179 8.48 2.14%
Other professional
and technical 297 296 -0.34 3.53%
Social services 1371 1363 -0.58 16.26%
Other 185 239 29.19 2.85%
Total 8307 8380 0.88
Source: Assembly Research calculations from figures presented in Trust Accounts for
year ending 31 March 2010
Page 15
NIAR 551-10 The DHSSPS budget: where does the money go?
Providing research and information services to the Northern Ireland Assembly 15
Table 9 Average numbers of persons employed 2009 and 2010 by NI Ambulance Trust
2009 2010 % change 08/09 to
09/10
Staff as
proportion of
total staffing
Medical and dental 2 2 0.00 0.18%
Nursing and
midwifery 0 0 0.00%
Profession allied to
medicine 0 0 0.00%
Ancillaries 0 0 0.00%
Administrative and
clerical 79 86 8.86 7.63%
Ambulance staff 1044 1033 -1.05 91.66%
Works 2 3 50.00 0.27%
Other professional
and technical 0 0 0.00%
Social services 0 0 0.00%
Other 0 0 0.00%
Total 1131 1127 -0.35
Source: Assembly Research calculations from figures presented in Trust Accounts for
year ending 31 March 2010
A number of observations may be made from these data:
The proportion of total staffing levels made up of administrative and clerical staff
ranges from 7.63% in the NI Ambulance Trust to 20.66% in the Southern HSC Trust;
In Belfast HSC Trust the proportion of administrative and clerical staff is second
highest (19.07%) but this is the largest Trust and one might expect the proportion of
admin support to be lower;
The proportion of total staffing levels made up of administrative and clerical staff is
higher than the proportion employed in social services in four of the six HSC Trusts
(except Northern - the Ambulance Trust does not employ social services staff);
In the Southern and Belfast HSC Trusts the proportion of administrative and clerical
staff is nearly double that of social services staff;
In four of the six HSC Trusts the average total number of staff employed increased
slightly between 2008/09 and 2009/10;
The average total number of staff employed by the Belfast and NI Ambulance HSC
Trusts decreased marginally between 2008/09 and 2009/10;
The average number of staff employed in „administrative and clerical‟ roles fell in
four of the six HSC Trusts;
The average number of staff employed in „administrative and clerical‟ roles
increased in the Southern HSC Trust (+6.57%) and in the NI Ambulance HSC Trust
(+8.86%);
Page 16
NIAR 551-10 The DHSSPS budget: where does the money go?
Providing research and information services to the Northern Ireland Assembly 16
The average number of staff employed in „medical and dental‟ roles fell in all HSC
Trusts except the NI Ambulance Trust;
The average number of staff employed in „nursing and midwifery‟ roles increased in
four of the six HSC Trusts (the NI Ambulance Trust employs no-one in this kind of
role) and fell slightly in the Belfast HSC Trust;
The average number of staff employed in „social services roles‟ changed only
marginally in four of the six HSC Trusts (the NI Ambulance Trust employs no-one in
this kind of role) but increased quite significantly in the Belfast HSC Trust (+6.51%).
5.2 Staff costs
The Department and Trusts‟ accounts also report staffing costs. The table below
shows the changes in net staffing costs from 2008/09 to 2009/10. Staffing costs
include salaries and wages, social security costs and other pensions costs, net of
salaries charged to capital and recoveries from outward secondments.
Table 10 Net staffing costs for Core Department and Trusts 2008/09 to 2009/10
£000 2008/09 2009/10 % change 09/10 staff cost
as proportion
of total income
DHSSPS Core
Department
25,210 28,888 14.59 n/a
Belfast HSC Trust 664,588 680,802 2.44 52.18%
Southern HSC
Trust
285,355 302,639 6.06 56.17%
South Eastern HSC
Trust
270,965 287,227 6.00 53.20%
Northern HSC
Trust
326,347 367,749 12.69 67.65%
Western HSC Trust 284,353 298,586 5.01 55.24%
NI Ambulance
Trust
43,552 44,253 1.61 74.56%
Source: Assembly Research calculations from figures presented in Departmental and
Trust Accounts for year ending 31 March 2010
The following observations may be made from these data:
Staffing costs increased in all HSC Trusts and in the core Department from 2008/09;
The increase in the core Department was nearly 15%;
The increase in the Northern Trust was over 12%;
Staffing costs expressed as a proportion of total income is over 50% in all HSC
Trusts and are noticeably higher in both the NI Ambulance Trust and the Northern
Trust.
Page 17
NIAR 551-10 The DHSSPS budget: where does the money go?
Providing research and information services to the Northern Ireland Assembly 17
Table 11: HSC Trusts average cost per member of staff 2008/09 and 2009/10
£000s 2008/09 2009/10
Belfast HSC Trust 37.2 39
Southern HSC Trust 35.4 37
South Eastern HSC Trust 36.1 36
Northern HSC Trust 34.3 38.4
Western HSC Trust 34.2 36
NI Ambulance Trust 39 39.2
Source: Assembly Research calculations from figures presented in Departmental and
Trust Accounts for year ending 31 March 2010
Average cost per member of staff rose in each HSC Trust except Southern which
fell marginally from 2008/09 to 2009/10;
The largest increase in average cost per staff member was in the Northern Trust,
where it rose on average by more than £4,000 per head;
The highest average cost per staff member is in the NI Ambulance Trust.
Page 18
NIAR 551-10 The DHSSPS budget: where does the money go?
Providing research and information services to the Northern Ireland Assembly 18
5.3 Management costs
Another subset of overall costs that is reported in the Trusts‟ accounts is the proportion
spent on management. The figure below shows these costs from 2006/07 to 2008/09.
Figure 9 Management costs3
One immediate observation that can be drawn from this chart is that in all HSC
Trusts management costs were higher in 2008/09 than they were in 2007/08. It is
also noticeable that in three of the HSC Trusts (Belfast, Northern and Western)
management costs had fallen between 2006/07 and 2007/08 before the increases in
the following year.
The table below presents slightly more recent data on management costs including
the figures for 2009/10. Management costs as a proportion of total income are also
presented.
3Cited in Assembly Research Paper 165/10 available online at:
http://www.niassembly.gov.uk/researchandlibrary/2010/16510.pdf
Page 19
NIAR 551-10 The DHSSPS budget: where does the money go?
Providing research and information services to the Northern Ireland Assembly 19
Table 12 Total management costs and management costs as a proportion of total income
2008/09 to 2009/10
£000 2008/09 08/09
management
costs as a
proportion of
total income
2009/10 % change in
management
costs 2008/09
to 2009/10
09/10
management
costs as
proportion of
total income
Belfast HSC Trust
41,454 3.6% 41,966 1.22 3.2%
Southern HSC
Trust
19,655 4.1% 20,919 6.43 3.9%
South Eastern
HSC Trust
15,527 3.2% 15,877 2.20 2.9%
Northern HSC
Trust
19,875 3.54% 21,356 7.45% 3.46%
Western HSC
Trust
20,815 4.31% 18,239 -12.38 3.37%
NI Ambulance
Trust
3,659 6.42% 3,745 2.35 6.31%
Source: Assembly Research calculations from figures presented in Trust Accounts for
year ending 31 March 2010
The following observations may be made from these data:
Management costs as a proportion of total income in 2009/10 ranged from 2.9% in
the South Eastern Trust to 6.31% in the NI Ambulance Trust;
In all HSC Trusts except one (Western – where they fell significantly) management
costs increased in 2009/10; but,
Although management costs increased in total in all but the Western HSC Trust,
they fell as a proportion of total income in all of the HSC Trusts.
5.4. „Other expenditure‟: what is it?
Other expenditure constitutes the second-largest proportion of each HSC Trust‟s net
expenditure account. This section provides some analysis of the categories of spend
that are covered within this broad heading.
Other expenditure is constituted of a large number of differing costs including the
purchase of supplies and services, grants to voluntary bodies, transport, interest
charges, bad debts and premises, for example.
Page 20
NIAR 551-10 The DHSSPS budget: where does the money go?
Providing research and information services to the Northern Ireland Assembly 20
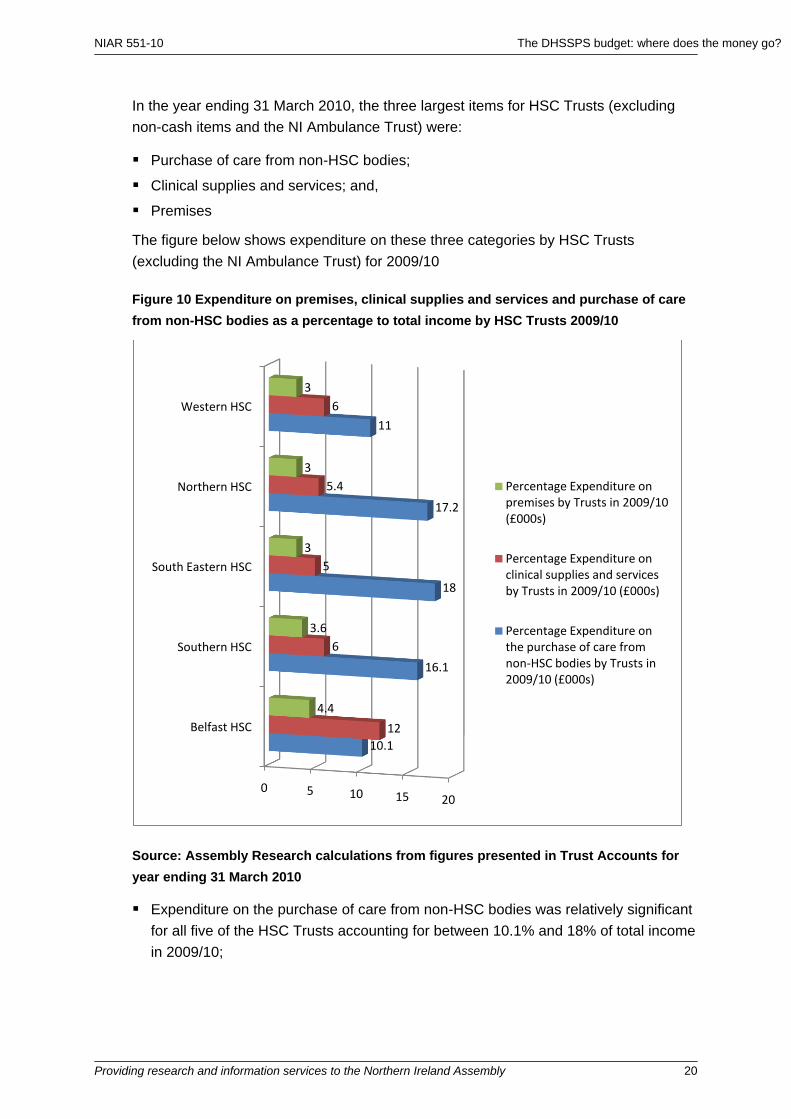
In the year ending 31 March 2010, the three largest items for HSC Trusts (excluding
non-cash items and the NI Ambulance Trust) were:
Purchase of care from non-HSC bodies;
Clinical supplies and services; and,
Premises
The figure below shows expenditure on these three categories by HSC Trusts
(excluding the NI Ambulance Trust) for 2009/10
Figure 10 Expenditure on premises, clinical supplies and services and purchase of care
from non-HSC bodies as a percentage to total income by HSC Trusts 2009/10
Source: Assembly Research calculations from figures presented in Trust Accounts for
year ending 31 March 2010
Expenditure on the purchase of care from non-HSC bodies was relatively significant
for all five of the HSC Trusts accounting for between 10.1% and 18% of total income
in 2009/10;
0 5 10 15 20
Belfast HSC
Southern HSC
South Eastern HSC
Northern HSC
Western HSC
10.1
16.1
18
17.2
11
12
6
5
5.4
6
4.4
3.6
3
3
3
Percentage Expenditure on premises by Trusts in 2009/10 (£000s)
Percentage Expenditure on clinical supplies and services by Trusts in 2009/10 (£000s)
Percentage Expenditure on the purchase of care from non-HSC bodies by Trusts in 2009/10 (£000s)
Page 21
NIAR 551-10 The DHSSPS budget: where does the money go?
Providing research and information services to the Northern Ireland Assembly 21
Expenditure on clinical supplies and services was between 5% and 6% of total
income for 2009/10 for four of the HSC Trusts, but double that (12%) in Belfast
HSC;
Expenditure on premises was slightly higher in Belfast HSC as a percentage of total
income – which one might expect as property costs are higher in Belfast than in
other parts of Northern Ireland.
6. Prompt payment performance
The most recent NIAO General Report on the HSC Sector in Northern Ireland
presented the data on prompt payments in the sector4 – see figure below:
Figure 11 prompt payment performance in the HSC sector 2008/09
This figure illustrates that in relative terms, a number of HSC Trusts performed quite
poorly on compliance with the prompt payment policy; best practice suggests that 95%
of payments to creditors (measure by volume rather than value) should be made within
30 days.5
The table below presents the percentage of payments made within 30 days by each of
the HSC Trusts from 2007/08 to 2009/10.
4 NIAO (2010) http://www.niauditoffice.gov.uk/pubs/2010/8632HealthSocialCarefinal.pdf (accessed 6 December 2010) (see
page 8) 5 NIAO (2010) http://www.niauditoffice.gov.uk/pubs/2010/8632HealthSocialCarefinal.pdf (accessed 6 December 2010) (see
page 7)
Page 22
NIAR 551-10 The DHSSPS budget: where does the money go?
Providing research and information services to the Northern Ireland Assembly 22
Table 13 Percentage of payments made within 30 days by HSC Trusts 2007/08 to 2009/10.
2007/08 2008/09 2009/10
Belfast HSC Trust*
90% 83.1% 80.4%
Southern HSC Trust
83.4% 75.3% 76.6%
South Eastern HSC
Trust
84.6% 79.2% 84.3%
Northern HSC Trust
83.6% 84.8% 88.2%
Western HSC Trust
91.4% 94.5% 89.5%
NI Ambulance Trust
92.3% 88.8% 93.3%
Source: figures presented in Trust Accounts for years ending 31 March 2009 and 2010.
*Note Belfast HSC Trust presents its figures in compliance with „paid within terms‟
rather than the 30-day policy.
Figure 12 Percentage of payments made within 30 days by HSC Trusts 2007/08 to 2009/10
Source: figures presented in Trust Accounts for years ending 31 March 2009 and 2010
The following observations may be made from these data:
In four of the HSC Trusts (Southern, South Eastern, Northern and NI Ambulance)
performance on prompt payment improved in 2009/10 on 2008/09;
0%10%20%30%40%50%60%70%80%90%
100%
Prompt payment
2007/08
2008/09
2009/10
Page 23
NIAR 551-10 The DHSSPS budget: where does the money go?
Providing research and information services to the Northern Ireland Assembly 23
In only one HSC Trust (Northern) did prompt payment show an improvement on the
previous year in both 2008/09 and 2009/10; and,
In one HSC Trust (Belfast) prompt payment worsened on the previous year in both
2008/09 and 2009/10.
7. Breakeven performance
Under Article 15(1) of the Health and Personal Social Services (NI) Order 19916 HSC
Trusts are required to ensure that their expenditure does not exceed their income. If a
deficit of greater than 0.5% of income arises, an explanation must be provided in the
accounts.7
The performance of the HSC Trusts from 2007/08 to 2009/10 on “the break even duty”
is shown in the figure below.
Figure 13 HSC Trusts surplus or deficit against Revenue Resource Limit 2007/08 to
2009/10
Source: HSC Trust Accounts 2009/10
The following observations may be made from these data:
6 Available online at:
http://www.statutelaw.gov.uk/content.aspx?LegType=All+Legislation&title=health+and+personal+social+services&Year=1
991&searchEnacted=0&extentMatchOnly=0&confersPower=0&blanketAmendment=0&sortAlpha=0&TYPE=QS&PageNu
mber=1&NavFrom=0&parentActiveTextDocId=2945679&ActiveTextDocId=2945701&filesize=961 (accessed 10 January
2011) 7 NIAO (2010) http://www.niauditoffice.gov.uk/pubs/2010/8632HealthSocialCarefinal.pdf (accessed 10 January 2011) (see page
6)
-1000
-800
-600
-400
-200
0
200
400
600
800
2007/08 2008/09 2009/10
Surplus/deficit against Revenue Resource Limit (£000s)
South Eastern HSC Trust
Belfast HSC Trust
Western HSC Trust
Southern HSC Trust
NI Ambulance HSC Trust
Northern HSC Trust
Page 24
NIAR 551-10 The DHSSPS budget: where does the money go?
Providing research and information services to the Northern Ireland Assembly 24
A deficit was reported by one HSC Trust in 2007/08 (Belfast);
A deficit was reported by two HSC Trusts in 2008/09 (Belfast and Northern); and
No HSC Trusts reported a deficit in 2009/10.
The performance in 2009/10 therefore appears to be an improvement on previous
years.
8. Income from other sources
The HSC Trusts main source of income is the allocation they receive from the
DHSSPS via the HSCB and the PHA. But they also have other sources of income
including:
Private patients;
Client contributions;
Other HSC Trusts;
Other Health Authorities in GB/RoI; and,
Non-HSS: Other
The table below presents the HSC Trusts total income, which is derived by adding
each Trusts‟ Revenue Resource Limit (RRL - the central allocation) and their income
from other sources for 2008/09 and 2009/10. The proportion of total income that
comes from other sources is also shown.
Table 14 Breakdown of HSC Trusts’ Income by source, 2008/09 and 2009/10 (000s)
£000s
2008/09
2009/10
RRL
income
from
other
sources
total
income
income
from
other
sources
as % of
total RRL
income
from
other
sources
total
income
income
from
other
sources
as % of
total
Belfast
HSC Trust 1090375 76,416 1,166,791 6.55 1,222,162 82,661 1,304,823 6.34
Southern
HSC Trust 458,420 26,586 485,006 5.48 509,560 29,190 538,750 5.42
South
Eastern
HSC Trust 453589 30015 483,604 6.21 502,334 37,595 539,929 6.96
Northern
HSC Trust 524,708 36,062 560,770 6.43 577,077 39,447 616,524 6.40
Western
HSC Trust 458354 24,716 483,070 5.12 513,047 27,466 540,513 5.08
NI
Ambulance 55730 1655 57,385 2.88 58124 1672 59,796 2.80
Page 25
NIAR 551-10 The DHSSPS budget: where does the money go?
Providing research and information services to the Northern Ireland Assembly 25
Source: Assembly Research calculations from figures presented in Trust Accounts for
year ending 31 March 2010
The following observations may be made about these data:
In both years income from sources other than the RRL represented between 5%
and 7% of total income (excluding the NI Ambulance Trust); and,
Income from other sources as a proportion of total income fell slightly for each HSC
Trust in 2009/10 except for South Eastern HSC which rose from 6.21% to 6.96%.