The Differential Effect of Career Anchor Profiles on the Relationship between Career Plateau and Turnover Intention
by
Lin, Bing-Han
A Thesis Submitted to the Graduate Faculty in Partial Fulfillment of the
Requirements for the Degree of
MASTER OF BUSINESS ADMINISTRATION
Major: International Human Resource Development
Advisor: Dr. C. Rosa Yeh, Ph. D.
National Taiwan Normal University Taipei, Taiwan
August 2017
ACKNOWLEDGEMENT This thesis is dedicated to each and every one who has been there every step of
the way throughout my two years being a graduate student. Without all the supports
I received from all of you, I couldn’t have made it to where I am today.
First, I would like to thank my advisor, Dr. Yeh. Thank you for guiding me
through the completion of my thesis. Without the guidance and advice, I would not
be able to accomplish this tough task. In addition, the attitude that you taught me
when dealing with work is the priceless treasure in this journey.
Second, I would like to thank my family. Although, there is little you can do to
help with my schoolwork and thesis (Actually, data collection is a huge part.), the
continuous encouragement and confidence in me are the energy that help me cross
the finish line.
Finally, I would like to thank Rick for all the help I received from you; Owen,
Karina, Derrick, Shanglin, Fan, Lynn and all other dear fellows in IHRD for
accompanying me from the beginning till the end. Things that I have learned from
all of you have become a part of me and made me who I am today. Hope that I did
the same to you all too. At last, I want to say that “We did it!
I
ABSTRACT
Career plateau is a situation that individuals will face sooner or later in their career
life. It generally leads to negative outcomes such as dissatisfaction toward the job,
low organizational commitment, and even worse high turnover intention and
turnover rate. In this study, the researcher intended to discover the relationship
between career plateau, turnover intention and career anchors to help resolve the
talent management problem. Therefore, two hypotheses were proposed. First, career
plateau had a relationship with turnover intention. Second, career anchor profiles
had a moderating effect on the relationship between career plateau and turnover
intention. A quantitative research was conducted and the data was collected through
online questionnaires. The participants in this study were the current employees in
Taiwan who have been working for at least one year in private sectors. The final
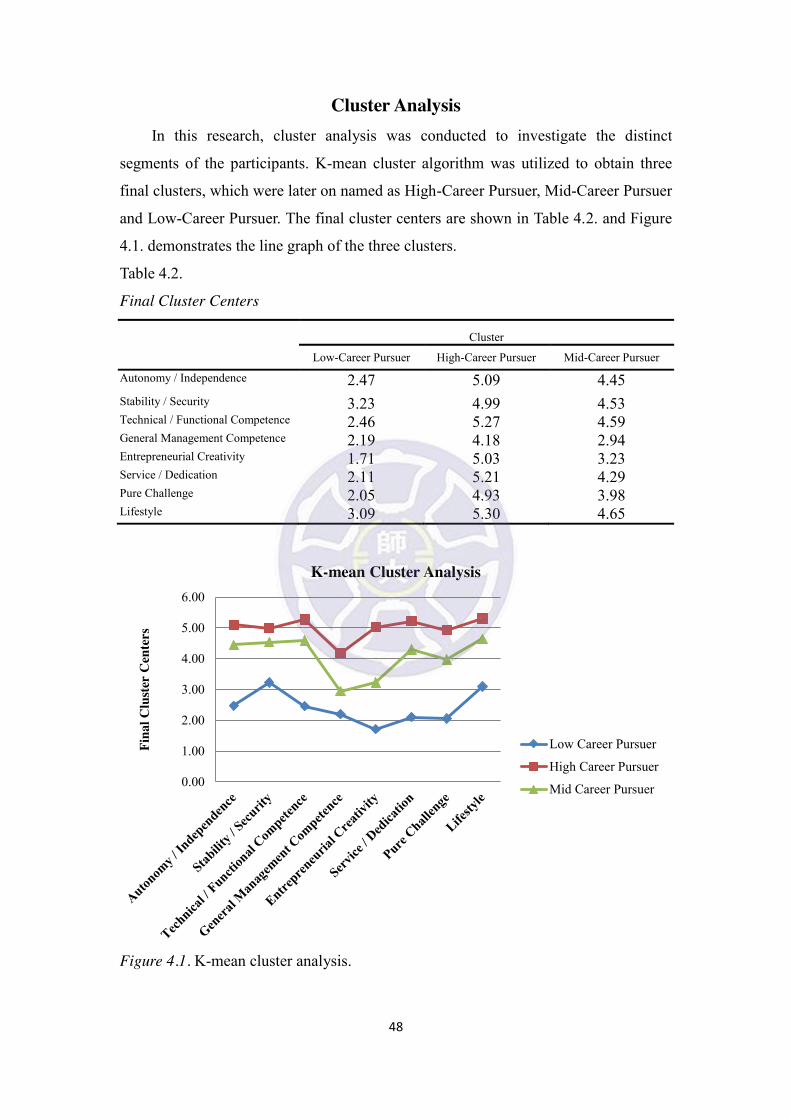
number of valid responses was 412. After the statistical analysis, three clusters: low
career pursuers, mid-career pursuers and high career pursuers, were generated. The
result demonstrated an individual’s career development stages. In the beginning,
individuals focus more on the stability/security and lifestyle anchors. After
accumulation of experiences and explored their career, individuals developed into
mid-career pursuers who paid great attention to technical/functional competence and
service/ dedication to a cause anchors. Finally, when they were well developed in
their career and became the high career pursuers, the general managerial competence
and entrepreneurial creativity seem to be the most important anchors at the stage.
The effects of the three cluster profiles on the relationship between career plateau
and turnover intention also support the aforementioned findings.
Keywords: career plateau, turnover intention, career anchors
II
TABLE OF CONTENTS
ABSTRACT ................................................................................................ I
TABLE OF CONTENTS ........................................................................... II
LIST OF TABLES ................................................................................... IV
LIST OF FIGURES ................................................................................... V
CHAPTER I INTRODUCTION ................................................................. 1
Background of the Study ........................................................................................... 1
Statement of the Problem ........................................................................................... 4
Purpose of the Study .................................................................................................. 5
Research Questions .................................................................................................... 6
Scope of the Study ..................................................................................................... 6
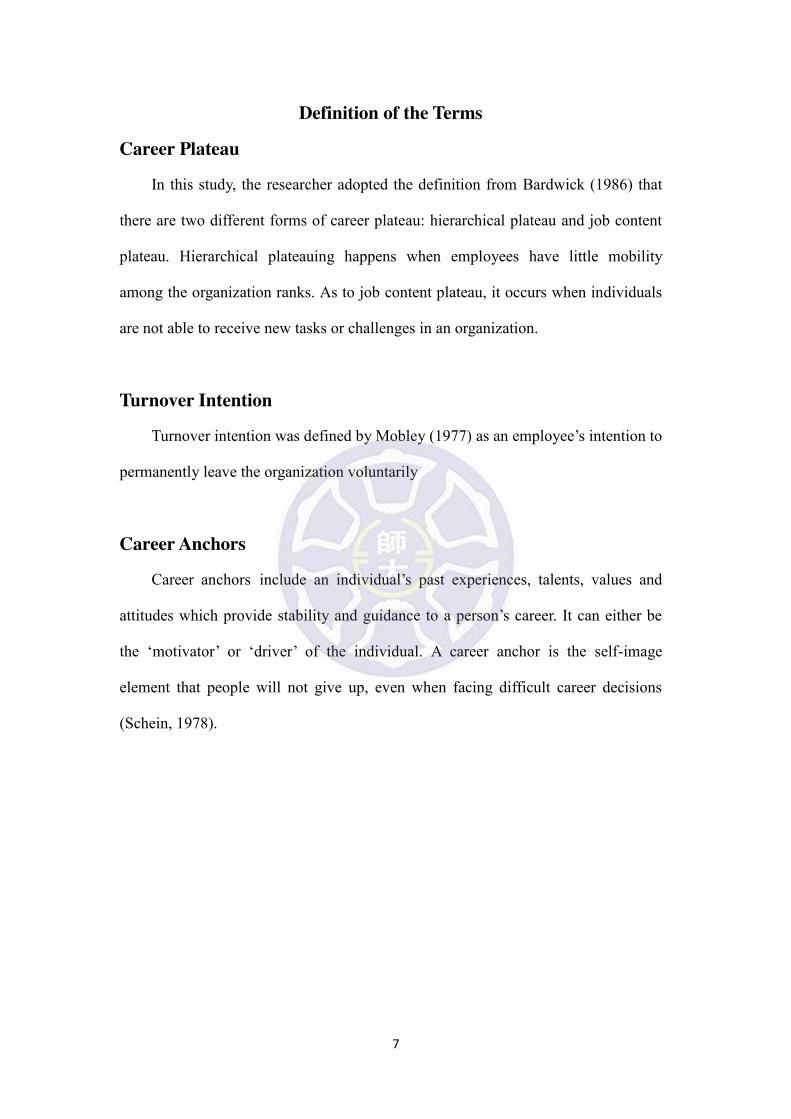
Definition of the Terms .............................................................................................. 7
CHAPTER II LITERATURE REVIEW .................................................... 8
Turnover ..................................................................................................................... 8
Career Plateau .......................................................................................................... 15
The Moderating Effects of Career Anchor Profiles ................................................. 18
CHAPTER III RESEARCH METHOD ................................................... 23
Research Framework ............................................................................................... 23
Research Procedure .................................................................................................. 24
Research Design ....................................................................................................... 26
Measurement ............................................................................................................ 30
Validity and Reliability Tests .................................................................................. 35
CHAPTER IV DATA ANALYSIS AND FINDINGS............................. 45
III
Correlation Analysis ................................................................................................ 45
Cluster Analysis ....................................................................................................... 48
Hierarchical Regression Analysis ............................................................................ 51
CHAPTER V CONCLUSIONS AND DISCUSSION ............................. 56
Conclusion ............................................................................................................... 56
Discussion ................................................................................................................ 56
Theoretical Implications .......................................................................................... 58
Practical Implications ............................................................................................... 59
Limitations ............................................................................................................... 59
Suggestions for Future Research ............................................................................. 60
REFERENCE ............................................................................................ 61
APPENDIX ............................................................................................... 67
IV
LIST OF TABLES
Table 3.1. Demographics of the Sample………………………………….......…...27
Table 3.2. Exploratory Factor Analysis (EFA): Turnover Intention......................36
Table 3.3. Exploratory Factor Analysis (EFA): Career Plateau………………….37
Table 3.4. Exploratory Factor Analysis (EFA): Career Anchors…………………38
Table 3.5. Indices of Model Fits………………………....…...…………………..41
Table 3.6. Career plateau and turnover intention model fit summary……………43
Table 3.7. Cronbach’s Alpha……………………………………………………..44
Table 4.1. Mean, Standard Deviation, Correlation and Reliability among Research
Variables ……………………………………………………………...47
Table 4.2. Final Cluster Centers………………………………………………….48
Table 4.3. Cluster Profile…………………………………………………………50
Table 4.4. Hierarchical Regression Result……………………………...…..….…51
Table 4.5. Hierarchical Regression Result among Clusters……………..………..53
Table 4.6. Hierarchical Regression Result among Clusters: Turnover Intention
Regressed on Job Content Plateau……………………….….…….…..53
Table 4.7. Hierarchical Regression Result among Clusters : Turnover Intention
Regressed on Hierarchical Plateau…………………………..…….......54
Table 4.8. Hypotheses Testing Result Summary…………………………….……55
V
LIST OF FIGURES
Figure 2.1. The employee turnover decision process……………………….…..10
Figure 2.2. A schematic representation of the primary variables and process of
employee turnover……………………………………..…..……..…11
Figure 3.1. Research framework……………………….……...………………..23
Figure 3.2. Research procedure………………….……………………………...25
Figure 3.3. Career plateau and turnover intention model…………………….…42
Figure 4.1. K-mean cluster analysis………………………..……........................48
1
CHAPTER I INTRODUCTION
Background of the Study
Nowadays, thanks to the advancement of transportation and technology, the
world has become more and more globalized and competitive. In order to survive
the fierce competition, the companies today modify their organizational structures
into flatter types with fewer hierarchical levels. In this case, the companies can
reduce the time needed to communicate among hierarchical levels to respond to the
rapid changing market quickly. This phenomenon happened quite commonly in
recent Taiwan society. Because of some natural constrains such as the population
and industry types, most companies in Taiwan are small and medium enterprises
(SMEs). According to the statistics from Ministry of Economic Affair in Taiwan,
around 97.6% of the companies are SMEs and approximately 78.2% of the entire
population in Taiwan works in SMEs (Small and Medium Enterprise Administration,
Ministry of Economic Affairs, 2016). SMEs are defined as companies with less than
100 employees (200 employees for manufacture and mining industry). With these
few employees in the company, the organization structures tend to have fewer ranks
and often look flatter. As a result, employees’ mobility toward the upper level will be
more difficult and more competitive with the few ranks existing in the companies.
This brings out the issue of career plateau, which originally refers to an individual
staying at the same position without moving to a higher rank in an organization.
When it was first discussed, career plateau talks only about the vertical and
horizontal mobility within the organization. However, Veiga (1981) suggested that
there is possibility that employees received upward movement without actually
earning more salary, facing extra or different job contents as well as challenges. The
study indicated that simply judging whether an employee is plateaued or not through
2
evaluating his/her chances of getting a promotion is not sufficient. Therefore, the
previous studies developed the construct of career plateau with two dimensions: job
content plateau and hierarchical plateau (Bardwick, 1986; Feldman & Weitz, 1988).
Career plateau is a situation that every employee will naturally encounter
sooner or later in their career life. It does not necessarily lead to bad consequences.
Research showed that plateaued employees constantly provide positive support to
the companies (Bardwick, 1986). However, generally, negative results were found in
studies. Job dissatisfaction, low engagement and commitment and even worse the
high turnover rate of employees might harm the companies badly (Feldman & Weitz,
1988). Often when employees are stocked at the same position too long, they are not
able to receive more payment or new job tasks. Doing routine works makes
employees feel bored, which results in the dissatisfaction toward the jobs and maybe
even the companies. Later on they may be reluctant to dedicate themselves to the
company and the performance start to deteriorate. If the situation becomes worse,
misbehaviors like absenteeism will start happening. Eventually, employees may
consider or actually leave the company, which is called employee turnover (Chao,
1990; Milliman, 1992).
For a human resource practitioner, the employee turnover rate of a company
needs to be monitored constantly. Turnover does not always come with bad
consequences. Positively, it prevents companies from aging and improves the overall
performance of companies as well (Staw, 1980). However, a turnover rate too high
will definitely do harm to the company. The company might end up wasting lots of
time and great deal of money to recruit and train new employees (Allen, Weeks, &
Moffitt, 2005). In order to prevent these from happening, maintaining the turnover
rate at a certain level (it is impossible to totally eliminate turnover in an organization)
is indeed crucial. In addition, the best turnover will be keeping the good performers
3
and replace the poor performers. For the purpose of keeping the talents in the
companies, the employers have to understand their employees. Knowing what the
employees want and what they valued most toward jobs is indeed crucial, especially
today in a world where companies have to take proactive measures to find and retain
talents. Hence, this research intends to utilize career anchors to discover how
differently employees prioritize their personal needs regarding their career choices
(Schein & Maanen, 2016).
Career anchors developed by Schein (1978) are the tools used to facilitate talent
management. It helps identify an individual’s internal factor that he/she will never
give up even when making difficult career decisions. It is an individual’s self-image
which is developed through their personality, skills, abilities, talents and past
experiences. However, individuals may not know what their career anchors are
without actually doing the job. It takes some time to accumulate experiences and
learn in the early years of their career life. Once an individual’s anchor is formed,
he/she will use it as guidance to their career path. However, from other studies,
researchers proposed that individuals do not only have one career anchor that
influences career decision making process (Suutari & Taka, 2004; Chapman &
Brown, 2014); rather, multiple anchors working at the same time as the dominant
anchors is the more common phenomenon in individuals’ career.
Therefore, this research intended to discover how employees in Taiwan react
when they encountered career plateau, especially their intention to leave the
organization. Meanwhile, using career anchors to identify how individuals’ personal
preferences affect the career decisions they have to make.
4
Statement of the Problem
From past studies, the relationship between career plateau and turnover
intention have been widely studied (Chao, 1990; Milliman, 1992) and the
investigation of factors in between has been focused on the variables such as
organizational/supervisor supports (Wickramasinghe & Jayaweera, 2010) and
mentoring (Foster, Shastri, & Withane, 2011). These research mostly focus on
contextual factors that affect individuals’ career decisions or behaviors; however,
few studies focus on individuals’ inner factors such as personality and individual
career-career oriented variables that greatly influence how they make choices
regarding their career (Ettington, 1998; Wen & Liu, 2015).
In addition, nowadays in the private sector in Taiwan, many companies conduct
all sort of personality tests when recruiting employees to make sure that the
candidates have either person-job fit or person-organization fit. However, companies
only apply the tests to the new employees when entering the company. Not many
companies utilize the tools and examine their workers regularly to see whether their
personal traits, preferences, priorities, and state of mind have changed over time,
especially in SMEs where talent management are usually not well-structured or even
ignored.
When employees are plateaued, they might face some career decisions. Career
anchors then play an important role in the decision-making process. With the career
anchors, employees will have a better guidance toward their future career, while the
employers will be able to know what the employees valued most, how the
employees feel about being plateaued. In this case, the employers might be able to
predict employees’ possible reactions (stay, turnover or else) so as to take
appropriate measures to minimize the effect of career plateau on turnover.
Nevertheless, different from the original definition of career anchors (Schein,
5
1978) that every individual have only one dominant anchor that plays as the most
important personal factor when dealing with career decisions, many researchers
found that individuals may have multiple dominant anchors at the same time (Erwee,
1990; Coetzee & Schreuder, 2014). Therefore, in this research, the researcher
proposed that the eight career anchors to an individual is more an idea of different
profile patterns and each anchor has different level of influence rather than a choice
of the most important one.
Purpose of the Study
There are two purposes in this study. First, this study aims to discover the
relationship between career plateau and turnover intention in Taiwan. The researcher
wants to discover what relationship it is in such an extreme industry structure (over
97% of companies are SMEs). Second, the researcher intends to explore the
existence of career anchor profiles and their differential level of the effects on the
relationship between career plateau and turnover intention.
Thus, the researcher hoped to investigate the general profile patterns of
employees in Taiwan and understood the general reactions to turnover intention of
plateaued employees with different career anchor profiles. It was expected to
facilitate human resource management and talent development within companies.
6
Research Questions
From the problem statement and the purpose of this study, the research
questions derived are as follow:
1. In Taiwan, how does career plateau affect an individual’s turnover
intention?
2. How will different career anchor profiles influence the relationship between
career plateau and turnover intention?
Scope of the Study
This study focuses on the relationship between career plateau and turnover
intention in Taiwan. Career anchor profiles are used as the moderators to see the
effects on such relationship. Some other important variables that might affect
employees’ turnover intention are not discussed in this research. In addition, other
consequences of career plateau are not included in the study as well. Due to time and
budget constraint, the participants of this research are Taiwan employees who have
been working for more than one year. The research questionnaires are distributed
online and the size of the sample is around 400; therefore, the results of this study
might not be able to generalize to the entire country or all industries.
7
Definition of the Terms
Career Plateau
In this study, the researcher adopted the definition from Bardwick (1986) that
there are two different forms of career plateau: hierarchical plateau and job content
plateau. Hierarchical plateauing happens when employees have little mobility
among the organization ranks. As to job content plateau, it occurs when individuals
are not able to receive new tasks or challenges in an organization.
Turnover Intention
Turnover intention was defined by Mobley (1977) as an employee’s intention to
permanently leave the organization voluntarily
Career Anchors
Career anchors include an individual’s past experiences, talents, values and
attitudes which provide stability and guidance to a person’s career. It can either be
the ‘motivator’ or ‘driver’ of the individual. A career anchor is the self-image
element that people will not give up, even when facing difficult career decisions
(Schein, 1978).
8
CHAPTER II LITERATURE REVIEW
Turnover
Definition of Turnover
In the organizational behavior field, turnover has been widely and frequently
studied in the past 50 years. A lot of scholars have made significant contributions to
the concept and construct of turnover. For example, Wanous, Strumpf, and
Bedrosian (1979) identified two kinds of turnover: voluntary and involuntary
turnover. Dalton, Todor and Krackhardt (1982) divided turnover into functional and
dysfunctional turnover. According to Mobley (1977), turnover is defined as an
employee works in an organization, through deep consideration after working for a
period of time, the employee decided to leave the organization permanently.
Williams and Hazer (1986) viewed turnover as the act of an employee actually
leaving the organization. Ferguson and Ferguson (1986) said turnover is the
termination of the relationship between employers and employees, no matter the
decision is made from which side. Hendrix, Robbins, Miller and Summers (1998)
defined turnover as both employees’ voluntary and involuntary leaving the
organizations permanently. In this research, turnover will be defined as the
employees’ voluntary decision of leaving a company permanently.
Types of Turnover
Wanous, et al. (1979) classified turnover into two types. One is voluntary
turnover and the other one is involuntary turnover. The former one referred to
employees’ behavior of leaving the position or organization voluntarily due to
organizational or personal factors, such as salary, promotion, health and so on. The
latter one indicated that employees are forced by the organization to quit
9
permanently (e.g. dismissal or layoff). Most studies focused on the voluntary
turnover for the reasons that this is the most commonly seen type of employees’
turnovers and that the factors influencing voluntary turnover can often be controlled
by the organization (Morrell, Loan-Clarke, & Wilkinson, 2001). In addition, Abelson
(1987) categorized employee turnover into avoidable and unavoidable. This
categorization is more for an organization point of view. For avoidable turnover,
organizations can always take measures to prevent or control it from happening,
regardless of whether it is employee’s voluntary or involuntary turnover. As to
unavoidable turnover, it refers to situations and conditions that cannot be easily
controlled or avoid by the organization. The following figure showed some
examples of the abovementioned categorization.
Turnover Process Model
The turnover process model in Figure 2.1. is the most commonly seen
model developed by Mobley (1977). It demonstrated an individual’s mind process
all the way till the actual turnover happened, from feeling dissatisfied with the
current job, evaluating the pros and cons of quitting, searching for the alternatives,
comparing options with the present job, having the intention to leave or stay, and
finally made up his/her mind to quit or stay.
10
Figure 2.1. The employee turnover decision process. Adapted from “Intermediate
linkages in the relationship between job satisfaction and employee turnover,” by
Mobley, W.H., 1977, Journal of Applied Psychology, 62(2), p.238.
Later on, Mobley, Griffeth, Hand and Meglino (1979) revised and enriched the
model by adding other related factors and control variables (refer to Figure 2.2.).
There are five features of this turnover process model: (a) Beside the differences
among personal perception, expectation and values, the model included personal and
occupational variables. (b) The perception and evaluation toward job opportunities
are demonstrated. (c) The centrality of work values and interests relative to other
values and interests, beliefs regarding non-work-related consequences of leaving or
11
staying, and contractual constraints are presented in the model. (d) The contribution
to turnover of current job satisfaction, expected job attraction, and the attraction of
attainable job alternatives are proposed. (e) Turnover intention is viewed as the
immediate precursor of actual turnover, while impulsive behavior will weaken the
relationship between them. This model is developed from the actual turnover
behavior and traced all the way back to its antecedents.
Figure 2.2. A schematic representation of the primary variables and process of
employee turnover. Adapted from “Review and conceptual analysis of the employee
turnover process,” by Mobley, W. H., Griffeth, R. W., Hand, H. H., & Meglino, B.
M., 1979, Psychological bulletin, 86(3), p.493.
12
Turnover Intention
Over the past five decades, the turnover process model has been discussed in
the field of organizational research. Other than the turnover process model
developed by Mobley in 1977, there are a lot of research regarding the idea of
turnover, the turnover process models and their antecedents. However, among all
antecedents of turnover, turnover intention has been shown to be the best predictor
among all other antecedents (Miller, Katerberg, & Hulin, 1979; Hom,
Caranikas-Walker & Prussia, 1992). In the field of psychology, Fishbein and Ajzen
(1977) once said that the best way to predict an individual’s behavior is to observe
and measure his/her intention to perform that certain behavior. Because of these
reasons, this study intends to measure turnover intention as the outcome variable.
Turnover intention and intention to leave (quit) are used as interchangeable
terms for each other. Porter and Steers (1973) defined intention to leave as the
withdrawal behavior of an individual when his/her expectations toward their work or
organization are not met. Mobley (1977) defined intention to quit as an employee’s
last stage of turnover decision process right before the actual turnover. Throughout
the process, job satisfaction, searching for alternative jobs and the evaluation among
alternatives and the current job are involved. In the research of Miller et al. (1979),
intention to leave is defined as a comprehensive idea that includes an individual’s
thought of leaving the current job, and seeking possible alternatives out of the
organization. Williams and Hazer (1986) defined intention to quit as an individual’s
intention, desire and plans to leave their job. To sum up the above definitions from
previous studies, turnover intention is merely an individual’s intention to search for
other job opportunities outside the current organization. The actual turnover has not
happened yet at this stage. The individual will process through some related
problems and questions (e.g., the idea of quitting, finding new jobs and evaluate all
13
alternative) then make a feasible and satisfying overall assessment. After all these
been done, the actual turnover happened, which means leaving the position or
organization permanently.
Antecedents of Turnover Intention
Demographic Factors. Generally speaking, personal factors, such as gender,
age, marital status, education background, tenure, and job position, are variables that
are related to turnover intention. According to previous research results, Marsh and
Mannari (1977) and Weisberg and Kirschenbaum (1993) found that females had
higher turnover rates than males.
Hayes (2015) found that age was negatively related to turnover intention. In
other words, the older an individual is, the lower their turnover intention will be.
Studies also found that family responsibility, which is measured by an
individual’s marital status and the number of his/her dependents, was related to
turnover intention (Koh & Goh, 1995). For people who are single, their turnover
intention tends to be higher, whereas those married employees and those with
dependents have a lower intention to quit.
In addition, education background influences employees’ turnover intention.
However, the direction of the effect on turnover intention is inconclusive. Mobley
(1982) found that education background was negatively related to turnover intention
while Cotton and Tuttle (1986) indicated that the higher an individual is educated,
the stronger turnover intention he/she has.
Work-Related Factors. Job satisfaction is the most commonly studied variable
related to turnover intention. Research showed that it is one of the most immediate
variables to predict an individual’s intention to leave an organization (Sousa-Poza &
Hennebeger, 2004). The results are intuitive. They showed that job satisfaction is
14
significantly negatively related to turnover intention. In other words, if an employee
is satisfied with his/her job, their turnover intention will be low (Porter & Steers,
1973; Price, 1977; Fogarty, Singh, Rhoads, & Moore, 2000; Sousa-Poza &
Hennebeger, 2004).
Organizational commitment is another important variable often used to predict
turnover intention. Abundant research presented the result that organizational
commitment is significantly and negatively related to turnover intention. That is, the
less committed an employee is to their organization, the stronger their intention to
quit the job permanently.
Still other minor factors affecting an employee’s intention to leave the
organization. For example, if the work is less repetitive, the turnover intention will
be lower; if the work provides an employee a larger room for autonomy, the
employee will less likely leave the organization as well (Hackman & Lawler, 1971).
Also, regarding work performance, high performers in an organization have lower
desire to quit their job (Dreher, 1982). Finally, an individual’s perception of job
opportunities and alternatives is related to their turnover intention. If an employee
perceived that there are lots of opportunities outside the company, he/she will have a
higher intention to leave the job for the alternatives.
15
Career Plateau
Definition of Career Plateau
Ference, Stoner and Warren (1977) considered career plateau to be a natural
consequence of the organization structure development. When an individual reaches
a point that the possibility of further promotion in the organization is low, he/she is
defined as experiencing a plateau in his/her career. Later on Veiga (1981) extended
the concept of career plateau to not only focusing on the vertical movement
(promotion), but also the horizontal transfer within the organization. However, at
this stage, career plateau is still focusing on an individual’s mobility in the
organization. Feldman and Weitz (1988) proposed that employees might experience
the increase of work responsibilities without actual promotion in the organization. In
this case, those employees might still have the chance to grow and develop
themselves; therefore, their self-perception of career plateau might be low. Likewise,
employees might also be promoted in the organization with given new tasks or
responsibilities. Hence, simply judging whether employees are plateaued through
hierarchical movement in the organization is not sufficient. Based on these previous
studies (Bardwick, 1986; Feldman & Weitz, 1988), Milliman (1992) developed a
measurement with two dimensions (job content plateau and hierarchical plateau) to
test an individual’s perception of his/her career status.
Antecedents of Career Plateau
Individual Factors. Individual factors are often the constraints or limitation of
an individual’s mobility and development in the organization. Studies often showed
that demographic variables often affect both subject and object career success. For
example, Gattiker and Larwood (1990) discovered that people who are plateaued
tend to be older than others who continued to make progress in their career. It is
16
logical that older people are more likely to have longer working years as well as the
tenure in the organization. The longer they work the higher chance they have to be
plateaued.
Education level is also a factor that can influence an employee’s mobility and
development. Lorence and Mortimer (1985) pointed out that the higher education
background an individual has the greater chance he/she will receive promotion.
Other than that, people who have higher education level are viewed as more capable
of taking up additional responsibilities; therefore, result in the increase of their job
content then lead to their growth. However, the level of education affects more
significantly at the entry stage of one’s career. Throughout the time, the effect will
become weaker as other factors such as experience will be more a determinant of an
individual’s mobility in the organization.
Other personal factors such as motivation to learn, career exploration, career
planning and job involvement, are also related to career plateau (Allen, Russell,
Poteet, & Dobbins, 1999). Some scholars viewed them as the results that are
affected by individuals’ personalities. The effects will influence an individual’s
attitudes toward receiving new tasks, facing challenges or pursuing a higher rank in
the organization and eventually causing he/she to be plateaued or not.
Organizational Factors. People facing career plateau is a commonly happened
phenomenon caused by the traditional hierarchical structure of the organization. The
funnel effect in an organization will naturally occur because of the fewer positions
when employees are trying to pursue upper movement, (Near, 1980) not to mention
that nowadays, there are more and more horizontal-organizational structures. With
fewer hierarchical levels in an organization, employees might seriously confront
hierarchical plateau. Moreover, as the upward movement is blocked, employees got
stock at the same position and kept on doing the same jobs and task. This will also
17
cause the employees to be plateaued on the job content aspect.
Consequences of Career Plateau The outcomes of career plateau can be both positive and negative. Some studies
showed that employees who faced the career plateau are often the solid citizen with
the organization. They are the one who make positive contribution to the company
(Bardwick, 1986; Feldman & Weitz, 1988; Ference et al., 1977; Near, 1980;
Heilmann, Holt, & Rilovick, 2008). Most findings, however, indicate that career
plateau generally has negative impacts on the organization (Allen et al., 1999;
Tremblay & Roger, 1993). For instance, the absenteeism of employees happened
more often on plateaued ones compared with those still making progress in the
organization. Plateaued employees are also less satisfied with their supervisors (Near,
1980, 1985). Other research results proposed that career plateau can also lead to low
job satisfaction and organizational commitment; then result in dissatisfying work
performance and eventually, lead to an increase of an individual’s turnover intention
and actual turnover (Chao, 1990; Milliman, 1992; Tremblay, Roger, & Toulouse,
1995; Allen et al., 1999). Therefore, this study predicts the following:
Hypothesis 1: Career plateau will be positively significantly related to
employees’ turnover intention.
18
The Moderating Effects of Career Anchor Profiles
From the previous research analyzed above, the effects of personal factors
indeed seemed to happen on both career plateau and turnover intention (Feldman &
Weitz, 1988; Guan, Wen, Chen, Liu, Si, Liu, Wang, Fu, Zhang, & Dong, 2014).
However, few studies focus on the moderating effect of an individual’s personality
or personal factors on the relationship between career plateau and turnover intention
(Ettington, 1998; Lee, Huang, & Zhao, 2012; Wen & Liu; 2015). Some evidence
was found that inventories used to test an individual’s vocational interest and
biographical information blank could be fairly used to predict turnover intention
(Porter & Steers, 1973). Individual factors such as personality were also included
into the turnover process model (Mobley et al., 1979). Still other studies indicated
that personal traits or work orientation do impact on turnover behavior (Steers &
Mowday, 1981; Williams & Hazer, 1986; Steel, 2004). Therefore, this study aims to
use career anchors developed by Edgar H. Schein (1978) to investigate the influence
of career-oriented factors on the relationship between career plateau and turnover
intention.
Schein’s Career Anchors
Schein (1978) first had the idea of career anchors. He proposed that there is a
factor within each individual’s career. The factor not only affects people’s career
decision, but also forms the goals that they strive to achieve in their lives. This
internal factor is called the career anchor. It is a self-image developed from people’s
intelligence, knowledge, value and experiences. This concept will influence people’s
expectation and preference when choosing their jobs. It is also the element that
people will not give up even when facing a difficult choice.
Schein said that at the beginning of people’s career, their self-concepts are still
19
vague. This is the stage when they learn and develop themselves through their job
and the organization they are in. They continuously experience and cultivate
themselves so as to recognize what they are interested in, what are their motivation,
what they valued the most in life and what advantages and KSAOs they possess.
After accumulating work experiences, they will have a higher decision-making
power toward choosing their jobs. Then they keep on the learning and
self-discovering process. When they are facing new tasks and challenges, they will
have the opportunity to find out their potentials. Finally, the self-concept and
understanding built up through the process will form a career anchor in their mind.
This anchor serves as the guide when people make critical decisions regarding their
career. In this study, Schein presented five categories of career anchors, which are
technical/functional competence, managerial competence, creativity, autonomy and
security. Later, Schein in 1990 increase the career anchors into eight categories.
Meanwhile, managerial insights, such as types of jobs, compensation and benefits,
and promotion, are also embedded into the descriptions. The eight categories are as
follow:
Technical / Functional Competence. People with this type of anchor will not
give up the opportunity to apply the skills they choose in that certain area. They like
the feeling of being the experts in the field and will gain satisfaction from the
technical or functional work they are doing. They can also enjoy managing others in
that certain field. However, they will avoid general management position for that
managing others is not the purpose of their career.
General Managerial Competence. People with this anchor tend to pursue
higher level in the organization because position at a certain level enable them to put
their efforts into managing cross functional departments and coordinate them for a
greater performance. They are willing to take up larger responsibility, dedicate
20
themselves to the organization and identify their work with the success of the
organization.
Autonomy / Independence. People with this career never give up the chance
to control over their own work. They want to feel free on what to do, how they do it
and the pace of doing the job. They often choose self-employment or freelance for
job because of the high autonomous.
Security / Stability. People with this anchor value the employment security
above all other factors. Their top priority is to make sure the stability of their job in
the organization. It can be either on financial or geographical aspects. This type of
people is less concerned with the job content not the rank in the organization. They
are willing to do whatever the employers ask to accept any arrangement as long as
they secure and stabilize their job.
Entrepreneurial Creativity. People with this anchor desired to create an
organization on their own. They want to overcome the obstacles with their ability
and are willing to take up all the risk of establishing their enterprise. They might
start with working in other people’s organizations to learn the skills needed and to
assess future opportunities. However, they will leave the organization as soon as
they feel that they are ready to handle the mission to set up their company.
Service / Dedication to a Cause. People with this anchor tend to pursue work
opportunities that they think are of value and will make the world a better place.
They will search for jobs that solve the environmental problems, cure diseases with
new products, create harmony in the world, and so on.
Pure Challenge. People who fall into this category like to find solutions to
unsolved problems, to win over tough competitions and to conquer all difficulties
and barriers. For them the crucial reason for them to pursue a job is to face
challenges one after another, and successfully win out all of them. Once the
21
challenges stop existing, they felt bored about the work immediately.
Lifestyle. People who possess this anchor will never give up the situations that
enable them to balance the personal needs, family demands and the requirement of
their career. To them, a successful career is not simply about being promoted to a
high level or earning a fortune, it’s more of an integration of every part of their life.
Therefore, the job they are searching for should be flexible enough to make
arrangement whenever needed.
Career Anchor Profiles
Despite the fact that the original design of career anchors is to find out one
dominant anchor out of eight for each individual, the researcher believed the
secondary anchors are also of great import when studying individuals’
career-oriented factors that influence their decision-making process. Past studies
also support the idea of individuals possessing multiple career anchors which may
even form several different profiles.
Igbaria, Greenhaus and Parasuraman (1991) applied the career anchor
measurement on employees working in the management information systems and
found that instead of finding merely one dominant anchor, three anchors were
identified: technical / functional competence, general managerial competence and
entrepreneurial creativity. Suutari and Taka (2004) studied on managers and leaders
with global careers who engaged in international tasks and business. They
specifically focused on the career anchor(s) that these participants based on when
they had to make decisions. The result indicated that most managers and leaders
consider themselves using two or three career anchors instead of one dominant
anchor when dealing with their daily work. The major anchors identified were
managerial competence and pure challenge. Singh, Bhattacharjee and Kodwani
22
(2009) utilized the career anchors on executives in engineering sectors for the
purpose of facilitating career management and planning. The result in their study
also showed multiple anchors possessed by the participants, which were pure
challenge, service / dedication to a cause and lifestyle.
Still other studies all demonstrated results of individuals having more than one
dominant career anchors at the same time. These research proved what Feldman and
Bolino (1996) proposed: individual could have multiple career anchors at the same
time under different conditions, to be true. Therefore, in this research, the researcher
proposed the possibility of career anchor profiles existing that rather than either
belonging or not belonging to a certain career anchor category, individuals vary
along a continuum of career anchors. In addition, the difference profile patterns that
represented individuals’ varied career preferences would affect their reaction on
turnover intention when they faced a plateau situation in their career. Therefore,
Hypothesis 2 is proposed as followed.
Hypothesis 2: Career anchor profiles will moderate the positive
relationship between career plateau and turnover intention.
23
CHAPTER III RESEARCH METHOD
In this chapter, the research framework, hypotheses and the methodology were
presented. It outlined the research procedure, sample of the study, instrument used,
data collection procedure and statistical methods for data analysis.
Research Framework
The research framework was developed on the basis of the purpose of this
study, and the literature reviewed in the previous chapter. The figure presented in
Figure 3.1. shows the variables of this study. According to the hypotheses
aforementioned, this study aimed to explore the relationship between career plateau
and turnover intention, and demonstrate how people with diverse career anchors
react differently when facing a plateaued situation in their career.
Figure 3.1. Research framework.
24
Two hypotheses were derived from the research framework of this study.
H1: Career plateau will be positively significantly related to employees’
turnover intention.
H2: Career anchor profiles will moderate the positive relationship between
career plateau and turnover intention.
Research Procedure
The research procedure included the eight steps shown in Figure 3.2. below. At
the beginning of this research, the researcher was interested in one specific
phenomenon. The researcher then reviewed the previous studies and came up with a
topic for this study. After the research topic was determined, the researcher thought
about the purpose and significance of this research, trying to find out the questions
and answers the study aimed to discover. Next, the researcher developed the
research framework. Based on the framework, the researcher then searched for
appropriate instruments developed from previous researchers and adopted them in
the present study. The research procedure was then designed. The selected
instruments were compiled and organized into a questionnaire, which went through
the expert review and pilot test to insure the validity and reliability. After the
instruments were tested, the questionnaires were distributed to the research targets
for data collection. Finally, the hypotheses were tested and the results were
presented at the end of the study.
25
Figure 3.2. Research procedure.
Conclude Research Results
Analyze Data
Conduct Data Collection
Conduct Expert Review and Pilot Test
Develop Research Instrument
Design Research Procedure
Construct Research Framework
Develop Research Purpose and Questions
Conduct Literature Review
Determine Research Topic
26
Research Design
This study adopted the quantitative research method to examine the relationship
among career plateau, turnover intention and the moderating effect of career anchors.
A questionnaire was used in this research to obtain data from employees in different
industries in Taiwan. Before the data collection process, the questionnaire was
examined by experts to insure content validity of the scales used in this study.
Finally, statistical analysis methods were adopted to insure construct validity and
reliability of the measurement and to test the abovementioned hypotheses.
Research Sample and Data Collection
The targets of this study were the current employees in Taiwan. They worked in
all kinds of industries were full-time employees who had been working in private
sectors for at least one year in the same position in the organizations. During the
data collection, the researcher constantly monitored the distribution of the collected
data through the demographics to make sure that the numbers of responses received
from all industries were similar so as to present more general results that apply to all
industries.
The data collection process started from April 17th to April 30th and was
conducted through online questionnaires. The link of the questionnaire was sent
through email to people that the researcher has personal contact with. These people
were either current employees in the company or the managers who assisted in the
distribution of the online questionnaires. In addition, the link was posted on several
social media websites to reach a wider range of targets. The total number of
questionnaires collected was 533 and the final number of the valid responses was
412 (valid rate: 77%).
27
Sample Profile
After reviewing the final valid responses, the following are the demographics
of the sample in this study. A total of 224 (54.4%) responses were from females and
188 (45.6%) from male participants. Moving on to the industries the participants
come from: 76 (18.4%) of them were from the real estate industry, 58 (14.1%)
service, 52 (12.6%) manufacturing, 48 (11.7%) financial and 178 (43.2%) other
different industries. Regarding participants’ education level, 182 (44.2%) had a
bachelor degree as their highest education level, 107 (25.9%) a master degree or
above and the rest (123, 29.8%) a degree of vocational school, high school or under.
As to respondents’ position within their company, 190 (46.1%) were at the entry
level, 74 (18%) low-level managers, 72 (17.5%) middle-level managers and 37 (9%)
top-level managerial positions. Finally, 244 (59.2%) of the respondents were
married and 145 (35.2%) were single. Detail information is shown in Table 3.1.
Table 3.1.
Demographics of the Sample (n=412)
Demographics Category Frequency Percentage
(%) Gender Male 188 45.6
Female 224 54.4
Age Below 30 years old 95 23.1
31-40 years old 105 25.4
41-50 years old 130 31.6
51-60 years old 73 17.7
above 61 years old 9 2.2
Education Level High School, Vocational School 123 29.9
Bachelor Degree 182 44.2
Master Degree 104 25.2
PhD Degree 3 0.7
(Continued)
28
Table 3.1. (Continued)
Demographics Category Frequency Percentage
(%) Marital Status Married 244 59.2
Single 145 35.2
Divorced 15 3.6
Widowed 1 0.2
Cohabitate 7 1.7
Position Employee 190 46.1
First Level Manager 74 18.0
Mid-Level Manager 72 17.5
Top Level Manager 37 9.0
Others 39 9.5
Tenure 1~5 years 206 50
6~10 years 77 18.7
11~15 years 46 11.2 16~20 years 30 7.3
Above 21 years 53 12.9
Career Year 1~5 years 90 21.8
6~10 years 58 14.1
11~15 years 55 13.3 16~20 years 61 14.8 Above 21 years 148 35.9 Number of Dependents
No dependent 128 31.1
1~2 dependents 193 46.8
More than 2 dependents 91 22.1 (Continued)
29
Table 3.1. (Continued)
Demographics Category Frequency Percentage
(%) Industry Real estate 76 18.4
Other services 58 14.1
Manufacturing 52 12.6
Financial and insurance service 48 11.7
Education 30 7.3
Professional, scientific and technical service 24 5.8
Wholesale and retail trade 21 5.1
Information and communication 21 5.1
Construction 19 4.6
Human health and social work 19 4.6
Accommodation and food service 12 2.9
Agriculture, forestry and fishing 9 2.2
Arts, entertainment and recreation 9 2.2
Transportation and storage 8 1.9
Administrative and support service 3 0.7
Electricity, gas, steam and air conditioning supply
2 0.5
Mining and quarrying 1 0.2
Questionnaire Design
The questionnaire included the measurement that measured the variables in the
research framework. It consisted of four sections, three research variables parts and
one demographic section. These measurements were found through the previous
studies and were originally developed in English. However, the targets of this study
were Taiwanese employees who speak Chinese, so the questionnaire was translated
into Chinese. After the translation, the Chinese version was examined by experts
who had expertise in Chinese and English to back translate and make sure the
meanings of the items remained the same. After finalizing the questionnaire, the
pilot test was conducted to make sure the initial validity and reliability.
30
According to Podsakoff and Organ (1986) the common method variance (CMV)
might affect the result of this study because the instruments used to measure all
variables were self-reports from the same source. In order to minimize the effect of
CMV, 7-point and 5-point Likert-type scale and a 6-point frequency scale were
utilized on career plateau, turnover intention and career anchors respectively.
Meanwhile, the order of instruments was re-arranged so that the respondents
answered the outcome variable first than the independent variable. The moderating
variable and personal information were answered at last.
Measurement
The measurements used in this study are described below. The complete
questionnaire can be seen in the Appendix: Questionnaire.
Career Plateau
Milliman (1992) first developed a two-dimensional instrument (Job content
plateau and Hierarchical Plateau) to measure an individual’s perceived career
plateau. The version this study utilized was the adapted version of Milliman (1992)
which was presented in Allen et al. (1999). The scale consists of two dimensions:
job content plateau and hierarchical plateau. In each dimension, six items were rated
on a 7-point Likert scale ranging from “1” “Totally Disagree” to “7” “Totally Agree”
in order to measure an individual’s self-perception of career plateau. A sample item
for Job Content Plateau is: “My job tasks and activities have become routine for me.”
A sample item for Hierarchical Plateau is: “I am unlikely to obtain a much higher
job title in the Organization.” Some items were reverse coded to insure the reliability
of the responses. A sample reverse coded item is: I expect to be constantly
challenged in my job. The Cronbach Alpha for job content plateau and hierarchical
31
plateau were 0.83 and 0.85 respectively in Allen et al.’s (1999) research.
Turnover Intention
To measure the respondents’ intention to leave their current job, the scale from
Wayne, Shore and Liden (1997) was adopted. There were five items in total and
each item was rated on a 5-point Likert scale ranging from “1” “Strongly Disagree”
to “5” “Strongly Agree”. A sample item is: “I am actively looking for a job outside
[company name]”. The Cronbach Alpha reported in Wayne et al. (1997) was 0.89.
Career Anchors
The instrument used to test the moderating effect in this framework was the
career orientation inventory developed by Schein (2006). There were eight
dimensions and each contained 5 items. The following shows the eight categories
and a sample item for each.
Technical /Functional Competence: “I want to be so good at what I do that others
will always seek my expert advice.”
General Managerial Competence: “I will feel successful only if I become a
high-level general manager in some organization.”
Autonomy/Independence: “I will feel successful in my career only if I achieve
complete autonomy and freedom to define my work.”
Security/Stability: I would not stay in an organization that would give me
assignments that would jeopardize my job security.
Entrepreneur Creativity: “I dream of starting up and building my own business.”
Service/Dedication to a Cause: “I dream of being in a career that makes a real
contribution to humanity and society.”
Pure Challenge: “I prefer work opportunities that strongly challenge my
32
problem-solving and competitive skills.”
Lifestyle: “I have always sought out work opportunities that minimize interference
with my personal and family concerns.”
The 40 items from eight dimensions were rated based on a 6-point self-reported
frequency ranging from “1” “Never True for me” to “6” “Always True for me”. The
use of an even number scale was to avoid the neutralization of responses so as to
have a more distinguished categorization. The Cronbach Alpha of this instrument
was reported from 0.77 to 0.81 by Coetzee and Schreuder (2011)
Control Variables
The following demographic variables are selected from the previous studies.
They serve as the control variables in the current study.
Gender. From the past studies, Valcour and Tolbert (2003) found that females
tend to have higher turnover rate over males. Therefore, in this study, the
respondents were asked to answer their gender.
Age. According to the previous literatures, employees’ age seems to influence
their turnover intention (Hayes, 2015). Therefore, in this study, the respondents were
asked to fill in their birth year (e.g.,1992) so as to calculate their age for the analysis.
Education Level. An individual’s education level affects their career plateau
and turnover intention as well even though the effect on turnover intention was
inconclusive (Mobley, 1982; Cotton & Tuttle, 1986). Hence, the researcher intended
to collect the information of the participants’ education level so as to do further
analysis. The respondents were asked to choose among “Under High School or
vocational school”, “Bachelor’s degree”, “Master’s degree” and “Doctorate degree”
to indicate their education level.
33
Marital Status. Koh and Goh (1995) indicated that the marital status and the
number of dependents have great impact on individuals’ intention to leave. They
proposed that people who were married were less likely to quit their jobs. Therefore,
in this study, the researcher asked the respondents to answer whether they were
“married”, “Divorced”, “Single”, “Widowed” and “Cohabitate”.
Number of Dependents. According to Steel and Lounsbury (2009), family
responsibility was one of the main factors that influence employees’ intention to
leave the organization. Participants were asked to answer how many dependents
they had.
Demographic Variables
Tenure of Current Job. An individual’s tenure of current job might influence
their perception toward career plateau. Therefore, the respondents were asked to fill
out an open-ended question of the years they have been working at the present job
and throughout their lives.
Total Working Years. The total working years of an employee may affect their
intention to leave the organizations. The longer time people work, their perception
of career plateau and their intention to leave might be changed.
Industry type. In order to examine the relationship among career plateau,
turnover intention and career anchors in different industries, the respondents were
asked to report the industries they were currently working in. The 19 industry
categories: Agriculture, forestry and fishing, Mining and quarrying, Manufacturing,
Electricity, gas, steam and air conditioning supply, Water supply; sewerage, waste
management and remediation activities, Construction, Wholesale and retail trade;
repair of motor vehicles and motorcycles, Transportation and storage,
Accommodation and food service activities, Information and communication,
34
Financial and insurance activities, Real estate activities, Professional, scientific and
technical activities, Administrative and support service activities, Public
administration and defense; compulsory social security, Education, Human health
and social work activities, Arts, entertainment and recreation and Other service
activities are from the Directorate-General of Budget, Accounting and Statistics,
Executive Yuan in Taiwan (2016).
35
Validity and Reliability Tests
Exploratory factor analysis (EFA) and confirmatory factor analysis (CFA) were
both used to test the construct validity of the research. EFA was first utilized during
pilot testing. According to the EFA result, the item translation and the sequence of
measures in the questionnaire were slightly modified before data was collected for
the main study.
After the final valid responses were determined, CFA was conducted. However,
since the CFA resulted in less-than-satisfactory fit, minor modification to the
measurement was performed. The researcher relied on EFA to modify the
measurement, but cross validated the modification using CFA with data from a
different sample. To complete this procedure, the sample was randomly split into
half. The first half of the data was analyzed through EFA in SPSS. According to
Costello and Osborne (2005), a factor loading above .4 is acceptable. However, in
order to retain only those items that better represent the construct, the criterion of the
factor loading for an item was set at the minimum of .65 and no cross loading to
ensure the quality of the scales was good. After the modification, the new
measurement model went through a cross-validation test by entering the second data
set from the split sample in a CFA.
Both career plateau and turnover intention measurement successfully went
through cross validation process mentioned above. However, since the career
anchors scale was designed as a formative measurement instead of a latent one, and
that the AMOS CFA technique does not handle well on formative measures, the
validity of the career anchors scale was tested using only EFA. The results are as
followed.
36
Exploratory Factor Analysis (EFA) Result
Table 3.2. Table 3.3. and Table 3.4. show the EFA result of turnover intention,
career plateau and career anchors. The finalized dimensions and the item deleted are
indicated in the tables.
Table 3.2.
Exploratory Factor Analysis (EFA): Turnover Intention
Item Factors
1 Final Dimension Items Deleted
TI3 .911 TI
TI4 .831 TI
TI1 .812 TI
TI2 .798 TI
TI5 .533
Deleted
Note. Extraction Method: Principal Component Analysis. Rotation Method:
Varimax. TI: Turnover Intention.
37
Table 3.3.
Exploratory Factor Analysis (EFA): Career Plateau
Item Factors
1 2 Final Dimension Items Deleted
JCP6 .904 JCP
JCP2 .881 JCP
JCP5 .873 JCP
JCP1 .855 JCP
JCP4 .738 JCP
HP2 .631 .439 Deleted
HP6 .500 .499 Deleted
HP5 .899 HP
HP4 .845 HP
HP1 .805 HP
HP3 .781 HP
JCP3 .503 Deleted
Note. Extraction Method: Principal Component Analysis. Rotation Method:
Varimax. JCP: Job Content Plateau; HP: Hierarchical Plateau; TI: Turnover
Intention.
The Kaiser-Meyer-Olkin Measure of Sampling Adequacy for EFA of turnover
intention and career plateau were .799 and .835. The Bartlett’s tests of sphericity
were both significant. These indicate that the data was suitable for the EFA analysis.
One factor in turnover intention and two factors in career plateau were extracted
with the eigenvalue larger than 1, which fit the original designs of the scales: one
38
dimension for turnover intention and two for career plateau. Those items with a
factor loading lower than .65 or with cross loading problems were deleted; therefore,
the remaining numbers of items were four for turnover intention; five for job content
plateau and four for hierarchical plateau.
Table 3.4.
Exploratory Factor Analysis (EFA): Career Anchors
Item
Factors
1 2 3 4 5 6 7 8 9 Final
Dimension
Items
Deleted
CHA2 .815
CHA
CHA4 .812
CHA
CHA3 .789
CHA
CHA1 .764
CHA
CHA5 .763
CHA
ENT5
.865
ENT
ENT1
.841
ENT
ENT2
.826
ENT
ENT4
.795
ENT
ENT3
.510
Deleted
TEC1
.729
TEC
TEC2
.712
TEC
TEC3
.693
TEC
TEC5
.629
Deleted
GEN1
.550
Deleted
(Continued)
39
Table 3.4. (Continued)
Item
Factors
1 2 3 4 5 6 7 8 9 Final
Dimension
Items
Deleted
LIF3
.805
LIF
LIF2
.788
LIF
LIF1
.730
LIF
LIF4
.708
LIF
LIF5
.637
Deleted
STA3
.897
STA
STA4
.829
STA
STA1
.750
STA
STA2
.649
Deleted
STA5
.534
Deleted
SER4
.805
SER
SER3
.788
SER
SER1
.712
SER
SER2
.651
SER
SER5
.568
Deleted
AU3
.779
AU
AU2
.765
AU
AU4
.692
AU
AU1
.691
AU
AU5
.456
Deleted
(Continued)
40
Table 3.4. (Continued)
Item
Factors
1 2 3 4 5 6 7 8 9 Final
Dimension
Items
Deleted
GEN4
.889
GEN
GEN3
.848
GEN
GEN5
.675
GEN
GEN2
.518
Deleted
TEC4
.723
Deleted
Note. Extraction Method: Principal Component Analysis. Rotation Method:
Varimax. CHA: Pure Challenge; ENT: Entrepreneurial Creativity; SER:
Service/Dedication to a Cause. STA: Stability/Security; TEC: Technical/Functional
Competence; LIF: Lifestyle; AU: Autonomy/Independence; GEN: General
Management Competence.
As to career anchors, the Kaiser-Meyer-Olkin Measure of Sampling Adequacy
for EFA was .929. The Bartlett’s test of sphericity was also significant. Nine factors
were extracted according to the result. However, TEC4 itself stands alone in the
ninth factor and was deleted. In addition, items with factor loading lower than .65 or
cross loaded were deleted as well. The final eight-factor structure was the same as
the initial development of the scale and the number of the remaining items was 30.
Confirmatory Factor Analysis (CFA)
Base on the EFA result of career plateau and turnover intention, the remaining
items were used to conduct CFA with data from the other half of the randomly split
41
sample. The purpose was to see whether the modified measurement model did have
a satisfactory model fit.
The modification indices in AMOS output that this study selected include x2/df,
SRMR, CFI, RMSEA. Base on Hooper, Coughlan and Mullen (2008), these indices
were appropriate indicators that should be able to point out the goodness of model fit
in this study. The criteria of good model fit indices are presented in Table 3.5.
Table 3.5.
Indices of Model Fits
Fit Indices Good Fit Acceptable Fit
x2/df 2~5 <5
SRMR <0.05 ≤0.08
CFI ≥0.95
GFI ≥.90 ≥.80
AGFI ≥.90 ≥.80
RMSEA <0.08 <0.1
CR >.7
AVE >.5
Note: Adapted from “Structural Equation Modelling: Guidelines for Determining
Model Fit,” by D. Hooper, J. Coughlan and M. Mullen, 2008, Electronic Journal of
Business Research Method, 6(1), p. 53-60. Copyright 2008 by the Academic
Conferences Ltd. and “Multivariate Data Analysis” by Hair, J. F., Black, W. C.,
Babin, B. J., Anderson, R. E., & Tatham, R. L., 1998., fifth ed. Prentice Hall, New
Jersey.
42
Figure 3.3. Career plateau and turnover intention model.
CFA for career plateau and turnover intention
Base on the EFA result, nine items measuring the career plateau and four for
turnover intention were used as the measurement model. The model and the
standardized regression weights are shown in Figure 3.3. The goodness of fit indices
of career plateau and turnover intention model is presented in Table 3.5.
43
Table 3.6.
Career Plateau and Turnover Intention Model Fit Summary
Model X2/df CFI GFI AGFI SRMR RMSEA
CP and TI 2.785 .936 .87 .812 .0929 .095
Composite Reliability (CR) Average Variance Extracted (AVE)
Job Content Plateau 0.929 0.727
Hierarchical Plateau 0.923 0.750
Turnover Intention 0.904 0.703
After examining the model fit summary in Table 3.6. and the criteria for good
model fit in Table 3.5., the model adopted in this research had an acceptable fit.
Therefore, the following statistical analysis utilized the measurement model
proposed above.
Common Method Variance (CMV)
Because all instruments used in this research were self-reported, the potential
problem of common method variance needed to be inspected. Harman’s one factor
analysis was examined to make sure there was no serious CMV problem. The total
variance explained in the first component of Eigenvalue greater than one was
24.89%, which was far below the 50% criteria. Therefore, the CMV problem was
not a potential threat to this study.
44
Cronbach’s Alpha
After the model was set, Cronbach’s alpha reliability test was performed to
make sure that the measurement scales adopted in this research were reliable.
According to Nunnally (1978), the Cronbach’s alpha above .70 was considered
reliable. The Cronbach’s alpha is demonstrated in Table 3.7. and the results were all
above .70, which mean that the scales utilized in this research were reliable.
Table 3.7.
Cronbach’s Alpha
Measurement Scale Coefficeint Alpha
Career plateau .76
Job Content Plateau .92
Hierarchical Plateau .88
Turnover Intention .87
Career Anchors .93
Autonomy / Independence .83
Security / Stability .85
Technical / Functional Competence .82
General Managerial Competence .86
Entrepreneurial Creativity .93
Service / Dedication to a Cause .90
Pure Challenge .93
Lifestyle .86
45
CHAPTER IV DATA ANALYSIS AND FINDINGS
In this chapter, the correlation analysis was used to gain a preliminary
knowledge of the relationship between variables. In addition, hierarchical regression
and K-mean cluster analysis were conducted to test the hypotheses proposed in this
study.
Correlation Analysis
Mean, Standard deviation, Cronbach’s alpha and the correlation between
variables are presented in Table 4.1. Starting from the control variables, as literature
stated, Age was significantly and negatively correlated with turnover intention
(r=-.33, p<.01), meaning that the older an employee is, the less likely they will think
about quitting. Marital status and the number of dependents were both significantly
and negatively correlated with turnover intention as well (r=-.26, p<.01; r=-.23,
p<.01). It means that when people are married or when they have more dependents
relying on them, their intention to leave their job will be lower. When employees are
managers in their companies, they tend to stay at the position rather than leaving
(r=-.13, p<.05). In addition, employees’ education level was significantly and
positively correlated with turnover intention. This indicated that people with higher
degrees are more likely to think about leaving their company.
Pearson’s Correlation was also used to examine the relationship between
independent variables, dependent variables and moderators. In this research, the data
did show that career plateau, and its two dimensions: job content plateau and
hierarchical plateau were significantly and positively correlated with turnover
intention (r=.37, p<.01; r=.16, p<.01; r=.35, p<.01). These suggested that when
employees meet a stagnant situation no matter on their job content or their position
46
in companies, they tend to have a higher intention to leave the organization that
makes them stuck at the current situation. However, the results of Pearson’s
correlation were inconclusive and did not test the hypothesized effects of career
plateau on turnover intention. Therefore, hierarchical regression was utilized in the
following sections to test the proposed research hypotheses.
47
Table 4.1.
Mean, Standard Deviation, Correlation and Reliability among Research Variables (n=412) Mean Std. 1 2 3 4 5 6 7 8 9 10 11 12 13 14 15 16 17 18
1. Turnover Intention 2.77 1.01 (.87)
2. Career Plateau 3.67 0.89 .37** (.76)
3. Job Content Plateau 3.33 1.27 .16** .73** (.92)
4. Hierarchical Plateau 4.10 1.37 .35** .61** -.09 (.88)
5. Autonomy / Independence 4.65 1.05 .01 -.18** -.23** .01 (.83)
6. Stability / Security 4.68 1.07 -.0 7 .13** .06 .12* .25** (.85)
7. Technical / Functional 4.80 1.02 -.08 -.21** -.24** -.03 .52** .37** (.82)
8. General Management
Competence
3.48 1.26 .07 -.07 -.03 -.07 .24** .21** .21** (.86)
9. Entrepreneurial Creativity 3.98 1.38 .16** -.00 .00 -.01 .34** .19** .26** .51** (.93)
10. Service / Dedication 4.61 1.06 -.08 -.14** -.18** .00 .40** .28** .55** .27** .42** (.90)
11. Pure Challenge 4.32 1.12. -.09 -.15** -.16** -.03 .39** .17** .54** .28** .45** .64** (.93)
12. Lifestyle 4.88 0.97 -.00 -.07 -.17** .10* .41** .44** .46** .15** .28** .48** .36** (.86)
13. Gender 0.54 0.50 .01 .00 -.00 .00 .08 .13** .14** -.15** -.09 .06 .02 .03
14. Age 40.63 10.58 -.33** .02 0.05 -.03 .00 .24** .12* .13** .14** .24** .16** .08 -.12*
15. Education Level 2.85 0.96 .15** .01 -.10* .14** -.08 -.14** -.14** .02 -.08 -.06 -.07 -.10 -.23** -.20**
16. Managerial Position 0.44 0.50 -.13* -.14** -.15** -.03 .06 -.01 .18** .14** .05 .11* .17** .02 -.23** .35** .12*
17. Marital Status 0.59 0.49 -.26** -.03 .04 -.08 -.04 .12* .04 .14** .14** .14** .05 .04 -.15** .62** -.14** .23**
18. Number of Dependents 1.50 1.32 -.23** .01 .07 -.06 .02 .09 .03 .11* .14** .12* .09 .01 -.14** .44** -.16** .16** .58**
Note: **. Correlation is significant at the 0.01 level (2-tailed). *. Correlation is significant at the 0.05 level (2-tailed).
Gender: 0= Male; 1= Female 0= Non-Managerial Positions; Managerial Position: 1= Managerial Positions Marital status: 0=Non-Married; 1=Married
Education Level: 1=High school or under; 2=Vocational School; 3=Bachelor degree; 4=Master degree; 5=PhD degree
Numbers in the parentheses represent the values of Cronbach’s Alpha.
48
Cluster Analysis In this research, cluster analysis was conducted to investigate the distinct
segments of the participants. K-mean cluster algorithm was utilized to obtain three
final clusters, which were later on named as High-Career Pursuer, Mid-Career Pursuer
and Low-Career Pursuer. The final cluster centers are shown in Table 4.2. and Figure
4.1. demonstrates the line graph of the three clusters.
Table 4.2.
Final Cluster Centers
Cluster
Low-Career Pursuer High-Career Pursuer Mid-Career Pursuer
Autonomy / Independence 2.47 5.09 4.45 Stability / Security 3.23 4.99 4.53 Technical / Functional Competence 2.46 5.27 4.59 General Management Competence 2.19 4.18 2.94 Entrepreneurial Creativity 1.71 5.03 3.23 Service / Dedication 2.11 5.21 4.29 Pure Challenge 2.05 4.93 3.98 Lifestyle 3.09 5.30 4.65
Figure 4.1. K-mean cluster analysis.
0.00
1.00
2.00
3.00
4.00
5.00
6.00
Fina
l Clu
ster
Cen
ters
K-mean Cluster Analysis
Low Career Pursuer
High Career Pursuer
Mid Career Pursuer
49
(1) The Low-Career Pursuer: Participants in this cluster scored relatively lower
than the other two clusters on all eight anchors. Their average age was 33.53 years old
and their career year was 8.42, which were both the lowest among the clusters.
Among them, 57.9% were entry-level employees and 26.3% were at the first-level
managerial positions, meaning that these participants were either not interested in
pursuing a higher career or they were still at the very start of their career. The latter
case suggested that they were still exploring in their career path and do not know what
were the essentials they want to pursue. From the pattern, it can be noted that
employees in this cluster valued more on the stability and job security, as well as the
work-life balance in their career.
(2) The Mid-Career Pursuer: In this cluster, the participants have their scores of
8 anchors between the Low-Career and High-Career cluster. The pattern looked
similar to those in High-Career cluster; however, they scored relatively low in the
general management competence and entrepreneurial creativity. Their average age
was 39.51 and the career year was 15.26. A 52.9% of these employees were in the
non-managerial positions; 18.6% were first level managers; 15.2% were mid-level
managers and 6.4% are in high managerial positions. These participants had a better
understanding about what they wanted for their career and knew quite well that they
did not want to or were not ready to be general managers or create their own business.
(3) The High-Career Pursuer: As to people classified as High-Career Pursuers,
they tended to pursue as many anchors as they can. However, the result still shows
that people would rather be technical or functional professionals in specific domain
than being at general managerial positions. Their average age was 42.55 and the
average career year was 18.16. Among all participants in this cluster, only 37.6% were
not in managerial positions; 16.4% were first level managers; 21.7% were in
mid-level managerial positions and 12.7% were high level managers. The result
suggested that most of these people had a relatively mature career and they wanted to
attend to each and every aspect of their career.
The cluster profiles are shown in Table 4.3.
50
Table 4.3.
Cluster Profiles
Clusters
Low-Career
Pursuer Mid-Career
Pursuer High-Career
Pursuer n 19 204 189
Gender Male 52.6% 43.1% 47.6% Female 47.4% 56.9% 52.4% Mean Age 33.53 39.51 42.55 Average Career Year 8.42 15.26 18.16 Average Number of Dependent 1.37 1.31 1.72 Marital Status Married 63.2% 54.9% 66.1% Not Married 36.8% 45.1% 33.9% Education Level High School or under 5.3% 9.8% 15.3% Vocational School 26.3% 13.7% 21.2% Bachelor Degree 31.6% 51.5% 37.6% Master Degree or above 36.8% 25% 25.9% Position
Non-Managerial 57.9% 52.9% 37.6%
First Level Manager 26.3% 18.6% 16.4%
Mid-Level Manager 0% 15.2% 21.7%
Top-Level Manager 0% 6.4% 12.7%
51
Hierarchical Regression Analysis In this section, hierarchical regression was performed to test the research
hypotheses. For career plateau, the entire variable and its both dimensions were
analyzed separately. The results are shown in Table 4.2.
In Table 4.4., Model 1 showed that control variables were analyzed and only age
had a significant negative effect on turnover intention (β=-.235, p<.001). Model 2
tested the first research hypothesis: Career plateau is positively related to employees’
turnover intention. This hypothesis was supported by the result that career plateau is
significantly positively influencing turnover intention (β=.374, p<.001). In Model 3
and 4, the researcher moved on to the dimensional level of the independent variable
and found that both job content plateau and hierarchical plateau had a significant
positive effect on turnover intention (β=.183, p<.001; β=.335, p<.001). The results
supported the Hypothesis 1 that career plateau had a significantly positive effect on
turnover intention.
Table 4.4. Hierarchical Regression Result (n=412)
Variable Turnover Intention
Model 1 Model 2 Model 3 Model 4
β β β β Gender -.027 -.019 -.019 -.034 Age -.235*** -.279*** -.249*** -.264*** Education Level .075 .057 .087 .025 Managerial Position -.034 .034 .000 -.017 Married -.059 -.029 -.056 -.026 Number of Dependents -.079 -.095 -.090 -.077
Career Plateau .374*** Job Content Plateau .183*** Hierarchical Plateau .335*** Adj. R2 .113 .249 .144 .222 ΔR2 .126 .136 .031 .109 F for ΔR2 9.753*** 20.513*** 10.872*** 17.754*** *p<.05. **p<.01. ***p<.001.
52
In Table 4.5., the sample was divided in to three groups according to the three
clusters generated in the previous section. The researcher intended to investigate the
differential effects of participants from the three clusters regarding how their career
plateau affected their intention to turnover. For Low Career Pursuers, there was no
significant effect of career plateau on turnover intention (β=.083, p>.05). However,
for Mid-Career Pursuers and High Career Pursuers, the results showed that their
career plateau did significantly positively influenced their turnover intention (β=.358,
p<.001; β=.400, p<.001) and that the effect for High Career Pursuers was stronger
than that of Mid-Career Pursuers (.400>.358).
Table 4.5.
Hierarchical Regression Result among Clusters (n=412)
Variable Turnover Intention
Low Career Pursuers Mid-Career Pursuers High Career Pursuers
β β β
Model 1 Model 2 Model 1 Model 2 Model 1 Model 2
Gender .226 .210 .027 .027 -.072 -.059
Age .017 .023 -.232* -.304** -.253** -.292***
Education Level .492 .434 .084 .082 .055 .039
Managerial Position .505 .511 -.051 -.003 -.115 -.018
Married -.141 -.181 -.061 -.018 -.128 -.090
Number of
Dependents -.415 -.397 .017 -.020 -.087 -.095
Career Plateau
.083
.358***
.400***
Adj. R2 .515 .477 .073 .196 .169 .321
ΔR2
.004
.124
.151
F for ΔR2 4.181* 3.348* 3.655** 8.069*** 7.351*** 13.695***
n 19 19 204 204 189 189
*p<.05. **p<.01. ***p<.001.
53
Later on, the researcher went on analyzing the dimensional level for the reason
that the two dimensions: job content plateau and hierarchical plateau have distinct
differences. The participants might experience them quite differently. Therefore, the
dimensions were tested to see whether there are indeed variations when it comes to
the effects of turnover intention. In Table 4.6., turnover intention was first regressed
on job content plateau. It demonstrated that for Low Career Pursuers, job content
plateau did not affect their turnover intention (β=.029, p>.05). For Mid-Career
Pursuers, job content plateau did have a significant positive influence on turnover
intention (β=.250, p<.001). As to High Career Pursuers, job content plateau also had a
significant positive effect on turnover intention (β=.166, p<.05); however, the effect
was weaker and less significant compare with that of Mid-Career Pursuers.
Table 4.6.
Hierarchical Regression Result among Clusters (n=412): Turnover Intention
Regressed on Job Content Plateau
Variable Turnover Intention
Low Career Pursuers Mid-Career Pursuers High Career Pursuers
β β β
Model 1 Model 2 Model 1 Model 2 Model 1 Model 2
Gender .226 .218 .027 .039 -.072 -.063
Age .017 .022 -.232* -.248* -.253** -.277**
Education Level .492 .475 .084 .120 .055 .067
Managerial Position .505 .504 -.051 -.032 -.115 -.072
Married -.141 -.140 -.061 -.070 -.128 -.123
Number of
Dependents -.415 -.435 .017 .027 -.087 -.093
Job Content Plateau .029 .250*** .166*
Adj. R2 .515 .471 .073 .130 .169 .191
ΔR2 .000 .060 .026
F for ΔR2 3.098* 3.291* 3.655** 5.350*** 7.351*** 7.321***
n 19 19 204 204 189 189
*p<.05. **p<.01. ***p<.001.
54
Finally, the researcher analyzed the effects of hierarchical plateau on turnover
intention from the three clusters. Same as the previous results, for Low Career
Pursuers, hierarchical plateau did not have any significant effect of turnover intention.
While the analysis on Mid-Career Pursuers and High Career Pursuers found that
hierarchical plateau did have significant positive effect on turnover intention (β=.250,
p<.001; β=.399, p<.001) and the effect seemed to have stronger influence for High
Career Pursuers than Mid-Career Pursuers. The results are presented in Table 4.7.
Table 4.7.
Hierarchical Regression Result among Clusters (n=412): Turnover Intention
Regressed on Hierarchical Plateau
Dependent Variable Turnover Intention
Low Career Pursuers Mid-Career Pursuers High Career Pursuers
β β β
Model 1 Model 2 Model 1 Model 2 Model 1 Model 2
Gender .226 .243 .027 .012 -.072 -.076
Age .017 .003 -.232* -.288** -.253** -.245**
Education Level .492 .485 .084 .042 .055 -.001
Managerial Position .505 .520 -.051 -.022 -.115 -.090
Married -.141 -.212 -.061 -.007 -.128 -.085
Number of
Dependents -.415 -.277 .017 -.032 -.087 -.084
Hierarchical Plateau .133 .250*** .399***
Adj. R2 .515 .478 .073 .129 .169 .322
ΔR2 .005 .059 .152
F for ΔR2 3.098* 3.358* 3.655** 5.283*** 7.351*** 13.733***
n 19 19 204 204 189 189
*p<.05. **p<.01. ***p<.001.
55
To sum up, based on the results of hierarchical regression analysis used to test
the research hypotheses, Hypothesis 1 and 2 were both supported. That is, career
plateau did have significant positive effect on turnover intention and career anchor
profiles did moderate this relationship. The integrated result is shown in Table 4.8.
Table 4.8.
Hypotheses Testing Result Summary
Hypotheses Result
Hypothesis 1 Career plateau will be positively significantly related
employees’ turnover intention. Supported
Hypothesis 2 Career anchor profiles will moderate the relationship
between career plateau and turnover intention. Supported
56
CHAPTER V CONCLUSIONS AND DISCUSSION This chapter presented the conclusions, discussion and implication based on the
findings in this research. Future suggestions and limitation of this research were also
provided.
Conclusion Career plateau is a situation that employees encounter sooner or later in their
career life, especially in a rapid changing era and a society full of SMEs like Taiwan.
In this study, the two proposed hypotheses were both tested. The significant
relationship between career plateau and turnover intention is proven to be true and the
hypothesis of the moderating effect of career anchor profiles is supported as well. The
results indicated that certain individual factors do play an important role in
employee’s turnover decision making process. In addition, three clusters were
generated to have a better understanding of the sample that this research intended to
investigate. The results did indicate several interesting findings that allowed the
researcher to provide some academic insights and practical suggestions to the
employers and human resource practitioners.
Discussion In this research, there were two focuses, the first one was to investigate the
relationship between career plateau and turnover intention in Taiwan. With a labor
market so small and a high percentage of population working in SMEs, people face
the plateau situation in their career quite often and soon. The consequence of career
plateau that when employees are facing a plateau in their career, they are more likely
to leave the organization and search for better development for their career in the
labor market was found. This proved what was stated in the literature to be also true
in Taiwan (Chao, 1990; Tremblay et al., 1995). The other focus of this study was to
find out the moderating role of personal interests in the relationship between career
plateau and turnover intention by using the career anchors profiles. Base on the model
proposed by Mobley et al. (1979), individual’s personal interests do take part in the
turnover decision making process. The findings of this research also supported the
model. The effects of career anchor profiles from the three generated clusters did
affect the relationship between career plateau and turnover intention differently.
57
The three clusters generated in this research were named as Low Career
Pursuers, Mid-Career Pursuers and High Career Pursuers. The patterns of the eight
career anchors from these three clusters generally represented three stages of an
individual’s career development process. In the beginning, which is the Low Career
Pursuers, it is the group with the lowest mean age among the three clusters. Therefore,
the researcher reasonably presumed that these people were at the beginning of their
career. They were still exploring what they want to pursue in their career and
meanwhile accumulating experiences in their jobs. At this stage, they mainly focused
on the stability and security of their job as well as the lifestyle to balance needs from
personal, family and work. As to other anchors, since they were still discovering
themselves or somehow disoriented on the career path, they scored low on these
indicators. However, when times go by with their experiences all piled up, they
developed into Mid-Career Pursuers.
When individuals got into the Mid-Career Pursuers group, they tended to have
better understandings toward themselves. At this stage, all career anchors were rated a
lot higher than Low Career Pursuers. The scores for Technical / Functional
Competence, Pure Challenge and Service / Dedication to a Cause had significantly
increased compared to the previous stage probably because individuals had chosen
their professions and were cultivating them to maturity already. They wanted to
sharpen their professional skills and make a different in their organization or to the
society. However, they were yet well-prepared for taking over general managerial
positions or create their own business outside the companies. This might be the reason
why individuals scored relatively lower on General Managerial Competence and
Entrepreneurial Creativity than other six anchors.
Finally, individuals entered the High Career Pursuers stage after being
experienced and well-developed on all aspects. Their professional skills were mature
and they were ready for general management positions in the company or perhaps
leaving the company and running their own business with all the competences and
skills they acquired after years of training. This might be the reason why the High
Career Pursuers scored higher in General Managerial Competence and
Entrepreneurial Creativity in comparison with the scores from Mid-Career Pursuers.
The hierarchical regression results also supported the abovementioned scenarios.
Generally, for both Mid-Career Pursuers and High Career Pursuers, career plateau did
58
have significant positive effect on turnover intention. In addition, the effect of High
Career Pursuers was stronger than that of Mid-Career Pursuers because with all skills
and competence matured, High Career Pursuers were more likely to have stronger
reactions when they faced a plateau situation in their career. Looking from the
dimensional level of career plateau, Mid-Career Pursuers’ job content plateau did
have stronger influence on turnover intention compare to High Career Pursuers. This
fit the point that the most focused career anchors for Mid-Career Pursuers were
Technical / Functional Competence, Service / Dedication to a Cause and Pure
Challenge, which were all related to their job contents. If job content plateau
happened on them, they would not be able to develop their professional skills and
might decide to leave for other opportunities. As to hierarchical plateau, the effect on
turnover intention from High Career Pursuers was the strongest for the reason that
they would like to climb up the ladder for higher rankings, which usually means
general managerial positions. When High Career Pursuers faced a hierarchical plateau
that stop them from moving upward in the organizations, they would consider leaving
the companies and create their own business.
To sum up, although the cluster analysis is a data driven result, the researcher
believed the reasoning provided above was logical it also fits with Super’s
Developmental Theory (1957) that individuals’ careers go through changes as they
mature. The development patterns are determined by the experiences, opportunities
and other socioeconomic factors they exposed to. People also develop their
self-concepts through the work roles they experience on their career path. Even
though the results might be different from the developmental stages and the
corresponding age ranges Super proposed, the general idea of the theory matched well
with the findings in this research.
Theoretical Implications The research result demonstrates the importance of personal career-oriented
interests/ factors that influence the relationship between career plateau and turnover
intention. In other words, the significance of individuals’ career interests can very
much affect their career decision. In addition, the result of cluster analysis proved the
plurality of career anchors proposed be Feldman and Bolino (1996) to be true. Also,
this research found that in accordance with previous studies, individuals’ career
59
anchors changed when people aged and went through life and career stages (Wey
Smola, & Sutton, 2002; Rodrigues & Guest, 2010). The results also suggested that
certain career-oriented variables can be utilized to study the career development
stages nowadays. Future research can focus on different individual interests between
the career plateau and turnover intention relationship with other career oriented
variables.
Practical Implications For practical implications, the important implication of the research is to
understand the employees in the company. Knowing the needs and what they place a
high value on is essential to keep talent within the companies as well as make the
companies grow. Therefore, career orientation assessments and the design of
individuals’ career path are crucial. Based on the findings in this research, for
employees in different career stages: Low, Mid and High Career Pursuers, the most
urgent needs for them to fulfill are Security / Stability, Technical / Functional
Competence and General Managerial Competence respectively. Human resource
practitioners can then identify and focus on fulfilling individuals’ needs to lower
employees’ intention to leave and the actual turnover behavior.
Other than the focus on individuals’ needs, age is also an important indicator
according to the cluster analysis. Employees in different age might result in different
stages of their career development as well. Take corresponding measures for
employees in different age range might be helpful for decreasing the turnover rate in
the companies.
Limitations A limitation of this study is that the researcher used convenient sampling by
asking friends and connections to fill out the online questionnaires. In doing so, the
result could be biased and might not be able to generalize to a larger society. Another
limitation is that the design of questionnaire was only able to find out the important
anchors; however, the most important anchor might not be able to identify. According
to Schein (2016), the identification of one dominant anchor can be done by interviews
with the research participants. Nevertheless, due to the limited time and budget, the
researcher was not able to conduct a comprehensive study to identify each
60
respondent’s dominant career anchor through an interview, but rather relied on the
respondent’s self-report which might be biased. Finally, because of the sample was
confined in Taiwan, due to cultural context, the results might not be generalizable.
Suggestions for Future Research There are three suggestions for the future research. (1) As mentioned by Schein
(2016), the future study regarding the career anchors can be done through the
combination of both qualitative and quantitative research approaches. In this case, the
researchers might be able to retrieve more accurate result of individuals’
career-oriented factors. (2) Individual factors between career plateau and turnover
intention can be further studied with different individual career orientation variables,
such as Holland Occupational Themes. In this case, researchers can understand
employees’ needs from different angles. (3) Future researcher can focus on different
cultural context or specific group of participants to investigate variation of career
anchor profiles and career development stages.
61
REFERENCE Allen, D. G., Weeks, K. P., & Moffitt, K. R. (2005). Turnover intentions and voluntary turnover: The moderating roles of self-monitoring, locus of control, proactive personality, and risk aversion. Journal of Applied Psychology, 90(5), 980-990. Allen, T. D., Russell, J. E., Poteet, M. L., & Dobbins, G. H. (1999). Learning and development factors related to perceptions of job content and hierarchical plateauing. Journal of Organizational Behavior, 20(7), 1113-1137. Abelson, M. A. (1987). Examination of avoidable and unavoidable turnover. Journal of Applied Psychology, 72(3), 382-386. Bardwick, J. M. (1986). The plateauing trap: How to avoid it in your career... and your life. New York, NY: American Management Association. Chao, G. T. (1990). Exploration of the conceptualization and measurement of career plateau: A comparative analysis. Journal of management, 16(1), 181-193. Chapman, R. J., & Brown, L. B. (2014). An empirical study of the career anchors that govern career decisions. Personnel Review, 43(5), 717-740. Coetzee, M., & Schreuder, D. (2009). Using the Career Orientations Inventory (COI) for measuring internal career orientations in the South African organisational context. SA Journal of Industrial Psychology, 35(1), 99-111. Coetzee, M., & Schreuder, D. (2011). The relation between career anchors, emotional intelligence and employability satisfaction among workers in the service industry. Southern African Business Review, 15(3), 76-97. Coetzee, M., & Schreuder, D. A. (2014). Psycho-social career meta-capacities. Switzerland: Springer International Publishing. Costello, A. B., & Osborne, J. W. (2005). Best practices in exploratory factor analysis: Four recommendations for getting the most from your analysis. Practical Assessment, Research & Evaluation, 10(7), 1-9. Cotton, J. L., & Tuttle, J. M. (1986). Employee turnover: A meta-analysis and review with implications for research. Academy of management Review, 11(1), 55-70. Dalton, D. R., Todor, W. D., & Krackhardt, D. M. (1982). Turnover overstated: The functional taxonomy. Academy of management Review, 7(1), 117-123. Directorate-General of Budget, Accounting and Statistics, Executive Yuan in Taiwan. Standard industrial classification system of the Republic of China, rev.10, 2016. Retrieve from https://docs.google.com/viewer?url=https%3A%2F%2Fwww.dgbas.gov.tw%2Fp ublic%2FAttachment%2F6530173144RP37PKRX.xlsx
62
Dreher, G. F. (1982). The role of performance in the turnover process. Academy of Management Journal, 25(1), 137-147. Erwee, R. (1990). Career anchor profiles of a sample of business and professional women. SA Journal of Industrial Psychology, 16(1), 5-12. Ettington, D. R. (1998). Successful career plateauing. Journal of Vocational Behavior, 52(1), 72-88. Feldman, D. C., & Bolino, M. C. (1996). Careers within careers: Reconceptualizing the nature of career anchors and their consequences. Human Resource Management Review, 6(2), 89-112. Feldman, D. C., & Weitz, B. A. (1988). Career plateaus reconsidered. Journal of management, 14(1), 69-80. Ference, T. P., Stoner, J. A., & Warren, E. K. (1977). Managing the career plateau. Academy of Management review, 2(4), 602-612. Ferguson, G. H., & Ferguson, W. F. (1986). Distinguishing voluntary from involuntary nurse turnover. Nursing management, 17(12), 43. Fishbein, M., & Ajzen, I. (1975). Belief, attitude, intention, and behavior: An introduction to theory and research. Reading, MA: Addison-Wesley. Fogarty, T. J., Singh, J., Rhoads, G. K., & Moore, R. K. (2000). Antecedents and consequences of burnout in accounting: Beyond the role stress model. Behavioral Research in Accounting, 12(1), 31-67. Foster, B. P., Shastri, T., & Withane, S. (2011). The impact of mentoring on career plateau and turnover intentions of management accountants. Journal of Applied Business Research (JABR), 20(4), 33-44. Gattiker, U. E., & Larwood, L. (1990). Predictors for career achievement in the corporate hierarchy. Human Relations, 43(8), 703-726. Guan, Y., Wen, Y., Chen, S. X., Liu, H., Si, W., Liu, Y., ... & Dong, Z. (2014). When do salary and job level predict career satisfaction and turnover intention among Chinese managers? The role of perceived organizational career management and career anchor. European Journal of Work and Organizational Psychology, 23(4), 596-607. Hackman, J. R., & Lawler, E. E. (1971). Employee reactions to job characteristics. Journal of applied psychology, 55(3), 259-286. Hair, J. F., Black, W. C., Babin, B. J., Anderson, R. E., & Tatham, R. L. (1998). Multivariate data analysis. Upper Saddle River, NJ: Prentice hall. Hayes, T. M. (2015). Demographic characteristics predicting employee turnover intentions (Doctoral Dissertation). Retrieved from ProQuest Dissertations &
63
Theses. (Order No. 3728489) Heilmann, S. G., Holt, D. T., & Rilovick, C. Y. (2008). Effects of career plateauing on turnover a test of a model. Journal of Leadership & Organizational Studies, 15(1), 59-68. Hendrix, W. H., Robbins, T., Miller, J., & Summers, T. P. (1998). Effects of procedural and distributive justice on factors predictive of turnover. Journal of Social Behavior and Personality, 13(4), 611-632. Hom, P. W., Caranikas-Walker, F., Prussia, G. E., & Griffeth, R. W. (1992). A meta- analytical structural equations analysis of a model of employee turnover. Journal of applied psychology, 77(6), 890-909. Hooper, D., Coughlan, J., & Mullen, M. (2008). Structural equation modelling: Guidelines for determining model fit. Journal of Business Research Methods, 6(1), 53-60. Igbaria, M., & Baroudi, J. J. (1993). A short-form measure of career orientations: A psychometric evaluation. Journal of Management Information Systems, 10(2), 131-154. Igbaria, M., Greenhaus, J. H., & Parasuraman, S. (1991). Career orientations of MIS employees: An empirical analysis. MIS Quarterly, 15(2), 151–169. Igbaria, M., Kassicieh, S. K., & Silver, M. (1999). Career orientations and career success among research, and development and engineering professionals. Journal of Engineering and technology management, 16(1), 29-54. Koh, H. C., & Goh, C. T. (1995). An analysis of the factors affecting the turnover intention of non-managerial clerical staff: A Singapore study. International Journal of Human Resource Management, 6(1), 103-125. Lee, C. C., Huang, S. H., & Zhao, C. Y. (2012). A study on factors affecting turnover intention of hotel employees. Asian Economic and Financial Review, 2(7), 866-875. Lorence, J., & Mortimer, J. T. (1985). Job involvement through the life course: A panel study of three age groups. American Sociological Review, 50(5), 618-638. Marsh, R. M., & Mannari, H. (1977). Organizational commitment and turnover: A prediction study. Administrative Science Quarterly, 22(1), 57-75. Miller, H. E., Katerberg, R., & Hulin, C. L. (1979). Evaluation of the Mobley, Horner, and Hollingsworth model of employee turnover. Journal of applied psychology, 64(5), 509-517. Milliman, J. F. (1992). Causes, consequences, and moderating factors of career plateauing (Doctoral dissertation). Retrieved from https://libraries.usc.edu/
64
Mobley, W. H. (1977). Intermediate linkages in the relationship between job satisfaction and employee turnover. Journal of applied psychology, 62(2), 237-240. Mobley, W. H., Griffeth, R. W., Hand, H. H., & Meglino, B. M. (1979). Review and conceptual analysis of the employee turnover process. Psychological bulletin, 86(3), 493-522. Mobley, W. H. (1982). Some unanswered questions in turnover and withdrawal research. Academy of Management Review, 7(1), 111-116. Morrell, K., Loan‐Clarke, J., & Wilkinson, A. (2001). Unweaving leaving: the use of models in the management of employee turnover. International Journal of Management Reviews, 3(3), 219-244. Near, J. P. (1980). The career plateau: Causes and effects. Business Horizons, 23(5), 53-57. Near, J. P. (1985). A discriminant analysis of plateaued versus nonplateaued managers. Journal of Vocational Behavior, 26(2), 177-188. Nunnally J C. (1978). Psychometric theory. New York: McGraw Hill. Podsakoff, P. M., & Organ, D. W. (1986). Self-reports in organizational research: Problems and prospects. Journal of management, 12(4), 531-544. Porter, L. W., & Steers, R. M. (1973). Organizational, work, and personal factors in employee turnover and absenteeism. Psychological bulletin, 80(2), 151-176. Price, J.L. (1977). The Study of Turnover. Ames, IA: Iowa State University Press. Rodrigues R., & Guest, D. (2010, July). Career anchors of professional workers: Extending Schein’s framework. Paper presented at the meeting of 27th International Congress of Applied Psychology, Melbourne, Australia. Schein, E. H. (1978). Career dynamics: Matching individual and organizational needs. Reading, MA: Addison-Wesley. Schein. E. H. (1990). Career anchors: Discovering your real values. San Francisco: Pfeiffer Wiley. Schein, E. H. (2006). Career anchors: Self assessment. San Francisco, Calif.: Pfeiffer. Schein, E. H., & Van Maanen, J. (2016). Career anchors and job/role planning: Tools for career and talent management. Organizational Dynamics, 45(3), 165-173. Singh, M. K., Bhattacharjee, V., & Kodwani, A. D. (2009). Mapping career anchors in a large engineering company: A study. Paradigm, 13(2), 50-56.
65
Small and Medium Enterprise Administration, Ministry of Economic Affairs. 2016 Small and medium enterprise statistics. [text in Chinese] Retrieved from http://www.moeasmea.gov.tw/lp.asp?ctNode=689&CtUnit=140&BaseDSD=7& mp=1 Sousa-Poza, A., & Henneberger, F. (2004). Analyzing job mobility with job turnover intentions: An international comparative study. Journal of Economic Issues, 38(1), 113-137. Super, D.E. (1957). The psychology of careers. New York: Harper & Row. Staw, B. M. (1980). The consequences of turnover. Journal of occupational Behaviour, 1(4), 253-273. Steel, R. P. (2004). Job markets and turnover decisions. In Griffeth, R., & Hom, P. (Eds.), Innovative theory and empirical research on employee turnover (pp. 73-82). Greenwich, Connecticut: Information Age Publishing Inc. Steel, R. P., & Lounsbury, J. W. (2009). Turnover process models: Review and synthesis of a conceptual literature. Human Resource Management Review, 19(4), 271-282. Steers, R.M., & Mowday, R.T. (1981). Employee turnover and post-decision justification. In L.L. Cummings & B.M. Staw (Eds.), Research in organizational behavior (pp. 235–282). Greenwich, CT: JAI Press. Suutari, V., & Taka, M. (2004). Career anchors of managers with global careers. Journal of Management Development, 23(9), 833-847. Tremblay, M., & Roger, A. (1993). Individual, familial, and organizational determinants of career plateau an empirical study of the determinants of objective and subjective career plateau in a population of Canadian managers. Group & Organization Management, 18(4), 411-435. Tremblay, M., Roger, A., & Toulouse, J. M. (1995). Career plateau and work attitudes: An empirical study of managers. Human relations, 48(3), 221-237. Valcour, P. M., & Tolbert, P. (2003). Gender, family and career in the era of boundarylessness: Determinants and effects of intra-and inter-organizational mobility. International Journal of Human Resource Management, 14(5), 768- 787. Veiga, J. F. (1981). Plateaued versus nonplateaued managers: Career patterns, attitudes, and path potential. Academy of Management journal, 24(3), 566- 578. Wanous, J. P., Stumpf, S. A., & Bedrosian, H. (1979). Job survival of new employees. Personnel psychology, 32(4), 651-662. Wayne, S. J., Shore, L. M., & Liden, R. C. (1997). Perceived organizational support and leader-member exchange: A social exchange perspective. Academy of
66
Management journal, 40(1), 82-111. Weisberg, J., & Kirschenbaum, A. (1993). Gender and turnover: A re-examination of the impact of sex on intent and actual job changes. Human Relations, 46(8), 987-1006. Wen, Y., & Liu, L. (2015). Career plateau and turnover intention in Chinese employees: Career anchor as moderator. Social Behavior and Personality: an international journal, 43(5), 757-766. Wey Smola, K., & Sutton, C. D. (2002). Generational differences: Revisiting generational work values for the new millennium. Journal of organizational behavior, 23(4), 363-382. Wickramasinghe, V., & Jayaweera, M. (2010). Impact of career plateau and supervisory support on career satisfaction: A study in offshore outsourced IT firms in Sri Lanka. Career Development International, 15(6), 544-561. Williams, L. J., & Hazer, J. T. (1986). Antecedents and consequences of satisfaction and commitment in turnover models: A reanalysis using latent variable structural equation methods. Journal of applied psychology, 71(2), 219.
67
APPENDIX
國立臺灣師範大學
學術研究問卷
親愛的先生/女士您好:
本研究旨在暸解台灣員工職涯傾向與其工作行為。研究結果對員工及僱
主雙方皆有所幫助。懇請您撥冗協助填答此問卷。您於本問卷中提供的所
有資訊皆將保密且僅屬學術用途,您的填答不會與您的身份以及所屬公司
有所連結。若您同意以上敘述,即可開始作答。
若您有任何關於此研究的問題,歡迎您直接與我們聯繫。非常感謝您的
時間與合作。
林秉翰/ 研究生
國際人力資源發展研究所
國立臺灣師範大學
指導教授
葉俶禎 博士
國際人力資源發展研究所
國立臺灣師範大學
68
第一部分
請您依據目前工作的感受選擇最適合的答案 並圈選數字作答 (1=完全不同意 5=完全同意)
完全不同意
不同意
普通
同意
完全同意
1. 我正積極地尋找公司外的工作機會 1 2 3 4 5 2. 一旦找到更好的工作,我將離開目前就職的公司 1 2 3 4 5 3. 我現在正認真地思考辭去目前的工作 1 2 3 4 5 4. 我經常考慮辭去目前任職公司的工作 1 2 3 4 5 5. 我認為一年後我仍任職於目前的公司 1 2 3 4 5
第二部分 請根據您目前的工作情形選擇最適合的答案 並圈選數字作答 (1=完全不同意, 7=完全同意)
完全不同意
非常不同意
不同意
普通
同意
非常同意
完全同意
1. 我預期目前的工作仍會繼續有各種挑戰 1 2 3 4 5 6 7 2. 目前的工作中,我有機會大量的學習與成長 1 2 3 4 5 6 7 3. 我的工作職掌與活動對我來說已經變成是循環的例行性工作
1 2 3 4 5 6 7
4. 我的工作職責有顯著地增加 1 2 3 4 5 6 7 5. 我的工作需要我不斷的拓展自身能力與知識 1 2 3 4 5 6 7 6. 我的工作具有挑戰性 1 2 3 4 5 6 7 7. 我在這家公司中的升遷機會很有限 1 2 3 4 5 6 7 8. 我預期自己在公司會有很多的升遷 1 2 3 4 5 6 7 9. 我在公司中能出頭的機會很有限 1 2 3 4 5 6 7 10. 在公司中我已經達到一個不太有機會能再升遷的職位 1 2 3 4 5 6 7 11. 我不太可能在這家公司中獲得更高的職稱了 1 2 3 4 5 6 7 12. 我預期自己近期內在公司中將升到更高的職位 1 2 3 4 5 6 7
69
第三部分
請回答下列各題項的敘述,符合自己面對【職涯/工作選擇】時的考量的程度有多高,並圈選數字作答。 (1=完全不符合; 6=完全符合)
完全不符合
完全符合
1. 我夢想我的工作能允許我自由地以自己的方式與步調來做事 1 2 3 4 5 6 2. 當我能全然自由地安排自己的工作、行程與工作方式時,最能感到滿足 1 2 3 4 5 6 3. 當能完全自主與自由地定義我的工作時,我才能感受到職涯的成功 1 2 3 4 5 6 4. 對我來說能以自己的方式做事,免於種種規定的限制,是非常重要的 1 2 3 4 5 6 5. 我寧願離開公司也不願意接受會減少自主與自由的工作 1 2 3 4 5 6
6. 比起工作自由與自主性,工作的保障與安全性對我而言更為重要 1 2 3 4 5 6 7. 我不願意留在一個會指派可能危及我工作保障的任務給我的組織 1 2 3 4 5 6 8. 我通常尋求能讓我感受到保障與穩定的工作 1 2 3 4 5 6 9. 我夢想能找到一份讓我感到穩定且有保障的工作 1 2 3 4 5 6 10. 當我在財務與工作上皆有所保障時,我最能感到滿足 1 2 3 4 5 6
11. 我想在工作上得心應手,使得其他人總是來尋求我的專業建議 1 2 3 4 5 6 12. 當我能在工作上不斷精進自己的能力時,我才會感受到職涯上的成功 1 2 3 4 5 6 13. 在我的專業領域上成為資深的功能性或技術性主管比成為總經理更加吸
引我 1 2 3 4 5 6
14. 我寧願離開公司也不願接受會使我離開專業領域的輪調性工作 1 2 3 4 5 6 15. 當我能在工作上運用我特殊的才能,我最能感到滿足 1 2 3 4 5 6
16. 當我在工作中能夠整合眾人的心血來完成一個共同的任務時,我對於工作最感到滿足。
1 2 3 4 5 6
17. 我夢想能負責管理一整個組織 1 2 3 4 5 6 18. 唯有在公司中成為高階總經理時,我才會感到成功 1 2 3 4 5 6 19. 對我來說成為總經理比在專業領域上成為資深功能性主管更為吸引人 1 2 3 4 5 6 20. 我寧願離開公司也不願意接受會讓我偏離升遷到高階管理的工作 1 2 3 4 5 6
21. 我總是在尋找靈感讓我能夠創立自己的事業 1 2 3 4 5 6 22. 建立自己的事業比在他人公司中擔任高階主管來得重要 1 2 3 4 5 6 23. 當我能以自己的能力及努力來創造出東西時,我最能感到滿足 1 2 3 4 5 6 24. 唯有根據我的想法以及能力來創立自己的企業,才能讓我感到成功 1 2 3 4 5 6 25. 我夢想創建我自己的事業 1 2 3 4 5 6
26. 當我的工作對社會福祉有實質貢獻時,我才會感受到職業生涯上的成功 1 2 3 4 5 6
27. 當我能在工作上以自己的才能服務他人,我最能感到滿足 1 2 3 4 5 6
28. 能夠發揮才能讓世界變得更美好是我職涯選擇的考量因素 1 2 3 4 5 6
29. 我夢想中的工作是能對全人類及社會有實質的貢獻 1 2 3 4 5 6
70
30. 我寧願離開公司也不願意接受會用不上我服務他人能力的工作 1 2 3 4 5 6
31. 我夢想中的職涯是能不斷挑戰解決更困難的問題 1 2 3 4 5 6 32. 唯有能在工作上不斷遇到並解決更困難的挑戰時,我才能感受到職涯上
的成功 1 2 3 4 5 6
33. 當我能解決看似難解甚至不可能完成的任務時,我最能感到滿足 1 2 3 4 5 6 34. 工作上我偏好強烈挑戰我個人解決問題能力與競爭力的機會 1 2 3 4 5 6 35. 比起達到高階管理階層,從事解決難題的工作對我而言更為重要 1 2 3 4 5 6
36. 我寧願選擇離開公司,也不願留在會讓我無法顧全個人與家庭的工作上 1 2 3 4 5 6 37. 我夢想中的職業要能夠同時滿足我個人、家庭以及工作需求 1 2 3 4 5 6 38. 唯有能均衡個人、家庭及工作需求時,我才會感到人生的成功 1 2 3 4 5 6 39. 比起擔任高階管理職位,能維持個人與專業上需求的平衡對我而言更為
重要 1 2 3 4 5 6
40. 我總是尋找對我個人以及家庭影響最小的工作 1 2 3 4 5 6
基本資料
1. 我的性別是 □男 □女 2. 我出生在西元 _______年 3. 我的最高學歷是 □高中職畢業及以下 □專科畢業 □學士畢業 □碩士畢業 □博士畢業 4. 我在目前職位的年資 ________ 5. 我總共工作了幾年 ________ 6. 目前工作職階: □自僱(自己開業) □一般職員 □初階管理層 □中階管理層 □高階管理層 □其他 7. 我的婚姻狀態是 □已婚 □單身 □離婚 □寡居 □同居 8. 我目前撫養的人數 ________ 9. 我目前工作所在的產業
□農、林、漁、牧業 □礦業及土石採取業 □製造業 □電力及燃氣供應業 □用水供應及
污染整治業 □營造業 □批發及零售業 □運輸及倉儲業 □住宿及餐飲業 □資訊及通訊
傳播業 □金融及保險業 □不動產業 □專業、科學及技術服務業 □支援服務業 □公共
行政及國防;強制性社會安全 □教育服務業 □醫療保健及社會工作服務業 □藝術、娛
樂及休閒服務業 □其他服務業