42
ISSUES & ANSWERS U.S. Department of Education The distribution of teaching and learning resources in California’s middle and high schools REL 2007–No. 023 At WestEd

I S S U E S & A N S W E R S
U . S . D e p a r t m e n t o f E d u c a t i o n
The distr ibution of teaching and learning resources in Cali fornia’s middle and high schools
R E L 2 0 0 7 – N o . 0 2 3
At WestEd

The distribution of teaching and learning resources in California’s
middle and high schools
September 2007
Prepared by
Miguel Socias, Ph.D. American Institutes for Research
Jay Chambers, Ph.D. American Institutes for Research
Phil Esra American Institutes for Research
Larisa Shambaugh, M.P.P. American Institutes for Research
I S S U E S&ANSWERS R E L 2 0 0 7 – N o . 0 2 3
U . S . D e p a r t m e n t o f E d u c a t i o n
At WestEd

Issues & Answers is an ongoing series of reports from short-term Fast Response Projects conducted by the regional educa-tional laboratories on current education issues of importance at local, state, and regional levels. Fast Response Project topics change to reflect new issues, as identified through lab outreach and requests for assistance from policymakers and educa-tors at state and local levels and from communities, businesses, parents, families, and youth. All Issues & Answers reports meet Institute of Education Sciences standards for scientifically valid research.
September 2007
This report was prepared for the Institute of Education Sciences (IES) under Contract ED-06-CO-0014 by Regional Edu-cational Laboratory West administered by WestEd. The content of the publication does not necessarily reflect the views or policies of IES or the U.S. Department of Education nor does mention of trade names, commercial products, or organiza-tions imply endorsement by the U.S. Government.
This report is in the public domain. While permission to reprint this publication is not necessary, it should be cited as:
Socias, M., Chambers, J., Esra, P., & Shambaugh, L. (2007). The distribution of teaching and learning resources in California’s middle and high schools (Issues & Answers Report, REL 2007–No. 023). Washington, DC: U.S. Department of Education, Institute of Education Sciences, National Center for Education Evaluation and Regional Assistance, Regional Educational Laboratory West. Retrieved from http://ies.ed.gov/ncee/edlabs
This report is available on the regional educational laboratory web site at http://ies.ed.gov/ncee/edlabs.
WA
OR
ID
MT
NV
CA
UT
AZ
WY
ND
SD
NE
KSCO
NM
TX
OK
CO
AR
LA
MS AL GA
SC
NC
VAWV
KY
TN
PA
NY
FL
AK
MN
WI
IA
IL IN
MI
OH
VT
NH
ME
MO
At WestEd

iii
Summary
Access to important educational re-sources in California’s middle and high schools is not equal among schools that serve different student popula-tions. Overall, the most disadvantaged populations of middle and high school students are likely to have the least access to the resources necessary for learning.
Students in schools with the highest concen-trations of low-income students or English language learners are more likely to have a less experienced teacher or a teacher not autho-rized to teach that subject, and they are less likely to be enrolled in courses required for admission to the University of California (UC) or California State University (CSU) systems.
Despite the general pattern of unequal dis-tribution of certain teaching resources, only limited differences in distribution are associ-ated with student race/ethnicity. For example, in foreign language and social science the schools with the highest concentrations of Af-rican American students did not experience as drastic a difference in out-of-field instruction as they have in the past. In contrast to prior research that indicated much more unequal patterns for schools with high concentrations of minorities, this suggests that some progress may have been made on one front. In addition,
aside from the expected trend of smaller classes in smaller rural schools, class sizes do not seem to vary greatly by type of student population.
The persistent disparities in the distribution of teaching and learning resources should not be ignored. Better answers are needed for why these patterns persist despite the time, effort, and resources devoted to the issue. The small differences identified in this report may sug-gest areas for further research. For example, to what extent can district policies and teacher union contracts explain the relationship be-tween teacher inexperience and schools with high concentrations of low-income students? Why is more out-of-field teaching found in schools with higher concentrations of low-income students? Why is much more out-of-field teaching found in middle schools than in high schools? Are fewer students enrolling in UC- and CSU-eligible courses in schools with higher concentrations of low-income students because the courses are not offered, because students are not encouraged to enroll, or because students do not feel prepared to take these courses?
The answers to such questions will come not from the datasets analyzed here but from conversations with school, district, county, and state practitioners who know the realities
The distribution of teaching and learning resources in California’s middle and high schools

iv Summary
of the education system. Through discussions with superintendents and other instructional leaders in the state, the underlying reasons behind these unequal distributions might be uncovered, providing local and state policy-makers with the information they need to
begin to make changes. Teaching and learn-ing resources can, ultimately, be more equally distributed—the next challenge is to figure out how.
September 2007

v
Table of conTenTs
Summary iii
Main findings 1Teacher quality 1Class size 2What students are studying 2What the findings mean for future research 3
Examining how public school systems allocate and use resources 3
The distribution of teacher quality 5Out-of-field teaching 8Teacher education 14Teacher experience 18
Average class size 21
What students are studying 22University of California– and California State University–eligible classes 23Course-taking patterns 27
Finding out why disparities persist 27
Notes 28
Appendix. Methodology 29
References 34
Boxes1 Methodology 42 Key findings for out-of-field teaching 83 Key findings on teacher education 144 Key findings on teacher experience 195 Key findings on average class size 216 Key finding on eligible classes 237 Key findings on course-taking 27
Figures1 Percentage of students taught by out-of-field teachers, middle school, by subject and poverty quartile, 2005/06 82 Percentage of students taught by out-of-field teachers, high school, by subject and poverty quartile, 2005/06 93 Percentage of students taught by out-of-field teachers in University of California– and California State
University–eligible classes, high school, by subject and poverty quartile, 2005/06 94 Percentage of students taught by out-of-field teachers, middle school, by subject and English language learner
quartile, 2005/06 105 Percentage of students taught by out-of-field teachers, high school, by subject and English language learner
quartile, 2005/06 106 Percentage of students taught by out-of-field teachers, University of California– and California State
University–eligible classes, high school, by subject and English language learner quartile, 2005/06 117 Percentage of students taught by out-of-field teachers, middle school, by subject and Hispanic student quartile,
2005/06 12

vi
8 Percentage of students taught by out-of-field teachers, high school, by subject and Hispanic student quartile, 2005/06 13
9 Percentage of students taught by out-of-field teachers, high school, by subject and population density, 2005/06 1310 Percentage of students taught by out-of-field teachers, middle school, by subject and school type, 2005/06 1411 Percentage of students taught by teacher with master’s or doctorate, middle school, by subject and poverty
quartile, 2005/06 1512 Percentage of students taught by teacher with master’s or doctorate, high school, by subject and poverty
quartile, 2005/06 1513 Percentage of students taught by teacher with master’s or doctorate, middle school, by subject and English
language learner quartile, 2005/06 1514 Percentage of students taught by teacher with master’s or doctorate, high school, by subject and English
language learner quartile, 2005/06 1615 Percentage of students taught by teacher with master’s or doctorate, middle school, by subject and Hispanic
student quartile, 2005/06 1616 Percentage of students taught by teacher with master’s or doctorate, high school, by subject and Hispanic
student quartile, 2005/06 1717 Percentage of students taught by teacher with master’s or doctorate, high school, by subject and African
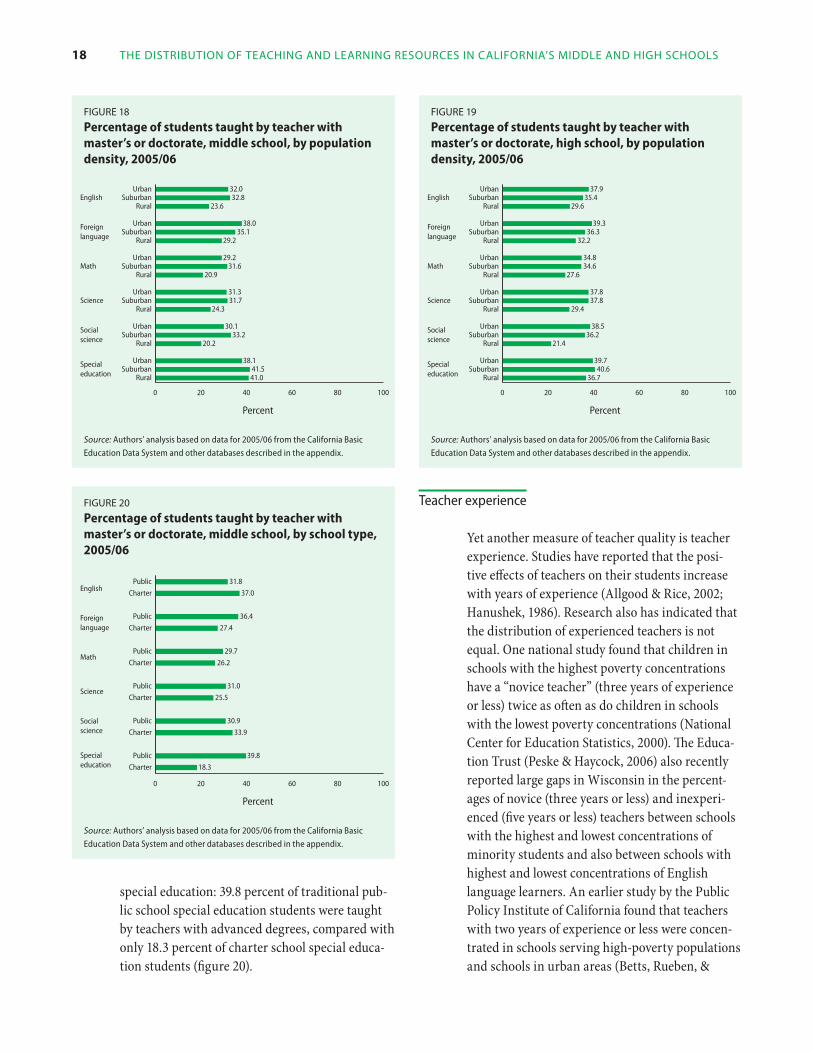
American student quartile, 2005/06 1718 Percentage of students taught by teacher with master’s or doctorate, middle school, by population density,
2005/06 1819 Percentage of students taught by teacher with master’s or doctorate, high school, by population density,
2005/06 1820 Percentage of students taught by teacher with master’s or doctorate, middle school, by school type, 2005/06 1821 Years of teaching experience, middle school, by subject and poverty quartile, 2005/06 1922 Years of teaching experience, high school, by subject and poverty quartile, 2005/06 2023 Years of teaching experience, high school, by subject and English language learner quartile, 2005/06 2024 Years of teaching experience, middle school, by subject and population density, 2005/06 2125 Years of teaching experience, middle school, by subject and school type, 2005/06 2126 Average class size, high school, by population density, 2005/06 2227 Percentage of students in University of California- and California State University-eligible classes, high school,
by poverty quartile, 2005/06 2428 Percentage of students in University of California- and California State University-eligible classes, high school,
by English language learner quartile, 2005/06 2429 Percentage of students in University of California– and California State University–eligible classes, high
school, by Hispanic student quartile, 2005/06 2530 Percentage of students in University of California– and California State University–eligible classes, high
school, by African American student quartile, 2005/06 2631 Percentage of students in University of California- and California State University-eligible classes, high school,
by population density, 2005/06 2632 Percentage of students in University of California– and California State University–eligible classes, high
school, by school type, 2005/06 26
Tables1 Average teaching and learning resources in California middle and high schools, 2005/06 52 Percentage of out-of-field teaching by poverty quartile and percentage of English language learners for high
school English, 2005/06 113 Admissions requirements for the University of California and California State University systems 23A1 Sizes of school quartiles by school characteristic 33

main findingS 1
Access to important educational resources in California’s middle and high schools is not equal among schools that serve different student populations. Overall, the most disadvantaged populations of middle and high school students are likely to have the least access to the resources necessary for learning.
MAin findings
California policymakers are focusing on how re-sources are allocated and used in the public school system. Information on the current distribution
of resources among schools throughout the state would aid their review and decisionmaking. This report provides a detailed and up-to-date snapshot of the distribution of some of the most critical re-sources in California’s middle and high schools—classroom teachers, class sizes, and college-going courses. It examines how these resources are distributed across schools grouped into quartiles by the percentage of low-income students, English language learners, Hispanic students, and African American students; by the population density of the areas in which schools are located; and by the type of school (traditional public or charter).
Teacher quality
The analysis of teacher quality focused on out-of-field teaching, teacher education, and teacher experience. Out-of-field teaching was based on the percentage of middle and high school students taking courses in specific subject areas (English, foreign language, math, science, and social sci-ence) and in special education with teachers not authorized to teach that subject.1 Teacher educa-tion examined the percentage of students taught in these subjects by teachers with master’s degrees or higher. Teacher experience was measured as the average number of years of experience by subject.
Out-of-field teaching. Students in schools with the highest concentrations of low-income students and those in schools with the highest concentrations of English language learners had a greater probabil-ity of experiencing out-of-field teaching, especially in English, math, science, and special education classes. For example, in middle school English classes 40.5 percent of students in first-quartile schools (schools with the lowest concentrations of low-income students) were taught by out-of-field teachers, compared with 48.7 percent of students in the fourth quartile (schools with the highest concentrations of low-income students).2
Science courses had the highest percentage of stu-dents receiving instruction from out-of-field teach-ers across all schools. English courses averaged a higher percentage of students with out-of-field

2 The diSTribuTion of Teaching and learning reSourceS in california’S middle and high SchoolS
teachers than did math courses. High schools, almost across the board, showed lower levels of out-of-field teaching than did middle schools, but the patterns with respect to poverty were similar to those for middle schools. High school courses that satisfied the University of California (UC) or California State University (CSU) admission re-quirements had lower rates of out-of-field teaching than all courses combined.
Teacher education. Low-income students had less access to teachers with advanced degrees. (Advanced degrees are intended to measure teacher subject mat-ter knowledge.) Schools with the highest percentages of low-income students had the lowest percent-ages of students taught by teachers
with advanced degrees. This finding held true in all subjects in both middle and high schools. Stu-dents in rural communities were also less likely to be taught by teachers with advanced degrees than were students in suburban and urban schools.
Teacher experience. Low-income students had less access to experienced teachers. For example, in middle school English classes teachers in first-quartile schools (with the lowest concentrations of low-income students) averaged 12.4 years of expe-rience, while teachers in fourth-quartile schools (with the highest concentrations of low-income students) averaged 10.4 years of experience.
Teacher experience was also higher in schools with lower percentages of English language learners, Hispanic students, and African American students and in schools in areas with lower population den-sities. Teachers in charter schools were likely to be much less experienced than their counterparts in traditional public schools.
Class size
Because smaller classes may afford students a better opportunity to learn and receive more at-tention from teachers, the differences in class size
across schools were analyzed. Unlike the other results, where clear patterns emerged with respect to the poverty and English language learner status of the students, the class-size findings were not striking. Few differences in average class size were found among the various subjects across the dif-ferent types of middle and high schools, except for rural schools. On average, classes were smaller in rural schools than in urban and suburban schools.
What students are studying
Another critical component of educational success is access to classes that prepare students for col-lege. One way to assess whether different catego-ries of students have equal access to educational resources is to examine the distribution of rigor-ous classes and student course-taking. Another is to look at the distribution of enrollment in classes in different subjects related to college preparation or attendance.
University of California– and California State University–eligible classes. Moving from a focus on teachers to a broader institutional perspective, we examined the rigor of courses by consider-ing the percentage of students enrolled in classes that met UC and CSU admission requirements. California state postsecondary school systems require incoming students to have taken specific courses in several subjects (often referred to as the “a-g” requirements). The different proportions of students enrolled in these courses may reflect dif-ferent levels of preparation for entry into the state’s public colleges.
High schools with higher poverty levels had lower percentages of students enrolled in UC- and CSU-eligible classes, with math classes showing the biggest difference.
Course-taking patterns. Another approach to considering the rigor of course loads in different schools is to look at the number of classes each student takes in different subjects, regardless of whether the courses are UC- and CSU-approved. For example, a heavier course load in math at a
schools with the highest
percentages of low-
income students had
the lowest percentages
of students taught
by teachers with
advanced degrees

examining how public School SySTemS allocaTe and uSe reSourceS 3
school might indicate that students there are sys-tematically given the opportunity or are encour-aged to take math instead of other courses less relevant to preparing for college.
But the findings were not conclusive. Overall, there were no clear differences in course loads by subject across quartiles for the 2005/06 school year. And when a subject did show a clear pattern in course-taking, the differences between quartiles were generally small.
What the findings mean for future research
Given these patterns of unequal distribution of access to teaching and learning resources, future research should investigate the roots of these pat-terns to understand how best to ameliorate them. Researchers should also delve more deeply into areas that show more equal distribution of re-sources, to learn from successes as well as failures. State policymakers need to better understand how to create incentives for schools and districts to en-sure that schools with the neediest students have the same access to teaching and learning resources as other schools.
exAMining hOw publiC sChOOl sysTeMs AllOCATe And use resOurCes
California policymakers are focusing on how re-sources are allocated and used in the public school system. The accountability requirements of the No Child Left Behind Act of 2001 have highlighted California’s continued low student outcomes, especially among the state’s large population of English language learners. The federal government also recently requested that California revise its plan to comply with No Child Left Behind regula-tions that require all teachers of core academic subjects to be “highly qualified,” emphasizing how the state plans to achieve a more equal distribution of highly qualified teachers throughout the state’s schools.3 And by the joint request of California’s governor, state superintendent, and senate and assembly leaders, an array of 22 research studies
(under the umbrella title Getting Down to Facts) was released in April 2006, to provide policymak-ers the information needed to decide how to fund education and improve student outcomes (Gover-nor’s Committee on Education Excellence, 2006).
Establishing whether the state’s resources are ad-equate for every child’s education and determin-ing how to address, on a state level, the ongoing pressure to raise student achievement outcomes require a better understanding of the current distribution of education resources throughout the state. This report provides a detailed snapshot of some of the most critical resources: middle and high school classroom teachers and the courses they teach. It examines how these resources were distributed in the 2005/06 school year among schools classified by the characteristics of their students (poverty status and the percentage of students classified as English language learner, Hispanic, and African American), type of school (public or charter), and degree of urbanization of the community served (measured by the popula-tion density of the surrounding area). (Box 1 and the appendix provide details on the methodology of the study.) The report examines how teacher quality (educational preparation, years of experi-ence, and out-of-field teaching) and class size were distributed across different types of schools and across subject areas within schools. It also presents data on the percentage of students taking courses required for admission to the UC and CSU systems (the “a-g” requirements).
The report focuses on middle and high schools because of the current push to understand how to reform secondary schools, especially given the high dropout and low graduation rates (Education Week, June 2006) and the low academic achievement of high school students (Hall & Kennedy, 2006). The recent introduction of the California High School Exit Exam as a graduation requirement also sharp-ens the focus on improving secondary education.
The report focuses on
middle and high schools
because of the current
push to understand
how to reform
secondary schools

4 The diSTribuTion of Teaching and learning reSourceS in california’S middle and high SchoolS
box 1
Methodology
This report analyzes the distribution of the following education resources in California:
Out-of-field teaching.•Teacher education.•Teacher experience.•Class size.•Courses satisfying the University •of California and California State University requirements.
Each resource was analyzed in its relationship to the following school characteristics:
The percentage of students at the •school who are eligible for free or reduced-price lunch.The percentage of students at the •school who are English language learners.The percentage of students at the •school who are Hispanic.The percentage of students at •the school who are African American.The population density of the •school’s surrounding area (urban, suburban, or rural).Whether the school is a charter •or a traditional public school.
The percentages of Hispanic and Afri-can American students were selected as variables because these are the two most common minorities in Cali-fornia schools and because they are often most at risk within the educa-tion system.
All data on middle and high schools were drawn from the California Basic Educational Data System for the 2005/06 school year. For each of the first four school characteristics listed above, schools were divided into quartiles. The first quartile was the group of schools with the lowest concentrations of students with the characteristic (that is, students in poverty or who are English language learners, Hispanic, or African Ameri-can), and the fourth quartile was the group of schools with the highest percentages of these students. The sizes of these quartiles are shown in table A1 in the appendix. In addition, this report presents average percent-ages for each quartile, but the story is more complex. There is quite a bit of variation in out-of-field teaching even within poverty quartiles. However, this analysis focuses primarily on the averages across quartiles.
Next the study analyzed how the availability of each teaching and learning resource varied by percent-age of low-income, English language learner, Hispanic, and African American students. Students are the unit of analysis for this study, so all results are shown from the student perspective—that is, the percentage of students taught by out-of-field teachers, the percentage of students taught by teachers with advanced degrees, and so on.
The graphs in this report show the average percentages of students taught by out-of-field teachers and teachers with advanced degrees, the
average number of years of teaching experience, the average class size, and the average percentage of students enrolled in UC- and CSU-eligible courses for schools in each quartile. This report includes only the graphs showing the clearest patterns. (Many more graphs were generated for this study; the full results are in a sepa-rate technical appendix, available by request from the authors.)
No tests of statistical significance were conducted for the differences between quartiles. Since the study includes the whole population of middle and high schools in California, any differ-ence in the distribution of education resources across school quartiles is, by definition, not an artifact of a particular sample. In other words, there is no need to test for statistical significance for average differences between quartiles, because no statisti-cal inference is needed. However, a benchmark was created defining small, medium-size, and large dif-ferences in results among quartiles, based on the results of the analyses. Any difference smaller than 0.20 stan-dard deviations was defined as small, any difference between 0.20 and 0.40 standard deviations as medium-size, and any difference greater than 0.40 standard deviations as large.
Additional analyses were conducted for the two previous school years (2003/04 and 2004/05), but changes over time appeared small for many of the teaching and learning resources, so these analyses were not included in this report.

The diSTribuTion of Teacher qualiTy 5
With the increasing importance of a college degree to success in the labor market, it is necessary to understand the education settings that provide students with an adequate chance to enter college. For all these reasons, state policymakers need a more refined understanding of the distribution of teaching and learning resources among middle and high school students.
This report does not recommend a way to equalize the distribution of resources, but it does highlight areas that others might address in bringing about change in California—the characteristics and qualifications of classroom teachers and the access students have to certain course offerings in middle and high schools.
Table 1 lists the teaching and learning resources studied in this report, showing the averages for middle and high schools in California for the 2005/06 school year.
Many patterns emerge from this snapshot of resources, but the focus here is on the distribu-tion of these resources to different populations and schools in California. Separate analyses were conducted for core academic subjects—English, foreign language, math, science, and social science—as well as for special education. Descrip-tive statistical analyses were conducted of teaching personnel, class sizes, and UC- and CSU-eligible course-taking patterns, broken down by several indicators of educational need. The indicators include the school’s poverty level; its concentration of English language learners, African American students, and Hispanic students; its type (public
or charter school); and the population density of its surrounding area. Student poverty, English language learner status, and minority status were selected as variables because they are often intertwined with educational success. The type of school was deemed important because California has the largest number of charter schools in the country (Center for Education Reform, 2006) and because there is interest in how charter schools differ from more traditional public schools.
This report provides descriptive information about the distribution of teaching and learn-ing resources among California schools in the 2005/06 school year and the relationships of those resources to specific school characteristics, but it makes no attempt to imply causation. The intent is not to find causal relationships; it is to arm the state’s policymakers and researchers with a better understanding of the distribution of California’s teaching and learning resources—to better equip them to change the public education system.
The disTribuTiOn Of TeACher quAliTy
Teacher quality is among the most critical re-sources for a student’s education—this is univer-sally acknowledged. The federal government has
Table 1
Average teaching and learning resources in California middle and high schools, 2005/06
characteristic middle schools high schools
average share of students taught by out-of-field teachers (percent) 40.4 19.5
average share of teachers with advanced degrees (percent) 32.8 36.0
average teaching experience (years) 11.8 11.2
average class size (number of students) 26.1 25.5
average share of students enrolled in uc- and cSu-eligible courses (percent) 10.1 40.9
Source: Authors’ analysis based on data for 2005/06 from the California Basic Education Data System and other databases described in the appendix.
This report provides
descriptive information
about the distribution
of teaching and learning
resources among
California schools and
the relationships of those
resources to specific
school characteristics,
but makes no attempt
to imply causation

6 The diSTribuTion of Teaching and learning reSourceS in california’S middle and high SchoolS
recognized the importance of qualified teachers by requiring, through the No Child Left Behind Act, that all teachers of core academic subjects be “highly qualified.” While states have some leeway in defining “highly qualified,” the federal govern-ment did set three parameters. A highly qualified teacher must hold a bachelor’s degree or higher in the subject taught, obtain full teacher certifica-tion, and demonstrate knowledge in the subject taught.
But measuring a teacher’s quality is difficult. One means of doing so is to determine whether the teacher is certified to teach the subject. This is sometimes a crude measure of quality, since uncerti-fied teachers may still be qualified and capable. For example, Kane, Rockoff, and Staiger (2007)—ex-amining high- and low-perform-
ing teachers as defined by their students’ outcomes in grades 3–8 in New York City—recently found no difference in teaching quality between tradi-tionally certified teachers and alternatively certi-fied teachers, such as New York City’s Teaching Fellows and Teach for America Corps members. However, other research has asserted that teacher credentials do indeed measure teacher quality (Goldhaber & Brewer, 1996).
Having a state “authorize” a teacher to teach a certain subject may not be a universally accept-able measure of teacher quality, but researchers do agree on the key relationship between effective teachers and student achievement (see, for ex-ample, Sanders & Rivers, 1996). So it is important to find proxies for teacher quality and to examine how these proxies are distributed among differ-ent schools. In the current No Child Left Behind policy environment the distribution of teacher quality—as measured by credentials, education, and experience—continues to be an important topic to study. Moreover, one could infer that districts value these attributes, since salary scales still often tie teacher compensation to certification, educational preparation, and experience.
Whatever the measure of teacher quality, quali-fied teachers historically have not been equally distributed among schools in the United States. Previous studies have found that students most in need—those from the most disadvantaged communities—are often taught by the least quali-fied teachers (Darling-Hammond, 1987; Oakes, Ormseth, Bell, & Camp, 1990). The National Center for Education Statistics (Ingersoll, 1996) examined the proportion and distribution of out-of-field teaching in the United States, based on the Schools and Staffing Survey from the 1990/91 school year. Ingersoll found that schools with high percentages of low-income students had higher proportions of out-of-field teaching (defined in that study as teaching by someone who does not have at least a minor in the field taught) than did the schools with lower percentages of low-income students, but there was not as clear a pattern for schools with predominantly minority populations. In addition, the report found higher proportions of out-of-field teaching in middle schools than in high schools.
More recently, the Public Policy Institute of California looked at variations in school resources among California schools (Betts, Rueben, & Danenberg, 2000). The report, using data from the California Basic Educational Data System for the 1997/98 school year, found large variations in teacher education and experience and in the percentages of teachers with full credentials. More experienced teachers were also typically more educated, so that schools with the highest concen-trations of low-income students had the least ex-perienced and least educated teachers. In addition, urban schools tended to have teachers with much less experience: teachers with master’s degrees or higher were most common in suburban schools, followed by urban schools.
This study examines several of the same re-sources as that earlier report (Betts, Rueben, & Danenberg, 2000), but it uses data for the 2005/06 school year. In addition to looking at some of the same resources and using an up-to-date version of the same database, this study shares many
This report builds on
previous research
studies to present up-
to-date information
on the distribution of
teaching resources
across middle and high
schools in California

The diSTribuTion of Teacher qualiTy 7
methodological characteristics with the earlier study. Both are focused at the school level, rather than at the student level, even though all results in this study are weighted by the number of stu-dents at each school. Analyses of student, class, and teacher characteristics in both reports are weighted predominantly by enrollment. However, the earlier study considered all K–12 students in California, whereas this report considers only middle and high school students. In addition, the earlier study also included multivariate regression results on student outcomes, whereas this report simply presents bivariate statistics and does not at-tempt to draw conclusions about the impact of the observed resource differences on students.
In another recent report, the Education Trust (Peske & Haycock, 2006) described large gaps in the percentages of “highly qualified” teachers (as defined by No Child Left Behind) in middle and high schools in Ohio between schools with the highest and lowest percentages of low-income stu-dents, as well as large differences in the percent-ages of teachers who failed the teacher licensure exams in Chicago’s schools with the highest and lowest percentages of low-income students. In ad-dition, the authors reported a large gap in Illinois between schools with the highest and lowest mi-nority enrollments on the teacher quality index—a measure developed by the state to assess various attributes tied to teacher quality. A separate Edu-cation Trust report (Education Trust–West, 2005) measured the unequal distribution of teachers in California by examining salary differences within a district. While this report does not examine the variability of teacher salaries, Education Trust’s finding that high-poverty and high-minority schools have remarkably lower teacher salaries is yet another indication of an unequal distribution of teacher quality in California.
More recently, a report by the Center for the Fu-ture of Teaching and Learning (Guha et al., 2006) addressed the distribution of qualified teachers throughout the state. The authors found that the total number of “underprepared” teachers (teach-ers who have not completed a teacher preparation
program and attained a preliminary or profes-sional credential) has declined in California over the past five years but that low-income and minor-ity students were still the most likely to have an underprepared teacher in the 2005/06 school year. The findings also indicated that the schools with the lowest achievement outcomes were more likely to have underprepared teachers.
This report builds on these research studies and presents detailed information on the distribu-tion of teaching resources across middle and high schools in California, to determine whether dif-ferent measures of teacher qualifications show the same unequal distributions across schools serving students with varying educational needs. To gauge the distribution of qualified teachers throughout the state, it examines the distribution of out-of-field teaching, defined by state regulations as instruction by a teacher who is not authorized to teach the subject being taught. Previous reports have used other definitions of teacher quality, such as whether a teacher is fully credentialed, so this measure of out-of-field teaching may provide a dif-ferent assessment of the distribution of qualified teachers.
Because out-of-field teaching is only one part of the measure of teacher quality, this report also examines how more experienced teachers and teachers with advanced degrees are distributed among schools. These factors are not examined in the recent studies of resources in California middle and high schools. The report explores variations in these three measures of teacher quality (out-of-field teaching, teacher education, and teacher experience) across schools by poverty quartile; percentages of English language learn-ers, African American students, and Hispanic students; type of school (public or charter); and population density of the surrounding area. And it examines how these mea-sures differ across subject
students in middle
schools with the highest
concentrations of low-
income students were
more likely to be taught
by out-of-field teachers
in english, math, science,
and special education

8 The diSTribuTion of Teaching and learning reSourceS in california’S middle and high SchoolS
areas (English, foreign language, math, science, social science) and special education.
Out-of-field teaching
The measure of out-of-field teaching, defined here as instruction by a teacher who is not authorized by the state to teach the subject being taught, is intended to capture the degree to which students are receiving instruction from teachers who may
not have strong backgrounds in the subject and therefore may be less prepared to impart knowledge (see box 2 for key findings).
Poverty status. In the 2005/06 school year schools with the low-est percentages of low-income students had an average of about 8 percent fewer students receiving out-of-field instruction in English, math, and science (a medium-size gap) than did schools with
the highest percentages of low-income students. While foreign language, social science, and special education all had small gaps, the likelihood of out-of-field teaching increased as the concentra-tion of low-income students increased (figure 1). The percentage of students receiving out-of-field instruction was especially high in science classes in schools with the highest concentrations of low-income students—62.1 percent.
Although the percentage of students taught by out-of-field special education teachers in middle schools was lower than for the core subjects, schools with the highest concentrations of low-income students still had a higher percentage of students taught by out-of-field special education teachers than did schools with the lowest concen-trations of low-income students, a small gap of 3.2 percentage points (see figure 1). But these numbers reflect only out-of-field teaching. When looking at special education by underprepared teachers (teachers who have not yet completed a teacher preparation program), others recently found the numbers to be much higher for special education
box 2
Key findings for out-of-field teaching
Students in schools with the highest concentra-•tions of low-income students or the highest concentrations of English language learners had a greater probability of receiving instruction from out-of-field teachers, especially in English, math, science, and special education.
Science courses had the highest percentage of •out-of-field teaching across all poverty quartiles. English courses showed, on average, a higher per-centage of out-of-field teaching than math.
High schools, almost across the board, showed •less out-of-field teaching than did middle schools, but the patterns for poverty were similar to those shown for middle schools.
High school courses that satisfied the UC and CSU •admission requirements had lower rates of out-of-field teaching than did all courses combined.
in both middle and
high schools students
in schools with the
highest concentration
of low-income students
were more likely to be
taught by out-of-field
teachers than were
students attending
the schools with the
lowest concentration
0 20 40 60 80 100
4th3rd
2nd1st
4th3rd
2nd1st
4th3rd
2nd1st
4th3rd
2nd1st
4th3rd
2nd1st
4th3rd
2nd1st
Percent
Quartile
Specialeducation
Socialscience
Science
Math
Foreignlanguage
English
9.28.1
6.86.0
39.236.5
37.939.2
62.159.2
55.553.7
41.738.6
37.733.6
26.331.2
38.927.6
48.744.043.7
40.5
figure 1
Percentage of students taught by out-of-field teachers, middle school, by subject and poverty quartile, 2005/06
Note: The first quartile has the lowest percentage of low-income students, and
the fourth has the highest.
Source: Authors’ analysis based on data for 2005/06 from the California Basic
Education Data System and other databases described in the appendix.

The diSTribuTion of Teacher qualiTy 9
than for the other subjects (Guha et al., 2006), and there was a much higher percentage of under-prepared special education teachers in schools with the highest percentages of minority students than in schools with the lowest percentages of minority students.
The average percentage of students receiving out-of-field teaching in math classes in 2005/06 was 38.3 percent in middle schools but only 12.1 per-cent in high schools, a medium-size gap. In middle school English classes the average was 44.4 per-cent, compared with only 12.6 percent in high school English classes.
The average percentage of high school students in classes with out-of-field teachers was lower in schools in the lowest poverty quartile than in schools in the highest poverty quartile for all subjects (figure 2), with medium-size gaps of 8.3 percentage points in English and 6.1 percentage points in special education. As in middle schools the percentage of out-of-field teaching in special education was lower overall than for other sub-jects, but a medium-size gap between the first and fourth quartiles was still evident.
University of California– and California State University–eligible courses. The results for the high school courses that met the UC and CSU systems’ admissions requirements (the “a-g” requirements) were similar to those for all high school courses, with one important difference. While the pattern of unequal distribution by poverty quartile was still evident in English and science, the average percentage of students exposed to out-of-field teaching in UC- and CSU-eligible courses (as op-posed to all courses) was lower across all quartiles and all subjects (figure 3).
English language learner status. The distribution of out-of-field teaching by concentration of English language learners showed similar results to the distribution by poverty level. Schools with higher concentrations of English language learners had higher levels of out-of-field teaching in English, math, and science in both middle and high schools.
0 20 40 60 80 100
4th3rd
2nd1st
4th3rd
2nd1st
4th3rd
2nd1st
4th3rd
2nd1st
4th3rd
2nd1st
4th3rd
2nd1st
Percent
Quartile
Specialeducation
Socialscience
Science
Math
Foreignlanguage
English
9.35.65.6
3.2
11.19.89.810.4
44.440.1
39.740.0
13.211.5
10.69.9
8.58.99.0
7.2
17.711.6
9.59.4
figure 2
Percentage of students taught by out-of-field teachers, high school, by subject and poverty quartile, 2005/06
Note: The first quartile has the lowest percentage of low-income students, and
the fourth has the highest.
Source: Authors’ analysis based on data for 2005/06 from the California Basic
Education Data System and other databases described in the appendix.
0 20 40 60 80 100
4th3rd
2nd1st
4th3rd
2nd1st
4th3rd
2nd1st
4th3rd
2nd1st
4th3rd
2nd1st
Percent
Quartile
Socialscience
Science
Math
Foreignlanguage
English
9.29.59.3
8.6
42.138.5
37.837.2
6.64.5
6.04.6
8.58.99.0
7.2
4.73.43.73.2
figure 3
Percentage of students taught by out-of-field teachers in University of California– and California State University–eligible classes, high school, by subject and poverty quartile, 2005/06
Note: The first quartile has the lowest percentage of low-income students, and
the fourth has the highest.
Source: Authors’ analysis based on data for 2005/06 from the California Basic
Education Data System and other databases described in the appendix.

10 The diSTribuTion of Teaching and learning reSourceS in california’S middle and high SchoolS
For middle schools the results for English, math, and science classes produced a fairly consistent picture. For the most part, a higher percentage of students received out-of-field teaching in schools with higher concentrations of Eng-lish language learners (figure 4).
The highest overall proportion of students receiving out-of-field instruction in middle schools was, again, in science classes in schools with the highest concentrations of English language learners (62.0 per-
cent). Special education students in middle schools with the highest concentrations of English language learners had a higher percentage of out-of-field teaching (9.8 percent) than did special education students in middle schools with the lowest concen-trations of English language learners (5.3 percent).
The patterns in high school were less clear. A gap was seen in high school special education
classes, in which the schools with the lowest English language learner concentrations had lower percentages of students receiving out-of-field teaching than those with the highest English language learner concentrations (figure 5). But in other subjects, such as foreign language, the gap was reversed: the schools with the lowest English language learner concentrations had a higher per-centage of students receiving out-of-field instruc-tion than the schools with the highest English language learner concentrations.
The schools with the highest English language learner concentrations had higher percentages of students receiving out-of-field instruction in both English (14.8 percent) and science (42.4 percent) than did the schools with the lowest English lan-guage learner concentrations. Again, the subject with the highest average percentage of out-of-field teaching across high schools was science.
For many subjects the percentage of out-of-field teaching tended to increase from the second to the third quartile and from the third to the
0 20 40 60 80 100
4th3rd
2nd1st
4th3rd
2nd1st
4th3rd
2nd1st
4th3rd
2nd1st
4th3rd
2nd1st
4th3rd
2nd1st
Percent
Quartile
Specialeducation
Socialscience
Science
Math
Foreignlanguage
English
9.88.8
6.65.3
41.635.636.0
39.4
62.057.3
55.955.8
41.938.4
35.237.8
28.633.8
35.126.4
49.645.6
40.442.7
figure 4
Percentage of students taught by out-of-field teachers, middle school, by subject and English language learner quartile, 2005/06
Note: The first quartile has the lowest percentage of English language learner
students, and the fourth has the highest.
Source: Authors’ analysis based on data for 2005/06 from the California Basic
Education Data System and other databases described in the appendix.
0 20 40 60 80 100
4th3rd
2nd1st
4th3rd
2nd1st
4th3rd
2nd1st
4th3rd
2nd1st
4th3rd
2nd1st
4th3rd
2nd1st
Percent
Quartile
Specialeducation
Socialscience
Science
Math
Foreignlanguage
English
8.45.8
3.93.4
9.08.0
9.113.4
42.442.4
37.941.1
10.79.69.6
16.5
5.67.58.1
15.6
14.810.5
8.614.3
figure 5
Percentage of students taught by out-of-field teachers, high school, by subject and English language learner quartile, 2005/06
Note: The first quartile has the lowest percentage of English language learner
students, and the fourth has the highest.
Source: Authors’ analysis based on data for 2005/06 from the California Basic
Education Data System and other databases described in the appendix.
special education
students in middle
schools with the
highest concentrations
of english language
learners had a higher
percentage of out-of-
field teaching than
did special education
students in middle
schools with the lowest
concentrations of english
language learners

The diSTribuTion of Teacher qualiTy 11
fourth quartile, but the quartile with the lowest concentration of English language learners often had a higher percentage of out-of-field teaching (see figures 4 and 5). Generally, schools with high concentrations of low-income students can have low proportions of English language learners, and schools with high proportions of English language learners do not necessarily have high concentra-tions of low-income students. Moreover, schools with high concentrations of low-income students have more out-of-field teaching regardless of varia-tion in percentage of English language learners.
For high school English classes, students in schools with low percentages of English language learners and high percentages of low-income students were the most likely to face out-of-field instruction in English, even more likely than students in schools with high concentrations of both English language learners and low-income students (table 2). This result was seen for other subjects as well.
University of California– and California State University–eligible courses. The results were differ-ent for courses that met the UC and CSU systems’ “a-g” requirements. As with poverty status, the pro-portion of students receiving out-of-field teaching was lower across the board for UC- and CSU-eligible courses than for all courses. But for the majority of courses the pattern was opposite the patterns seen for all courses. Schools with the lowest proportions of English language learners had the highest per-centages of students taught by out-of-field teachers,
and schools with the highest proportions of English language learners had the lowest percentages (fig-ure 6). The only exception was science, which had the highest percentages of out-of-field teaching. Un-like the other UC- and CSU-eligible courses, science classes had the highest percentages of students ex-periencing out-of-field teaching in schools with the highest concentrations of English language learners,
0 20 40 60 80 100
4th3rd
2nd1st
4th3rd
2nd1st
4th3rd
2nd1st
4th3rd
2nd1st
4th3rd
2nd1st
Percent
Quartile
Socialscience
Science
Math
Foreignlanguage
English
8.18.58.8
11.0
41.240.3
36.437.9
4.65.55.2
7.4
5.67.58.1
15.6
3.33.1
4.35.1
figure 6
Percentage of students taught by out-of-field teachers, University of California– and California State University–eligible classes, high school, by subject and English language learner quartile, 2005/06
Note: The first quartile has the lowest percentage of English language learner
students, and the fourth has the highest.
Source: Authors’ analysis based on data for 2005/06 from the California Basic
Education Data System and other databases described in the appendix.
Table 2
Percentage of out-of-field teaching by poverty quartile and percentage of English language learners for high school English, 2005/06
poverty quartileenglish language learner quartile 1
english language learner quartile 2
english language learner quartile 3
english language learner quartile 4
overallaverage
first 10.6 7.4 11.4 7.8 9.4
Second 11.3 7.3 11.1 6.7 9.5
Third 22.8 11.2 8.9 12.5 11.6
fourth 30.2 10.6 11.4 16.8 17.7
overall average 14.3 8.6 10.5 14.8 12.6
Note: The first quartile has the lowest percentage of low-income or English language learner students, and the fourth quartile has the highest.
Source: Authors’ analysis based on data for 2005/06 from the California Basic Education Data System and other databases described in the appendix.

12 The diSTribuTion of Teaching and learning reSourceS in california’S middle and high SchoolS
with 41.2 percent of students in the fourth quartile receiving out-of-field instruction, compared with 37.9 percent of students in the first quartile. This surprising pattern may be due in part to the fact that schools with the fewest English lan-guage learners may still have high concentrations of poverty.
Minority status. For schools with different con-centrations of Hispanic and African American stu-dents the patterns were not as clear as for schools in the poverty and English language learner analyses, but there was some evidence of unequal distribution.
For middle schools clear patterns emerged for English, math, and science classes for Hispanic students. In most subjects middle schools serv-ing higher percentages of Hispanic students had higher percentages of out-of-field instruction than schools serving lower percentages of Hispanic stu-dents, with small gaps in every subject (figure 7).
For example, for math in the 2005/06 school year there was a 4.8 percentage point gap between the schools with the fewest and those with the most Hispanic students. The average percentage of stu-dents receiving out-of-field instruction in science was, again, higher than in any other subject.
The patterns for African American students in middle schools were not as clear, but patterns emerged in some subjects, revealing that the distribution of out-of-field teachers for disadvan-taged populations is not always either predictable or unequal.
Most high school subjects did not show a clear pat-tern by race or ethnicity, and the gaps between the first and fourth quartiles were never large. Indeed, the distribution was actually reversed for foreign language and math, with small gaps showing that schools with higher proportions of Hispanics have lower rates of out-of-field teaching. For example, in schools with the lowest concentrations of Hispanic
students, 12.7 percent of students received out-of-field teaching in math, compared with 10.8 percent in schools with the highest proportions of His-panic students, a small gap (figure 8).
University of California– and California State University–eligible courses. For high school courses meeting the UC and CSU “a-g” requirements, there were lower percentages of students in high-minority schools taught by out-of-field teachers across all quartiles than for all courses (the same pattern as in the poverty analysis).
Population density. The distribution of out-of-field teaching across rural, suburban, and urban com-munities (as measured by population density) was analyzed. In almost every subject—English, math, social science, and foreign language—at both the middle and high school levels, rural schools had the highest percentage of students receiving out-of-field teaching (figure 9).
The relatively high proportion of out-of-field teach-ing in rural schools likely reflects the difficulties
0 20 40 60 80 100
4th3rd
2nd1st
4th3rd
2nd1st
4th3rd
2nd1st
4th3rd
2nd1st
4th3rd
2nd1st
4th3rd
2nd1st
Percent
Quartile
Specialeducation
Socialscience
Science
Math
Foreignlanguage
English
9.89.7
7.33.8
39.437.6
36.439.3
60.059.8
55.755.5
40.539.8
37.135.7
29.833.5
38.624.3
48.045.3
42.142.7
figure 7
Percentage of students taught by out-of-field teachers, middle school, by subject and Hispanic student quartile, 2005/06
Note: The first quartile has the lowest percentage of Hispanic students, and the
fourth has the highest.
Source: Authors’ analysis based on data for 2005/06 from the California Basic
Education Data System and other databases described in the appendix.
Middle schools with the
highest concentrations
of hispanic students
had higher levels of
out-of-field teaching in
most subjects than did
middle schools with the
lowest concentrations

The diSTribuTion of Teacher qualiTy 13
that rural communities have in recruiting quali-fied personnel in almost any specialized occupa-tion. But there was one exception, particularly sur-prising given the common shortages of certified
special education teachers (Fideler, Foster, & Schwartz, 2000; AEL, 2003). In both middle and high schools rural schools had the lowest percent-ages of special education students receiving out-of-field teaching.
Also surprising is that suburban middle and high schools sometimes had higher percentages of students taught by out-of-field teachers than did urban schools. This difference was large in middle school foreign language and in high school math and social science.
University of California– and California State University–eligible courses. For courses that satisfy UC and CSU requirements the averages for out-of-field teaching were, again, always lower than for all classes, but the patterns were similar in all subjects except science. Rural schools had the highest percentages of students receiving out-of-field teaching in UC- and CSU-eligible courses. But in science suburban schools had the highest percentages of out-of-field teaching in UC- and CSU-eligible classes.
Charter schools and traditional public schools. In every subject in both middle and high schools the percentage of students receiving out-of-field instruc-tion was higher in charter schools than in traditional public schools (figure 10). The largest gaps were in middle school math and science. For example, students in science classes in charter schools experi-enced 23.9 percentage points more out-of-field teach-ing on average than did students in public schools. Considering that charter schools were created to allow more freedom at the school level and that they may be less focused on teacher certification, this finding is not necessarily surprising.
University of California– and California State University–eligible courses. For high school UC- and CSU-eligible courses the percentages of stu-dents receiving out-of-field teaching were higher in
0 20 40 60 80 100
4th3rd
2nd1st
4th3rd
2nd1st
4th3rd
2nd1st
4th3rd
2nd1st
4th3rd
2nd1st
4th3rd
2nd1st
Percent
Quartile
Specialeducation
Socialscience
Science
Math
Foreignlanguage
English
7.07.4
4.03.4
10.89.08.8
10.6
44.041.7
39.738.5
10.811.211.4
12.7
6.67.5
9.012.6
14.611.9
10.311.2
figure 8
Percentage of students taught by out-of-field teachers, high school, by subject and Hispanic student quartile, 2005/06
Note: The first quartile has the lowest percentage of Hispanic students, and the
fourth has the highest.
Source: Authors’ analysis based on data for 2005/06 from the California Basic
Education Data System and other databases described in the appendix.
0 20 40 60 80 100
RuralSuburban
Urban
RuralSuburban
Urban
RuralSuburban
Urban
RuralSuburban
Urban
RuralSuburban
Urban
RuralSuburban
Urban
Percent
Specialeducation
Socialscience
Science
Math
Foreignlanguage
English
2.74.4
6.4
19.77.47.0
43.339.640.7
21.29.28.9
22.66.16.3
21.39.1
10.5
figure 9
Percentage of students taught by out-of-field teachers, high school, by subject and population density, 2005/06
Source: Authors’ analysis based on data for 2005/06 from the California Basic
Education Data System and other databases described in the appendix.
in every subject in
both middle and high
schools the percentage
of students receiving
out-of-field instruction
was higher in charter
schools than in
traditional public schools

14 The diSTribuTion of Teaching and learning reSourceS in california’S middle and high SchoolS
charter schools than in traditional public schools. UC- and CSU-eligible courses in both charter schools and public schools had lower percentages of out-of-field teaching than did other courses.
Teacher education
Another gauge of teacher quality is amount of teacher education. A higher level of education may mean that a teacher has had more exposure to the best practices and new methods, whether through a longer course of study or through returning to school.
Previous research is mixed on using teacher education as a gauge for quality. Some studies have found that advanced degrees are correlated with higher student achievement, while others indicate the opposite (Greenwald, Hedges, & Laine, 1996; Hanushek, 1986). So while measuring teacher quality by whether a teacher holds an advanced degree is not universally accepted as the most effective measure of teacher quality, it is one gauge of teacher quality. To assess the distribution of teachers with advanced degrees among schools throughout California, the report analyzed the
percentages of students taught by teachers with master’s or doctoral degrees (box 3 summarizes the key findings).
Poverty status. The general patterns across poverty quartiles were similar for middle and high schools. At both levels lower percentages of students in the higher poverty quartiles were taught by teachers with advanced degrees. In middle schools the gap between the first and fourth poverty quartiles ranged from a high of 18 percentage points for special education to a low of 3.9 percentage points for foreign language (figure 11). The pattern was slightly different for foreign language, but for English, math, science, and social science, it was around 10 percentage points. The gap was large for special education, small for foreign language, and medium-size for all other subjects.
In high schools the pattern was similar (figure 12). Special education again had the biggest gap between the first and fourth poverty quartiles, at 16.1 percentage points, and science had the smallest gap, at 5.7 percentage points. The gaps in English, foreign language, math, and social science were again about 10 percentage points. The gaps were large for foreign language, social science, and special education and medium-size for the other subjects.
The Public Policy Institute of California’s 2000 report, with a focus similar to this study’s, found a stronger link between student poverty and teach-ers with lower education levels (a bachelor’s degree at most). It also found that schools with fewer
0 20 40 60 80 100
Charter
Public
Charter
Public
Charter
Public
Charter
Public
Charter
Public
Charter
Public
Percent
Specialeducation
Socialscience
Science
Math
Foreignlanguage
English
19.6
7.5
45.5
38.0
73.3
57.3
61.3
37.4
33.1
31.1
51.0
44.2
figure 10
Percentage of students taught by out-of-field teachers, middle school, by subject and school type, 2005/06
Source: Authors’ analysis based on data for 2005/06 from the California Basic
Education Data System and other databases described in the appendix.
box 3
Key findings on teacher education
Schools with the highest percentages of low-•income students had the lowest percentages of stu-dents taught by teachers with advanced degrees—for all subjects in both middle and high schools.
Students in rural schools were less likely to be •taught by teachers with advanced degrees than students in suburban and urban schools.

The disTribuTion of Teacher qualiTy 15
low-income students had more teachers with mas-ter’s degrees or higher. In high schools the median
percentage of teachers with master’s degrees or higher in the fourth poverty quintile was 36 per-cent, compared with 43 percent in the first poverty quintile (Betts, Rueben, & Danenberg, 2000).
English language learner status. The patterns for the percentage of students taught by teachers with advanced degrees in schools with different concentrations of English language learners varied by subject. For the most part, students in the quartiles with the lowest concentrations of English language learners were more likely to be taught by teachers with advanced degrees.
In middle schools only foreign language classes had a higher percentage of students taught by teachers with advanced degrees in schools with a higher con-centration of English language learners (third and fourth quartiles combined) than in schools with a lower concentration (first and second quartiles combined; figure 13). For all other subjects there were higher percentages of students taught by teach-ers with advanced degrees in the quartiles with fewer English language learners. Special education
0 20 40 60 80 100
4th3rd
2nd1st
4th3rd
2nd1st
4th3rd
2nd1st
4th3rd
2nd1st
4th3rd
2nd1st
4th3rd
2nd1st
Percent
Quartile
Specialeducation
Socialscience
Science
Math
Foreignlanguage
English
30.738.9
42.648.7
24.630.6
34.534.7
26.331.2
29.935.8
24.927.6
30.336.1
30.033.9
41.933.9
27.629.5
33.837.4
figure 11
Percentage of students taught by teacher with master’s or doctorate, middle school, by subject and poverty quartile, 2005/06
Note: The first quartile has the lowest percentage of low-income students, and
the fourth has the highest.
Source: Authors’ analysis based on data for 2005/06 from the California Basic
Education Data System and other databases described in the appendix.
0 20 40 60 80 100
4th3rd
2nd1st
4th3rd
2nd1st
4th3rd
2nd1st
4th3rd
2nd1st
4th3rd
2nd1st
4th3rd
2nd1st
Percent
Quartile
Specialeducation
Socialscience
Science
Math
Foreignlanguage
English
33.138.338.7
49.2
31.735.0
32.342.1
33.936.236.2
39.6
29.933.7
31.839.3
31.034.5
36.942.0
31.335.134.9
41.2
figure 12
Percentage of students taught by teacher with master’s or doctorate, high school, by subject and poverty quartile, 2005/06
Note: The first quartile has the lowest percentage of low-income students, and
the fourth has the highest.
Source: Authors’ analysis based on data for 2005/06 from the California Basic
Education Data System and other databases described in the appendix.
0 20 40 60 80 100
4th3rd
2nd1st
4th3rd
2nd1st
4th3rd
2nd1st
4th3rd
2nd1st
4th3rd
2nd1st
4th3rd
2nd1st
Percent
Quartile
Specialeducation
Socialscience
Science
Math
Foreignlanguage
English
32.537.7
44.144.3
28.029.1
33.932.4
31.628.9
31.930.9
27.526.8
31.532.0
38.738.8
35.733.7
29.528.8
35.633.3
figure 13
Percentage of students taught by teacher with master’s or doctorate, middle school, by subject and English language learner quartile, 2005/06
Note: The first quartile has the lowest percentage of English language learner
students, and the fourth has the highest.
Source: Authors’ analysis based on data for 2005/06 from the California Basic
Education Data System and other databases described in the appendix.

16 The diSTribuTion of Teaching and learning reSourceS in california’S middle and high SchoolS
had the biggest gap and science the smallest. Over-all, the differences were smaller and less consistent than those for the poverty quartiles; the special edu-cation gap was large, but the others were small.
In high schools the patterns were similar, except for foreign language classes. Unlike the distribution in middle schools, students in high school foreign language classes in schools with low concentrations of English language learners were more likely to be taught by teachers with advanced degrees (fig-ure 14). Special education and foreign language had medium-size gaps; all other gaps were small.
Minority status. The results of an analysis of schools by percentage of Hispanic students were very similar to the results of an analysis by per-centage of English language learners—not surpris-ing considering the high percentage of English language learners who are Hispanic.
In middle schools foreign language and science were again the only subjects with a higher percentage of students taught by teachers with advanced degrees
in schools with higher concentrations of Hispanic students than in schools with lower concentra-tions of Hispanic students (figure 15). All other subjects had higher percentages of students taught by teachers with advanced degrees in the quartiles with lower percentages of Hispanic students. Special education again had the biggest gap and science the smallest. All gaps were small or medium-size.
In high school the gaps were somewhat narrower. In percentage of students taught by teachers with advanced degrees, special education still showed the largest gap between the quartile with the low-est percentage of Hispanic students (46.0 percent) and the quartile with the highest percentage of Hispanic students (33.9 percent) (figure 16). This gap was the only one classified as large. Foreign language had a medium-size gap between the quartiles with the lowest and highest percentages of Hispanic students. In English, science, and social science the gaps were small.
When middle schools were analyzed separately by percentage of African American students, no clear
0 20 40 60 80 100
4th3rd
2nd1st
4th3rd
2nd1st
4th3rd
2nd1st
4th3rd
2nd1st
4th3rd
2nd1st
4th3rd
2nd1st
Percent
Quartile
Specialeducation
Socialscience
Science
Math
Foreignlanguage
English
33.437.3
45.242.8
32.837.0
38.132.6
34.337.4
40.433.9
30.735.5
36.832.0
32.636.4
38.138.4
33.134.7
38.335.3
figure 14
Percentage of students taught by teacher with master’s or doctorate, high school, by subject and English language learner quartile, 2005/06
Note: The first quartile has the lowest percentage of English language learner
students, and the fourth has the highest.
Source: Authors’ analysis based on data for 2005/06 from the California Basic
Education Data System and other databases described in the appendix.
0 20 40 60 80 100
4th3rd
2nd1st
4th3rd
2nd1st
4th3rd
2nd1st
4th3rd
2nd1st
4th3rd
2nd1st
4th3rd
2nd1st
Percent
Quartile
Specialeducation
Socialscience
Science
Math
Foreignlanguage
English
33.039.5
42.743.3
29.729.6
31.832.6
31.529.4
31.031.4
28.528.2
29.531.9
39.137.9
37.133.1
30.530.5
32.034.3
figure 15
Percentage of students taught by teacher with master’s or doctorate, middle school, by subject and Hispanic student quartile, 2005/06
Note: The first quartile has the lowest percentage of Hispanic students, and the
fourth has the highest.
Source: Authors’ analysis based on data for 2005/06 from the California Basic
Education Data System and other databases described in the appendix.

The diSTribuTion of Teacher qualiTy 17
patterns were found across or within subjects. The high school analysis did not yield striking results either, except in special education, which averaged a notably higher proportion of students learning from teachers with advanced degrees in the schools with the fewest African Americans (figure 17). Conversely, the average percentage of high school students taught by social science teachers with advanced degrees was lowest in the schools with the fewest African American students. The gaps for special education and social science were medium-size, while those for the other subjects were small.
Population density. The differences between urban and suburban schools were not large for either middle schools or high schools (figures 18 and 19). For most subjects in middle schools more students in suburban schools than in urban schools were taught by teachers with advanced degrees, but this pattern was reversed in high schools. More notice-able, though, is that at both levels there were lower percentages of students taught by teachers with ad-vanced degrees in rural schools, especially in social science. High schools showed a large gap between
urban and rural schools, with 21.4 percent of rural students taught by teachers with advanced degrees, compared with 38.5 percent of urban students and 36.2 percent of suburban students. The pattern was less pronounced at the middle school level, with a medium-size gap between urban and rural schools: 20.2 percent of rural students were receiving instruction from teachers with advanced degrees, compared with 30.1 percent of urban students and 33.2 percent of suburban students.
Charter schools and traditional public schools. In some subjects higher percentages of students in charter schools than in traditional public schools were taught by teachers with advanced degrees, and in others the opposite was true. For the most part the gaps were small or medium-size. But in middle schools there was a large gap between the two types of schools for
0 20 40 60 80 100
4th3rd
2nd1st
4th3rd
2nd1st
4th3rd
2nd1st
4th3rd
2nd1st
4th3rd
2nd1st
4th3rd
2nd1st
Percent
Quartile
Specialeducation
Socialscience
Science
Math
Foreignlanguage
English
33.937.0
41.446.0
35.236.3
34.335.1
36.136.7
38.235.2
32.933.1
36.732.3
32.735.736.2
40.8
33.736.4
34.836.5
figure 16
Percentage of students taught by teacher with master’s or doctorate, high school, by subject and Hispanic student quartile, 2005/06
Note: The first quartile has the lowest percentage of Hispanic students, and the
fourth has the highest.
Source: Authors’ analysis based on data for 2005/06 from the California Basic
Education Data System and other databases described in the appendix.
0 20 40 60 80 100
4th3rd
2nd1st
4th3rd
2nd1st
4th3rd
2nd1st
4th3rd
2nd1st
4th3rd
2nd1st
4th3rd
2nd1st
Percent
Quartile
Specialeducation
Socialscience
Science
Math
Foreignlanguage
English
35.439.440.3
41.9
37.736.4
38.030.0
36.139.3
38.233.8
35.033.7
36.830.4
34.937.737.6
35.3
35.934.8
37.933.0
figure 17
Percentage of students taught by teacher with master’s or doctorate, high school, by subject and African American student quartile, 2005/06
Note: The first quartile has the lowest percentage of African American students,
and the fourth has the highest.
Source: Authors’ analysis based on data for 2005/06 from the California Basic
Education Data System and other databases described in the appendix.
for most subjects in
middle and high schools
urban schools had the
highest percentages
of students taught by
teachers with advanced
degrees, followed by
suburban schools and
then rural schools
18 The diSTribuTion of Teaching and learning reSourceS in california’S middle and high SchoolS
special education: 39.8 percent of traditional pub-lic school special education students were taught by teachers with advanced degrees, compared with only 18.3 percent of charter school special educa-tion students (figure 20).
Teacher experience
Yet another measure of teacher quality is teacher experience. Studies have reported that the posi-tive effects of teachers on their students increase with years of experience (Allgood & Rice, 2002; Hanushek, 1986). Research also has indicated that the distribution of experienced teachers is not equal. One national study found that children in schools with the highest poverty concentrations have a “novice teacher” (three years of experience or less) twice as often as do children in schools with the lowest poverty concentrations (National Center for Education Statistics, 2000). The Educa-tion Trust (Peske & Haycock, 2006) also recently reported large gaps in Wisconsin in the percent-ages of novice (three years or less) and inexperi-enced (five years or less) teachers between schools with the highest and lowest concentrations of minority students and also between schools with highest and lowest concentrations of English language learners. An earlier study by the Public Policy Institute of California found that teachers with two years of experience or less were concen-trated in schools serving high-poverty populations and schools in urban areas (Betts, Rueben, &
0 20 40 60 80 100
RuralSuburban
Urban
RuralSuburban
Urban
RuralSuburban
Urban
RuralSuburban
Urban
RuralSuburban
Urban
RuralSuburban
Urban
Percent
Specialeducation
Socialscience
Science
Math
Foreignlanguage
English
41.041.5
38.1
20.233.2
30.1
24.331.731.3
20.931.6
29.2
29.235.1
38.0
23.632.8
32.0
figure 18
Percentage of students taught by teacher with master’s or doctorate, middle school, by population density, 2005/06
Source: Authors’ analysis based on data for 2005/06 from the California Basic
Education Data System and other databases described in the appendix.
0 20 40 60 80 100
RuralSuburban
Urban
RuralSuburban
Urban
RuralSuburban
Urban
RuralSuburban
Urban
RuralSuburban
Urban
RuralSuburban
Urban
Percent
Specialeducation
Socialscience
Science
Math
Foreignlanguage
English
36.740.6
39.7
21.436.2
38.5
29.437.837.8
27.634.634.8
32.236.3
39.3
29.635.4
37.9
figure 19
Percentage of students taught by teacher with master’s or doctorate, high school, by population density, 2005/06
Source: Authors’ analysis based on data for 2005/06 from the California Basic
Education Data System and other databases described in the appendix.
0 20 40 60 80 100
Charter
Public
Charter
Public
Charter
Public
Charter
Public
Charter
Public
Charter
Public
Percent
Specialeducation
Socialscience
Science
Math
Foreignlanguage
English
18.3
39.8
33.9
30.9
25.5
31.0
26.2
29.7
27.4
36.4
37.0
31.8
figure 20
Percentage of students taught by teacher with master’s or doctorate, middle school, by school type, 2005/06
Source: Authors’ analysis based on data for 2005/06 from the California Basic
Education Data System and other databases described in the appendix.

The diSTribuTion of Teacher qualiTy 19
Danenberg, 2000). This analysis looked at the av-erage number of years of experience teachers had across quartiles in all subjects (box 4 summarizes the key findings).
Poverty status. Teachers with more experience were more likely to be in schools with lower con-centrations of low-income students. For example, for math classes in middle schools the difference between schools with the highest concentrations of low-income students and those with the lowest was more than three years of experience. Students in the lowest poverty quartile schools had teach-ers with an average of 12.9 years of experience, while those in schools in the highest had teachers with an average of 9.3 years, a large difference (figure 21). Students in each successive poverty quartile, from lowest to highest, had teachers with fewer average years of experience, with experi-ence decreasing by at least one full year in each quartile. A similar pattern, but with only a medi-um-size difference, emerged for English classes.
The gap between schools with the highest and lowest concentrations of low-income students was less pronounced for high schools than for middle schools. In high schools students in the schools in the three lowest poverty quartiles had teach-ers with similar levels of experience. In math, English, and social science, students in schools in the second-lowest poverty quartile had teachers with the most experience. Students in the high-est poverty schools had teachers with the least
experience. For example, in social science students in the fourth poverty quartile had teachers who averaged 10.8 years of experience, compared with 12.9–13.5 years for teachers in the other three quartiles (figure 22).
English language learner status. Teachers were also generally less experienced in schools with higher percentages of English language learners. In middle schools the difference in experience by percentage of English language learners was most pronounced in math classes. Students in schools in the quartile with the lowest percentages of English language learners had teachers who averaged 12.8 years of experience, compared with 9.6 years for students in the quartile with the highest percent-ages, a large gap of more than three years.
In high schools the differ-ence in teacher experi-ence between schools with the lowest and highest concentrations of English language learners was less pronounced than
0 5 10 15
4th3rd
2nd1st
4th3rd
2nd1st
4th3rd
2nd1st
4th3rd
2nd1st
4th3rd
2nd1st
4th3rd
2nd1st
Years of teaching experience
Quartile
Specialeducation
Socialscience
Science
Math
Foreignlanguage
English
9.911.711.8
12.3
10.813.2
13.913.5
9.611.9
11.612.2
9.310.7
12.012.9
10.812.5
14.113.4
10.411.5
12.312.4
figure 21
Years of teaching experience, middle school, by subject and poverty quartile, 2005/06
Note: The first quartile has the lowest percentage of low-income students, and
the fourth has the highest.
Source: Authors’ analysis based on data for 2005/06 from the California Basic
Education Data System and other databases described in the appendix.
box 4
Key findings on teacher experience
Measured by the number of years of educational •service, teacher experience was higher in schools with lower percentages of low-income students; English language learners, Hispanic students, and African American students; and in schools in set-tings with lower population densities.
Teachers in charter schools were, on average, •much less experienced than teachers in traditional public schools.
Teachers with more
experience were
more likely to be in
schools with lower
concentrations of
low-income students

20 The diSTribuTion of Teaching and learning reSourceS in california’S middle and high SchoolS
in middle schools. For math the medium-size gap between the quartiles with the fewest and most English language learners was only 2.2 years. The students in schools in the second quartile had teachers who were slightly more experienced than those in the first: 12.5 years compared with 12.3 years (figure 23).
Minority status. Students in the middle schools with the largest concentrations of African Ameri-can and Hispanic students typically had the least experienced teachers. In middle schools the difference in teachers’ average years of experi-ence between the quartiles with the lowest and highest percentages of Hispanic students was 2.0 years for English (a medium-size gap) and 3.4 years for math (a large gap), with teachers in the first quartile again having more experience. Math teachers averaged 2.1 years less experience in schools with the highest concentrations of African American students than in schools with the lowest concentrations, a medium-size gap. One excep-tion was in foreign language classes. Teachers’ experience was similar across all quartiles, with 12.5 years of experience in schools in the second
quartile and 13.2 years in schools in the other three quartiles.
In high schools the patterns for students in schools with the highest concentrations of African Ameri-can students and Hispanic students were not that different from those in middle schools. Again, the gap was largest in math classes, with a large gap of 3.5 years for math teachers between schools in the quartiles with the lowest and highest percentages of Hispanic students. Other subjects followed a similar pattern, though with smaller differences in teacher experience.
Population density. Teachers in urban schools were the least experienced, those in suburban schools were in the middle, and those in rural schools were most experienced. In middle schools science teachers had the most variation in experience by population density, with 10.8 years of experience for urban teachers, 11.8 for suburban teachers, and 13.4 for rural teachers—a large gap of 2.6 years (the gaps for all other subjects were medium-size or small; figure 24). The patterns were the same in high schools, but there was generally less variation
0 5 10 15
4th3rd
2nd1st
4th3rd
2nd1st
4th3rd
2nd1st
4th3rd
2nd1st
4th3rd
2nd1st
4th3rd
2nd1st
Years of teaching experience
Quartile
Specialeducation
Socialscience
Science
Math
Foreignlanguage
English
10.411.4
13.213.4
10.812.9
13.512.9
10.011.4
12.912.9
9.711.5
12.912.8
11.412.813.0
13.3
9.711.3
12.311.8
figure 22
Years of teaching experience, high school, by subject and poverty quartile, 2005/06
Note: The first quartile has the lowest percentage of low-income students, and
the fourth has the highest.
Source: Authors’ analysis based on data for 2005/06 from the California Basic
Education Data System and other databases described in the appendix.
0 5 10 15
4th3rd
2nd1st
4th3rd
2nd1st
4th3rd
2nd1st
4th3rd
2nd1st
4th3rd
2nd1st
4th3rd
2nd1st
Years of teaching experience
Quartile
Specialeducation
Socialscience
Science
Math
Foreignlanguage
English
11.011.8
13.013.2
11.312.7
12.912.4
10.211.7
12.712.1
10.111.6
12.512.3
11.412.9
13.212.9
10.211.3
11.611.7
figure 23
Years of teaching experience, high school, by subject and English language learner quartile, 2005/06
Note: The first quartile had the lowest percentage of English language learner
students, and the fourth has the highest.
Source: Authors’ analysis based on data for 2005/06 from the California Basic
Education Data System and other databases described in the appendix.

average claSS Size 21
across categories. The experience for science teach-ers ranged from 11.5 years for urban teachers to 12.9 years for rural teachers—a medium-size gap.
Charter schools and traditional public schools. Teachers in charter schools were much less ex-perienced, on average, than those in traditional
public schools. In middle schools there was a large difference in teacher ex-perience between charter schools and traditional public schools in all subjects. The biggest gap was in social science: teachers in traditional public schools averaged 5.5 more years of experience than those in charter schools (figure 25). Special education teachers were the most similar across the two school types, with only a 2.6-year gap. In high schools the experience gap was even greater in most subjects.
AverAge ClAss size
Aside from the type of teacher a student has, an important factor in an effective educational environment is the number of students learning together in each classroom (box 5 summarizes the key findings on class size). The Tennessee Student/Teacher Achievement Ratio (STAR) experiment, one of the first randomized control trials to examine class size in education, found signifi-cant and positive effects for smaller classrooms (Finn & Achilles, 1999; Nye & Hedges, 1999). But more recent work by Milesi and Gamoran (2006) found no positive effect for reducing class size in kindergarten.
Class size has been the focus of much attention nationwide and in California. The Morgan-Hart Class Size Reduction Act of 1989 encourages
0 5 10 15
RuralSuburban
Urban
RuralSuburban
Urban
RuralSuburban
Urban
RuralSuburban
Urban
RuralSuburban
Urban
RuralSuburban
Urban
Years of teaching experience
Specialeducation
Socialscience
Science
Math
Foreignlanguage
English
12.711.9
10.9
14.513.5
12.3
13.411.8
10.8
13.011.5
11.1
11.913.8
12.6
12.512.2
11.4
figure 24
Years of teaching experience, middle school, by subject and population density, 2005/06
Source: Authors’ analysis based on data for 2005/06 from the California Basic
Education Data System and other databases described in the appendix.
0 5 10 15
Charter
Public
Charter
Public
Charter
Public
Charter
Public
Charter
Public
Charter
Public
Years of teaching experience
Specialeducation
Socialscience
Science
Math
Foreignlanguage
English
8.9
11.5
7.5
13.0
6.7
11.5
7.6
11.4
9.3
13.1
6.7
11.8
figure 25
Years of teaching experience, middle school, by subject and school type, 2005/06
Source: Authors’ analysis based on data for 2005/06 from the California Basic
Education Data System and other databases described in the appendix.box 5
Key findings on average class size
Few differences were found in average class size •for the various subjects across the different types of schools.
Average class sizes were smaller in suburban •schools than in urban schools, and smaller again in rural schools than in suburban schools.
Teachers in charter
schools were much
less experienced, on
average, than those in
traditional public schools

22 The diSTribuTion of Teaching and learning reSourceS in california’S middle and high SchoolS
districts to reduce class size in ninth-grade Eng-lish and in one other ninth-grade course required for graduation. The Class Size Reduction Act of 1996, focused solely on kindergarten through third grade, stirred up much debate in California about the usefulness of smaller class sizes. As a large proportion of the governor’s recent $2.9 bil-lion settlement with the teachers union is allocated to reducing class size again in California through the Quality Education Investment Act (SB 1133), a better understanding of the current distribution of class size in the state is important.
Previous work by the Public Policy Institute of California (Betts, Rueben, & Danenberg, 2000) that examined variations in school resources based on the proportions of disadvantaged popula-tions in California schools did not find a large dif-ference in average class size for the 1997/98 school year. This report finds similar results in California middle and high schools for 2005/06. The only clear difference in average class size was found, not surprisingly, among schools in settings with different population densities—urban, suburban, and rural (figure 26).
The average class sizes experienced by students in schools by poverty, English language learners, and minorities show small to no differences in average class size. The small differences are almost always due to slightly smaller classes in the schools with the lowest concentrations of poverty, English language learners, or minorities. For example, for high school English the schools with the low-est proportions of Hispanic students had almost two fewer students per class on average than did
schools with the highest propor-tions of Hispanic students (24.5 students and 26.2 students).
One clear pattern was the differ-ence in average class size across schools in urban, suburban, and rural communities. But the dif-ferences between urban and rural schools were never large. Urban schools had larger class sizes on
average than did suburban schools, and suburban schools had larger class sizes on average than did rural schools in all subjects except middle school special education and foreign language.
whAT sTudenTs Are sTudying
Another critical component of educational suc-cess in California is access to classes that prepare students for college. One way to assess whether different categories of students have equal access to educational resources is to examine the dis-tribution of rigorous classes and student course-taking. For example, higher enrollment in more challenging classes among one group of students may indicate that that group is better prepared for the future than another.
Admissions requirements for the UC and CSU systems include at least 15 year-long classes in a variety of subjects, at least 7 of them in the last two years of high school. For a class to meet the requirements, a school must submit an annual request to the University of California and have the course certified by the university (table 3). The California State University system uses the
Classes in urban schools
were larger on average
than those in suburban
schools, and classes
in suburban schools
were larger than
those in rural schools,
but the differences
were never large
0 10 20 30 40 50
RuralSuburban
Urban
RuralSuburban
Urban
RuralSuburban
Urban
RuralSuburban
Urban
RuralSuburban
Urban
RuralSuburban
Urban
Average class size
Specialeducation
Socialscience
Science
Math
Foreignlanguage
English
8.711.010.9
23.130.2
31.4
21.729.3
31.4
19.827.5
29.4
24.029.7
30.6
20.326.2
27.0
figure 26
Average class size, high school, by population density, 2005/06
Source: Authors’ analysis based on data for 2005/06 from the California Basic
Education Data System and other databases described in the appendix.

whaT STudenTS are STudying 23
University of California’s list of approved courses. The UC- and CSU-required coursework is designed to ensure that incoming students have “attained a body of general knowledge that will provide breadth and perspective to new, more advanced study” and have “attained essential critical think-ing and study skills.”4
A 2000 report by the Public Policy Institute of California examined variations in school resources among California schools and found, for the 1997/98 school year, that the median percentage of classes offered that met UC and CSU requirements ranged from about 50 percent for the two highest poverty quintiles to about 60 percent for the lowest poverty quintile (Betts, Rueben, & Danenberg, 2000). The study also reported that disadvantaged students received fewer resources in individual districts—not just in different districts across the state. Suburban schools were most likely to offer UC- and CSU-eligible classes, followed by urban and then rural schools.
The University of California All Campus Consor-tium on Research for Diversity and the University of California at Los Angeles Institute for Democ-racy, Education, and Access published a report (Oakes et al., 2006) that examined questions similar to those addressed here. Using data from
the 2004/05 school year, the report found that schools with high proportions of African Ameri-can and Hispanic students had lower numbers of UC- and CSU-eligible courses than schools with majority white or Asian students, leading to lower completion rates of UC and CSU requirements in high-minority schools.
This section builds on the work done by those studies (Betts, Rueben, & Danenberg, 2000; Oakes at al., 2006) by looking at the most cur-rent data available for the 2005/06 school year. It examines the course-taking patterns in differ-ent subjects and the distribution of enrollment in classes that meet UC and CSU requirements in different subjects (box 6 summarizes the key finding). Because very low percentages of students are enrolled in UC- and CSU-eligible courses in middle schools, this analysis consid-ers only high school students. Also excluded are foreign language classes (because almost all foreign language classes at the high school level are UC- and CSU- eligible) and special education classes (because no special education classes are UC- and CSU-eligible).
University of California– and California State University–eligible classes
Poverty status. In high schools, schools with higher concentrations of low-income students had fewer students enrolled in UC- and CSU-eligible classes in math, English, and social science. The biggest difference was in math: 44 percent of math students in schools with the lowest poverty con-centrations were in UC- and CSU-eligible classes, compared with only 25.5 percent in schools with the highest poverty concentrations—a large gap
Table 3
Admissions requirements for the University of California and California State University systems
Subject years required
history/social science 2
english 4
math 3, with 4 recommended
laboratory science 2, with 3 recommended
language other than english 2, with 3 recommended
visual and performing arts 1
college preparatory electives 1
Source: www.universityofcalifornia.edu/admissions/undergrad_adm/paths_to_adm/freshman/subject_reqs.html.
box 6
Key finding on eligible classes
Higher-poverty schools had lower percentages of •students enrolled in UC- and CSU-eligible classes in high schools, with math showing the biggest difference.

24 The diSTribuTion of Teaching and learning reSourceS in california’S middle and high SchoolS
(figure 27). In English the difference was only 3 percentage points (17.4 percent compared with 14.6 percent, a small gap). In social science the difference was 10 percentage points (25.5 percent compared with 15.1 percent, a medium-size gap).
English language learner status. Overall, the patterns of enrollment in UC- and CSU-eligible courses for schools with different percentages of English language learners were somewhat similar to those in the poverty analysis, with one notice-able difference. There were higher percentages
of students in eligible classes in the second English language learner quartile than in the first quartile for math, English, sci-ence, and social science classes (figure 28). For example, among math students 41.6 percent in schools in the second English language learner quartile were in math classes meeting UC and CSU requirements compared with 37.7 percent in the first quartile, a
3.9 percentage point gap. This pattern is similar to that for out-of-field teaching.
One possible explanation for this pattern is that, as previously mentioned, out-of-field teaching increased drastically with poverty for schools in the first English language learner quartile. Students in schools with low percentages of English language learners and high percentages of low-income students were very likely to face out-of-field instruction in English—even more likely than students in schools with high concentrations of English language learners and of low-income students. Similar results in this section also seem to imply that the interaction between poverty and English language learners can partially explain why the average enrollment in UC- and CSU-eli-gible classes is lower for the first English language learner quartile.
Minority status. The patterns for minority stu-dents’ enrollment in UC- and CSU-eligible courses were not clear. To some extent, there was higher enrollment in such courses in schools with lower
0 20 40 60 80 100
4th3rd
2nd1st
4th3rd
2nd1st
4th3rd
2nd1st
4th3rd
2nd1st
Percent
Quartile
Socialscience
Science
Math
English
15.118.1
21.625.5
71.971.3
72.873.5
25.529.7
37.444.0
14.614.615.7
17.4
figure 27
Percentage of students in University of California- and California State University-eligible classes, high school, by poverty quartile, 2005/06
Note: The first quartile has the lowest percentage of low-income students, and
the fourth has the highest.
Source: Authors’ analysis based on data for 2005/06 from the California Basic
Education Data System and other databases described in the appendix.
0 20 40 60 80 100
4th3rd
2nd1st
4th3rd
2nd1st
4th3rd
2nd1st
4th3rd
2nd1st
Percent
Quartile
Socialscience
Science
Math
English
16.020.2
23.721.4
73.474.6
73.368.5
26.932.9
41.637.7
14.216.0
17.815.7
figure 28
Percentage of students in University of California- and California State University-eligible classes, high school, by English language learner quartile, 2005/06
Note: The first quartile has the lowest percentage of English language learner
students, and the fourth has the highest.
Source: Authors’ analysis based on data for 2005/06 from the California Basic
Education Data System and other databases described in the appendix.
in high schools,
schools with higher
concentrations of
low-income students
had fewer students
enrolled in university of
California– and California
state university–eligible
classes in math, english,
and social science

whaT STudenTS are STudying 25
concentrations of Hispanic students, but the gap between quartiles was smaller than that between the lowest and second-lowest English language learner quartiles.
With Spanish-speaking students making up about 83 percent of California’s English language learner student population,5 it is not surprising that the results for Hispanic students are very similar to those for English language learners. But in math the lowest and second-lowest quartiles for Hispanic students follow the same pattern as the other quartiles (figure 29 shows this for high school), instead of being reversed as they are for English language learners. In the first quartile 42.7 percent of students are in UC- and CSU-eligible classes. This proportion drops for each quartile as the percentage of Hispanic students increases, down to 26.0 percent for the fourth quartile. The gap between the first and fourth quartiles is large.
In English the gap between the first and fourth quartiles of Hispanic students is slightly more than 2 percentage points, with fewer students in the fourth quartile taking UC- and CSU-eligible classes (14.4 percent compared with 16.7 percent, a small gap). At 17.1 percent the percentage in the second quartile of Hispanic students is slightly higher than the percentage in the first, but the overall pattern is one of fewer students taking classes meeting UC and CSU requirements in quartiles with more Hispanic students.
Social science follows the same general pattern, with 23.1 percent of students taking classes that meet UC and CSU requirements in schools in the first quartile of Hispanic students, just over 21 percent in the second and third quartiles, and only 15.8 percent in the fourth. The gap between the first and fourth quartiles of Hispanic students is small.
For schools with varying concentrations of African American students the differences between quartiles were smaller than for schools with varying concentrations of Hispanic
students—and the patterns were less distinct. In math the two quartiles with lower concentra-tions of African American students had higher percentages of students enrolled in UC- and CSU-eligible classes than the two quartiles with higher concentrations of African American stu-dents (34.4 percent and 38.5 percent, compared with 34.0 percent and 31.4 percent). In science, however, there was a small difference between the percentage of students enrolled in eligible classes in the quartile with the lowest percent-age of African American students and the percentages in the other quartiles: 69.5 percent for the first quartile, compared with between 73.6 percent and 74.2 percent for the other three quartiles (figure 30).
Population density. Rural high schools gener-ally had the fewest students in UC- and CSU-eligible classes, while urban schools generally had the most.
In both math and social science urban and subur-ban schools had similar percentages of students
0 20 40 60 80 100
4th3rd
2nd1st
4th3rd
2nd1st
4th3rd
2nd1st
4th3rd
2nd1st
Percent
Quartile
Socialscience
Science
Math
English
15.821.121.3
23.1
72.273.3
71.573.3
26.032.5
37.642.7
14.415.6
17.116.7
figure 29
Percentage of students in University of California– and California State University–eligible classes, high school, by Hispanic student quartile, 2005/06
Note: The first quartile has the lowest percentage of Hispanic students, and the
fourth has the highest.
Source: Authors’ analysis based on data for 2005/06 from the California Basic
Education Data System and other databases described in the appendix.

26 The diSTribuTion of Teaching and learning reSourceS in california’S middle and high SchoolS
In English, suburban schools were more like rural schools than like urban schools, and suburban and rural schools had lower percentages of students in UC- and CSU-eligible classes than did urban schools. Rural schools had 14.5 percent of their English students in eligible classes, suburban schools had almost the same (14.3 percent), and urban schools had 18.2 percent.
In science the percentage of students in suburban schools taking classes that met the requirements fell neatly between the percentages for rural and urban schools. Rural schools were at 63.3 per-cent, suburban schools at 71.2 percent, and urban schools at 76.6 percent. The gap between rural and urban schools was medium-size.
Charter schools and traditional public schools. In high schools across all subjects there were lower percentages of charter school students than public school students in UC- and CSU-eligible classes. The differences ranged from a medium-size gap of 12.7 percentage points fewer charter students in science classes to a small gap of 3.1 points fewer in English. In both types of schools science had the highest percentage of students in classes that
0 20 40 60 80 100
Charter
Public
Charter
Public
Charter
Public
Charter
Public
Percent
Socialscience
Science
Math
English
13.2
21.2
61.0
73.7
26.8
35.5
13.2
16.3
figure 32
Percentage of students in University of California– and California State University–eligible classes, high school, by school type, 2005/06
Source: Authors’ analysis based on data for 2005/06 from the California Basic
Education Data System and other databases described in the appendix.
in classes that met UC and CSU requirements (figure 31). Rural schools had fewer students in eligible classes in both subjects.
0 20 40 60 80 100
Rural
Suburban
Urban
Rural
Suburban
Urban
Rural
Suburban
Urban
Rural
Suburban
Urban
Percent
Socialscience
Science
Math
English
16.1
22.1
21.5
63.3
71.2
76.6
30.2
36.0
36.3
14.5
14.3
18.2
figure 31
Percentage of students in University of California- and California State University-eligible classes, high school, by population density, 2005/06
Source: Authors’ analysis based on data for 2005/06 from the California Basic
Education Data System and other databases described in the appendix.
0 20 40 60 80 100
4th3rd
2nd1st
4th3rd
2nd1st
4th3rd
2nd1st
4th3rd
2nd1st
Percent
Quartile
Socialscience
Science
Math
English
18.421.2
23.018.9
74.273.973.6
69.5
31.434.0
38.534.4
16.216.315.815.6
figure 30
Percentage of students in University of California– and California State University–eligible classes, high school, by African American student quartile, 2005/06
Note: The first quartile has the lowest percentage of African American students,
and the fourth has the highest.
Source: Authors’ analysis based on data for 2005/06 from the California Basic
Education Data System and other databases described in the appendix.

finding ouT why diSpariTieS perSiST 27
met the UC and CSU requirements: 73.7 percent for traditional public schools and 61.0 percent for charter schools (figure 32).
Course-taking patterns
The analysis also looked at the distribution of enrollment in classes in different subjects re-lated to college preparation or attendance. A heavier course load in math for the students in one quartile, for example, might indicate that students in that quartile are systematically given the opportunity, or encouraged, to take math instead of other courses less relevant to preparing for college (box 7 summarizes the key findings on course-taking).
Across poverty quartiles in middle schools math showed the clearest pattern. Students in schools with higher concentrations of low-income students averaged slightly heavier math course loads than students in schools with lower concentrations of low-income students. The range was from an aver-age of 0.95 class periods for students in the first poverty quartile to an average of 1.03 class periods for students in the fourth.
Conversely, the pattern for middle school science shows that students in schools with the lowest concentrations of low-income students were taking an average of 0.91 periods of science, compared with 0.80 periods for students in schools with the highest concentrations, with incrementally lower course loads in each quartile from lowest poverty to highest. In high schools English showed the
clearest pattern in the poverty analysis. Stu-dents in schools with the lowest concentrations of low-income students were taking an average of 1.03 periods of English, compared with 1.19 periods for students in schools with the highest concentrations.
finding OuT why dispAriTies persisT
Many of the findings in this report are not new. Many of the unequal patterns found in 2005/06 are similar to patterns that other researchers have found over the past 30 years. Out-of-field teach-ing is still distributed unequally—occurring less frequently in schools with the lowest proportions of disadvantaged students and English language learners. Teachers with the most experience con-tinue to teach at schools with the lowest concentra-tions of low-income students and English language learners. Enrollments in college-preparation courses that allow students to enter California’s state college and university systems are lowest in schools where poverty is highest. While it is not surprising that more experienced teachers gravi-tate to less disadvantaged schools, it is discourag-ing to see how little this trend has changed. De-spite an ongoing, overarching focus on educational success for all children, little change is evident in the distribution of these resources.
Within the general patterns of unequal distribu-tion of certain teaching resources, however, only limited differences associated with students’ race or ethnicity were observed. For example, in foreign language and social science classes the schools with the highest concentrations of African American students did not experience as drastic a difference in out-of-field instruction as other at-risk populations. Contrary to previous research that indicated much more unequal patterns for schools with high concentrations of minorities, this suggests that some progress may have been made on one front.
The persistent disparities in the distribution of teaching and learning resources should not
box 7
Key findings on course-taking
Overall, there were no clear differences in course •loads by subject across quartiles for the 2005/06 school year.
When a subject did show a clear pattern in course-•taking, the differences between quartiles were generally small.

28 The diSTribuTion of Teaching and learning reSourceS in california’S middle and high SchoolS
be ignored. Better answers are needed for why these patterns per-sist despite the expenditure of so much time, effort, and resources. Finding answers within the small differences in this report may sug-gest areas for further research. For
example, to what extent can district policies and teacher union contracts explain the relationship between teacher inexperience and schools with high concentrations of low-income students? Why is there more out-of-field teaching in schools with higher concentrations of low-income students? Why is there dramatically more out-of-field teach-ing in middle schools than in high schools? Are fewer students enrolling in the UC- and CSU-eligi-ble courses in schools with higher concentrations of low-income students because the courses are not offered, because students are not encouraged to enroll, or because students do not feel prepared to take these courses?
The answers to such questions can be found not in the datasets analyzed here, but in conversations with school, district, county, and state practi-tioners who know the realities of the education system. Through discussions with superintendents and other instructional leaders in the state, the underlying reasons behind these unequal dis-tributions might be uncovered, providing local and state policymakers with the information they need to begin to make changes. Teaching and learning resources can, ultimately, be more equally distributed—the next challenge is to figure out how.
An area of further research would involve apply-ing the standard behavioral models generally used by economists to explore the range of factors that affect the choices of school and district decision-makers. Next steps in this work should build on
discussions with administrators at the school and district levels and then proceed to develop-ing models that can help us explore the various relationships among state funding, local policies about resource allocation, and other regional characteristics that influence the labor market in school districts.
These additional pieces of research can help in ascertaining how much certain policies and behaviors might reduce the disparities that persist for students with the greatest needs.
nOTes
According to this definition, an out-of-field 1. teacher may or may not be fully credentialed but does not have state authorization to teach the subject he or she is currently teaching.
This report presents average percentages for 2. each quartile, but the story is more complex. Out-of-field teaching varies even within pov-erty quartiles. However, this analysis focuses primarily on the averages across quartiles.
The definition of a highly qualified teacher is 3. determined in part by each state, but the fol-lowing are requirements: a bachelor’s degree or higher in the subject taught, full teacher certification, and demonstrated knowledge in the subject taught.
From www.universityofcalifornia.edu/4. admissions/undergrad_adm/paths_to_adm/freshman/subject_reqs.html
California Department of Education, Califor-5. nia Basic Educational Data System (CBEDS) and Language Census Data Files (R30-LC).
The persistent disparities
in the distribution of
teaching and learning
resources should
not be ignored

appendix 29
Appendix MeThOdOlOgy
This appendix explains in further detail how the analyses in this report were performed and discusses the data sources used for the analyses. It also shows the number of schools in each quartile, population density group, and school type (see table A1 at the end of this appendix).
Teaching and learning resources
Out-of-field teaching. Teacher-level information was taken from the Professional Assignment Informa-tion Form (PAIF) data in the California Basic Edu-cational Data System (CBEDS) file for the 2005/06 school year. This staff characteristics file lists teachers by ID variable and County-District-School code and is publicly available for download from the California Department of Education web site (www.cde.ca.gov/ds/ss/cb/filespaif.asp). The layout of the database for the school year 2005/06 can be found at http://www.cde.ca.gov/ds/ss/cb/fspaif05.asp. The PAIF staffing files indicate which subjects each teacher is authorized to teach in California. For instance, the math variable in that database has a value of one if a teacher is authorized to teach that subject in the state and zero if not.
The PAIF staffing files were merged (by record iden-tification and County-District-School code) with the PAIF course data. This course database (see the layout of the 2005/06 database at http://www.cde.ca.gov/ds/ss/cb/fsassign05.asp) contains informa-tion about all the courses that have been taught in California schools, by grade and subject. Merging these two databases allows the analysis of which teachers taught which courses in the state. Note that the PAIF course database contains a variable identifying the code of the assignment. In order to understand what these codes really mean, it is nec-essary to merge (using the assignment code) a third database. This third database, the assignment code and name file (see the layout of this file at http://www.cde.ca.gov/ds/ss/cb/fsasgncode.asp), makes it easy to analyze whether a teacher is teaching a course that he or she is authorized to teach.
As a second step, it is necessary to aggregate all the teacher- and course-level information and to generate a school-level percentage of, for example, math courses taught by nonauthorized (out-of-field) teachers. In this school-level computation each course’s teacher authorization was weighted by its total enrollment (which comes from the PAIF course data file). Therefore, the school-level percentage of courses of subject i that are taught by nonauthorized teachers is equal to:
School level % out of �eld teachingi = × 1001 –
EnrollmentijΣj=1
N
Enrollmentij ×Σj=1
N Authorizationdummyi variable
where j denotes the different instances of a specific assignment or subject at the school.
Once these school-level percentages have been estimated, poverty, English language learner, His-panic, and African American quartile averages, as well as charter, traditional public, urban, subur-ban, and rural school averages, are calculated by taking the simple mean of all the schools that fall into each group.
University of California and California State University course requirements. The assignment code and assignment name files (http://www.cde.ca.gov/ds/ss/cb/fsasgncode.asp) contain data that indicate whether each course taught in California schools is eligible to be designated as meeting the University of California (UC) and California State University (CSU) requirements for admission. The four possible values of this variable are: always or almost always approved as UC “a-g” course, cannot be approved as UC “a-g” course, sometimes approved as UC “a-g” course, and not a teaching assignment. With this information, the percentage of all the courses in each school that are always or almost always approved as UC “a-g” courses was computed. (Courses that were sometimes approved were not included, since this variable does not indicate whether, in the end, they were actually approved. Courses that were classified as nonteaching assignments were also not included

30 The diSTribuTion of Teaching and learning reSourceS in california’S middle and high SchoolS
in the analysis.) The school-level variable is then defined as
School level %UC/CSU coursesi = × 100
Enrollmentij × UC/CSU dummy variableiΣj=1
N
EnrollmentijΣj=1
N
where i denotes the subject and j the different instances of a specific assignment or subject at the school. The UC/CSU dummy variable takes a value of one if the course satisfies UC and CSU require-ments and zero otherwise.
Once these school-level percentages have been estimated, poverty, English language learner, Hispanic, and African American quartile aver-ages, as well as charter, traditional public, urban, suburban, and rural school averages, are easily calculated by taking the simple mean of all the schools that fall into each group.
Class size. The class size variable is a measure of the enrollment of each course. This enrollment figure is estimated from the course database (http://www.cde.ca.gov/ds/ss/cb/fsassign05.asp) by adding the male and female enrollments of the class or course. Note that this estimated total enrollment of each course is also used as a weight in the school-level percentages of out-of-field teaching and classes satisfying UC and CSU requirements.
School level average class sizei = × 100N
EnrollmentijΣj=1
N
where i denotes the subject, j the different in-stances of a specific assignment or subject at the school, and N the total number of instances of a specific assignment.
Once these school-level average class sizes have been estimated, poverty, English language learner, Hispanic, and African American quartile averages, as well as charter, traditional public, urban, sub-urban, and rural school averages, are calculated by taking the simple mean of all the schools that fall into each group.
Course-taking patterns. One of the analyses exam-ines the percentage of students in each school who enrolled in a particular subject. To generate these data it is necessary to use two different sources. The first one is the PAIF course database (www.cde.ca.gov/ds/ss/cb/fsassign05.asp), which lists the total enrollment in each course. The second is the CBEDS School Information Form (for a layout of this data file see http://dq.cde.ca.gov/DataQuest/downloads/fs/sifenr.asp?year=2005), which pro-vides total school enrollment data. The percentage of students at each school who enroll in a particu-lar subject is then estimated as follows:
School level % of students enrolled in subjecti = × 100Total enrollment
EnrollmentijΣj=1
N
where i denotes the subject and j the different instances of a specific assignment or subject at the school. The denominator indicates the total student enrollment at the school as taken from the CBEDS database.
Once these school-level average class sizes have been estimated, poverty, English language learner, Hispanic, and African American quartile averages, as well as charter, traditional public, urban, sub-urban, and rural school averages, are calculated by taking the simple mean of all the schools that fall into each group.
Teacher experience. The professional experience of teachers is taken from the PAIF staff files (www.cde.ca.gov/ds/ss/cb/fspaif05.asp). A variable in that file indicates the total number of years of public and private educational service in the current school district, other districts, other states, and other countries.
The analysis considers teacher experience across different subjects, so it is necessary to use the PAIF staff file information on teaching experience in conjunction with the PAIF assignment database (www.cde.ca.gov/ds/ss/cb/fsassign05.asp) to match teachers to subjects. Again, this merging is done using the teacher ID variable and County-District-School code.

appendix 31
Once these two data files have been merged, the school-level average teacher experience is esti-mated as follows:
Average years of teacher experiencei = × 100×
Ti
Teacher experienceijΣj=1
N
Enrollmentij
EnrollmentijΣj=1
N
where i denotes the subject, j denotes the different instances of a specific assignment or subject at the school, and T denotes the number of teachers at the school who teach a particular subject.
Once these school-level averages have been esti-mated, poverty, English language learner, His-panic, and African American quartile averages, as well as charter, traditional public, urban, subur-ban, and rural school averages, are calculated by taking the simple mean of all the schools that fall into each group.
Teacher education. The PAIF staff database (www.cde.ca.gov/ds/ss/cb/fspaif05.asp) contains a vari-able that lists the educational attainment of each teacher in California. There are six possible values of this variable:
Doctorate1 = Master’s degree plus 30 or more semester 2 = hoursMaster’s degree3 = Bachelor’s degree plus 30 or more semester 4 = hoursBachelor’s degree5 = Less than bachelor’s degree6 =
Since the focus of the analysis is the percentage of students taught by teachers with master’s or doc-toral degrees, the first step is to generate a dummy variable that takes a value of one if the teacher’s education variable is 1, 2, or 3. If the teacher’s edu-cation variable is 4, 5, or 6, the dummy variable takes a value of zero.
As with the analysis of teacher experience, to esti-mate figures for teacher education by subject, it is necessary to merge the PAIF staff data file with the
respective assignment database (http://www.cde.ca.gov/ds/ss/cb/fsassign05.asp). Knowing which teacher is assigned to each subject, the percentage of students being taught by teachers with ad-vanced academic degrees is computed as follows:
% of students taught by teachers with advanced degreesi = × 100
Advanced degree dummy variablei × EnrollmentjΣj=1
N
EnrollmentjΣj=1
N
where i denotes the subject and j the different instances of a specific assignment or subject at the school.
Once these percentages have been estimated, poverty, English language learner, Hispanic, and African American quartile averages, as well as char-ter, traditional public, urban, suburban, and rural school averages, are calculated by taking the simple mean of all the schools that fall into each group.
School characteristics
Percentage of students eligible for free or reduced-price lunch. This variable is generated using two different data sources. First, the number of students eligible for free or reduced-price lunch comes from the school-level data of the Free and Reduced Price Meals Program and the Califor-nia Work Opportunity file for 2005 (see layout at www.cde.ca.gov/ds/sh/cw/fsafdc2.asp). The data file can be downloaded from www.cde.ca.gov/ds/sh/cw/filesafdc.asp. The denominator of this ratio is obtained from the CBEDS School Infor-mation Form (for a layout of this data file, see http://dq.cde.ca.gov/DataQuest/downloads/fs/sifenr.asp?year=2005), which provides total school enrollment data.
Percentage of Hispanic students. This percentage was taken directly from the school-level academic performance index (API) 2005 database, which can be downloaded from www.cde.ca.gov/ta/ac/ap/apidatafiles.asp. For a description of the layout of the database, see www.cde.ca.gov/ta/ac/ap/reclayout05b.asp.

32 The diSTribuTion of Teaching and learning reSourceS in california’S middle and high SchoolS
Percentage of English language learners. This percentage was taken directly from the school-level API 2005 database, which can be downloaded from www.cde.ca.gov/ta/ac/ap/apidatafiles.asp. For a description of the layout of the database, see www.cde.ca.gov/ta/ac/ap/reclayout05b.asp.
Percentage of African American students. This percentage was taken directly from the school-level API 2005 database, which can be downloaded from www.cde.ca.gov/ta/ac/ap/apidatafiles.asp. For a description of the layout of the database, see www.cde.ca.gov/ta/ac/ap/reclayout05b.asp.
Charter school. The value of this variable was de-termined by consulting the school-level API 2005 database, which can be downloaded from www.cde.ca.gov/ta/ac/ap/apidatafiles.asp. For a descrip-tion of the layout of the database, see www.cde.ca.gov/ta/ac/ap/reclayout05b.asp.
Population density. The value of this variable was determined by consulting the CBEDS public schools database (see layout at www.cde.ca.gov/ds/si/ds/fspubschls.asp). That data file contains a vari-able that takes the following possible values:
Large city.1 = A central city of Consolidated Met-ropolitan Statistical Area (CMSA), with the city having a population greater than or equal to 250,000.
Mid-size city.2 = A central city of a CMSA or Met-ropolitan Statistical Area (MSA), with the city having a population less than 250,000.
Urban fringes of large city.3 = Any incorporated place, Census Designated Place, or non-place territory within the CMSA or MSA of a large city and defined as urban by the Census Bureau.
Urban fringes of mid-size city.4 = Any incor-porated place, Census Designated Place, or non-place territory within the CMSA or MSA of a mid-size city and defined as urban by the Census Bureau.
Large town.5 = An incorporated place or Census Designated Place with a population greater than or equal to 25,000 and located outside a CMSA or MSA.
Small town.6 = An incorporated place or Census Designated Place with a population less than 25,000 and greater than 2,500 and located outside a CMSA or MSA.
Rural, outside MSA.7 = Any incorporated place, Census Designated Place, or non-place terri-tory designated as rural by the Census Bureau.
Rural, inside MSA.8 = Any incorporated place, Census Designated Place, or non-place ter-ritory within the CMSA or MSA of a large or mid-size city and defined as rural by the Census Bureau.
To generate the urban, suburban, and rural catego-ries, these categories are mapped as follows:
Urban: large city or mid-size city.•
Suburban: urban fringes of large city, urban •fringes of mid-size city, large town, or small town.
Rural: rural, outside MSA, or rural, inside •MSA.
Overall assessment of data quality
Some data quality issues arise when working with the datasets described above. One challenge when working with California education data is that the state-level datasets are not always uni-fied or consistent. For example, school identi-fiers (such as County-District-School codes) are sometimes not provided and have to be generated from county, district, and school codes, add-ing an additional step to the process of merging school-level data.
A second issue is that, given the several sources of data available (for example, CBEDS, API files,

appendix 33
CALWORKS, and STAR research files), it is pos-sible to have more than one value for the same variable. For instance, two different datasets of the PAIF from CBEDS provide information on whether a class satisfies UC and CSU require-ments (see the variable “UC_CSU_REQ” at www.cde.ca.gov/ds/ss/cb/fsasgncode.asp and the
variable “UC_CSU” at www.cde.ca.gov/ds/ss/cb/fsassign00.asp).
Finally, the typical problems of almost any data analysis (missing data and changing definitions of variables over time) are also present in this analysis.
Table a1
Sizes of school quartiles by school characteristic
number of middle schools
number of high schools
School quartiles by percentage of poverty (low-income students)
quartile 1 (lowest) 306 268
quartile 2 305 268
quartile 3 306 268
quartile 4 (highest) 305 268
School quartiles by percentage of English language learners
quartile 1 (lowest) 318 287
quartile 2 329 270
quartile 3 289 288
quartile 4 (highest) 312 268
School quartiles by percentage of Hispanic students
quartile 1 (lowest) 320 280
quartile 2 313 291
quartile 3 303 269
quartile 4 (highest) 312 273
School quartiles by percentage of African American students
quartile 1 (lowest) 320 332
quartile 2 370 285
quartile 3 264 224
quartile 4 (highest) 294 272
Population density
urban 493 385
Suburban 616 472
rural 94 150
School type
Traditional public 1,199 967
charter 51 158
Note: The quartiles do not have exactly the same number of schools because several schools have exactly the same percentage of English language learners, Hispanic students,
and so on, making it impossible to define quartiles across schools with exactly the same value. Note that for each group the official percentages were used as provided in the
2005 Academic Performance Index database, which reports percentages with two decimals. Therefore, the cut point between quartiles has only that level of precision. In addi-
tion, the number of total observations for each analysis is different depending on the variables used, such as concentration of students eligible for free or reduced price lunch,
English language learners, and so on, due to missing data in the CBEDS or API databases.
Source: Authors’ analysis based on data for 2005/06 from the California Basic Education Data System and other databases described in this appendix.

34 The diSTribuTion of Teaching and learning reSourceS in california’S middle and high SchoolS
referenCes
AEL. (2003, December). Recruiting and retaining high-quality teachers in rural areas. Charleston, WV: Author. Retrieved January 13, 2007, from http://www.edvantia.org/publications/pdf/PB_Rural_Teachers.pdf
Allgood, W., & Rice, J. K. (2002). The adequacy of urban education: Focusing on teacher quality. In C. F. Roellke & J. K. Rice (Eds.), Fiscal policy issues in urban educa-tion (pp. 155–180). Greenwich, CT: Information Age Publishing, Inc.
Betts, J. R., Rueben, K., & Danenberg, A. (2000). Equal resources, equal outcomes? The distribution of school resources and student achievement in California. San Francisco, CA: Public Policy Institute of California. Retrieved January 13, 2007, from http://www.ppic.org/content/pubs/report/R_200JBR.pdf
Center for Education Reform. (2006, September). National charter school data: New school estimates 2006–07. Washington, DC: Author. Retrieved January 13, 2007, from http://www.edreform.com/index.cfm?fuseAction=stateStatChart&psectionid=15&cSectionID=44
Darling-Hammond, L. (1987). Teacher quality and equality. In J. Goodlad & P. Keating (Eds.), Access to knowledge: An agenda for our nation’s schools. New York: College Entrance Examination Board.
The Education Trust–West. (2005, March). California’s hidden teacher spending gap: How state and district budgeting practices shortchange poor and minority stu-dents and their schools. Oakland, CA: Author. Retrieved February 10, 2007, from http://www.hiddengap.org/resources/report031105.pdf
Education Week. (2006, June 22). Diplomas count: An es-sential guide to graduation policy and rates. Bethesda, MD: Editorial Projects in Education, Inc. Retrieved January 13, 2007, from http://www.edweek.org/ew/toc/2006/06/22/index.html
Fideler, E. F., Foster, E. D., & Schwartz, S. (2000). The urban teacher challenge: Teacher demand and supply in the great city schools. The Urban Teacher Collaborative.
Retrieved January 13, 2007, from http://www.cgcs.org/pdfs/utc.pdf
Finn, J., & Achilles, C. M. (1999). Tennessee’s class size study: Findings, implications, and misconceptions. Educational Evaluation and Policy Analysis, 21, 97–109.
Gándara, P., Rumberger, R., Maxwell-Jolly, J., & Calla-han, R. (2003). English learners in California schools: Unequal resources, unequal outcomes. Education Policy Analysis, 11(36).
Goldhaber, D., & Brewer, D. (1996). Evaluating the effect of teacher degree level on educational performance. In W. Fowler (Ed.), Developments in school finance, 1996 (pp. 197–210). Washington, DC: U.S. Department of Education, National Center for Education Statistics (ED 409 634).
Governor’s Committee on Education Excellence. (2006, August). Getting down to facts: Studies and descrip-tions. Retrieved January 13, 2007, from http://www.everychildprepared.org/docs/studies_and_descriptions.pdf
Greenwald, R., Hedges, L., & Laine, R. (1996, fall). The ef-fect of school resources on student achievement. Review of Educational Research, 66(3), 361–396.
Guha, R., Campbell, A., Humphrey, D., Shields, P., Tiffany-Morales, J., & Weschler, M. (2006). California’s teaching force 2006: Key issues and trends. Santa Cruz, CA: The Center for Teaching and Learning. Retrieved January 13, 2007, from http://www.cftl.org/documents/2006/TCF2006FINAL.pdf
Hall, D., & Kennedy, S. (2006, March). Primary progress, secondary challenge. Washington, DC: The Education Trust. Retrieved January 13, 2007, from http://www2.edtrust.org/NR/rdonlyres/15B22876-20C8-47B8-9AF4-FAB148A225AC/0/PPSCreport.pdf
Hanushek, E. (1986). The economics of schooling: Produc-tion and efficiency in public schools. Journal of Eco-nomic Literature, 24(3), 1141–78.
Ingersoll, R. (1996). Out-of-field teaching and educational equity. Washington, DC: U.S. Department of Education,

referenceS 35
Office of Educational Research and Improvement (NCES 96-040).
Kane, T. J., Rockoff, J. E., & Staiger, D. O. (2007, winter). Photo finish: Certification doesn’t guarantee a win-ner. Education Next. Retrieved January 13, 2007, from www.tntp.org/newsandpress/newsitems/documents/ednext_20071_60.pdf
Milesi, C., & Gamoran, A. (2006). Effects of class size and instruction on kindergarten achievement. Educational Evaluation and Policy Analysis, 28(4), 287–313.
National Center for Education Statistics. (2000, December). Monitoring quality: An indicators report. Washington, DC: Author.
Nye, B., & Hedges, L. V. (1999). The long-term effects of small classes: A five-year follow-up of the Tennessee class size experiment. Educational Evaluation and Policy Analysis, 21(2), 127–142.
Oakes, J., Rogers, J., Silver, D., Valladares, S., Terriquez, V., McDonough, P., Renée, M., & Lipton, M. (2006).
Removing the roadblocks: Fair college opportunities for all California students. Los Angeles, CA: University of California All Campus Consortium on Research and Diversity and University of California, Los An-geles, CA, Institute for Democracy, Education and Access. Retrieved February 10, 2007, from http://www.idea.gseis.ucla.edu/publications/roadblocks/pdf/ExecutiveSummary.pdf
Oakes, J., Ormseth, T., Bell, R. M., & Camp, P. (1990). Multiplying inequalities: The effects of race, social class, and tracking on opportunities to learn math and science. Santa Monica, CA: RAND.
Peske, H. G., & Haycock, K. (2006, June). Teaching inequal-ity: How poor and minority students are shortchanged on teacher quality. Washington, DC: The Education Trust. Retrieved January 13, 2007, from http://www2.edtrust.org/NR/rdonlyres/010DBD9F-CED8-4D2B-9-E0D-91B446746ED3/0/TQReportJune2006.pdf
Sanders, W. L., & Rivers, J. C. (1996). Cumulative and residual effects of teachers on future student academic achievement. Knoxville, TN: University of Tennessee.


