Lead, Mercury, Cadmium and Arsenic in the Environment Edited by T. C. Hutchinson and K. M. Meema @ ]987 SCOPE. Published by John Wiley & Sons Ltd CHAPTER 15 The Distribution of Trace Metals in Aswan High Dam Reservoir and River Nile Ecosystems MOHAMED R. LASHEEN Water Pollution Control Laboratory, National Research Center, Dokki, Cairo, Egypt ABSTRACT Since the main source of fresh water in Egypt is the' River Nile, which originates from outside the country, a study was designed to assess the levels of trace metals and their effects on the river water quality and identify areas of diminished water quality. Trace elements, Cd, Co, Cu, Cr, Pb, Mn, and Zn, were determined in water, sediments and fish. For the Aswan High Dam reservoir, the investigation revealed significant sea- sonal, spatial and vertical variations in trace element content. Sediments and sus- pended matter playa significant role in the overall distribution of trace elements in the reservoir. For the River Nile, the results revealed that river water contains concentrations of these metals far below the levels suggested for potable water. However, the trace elements have accumulated in high concentrations in river sediments indicating the existence of localized pollution. Fish samples showed that metal concentrations varied according to the species and the sampling area. Metal concentrations in nsh samples followed the order: Zn > Mn > Pb > Cu > Cd. The findings contribute to the understanding of the distribution and dynamics of metals in the reservoir and River Nile ecosystems. INTRODUCTION One of the most important projects in Egypt was the construction of the Aswan High Dam (1959-1969). The Aswan High Dam Reservoir (AHDR) extendsoveranareaof 5000km2with itsnortherntwo-thirds in Egypt (known as Lake Nasser) and southern third in Sudan (known as Lake Nubia). 235
Transcript
Lead, Mercury, Cadmium and Arsenic in the EnvironmentEdited by T. C. Hutchinson and K. M. Meema@ ]987 SCOPE. Published by John Wiley & Sons Ltd
CHAPTER 15
The Distribution of Trace Metals inAswan High Dam Reservoir andRiver Nile Ecosystems
MOHAMED R. LASHEEN
Water Pollution Control Laboratory,National Research Center,Dokki, Cairo, Egypt
ABSTRACT
Since the main source of fresh water in Egypt is the' River Nile, which originatesfrom outside the country, a study was designed to assess the levels of trace metalsand their effects on the river water quality and identify areas of diminished waterquality. Trace elements, Cd, Co, Cu, Cr, Pb, Mn, and Zn, were determined in water,sediments and fish.
For the Aswan High Dam reservoir, the investigation revealed significant sea-sonal, spatial and vertical variations in trace element content. Sediments and sus-pended matter playa significant role in the overall distribution of trace elementsin the reservoir.
For the River Nile, the results revealed that river water contains concentrationsof these metals far below the levels suggested for potable water. However, the traceelements have accumulated in high concentrations in river sediments indicatingthe existence of localized pollution.
Fish samples showed that metal concentrations varied according to the speciesand the sampling area. Metal concentrations in nsh samples followed the order: Zn> Mn > Pb > Cu > Cd.
The findings contribute to the understanding of the distribution and dynamicsof metals in the reservoir and River Nile ecosystems.
INTRODUCTION
One of the most important projects in Egypt was the construction of theAswan High Dam (1959-1969). The Aswan High Dam Reservoir (AHDR)extendsoveran areaof 5000km2with its northerntwo-thirdsin Egypt(known as Lake Nasser) and southern third in Sudan (known as Lake Nubia).
235
236 Lead, Mercury, Cadmium and Arsenic in the Environment
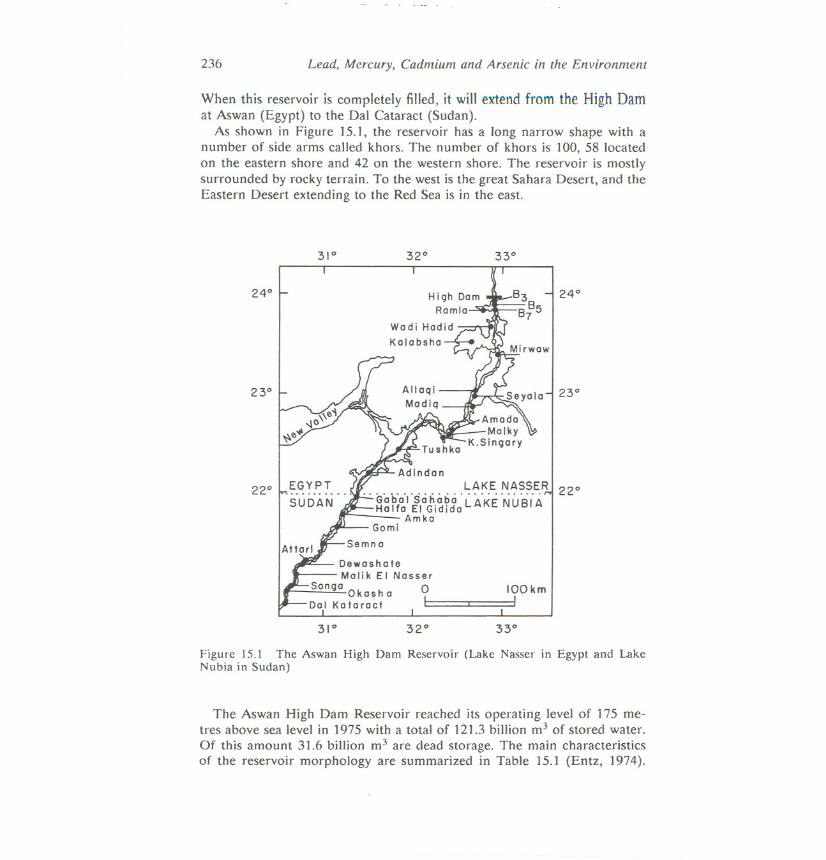
When this reservoir is completely filled, it will extend from the High Damat Aswan (Egypt) to the Dal Cataract (Sudan).
As shown in Figure 15.1, the reservoir has a long narrow shape with anumber of side arms called khors. The number of khors is 100, 58 locatedon the eastern shore and 42 on the western shore. The reservoir is mostlysurrounded by rocky terrain. To the west is the great Sahara Desert, and theEastern Desert extending to the Red Sea is in the east.
31° 32° 33°
23°
24°24°
23°
LA!<.E.!'I.~?~.~~ 22°.. Gab'o"!"Sohabo' LAKE NUBI AHaifa EI Gidido
-AmkoGomi
DewoshoteMalik EI Nasser
50ngo 0-Okosh aDol Kotoroct I
IOOkmI
31° 32° 33°
Figure 15.1 The Aswan High Dam Reservoir (Lake Nasser in Egypt and LakeNubia in Sudan)
The Aswan High Dam Reservoir reached its operating level of 175 me-tres above sea level in 1975 with a total of 121.3 billion m3 of stored water.Of this amount 31.6 billion m3 are dead storage. The main characteristicsof the reservoir morphology are summarized in Table 15.1 (Entz, 1974).
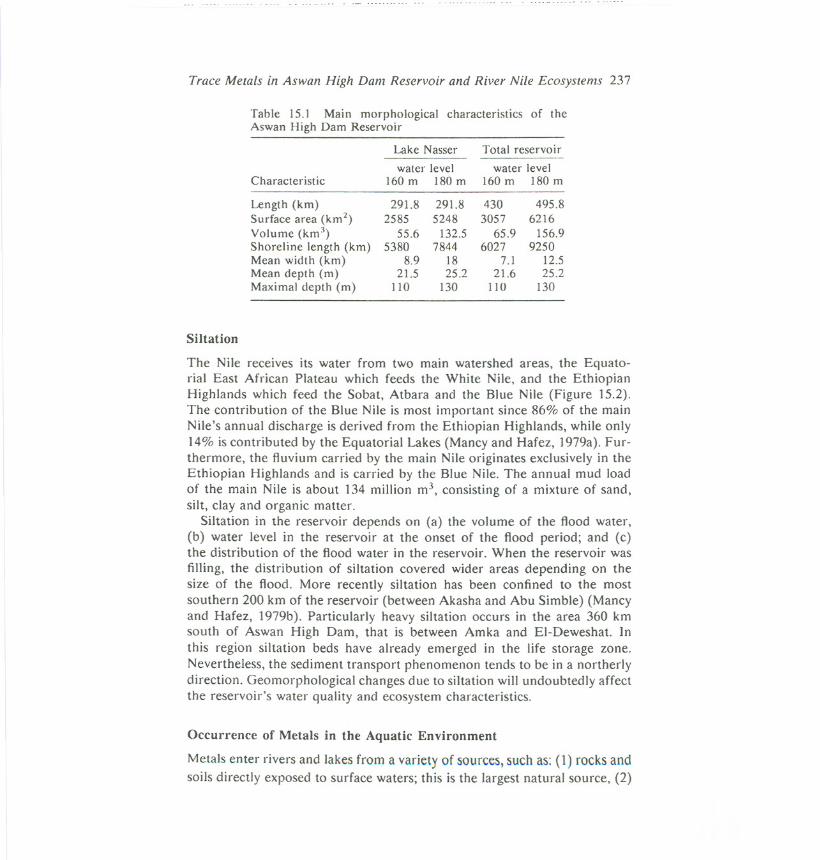
Trace Metals in Aswan High Dam Reservoir and River Nile Ecosystems 237
Table 15.1 Main morphological characteristics of theAswan High Dam Reservoir
Characteristic
Lake Nasser
water level160 m 180 m
Total reservoir
water level160 m 180 m
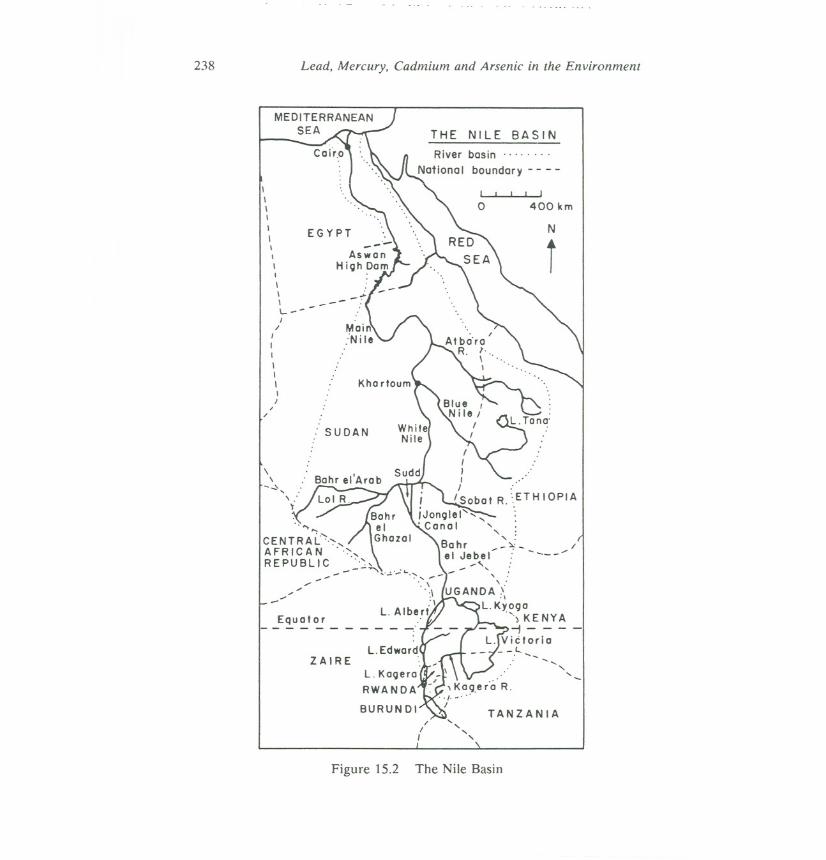
The Nile receives its water from two main watershed areas, the Equato-rial East African Plateau which feeds the White Nile, and the EthiopianHighlands which feed the Sobat, Atbara and the Blue Nile (Figure 15.2).The contribution of the Blue Nile is most important since 86% of the mainNile's annual discharge is derived from the Ethiopian Highlands, while only14% is contributed by the Equatorial Lakes (Mancy and Hafez, 1979a). Fur-thermore, the fluvium carried by the main Nile originates exclusively in theEthiopian Highlands and is carried by the Blue Nile. The annual mud loadof the main Nile is about 134 million m\ consisting of a mixture of sand,silt, clay and organic matter.
Siltation in the reservoir depends on (a) the volume of the flood water,(b) water level in the reservoir at the onset of the flood period; and (c)the distribution of the flood water in the reservoir. When the reservoir wasfilling, the distribution of siltation covered wider areas depending on thesize of the flood. More recently siltation has been confined to the mostsouthern 200 km of the reservoir (between Akasha and Abu Simble) (Mancyand Hafez, 1979b). Particularly heavy siltation occurs in the area 360 kmsouth of Aswan High Dam, that is between Amka and EI-Deweshat. Inthis region siltation beds have already emerged in the life storage zone.Nevertheless, the sediment transport phenomenon tends to be in a northerlydirection. Geomorphological changes due to siltation will undoubtedly affectthe reservoir's water quality and ecosystem characteristics.
Occurrence of Metals in the Aquatic Environment
Metals enter rivers and lakes from a variety of sources, such as: (1) rocks andsoils directly exposed to surface waters; this is the largest natural source, (2)
238 Lead. Mercury. Cadmium and Arsenic in the Environment
THE NILE BASIN
River basin"" . . . .National boundary - - - -
\\\,,,,
I\I\\ :/--, --~L .'I
/III,II,I
//
L i L L-I400 km0
N
iEGYPT
. SUDAN
\ ,
Equator,------
ZAIRE
TANZANIA/
I,
Figure 15.2 The Nile Basin
Trace Metals in Aswan High Dam Reservoir and River Nile Ecosystems 239
dead and decomposing vegetation and animal matter, (3) wet and dry falloutof atmospheric particulate matter, and (4) from man's activities, includingthe discharge of various treated and untreated liquid wastes into the waterbody.
Trace metals such as chromium, manganese, cobalt, copper and zinc playabiochemical role in the life processes of aquatic plants and animals, and theirpresence in trace amounts in the aquatic environment is essential. However,at high concentrations, these trace metals become toxic (Nurnberg, 1982).
A further special feature of toxic metals is that they are not biodegradable.Instead they undergo a biogeochemical cycle with substantially different res-idence times in the various spheres and compartments of the environment.Within this cycle they will be taken up also by man, predominantly fromfood and drinking water. In this respect toxic metals constitute a particularrisk, because, although a certain fraction of the ingested amount is againexcreted, they have a tendency to accumulate in vital organs. Thus, theywill exert progressively growing toxic actions over long periods of the life-span depending also on the cumulative magnitude of the dose as a functionof the long term exposure of the individual to its particular environment(Nurnberg, 1982).
Heavy metals in the aquatic environment are generally classified as exist-ing in a number of chemical forms. The usual classification includes metalsin the sediment, metals in suspended particulates (>0.45 j.tm), metals ad-sorbed onto hydrous oxides and humic colloids, and metals in true solution.The metals in true solution can be further divided into free ionic species, in-organic complexes, and complexes with naturally occurring organic ligands(amino acids, citric acid, etc.) (Guy and Kean, 1980).
Of particular importance for the regulation of trace constituents or pol-lutants in natural waters are the particles that act as 'scrubbing agents' byscavenging. All substances that are strongly adsorbed on suspended matteror become incorporated into settling biomass have short relative residencetimes. Obviously, the relative residence time of a compound decreases withincreasing adsorbability (Stumm and Morgan, 1981). Particles are also ofgreat importance in rivers and about 75% of the matter carried by therivers to the ocean is in the form of particulate matter (Martin and Whit-field, 1983).
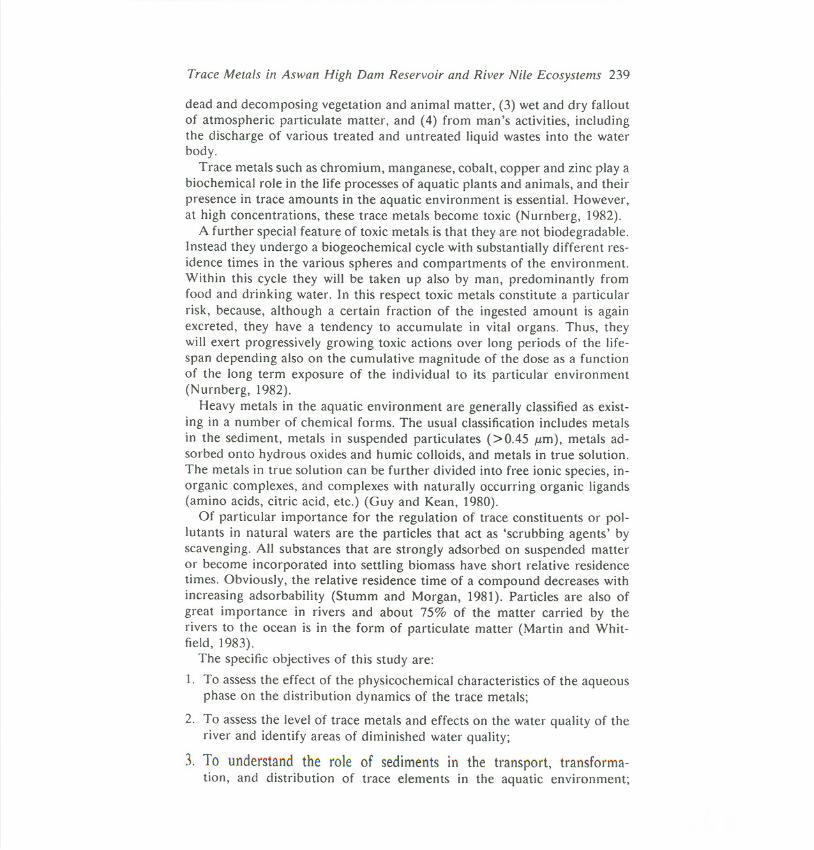
The specific objectives of this study are:
1. To assess the effect of the physicochemical characteristics of the aqueousphase on the distribution dynamics of the trace metals;
2. To assess the level of trace metals and effects on the water quality of theriver and identify areas of diminished water quality;
3. To understand the role of sediments in the transport, transforma-tion, and distribution of trace elements in the aquatic environment;
240 Lead. Mercury, Cadmium and Arsenic in the Environment
4. To elucidate the correlation between the transport behaviour of the sus-pended matter and trace element distribution patterns within the reser-voir;
5. To assess the level of metals in fish.
METHODS AND MATERIALS
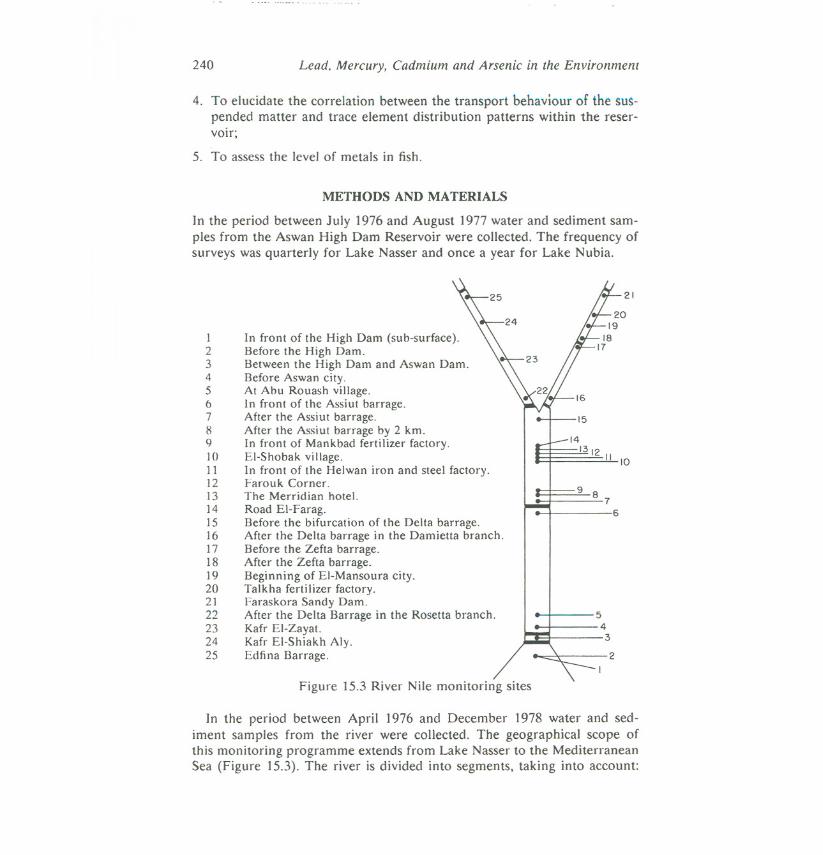
In the period between July 1976 and August 1977 water and sediment sam-ples from the Aswan High Dam Reservoir were collected. The frequency ofsurveys was quarterly for Lake Nasser and once a year for Lake Nubia.
12345678910111213141516171819202122232425
21
In front of the High Dam (sub-surface).Before the High Dam.Between the High Dam and Aswan Dam.Before Aswan city.At Abu Rouash village.In front of the Assiut barrage.After the Assiut barrage.After the Assiut barrage by 2 km.In front of Mankbad fertilizer factory.El-Shobak village.In front of the Helwan iron and steel factory.f'arouk Corner.The Merridian hotel.Road EI-Farag.Before the bifurcation of the Delta barrage.After the Delta barrage in the Damietta branch.Before the Zefta barrage.After the Zefta barrage.Beginning of EI-Mansoura city.Talkha fertilizer factory.Faraskora Sandy Dam.After the Delta Barrage in the Rosetta branch.Kafr EI-Zayat.Kafr EI-Shiakh Aly.Edfma Barrage.
15
14
13 12" 10
9 8 76
543
2
Figure 15.3 River Nile monitoring sites
I n the period between April 1976 and December 1978 water and sed-iment samples from the river were collected. The geographical scope ofthis monitoring programme extends from Lake Nasser to the MediterraneanSea (Figure 15.3). The river is divided into segments, taking into account:
Trace Metals in Aswan High Dam Reservoir and River Nile Ecosystems 241
(a) geographical features;(b) administrative boundaries; and(c) human activities.
Heavy metals in fish samples taken from the Nile River, its two branchesand two main canals during the years 1981-1982 were assessed.
Trace metal analysis was done using a Perkin-Elmer Model 370 atomicabsorption spectrophotometer equipped with a Heated Graphite Atomizer(HGA) Model 2100 and deuterium arc background corrector.
RESULTS AND DISCUSSION
There are two major processes affecting the distribution of trace metals inthe AHDR.
1. The Transportation and Movement Patterns of Suspended Matter
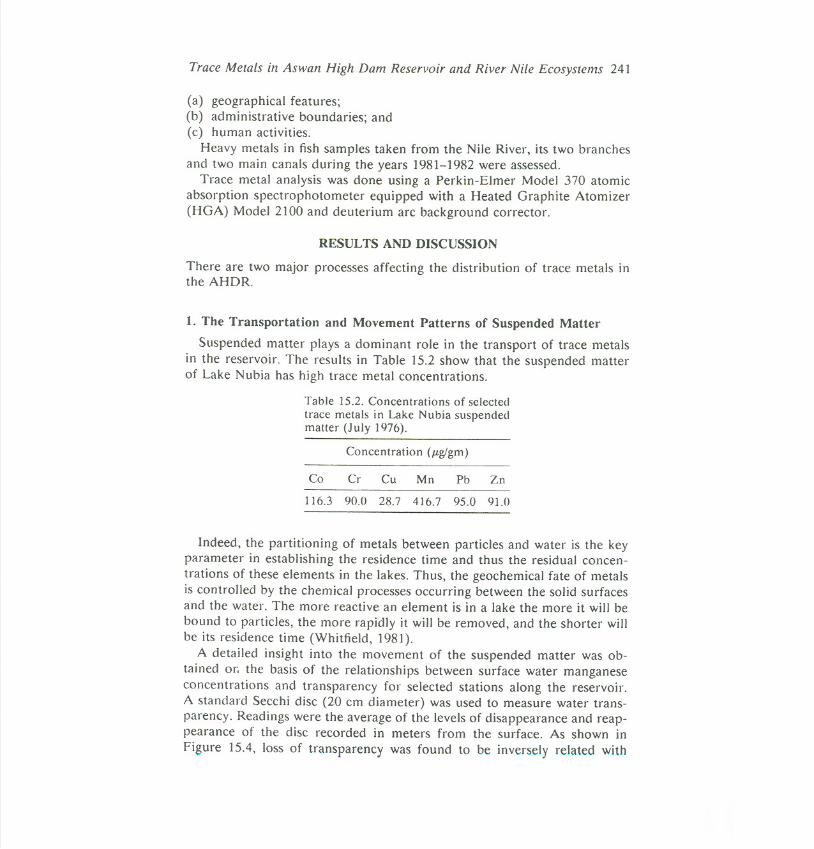
Suspended matter plays a dominant role in the transport of trace metalsin the reservoir. The results in Table 15.2 show that the suspended matterof Lake Nubia has high trace metal concentrations.
Table 15.2. Concentrations of selectedtrace metals in Lake Nubia suspendedmatter (J uly 1(76).
Concentration (f.lg/gm)
Co Cr Cu Mn Pb Zn
116.3 90.0 28.7 416.7 95.0 91.0
Indeed, the partitioning of metals between particles and water is the keyparameter in establishing the residence time and thus the residual concen-trations of these elements in the lakes. Thus, the geochemical fate of metalsis controlled by the chemical processes occurring between the solid surfacesand the water. The more reactive an element is in a lake the more it will bebound to particles, the more rapidly it will be removed, and the shorter willbe its residence time (Whitfield, 1981).
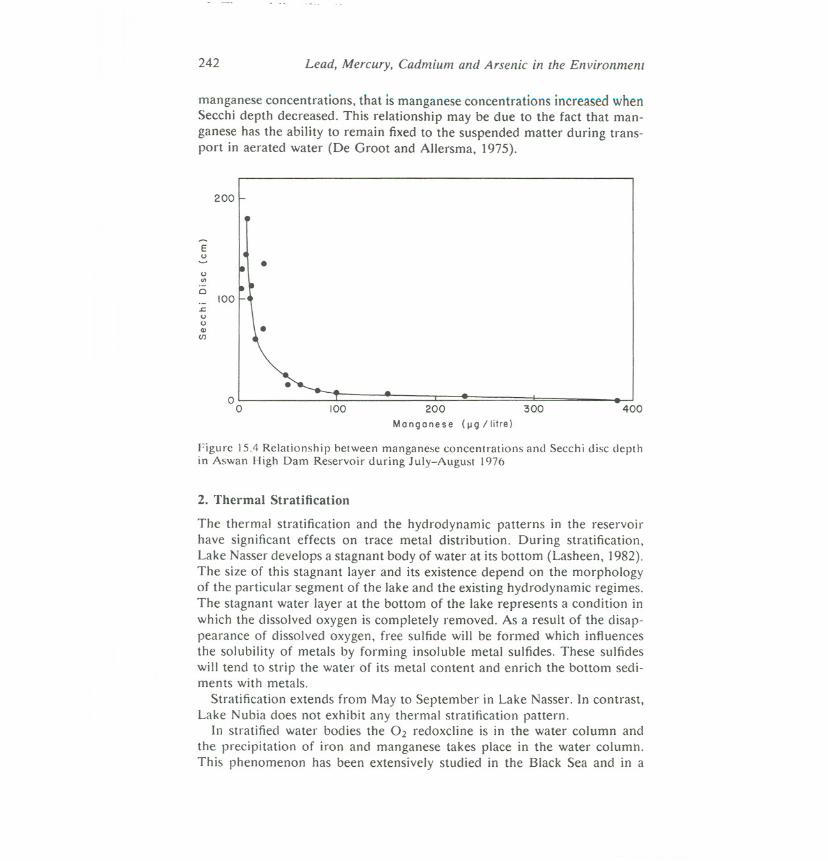
A detailed insight into the movement of the suspended matter was ob-tained or; the basis of the relationships between surface water manganeseconcentrations and transparency for selected stations along the reservoir.A standard Secchi disc (20 cm diameter) was used to measure water trans-parency. Readings were the average of the levels of disappearance and reap-pearance of the disc recorded in meters from the surface. As shown in
Figure 15.4, loss of transparency was found to be inversely related with
242 Lead, Mercury, Cadmium and Arsenic in the Environment
manganese concentrations, that is manganese concentrations increased whenSecchi depth decreased. This relationship may be due to the fact that man-ganese has the ability to remain fixed to the suspended matter during trans-port in aerated water (De Groot and Allersma, ]975).
200
00 100 200
Manganese (lIg /Iitre)
300 400
Figure] 5.4 Relationship hetween manganese concentrations and Secchi disc depthin Aswan High Dam Reservoir during July-August 1976
2. Thermal Stratification
The thermal stratification and the hydrodynamic patterns in the reservoirhave significant effects on trace metal distribution. During stratification,Lake Nasser develops a stagnant body of water at its bottom (Lasheen, ]982).The size of this stagnant layer and its existence depend on the morphologyof the particular segment of the lake and the existing hydrodynamic regimes.The stagnant water layer at the bottom of the lake represents a condition inwhich the dissolved oxygen is completely removed. As a result of the disap-pearance of dissolved oxygen, free sulfide will be formed which influencesthe solubility of metals by forming insoluble metal sulfides. These sulfideswill tend to strip the water of its metal content and enrich the bottom sedi-ments with metals.
Stratification extends from May to September in Lake Nasser. In contrast,Lake Nubia does not exhibit any thermal stratification pattern.
In stratified water bodies the O2 redoxcline is in the water column andthe precipitation of iron and manganese takes place in the water columh.This phenomenon has been extensively studied in the Black Sea and in a
E<.>
1..\ .<.>en
0100
L;c.><.>Q)
I/)
Trace Metals in Aswan High Dam Reservoir and River Nile Ecosystems 243
number of Swiss lakes (Sigg et al., 1983). The precipitating iron hydroxidesare able to scavenge and co-precipitate trace metals from the water columnand transfer them to the sediment. In this way the O2 redoxcline in stratifiedlakes not only acts as a barrier against upward diffusing metals but alsoactively removes some dissolved trace metals from the system (Salomons,1984) .
The quantitative effect of sediment on lake water composition depends toa large extent on the volume/surface area ratio. In shallow lakes the influenceis expected to be much stronger compared with deep lakes.
Spatial and Seasonal Distribution of Trace Elements in the ReservoirWaters
1. Spatial Distribution
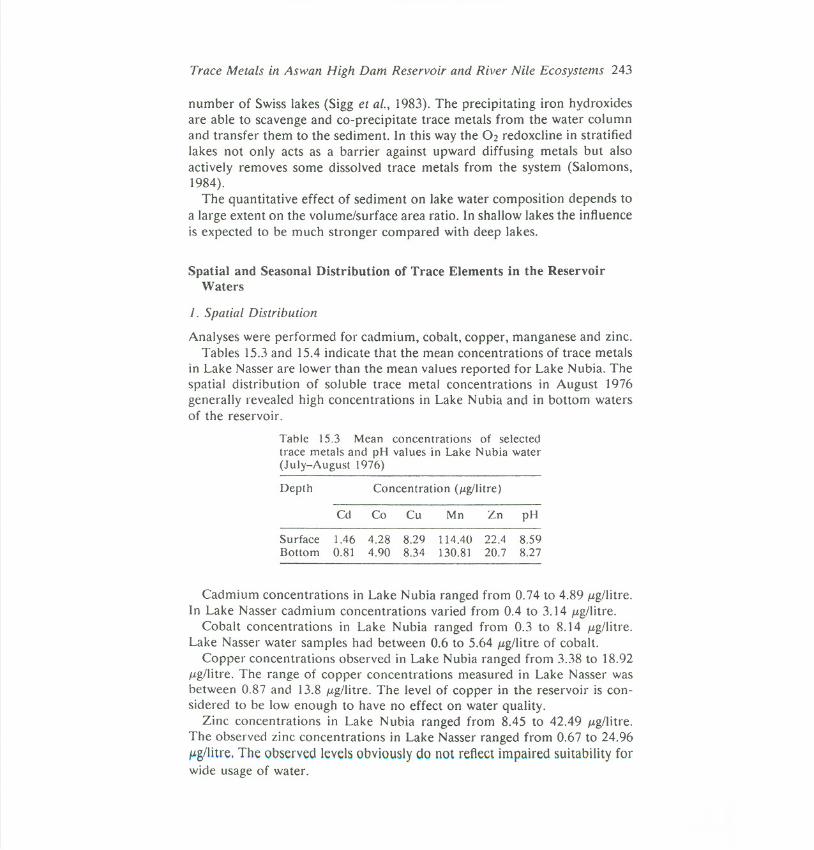
Analyses were performed for cadmium, cobalt, copper, manganese and zinc.Tables 15.3 and 15.4 indicate that the mean concentrations of trace metals
in Lake Nasser are lower than the mean values reported for Lake Nubia. Thespatial distribution of soluble trace metal concentrations in August 1976generally revealed high concentrations in Lake Nubia and in bottom watersof the reservoir.
Table 15.3 Mean concentrations of selectee!trace metals and pH values in Lake Nubia water(July-August 1976)
Cadmium concentrations in Lake Nubia ranged from 0.74 to 4.89 j.lg/litre.In Lake Nasser cadmium concentrations varied from 0.4 to 3.14 j.lg/litre.
Cobalt concentrations in Lake Nubia ranged from 0.3 to 8.14 j.lg/litre.Lake Nasser water samples had between 0.6 to 5.64 j.lg/litre of cobalt.
Copper concentrations observed in Lake Nubia ranged from 3.38 to 18.92j.lg/litre. The range of copper concentrations measured in Lake Nasser wasbetween 0.87 and 13.8 j.lg/litre. The level of copper in the reservoir is con-sidered to be low enough to have no effect on water quality.
Zinc concentrations in Lake Nubia ranged from 8.45 to 42.49 j.lg/litre.The observed zinc concentrations in Lake Nasser ranged from 0.67 to 24.96~g/litre, The observedlevelsobviously do not reflect impaired suitability forwide usage of water.
244 Lead, Mercury, Cadmium and Arsenic (n the Environment
Manganese concentrations observed in Lake Nubia ranged from 16.67 to384.84 j.lg/litre and in Lake Nasser they ranged from 1.84 to 224.15 j.lg/litre.The greatest variation on vertical distributions of manganese occurred dur-ing the thermally stratified period.
Manganese concentrations in the bottom waters were much higher thanin the surface waters. This difference is due to a combination of factorsamong which are surface assimilation by phytoplankton, the presence ofmanganese as soluble Mn2+ under the well-established anaerobic conditionsin the bottom waters, and the release of manganese from suspended matterdeposited on the sediment surface.
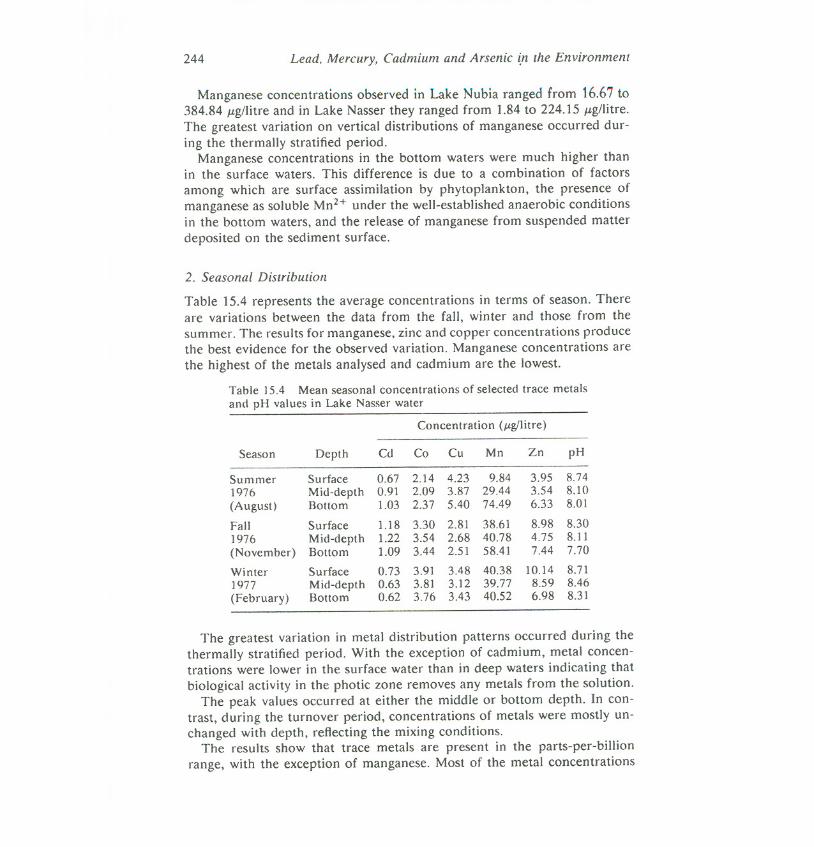
2. Seasonal Distribution
Table 15.4 represents the average concentrations in terms of season. Thereare variations between the data from the fall, winter and those from thesummer. The results for manganese, zinc and copper concentrations producethe best evidence for the observed variation. Manganese concentrations arethe highest of the metals analysed and cadmium are the lowest.
Table 15.4 Mean seasonal concentrations of selected trace metalsand pH values in Lake Nasser water
The greatest variation in metal distribution patterns occurred during thethermally stratified period. With the exception of cadmium, metal concen-trations were lower in the surface water than in deep waters indicating thatbiological activity in the photic zone removes any metals from the solution.
The peak values occurred at either the middle or bottom depth. In con-trast, during the turnover period, concentrations of metals were mostly un-changed with depth, reflecting the mixing conditions.
The results show that trace metals are present in the parts-per-billionrange, with the exception of manganese. Most of the metal concentrations
Trace Metals in Aswan High Dam Reservoir and River Nile Ecosystems 245
are well below the recent proposed criteria for water quality (US Environ-mental Protection Agency, 1972).
Spatial and Seasonal Distribution of Trace Metals in the ReservoirSediments
Table 15.5 indicates that the mean concentrations of Co, Cr, Mn and Zn inLake Nubia sediments are higher than the mean values reported for LakeNasser. Copper and lead were slightly higher in Lake Nasser sediments thanin those of Lake Nubia.
Table 15.5 Means and ranges of metal concentra-tions of bottom sediments of Lake Nubia and LakeNasser (July-August 1976)
Concentration (Jtglgm)
The concentrations of chromium and manganese were the highest of themetals in all sediments. Lead and copper, on the other hand, were in thelowest concentrations in most of the sediments.
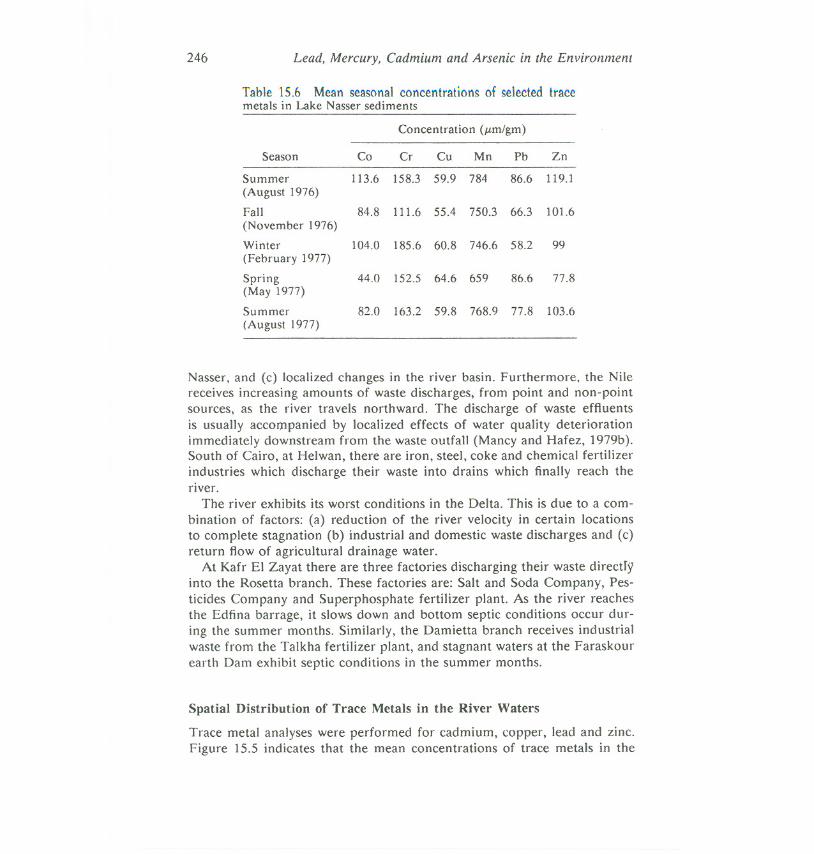
Mean seasonal concentrations of the trace metals in Lake Nasser sedimentsare presented in Table 15.6. Manganese, lead and zinc concentrations werethe highest in August 1976, but Co and Cr were the highest in February1977. Copper content showed a slight increase in May 1977.
Where metal contamination is less severe, physical and chemical processesmake spatial differences in the metal content of sediments difficult to in-terpret. However, the observed changes in the trace metal content of thesediments with distance from the High Dam suggest that changes in theenvironment of deposition do occur along the reservoir.
The Factors Influencing the Distribution Patterns of Trace Metals in theRiver Nile
Themainfactorswhichaffectwaterqualitycharacteristicsof theRiverNileinclude: (a) upstream changes south of Lake Nasser, (b) changes in Lake
246 Lead, Mercury, Cadmium and Arsenic in the Environment
Table 15.6 Mean seasonal concentrations of selected tracemetals in Lake Nasser sediments
Nasser, and (c) localized changes in the river basin. Furthermore, the Nilereceives increasing amounts of waste discharges, from point and non-pointsources, as the river travels northward. The discharge of waste effluentsis usually accompanied by localized effects of water quality deteriorationimmediately downstream from the waste outfall (Mancy and Hafez, 1979b).South of Cairo, at Helwan, there are iron, steel, coke and chemical fertilizerindustries which discharge their waste into drains which finally reach theriver.
The river exhibits its worst conditions in the Delta. This is due to a com-bination of factors: (a) reduction of the river velocity in certain locationsto complete stagnation (b) industrial and domestic waste discharges and (c)return flow of agricultural drainage water.
At Kafr EI Zayat there are three factories discharging their waste directfyinto the Rosetta branch. These factories are: Salt and Soda Company, Pes-ticides Company and Superphosphate fertilizer plant. As the river reachesthe Edfina barrage, it slows down and bottom septic conditions occur dur-ing the summer months. Similarly, the Damietta branch receives industrialwaste from the Talkha fertilizer plant, and stagnant waters at the Faraskourearth Dam exhibit septic conditions in the summer months.
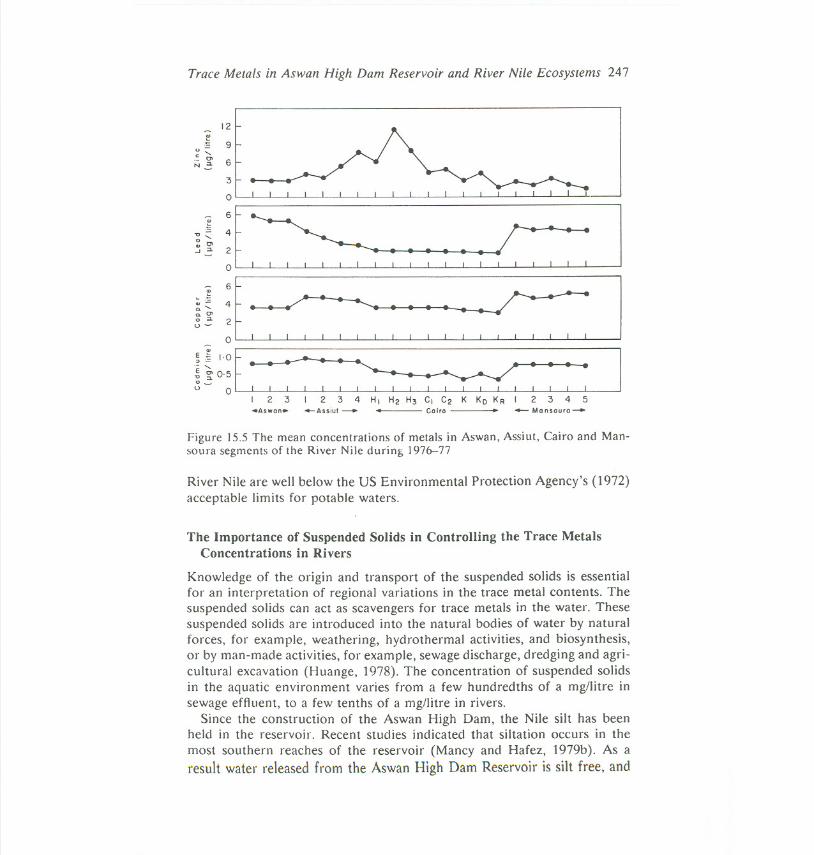
Spatial Distribution of Trace Metals in the River Waters
Trace metal analyses were performed for cadmium, copper, lead and zinc.Figure 15.5 indicates that the mean concentrations of trace metals in the
Trace Metals in Aswan High Dam Reservoir and River Nile Ecosystems 247
12
3
0
"u:= 9c "-.- 0>N.= 6
31 :[ ~ : : : : : :0
~l :l ~ : : ~ : : : : : ~ ,
II~:t~~: : ~ : ~ , , , ,u 0
;-.. . .I I I I I I
...'-'I I I I I
2 3 2 3 4 HI H2 H3 CI C2 K Ko KR I 2 3 4 5-Ass;ut-. Coiro . - Monsouro-4Aswon..
Figure 15.5 The mean concentrations of metals in Aswan, Assiut, Cairo and Man-soura segments of the River Nile during 1976-77
River Nile are well below the US Environmental Protection Agency's (1972)acceptable limits for potable waters.
The Importance of Suspended Solids in Controlling the Trace MetalsConcentrations in Rivers
Knowledge of the origin and transport of the suspended solids is essentialfor an interpretation of regional variations in the trace metal contents. Thesuspended solids can act as scavengers for trace metals in the water. Thesesuspended solids are introduced into the natural bodies of water by naturalforces, for example, weathering, hydrothermal activities, and biosynthesis,or by man-made activities, for example, sewage discharge, dredging and agri-cultural excavation (Huange, 1978). The concentration of suspended solidsin the aquatic environment varies from a few hundredths of a mg/litre insewage effluent, to a few tenths of a mg/litre in rivers.
Since the construction of the Aswan High Dam, the Nile silt has beenheld in the reservoir. Recent studies indicated that siltation occurs in themost southern reaches of the reservoir (Maney and Hafez, 1979b). As aresult water released from the Aswan High Dam Reservoir is silt free, and
248 Lead, Mercury, Cadmium and Arsenic in the Environment
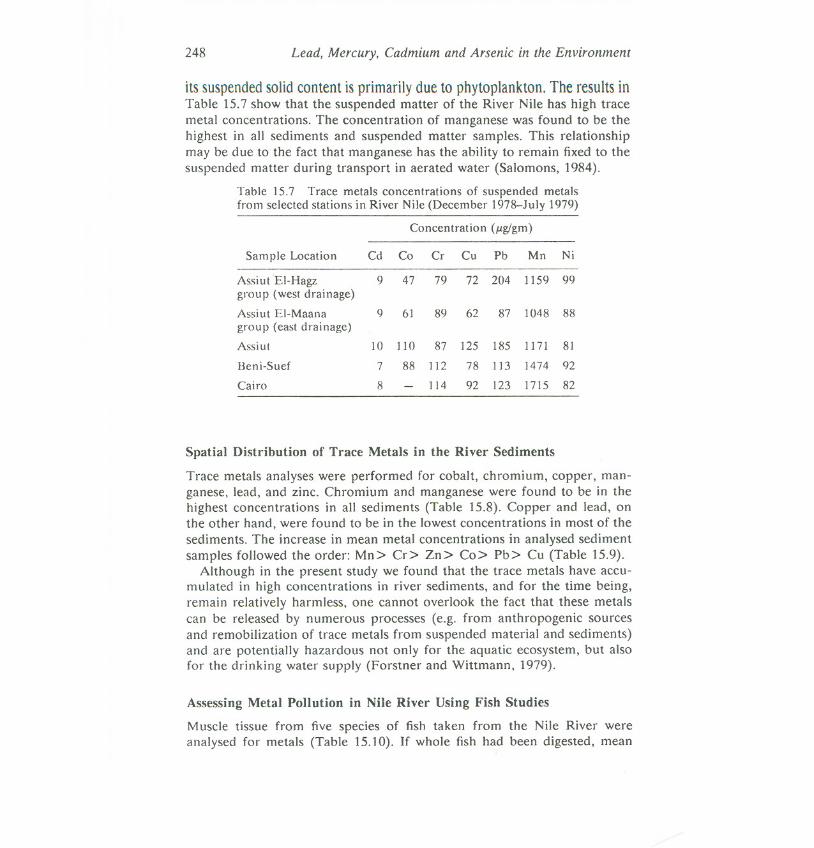
its suspendedsolid content is primarily due to phytoplankton. The results inTable 15.7 show that the suspended matter of the River Nile has high tracemetal concentrations. The concentration of manganese was found to be thehighest in all sediments and suspended matter samples. This relationshipmay be due to the fact that manganese has the ability to remain fixed to thesuspended matter during transport in aerated water (Salomons, 1984).
Table 15.7 Trace metals concentrations of suspended metalsfrom selected stations in River Nile (December 1978-July 1979)
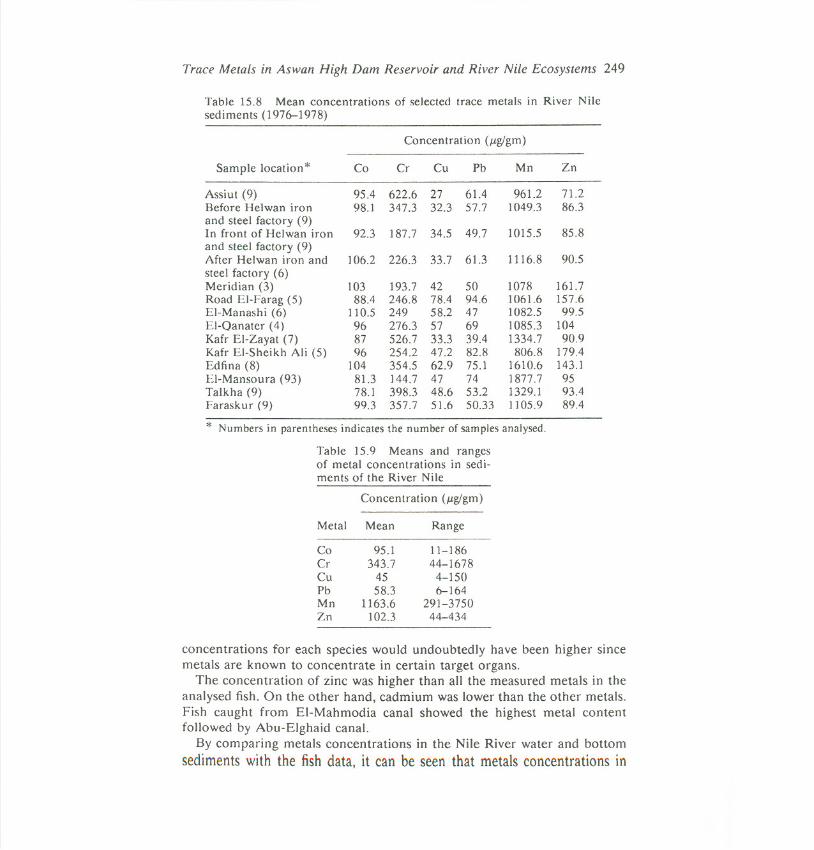
Spatial Distribution of Trace Metals in the River Sediments
Trace metals analyses were performed for cobalt, chromium, copper, man-ganese. lead, and zinc. Chromium and manganese were found to be in thehighest concentrations in all sediments (Table 15.8). Copper and lead, onthe other hand, were found to be in the lowest concentrations in most of thesediments. The increase in mean metal concentrations in analysed sedimentsamples followed the order: Mn> Cr> Zn> Co> Pb> Cu (Table 15.9).
Although in the present study we found that the trace metals have accu-mulated in high concentrations in river sediments, and for the time being,remain relatively harmless, one cannot overlook the fact that these metalscan be released by numerous processes (e.g. from anthropogenic sourcesand remobilization of trace metals from suspended material and sediments)and are potentially hazardous not only for the aquatic ecosystem, but alsofor the drinking water supply (Forstner and Wittmann, 1979).
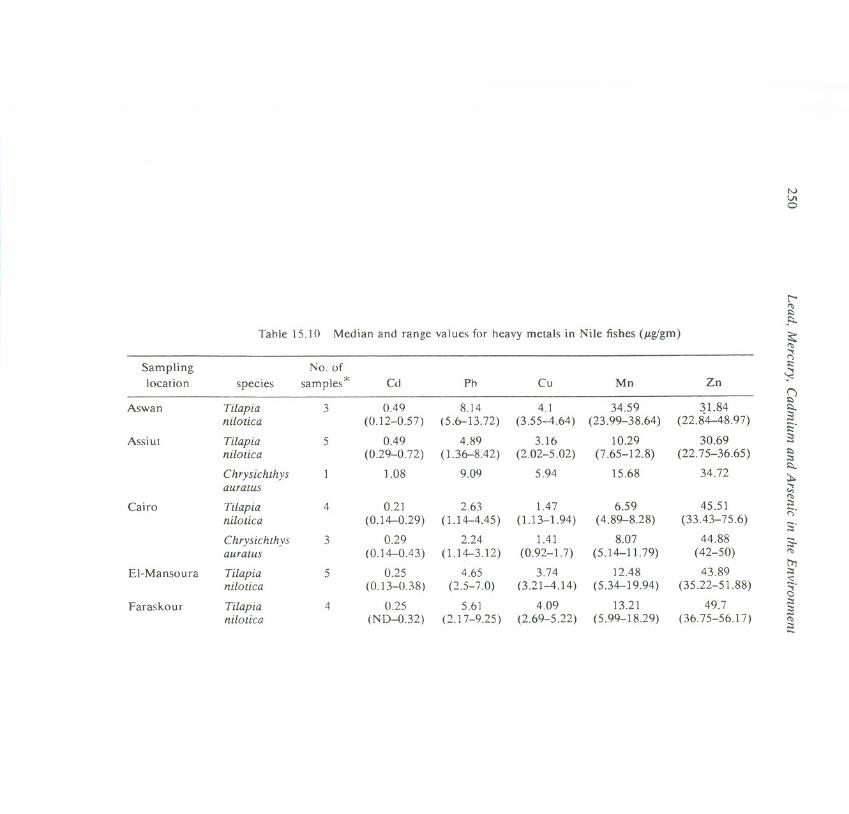
Assessing Metal Pollution in Nile River Using Fish Studies
Muscle tissue from five species of fish taken from the Nile River wereanalysed for metals (Table 15.10). If whole fish had been digested, mean
Concentration (/1g!gm)
Sample Location Cd Co Cr Cu Pb Mn Ni
AssiutEI-Hagz 9 47 79 72 204 1159 99group (west drainage)
Trace Metals in Aswan High Dam Reservoir and River Nile Ecosystems 249
Table 15.8 Mean concentrations of selected trace metals in River Nilesediments (1976-1978)
Table 15.9 Means and rangesof metal concentrations in sedi-ments of the River Nile
Concentration (Jlglgm)
concentrations for each species would undoubtedly have been higher sincemetals are known to concentrate in certain target organs.
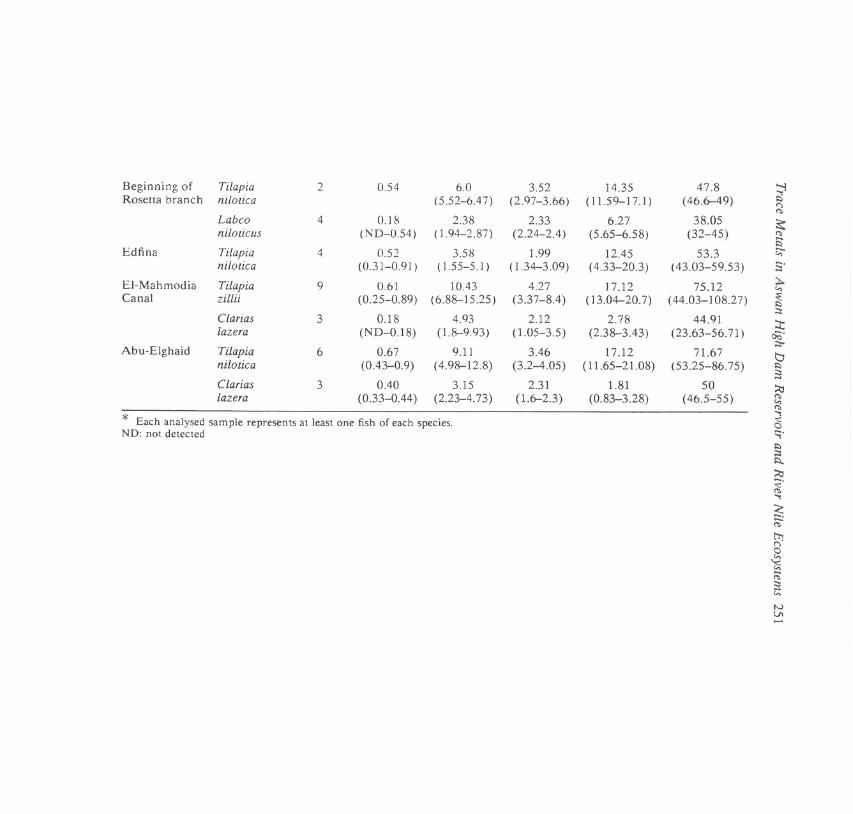
The concentration of zinc was higher than all the measured metals in theanalysed fish. On the other hand, cadmium was lower than the other metals.Fish caught from EI-Mahmodia canal showed the highest metal contentfollowed by Abu-Elghaid canal.
By comparing metals concentrations in the Nile River water and bottomsedimentswith the fish data,it canbe seenthat metalsconcentrationsin
* Each analysed sample represents at least one fish of each species.ND: not detected
252 Lead, Mercury, Cadmium and Arsenic in the Environment
fish flesh were considerably lower thanconcentrationsin bottom sediments.However, all metals were more highly concentrated in fish muscle tissuethan in Nile water.
In recent years, intensive pollution resulting from .the discharge of in-creasing amounts of agricultural, domestic and industrial waste-water to theNile River is reported to have had a .marked effect on the fish productionfrom the river (Maney and Hafez, 1979b).
We conclude that the threat of pollution to the fisheries of Egypt is sensedalthough not yet adequately.defined. It is obvious that considerable workneeds to be done in monitoring of heavy metal concentrations to improveour understanding of their cycle in the Nile environment.
CONCLUSIONS
The important findings of this study are summarized as follows:
1. For all of the metals studied the average level found in the reservoir wateris below the value set by the United States EP A as harmless to aquatic life.
2. The high metal concentrations in sediments relative to that in waterdemonstrate the importance of the suspended matter as a transport path-way for metals.
3. The dissolved oxygen content and oxidation-reduction conditions to alarge extent control the amount and species of metal ions.
4. Some elevated concentrations of trace metals were noted in the region ofLake Nubia. In general though, the trace metal content and suspendedmatter of the water samples revealed significant correlation.
5. The significant drop in metal concentrations in River Nile water mightresult from dilution or from precipitation and adsorption reactions whichwould tend to reduce the metals levels.
6. Trace metals have accumulated in high concentrations in river sedimentsindicating the existence of localized pollution. These metals can be re-leased by various processes of remobilization and move up the biologicalchain, thereby reaching humans and possibly produce chronic and acuteailments.
Recommendations
It is now accepted by environmental scientists that to fully understand thebiological availability, toxicity and transport of heavy metals in natural watersystems, measurements of total metal concentrations are no longer adequate,the chemical forms of the metals in solution must be considered. Electro-analytical techniques should be applied to measure the concentrations of
Trace MetaLs in Aswan High Dam Reservoir and River Nile Ecosystems 253
various metal species and to permit the determination of the equilibriumconcentrations of metal complexes.
A more detailed insight into the relations between heavy metals char-acteristics and physical properties of the solid constituents of the aquaticenvironment is urgently needed, especially in view of processes of bioaccu-mulation.
Partial extraction techniques of metals from aquatic sediments should beapplied to measure the sediment fraction that has a detrimental effect onwater quality and the associated biota.
The presence of high concentrations of heavy metals in Nile sedimentsshould prompt the development of dredged material disposal criteria inEgypt.
Since trace metals are concentrated in biological material a study shouldbe made to ascertain whether metals reach excessive levels in the highermembers of the biological food chains in AHDR and River Nile ecosystems.
As yet the total scope of latent toxic effects of trace metals is unknown.Thus until all doubt about the effect of potentially toxic metals on the bio-logical food chain and drinking water supply is removed, trace metals shouldbe kept to a minimum in all aquatic systems.
ACKNOWLEDGEMENT
This study was supported in part by the funds provided by the 'Water QualityStudies on the River Nile and Lake Nasser' research project administeredby the Egyptian Academy of Scientific Research and Technology and theUniversity of Michigan, USA.
REFERENCES
De Groot, A. J., and Allersma, E. (1975). Field observations on the transport ofheavy metals in sediments. In Krenkel, P. A. (Ed.), Heavy Metals in the AquaticEnvironment, Pergamon Press, New York, 352 pages.
Entz, B. (1974). The Morphometry of Lake Nasser and Lake Nubia. Lake NasserDevelopment Centre, Aswan.
Forstner, U.. and Whittmann, G. T. W. (1979). Metal Pollution in the Aquatic Envi-ronment, Springer-Verlag, Berlin, 486 pages.
Guy, R. D.. and Kean, A. R. (1980). Algae as a chemical speciation monitor. 1A.Comparison of algal growth and computer calculated speciation. Water Res., 14,891-899.
Huange, C. P. (1978). Solid-solution interface: its role in regulating the chemicalcomposition of natural waters. In Gibbs, R. J. (Ed.), Transport Processes in Lakesand Oceans, pp. 9-34, Plenum Press, New York.
Lasheen, M. R. (1982). Water Ouality Study on Aswan High Dam Reservoir, N. R.C. Bull., Vol. 7, Egypt.
254 Lead, Mercury, Cadmium and Arsenic in the Environment
Maney, K. H., and Hafez, M. (1979a). An overview of the Nile physical and hydro-logical characteristics and its major control programs. The Water Quality Bulletin.The World Health Organization, April, 1979.
Maney, K. H., and Hafez, M. (1979b). Water Quality and Ecosystem Considerationin Integrated Nile Resources Management. Proc. of the 1st Water Conf. on WaterRes. Management in Egypt. Ministry of Irrigation and Cairo Univ., Cairo, Egypt.
Martin, J. M., and Whitfield, M. (1983). The significance of the river input of chem-ical elements to the ocean. In Wong, C. S., Boyle, E., Bruland, K. W., Button, J.D., and Goldberg, E. D. (Eds), Trace Metals in Sea Water, pp. 265-296, PlenumPress, New York.
Nurnberg, H. W. (1982). Yoltametric trace analysis in ecological chemistry of toxicmetals. Pure and Appl. Chern., 54(4), 853-878.
Salomons, W. (1984). Contamination in sediment, out of sight out of mind? Int.Conf. En\'. Contamination, London, July 1984. pp. 766-774. CEP Cons. Pub..London.
Sigg, L.. Sturm, M., Davis, U., and Stumm, W. (1983). Metal Transfer Mechanismsin Lakes. Thalassia, Yugoslavia.
Stumm. W., and Morgan, J. J. (1981). Aquatic Chemistry, Wiley Interscience. NY,780 pages.
US Environmental Protection Agency (1972). Water Quality Criteria. NationalAcademy of Sciences.
Whitfield. M. (1981). The world ocean mechanism or machination? Interdiscipl.Sei. Rev.. 6, 20.