19
The District Health Barometer 2005/06 Fiorenza Monticelli, HST, 21 February 2007, District management meeting, Kwazulu-Natal
| Date post: | 17-Dec-2015 |
| Category: |
Documents |
| Upload: | dina-andrews |
| View: | 213 times |
| Download: | 1 times |

The District Health Barometer 2005/06
Fiorenza Monticelli, HST, 21 February 2007, District management meeting, Kwazulu-Natal

The District Health BarometerWhat is it?
• A report that provides a snapshot of performance in key health areas at a specific time across the 53 health districts in SA
• A tool for all managers at district, province and national level for : – Monitoring and evaluation– Strategic planning and annual performance
planning– Identifying quality issues in DHIS data that
need to be addressed.

What is the purpose of the District Health Barometer?
It functions as a TOOL to monitor progress and support improvement of equitable provision of primary health care by: – Illustrating important aspects of the health
system at district level through analysis of indicators.
– Ranking , classifying and analysing health districts (in various groupings eg. metros, provinces, ISRDP sites), by indicators
– Comparing these indicators over time.

What is measured? (DHB year 1) Nurse clinical work load (PHC) Per capita health expenditure (Public sector) Caesarean section rate Male condom distribution rate Immunisation coverage <1y Immunisation drop out rate (DTP-Hib 1 – DTP-Hib 3) Proportion antenatal clients tested for HIV HIV prevalence among antenatal clients tested
Nevirapine uptake rate among HIV+ pregnant women Nevirapine uptake rate among babies born to HIV+
women PHC Utilisation rate TB cure rate Smear conversion rate Incidence of diarrhoea under 5 years (per 1000).
Stillbirth Rate

What is new in the DHB year 2 (2005/06)?Socioeconomic background data
– Household access to piped water– Deprivation indices and quintiles
Financial data– % of DH services expenditure on management – % of DH services expenditure on district hospitals
Health indicators - 3 financial years and additional indicators– Incidence of STIs treated – Underweight rate for age < 5 years – Delivery rate in facility – Perinatal mortality rate in facility – Average length of stay– Bed utilisation rate
Facility data– Number of public and private facilities – Number of public and private beds.

Publication ContentsBackground, Introduction & Overview , Methodology
Section A : Indicator Comparisons by district – For 53 districts, 6 metro and 13 rural nodes– Change in performance 2003/04 to 2005/06
Section B : District and province profiles– Map, data table & summary analysis
Appendices : – Definitions, Deprivation indices detail,
indicator correlations, maps, data table, resources and references.

Districts by deprivation indexDeprivation index, 2001
0 1 2 3 4 5
West Coast DMOverberg DM
Cape Winelands DMEden DM
Central Karoo DMNamakw a DM
Cape Tow n MMSiyanda DM
Johannesburg MMN Mandela MMSedibeng DM
Pixley ka Seme DMFrances Baard DM
Tshw ane MMEkurhuleni MMWest Rand DM
Cacadu DMMetsw eding DM
Xhariep DMeThekw ini MMSouthern DM
Fezile Dabi DMMotheo DM
Lejw eleputsw a DMNkangala DM
uMgungundlovu DMBojanala Platinum DM
Amajuba DMWaterberg DMG Sibande DM
T Mofutsanyane DMEhlanzeni DM
Central DMBophirima DMAmathole DMCapricorn DMKgalagadi DM
Mopani DMC Hani DM
Bohlabela DMiLembe DM
Ukhahlamba DMUthungulu DM
Uthukela DMVhembe DM
Ugu DMSisonke DM
Gr Sekhukhune DMZululand DM
Umkhanyakude DMUmzinyathi DM
A Nzo DMO Tambo DM
better Index worse
EC
FS
GP
KZN
LP
MP
NC
NW
WC
Metros
Umkanyakude UmzinyathiA Nzo & O R Tambo all are ISRDS nodes
uMgundundlovu
SOCIOECONOMIC INDICATOR

Per Capita Health Expenditure (PHC public sector) 2005/06
0 100 200 300 400 500
Gr Sekhukhune DMMetsw eding DM
Siyanda DMG Sibande DMBohlabela DM
West Rand DMAmajuba DMNkangala DM
Waterberg DMCapricorn DM
Lejw eleputsw a DMA Nzo DM
Uthukela DMCacadu DM
Tshw ane MMN Mandela MMOverberg DM
Frances Baard DMUkhahlamba DMCape Winelands
Fezile Dabi DMO Tambo DM
iLembe DMEhlanzeni DM
Umzinyathi DMuMgungundlovu
Zululand DMBojanala Platinum
Sedibeng DMUgu DM
Mopani DMT Mofutsanyane
Motheo DMVhembe DM
Pixley ka Seme DMUthungulu DMAmathole DM
Eden DMJohannesburg MM
C Hani DMKgalagadi DMSouthern DM
eThekw ini MMEkurhuleni MM
Sisonke DMCentral DM
West Coast DMUmkhanyakude DM
Central Karoo DMCape Tow n MM
Xhariep DMNamakw a DMBophirima DMSouth Africa
Rand
EC
FS
GP
KZN
LP
MP
NC
NW
WC
SA
SA ave 2005 = R232
SA ave in 2001= R168
INPUT INDICATOR
R115
R166
R309


Change in per capita expenditure 2001/02 to 2005/06
-150 -100 -50 0 50 100 150 200 250
Ekurhuleni MMJohannesburg MM
Metsw eding DMOverberg DM
Eden DMCape Tow n MM
Central Karoo DMWest Rand DM
Cape Winelands DMTshw ane MMAmajuba DMSiyanda DM
uMgungundlovu DMGr Sekhukhune DM
West Coast DMBophirima DMUthukela DMSouthern DM
Waterberg DMUgu DM
Frances Baard DMZululand DM
N Mandela MMSedibeng DM
Pixley ka Seme DMBojanala Platinum
Ehlanzeni DMeThekw ini MMUmzinyathi DM
Mopani DMLejw eleputsw a DM
Uthungulu DMBohlabela DM
iLembe DMG Sibande DM
Sisonke DMCapricorn DM
Motheo DMAmathole DMVhembe DM
A Nzo DMKgalagadi DM
Fezile Dabi DMO Tambo DMCacadu DM
Nkangala DMCentral DM
Umkhanyakude DMNamakw a DM
C Hani DMT Mofutsanyane DM
Ukhahlamba DMXhariep DM
South Africa
Rand (change)
EC
FS
GP
KZN
LP
MP
NC
NW
WC
SA
Change in per capita health expenditure 2001-2005
UmkhanyakudeR143 more
Amajuba R18 more
Metros and less deprived
districts spending less

Perinatal mortality rate 2005/06Perinatal mortality rate, 2005/06
0 20 40 60 80 100
N Mandela MMZululand DM
A Nzo DMO Tambo DMAmajuba DM
Ukhahlamba DMCacadu DMiLembe DM
Lejw eleputsw a DMNkangala DMBohlabela DMAmathole DM
Sisonke DMG Sibande DM
T Mofutsanyane DMMotheo DM
Gr Sekhukhune DMeThekw ini MM
Xhariep DMSiyanda DM
Capricorn DMUmzinyathi DMEkurhuleni MM
Ugu DMWest Rand DM
Ehlanzeni DMuMgungundlovu DM
Central Karoo DMFezile Dabi DM
Mopani DMUthungulu DM
Uthukela DMWaterberg DMTshw ane MM
Umkhanyakude DMSedibeng DMNamakw a DM
Frances Baard DMJohannesburg MM
Eden DMC Hani DM
Cape Winelands DMWest Coast DMCape Tow n MM
Vhembe DMOverberg DM
Pixley ka Seme DMKgalagadi DM
Central DMBophirima DM
Bojanala Platinum DMSouthern DM
Metsw eding DMSouth Africa
Per 1000 births
EC
FS
GP
KZN
LP
MP
NC
NW
WC
SA
Below SA ave of
34/1000
More deaths than SA ave and over 40
Unrealistic/ data
problems
Unrealistic/ data
problemsIMPACT INDICATOR

Immunisation coverage 2005/06Immunisation coverage 2005/06
0 20 40 60 80 100 120 140
Metsweding DMWaterberg DM
West Rand DMNamakwa DMEhlanzeni DM
Central DMG Sibande DM
Southern DMWest Coast DM
Zululand DMOverberg DMUthukela DM
Xhariep DMCape Winelands DM
Bojanala Platinum DMAmajuba DM
eThekwini MMEkurhuleni MMNkangala DM
Lejweleputswa DMSiyanda DM
Bophirima DMEden DM
Ukhahlamba DMJohannesburg MM
Gr Sekhukhune DMUmzinyathi DMBohlabela DM
T Mofutsanyane DMMotheo DM
Cape Town MMMopani DM
Sedibeng DMCacadu DM
Central Karoo DMCapricorn DMKgalagadi DM
Umkhanyakude DMFezile Dabi DM
Tshwane MMiLembe DM
Uthungulu DMAmathole DM
Pixley ka Seme DMVhembe DM
O Tambo DMSisonke DM
A Nzo DMN Mandela MM
Frances Baard DMuMgungundlovu DM
Ugu DMC Hani DM
South Africa
Percentage
EC
FS
GP
KZN
LP
MP
NC
NW
WC
SA
SA ave 90.3% up from 80.7% 2003
Ugu 117.9 %Zululand 79.5 %
OUTPUT INDICATOR

TB Cure rate, 2004
0 10 20 30 40 50 60 70 80 90 100
Nkangala DMUthungulu DM
Frances Baard DMuMgungundlovu DM
G Sibande DMAmathole DM
Ugu DMeThekw ini MM
Umkhanyakude DMO Tambo DM
A Nzo DMEhlanzeni DMUthukela DMSiyanda DMiLembe DM
Pixley ka Seme DMN Mandela MM
C Hani DMSouthern DMSisonke DMZululand DM
Ukhahlamba DMMopani DMCacadu DM
Gr Sekhukhune DMUmzinyathi DMEkurhuleni MM
Central DMBojanala Platinum DM
Namakw a DMKgalagadi DM
Fezile Dabi DMSedibeng DMAmajuba DM
Johannesburg MMTshw ane MM
Cape Winelands DMMotheo DM
Cape Tow n MMT Mofutsanyane DM
Bophirima DMXhariep DM
Capricorn DMLejw eleputsw a DM
Metsw eding DMCentral Karoo DM
West Rand DMWest Coast DM
Vhembe DMBohlabela DM
Waterberg DMEden DM
Overberg DMSouth Africa
Percentage
EC
FS
GP
KZN
LP
MP
NC
NW
WC
SA
TB cure rate 2004 SA target 2005/6 = 65%
SA ave 2004 = 50.8%, SA ave 2003 = 56.7%
Overberg 84.5%
34 districts achieved over 50% cure rate
uMgungundlovu 23%Uthungulu 18.1%
Nkangala 12%
Sisonke 50.6% from 23.7%
OUTCOME INDICATOR
61.1%

District Profiles
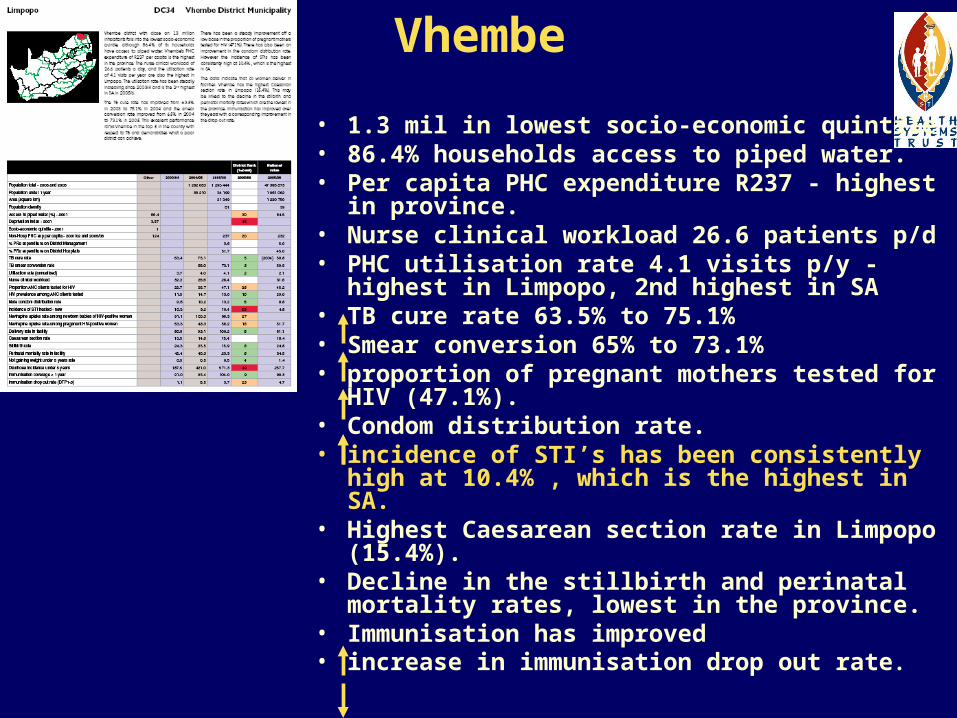
Vhembe
• 1.3 mil in lowest socio-economic quintile • 86.4% households access to piped water. • Per capita PHC expenditure R237 - highest in
province. • Nurse clinical workload 26.6 patients p/d• PHC utilisation rate 4.1 visits p/y - highest in
Limpopo, 2nd highest in SA • TB cure rate 63.5% to 75.1% • Smear conversion 65% to 73.1% • proportion of pregnant mothers tested for HIV
(47.1%). • Condom distribution rate. • incidence of STI’s has been consistently high
at 10.4% , which is the highest in SA. • Highest Caesarean section rate in Limpopo
(15.4%). • Decline in the stillbirth and perinatal mortality
rates, lowest in the province. • Immunisation has improved • increase in immunisation drop out rate.

DC27 Umkhanyakude• 586 000 with v. poor socio-economic status • PHC expenditure per person=R309, incr of R143 from 2001, rank = 6• PHC utilisation 2.2 visits pp/y. • Nurse clinical workload 22.7 in 2005 from 38.8
in 2004.• TB cure rate improved from 30.0% in 2003 to
34.9% in 2004 , rank 45• Smear conversion rate 47.1% in 2004 to 44% in
2005 !!!!!• Pregnant mothers tested for HIV decr to 58.6%
from 73.1 in 2004! • HIV+ve mothers receiving NVP from 57.5 % in
2003 to 68.5% in 2005. • NVP - newborn babies decr to 77%! Rank 45• Male condom distribution ave 10.9 per man. • Perinatal mortality declining 47.7 – 30.8 – 30.1
rank 18 • Immunisation coverage 96.8, Drop out rate 5.1.

Data Quality!• DHB is considered a valuable tool (National DOH,
Treasury, WHO, health managers at all levels)• Data extracted is the official dataset for 2005/06,
(extracted June 2006) as submitted by the provinces to Treasury and the NDOH
• Bad quality data is brought to light in DHB• Report could be more useful with better quality & reliable
DHIS data – decision making improved• Improving quality of DHIS data is ongoing - BUT leads to
multiple data extractions / sources.
Use the DHB to identify areas which require improvement in data quality and improvement in
performance.

How to use the DHB
• Gives an idea which areas to focus your attention on– Explain the data, look at the trends, look for
underlying reasons why, how can it be improved in the future, set a new target and steps to achieve it.
• Can compare your district to other districts – what can one learn from one another.
• Monitor and evaluate progress.
• Identify and improve data quality issues

We acknowledge the National Department of Health for access to and use of their data for this publication and Atlantic Philanthropies
for funding the project
Your comments / suggestions are valued!
e-mail [email protected] you


