The Dividends of Religious Freedom: An Empirical Analysis of the Effects of Religious Liberty on Forty Years of Membership Growth for Three, Strict, Evangelizing Christian Religions 1 May 23, 2012 Donald B. Holsinger 2 Although recent research has established that there are positive correlations among indicators of religious freedom and social capital and economic development, the question addressed in this paper has to do with the evangelistic success of three outreach-oriented churches with worldwide membership bases. By “success” is meant the growth of their worldwide memberships rather than religiosity. This investigation uses the Average Quinquennial Growth Rate (AQGR--annualized 5-year compound growth rate) as the dependent variable of interest. Jehovah’s Witnesses, Mormons (or, interchangeably, LDS) and Seventh-day Adventists all share a great deal in common. They are strict in the sense of requiring adherence to behavior peculiar to their religious tradition and uncommon to the cultures in which they are embedded. They also rely heavily on worldwide evangelism to spread their message and acquire new adherents. All three religions have approximately fifty-year histories in a wide range of countries, and employ active proselyting methods for spreading their message to attract new adherents. These religions are all active in the promotion of freedom of religion in the legal and social contexts in which they perform their evangelizing activities. The central question addressed in this paper is whether religious liberty has affected membership growth in a sample of 170 countries over a period of the past forty to fifty years. Not much work has been done on this question although two scholars recently hypothesized a negative relationship but their work did not focus on the freedom of religion dimension to growth. I were unable to find a significant association between religious liberty and my indicator of membership growth for any of the three religious groups. I did find significant associations between membership growth and human development (strongly negative), and also with economic development (also negative), providing some support for the modernization theory of religious growth. Religious liberty has little to do with predicting how well the religion performs in terms of adding new proselytes. This finding isn’t intuitively obvious. Many casual observers have been tempted to find that strictures against religion, such as proselyting bans, restrictive registration laws, strong bias against minority religious doctrines and outward practices, are at least as important as any inherent attraction that a new religion might itself provide. I find no evidence for these conclusions. 1 Appreciation is extended to the many people who have read this manuscript and commented on it including Dr. Brian Grim, Dr. Ryan Cragun and my wife, Ellen S. Holsinger. 2 Dr. Holsinger is Professor Emeritus of International Development Studies at Brigham Young University’s David M. Kennedy Center for International Studies. He and his wife represent the Kennedy Center, an accredited NGO in special consultative relationship with ECOSOC at the Geneva, Switzerland office. Correspondence regarding this paper should be directed to Dr. Holsinger at [email protected].
Transcript
The Dividends of Religious Freedom: An Empirical Analysis of the Effects of Religious Liberty on Forty Years of
Membership Growth for Three, Strict, Evangelizing Christian Religions1
May 23, 2012
Donald B. Holsinger2
Although recent research has established that there are positive correlations among indicators of religious freedom and social capital and economic development, the question addressed in this paper has to do with the evangelistic success of three outreach-oriented churches with worldwide membership bases. By “success” is meant the growth of their worldwide memberships rather than religiosity. This investigation uses the Average Quinquennial Growth Rate (AQGR--annualized 5-year compound growth rate) as the dependent variable of interest. Jehovah’s Witnesses, Mormons (or, interchangeably, LDS) and Seventh-day Adventists all share a great deal in common. They are strict in the sense of requiring adherence to behavior peculiar to their religious tradition and uncommon to the cultures in which they are embedded. They also rely heavily on worldwide evangelism to spread their message and acquire new adherents. All three religions have approximately fifty-year histories in a wide range of countries, and employ active proselyting methods for spreading their message to attract new adherents. These religions are all active in the promotion of freedom of religion in the legal and social contexts in which they perform their evangelizing activities. The central question addressed in this paper is whether religious liberty has affected membership growth in a sample of 170 countries over a period of the past forty to fifty years. Not much work has been done on this question although two scholars recently hypothesized a negative relationship but their work did not focus on the freedom of religion dimension to growth. I were unable to find a significant association between religious liberty and my indicator of membership growth for any of the three religious groups. I did find significant associations between membership growth and human development (strongly negative), and also with economic development (also negative), providing some support for the modernization theory of religious growth. Religious liberty has little to do with predicting how well the religion performs in terms of adding new proselytes. This finding isn’t intuitively obvious. Many casual observers have been tempted to find that strictures against religion, such as proselyting bans, restrictive registration laws, strong bias against minority religious doctrines and outward practices, are at least as important as any inherent attraction that a new religion might itself provide. I find no evidence for these conclusions.
1 Appreciation is extended to the many people who have read this manuscript and commented on it including Dr. Brian Grim, Dr. Ryan Cragun and my wife, Ellen S. Holsinger. 2 Dr. Holsinger is Professor Emeritus of International Development Studies at Brigham Young University’s David M. Kennedy Center for International Studies. He and his wife represent the Kennedy Center, an accredited NGO in special consultative relationship with ECOSOC at the Geneva, Switzerland office. Correspondence regarding this paper should be directed to Dr. Holsinger at [email protected].
Dividends of Religious Freedom page
2
INTRODUCTION Most outreach-oriented Christian religions invest heavily in the defense and promotion of religious freedom even though there is scant evidence that its presence or absence materially affects the success of their missionary endeavors. By “success” is meant both the growth of membership through convert baptisms and in the establishment of new congregations. I am not so much interested in “religiosity” as in the quality of a person’s religious life. This paper takes a social organizational approach and examines church attendance or membership as a function of the degree to which governments create environments of religious restriction or religious freedom and, to a lesser degree, the amount of social hostility toward religion or, conversely, the tolerance in society for religious diversity. Together with with Anthony Gil, I have wondered what it is that promotes religious participation in a country.3 The secularization or modernization thesis is clear. As rural peoples became increasingly exposed to the institutions of urban, secular life, religion is no longer necessary and the growth experienced in pre-modern eras attenuates. Several excellent scholars including Cragun and Lawson have demonstrated quite convincingly that religious growth has, in the past couple of centuries, predictably followed an inverted “U” pattern where memberships rise rapidly, stagnate, and then fall, each phase aligned with the stages of economic development.4 Is it axiomatic, I ask, that faith decreases, and affiliation with religious bodies diminishes, with each successive wave of technological advance? If yes, why is it that the Pew Foundation has found that the number of religious people is increasing around the world at the same time that Grim and Finke have reported religious intolerance is also on the rise?5 Recent research by Grim and Finke has established that there are positive correlations among indicators of religious freedom and social capital and economic development.6 Still the question of the impact of religious liberty on the ability of evangelistic churches to succeed in their core mission was not examined. This paper addresses an issue of interest not just to sociologists but also to Christian religions who take as a foundational doctrine (often stated in terms of the Great Commission, Matthew 28:19-20) the requirement to take the Christian gospel to all people. Despite their evangelizing efforts, modernization theorists have maintained that the inherent attraction of religion declines with the rise of secular society. Former British Prime Minister Tony Blair recently put the question this way: "For years, it was assumed, certainly in the West, that, as society developed, religion would wither away. For many Europeans brought up in the 1960s and 1970s there was a single equation: as society progressed, religion would decline. It hasn’t happened. The global numbers
3 Gill and Lundsgaarde use participation and religiosity interchangeably whereas I am looking here at religious participation in explicitly public ways such as attendance at worship services, baptism and witnessing activities. I use church reported membership data not self-reported identification. 4 Personal correspondence with Cragun and Lawson revealed their interest in the religious liberty variable but that they had concluded it had little additional effect on religious growth above and beyond “majority Muslim” and “formerly communist.” 5 This conclusion is from Brian Grim’s presentation to the United Nations of Geneva conference of February 27, 2012 which this author helped to sponsor. See “References” for published work. 6 See Brian J. Grim and Roger Finke, The Price of Freedom Denied; Religious Persecution and Conflict in the Twenty-First Century; Cambridge University Press, 2011.
Dividends of Religious Freedom page
3
of those espousing a faith has increased and what’s more has increased even in many nations enjoying strong prospects of development.”7 Blair provides no evidence for the assertion that the global number of those espousing a faith has increased but there are two possible explanations open to him. First, the discrepancy between demographic evidence and Blair’s assertion may be accounted for by the distinction between numerical growth of religious adherents and the number of religious people of political influence. Perhaps Blair refers here to the latter. Second, Blair may be relying on estimates of Muslim growth to reach his conclusion. The much predicted doubling of the population of the Arab world over the next 25-30 years will lead to a substantial rise in the numbers of Muslims. In Southeast Asia, Indonesia’s high birth rates will also add to the share of Muslims in the world population. For Christians, however, Blair’s reference to evangelical growth in Latin America is a specious argument as these converts are coming from Catholicism and hence will not contribute to the global number of Christians. An excellent source documenting and discussing the meaning of religious adepts around the world is found in the highly acclaimed work of Norris and Inglehart.8 Freedom of Religion is explicitly acknowledged in the United Nations as a human right. This right was enshrined in Article 18 of the Universal Declaration of Human Rights and has been used throughout the free world as the basis for legal opinions and customary law. I also use this United Nations definition for my religious liberty variable in this paper.9 Legal scholars and social scientists from a variety of disciplines have, in recent years, pointed to a range of threats to religious liberty stemming from both courts and legislative bodies at the national and international levels. Among many others, one recurring concern about the effects of the erosion of religious liberty is the impact this might have on the ability of some faiths to carry out the work that is a central feature of their existential rationale. This study intends to cast empirical light on the strength and validity of the relationship between a repeated measure of religious liberty on the one hand and religious success on the other. The central question, then, is how religious success is affected by religious liberty. I use “freedom of religion or belief” and “religious liberty” interchangeably. Legal scholars suspect that the two have a direct positive relationship whereas some social scientists have suggested a relationship in the opposite direction. I align my hypothesis with that of Gil, who posited, “religious freedom and religious prosperity were linked.”10 But the hypothesized associations have never been demonstrated empirically to my knowledge. Interest in this topic is not confined to the three religions identified in this study. The implications
7 Tony Blair in a January 2, 2012 blogpost "Faith in a Globalized Age," published on New Europe Online. 8 Pippa Norris and Richard Inglehart, Sacred and Secular: Religion and Politics Worldwide. Cambridge University Press, New York, 2006 9 The United Nations’ definition includes: (1) The right to freedom of thought, conscience and religion as found in article 18 of the Universal Declaration of Human Rights (“UDHR”) and article 18 of the International Covenant on Civil and Political Rights (“ICCPR”), and (2) the right to nondiscrimination and equal protection as found in article 7 of the UDHR and article 26 of the ICCPR. Very few definitions of Freedom of Religion depart materially from this standard. 10 Anthony Gill, The Political Origins of Religious Liberty. By Anthony Gill. Cambridge University Press, 2008. 263 pages and Anthony Gill, “Rationality and Society”
Dividends of Religious Freedom page
4
for all religious persuasions and, indeed, for a range of other independent civil associations, is evident. LITERATURE REVIEW Freedom of Religion, the subject of a huge literature in the field of International Law and Religious Studies generally, is not commonplace in the Sociology of Religion. It is not prominent in the religious economies model, which seems an oversight given the contextual prominence of both government regulation and social restrictions on the observance of religion as a practical, daily matter. In part this may be due to the paucity of religious liberty data prior to the ARDA dataset now increasingly well known due to the work of Grim and Finke.
Sociologists, historians and other social scientists, notably political scientists, have extensively studied religious membership growth rates. Rodney Stark, in particular, popularized the notion of the religious economies model and did much to bring this field to the attention of serious scholars of large-scale social phenomena. An excellent review of Stark’s huge contribution to the literature of the field is found in the work of D. Hackett in the early 1990s. The work Roger Finke, who frequently collaborated with Stark and, more recently, with Brian Grim, has had a large impact on the field and on this author.
The generally accepted understanding of religious growth for new, minority religions can be summarized from the work of several scholars as follows. The growth of religious adepts in a particular country generally follows a pattern based on the number of members and worldwide growth histories, length of time a religion has been present in a country, convert baptism rates, and the receptivity of the population where congregations are established. Geometric growth rates (steady or increasing percentage growth) occur in countries in the early years of a religion’s presence and where small membership, high local receptivity, and a recent establishment are all present simultaneously. As membership increases and several years or decades elapse since the initial entry of a new religion into a country, receptivity begins to slowly decline in the areas of a country where the religion has congregations, and thereafter membership growth rates are generally thought to behave in a normal arithmetic manner.
But explaining variations in growth rages has proven challenging and contentious and several competing theories have been advanced. Sociologists Cragun and Lawson11 have recently argued that both supply and demand-side characteristics of national populations contribute to religious growth.12 The question often posed by social scientists is which of the several supply-side and demand-side characteristics contribute the most religious growth, and in what combination and periods of socioeconomic development. Cragun and Lawson are primarily concerned with the demand side and postulate that socioeconomic development and modernization are powerful factors in determining religious growth at certain time periods. The crux of their argument is that socioeconomic development of countries will over time lead to a transition toward secular attitudes, values and beliefs, and that the increasing acceptance of secular explanations of social and natural phenomena curtails the growth of religions. They use 30 to 35 years of growth data for LDS, SDA and JW to make their
11 The Secular Transition: The Worldwide Growth of Mormons, Jehovah’s Witnesses, and Seventh-day Adventists by Ryan T. Cragun and Ronald Lawson, Sociology of Religion, 2010. 12 Supply side factors are characteristics controlled by the proselyting religions whereas demand side factors are characteristics of the population of potential converts.
Dividends of Religious Freedom page
5
case. The explanation for why Cragun and Lawson did not use a “Freedom of Religion” variable in their theoretical model probably has to do more with its availability for only three years (2001, 2003 and 2005) and less to do with its theoretical relevance. I encountered the same problem but found an alternative path using Freedom House data. Cragun and Lawson refer to the “religious economies” model as an alternative explanation for religious growth. In the “religious economies” theory, supply-side factors are those that the religious group itself controls and brings to a country context usually in a unique way. These include a personal response to central message and beliefs of the religion. Demand-side factors are those that are found embedded in the population being proselytized—namely, the socioeconomic context (or culture) in which a religion is attempting to grow. Disentangling the two types of factors is complex. Cragun and Lawson argue that both are important factors in explaining country-level religious growth. But they prefer the modernization theory as reflected in their two central hypotheses: (1) modernizing countries will have the highest rate of growth, and (2) pre-modernizing and highly modernized countries will have much lower rates of religious growth. Fundamentally, the Cragun and Lawson explanation for the pattern of worldwide growth of the religious groups is that they provide “existential security” in the face of socioeconomic insecurity. When insecurity declines, so does membership growth. Cragun and Lawson shared with me the comments of one of the original Sociology of Religion journal reviewers. One referee called the authors’ attention to the fact that their analysis had not controlled for either social or government regulation of religion. The reviewer suggested that, “Inclusion of a measure of religious regulation could substantially change your empirical results and therefore your theoretical explanation.” The authors disagreed. They rejoined that they that had run regression models that included the government regulation variables from Grim and Finke. They noted that these religious freedom variables were available for only three years, 2001, 2003 and 2005 and therefore did not allow for coterminous examination with their thirty-five year religious growth dataset. The authors then showed evidence that the variables, “Predominately Muslim” and “Currently Communist” captured essentially the same variation in membership growth as did the two ARDA13 variables “Government Regulation” and “Social Restriction”. Statistical efforts to include the ARDA composite variables produced a somewhat counter-intuitive finding. From Cragun and Lawson: “With the full models, in only one case is one of the government regulation variables significant—Government Regulation significantly INCREASES Mormon growth rates. In no models do the Government Regulation variables significantly decrease growth rates. However, the Current Communist and Predominately Muslim variables are significant in almost every case.”14 Also relevant to my research is the work of Fox and Tabory15 who examine the impact of government support for religion as a factor affecting religious growth. They do not use the ARDA data for empirical indicators of religious freedom but rather the Religion and State (RAS) database. Their dependent or outcome variables are attendance at religious services, religious 13 The Association of Religious Data Archive hereafter referred to in this manuscript by the convenient acronym ARDA. The proper citation for the ARDA data is Grim and Finke (IJRR, 2006). 14 Cragun and Lawson correspondence with the editors of Sociology of Religion shared with us and cited with permission. 15 “Contemporary Evidence Regarding the Impact of State Regulation of Religion on Religious Participation and Belief” by Jonathan Fox and Ephraim Tabory, Sociology of Religion, 2008, 69:3 245-271.
Dividends of Religious Freedom page
6
beliefs, and practices in an overall composite measure that the authors call “religiosity.” The authors’ conclusion is summarized in their statement that, “Overall, the results of the data analysis provide qualified support for the argument that government involvement in religion is associated with lower levels of religiosity.” This paper is of less specific interest here than might be thought from its title alone. The outcome variable “Religiosity” is vague enough to be problematic for any given religious group. Moreover, the question for us is not how religious people are under varying levels of state involvement, but rather if strict, proselyting religions can grow in the presence of state-imposed regulations and socially imposed restrictions on religious freedom. METHODS AND DATA This research draws heavily on ARDA16 and Freedom House data to quantify the nature and variation of religious freedom present in a given year in most countries of the world. ARDA data typically refer either to government laws, regulations and established practice, or to social acceptance or rejection of religion by the citizens of a nation state. The 60 variables that are collected by ARDA are combined into three summary or composite measures. I use the composite indicators in this study. But, as I will point out, the limited time frame of the ARDA I indicators caused me to draw on a different data set for the analysis. In principle it should be possible to relate variations in the degree of religious freedom, as summarized by the composite or scale score, to variation in religious success. Again, due to the limited time frame covered by the ARDA data, I found it necessary to use an alternative source for estimates of religious freedom characterizing countries prior to 2000. The RAS dataset is limited to 1990 and forward, and therefore also not suitably matched to the analysis planned. The best data source, providing 40 years of country specific data, was from Freedom House, whose “civil liberties” variable is significantly based on the Universal Declaration of Human Rights and has a substantial proportion of all questions devoted to freedom of religion and belief (significant to the matter of face validity). Correlations of the Freedom House “civil liberties” variable with three other freedom of religion variables were uniformly high, positive and significant: IRLA = +.68; ARDA = +.77; and RAS = +.58. For this reason I used the Freedom House “Civil Liberty” variables as proxies for freedom of religion for the quinquennia between 1970 and 2000. I will now briefly address possible concerns with respect to the use of the Freedom House “civil liberties” measure. There are many reasons why this measure is appropriate here not least because it provides the longest continuous time frame. Additionally, it is heavily biased toward the UN Universal Declaration, Article 18. There has been modest debate in the academic world about the sub-categories of the scale or scale factors and also of the inter-rater reliability in assigning numerical ratings on an item for a country. Most composite indicators are subject to this same type of criticism including the Overall Modernity (OM) scale that I cut my teeth on years ago as an Inkeles doctoral student. The reader should understand and evaluate my use of the Freedom House Civil Liberties measure in relationship to one’s own methodological preferences. Moreover, where human rights are concerned, and Freedom of Religion or Belief in particular, there are few absolute universally acknowledged valid measures. The Freedom House civil liberties scale enjoys substantial correlations with other measures of Freedom of 16 The Association of Religious Data Archive (ARDA) is a collection of surveys, polls, and other data submitted by researchers and made available online by the ARDA. The international freedom of religion data are derived primarily from the work of researchers Grim and Finke. These data are commonly referred to among sociologists of religion and by Brian Grim himself as the ARDA data set and are referred to by that acronym in this paper.
Dividends of Religious Freedom page
7
Religion, including ARDA. The inter-correlations are sufficiently high so that they can be substituted for each other without significantly altering any subsequent analysis. That is an acceptably strong argument for validity. Religious success indicators are meant to measure the degree of essential “business” and ecclesiastical practices found in three worldwide Christian religions. These “success” measures include, inter alia, the ability to conduct free and open worship services, to appoint church leaders, to hire and terminate employees who observe required religious practice standards, to own property, and to live free of religious-based persecution. For purposes of this study three religions are compared: The Church of Jesus Christ of Latter-day Saints (Mormons or alternatively LDS), Seventh-day Adventists (SDA) and Jehovah’s Witnesses (JW). These well-known Christian religions all have western (American) origins and rely heavily on worldwide evangelism to spread their message, acquire new adherents, and establish themselves as recognized religious organizations for legal and tax purposes. The construction of a measure of evangelistic success and related indicators of the numerical strength and growth of these religious bodies is limited by available, secondary or pre-existing data sources often supplied by the religions themselves. In some cases, composite indexes or scale indicators are constructed by combining several data points. For Mormons, missionary work is a well understood activity and the majority of active male (and large numbers of female) members have themselves served as Mormon missionaries in their early adult lives and many in their post retirement years. LDS evangelistic “success” is typically equated with the ability to teach core doctrinal principles, to baptize receptive listeners who are then received into fellowship by a local congregation. Baptisms and baptismal rates, in relation to the number of missionaries assigned to a given country and over time, are accepted as measures of missionary success. “Success” in the above sense clearly depends on the ability to join the missionary and the prospective adherent or “investigator” in the same physical space and at the same time. For this to happen the evangelist must be able to travel to the place where the prospective convert lives. If this is in the home country of the evangelist, there are probably no special legal prerequisites involved. However, in the commonplace circumstance of a North American message carrier and a distant pool of prospective adepts outside of North America, the ability of the one to enter and remain in a country of the other is foundational. Hence, the significance attached to missionary visas for the success of worldwide evangelism is clearly seen. Together, a small cluster of favorable outcomes defines what I mean by evangelistic success. These are readily understood and enjoy a high degree of face validity. In this preliminary investigation, I have not achieved a satisfactory “success” indicator and fall back on membership growth as a proxy measure. I emphasize that I are not satisfied with this approach and intend to redo the analysis once I have been able to construct a success indicator for all three religions that meets standards of validity and reliability. Still, the annual number of new adherents added to membership rolls in a given country is one fair, and perhaps the most commonplace denominator, of success. Throughout most of the Christian community, membership growth denotes the successful spreading of the Christian gospel as understood by a particular Christian denomination. The ability of the community of believers to worship together freely and without outside (social or governmental) interference is another form of success. Perhaps not as crucial to growth as the first but nevertheless it is a essential that members of a particular religious denomination enjoy the opportunity to associate freely with others of the same confession.
Dividends of Religious Freedom page
8
MEMBERSHIP DATA SOURCES AND CONSTRAINTS (dependent variables) Initial efforts to compile a working data set included 210 countries. Many of these were not members of the United Nations and others were very small with populations of less than 50,000. Eventually I decided to limit my attention to countries with populations of greater than 250,000. This decision left us 170 countries and allowed us to focus on countries most likely to act independent of larger neighbors. By limiting my dataset to 170 countries, I exclude less than .5 percent of the world’s population. Religion membership data for total annual membership over the 50-year time frame (1960 to 2010) are available from a number of sources; however, this paper relies on officially published “membership” numbers.17 Membership is defined differently even among these three religions that otherwise have much in common. Total membership may include annual increases from natural internal births and from converts reported for a given year. Or it may focus on measures of religious practice or observance, as illustrated best by Jehovah’s Witnesses or the Watchtower Bible and Tract Society. Membership data from SDA and JW are a rather straightforward matter of accessing publically available databases on the internet. Data for the LDS Church are more complicated. LDS membership data are available from many sources but with some inconsistency, suggesting the need for caution. I relied principally on the Deseret Morning News Church Almanac for country level membership for years 1975 to 2011. Data for the Seventh-day Adventist church are comparatively easy to find as the church maintains a website containing membership data by country and over as many years as they have had members in that country.18 The Adventist Office of Archives and Statistics stands in sharp contrast to the two other religions in their openness and transparency of membership numbers. For older SDA data, researchers Cragun and Lawson supplied us with data they obtained from private Adventist sources which I take as reliable. As with all membership data in my file, I use missing data codes whenever there is any reason to doubt the accuracy of data at hand. The country-level data19 for Jehovah's Witnesses used in this paper come from their own yearly reports. Jehovah's Witnesses’ records are considered to be exceptionally precise and reliable. But it should be kept in mind that my membership numbers are based on "average monthly publishers," i.e., the yearly average of monthly self-reported counts of "publishers." Publishers are Jehovah's Witnesses in good standing who have submitted a report of their proselyting activity during the month. One must be an average publisher or better to be considered a member. 17 Subsequent analyses will use more nuanced measures of religious success that incorporate organizational strength dimensions as well as membership. 18 For additional information see http://www.adventistarchives.org/docs/ASR/ASR2009.pdf. The historical membership archive is found at http://www.adventistarchives.org/documents.asp?CatID=9&SortBy=2&ShowDateOrder=True 19 It should also be noted that Jehovah's Witnesses reports summarize data based on "lands" and not strictly by nations as defined by the United Nations. In fact, Hawaii and Alaska are still listed separately from the United States.
Dividends of Religious Freedom page
9
This standard for being counted as a "member" means the Jehovah's Witness statistics are perhaps the most conservative figures presented by any religious group, and certainly the most conservative of the three religions considered here. Another measure of how many "adherents" the group has can be obtained by looking at their Memorial attendance figures. These figures are simply the count of people at their yearly “communion” meeting. Attendance at a yearly meeting may not seem like a high standard for being counted as an adherent, but it is actually the standard used by groups such as Anglicans to issue estimates of "active" membership. In practice, a large number of people counted in Memorial attendance figures but not counted as publishers may simply be guests or investigators. An even larger number are people who consider themselves Jehovah's Witnesses but aren't currently fulfilling duties required to be counted as a publisher. In Table 1, I present the number of countries in my database by religion and quinquennium. Note that for Q60 the SDA countries are more than twice that of LDS, and the JW nearly four times as numerous as LDS. By Q05, the country numbers are nearly identical for all three religions but that does not mean that the countries themselves are the same. In fact, the degree of overlap is quite small. I do not weight the religions by their worldwide population size because the membership numbers are not sample statistics and, at least for the present, I am not using tests of statistical significance. Table 1: Number of countries by religion and year of membership data availability
Religion
Q60 (1960- 1965)
Q65 (1965- 1970)
Q70 (1970- 1975)
Q75 (1975- 1980)
Q80 (1980- 1985)
Q85 (1985- 1990)
Q90 (1990- 1995)
Q95 (1995- 2000)
Q00 (2000- 2005)
Q05 (2005- 2010)
LDS
33 35 38 48 59 69 109 121 121 121
JW
113 112 121 121 119 111 110 123 133 134
SDAS SDA
71 71 85 88 99 110 118 136 141 143
FREEDOM OF RELIGION VARIABLES (Independent Variables) The Freedom of Religion indicators I consulted and added to the database are four as follow:
1. RAS. The Religion and State (RAS) project is a university-based project located at Bar Ilan University in Ramat Gan, Israel. Its goal is to create a set of measures that systematically gauge the intersection between government and religion. Specifically, it examines government religion policy. The RAS dataset includes a comprehensive range of measures of the extent of government involvement in religion for 175 nations of over 250,000 in population between 1990 and 2002. The dataset is rich in descriptive measures of different kinds of religious discrimination and public regulations (11 types) and restrictions (33 types) on religion.
2. ARDA. The Association of Religious Data Archive (ARDA) is a collection of surveys, polls, and other data submitted by researchers and made available online by the ARDA. The International Freedom of Religion data are derived primarily from the coding efforts of
Dividends of Religious Freedom page
10
researchers Brian Grim and Roger Finke. This coding produced data on 196 different countries and territories (see Grim and Finke 2006 for list of countries coded), but excluded the United States. It also includes three indexes calculated from these data: Government Regulation of Religion index (GRI), Social Regulation of Religion index (SRI), and Government Favoritism of Religion index (GFI). All three years of data (2001, 2003, and 2005) are aggregated into a single dataset, International Religious Freedom Data, Aggregate File, which I use in my analysis. I refer to the aggregate data as a “Composite Religious Freedom” variable and use it for the Q00. I also use it for some analyses under the assumption that it may be applied backward in time. For purposes of this paper I refer to the composite measure as ARDA, just as does Brian Grim who confirmed the commonplace use of the ARDA acronym to refer to the data in person to the author during his visit to the United Nations Geneva in February of this year.
3. IRLA. Chartered in 1893, the International Religious Liberty Association (IRLA) is the oldest association dedicated to freedom of conscience for all people. The IRLA has one of the most active international networks among NGOs. It has national associations in 80 countries—including Kazakhstan, Azerbaijan, and Russia. Every year the IRLA publishes a form of annual worldwide national review in which the human rights record of all countries is described. A numerical rank is assigned to each country on the basis of the country’s overall favorability to religion.
4. FH. The Freedom House Civil Liberties Index measures freedom of expression, assembly, association, and religion. Freedom House rates civil liberties on a scale of 1 to 7, with 1 representing the most free and 7 representing the least free. Countries with a rating of 1 generally have an established and equitable rule of law and complete freedom of religion. A rating of 7 indicates virtually no freedom. Freedom House notes that a poor rating for a country "is not necessarily a comment on the intentions of the government, but may indicate real restrictions on liberty caused by non-governmental terror." Data are available annually from 1972-2008 for 192 countries. Respondents answer a series of survey questions, and the sum of these raw points is used to calculate a country's Civil Liberties Rating. The Civil Liberties questions, including the 2007 additions, are available on-line at http://www.freedomhouse.org/template.cfm?page=351&ana_page=333&year=2007. One of the four categories is “Freedom of Expression and Belief” and the other three are highly relevant to the practice of religious liberty. Freedom House distinguishes between constitutional guarantees of rights and those in practice. Therefore, the survey does not rate governments or government performance per se, but rather the real-world rights and freedoms enjoyed by individuals. Thus, the survey ratings generally reflect the interplay of a variety of actors, both governmental and nongovernmental.
ANALYSIS AND RESULTS Findings on Fifty-year Membership Growth for the Three Religions The first step in a long process was to calculate the growth rates or, more precisely, the Annual Average Quinquennial Growth Rates. Bearing in mind the decision to use a five-year clustered rate called a “quinquennium,” the rate is expressed as the average of the five-year group or hereafter the AQGR. Data were exhaustively checked against all reliable sources.
Dividends of Religious Freedom page
11
The AQGR were calculated following the method described in Appendix A below and presented in Table 2 for each quinquennia and by religion.20 Table 2: AQGR for Three Religions at Each Quinquennium
We had never before seen this statistic as a measure of religious membership change and did not know what to expect. The results show trends similar to those reported by other researchers using the AAGR. I were initially struck by the inter-religion differences of the AQGR coefficients, with the LDS numbers being higher. Even more striking are the trend similarities over time. All three religions show a marked decline in AQGR beginning roughly in 1990. To visualize the rates, a line graph was produced. Figure 1 makes more vivid an anomalous finding for JW data for the Q70 period, namely a sharp drop in membership growth. This finding caused us to recheck the JW membership data several times and even to find alternate sources of data. Bearing in mind that for JW I are looking at the number of “average publishers” it is easier to understand how definitional issues could change the reported number at any given point in time. The steep decline in growth for the LDS Church data in the ten-year period between Q60 and Q70 is also brought into sharp focus by the graphical presentation. At this point I do not attempt to explain this change, merely to note its existence. As mentioned, the three religions all experience a marked decline in growth beginning in Q90. Remembering that this is still positive growth, the worldwide decline at the same time for three completely independent religious bodies is suggestive of an external cause rather than an internal policy shift. Moreover, the growth rates of the three religions appear to be converging.
20 The problem of defining AQGR as an annualized compound growth rate is that some individuals may not understand the definition. One advantage of looking at 5-year growth rates is that they moderate the year-to-year variability. Annual rates can be all over the place.
Dividends of Religious Freedom page
12
Figure 1: AQGR for Three Religions at Each Quinquennium
We also calculated the AQGR for each of the UN regions of the world as seen in Table 3. This gave us an idea of the geographical dispersion of growth and how it differed across the three religions being compared. From Table 2 it is evident that the growth, so similar when expressed in terms of a rate, is very different when examined geographically. Take Eastern Africa, for example. While it has been noted elsewhere that the LDS Church got a late start in “black” Africa, the Adventists did not and their historical growth in that region is evident here.21 On the other hand, the LDS Church in the Americas has enjoyed comparatively great success. TABLE 3: Worldwide Fifty-Year (1960-2010) Average Quinquennial Growth Rate of Three Proselyting Religions by United Nations World Region No. UN World Region LDS JW SDA
1 Eastern Africa .86 5.53 26.09 2 Middle Africa .87 4.76 16.21 3 Northern Africa .04 .27 .27 4 Southern Africa 2.09 2.64 NA 5 Western Africa 4.27 6.75 1.71 6 Caribbean 2.96 2.63 24.54 7 Central America 44.77 17.36 20.94 8 South America 116.80 33.08 68.90 9 Northern America 23.85 14.51 102.50 21 Ronald Lawson and Cragun, Ryan T. Comparing the Geographic Distributions and Growth of Mormons, Adventists and Witnesses forthcoming in Journal for the Scientific Study of Religion, 2012.
Dividends of Religious Freedom page
13
10 Central Asia .03 NA NA 11 Eastern Asia 7.97 12.51 7.60 12 Southern Asia .42 1.88 61.26 13 South-Eastern Asia 16.83 4.83 20.61 14 Western Asia .46 .29 .04 15 Eastern Europe .91 NA .86 16 Northern Europe 3.90 2.91 .54 17 Southern Europe 2.24 13.20 .53 18 Western Europe 2.03 8.06 1.03 19 Australia and New Zealand 20.45 5.74 1.26 20 Melanesia 1.86 .34 4.57 21 Micronesia .75 NA NA 22 Polynesia 6.06 NA NA FINDINGS ON THE IMPACT OF RELIGIOUS FREEDOM ON MEMBERSHIP GROWTH The objective of this research is to examine the relationship between religious liberty and the membership growth of three strict, proselyting Christian religions in the same time period. For the present, this analysis deliberately does not use commonplace multivariate regression analysis including time series modeling regression in order to make the findings more accessible to general humanities readers and other professionals from law and social sciences generally. Although there were four different measures of religious liberty available to us for each country and at different points in time, I were unable to match the two sets of variables using the ARDA religious freedom dataset.22 Cragun and Ryan in their earlier work on these same three religions had encountered a similar problem also stemming from the fact that the Religious Freedom Reports are available for only three years all in the past decade. For this reason I used my other measures of religious freedom. Although Freedom House uses the descriptor “civil liberties” rather “religious liberty” in naming this variable, I feel completely justified in using it as a measure of religious liberty here. There are many reasons in addition to those presented in the independent variable description above. As mentioned before, the FH variable is highly correlated with all three other variables: IRLA (r= +.78); ARDA (r=+.70); RAS (r=+.69). This is a type of criterion-referenced test of validity where the other measures are taken to be the validating criteria. A simple look at the components of the FH measure reveals that there is
22 Each year (since 1999) the U.S. State Department releases International Religious Freedom Reports on approximately 196 countries or territories (http://www.state.gov/g/drl/irf/) for the years 2001, 2003, and 2005. Based on the text in these reports, ARDA researchers systematically coded the measures included in this file. The questions included measures for specific acts of discrimination, prejudice, persecution, warfare, property rights, forced migration, and other acts that might (or might not) be related to the religious life of the country. The data in this file represent mean scores from three years of coding. The specific data for a given year is a country’s average response. The aggregate dataset for the three years of coding contains the mean score of each ordinal variable across the three years. I use the ARDA aggregate country response, which is a composite summary measure of many separate measures of religious freedom. The composite variable has the benefit of greater variation and lesser error since random errors from one year are attenuated in the aggregate data. But it has the disadvantage of being restricted to a very short time period, 2001 to 2005.
Dividends of Religious Freedom page
14
substantial overlap with freedom of religion dimensions that predominate the substance of the variable—a good indicator of “face validity.” For these reasons and because the Freedom House measure is available since 1970, I used it rather than the ARDA measure for my Freedom of Religion indicator in all statistical analyses in this paper. At each point in time I provide AQGR and the matching year Freedom of Religion variable side by side. I also correlated the two variables for the same time period and provide the correlation coefficient to see how strongly they are related. The question, again, is this: are the membership growth figures different for my 170-country sample when divided along lines of the degree of religious liberty reported in that country? The best approach was determined to be the use of a measure of religious liberty for each quinquennium and relate that measure to membership growth of the same time period. In this way I was able to examine the relationship between religious freedom and AQGR with contemporaneous measures—in other words, an indicator of religious freedom taken at the same time as the membership number. Figure 2 presents the results for this analysis using the LDS data for membership growth. Results for the other two denominations will follow. Figure 2: LDS AQGR and Contemporaneous Freedom of Religion for Forty Years
For the LDS data I first draw attention to the fact that the correlations are all low and negative. The meaning is that the growth rates are higher when the Freedom of Religion numbers are slightly lower. I see that Freedom of Religion increases slowly over time without large variations in the rather flat trend line. The LDS AQGR are found in a single summary line which has the same general shape as before—a slight rise to 1975 followed by a steady downward trend thereafter. Since the Freedom House data begin with 1972, I present this analysis for a 40-year timeline. The analysis is next repeated for Jehovah’s Witnesses’ data. In the case of JW, the data do not show actual membership through baptism but rather the number of average publishers as
Dividends of Religious Freedom page
15
previously explained. Apart from the curiously low Q70 growth figures, the JW data are consistent and little affected by the separation into homogenous Religious Liberty categories. The trend line for religious freedom, identical in all three presentations, remains on a steady slow upward trajectory. The correlation of religious liberty with JW growth rates is, as for LDS, slightly negative. And, as before, the AQGR line for JW is in a rapid free fall from about Q90 onward. Figure 3: JW AQGR and Contemporaneous Freedom of Religion for Forty Years
The same analysis for Seventh-day Adventists is shown in data Table 4. A clear pattern of association is difficult to discern for the Adventists. Like the other two denominations, the most prominent feature is the slow but inexorable decline in the growth rates, a fact that probably has little to do with the level of religious freedom.
Dividends of Religious Freedom page
16
Figure 4: SDA AQGR and Contemporaneous Freedom of Religion for Forty Years
At this juncture the analysis points to the conclusion that while religious liberty, however measured, is slowly but steadily improving worldwide, with several glaring exceptions, the same cannot be said for religious membership growth that presumably benefitted from it. Freedom of Religion is a demand-side variable, outside the direct control of religious bodies themselves. If membership growth rates are declining steadily in the face of small advances in freedom of religion, the connection between the two is problematic at best. The absence of statistically significant correlations between the two sets of variables, even when measured contemporaneously, gives support to the view that freedom of religion has not played a large role in membership growth in either direction. To restate, perhaps the most surprising result of my study was the lack of correlation between religious growth and religious freedom. ARE THERE IMPORTANT DEMAND-SIDE VARIABLES AFFECTING GROWTH? In a final effort to see whether or not I had overlooked or misinterpreted something in my simple analytic technique involving tables, charts and graphs, I relented and ran a few simple bivariate correlations. By reconstructing my AQGR variable into a single combined average annual growth rate indicator for all countries for which there were 50 years of membership records available, I were able to run some simple, bivariate correlations. The results confirmed my earlier finding. The simple correlations between the ARDA Freedom of Religion Variable and the average annual growth rate were: LDS: -.111, SDA: -.162, and JW: -.110.23 When Cragun and Lawson defended their non-inclusion of the Freedom of Religion variables because they were either statistically non-significant or even negatively related to growth, they had discovered a relationship that I have unintentionally replicated with an entirely new dataset and a more complex and accurate analytic approach. What is going on? Even if
23 See Appendix C for additional details and full correlational matrix.
Dividends of Religious Freedom page
17
freedom of religion is unrelated to growth, are there no important contextual or demand-side country characteristics? There were two possibilities, both suggested earlier by Cragun and Lawson: the Human Development Index or HDI and familiar indicators of national prosperity such as GDP per capita. Both had been reported to be associated with the growth of new religions worldwide. I was particularly intrigued with the Human Development Index or HDI. The United Nations’ first Human Development Report introduced a new way of measuring development by combining a range of indicators of health, education and income into a composite human development index, the HDI. The creation of a single statistic that served as a frame of reference for both social and economic development has been extensively used in development research. The HDI sets a minimum and a maximum for each dimension and then shows where each country stands, expressed as a value between 0 (lowest possible) and 1 (highest possible). The HDI has been available since 1975. Again this enabled us to examine the relationship between religious freedom and membership growth within categories of human development. I calculated the average HDI for countries in which each of the three religions had members and at the same time period. This enabled us to correlate the AQGR with HDI. (See Table 9 below.) The correlations were strong and negative (from -.12 to -.53). I then divided the 170 countries into five groups for each religion individually. The groupings ranged from countries with the lowest 50-year growth (group 1) to the highest growth (group 5). Finally I calculated the mean HDI for that group of countries with results as seen in Table 4.
Dividends of Religious Freedom page
18
Table 4: Mean HDI Score by AQGR for Three Religions
The HDI is a demand-side characteristic clearly related to religious membership growth. The HDI stands in sharp contrast to Freedom of Religion as causal factor in membership growth for all three religions. Two additional characteristics are worth noting. First, High AQGR countries have lower HDI scores than do the low AQGR countries. All three religions had been growing faster where social and economic conditions were worse. Second, it is quite clear that the LDS growth is coming from higher HDI countries than is the SDA growth, and that SDA growth comes from countries with higher HDI than does the JW growth. There is a clear internal ordering. To further investigate the HDI relationship to membership growth, I selected from the data file, those countries for which there was a membership presence for each of the three religions in each quinquennia from 1975 to 2005. I began with 1975 because this is the first year for which there is a United Nations reported Human Development Index indicator. I then correlated the AQGR for Q75 with the reported HDI for 1975 for each religion. Next I calculated the correlations for the all religions and all other five-year time periods. Here is what I found:
Dividends of Religious Freedom page
19
Table 5: Simple Correlations Between AQGR and HDI for Q75 to Q05 Religion
Q75 Q80 Q85 Q90 Q95 Q00 Q05
LDS -.113 -.432 -.531 -.451 -.427 -.528 -.239 SDA -.218 -.515 -.478 -.312 -.171 -.368 -.159 JW -.101 -.073 -.123 -.440 -.373 -.409 -.240 Most of these correlations are statistically significant at the .05 level and many of them are quite large. Although somewhat tangential to the main focus of this paper, which is on religious freedom and membership growth, these correlations reveal a truly remarkable negative association between the Human Development Index and membership growth. This relationship has been in place for a long time and is the same for all three religions. Finally I investigated the possibility of a relationship between AQGR and a 30-year (1980 to 2010) improvement in HDI scores. All world countries are ranked in terms of their improvement in the HDI index. The correlations are found in Table 10. Table 6: Correlation between HDI Improvement and 1980 AQGR Religion
HDI improvement rank
LDS
.232
SDA
-.039
JW -.072
In the years since 1975, when the HDI was introduced, the HDI has generally increased throughout the world at the same time membership growth rates of the three religions under study here has declined. In countries where a positive membership growth rate is observed I find low HDI scores. In fact the lower the HDI the higher the growth rate. There is nothing necessarily causal about this relationship—membership growth is not hereby demonstrated to result from low human development conditions. And neither is the opposite true—church growth does not lower human development and might even raise it. Nevertheless associations this strong cannot be put aside. There is a powerful story here—we just don’t know exactly what it is. What has been shown is that demand side characteristics of a country are related to growth. But of the three I are looking at here, Human Development Index, Wealth per capita, and Freedom of Religion, only the last one, Freedom of Religion, shows little empirical association with membership growth—the other two demonstrate quite robust associations.
Dividends of Religious Freedom page
20
LIMITATIONS OF THE STUDY Focus on three strict, proselyting religions, while appropriate for the hypotheses advanced in this paper, imposes severe restrictions on the ability to understand the impact of religious liberty on religious growth more broadly. The question of the implications of the study for the growth of larger religions is not addressed. The ability to adequately test the relationship between freedom of religion and membership growth without using a multivariate analytical approach is a limitation being addressed at the present time. Preliminary results do not appear to contradict the preliminary conclusions presented here. The comparative analysis of the global level religious freedom (using Freedom House data as a proxy measure) with global growth rates could mask important variations in individual countries. Space limitations preclude presentation of 170 individual analyses but Appendix A Graph 2 provides a look at Australia for which long-term membership data are available. The pattern of no relationship was found. The ARDA data set is a rich source of information on freedom of religion but it also imposes a serious constraint on a fifty-year longitudinal study of the influence of religious liberty on membership growth. Unfortunately, there are only two of quinquennia that are time matched by the religious freedom variables, Q00 and Q05 and even these two years are not perfect matches. My use of the Freedom House “Civil Liberties” variables as proxies for freedom of religion is an acceptable compromise solution as a measure of the religious liberty construct and the multi-decade time frame the research model requires. I emphasize that the Civil Liberties scale has a large and explicit religious liberty subset of items and that the other items not included in the religious liberty subset are at times found in the religious liberty scales constructed by other groups of researchers. Still, I acknowledge this as a limitation but urge readers to be cautious of dismissing these findings on this basis alone. The mere fact that it brings to the analysis the element of contemporaneous measures is a considerable strength. DISCUSSION Why People Convert--Supply and Demand-side Reasons Empirical information on global growth rates for LDS, JWs and SDA has been reported by others but never over a 50-year time horizon. The article attempts to provide understanding of a counter-intuitive finding—that despite religious freedom, this variable does not predict religious growth. It is not logical to suppose that most people, when asked to provide reasons for their religious conversion, would look to demand-side variables in providing an answer. One would not likely expect to hear a new convert describing his or her lack of secondary education or poor access to preventive health care or a new law on religious freedom as a determining factor in the decision. This is not to doubt that there are many predisposing, demand-side, contextual variables. Still it is instructive to examine reasons that are actually given by converts for their decision. The recent Pew Research Center publication, “Mormons in America,” provides just this
Dividends of Religious Freedom page
21
sort of opportunity for one country.24 What it does not do is provide a comparative analysis of conversion factors across many countries or over long periods of time. For the United States, when Pew survey researchers asked respondents to describe in their own words their reasons for converting to Mormonism, 59 percent of American converts to Mormonism cite the religion’s beliefs as a reason. The most common responses within this category are general statements about the religion being true or making sense (38 percent), as well as statements about the Book of Mormon or other scriptures (13 percent). Mormonism’s emphasis on the family and family values is cited as a reason for converting by five percent of converts, and three percent cite the faith’s specific teaching that families can be bound together for eternity. Roughly one-quarter of American converts to Mormonism (23 percent) cite issues of personal spirituality as reasons for their conversion, including 17 percent who say they felt they had gained a personal testimony. About one-in-five converts to Mormonism cite either the influence of Mormons they interacted with before they converted or an appreciation for the institutions and practices of the LDS Church. Common responses in this category include the work of Mormon missionaries (five percent) and positive impressions of Mormon people (four percent). Just over one-in-ten converts mention a major life change as their reason for becoming Mormon. This includes twelve percent who say they converted because they married a Mormon or for other family reasons. Although it is tempting to speculate that reasons for joining a new faith in the Democratic Republic of Congo may be different from those in the United States, I are not confident that such differences exist. In short, I conclude that the often-acknowledged difficulty in disentangling supply and demand side characteristics in explanations of religious membership growth exists for us. But all of this does not lead to the conclusion that religious freedom is of no interest to religious practitioners. Their interest is keen and on the uptick. Some of it has to do with “business” concerns such as the enactment or enforcement of zoning regulations for religious edifices; or the right to obtain visas for missionaries to enter and remain in a country not of their own citizenship purely for evangelistic functions; or the right of members to make tax-exempt donations to their religion. And there are many others. What was the state of religious freedom in Brazil and in the Philippines in 1972? That was the first year Freedom House gathered and reported civil liberties information for most countries of the world. It was also a year in which membership growth for all three religious bodies was at or near record highs. In a seven point scale for which “1” is the highest level of the Civil Liberty scales and “7” is the lowest level, Brazil was at “5” and the Philippines given a score of “6”, whereas for comparison Canada, Denmark, New Zealand and Norway all received a “1” score. It is quite evident that whatever else may have been true of civil liberties in Brazil and Philippines in these years, it did nothing to diminish the virtual flood of new converts. Today both countries have moved up three positions: Brazil is at “2” and the Philippines at “3.” Membership growth rates have astonishingly declined by similar proportions. There are strong correlations here but there is probably no causality at work. I must look elsewhere for the explanation—to other demand-side characteristics. With Cragun and Lawson earlier, I have again drawn attention to the relationship between the Human Development Index and membership growth— 24 The Pew Forum on Religion and Public Life (http://www.pewforum.org/Christian/Mormon/mormons-in-america.aspx)
Dividends of Religious Freedom page
22
one demand-side variable that is a top contender for further investigative study. The supply-side has remained constant over time. CONCLUSIONS Religious liberty has a peculiar relationship to membership growth. The peculiarity is less a matter of having a negative or positive influence and more a question of being hard to find at all. When viewed from an "economics of religion" perspective, I agree with Cragun and Lawson. Where religious liberty shows an influence on membership growth at all, it is a slightly negative one. As a demand-side variable (characteristics of the country not controlled by the religion), the impact is indirect by allowing the entry of missionaries and in providing an enabling legal environment of property ownership and tax exemptions. Predominately Muslim countries, historically black countries and presently communist countries all have the least religious liberty; and new proselyting religions (other than for a state monopoly religion) tend to have a very small presence or to be absent altogether. Saudi Arabia, Senegal and China are examples. Once a church presence has been established, usually through foreign-born missionaries, membership growth is predominately a function of supply-side variables (aspects of the faith that they control). Religious liberty has little to do with predicting how well the religion performs in terms of adding proselytes or in establishing a strong institutional capacity, for example, new congregations. This finding isn’t intuitively obvious. Many casual observers have been tempted to find that strictures against religion, such as proselyting bans, restrictive registration laws, strong bias against non-majority religious doctrines and outward practices, are at least as important as any inherent attraction that a new religion might itself provide. I find no evidence for these conclusions. More work must be done on the matter of the meaning of religious success as this is hardly subsumed by reference to membership growth alone. I will also redo the analysis using multiple regression techniques such as time series analysis that will allow more precise control of other variables that might affect the relationship between religious liberty and membership, as well as other dimensions of religious success. I do not expect such work to alter the findings but it will bring my work into the methodological mainstream of contemporary sociological study of religion. I would also hope to expand my work so as to include other and larger religious groups.
Dividends of Religious Freedom page
23
REFERENCES Anderson, Duwayne R. 2006. “Estimates for the future Membership of The Church of Jesus Christ of Latter-day Saints.” http://www.belnapfamily.org/brentjbelnap/institute/ Anderson_Church_Growth_Rates.pdf Chaves, Mark and David E. Cann, 1992. “Regulation, Pluralism and Religious Market Structure: Explaining Religion’s Vitality.” Rationality and Society 4: 272-290. Craygun, Ryan T. and Ronald Lawson 2010. The Secular Transition: Worldwide growth of Mormons, Jehovah’s Witnesses, and Seventh-day Adventists. Sociology of Religion, 71(3):349-73. Deseret Morning News, 1975…2011 Church Almanac. Salt Lake City, UT: Deseret News. Finke, Roger. 1990. “Religious Deregulation: Origins and Consequences.” Journal of Church and State 32: 609-26. Finke, Roger and Laurence R. Iannaccone. 1993. “Supply-side Explanations for Religious Change.” Annals 527: 27-39. Finke, Roger and Rodney Stark, 1988. “Religious Economies and Sacred Canopies: Religious Mobilization in American Cities, 1906” American Sociological Review Vol. 53, No. 1 (Feb., 1988), pp. 41-49 Fox, Jonathan, and Ephraim Tabory 2008. “Contemporary Evidence Regarding the Impact of State Regulation of Religion on Religious Participation and Belief.” Sociology of Religion 69:245-271 Gill, Anthony and Erik Lundsgaarde, 2004. “State Welfare Spending and Religiosity: A Cross- National Analysis.” Rationality and Society Vol. 16(4): 399-436. Gooren, Henri. 2006. “Latter-day Saints under Siege: The Unique Story of Mormon Growth in Nicaragua.” Paper presented at the annual meeting of the Society for the Scientific Study of Religion, Portland, Oregon. Gottlieb, Robet, and Peter Wiley. 1986. America’s saints: The rise of Mormon power. Sand Diego: Harcourt Brace Jovanovich. Grim, Brian J., and Roger Finke. 2006. “International Religion Indexes: Government Regulation, Government Favoritism, and Social Regulation of Religion.” Interdisciplinary Journal of Research on Religion 2:1-40. _______________ 2011 The Price of Freedom Denied; Religious Persecution and Conflict in the Twenty-First Century. Cambridge University Press. Hackett, David G., Journal for the Scientific Study of Religion, Vol. 29, No. 3 (Sep., 1990), pp. 372-376.
Dividends of Religious Freedom page
24
Hadaway, C. Kirk. 2006. “LDS Membership in the U.S.” Annual Meeting of the Society for the Scientific Study of Religion, Portland, OR. Heaton, Tim B., Stephen J. Bahr, and Cardell K. Jacobson. 2005. A Statistical Profile of Mormons: Health, Wealth, and Social Life. New York: Edwin Mellen Press. Holsinger, Donald B. 1973. The Elementary School as Modernizer: A Brazilian Study. International Journal of Comparative Sociology 14 (3-4):178-202. ________________ and Gary L. Theisen. 1977. Education, Individual Modernity, and National Development: A Critical Appraisal. The Journal of Developing Areas 11 (3):315-334. Iannaccone, Laurence R. 1900. “Religious Practice: A Human Capital Approach.” Journal for the Scientific Study of Religion 29: 297-314. Iannaccone, Laurence R. 1994. “Why Strict Churches Are Strong.” American Journal of Sociology 99: 1180-211. Inkeles, Alex and David H. Smith. 1974. Becoming Modern: Individual Change in Six Developing Countries. Cambridge, Mass.: Harvard University Press Knowlton, David Clark. 2005. “How Many Members Are There Really? Two Censuses and the Meaning of LDS Membership in Chile and Mexico.” Dialogue 38:53. Lawson, Ronald. 1995. “Sect-State Relations: Accounting for the Differing Trajectories of Seventh-day Adventists and Jehovah’s Witnesses.” Sociology of Religion 56:351 ____________. 2005. “Comparing the Global Growth Rates and Distributions of Adventists, Mormons, and Witnesses.” Paper presented at the annual meeting of the Society for the Scientific Study of Religion, Rochester, NY. ____________. 2007 “Comparing Further the Global Growth Rates and Distributions of Adventists, Mormons, and Witnesses.” Paper presented at the annual meeting of the Society for the Scientific Study of Religion, Tampa, FL. Loomis, Roger. 2002. “Church Growth.” The Association for the Sociology of Religion. Chicago, IL. http://lds4u.com/growth/growth.PDF Phillips, Rick. 2006. “Rethinking the International Expansion of Mormonism.” Nova Religio 10: 52-68. Stark, Rodney. 2001. “Modernization and Mormon Growth: The Secularization Thesis Revisited.” In Contemporary Mormonism: Social Science Perspectives, vol. 2, edited by Marie Cornwall, and Tim B. Heaton, and Lawrence Young, 12-23. Illinois: University of Illinois Press. ____________. 1996. The Rise of Christianity: A Sociologist Reconsiders History. Princeton, NJ: Princeton University Press.
Dividends of Religious Freedom page
25
_____________ and William Sims Bainbridge. 1985. The Future of Religion: Secularization, Revival and Cult Formation. Berkeley, CA: University of California Press. The World Bank Group. 2010. “World Development Indicators 2009.” http://web.worldbank.org United Nations. 2010. “Human Development Reports.” http://hdr.undp.org/reports/global/2009 Voas, David. 2007. “The Continuing Secular Transition.” In The Role of Religion in Modern Societies, edited by Detlef Pollack, and Daniel V.A. Olson, 25-48. New York: Routledge.
Dividends of Religious Freedom page
26
APPENDIX A: Calculating the Average Quinquennial Growth Rate (AQGR) The rate of change in the membership of the three religions under consideration is the principal dependent variable in this study. The method for calculating this change must be clear and replicable. Sadly, this has not always been the case in the literature dealing with religious adherents’ growth rates. One of the moderately contentious components has to do with how to handle zero growth years and zero growth countries. This study uses 50-year membership data, from 1960 to 2010. If the religion in question has not had a 50-year history in a particular country, I use the longest period of time for which data are available. Because measures of the independent variable of interest, Freedom of Religion, were available of only 40 years, the analysis was limited to a forty-year time frame as opposed to 50 years, which I had originally anticipated. Years for which no membership numbers are reported are given a “missing data” code, which is then correctly dealt with in subsequent statistical calculations. I prefer to look at membership change in five-year periods of time called a quinquennium or Average Quinquennial Growth Rate. The quinquennium offers several advantages and few disadvantages over the AAGR. A five-year period of time allows us to have many fewer data points, thus simplifying both analysis and interpretation. The disadvantage is that I use the mean growth rate for the five-year period rather than a single year or annual growth rate. But fluctuations are not great from year to year and a quinquennium allows us to visualize changes in membership growth in a larger time frame. One problem with this 50-year approach is that for some countries, one or more of the three religions does not have a 50-year history while another country will have had a 100-year history of membership growth. I choose the countries first and then entered the growth data for as many years as the religion has reported members in those countries. If there have never been members of one of the three religions in a particular country, I give religious membership for that country a missing data code. I are convinced that countries in which there are no members of a religion and never have been, should not be included in an overall growth rate calculation. To do otherwise would confound every type of explanation given for membership change. However, researchers in this field have had different points of view about the inclusion of zero or negative growth years. Gragun and Lawson argue that zero growth years must be included so as not to bias the results toward growth. I agree with their position provided that I are speaking of no growth years following years in which membership numbers were present. Of course, negative growth years must also be included. The commonplace statistic used by most demographers for changes in the human population of a demographic region is the annual average growth rate or AAGR.25 Although there are many
25 A simplified explanation of the AAGR is as follows: AAGR = ((Vpresent – Vpast)Vpast * 100) In this formula, Step 1 Vpresent = present membership number in final year of growth period Vpast = membership number at the start of the growth period
Dividends of Religious Freedom page
27
problems associated with the calculation and interpretation of the AAGR, its commonness requires that I explain briefly why I do not use it and what I use in its place. We illustrate the steps for the calculation of the AQGR for those who want to satisfy themselves of the method and meaning of the statistic. For the purpose of this illustration I choose to use LDS data for Australia. These data are complete for the 50-year period and unambiguous. Appendix Table A1: AQGR calculation steps Year LDS Aus step 1 step 2 step 3 step 4 Q
2010 129744 1.168 1.032 0.032 3.15 Q05 The AQGR is calculated for the Australian data in four steps, the fifth (below) being the proof: Step 2 To calculate an annual percentage rate of change, divide the percent change arrived in Step 1 by N N = number of years between the two members values used in Step 1 For example, to calculate the AAGR for Malta: LDS membership in 1990 was 21 and a membership in 2008 of 264. To find the AAGR of the Mormon population in Malta in this 18-year period I would do the following: Growth Rate = (264 – 21) / 21 * 100 Growth Rate = 116 percent Average Annual Growth Rate = 116% / 18 years AAGR = 6.4 percent
Dividends of Religious Freedom page
28
Step 1: divide the later year population by the earlier year population Step 2: determine the fifth root (Excel formula in cell is: number ^ (1/5) Step 3: subtract 1 Step 4: multiply by 100, which is the Average Quinquennial Growth Rate Step 5: prove by multiplying first year in five-year series by step 2 The proof for Q05 (2005 to 2010) is carried out as follows: Proof: Multiply the 2005 population figure of 111,098 by 1.03152 from Step 2 Proof step 1. Multiply by 1.03152 a first time. 114599.4 Proof step 2. Multiply the result by 1.03152 118211.2 Proof step 3. Multiple the result by 1.03152 121936.8 Proof step 4. Multiply the result by 1.03152 125779.8 Proof step 5. Multiply the result a final time 129744 Exactly! Appendix Table A2: Australian and LDS Total Fifty Year AQGR
Appendix Graph 1: Australia and LDS Total: AQGR 1960 to 2010
Appendix A: Graph 2—Australia Country Analysis of relationship between Freedom of Religion (Freedom House proxy) and AQGR
Dividends of Religious Freedom page
30
Appendix B: Preliminary Multivariate Analysis Correlations below are Pearson product-moment bilateral coefficients between three religions AQGR and four different measures of religious liberty. The religious liberty measures are all at time of latest availability. None of the correlations is statistically significant. Appendix Table B1: Correlations between indicators of religious liberty and AQGR for three religions Religion
IRLA RAS ARDA FH
SDA
+.091 -.088 -.162 +.035
JW
+.170 -.066 -.110 +.207
LDS -.039 -.171 -.111 +.206
Dividends of Religious Freedom page
31
Appendix C: Average Quinquennial Growth Rate by UN World Region for Three Religions (LDS, SDA and JW) Appendix Table C1: LDS AQGR by UN World Region
LDS AQGR by UN World Region
World Region Q60 Q65 Q70 Q75 Q80 Q85 Q90 Q95 Q00 Q05 Eastern Africa NA NA NA NA 17.61 26.27 16.57 18.23 12.53 8.90
Middle Africa NA NA NA 50.8448 61.99 13.66 19.44 5.44 8.69 5.50

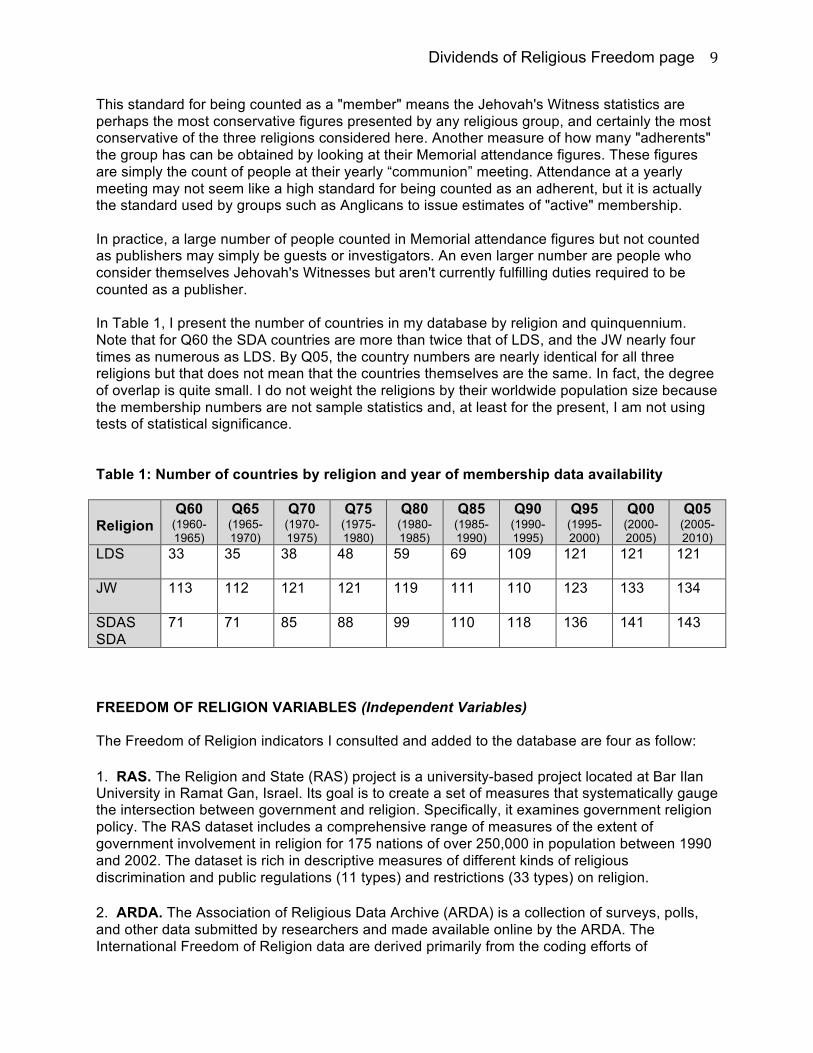
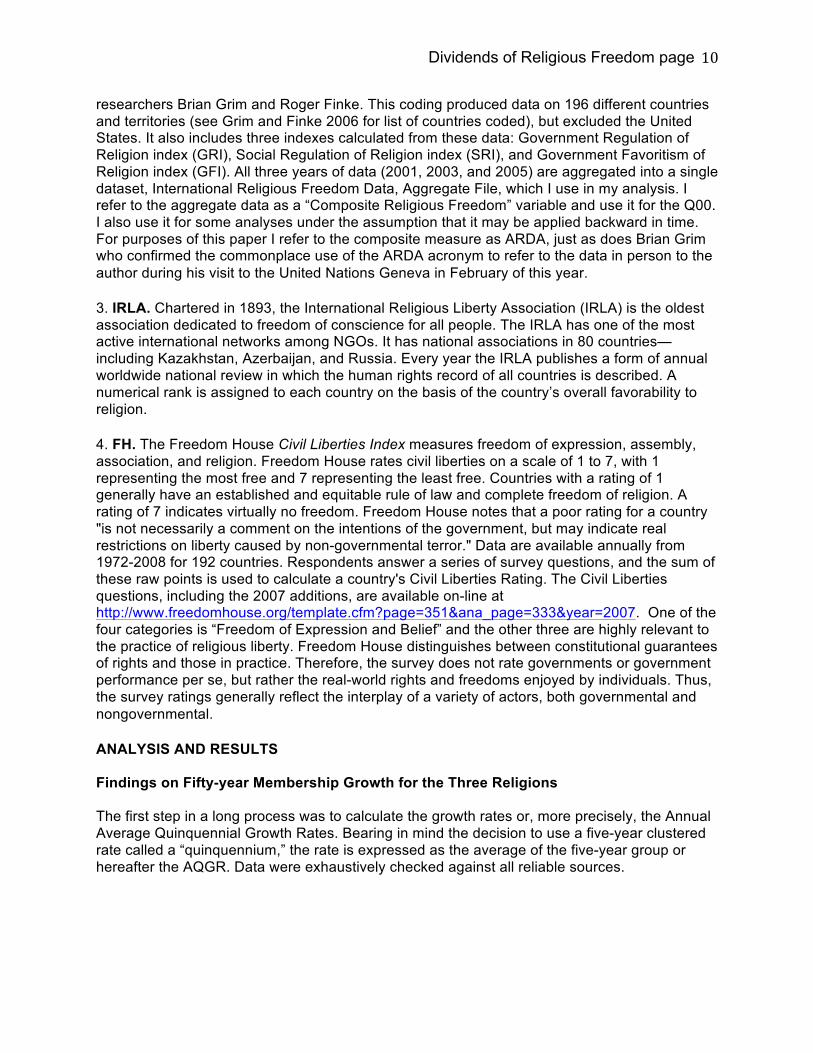
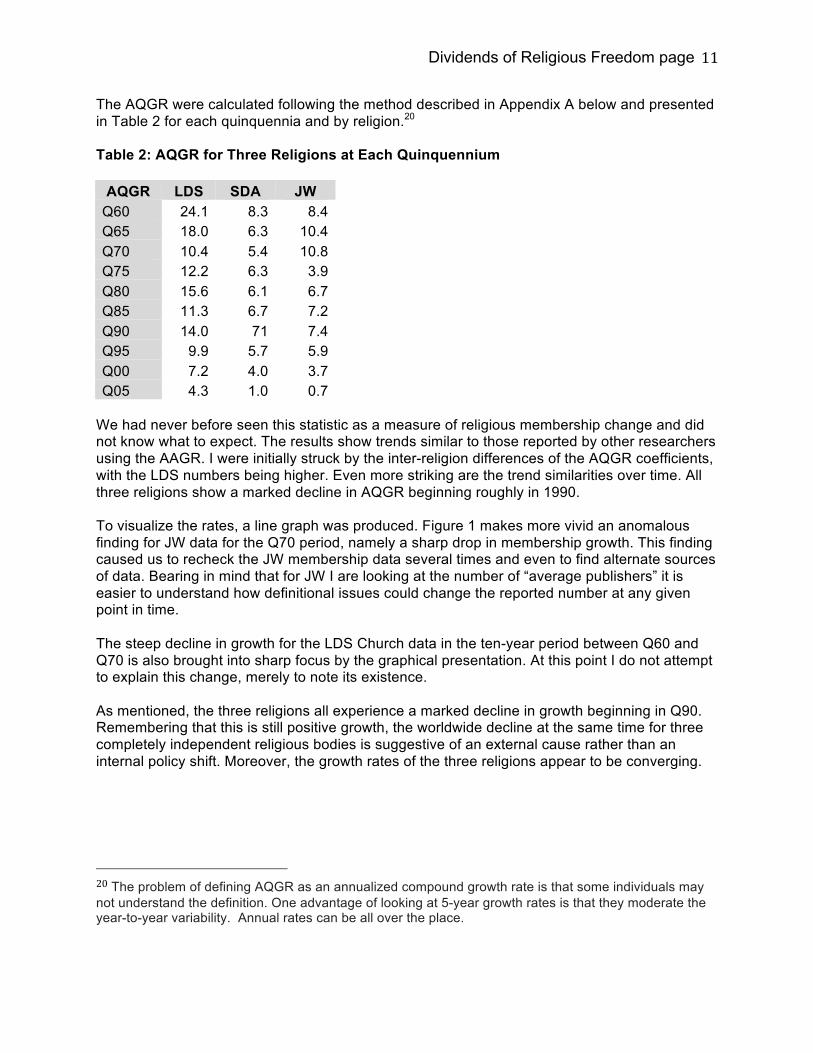
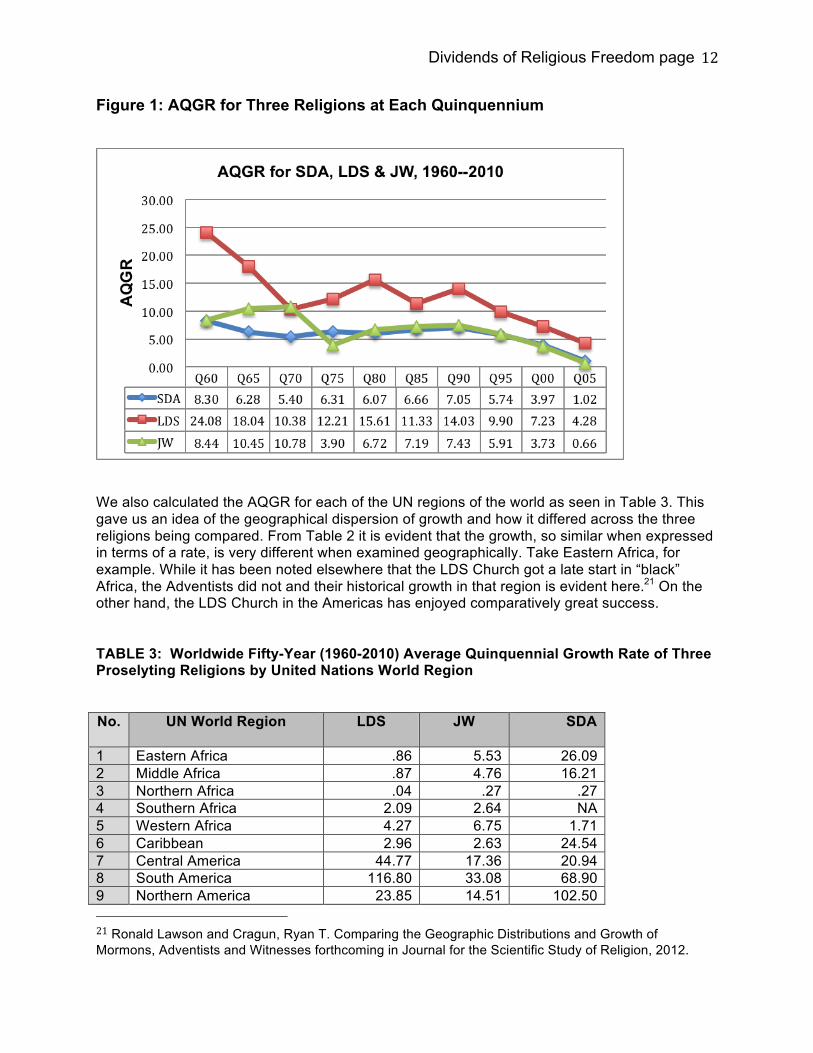
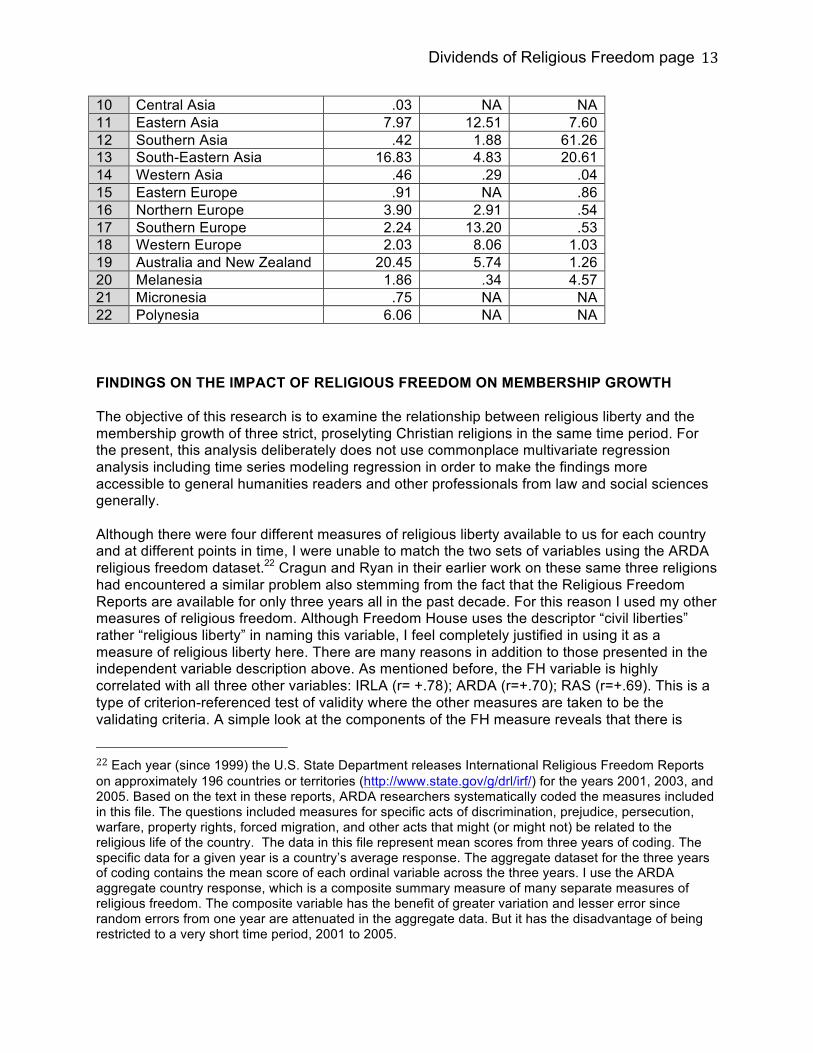
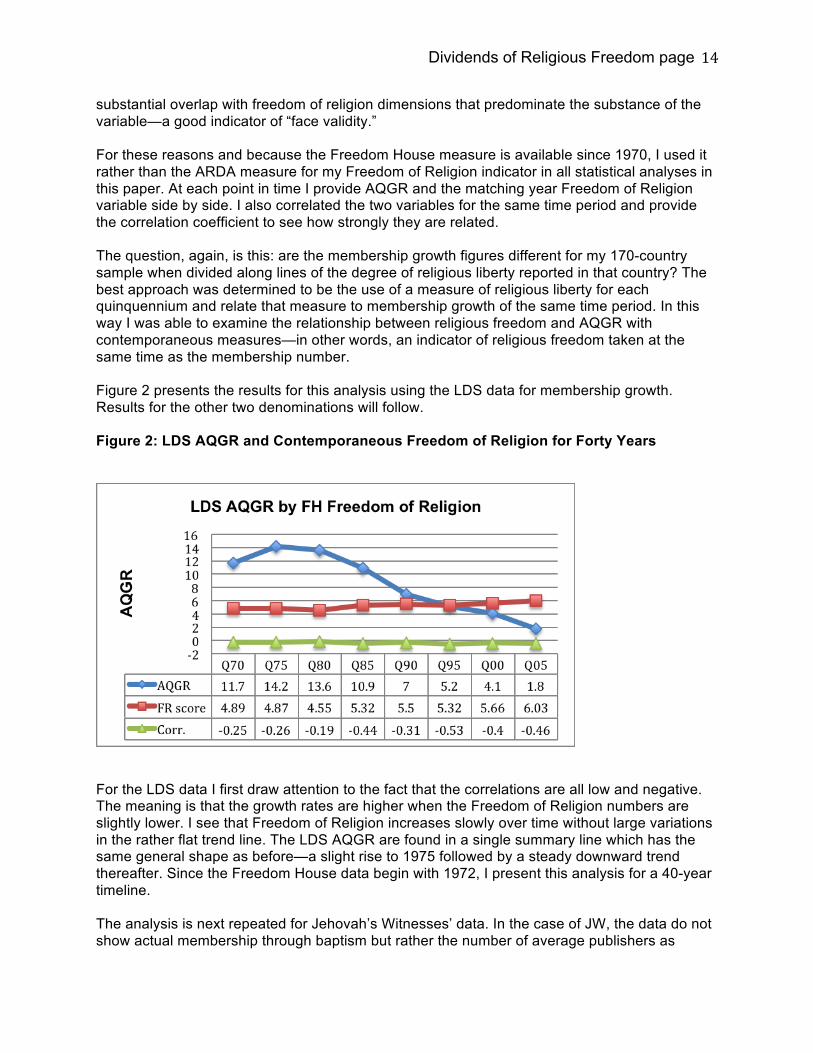
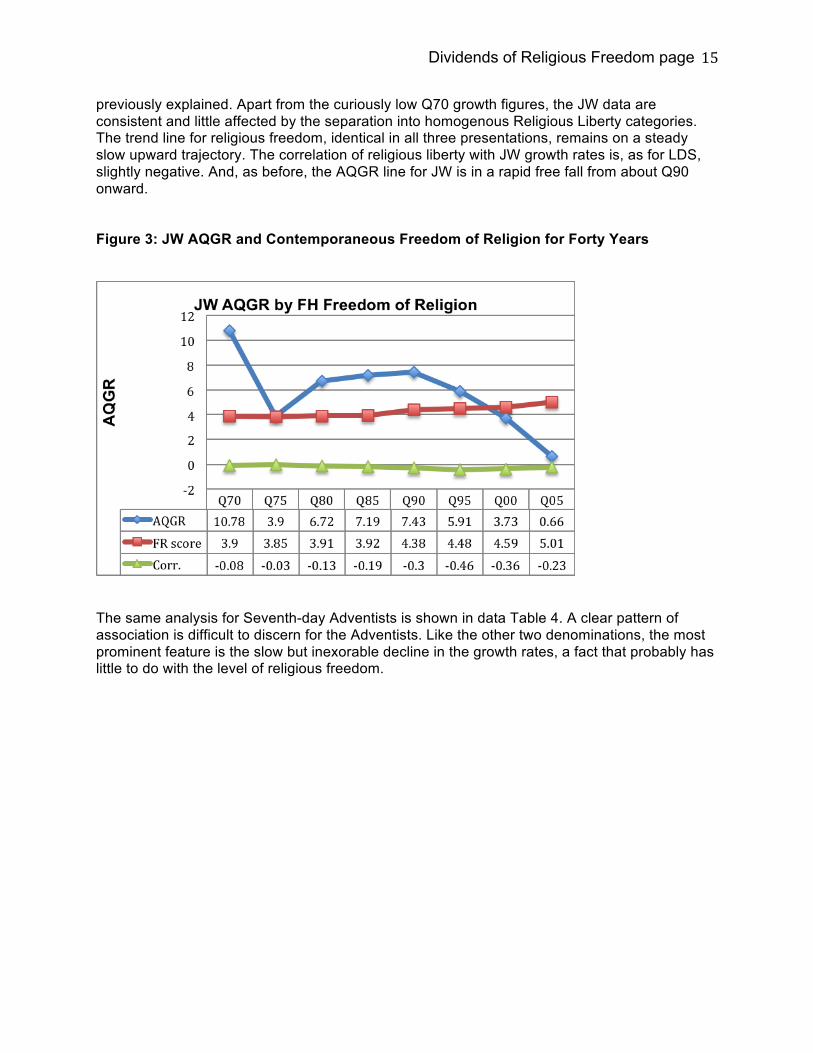
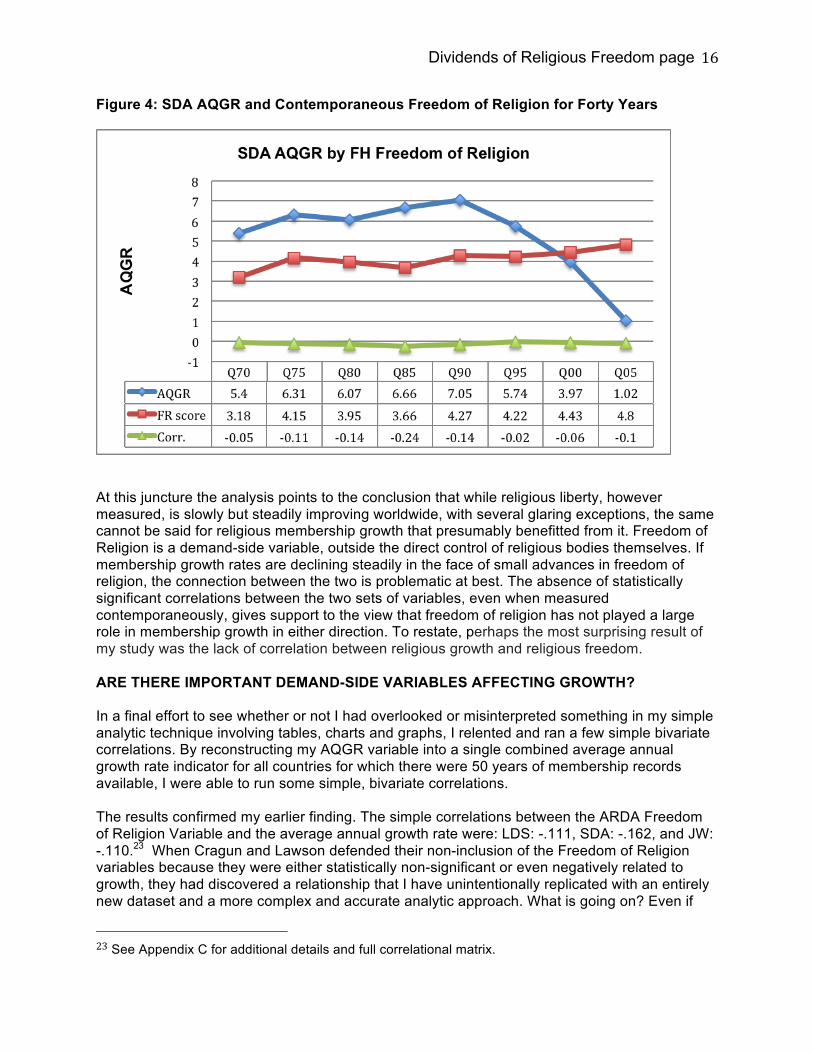
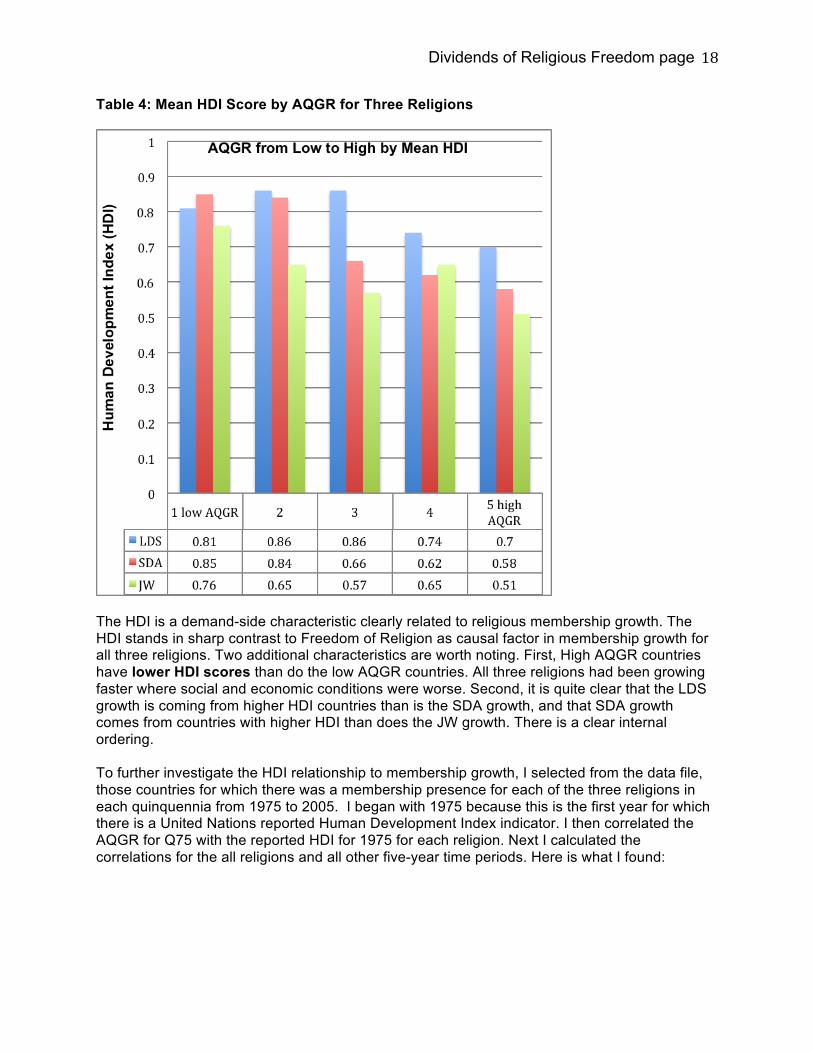
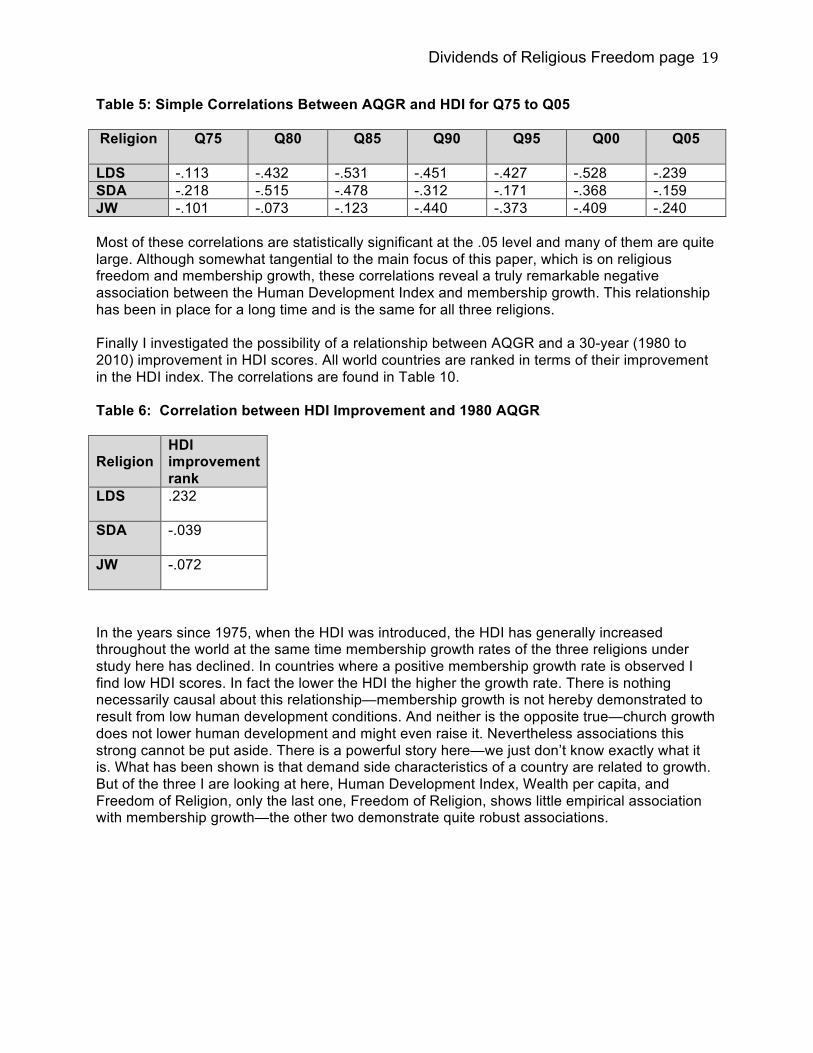
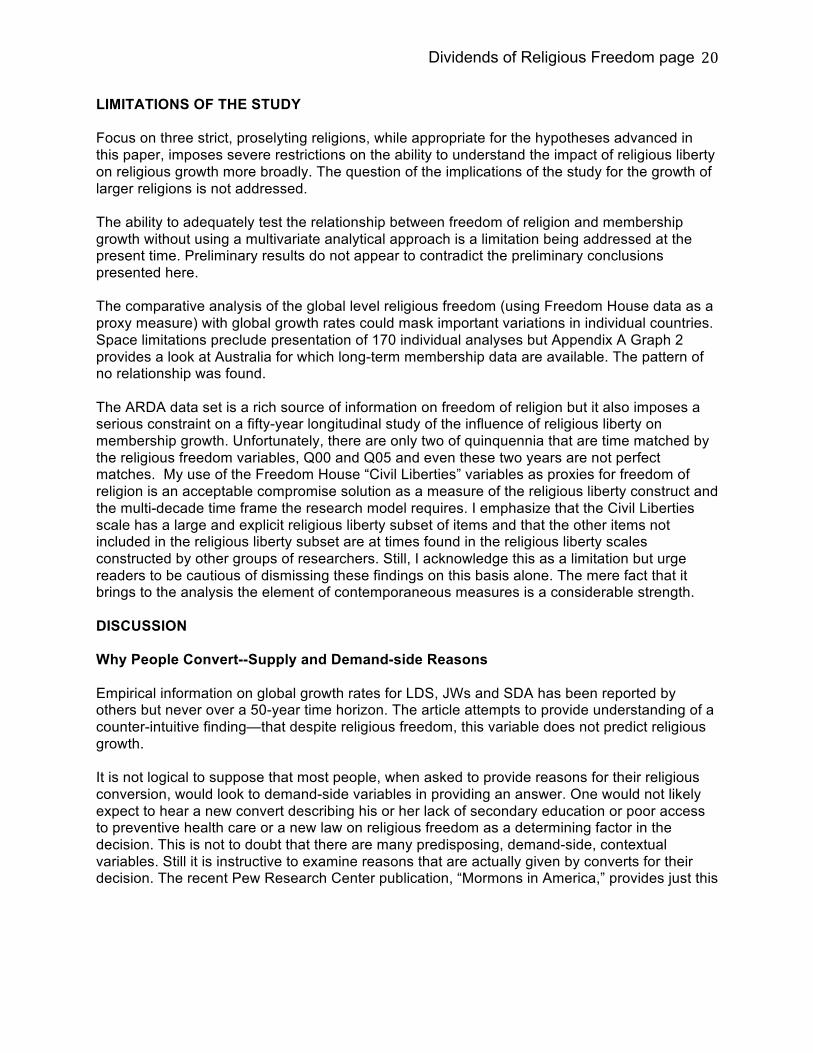

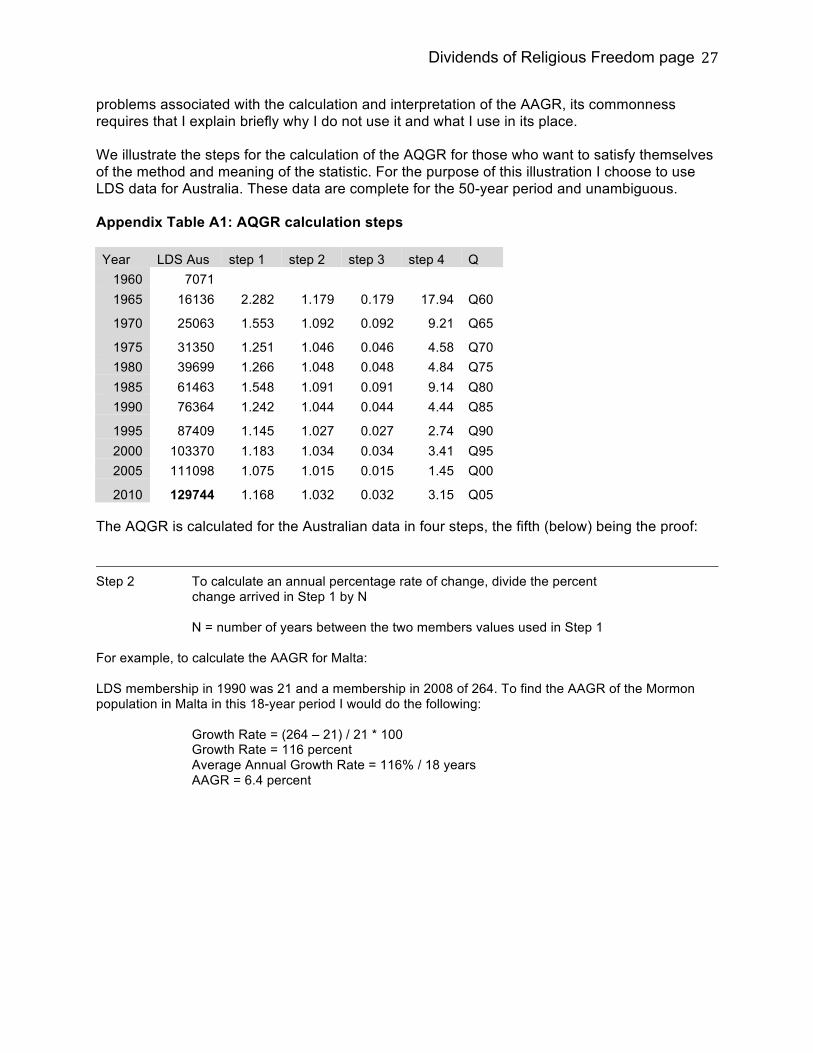
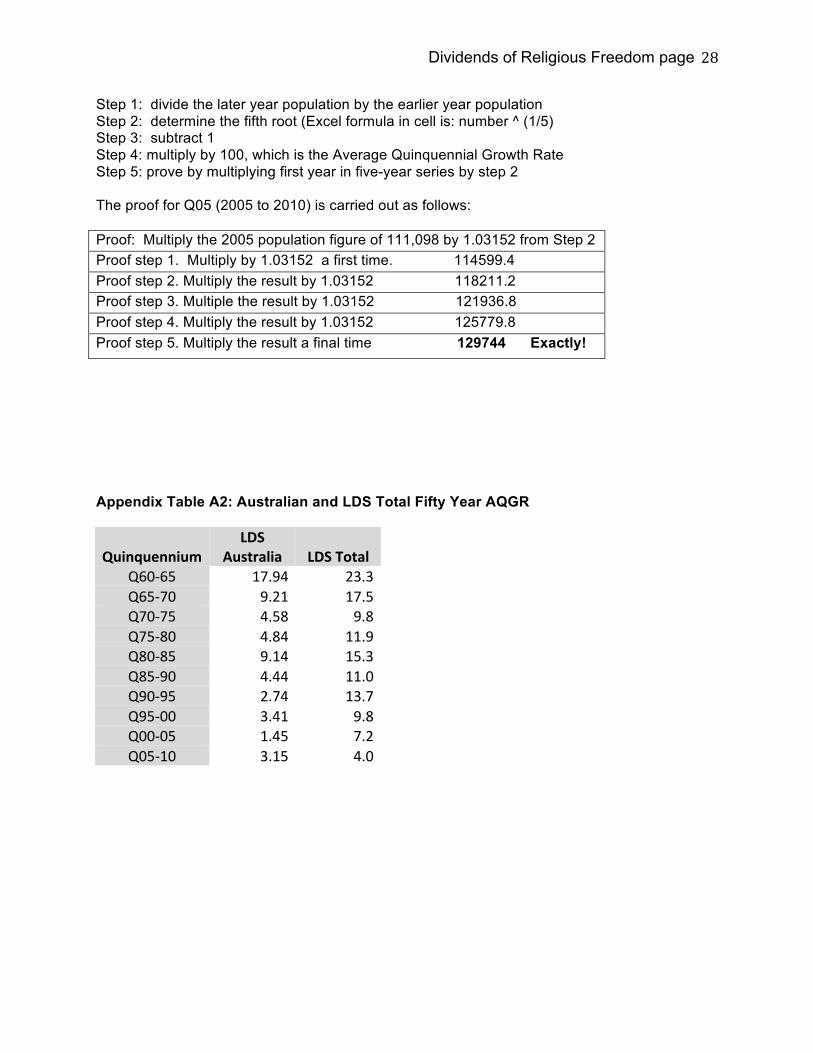
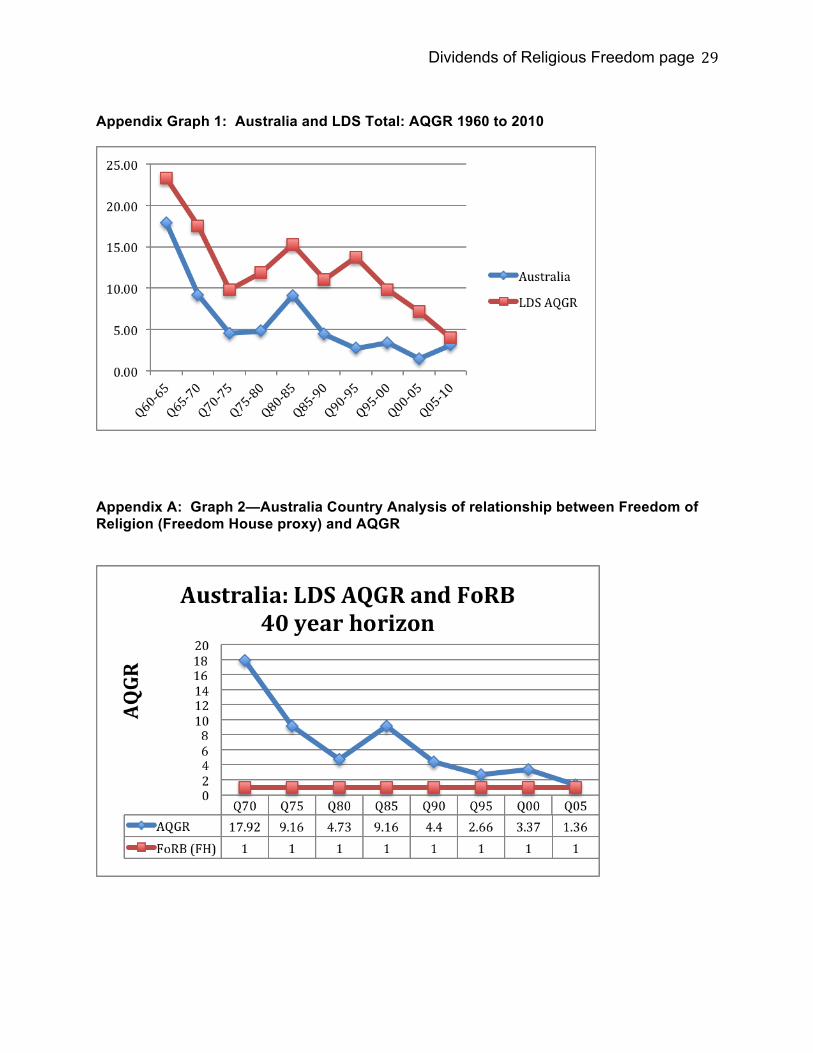
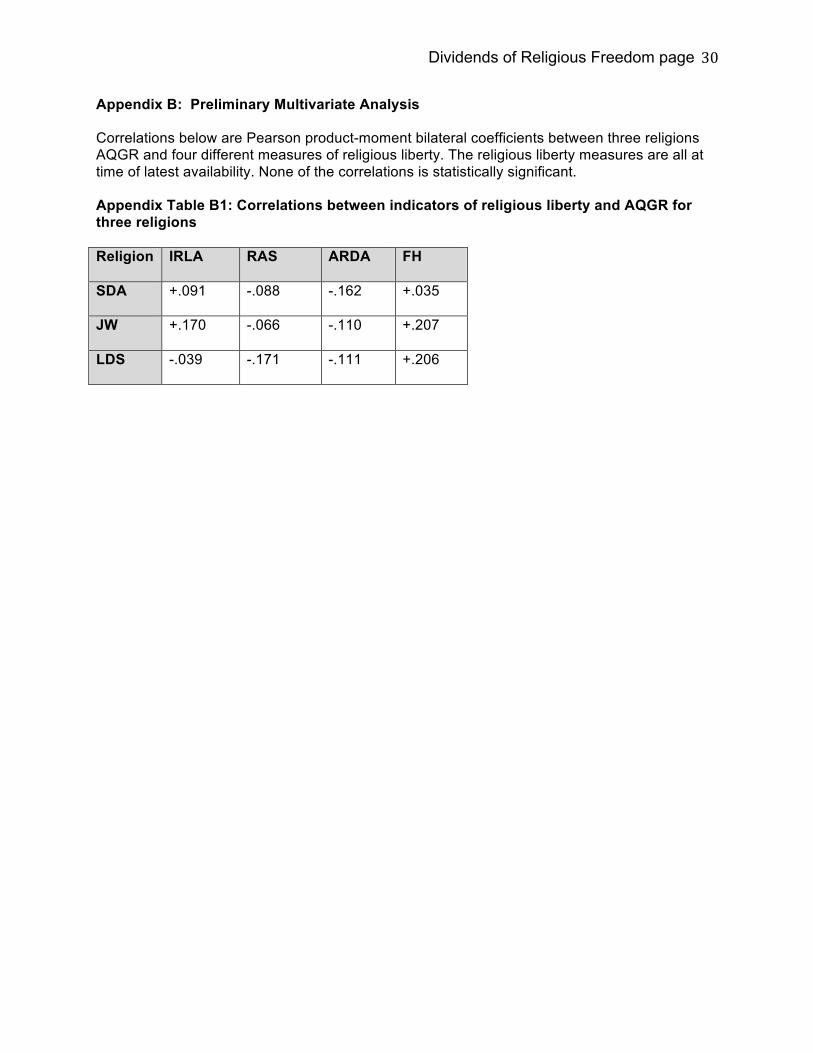
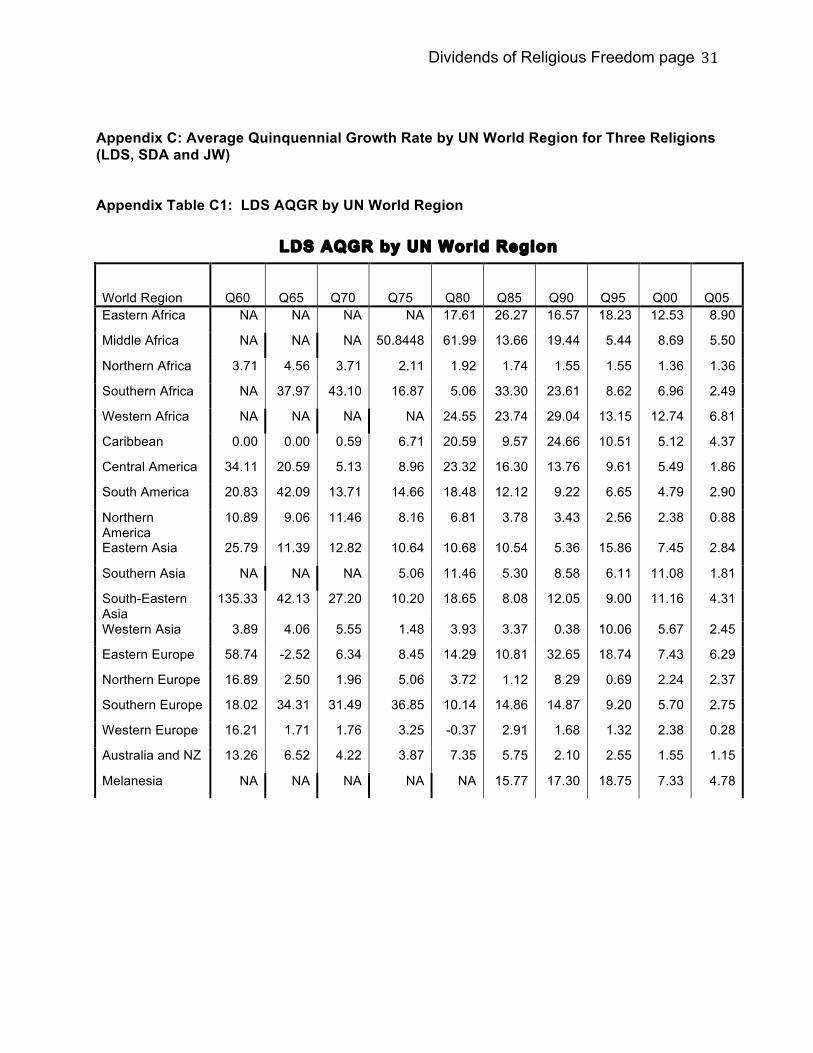
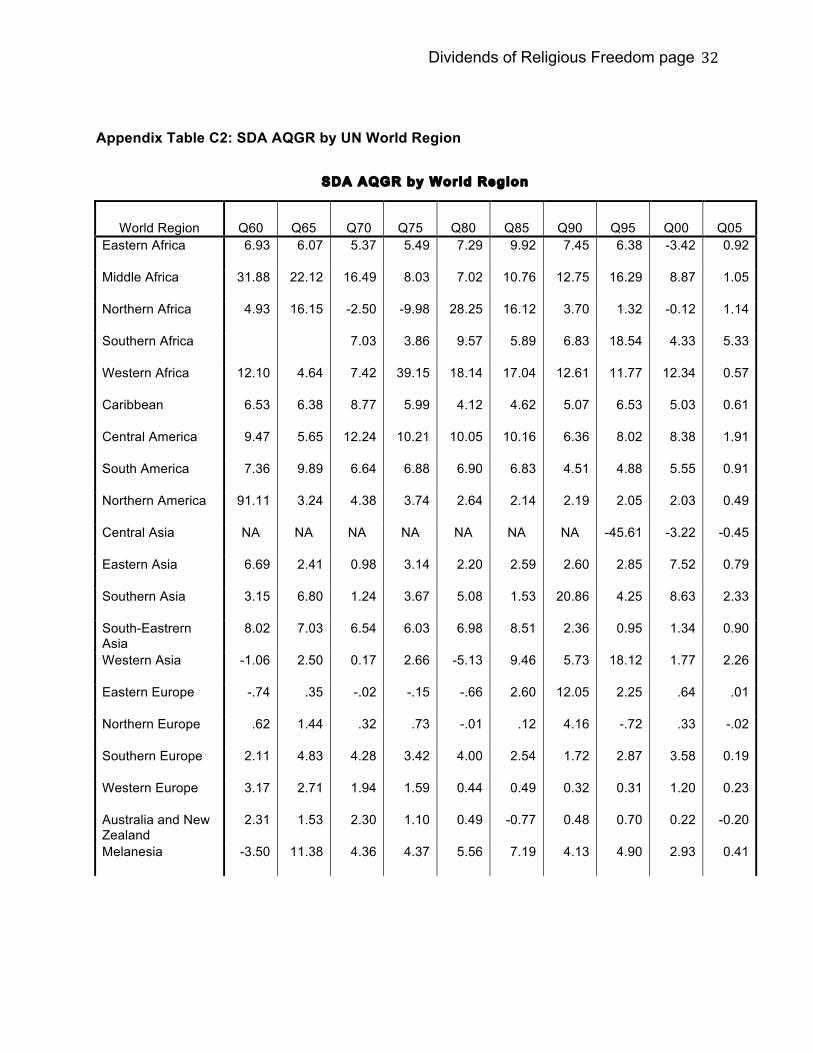


![-imLIGIOUS FREEDOM AND THE CONFESSIONAL STATE...RELIGIOUS FREEDOM AND THE CONFESSIONAL STATE [635] RELIGIOUS FREEDOM AND THE CONFESSIONAL STATE freedom of conscience and ofreligion](https://static.documents.pub/doc/80x56/5e8adbc12c8f364a0b169b8d/-imligious-freedom-and-the-confessional-state-religious-freedom-and-the-confessional.jpg)


