AU-22 001-2018 December 2017 The Ionizing Radiation Dose Ranges Chart was developed by the Department of Energy (DOE) and is used by the Office of the Associate Under Secretary for Environment, Health, Safety and Security (AU) and various other DOE organizations in presentations and radiation protection training activities. This supporting document introduces radiation science and explains the Chart for those not completely familiar with the concepts it presents. INTRODUCTION Radiation is a normal part of our existence. Every day each of us is exposed to radiation from naturally-occurring radionuclides in our environment and in the foods we eat, as well as from cosmic radiation from space. Many individuals are exposed to additional radiation from medical diagnostics and procedures that can vary in dose by several orders of magnitude. The newly-revised DOE Ionizing Radiation Dose Ranges Chart puts this into perspective by comparing ranges of doses from natural sources with doses received occupationally or medically. The Chart attempts to provide a user-friendly reference for comparison of radiation exposures of interest to scientists and the public, illustrating how ionizing radiation interacts with humans over six orders of magnitude. This Information Brief will explain the basic features and the arrangement of the subject matter on the Chart. To begin, some basic radiation physics and radiation biology will be reviewed. RADIATION PHYSICS Radiation is the emission or transmission of energy through a vacuum or through a material medium. Radiation broadly manifests in two forms: electromagnetic radiation (photons, e.g., heat, radio waves, microwaves, visible light, x-rays, gamma-rays), and particle radiation (e.g., alpha particles, beta particles, neutrons, or heavy ions). Current scientific theory holds that all energetic particles also have a wave nature, and that all electromagnetic waves have a particulate nature; thus, light waves also behave as discreet packets of energy, known as photons. Ionizing Radiation. Ionizing radiation is radiation that carries sufficient energy to release one or more electrons from their accustomed positions in atoms in matter through which it is traveling. Upon loss of one or more of its electrons, the atom is said to be ionized. The electrons and atoms may immediately recombine, and most do recombine, but if they do not then the atoms are left with a positive charge. An ionized atom or molecule may now behave differently in matter. Ionizing radiation can be either electromagnetic waves (photons) on the high-energy end of the electromagnetic spectrum (very high UV, X-rays, and gamma-rays), or energetic subatomic particles, ions, and atoms moving at high speeds. Figure 1 illustrates the more common types of ionizing radiation. Alpha particles () are ionized helium nuclei with a positive charge of 1 or 2; beta The DOE Ionizing Radiation Dose Ranges Chart How does where you live affect your exposure to radiation? Should you be concerned about dental x-rays? What about a CT scan?
Transcript
AU-22 001-2018 December 2017
The Ionizing Radiation Dose Ranges Chart was developed by the Department of Energy (DOE) and is used by the Office of the Associate Under Secretary for Environment, Health, Safety and Security (AU) and various other DOE organizations in presentations and radiation protection training activities. This supporting document introduces radiation science and explains the Chart for those not completely familiar with the concepts it presents.
INTRODUCTION Radiation is a normal part of our existence. Every day each of us is exposed to radiation from naturally-occurring radionuclides in our environment and in the foods we eat, as well as from cosmic radiation from space. Many individuals are exposed to additional radiation from medical diagnostics and procedures that can vary in dose by several orders of magnitude. The newly-revised DOE Ionizing Radiation Dose Ranges Chart puts this into perspective by comparing ranges of doses from natural sources with doses received occupationally or medically. The Chart attempts to provide a user-friendly reference for comparison of radiation exposures of interest to scientists and the public, illustrating how ionizing radiation interacts with humans over six orders of magnitude. This Information Brief will explain
the basic features and the arrangement of the subject matter on the Chart. To begin, some basic radiation physics and radiation biology will be reviewed. RADIATION PHYSICS Radiation is the emission or transmission of energy through a vacuum or through a material medium. Radiation broadly manifests in two forms: electromagnetic radiation (photons, e.g., heat, radio waves, microwaves, visible light, x-rays, gamma-rays), and particle radiation (e.g., alpha particles, beta particles, neutrons, or heavy ions). Current scientific theory holds that all energetic particles also have a wave nature, and that all electromagnetic waves have a particulate nature; thus, light waves also behave as discreet packets of energy, known as photons. Ionizing Radiation. Ionizing radiation is radiation that carries sufficient energy to release one or more electrons from their accustomed positions in atoms in matter through which it is traveling. Upon loss of one or more of its electrons, the atom is said to be ionized. The electrons and atoms may immediately recombine, and most do recombine, but if they do not then the atoms are left with a positive charge. An ionized atom or molecule may now behave differently in matter. Ionizing radiation can be either electromagnetic waves (photons) on the high-energy end of the electromagnetic spectrum (very high UV, X-rays, and gamma-rays), or energetic subatomic particles, ions, and atoms moving at high speeds. Figure 1 illustrates the more common types of
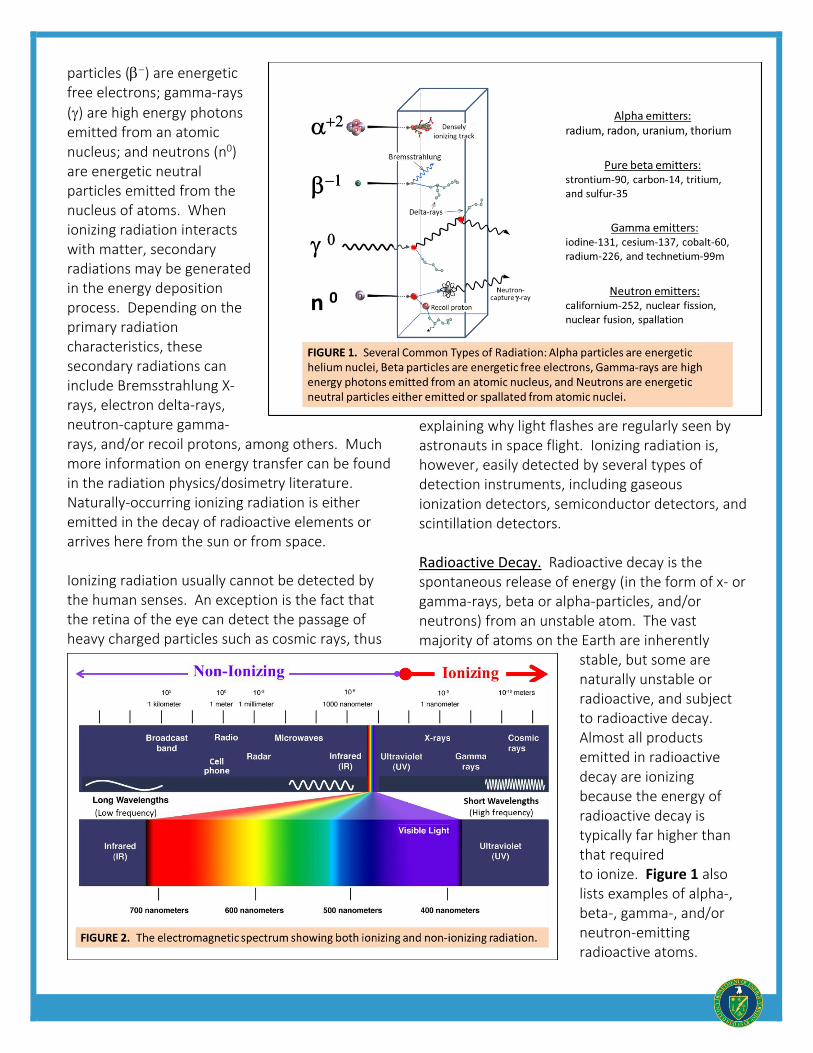
ionizing radiation. Alpha particles () are ionized helium nuclei with a positive charge of 1 or 2; beta
The DOE Ionizing Radiation Dose Ranges Chart
How does where you live affect your
exposure to radiation? Should you be
concerned about dental x-rays? What
about a CT scan?
particles () are energetic free electrons; gamma-rays
() are high energy photons emitted from an atomic nucleus; and neutrons (n0) are energetic neutral particles emitted from the nucleus of atoms. When ionizing radiation interacts with matter, secondary radiations may be generated in the energy deposition process. Depending on the primary radiation characteristics, these secondary radiations can include Bremsstrahlung X-rays, electron delta-rays, neutron-capture gamma-rays, and/or recoil protons, among others. Much more information on energy transfer can be found in the radiation physics/dosimetry literature. Naturally-occurring ionizing radiation is either emitted in the decay of radioactive elements or arrives here from the sun or from space. Ionizing radiation usually cannot be detected by the human senses. An exception is the fact that the retina of the eye can detect the passage of heavy charged particles such as cosmic rays, thus
explaining why light flashes are regularly seen by astronauts in space flight. Ionizing radiation is, however, easily detected by several types of detection instruments, including gaseous ionization detectors, semiconductor detectors, and scintillation detectors. Radioactive Decay. Radioactive decay is the spontaneous release of energy (in the form of x- or gamma-rays, beta or alpha-particles, and/or neutrons) from an unstable atom. The vast majority of atoms on the Earth are inherently
stable, but some are naturally unstable or radioactive, and subject to radioactive decay. Almost all products emitted in radioactive decay are ionizing because the energy of radioactive decay is typically far higher than that required to ionize. Figure 1 also lists examples of alpha-, beta-, gamma-, and/or neutron-emitting radioactive atoms.
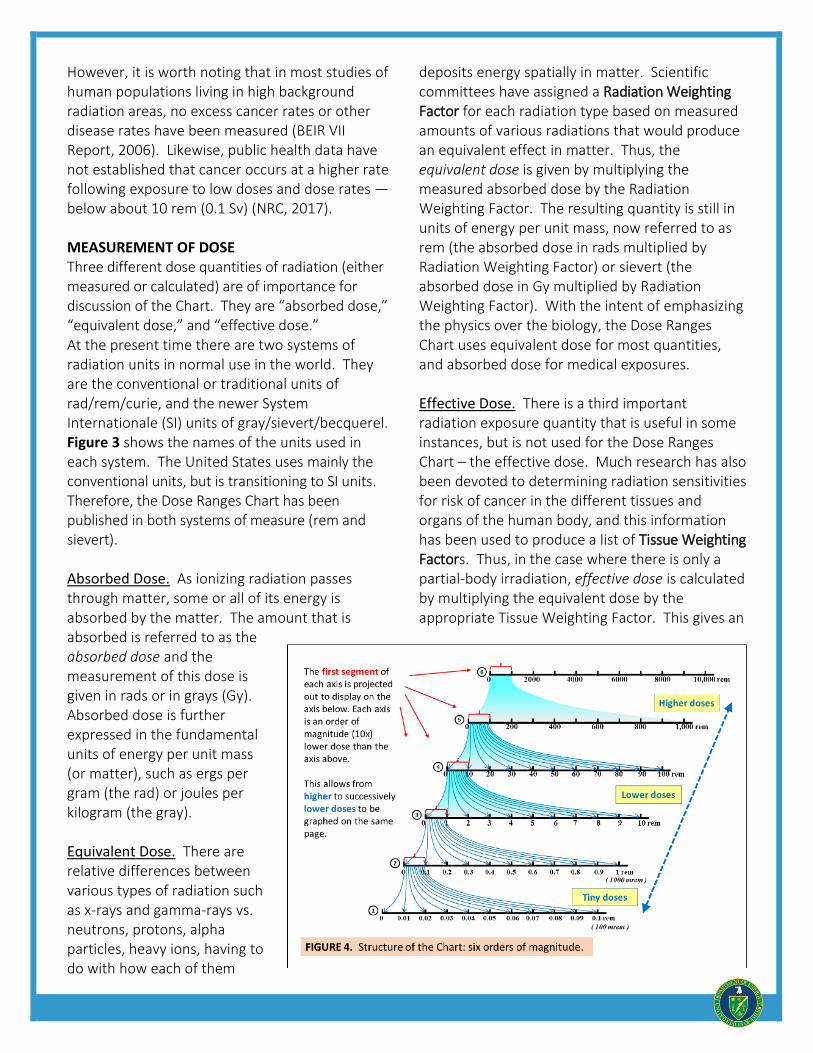
Non-Ionizing Radiation. Non-ionizing radiation does not have enough energy to ionize the matter through which it travels. It is only capable at most of exciting the electrons to vibrate faster, but not enough for them to escape; the energy imparted falls short of the binding energy of the electron, and therefore does not change the chemistry of the parent atom. Non-ionizing radiation includes the photons with energies at, or below, the middle ultraviolet part of the electromagnetic spectrum, including visible light, infrared, microwaves, and radio waves. Different wave frequencies have been used for many decades in human inventions such as broadcast television, radio, and more recently the cell phone. Figure 2 shows the extended electromagnetic spectrum to include both ionizing and non-ionizing photon radiation. (Note: Non-ionizing radiation is not included on the Dose Ranges Chart.) RADIATION BIOLOGY Ionizing radiation can also impart enough energy in biological systems to release one or more electrons from their normal positions in atoms within biomolecules. This ionization can significantly change the subsequent chemistry of the biomolecule, and can impact the subsequent health of the system. For example, if atoms that make up a DNA molecule in a biological cell are ionized, then one or more single or double-strand DNA breaks may occur. If the cell survives but the breaks are not repaired, or are repaired incorrectly, then the damaged cell could impact the health of the tissue. Low Dose Exposures. The vast majority of human exposure to radiation is in the low
dose range below 10 rem acutely delivered or 50 rem chronically delivered, and for these small doses our natural protective defenses are generally more than adequate for a healthy individual to resolve the damage. Even a severely damaged cell in an otherwise healthy human tissue or organ will normally undergo cell death and be replaced. Our protective mechanisms include DNA repair, cell death and replacement, immune system surveillance, and adaptive response. High Dose Exposures. Conversely, if the radiation dose is high enough and the rate of exposure is also high (acute exposure), then our protective homeostatic defenses will be damaged over a wide area and cannot operate efficiently, and may even be permanently compromised. Exposure to very high doses of ionizing radiation, given at a fast rate (seconds to minutes) causes damage to living tissue that may not be repaired. Depending on the total dose, high dose rate exposure can result in higher risk of cancer over a lifetime, radiation sickness, or even death. Humans differ by age, gender, genetic predisposition, state of health, etc., and will also show variability in defending against the many environmental stresses with which we live.
However, it is worth noting that in most studies of human populations living in high background radiation areas, no excess cancer rates or other disease rates have been measured (BEIR VII Report, 2006). Likewise, public health data have not established that cancer occurs at a higher rate following exposure to low doses and dose rates — below about 10 rem (0.1 Sv) (NRC, 2017). MEASUREMENT OF DOSE Three different dose quantities of radiation (either measured or calculated) are of importance for discussion of the Chart. They are “absorbed dose,” “equivalent dose,” and “effective dose.” At the present time there are two systems of radiation units in normal use in the world. They are the conventional or traditional units of rad/rem/curie, and the newer System Internationale (SI) units of gray/sievert/becquerel. Figure 3 shows the names of the units used in each system. The United States uses mainly the conventional units, but is transitioning to SI units. Therefore, the Dose Ranges Chart has been published in both systems of measure (rem and sievert). Absorbed Dose. As ionizing radiation passes through matter, some or all of its energy is absorbed by the matter. The amount that is absorbed is referred to as the absorbed dose and the measurement of this dose is given in rads or in grays (Gy). Absorbed dose is further expressed in the fundamental units of energy per unit mass (or matter), such as ergs per gram (the rad) or joules per kilogram (the gray). Equivalent Dose. There are relative differences between various types of radiation such as x-rays and gamma-rays vs. neutrons, protons, alpha particles, heavy ions, having to do with how each of them
deposits energy spatially in matter. Scientific committees have assigned a Radiation Weighting Factor for each radiation type based on measured amounts of various radiations that would produce an equivalent effect in matter. Thus, the equivalent dose is given by multiplying the measured absorbed dose by the Radiation Weighting Factor. The resulting quantity is still in units of energy per unit mass, now referred to as rem (the absorbed dose in rads multiplied by Radiation Weighting Factor) or sievert (the absorbed dose in Gy multiplied by Radiation Weighting Factor). With the intent of emphasizing the physics over the biology, the Dose Ranges Chart uses equivalent dose for most quantities, and absorbed dose for medical exposures. Effective Dose. There is a third important radiation exposure quantity that is useful in some instances, but is not used for the Dose Ranges Chart – the effective dose. Much research has also been devoted to determining radiation sensitivities for risk of cancer in the different tissues and organs of the human body, and this information has been used to produce a list of Tissue Weighting Factors. Thus, in the case where there is only a partial-body irradiation, effective dose is calculated by multiplying the equivalent dose by the appropriate Tissue Weighting Factor. This gives an
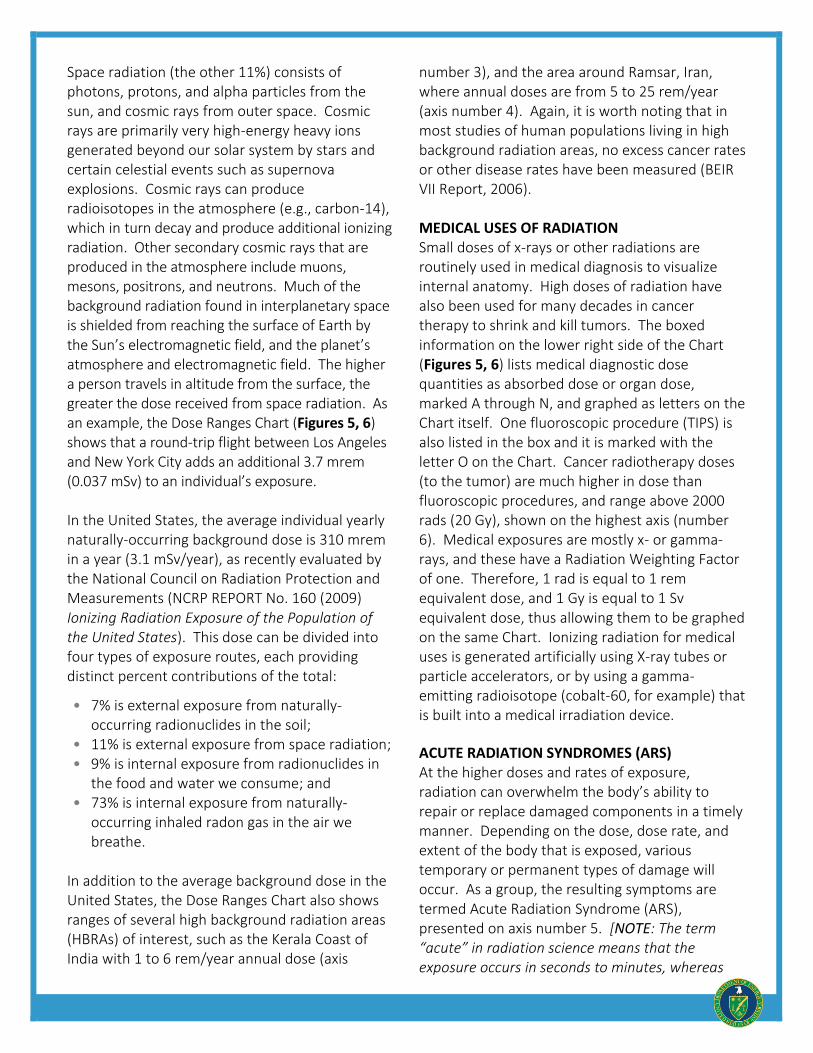
estimate of the dose to the whole individual that would effectively produce the same risk of cancer. Effective dose has the same unit names as equivalent dose—the rem or the Sievert (see Figure 3). STRUCTURE OF THE CHART The general structure of the Dose Ranges Chart is shown in Figure 4, using the conventional (traditional) unit of the rem. Each of the axes are numbered from one to six, for ease of discussion. Study each of the axes in turn. Notice that each axis is a linear scale, beginning with zero and ending with a power of ten in units as designated for each axis. For example, the top axis, labelled 6 in Figure 4, shows a dose range of from zero to 10,000 rem. Compare the range from one axis to the next, and notice that neighboring axes differ by a factor of ten (an order of magnitude). As can be
seen by traveling from the topmost axis downward, each succeeding lower axis comprises a projection of the first 1/10th of the dose of its neighbor axis above. Thus, the next axis down, labeled 5, has a dose range of from zero to 1,000 rem. The blue colored shapes sweeping down to connect the neighboring axes are designed to remind the reader of this relationship. Each succeeding lower axis expands and spreads out the first tenth of the upper axis so that the dose ranges graphed within that order of magnitude can be easily seen. Another way to picture the Chart structure is to start at the lowest axis (number 1) and realize that its entire range, from zero to 100 mrem, fits into the first 1/10th of the axis above it (number 2). In the case of these two lower axes, some quantities are graphed on both of the axes—medical
diagnostics A and B, and also the “DOE, NRC dose limit for the public: 100 mrem/y.” Figures 5 and 6 are the Dose Ranges Chart in rem and sievert, respectively. The information can be mostly subdivided into several topics, which are color-coded for easier recognition: • Natural Background Radiation is seen in green
text and arrows; • Medical Diagnostics and Therapy are in blue; • Acute Radiation Syndromes are in grey or
black; and • Regulations and Guidelines are in red.
NATURAL BACKGROUND RADIATION Everyone on the planet is exposed to naturally-occurring background radiation, thus it warrants slightly longer discussion here. Cosmic rays and the decay of radioactive elements are the primary
sources of natural ionizing radiation on Earth and are referred to as background radiation. Radioactive decay is the major source (89%) of background radiation exposure. We receive internal exposures from radionuclides acquired from food and water and from the radioactive radon gas in the air. We receive external exposure from naturally-occurring radionuclides in the soil. Naturally-occurring radioactive elements in Earth’s crust of greatest importance are the uranium-238 series, the thorium-232 series, and potassium-40 (238U and 232Th series, and 40K). The significant radioactive elements taken into our bodies through food and water are potassium-40, carbon-14, and radium-226 (40K, 14C, 226Ra), while those breathed in from the air are radon-222 and radon-220 (222Rn and 220Rn).
Space radiation (the other 11%) consists of photons, protons, and alpha particles from the sun, and cosmic rays from outer space. Cosmic rays are primarily very high-energy heavy ions generated beyond our solar system by stars and certain celestial events such as supernova explosions. Cosmic rays can produce radioisotopes in the atmosphere (e.g., carbon-14), which in turn decay and produce additional ionizing radiation. Other secondary cosmic rays that are produced in the atmosphere include muons, mesons, positrons, and neutrons. Much of the background radiation found in interplanetary space is shielded from reaching the surface of Earth by the Sun’s electromagnetic field, and the planet’s atmosphere and electromagnetic field. The higher a person travels in altitude from the surface, the greater the dose received from space radiation. As an example, the Dose Ranges Chart (Figures 5, 6) shows that a round-trip flight between Los Angeles and New York City adds an additional 3.7 mrem (0.037 mSv) to an individual’s exposure. In the United States, the average individual yearly naturally-occurring background dose is 310 mrem in a year (3.1 mSv/year), as recently evaluated by the National Council on Radiation Protection and Measurements (NCRP REPORT No. 160 (2009) Ionizing Radiation Exposure of the Population of the United States). This dose can be divided into four types of exposure routes, each providing distinct percent contributions of the total:
• 7% is external exposure from naturally-occurring radionuclides in the soil;
• 11% is external exposure from space radiation; • 9% is internal exposure from radionuclides in
the food and water we consume; and • 73% is internal exposure from naturally-
occurring inhaled radon gas in the air we breathe.
In addition to the average background dose in the United States, the Dose Ranges Chart also shows ranges of several high background radiation areas (HBRAs) of interest, such as the Kerala Coast of India with 1 to 6 rem/year annual dose (axis
number 3), and the area around Ramsar, Iran, where annual doses are from 5 to 25 rem/year (axis number 4). Again, it is worth noting that in most studies of human populations living in high background radiation areas, no excess cancer rates or other disease rates have been measured (BEIR VII Report, 2006). MEDICAL USES OF RADIATION Small doses of x-rays or other radiations are routinely used in medical diagnosis to visualize internal anatomy. High doses of radiation have also been used for many decades in cancer therapy to shrink and kill tumors. The boxed information on the lower right side of the Chart (Figures 5, 6) lists medical diagnostic dose quantities as absorbed dose or organ dose, marked A through N, and graphed as letters on the Chart itself. One fluoroscopic procedure (TIPS) is also listed in the box and it is marked with the letter O on the Chart. Cancer radiotherapy doses (to the tumor) are much higher in dose than fluoroscopic procedures, and range above 2000 rads (20 Gy), shown on the highest axis (number 6). Medical exposures are mostly x- or gamma-rays, and these have a Radiation Weighting Factor of one. Therefore, 1 rad is equal to 1 rem equivalent dose, and 1 Gy is equal to 1 Sv equivalent dose, thus allowing them to be graphed on the same Chart. Ionizing radiation for medical uses is generated artificially using X-ray tubes or particle accelerators, or by using a gamma-emitting radioisotope (cobalt-60, for example) that is built into a medical irradiation device.
ACUTE RADIATION SYNDROMES (ARS) At the higher doses and rates of exposure, radiation can overwhelm the body’s ability to repair or replace damaged components in a timely manner. Depending on the dose, dose rate, and extent of the body that is exposed, various temporary or permanent types of damage will occur. As a group, the resulting symptoms are termed Acute Radiation Syndrome (ARS), presented on axis number 5. [NOTE: The term “acute” in radiation science means that the exposure occurs in seconds to minutes, whereas
“chronic” exposure happens over days, months, years, or decades. Both acute and chronic exposures can be of varying amounts of dose.] For ARS, the damage ranges from a transient skin erythema (reddening of skin) within 2–24 hours after about 200 rem, to immediate death by cerebral/vascular breakdown after 9000 rem or greater (whole body acute). Observation of ARS in irradiated individuals was the earliest type of biodosimetry known; by looking at the combination of symptoms of an exposed accident victim, it is possible to determine a rough estimate of radiation dose received. A lower dose of about 45 rem acute may result in a transient increase in chromosome aberrations in the blood; this type of biodosimetry is used today for emergency occurrences when radiation detector measurements are not available.
Axis number 5 shows two separate but overlapping LD50/30 dose ranges. This notation is defined as Lethal Dose 50/30: the whole body acute dose that results in lethality to 50% of an exposed population within 30 days after irradiation. The Chart shows LD50/30 ranges for a human population either with or without medical intervention.
REGULATIONS AND GUIDELINES As presented in axis number 1, the Federal government is responsible for setting both occupational and public radiation exposure standards and limits in the United States. The Federal agencies that have regulatory authority for radiation protection at different sites/facilities include DOE, EPA, NRC, DOD, DHS, DOT, HHS, and OSHA. The EPA and DHS also have established guidelines to be used in emergency situations. Several of these guidelines are graphed on the Chart in axes number 3 and 4.
THE CHART DISCLAIMER The Chart was compiled under the auspices of DOE, but please notice the disclaimer that is appended to the Note at the bottom of the Chart, part of which reads:
“…Disclaimer: Neither the United States Government nor any agency thereof, nor any of their employees, makes any warranty, express or implied, or assumes any legal liability or responsibility for the accuracy, completeness, or usefulness of any information disclosed.”
SELECTED REFERENCES Anno GH, Young RW, Bloom RM, and Mercier JR. Dose Response Relationships for Acute Ionizing –Radiation Lethality. Health Physics; 84: 565-575; 2003.
Hall, EJ and Giaccia, AJ. Radiobiology for the Radiologist, 7th edition. Lippincott Williams & Wilson, 2012.
National Academies of Sciences, Engineering, and Medicine. Adopting the International System of Units for Radiation Measurements in the United States: Proceedings of a Workshop. Washington DC: The National Academies Press, 2017.
National Council on Radiation Protection and Measurements (NCRP), NCRP Report No. 160 Ionizing Radiation Exposure of the Population of the United States. https://www.ncrppublications.org/Reports/160, 2009.
National Research Council. BEIR VII Report, Health Risks from Exposure to Low Levels of Ionizing Radiation: BEIR VII Phase 2. Washington, DC: The National Academies Press, 2006.
Nuclear Regulatory Commission (NRC). Radiation Exposure and Cancer. https://www.nrc.gov/about-nrc/radiation/health-effects/rad-exposure-cancer.html, 2017.
Questions or suggestions concerning this Information Brief or the Dose Ranges Chart should be directed to Noelle Metting at [email protected], or to [email protected].