The Domino Theory: An Empirical Investigation * Peter T. Leeson † Andrea M. Dean George Mason University West Virginia University Abstract The “domino theory” has a long and impressive history guiding global foreign policy. According to this theory, increases or decreases in democracy in one country spread and “infect” neighboring countries, increasing or decreasing their democracy in turn. Using panel data that covers over 130 countries between 1900 and 2000, this paper empirically investigates the domino theory. We find that democratic dominoes do in fact fall, as the theory contends. However, these dominoes fall significantly “lighter” than the historical importance of this model suggests. Countries consistently “catch” only about 11 percent of the increases or decreases in their average geographic neighbors’ increases or decreases in democracy. We also explore whether U.S. military intervention is capable of spreading democracy, as policymakers reasoning according to the domino theory have argued. Our results are mixed. Post-WWII occupation of Austria successfully spread democracy to its neighbors. More recent occupations in Haiti and the Dominican Republic failed to do so. * We are especially grateful to Chris Coyne, Andrei Shleifer, and Russell S. Sobel for invaluable comments and suggestions. The financial support of the Kendrick Fund is also gratefully acknowledged. † Email: [email protected]. Address: Department of Economics, George Mason University, MSN 3G4, Fairfax, VA 22030. 1
Transcript
The Domino Theory: An Empirical Investigation*
Peter T. Leeson† Andrea M. Dean George Mason University West Virginia University
Abstract
The “domino theory” has a long and impressive history guiding global foreign policy. According to this theory, increases or decreases in democracy in one country spread and “infect” neighboring countries, increasing or decreasing their democracy in turn. Using panel data that covers over 130 countries between 1900 and 2000, this paper empirically investigates the domino theory. We find that democratic dominoes do in fact fall, as the theory contends. However, these dominoes fall significantly “lighter” than the historical importance of this model suggests. Countries consistently “catch” only about 11 percent of the increases or decreases in their average geographic neighbors’ increases or decreases in democracy. We also explore whether U.S. military intervention is capable of spreading democracy, as policymakers reasoning according to the domino theory have argued. Our results are mixed. Post-WWII occupation of Austria successfully spread democracy to its neighbors. More recent occupations in Haiti and the Dominican Republic failed to do so.
* We are especially grateful to Chris Coyne, Andrei Shleifer, and Russell S. Sobel for invaluable comments and suggestions. The financial support of the Kendrick Fund is also gratefully acknowledged. † Email: [email protected]. Address: Department of Economics, George Mason University, MSN 3G4, Fairfax, VA 22030.
1
1 Introduction
In a 1954 press conference, then-U.S. President Dwight Eisenhower famously described what he
called “the falling domino principle” behind American foreign policy: “You have a row of
dominoes set up, you knock over the first one, and what will happen to the last one is the
certainty that it will go over very quickly. So you could have a beginning of a disintegration that
would have the most profound influences.”1
The dominoes Eisenhower described were countries and the contagious element they
carried with them were the political-economic features of totalitarian communism or democratic
capitalism. According to this “domino theory,” increases in democracy in one country spread to
neighboring countries, increasing their democracy, which spreads to their neighbors and so on.
The result is greater democracy in the region and world. On the other hand, decreases in
democracy in one country also “infect” neighboring nations, reducing their democracy, which
spreads to their neighbors, deteriorating global democracy.
The domino theory is the most pervasive model of geo-political determination in modern
history. This theory’s important Cold War legacy is well known. From Eisenhower’s
predecessor, Harry Truman, who intervened in South Korea in 1950, to Ronald Reagan’s
intervention in Latin America in the 1980s, American political leaders explicitly rooted
important foreign policy decisions in the domino theory’s logic. From the end of WWII until the
collapse of the Soviet Union the domino theory undeniably stood “at the heart of American
foreign policy” (Slater 1987: 105).
1 Presidential News Conference, April 7, 1954.
2
Less well-advertised is the prominent role the domino theory played in U.S. foreign
policy decisions well before it was rendered explicit in the 1950s. Domino theory reasoning has
played a pivotal role in major American foreign policy decisions going back nearly a century.
One example of this is Woodrow Wilson’s reasoning for initiating American involvement in
WWI. As Ninkovich (1994) points out, Wilson, who on the eve of WWI famously declared
America’s mission as “making the world safe for democracy,” clearly had the domino theory in
mind. Wilson argued that America’s entrance into WWI “prevented a catastrophe that might
have overwhelmed the world.”2
Franklin Delano Roosevelt also adhered to a proto-domino theory (Ninkovich 1994).
Roosevelt famously feared the spread of fascism not only through Hitler’s military conquest, but
also through fascist contagion to neighboring countries Hitler did not invade. Stanley K.
Hornbeck, Roosevelt’s Chief Advisor for Far Eastern Affairs in the State Department, likened
the global geo-political landscape to a gigantic fabric. “Disturb this fabric at any point,” he
argued, “and you produce disturbances throughout its entirety.”3
American is not the only country whose important foreign policy decisions have long-
been rooted in falling domino logic. Foreign policymakers in Germany, Britain, and elsewhere
have reasoned according to this model as well (Jarvis 1991: 20-21). During the Cold War, for
instance, the Soviet Union feared the spread of democratic capitalism as much as the West feared
the spread of totalitarian communism. Like their American counterparts, Soviet foreign
policymakers viewed democracy as a virus that spreads between neighboring countries. On the
basis of this model, for nearly 50 years the Soviet Union struggled against the U.S. to maintain
2 Quoted in Ninkovich (1994). 3 Quoted in Ninkovich (1994).
3
control of “key dominoes” it believed were critical to tipping important regions toward its
political organization against the West.
The domino theory did not die with the Cold War, however. Most recently, this idea has
been used to justify American intervention in Iraq and the Middle East, which the New Republic
called “the most important foreign policy decision in a generation” (Ackerman 2006). According
to George W. Bush, “The establishment of a free Iraq at the heart of the Middle East will be a
watershed event in the global democratic revolution.”4 By improving democracy in Iraq, it is
argued, American occupation will lead to falling democratic dominoes that democratize the
Middle East.
Despite the domino theory’s long and impressive history guiding global foreign affairs,
no one has formally investigated whether in fact changes in democracy spread between
geographic neighbors as this theory hypothesizes. Indeed, surprising little research directly
addresses the domino theory as a general proposition at all. Several Cold War-era papers offer
their judgments of whether domino effects will be important in one country or another and what
the broader consequences of falling dominoes might be in particular nations (see, for instance,
Murphy 1966; Viksnins 1974). Several others argue that the stakes of falling dominoes during
the Cold War were exaggerated (see, for instance, Slater 1987; Walt 2000). A few papers that
consider how the domino theory metaphor has impacted countries’ foreign policy also exist (see,
for instance, Shimko 1994). Understandably for the time it was written, much of this research
focuses exclusively on Southeast Asia, or confines itself to other “specific dominoes” rather than
on the general theory of falling democratic dominoes (see, for instance, Silverman 1975).
4 “President Bush Discusses Freedom in Iraq and the Middle East,” Remarks to the National Endowment for Democracy at the United States Chamber of Commerce, November 6, 2003.
4
An important collection of essays complied by Jervis and Snyder (1991) comes the
closest to empirically evaluating the validity of the domino theory idea. However, these essays
tend to be country or region-specific and rely exclusively on case studies. No one, in contrast,
has empirically investigated the domino theory using formal, econometric methods or
considering a large sample of the world’s countries over long periods of time. While case-study
evidence can be intriguing and is crucial for understanding the more micro-level issues involved,
it does not allow us to isolate the domino effect if one exists, measure this effect, or provide
evidence of a general domino effect that would allow us to determine whether the domino theory
is valid or not. This requires a special kind of econometric analysis designed to measure spatial
dependence covering many countries over many years.
The key questions of the domino theory’s general validity therefore remain. Does
democracy spread? If so, to what extent? Could democratizing key countries in undemocratic
portions of the world really lead to greater democracy in the region and beyond, as American
policy leaders from Woodrow Wilson to George W. Bush have argued?
This paper is the first to empirically examine these questions with formal methods. It
explores the spread of democracy between countries using spatial econometric methods designed
specifically to identify and measure spatial interdependences, such as the democratic
interdependency postulated by the domino theory. We estimate both spatial autoregressive
(SAR) and spatial error (SEM) models using panel data that span more than 130 countries for the
century between 1900 and 2000.
Our results suggest that democracy does in fact spread, as the domino theory contends.
However, democratic dominoes fall significantly “lighter” than foreign policy applications of
this principle pretend. Countries consistently “catch” about 11 percent of their average
5
geographic neighbors’ changes in democracy. These findings are highly robust and remain even
after accounting for traditional determinants of democracy, such as colonial origin, legal origin,
ethnolinguistic fractionalization, and continental membership.
We also explore American foreign military intervention’s ability to spread democracy
abroad. We consider three cases of U.S. occupation with the aim of increasing democracy. Our
findings are mixed. American military occupation in Austria following WWII both increased
democracy in Austria and led to positive changes in democracy that spread from Austria to its
neighbors via the domino effect. On the other hand, U.S. interventions in the Dominican
Republic and Haiti in the second half of the 20th century were unsuccessful. Occupation actually
decreased democracy in the Dominican Republic, and in both countries occupation failed to
spread democracy to their neighbor.
Existing research that examines the ‘stickiness’ of exogenously-created institutions
suggests a plausible reason for our empirical finding. In Austria, democratic institutions were
already largely in place before America entered, allowing the occupiers to make marginal
changes that strengthened Austrian democracy by building on extant institutions. In contrast, in
the Dominican Republic and Haiti existing democratic institutions were far less well established
prior to U.S. occupation. Occupiers therefore had to ‘create’ democracy where there was little
previously existing basis for it. As a result, the institutional imposition did not ‘stick’, preventing
Dominican or Hatian democratic dominoes from increasing democracy in their neighbors.
2 Data and Empirical Strategy
Our basic empirical strategy, discussed in detail below, follows Leeson and Sobel (2007) who
investigate “capitalist contagion” between neighboring countries. We search for spatial
6
dependence in changes in democracy across geographic neighbors over time. To do this, we
construct a panel of democracy scores for three different time periods, 1900-2000, 1950-2000,
and 1990-2000. We want to take advantage of the fact that international democracy scores are
available going back to the start of the 20th century; however, the further back our panel goes the
fewer countries it contains. Considering three different panels that cover different time periods
allows us to maximize the number of years and number of countries our analysis considers.
Importantly, it also allows us to see if the process of democratic contagion described by the
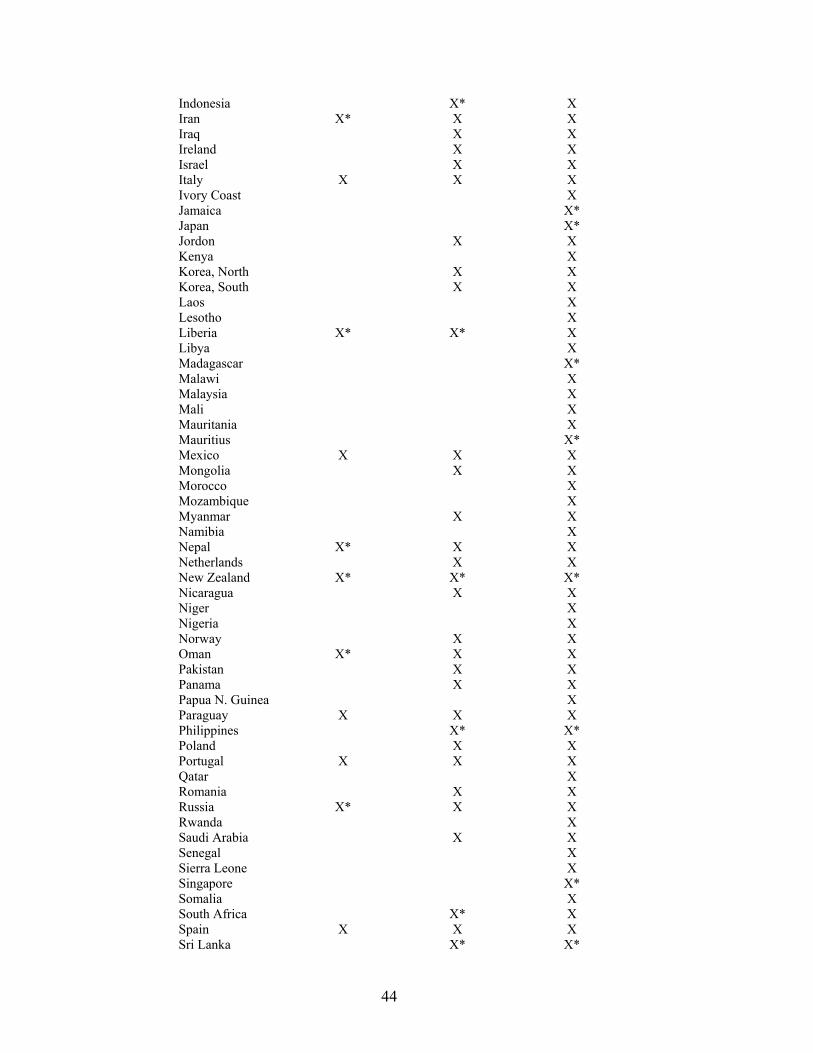
domino theory may have been at work during certain periods but not others. Appendix A lists all
of the countries in each of our samples.
Our data on democracy come from the Polity IV project (2004), which measures
countries’ levels of democracy annually beginning with 1900. This measure ranges from -10, or
“total autocracy,” to +10, or “total democracy.” To measure the extent of democracy across
countries, the Polity IV data considers the presence of political institutions and procedures
through which citizens can express effective preferences about alternative policies and leaders,
the existence of institutionalized constraints on the exercise of power by the executive, and the
guarantee of civil liberties to all citizens in their daily lives and in acts of political participation.
The resulting democracy measure captures the competitiveness of political participation,
openness and competitiveness of executive recruitment, and constraints on the chief executive in
each country. Polity IV has constructed a variable to measure these factors specifically for the
purpose of time series analysis, which makes each country’s democracy score comparable over
time. We use this measure, called Polity 2, for our analysis.
Our econometric analysis uses spatial methods, which are the most natural and effective
way to reliably estimate the spread of democracy between geographic neighbors. Unlike
7
Ordinary Least Squares, which produces biased estimates in the face of spatial correlation,
spatial methods are designed specifically to identify and measure spatial dependence. This makes
spatial methods ideally suited to investigate the domino theory since, as Danilovic points out, the
domino theory is “premised on this understanding of international events as spatially
interdependent” (2001: 344). If there is strong spatial dependence between countries’ changes in
democracy, as the domino theory contends, spatial methods will identify this and efficiently
estimate this dependence. We use two spatial models for this purpose, a spatial autoregressive
model (SAR) and a spatial error model (SEM). Each searches for spatial dependence in a
different way.
For readers unfamiliar with spatial methods, it is useful to think of the SAR model as
analogous to an autoregressive (AR) time series model, but with lags over geographic distances
rather than time. So, for a country i, one spatial lag refers to all of i’s contiguous geographic
neighbors, two spatial lags refers to contiguous geographic neighbors of i’s neighbors (i’s
neighbors that are two countries away), and so on.
The SAR model specifies each country’s dependent variable, in our case changes in
democracy, as a function of the weighted value of the changes in democracy in its neighbors. It
models how explained changes in democracy spill over onto geographic neighbors. The SAR
model allows potential democracy spillovers to flow multidirectionally rather than
unidirectionally, as it would in an AR time series model. This is important since we are
interested in how changes in democracy may flow into and out of multiple countries, influencing
the extent of democracy in each nation.
The SEM model is analogous to the moving average (MA) time series model for
contiguous geographic neighbors, which includes a spatially-correlated error structure. The SEM
8
model specifies each country’s error term, in our case for changes in democracy, as a function of
the weighted value of the changes-in-democracy error term of its geographic neighbors. It
models how unexplained changes in democracy spill over onto geographic neighbors. Like the
SAR model, the SEM model allows for multidirectional flows of influence rather than
unidirectional flows as it would in an MA time series model.
Our SAR model takes the form:
∆Dt = α + ρW∆Dt + Dt-5β + Xω + νt
where ∆Dt is an N×1 vector that measures countries’ changes in democracy between year t and
year t – 4. We consider countries’ changes in democracy over four-year periods to allow
sufficient time for changes in countries’ democracy to occur. Dt-5 is an N×1 vector that measures
countries’ lagged levels of democracy—i.e., the level of democracy that prevailed in each
country the year immediately preceding the four-year period over which countries’ changes in
democracy are calculated. X is an N×K matrix of exogenous variables, and νt is an N×1 vector of
IID random errors.
We include countries’ lagged levels of democracy in order to control for as many factors
as possible besides democratic contagion that might affect changes in democracy in its
geographic neighbors. This variable accounts for the fact that geographic neighbors often share a
similar colonial origin, legal origin, form of government, degree of ethnolinguistic
fractionalization, and other such factors that tend to persist over time. It controls for any features
of countries that contribute to their changes in democracy, which were present the year before
the period of tabulated change. The lagged democracy variable is also useful because it allows to
us determine whether there is ‘democratic convergence’ across countries. If countries with lower
levels of democracy in the previous period grow faster in terms of democracy the following
9
period, β will be negative, suggesting democratic convergence. If countries with lower levels of
democracy in the previous period grow slower in terms of democracy the following period, β
will be positive, suggesting ‘democratic divergence.’
W is an N×N spatial weight matrix based on first-degree contiguity (bordering
geographic neighbors). For example, since the United States has two contiguous geographic
neighbors, Canada and Mexico, each of these countries receives a weight of 1/2 in the spatial
weight matrix, W, as America’s geographic neighbors. This feature of the model makes it ideal
to test the domino theory since, as Johnson points out, the domino theory explicitly “linked
geography to politics by assuming that the political fate of . . . a nation would inevitably affect
the fate of contiguous nations in a continuous chain fashion” (Johnson 1985: 39). ρ, our
parameter of interest in the SAR model, is the spatial autoregressive coefficient. It measures the
spread of changes in democracy between geographic neighbors. If democracy spreads as the
domino theory suggests, this coefficient should be positive and significant.
Our SEM model takes the form:
∆Dt = α + Dt-5β + Xω + εt; λW∆εt + ηt
where our parameter of interest is λ, the spatial autocorrelation coefficient, which measures the
spread of democracy using the SEM model.
One nice feature of the domino theory for the purposes of empirical investigation is that
since this theory is geography-based, we do not need to worry about the potential for
endogeneity bias. Geography is exogenous. Countries cannot choose their geographic location
and are thus unable to affect who they have as geographic neighbors. This removes reverse
causality as a concern for our spatial estimates.
10
The biggest disadvantage of investigating the spread of democracy geographically is the
question of how to deal with islands, which have no contiguous geographic neighbors. Because
of this, in the full sample, the geographic spatial weight matrix contains values of zero when
predicting changes in democracy of islands. We address this issue in two ways. First, we run our
regressions on the entire sample treating islands as countries without neighbors, and include a
dummy variable that controls for island status. Second, as a robustness check, we estimate both
spatial models excluding islands from the sample to ensure that treating islands this way does not
affect our estimates.5 The results of this robustness check are discussed in Section 5, which
performs a sensitivity analysis of our spatial regressions.
3 Does Democracy Spread? The Evidence at a Glance
A preliminary look at the data lends support to the domino theory. In Figure 1 we create four
maps that display democracy in the world in 1900, 1950, and 1990. We color-code countries
according to democracy quartiles for each year. More democratic countries receive darker
shading and less democratic countries receive lighter shading. The white countries are those for
which we do not have democracy scores in certain years.
Two features stand out in Figure 1. First, there is substantial geographic dependence in
democracy. Consider, for example, democracy in the world in 1990. All of North America is
highly democratic. The countries of South America are relatively democratic. All of the
countries in Western Europe are highly democratic, while Central Europe is more weakly
democratic, and the countries of Eastern Europe are quite undemocratic. Africa is a bit more
5 Because of some missing observations, our sample includes a small number of “data islands”—countries that have contiguous geographic neighbors for which data are not available. Our empirical analysis treats these the same as actual islands.
11
mixed, but even here democracy displays strong geographic dependence. The southernmost part
of Africa is relative democratic, the northern region is slightly less democratic than these
countries, and the vast majority of the rest of the continent is highly undemocratic.
The second feature that stands out in Figure 1 is that changes in democracy over time also
display significant geographic dependence. Consider, for example, the pattern in the southern
part of South America over time. Figure 1 clearly shows democracy increasing together in the
countries in this region as one moves from the map for 1950 to the map for 1990, and creeping
throughout the rest of the continent as well. A similar pattern exists among the nations of Central
Europe. Between 1950 in the throws of the Cold War, and 1990 when communism is collapsing,
democracy is clearly increasing among neighboring countries in this region together.
In the graphics, at least, there is some support for the domino theory. Regions, rather than
isolated countries, are typically democratic, moderately democratic, or undemocratic.
Furthermore, the most notable changes in democracy over time appear to occur in bordering
countries, which move together as the domino theory suggests.
4 Spatial Results
While the visual evidence is intriguing, to determine if democracy spreads as the domino theory
contends we need to isolate the spread of democracy between nations econometrically. We begin
this task with our simplest spatial model, which looks for spatial dependence in changes in
democracy between geographic neighbors controlling only for island status. Table 1 contains our
results using our longest sample, which covers the years between 1900 and 2000. The left panel
of this table presents our results using the SAR model, and the right panel presents our results
using the SEM model. In both panels, the first column contains this stripped-down specification.
12
The spatial coefficients in both models are highly significant, confirming the strong
presence of spatial dependence in changes in democracy between geographic neighbors
suggested by Figure 1. Unadjusted, a country, i, whose geographic neighbors on average
experience a one unit larger increase in democracy than the geographic neighbors of some other
country, j, experiences a 0.11 unit larger increase in democracy than j. It does not matter whether
we use the SAR or SEM model, which deliver nearly identical estimates. If one cut a hole in a
map that contained no countries’ names but instead only their changes in democracy, he could
predict the missing country’s movement in democracy by taking 11 percent of the average
change in democracy in its geographic neighbors and adding it to the constant in row three.
Different continents may each have their own equilibrium level of democracy.
Additionally, there may be some factors specific to each continent independent of whether
democracy spreads that accounts for this spatial dependence. To control for this, in the second
column of each panel we include continent dummies. None of the continent dummies are
significant. The spatial coefficient in both models, in contrast, remains significant at the one
percent level and is nearly identical in size to the specification in column 1.
In the third column of both panels we control for countries’ lagged levels of democracy.
The coefficient on lagged democracy is positive and highly significant, suggesting that there has
been ‘democratic divergence’ globally over the 20th century. More democratic countries
experience larger increases in democracy from one year to the next than less democratic
countries. Further, controlling for lagged democracy leaves the spatial coefficient in both models
unchanged. Countries continue to “catch” about 11 percent of the average change in democracy
in their geographic neighbors.
13
Finally, in the last column of each panel we include controls for continent membership
and lagged democracy. The results are unchanged from the previous specifications. Our estimate
of democracy’s spread rate is highly consistent. In both models, about 11 percent of average
change in countries’ neighbors spreads to them.
Table 2 considers the same six specifications for the panel that covers the years between
1950 and 2000. Notably, here, the democratic contagion described by the domino theory is as
prominent in the second half of the 20th century as it in the 20th century overall. Democracy
spreads at nearly the same rate as above, between 10 and 12 percent. There is one notable
difference in Table 2, however. In columns 3 and 4, which include lagged democracy, the
coefficient is negative instead of positive like above. Thus, in the second half of the 20th century
the world’s countries have experienced ‘democratic convergence’—more democratic countries
becoming more democratic at a slower rate than less democratic countries. Although for the 20th
century overall nations are diverging in their levels of democracy, since 1950 they are moving
closer to one another along this important dimension.
Table 3 presents our results using our most recent panel, which covers the years between
1990 and 2000. In column 1, which contains our most basic specification, the spatial coefficient
in both the SAR and SEM models is positive and highly significant, as in the previous two
tables. Here, however, democracy’s spread rate grows slightly to 0.13. Including continent
dummies in column 2 reduces this to 0.11. In column 3, when lagged democracy is added, the
spatial coefficient falls in the SAR model to 0.10, but rises in the SEM model to 0.17. This
specification is the only one that produces any notable divergence between the estimates of the
SAR and SEM models. However, in column 4 where both continent dummies and lagged
democracy are included, this small divergence disappears and the estimated spread rate of
14
democracy becomes approximately 0.09 in both models. Thus, like in our previous panels, here
too countries “catch” about 10 percent of the average change in their neighbors’ democracy.
Finally, consistent with our panel that considered the 1950-2000 period, here too, the coefficient
on lagged democracy is negative, confirming that there has been democratic convergence across
countries in the latter 20th century.
The results in Tables 1-3 find significant spatial dependence in changes in democracy
between neighboring nations. The basic principle described by the domino theory appears to be
valid. However, our estimates also indicate that the strength with which democratic dominoes
fall has been significantly overstated by those who have reasoned according to domino effect
logic. President Eisenhower, for example, argued democratic dominoes “go over very quickly”
and when falling in the direction of less democracy create a “disintegration that would have the
most profound influences.”6 A spread rate of approximately 11 percent is hardly one that could
be described as leading democratic dominoes to “go over very quickly” and is not one capable of
producing “the most profound influences.”
To see this, consider a simple example, such as the United States, which has only two
first-order contiguous geographic neighbors—Canada and Mexico. Between 1996 and 2000
democracy in the U.S. and Canada did not measurably change, and in Mexico increased from 4
to 8, a positive four-unit change. The average change in democracy in North America was
therefore 1.33. Using the estimates from Tables 1-3, we can predict what the change in
democracy would be in these countries and for North America as a whole if instead the U.S.
became dramatically less democratic, falling to say, the level of democracy in Iran over this four-
year period, which was 3.
6 Presidential News Conference, April 7, 1954.
15
The equation for calculating the difference between Canada and Mexico’s current
changes in democracy and their changes in democracy under this scenario is simply: ∂∆Fi =
ρwi,j·∂∆Fj. For Canada, this means its change in democracy would fall by: (0.11 × 1) × (3 – 10) =
-0.77, making its new change in democracy: 0 – 0.77 = -0.77. For Mexico this operation is
slightly more difficult because unlike Canada, which has only the U.S. as a neighbor, Mexico has
three neighbors: the U.S., Guatemala, and Belize. The presence of these additional neighbors
softens the fall in Mexico’s democracy increase that would occur if American democracy fell to
the level in Iran because having more neighbors dilutes the democracy contagion effect coming
from any one neighbor. It’s easy to see this when we calculate the change in Mexico’s
democracy increase: (0.11 × (1/3)) × (3 – 10) = -0.257, which would make Mexico’s new change
in democracy: 4 – 0.257 = 3.74. If the U.S. had a decrease in democracy sufficient to make it as
undemocratic as Iran, the average change in North American democracy would therefore be: (-7
– 0.77 + 3.47)/3 ≈ -1.43, a drop of 2.76.
Given the rather dramatic difference between the extent of democracy in the U.S. and
Iran, this effect is small. So, while our estimates indicate that there is a statistically significant
democratic domino-type effect, its impact on overall regional democracy is quite modest. In
large part, this modest effect stems from the fact that most countries have multiple neighbors.
The more neighbors a country has, the more diluted is the positive or negative “wave” of
democratic change spreading to it from any one neighbor, muting the “heft” with which
democratic dominoes fall.
16
5 Sensitivity Analysis
In addition to estimating both SAR and SEM models for multiple panels covering different
years, we take several further steps to ensure the robustness of our core result, which finds
evidence for the domino theory but suggests that the domino effect is not large. First, to address
the issue of islands raised above, which do not have contiguous geographic neighbors, we rerun
all of our regressions for each of our three panels on a subsample that excludes islands.
We do not report these results separately, which are very similar to those we find when
we do not exclude islands from the sample. The spatial coefficient is highly significant and
suggests that democracy spreads at a rate of about 7-9 percent between geographic neighbors.
The one exception to this is the panel that considers the period from 1950 to 1990, which is
sensitive to the exclusion of islands. Without islands, the spatial coefficient in this panel rises to
about 0.25, depending upon the model and specification one looks at. Notably, however, even in
this panel, while the spatial coefficient is significant at the one percent level, it is still relatively
small, pointing again to the ‘correctness’ of the domino theory, but also to the relative weakness
of the domino effect.
Second, we rerun all of our regressions for both models in each of our panels both
looking at the levels of countries’ democracy instead of their changes in democracy. Although
the traditional rendering of the domino theory clearly suggests that it is changes in democracy
that spread between neighbors, considering levels is another way to evaluate the domino theory’s
basic claim. We present these results in Tables 4-6. They confirm our finding from above.
Democracy does in fact spread between neighbors, but the contagion effect is weak. In all of the
regressions in Tables 4-6 the spatial coefficient is positive and in all but one specification is
significant at the one percent level.
17
However, in the full specifications that control for continent status and lagged
democracy, this coefficient ranges from slightly greater than zero to 0.05, suggesting a
statistically significant but somewhat weaker domino effect than our benchmark regressions that
consider changes in democracy. In the 1900-2000 panel, countries “catch” between three and
five percent of their average neighbors’ level of democracy. In the1950-2000 panel, they catch
two percent of their average neighbors’ level of democracy. And in the 1990-2000 model,
nations catch between 0.3 and five percent of their average neighbors’ level of democracy. In the
levels regressions as well as the change regressions, the domino effect is present but small.
Finally, we try rerunning all of our regressions using a different method of weighting
countries in the spatial weight matrix, W. As discussed above, since the domino theory is based
on the spread of democracy through geographic neighbors, our main regressions use first-order
contiguity to determine the weight received by each country in W. However, not all of countries’
geographic neighbors may be equal. In particular, those with more inhabitants, may be may be
more influential than others on their changes in democracy. For instance, a more populous
country, such as the United States, might have more impact on Mexico’s changes in democracy
than one of Mexico’s other contiguous neighbors, such as Belize, which is considerably smaller
than the U.S.
To address this possibility we also try weighting contiguous neighbors in the spatial
weight matrix according to population size. We do this for all specifications and samples. As it
turns out, this does not matter for the geographic spread of democracy. We find nearly identical
estimates as when we use simple first-order contiguity for the spatial weight matrix and so do not
report the results with population weighting separately.
18
6 Spreading Democracy through Foreign Intervention
A natural question that arises in light of these results is whether it is possible to use the domino
effect to spread democracy to undemocratic countries in the world through foreign military
intervention. Can, for example, U.S. occupation abroad in strategic, less democratic countries
promote democracy in the region through the domino effect by enhancing “spreadable”
democracy in the countries it occupies? This question is especially interesting to consider given
the controversial foreign policy currently guiding America in the Middle East.
On the one hand, U.S. foreign policy past and present displays tremendous faith in the
ability of military occupation to spread democracy abroad. According to proponents of this
policy, military intervention is needed to exogenously provide democracy to countries that
cannot or will not democratize internally. The failure to internally democratize could be because
of a tyrannical government that refuses to do so, as was argued in the case of U.S. occupation in
Haiti and Iraq, because of civil conflict, as was argued in the case of U.S. occupation of the
Dominican Republic in the 1960s, or following international war for the purposes of
reconstruction, as was the case in Germany, Austria, and Japan for example, at the end of WWII.
On the other hand, recent research that examines the transportability of institutions across
countries suggests that institutions have difficulty ‘sticking’ where outsiders try to exogenously
impose them (see, for instance, Boettke, Coyne and Leeson 2007). According to this work, when
institutions that promote greater democracy emerge endogenously, they tend to take hold in the
nation they emerge in and, as our results above suggest, spread greater democracy to their
neighbors. On the other hand, where these institutions are exogenously imposed in foreign
countries, their rate of successful take-hold tends to be much lower.
19
Researchers have offered a number of explanations for this pattern. Easterly (2002,
2006), for example, argues that weak or perverse incentives of foreign aid recipients in the
developing world prevents them from genuinely committing to more democratic institutions.
North (1990, 2005) suggests that institutions cannot be exogenously imposed abroad with
success in most instances because of institutional path dependence rooted in both economic
factors and culturally-embedded mental attitudes that must undergo change before new
institutions can take root.
F.A. Hayek’s (1996) arguments related to local knowledge have also been used to explain
failures to exogenously impose liberal democratic institutions in inhospitable host countries.
According to this view, foreign institutional designers and implementers simply do not have the
knowledge of local circumstances required to effectively transplant new institutions in distant,
largely unknown societies. Along similar lines, Boettke, Coyne and Leeson (2007) argue that
institutional stickiness depends upon proposed new institutions’ relationship to previously-
existing, informal institutional arrangements. Where a new proposed institution is inconsistent
with these arrangements, it will not take hold. Existing informal institutional arrangements
severely constrain the degree to which new, exogenously-imposed institutions can deviate from
the institutions already in place in the host country. Substantial institutional reforms that would
improve liberal democracy must therefore emerge endogenously rather than exogenously.
For these reasons, exogenously-imposed democratic institutions may take hold only
weakly or not at all in the foreign countries they are transported to. If this is the case, any
attendant increase in democracy resulting from exogenous institutional imposition may spread
only very weakly, or not at all, to their neighbors.
20
Despite this, there are several notable examples of exogenous institutional imposition that
clearly were successful. The most obvious of these are Germany, Austria, and Japan, which the
U.S. occupied for some years immediately following WWII. In these countries, democratic
institutions were successfully transplanted, evidenced by their persistence to this day. The
strength of democratic take-hold in Germany, Austria, and Japan suggests that democracy-
enhancing occupation can be successful and at least in principle generate increases in democracy
strong enough to spread to other countries.
Christopher Coyne’s (2007) important work explains the divergent patterns of successful
democracy building in Germany, Austria, and Japan vs. more recent U.S. democracy-building
occupations in countries like the Dominican Republic and Somalia, which are widely considered
failures. According to Coyne (2007), what distinguishes these two sets of cases is the presence or
absence of internal solutions to a series of “nested games” that face internal and external agents
involved in the process of democratic building. Before U.S. officials occupied Germany, Austria,
and Japan, strong, indigenous institutions very much conducive to liberal democracy were
already largely in place. Because of this, occupiers were able to implement marginal political
changes based on these existing institutions that served to strengthen democracy, instead of
attempting to create democracy in these countries de novo. As a result, occupier-initiated
institutional changes ‘stuck’ in Germany, Austria, and Japan, enhancing their democracy.
In contrast, in countries like the Dominican Republic and Somalia, pre-existing
democratic institutions that helped to overcome obstacles reflected in democracy-building
“nested games” were largely absent. Here, U.S. occupiers were in the position of creating
democratic institutions where they had no strong foundation in precedent. The result was a
failure to promote democracy in these countries.
21
Of key interest for our analysis is empirically establishing the impact of U.S. military
occupation not only on democracy in occupied countries, but also in these countries’ surrounding
nations, which the domino theory tells us should experience part of the increase or decrease in
democracy created in the occupied country through U.S. intervention. Indeed, as discussed
previously, the domino effect has been used repeatedly by political leaders to emphasize the
larger benefit of intervention, which is supposed to include not only the increase democracy in
the occupied country, but also an increase in democracy in the greater region the occupied
country is situated in. As Taber points out, for example, during the Cold War, “United States
leaders used this line of reasoning as their major argument for intervention” (1992: 899; see also,
Danilovic 2001: 346).
This view presumes that exogenously-created increases in democracy spread at the same
or a greater rate than democracy spreads when it is endogenously created. However, the research
on ‘institutional stickiness’ discussed above points to several reasons that exogenously-created
democratic increases, assuming intervention can create even these, may spread at a far small rate
than this, or not all, neutering the ability of U.S. military occupation to use the domino effect to
increase democracy throughout a region.
To examine these issues we consider instances of U.S. military intervention abroad with
the stated goal of achieving greater democracy in the occupied country, and hopefully the greater
region it exists in.7 Lawson and Thacker (2003) identify cases of U.S. military occupation related
to this goal since 1900 when our panel begins. Data limitations allow us to consider three of
them: Austria, which the U.S. occupied in 1945 and exited in 1955, the Dominican Republic,
7 It should be pointed out that although increasing democracy was one of these interventions’ stated goals, it was not the only one. Increasing economic freedom, among others, was also typically a part of their ends.
22
which America occupied in 1965 and left in 1966, and Haiti, which America occupied in 1994
and left in 1996.
Since Austria’s period of occupation lies largely outside of the time period considered by
our 1950-2000 panel and completely outside the time period covered by our 1990-2000 panel,
for this intervention we need to use the 1900-2000 panel. For the Dominican Republic and Haiti,
however, both of which were occupied in the second half of the 20th century, we need to use the
1950-2000 panel. Thus, we consider the Dominican Republic and Haiti interventions in one
regression, and the Austria intervention in another.
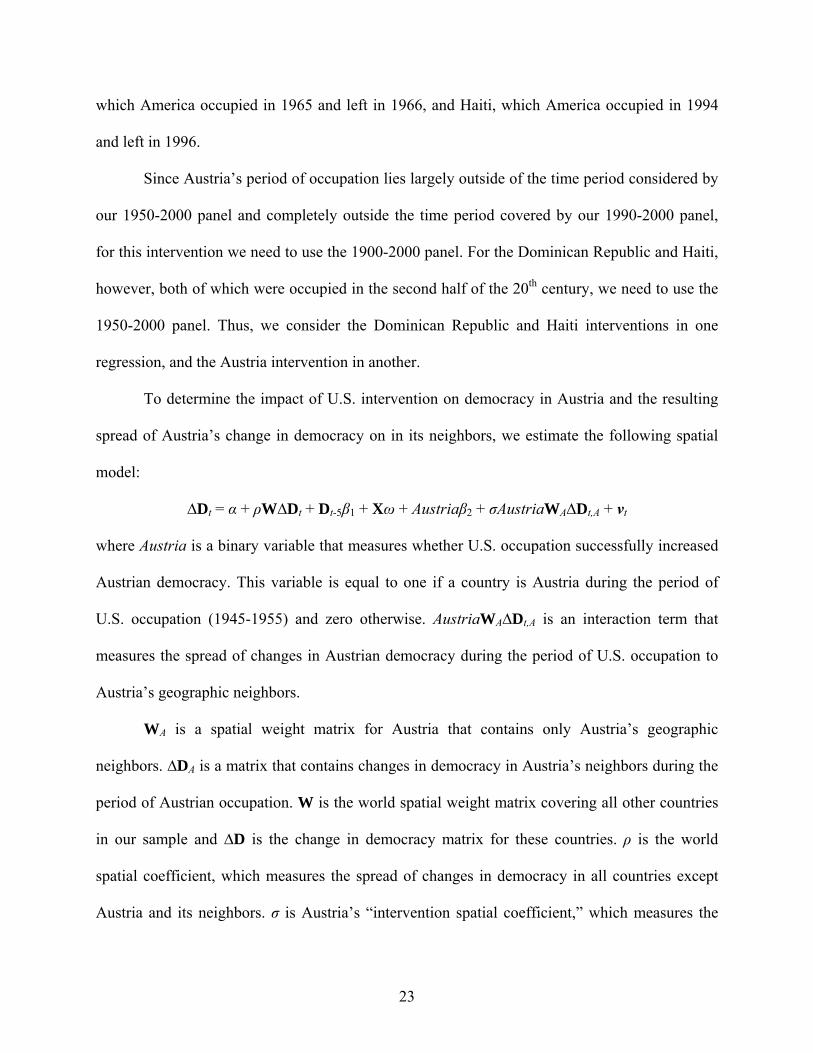
To determine the impact of U.S. intervention on democracy in Austria and the resulting
spread of Austria’s change in democracy on in its neighbors, we estimate the following spatial
where everything is the same as in the equation used to investigate U.S. occupation of Austria,
only here we need separate dummy variables, spatial weight matrices, and change in democracy
matrices for the Dominican Republic and Haiti.
Like in the case of Austria, when considering these two countries, we again confront a
constraint we wish we did not. Namely, both the Dominican Republic and Haiti each have only
one neighbor; incidentally, Haiti’s only neighbor is the Dominican Republic and vice versa. The
fact that these two countries happen to be neighbors poses no problem. Fortunately, each was
occupied in very different time periods, enabling us to avoid tricky specification issues.
However, ideally one or both of these countries would have additional neighbors so that we
could consider a more ‘elaborate’ domino effect (if one exists). Unfortunately, this is not the
case, so in looking at U.S. occupation’s ability to spread democracy from the Dominican
Republic and Haiti to their neighbors, we are looking at its ability to spread occupation-created
democracy increases to only one other nation. As it turns out, this limitation does not especially
matter since, as we discuss below, in at least the case of the Dominican Republic, American
occupation failed to enhance democracy even within the occupied country, rendering the spread
of a democratic increase moot.
26
Table 8 presents the results of our model that considers U.S. occupation in the Dominican
Republic and Haiti. Our findings here are more pessimistic about American military
intervention’s ability to spread democracy via the domino effect than our findings for Austria
from above. Occupation increased Haitian democracy but actually reduced democracy in the
Dominican Republic, though in the latter case not significantly. Consequently, it was not
possible for occupation to spread increased democracy from the Dominican Republic through the
domino effect. This is confirmed by considering the Dominican Republic’s intervention spatial
coefficient, which is negative and insignificant.
The case of Haiti is slightly different. Haiti’s dummy variable is positive and significant,
indicating that American occupation did, at least temporarily, increase Haitian democracy.
However, this increase did not spread to Haiti’s neighbor, the Dominican Republic. Haiti’s
intervention spatial coefficient is actually negative, and more importantly, highly insignificant.
This is not particularly surprising if one considers the ‘stickiness’ of the democratic increase
American occupation produced in Haiti. In 1993, the year before America occupied Haiti, its
democracy score was -7. In 1994, the first year of occupation, democracy increased to 7 where it
remained during the occupation and for a few years after. In 1999, however, when the U.S.
exited Haiti, Haitian democracy plunged to a 2, and after that, to a -2 where it is currently. In
short, Haiti’s democratic increase appears to have been supported entirely by U.S. occupation but
did not ‘stick,’ evidenced by its collapse following American withdrawal. This kind of fleeting
democratic spike is unlikely to spread for the reasons identified by the research discussed above;
the case of Haiti appears to confirm this.
Taken together, the results on American military occupation’s ability to increase
democracy in undemocratic countries and to spread these increases to neighboring countries via
27
the domino effect are quite mixed. Data limitations prevent us from investigating a larger
number of such interventions and thus from drawing more than tentative inferences. However,
even the few cases considered here supply sufficient evidence to indicate that there is no
“always” or “never” type of answer to the question of military occupation’s ability to spread
democracy abroad. Instead, our findings point to the validity of the arguments discussed above
that identify specific conditions under which U.S.-led “democracy building” abroad might be
successful. In particular, the idea of institutional stickiness, which is a function of countries’
previously-existing arrangements that are conducive to democratic building, seems to be
especially important.
7 Conclusion
The history of global foreign policy is strongly grounded in the idea that increases or decreases
in democracy spread between neighboring countries. The domino theory has explicitly or
implicitly guided foreign policy for some of the most important world events in the 20th and 21st
centuries. WWI, WWII, the Cold War, and most recently the War on Terror have all, to one
extent or another, been influenced by the belief that modes of political organization are
infectious like viruses.
This paper empirically investigated the domino theory using spatial econometrics to
estimate a panel covering more than 130 countries over the last century. Our results suggest that
a democratic domino effect like the one postulated by the domino theory does in fact exist.
However, they also find that this effect is more modest than the historical emphasis on domino-
type logic in global foreign affairs would suggest. Countries “catch” only about 11 percent of
their average geographic neighbors’ changes in democracy. The Cold War idea that capturing the
28
friendship or alliance of a few major nations would substantially alter the extent of democracy in
the rest of the region, for instance, does not appear to be correct.
This result is remarkably robust and remains after controlling for persistent institutional
and other features of countries, such as colonial origin, legal origin, ethnolinguistic
fractionalization, and continent membership. It is also true regardless of the spatial dependence
model used to estimate democracy’s spread, the time period our panel considers, whether we
look at the spread of democracy in levels or changes, and with and without islands in our sample.
Additionally, we explored whether U.S. military intervention is capable of spreading
democracy to less democratic nations abroad. Our results here are mixed. Although U.S.
intervention in Austria in the first half of the 20th century succeeded in increasing democracy in
Austria and spreading this increase to Austria’s neighbors via the domino effect, American
interventions in the Dominican Republic and Haiti in the second half of the 20th century failed to
spread democracy outside these countries’ border. Indeed, occupation in the Dominican Republic
did not even succeed in enhancing this country’s democracy, which was actually lower when the
occupiers left.
While it is important to be cautious in drawing policy implications from our analysis,
these results point to several conclusions. First, foreign policy should not pretend that democratic
increases in one country will lead to, in the words of President Bush, a “democratic revolution”
in the larger regions it is situated in. The domino effect is modest, and even in the presence of
only a few geographic neighbors, provided these neighbors are not also independently increasing
in their democracy, minimally affects changes in democracy in neighboring countries. In the
presence of many geographic neighbors, the vast majority of the spread of any increase (or
29
decrease) in democracy in one country to its neighbors is overwhelmed by the independent
democracy changes in these countries’ neighbors.
Second, there is not strong evidence in the second half of the 20th century for the
effectiveness of U.S. military occupation of foreign countries as a method of democratizing
nations or regions. Although data limitations only permitted us to consider two such
interventions, in both cases military occupation was largely a failure. On the other hand, if the
spread rate of democratic increases that military occupation creates are substantially stronger
than democracy’s spread rate when such changes are the result of endogenous forces, occupation
may in some cases be able to democratize regions. Our empirical analysis of foreign intervention
did not allow us to decisively determine whether or not this is the case. However, in light of the
relatively rarified conditions that appear to be needed for occupation-created increases in
democracy to spread in the first case, and what appears to be a very modest spread rate of
democratic changes under “normal” conditions, it does not seem especially likely that military
occupation is in general an effective way to increase global democracy.
30
References
Ackerman, Spencer (2006). “Hard of Hearing,” The New Republic Online, June 27, 2006. Boettke, Peter J., Christopher J. Coyne, and Peter T. Leeson (2007). “Institutional Stickiness and
the New Development Economics,” Constitutional Political Economy, forthcoming.
Coyne, Christopher (2007). After War: The Political Economy of Exporting Democracy. Stanford: Stanford University Press.
Danilovic, Vesna (2001). “The Sources of Credibility in Extended Deterrence,” Journal of Conflict Resolution, 45: 341-369.
Easterly, William (2002). The Elusive Quest for Growth. Cambridge: MIT Press. Easterly, William (2006). The White Man’s Burden. New York: Penguin Press. Hayek, Friedrich (1996). Individualism and Economic Order. Chicago: University of Chicago
Press.
Jervis, Robert (1991). “Domino Beliefs and Strategic Behavior,” in Robert Jervis and Jack Snyder, eds., Dominoes and Bandwagons: Strategic Beliefs and Great Power Competition in the Eurasian Rimland. Oxford: Oxford University Press, pp. 20-50.
Jervis, Robert and Jack Snyder, eds. (1991). Dominoes and Bandwagons: Strategic Beliefs and Great Power Competition in the Eurasian Rimland. Oxford: Oxford University Press.
Johnson, Robert H. (1985). “Exaggerating America’s Stakes in Third World Conflicts,” International Security, 10: 32-68.
Lawson, Chappell and Strom Thacker (2003). “Democracy? In Iraq?,” Hoover Digest, No. 3. Leeson, Peter T. and Russell S. Sobel (2007). “Contagious Capitalism,” mimeo. Murphy, Rhodes (1966). “China and the Dominoes,” Asian Survey, 6: 510-515. Ninkovich, Frank (1994). Modernity and Power: A History of the Domino Theory in the 20th
Century. Chicago: University of Chicago Press.
North, Douglass (1990). Institutions, Institutional Change and Economic Performance. Cambridge: Cambridge University Press.
North, Douglass (2005). Understanding the Process of Economic Change. Princeton: Princeton University Press.
Shimko, Keith L. (1994). “Metaphors and Foreign Policy Decision Making,” Political
31
Psychology, 15: 655-671.
Silverman, Jeremy Mark (1975). “The Domino Theory: Alternative to a Self-Fulfilling Prophecy,” Asian Survey, 15: 915-939.
Slater, Jerome (1987). “Dominos in Central America: Will they Fall? Does it Matter?,” International Security, 12: 105-134.
Taber, Charles S. (1992). “POLI: An Expert System Model of U.S. Foreign Policy Belief Systems,” American Political Science Review, 86: 888-904.
Viksnins, George J. (1975). “The Economic Consequences of Falling Dominoes,” Asian Survey, 15: 940-956.
Walt, Stephen M. (2000). “Fads, Fevers, and Firestorms,” Foreign Policy, No. 121: 34-42.
32
Figure 1. Evidence for the Domino Theory at a Glance
1900
1950
33
1990
34
35
Table 1. The Spread of Democracy, 1901-2001
Dependant Variable: Change in Democracy (t-statistics in parentheses) Spatial Weight Matrix: First-order Contiguity (***=1%, **=5%, *=10%)
Table 8. U.S. Occupation in the Dominican Republic and Haiti, 1951-2001
42
Appendix A. Sample Countries Country 1900 1950 1990
Albania X X Algeria X Angola X Argentina X X X Australia X* X* Austria X X X Bahrain X* Belgium X X Benin X Bhutan X X Bolivia X X X Brazil X X Bulgaria X* X X Burkina Faso X Burundi X Cambodia X Cameroon X Canada X X X Cen. Afr. Rep. X Chad X Chile X X X China X X Colombia X X X Comoros X* Congo, Dem. R. X Congo, Rep. of X Costa Rica X* X X Cuba X* X* Cyprus X* Czech Republic X X Denmark X* X Djibouti X Dom. Republic X X Ecuador X X X Egypt X X El Salvador X X X Eq. Guinea X Ethiopia X* X Fiji X* Finland X X France X X X Gabon X Gambia X Germany X Ghana X Greece X X Guatemala X X X Guinea X Guinea-Bissau X Guyana X Haiti X X Honduras X X Hungary X India X X
43
Indonesia X* X Iran X* X X Iraq X X Ireland X X Israel X X Italy X X X Ivory Coast X Jamaica X* Japan X* Jordon X X Kenya X Korea, North X X Korea, South X X Laos X Lesotho X Liberia X* X* X Libya X Madagascar X* Malawi X Malaysia X Mali X Mauritania X Mauritius X* Mexico X X X Mongolia X X Morocco X Mozambique X Myanmar X X Namibia X Nepal X* X X Netherlands X X New Zealand X* X* X* Nicaragua X X Niger X Nigeria X Norway X X Oman X* X X Pakistan X X Panama X X Papua N. Guinea X Paraguay X X X Philippines X* X* Poland X X Portugal X X X Qatar X Romania X X Russia X* X X Rwanda X Saudi Arabia X X Senegal X Sierra Leone X Singapore X* Somalia X South Africa X* X Spain X X X Sri Lanka X* X*
44
Sudan X Swaziland X Sweden X* X X Switzerland X X X Taiwan X* X* Tanzania X Thailand X X Togo X Trin. & Tob. X* Tunisia X Turkey X X U. Arab Emirates X Uganda X UK X* X X USA X X X Uruguay X X X Venezuela X X X Vietnam X Yemen X Yugoslavia X Zambia X Zimbabwe X * Indicates island status including ‘data island.’