UNITED STATES SECURITIES AND EXCHANGE COMMISSION Washington, D.C. 20549 FORM 10-K ANNUAL REPORT PURSUANT TO SECTION 13 OR 15(d) OF THE SECURITIES EXCHANGE ACT OF 1934 For the fiscal year ended DECEMBER 31, 2007 Commission file number: 1-3433 THE DOW CHEMICAL COMPANY (Exact name of registrant as specified in its charter) Delaware (State or other jurisdiction of incorporation or organization) 38-1285128 (I.R.S. Employer Identification No.) 2030 DOW CENTER, MIDLAND, MICHIGAN 48674 (Address of principal executive offices) (Zip Code) Registrant’s telephone number, including area code: 989-636-1000 Securities registered pursuant to Section 12(b) of the Act: Title of each class Common Stock, par value $2.50 per share Debentures, 6.85%, final maturity 2013 Name of each exchange on which registered Common Stock registered on the New York and Chicago Stock Exchanges Debentures registered on the New York Stock Exchange Indicate by check mark if the registrant is a well-known seasoned issuer, as defined in Rule 405 of the Securities Act. Yes No Indicate by check mark if the registrant is not required to file reports pursuant to Section 13 or Section 15(d) of the Act. Yes No Indicate by check mark whether the registrant (1) has filed all reports required to be filed by Section 13 or 15(d) of the Securities Exchange Act of 1934 during the preceding 12 months (or for such shorter period that the registrant was required to file such reports), and (2) has been subject to such filing requirements for the past 90 days. Yes No Indicate by check mark if disclosure of delinquent filers pursuant to Item 405 of Regulation S-K is not contained herein, and will not be contained, to the best of the registrant’s knowledge, in definitive proxy or information statements incorporated by reference in Part III of this Form 10-K or any amendment to this Form 10-K. Indicate by check mark whether the registrant is a large accelerated filer, an accelerated filer, a non-accelerated filer, or a smaller reporting company. See the definitions of “large accelerated filer,” “accelerated filer” and “smaller reporting company” in Rule 12b-2 of the Exchange Act. Large accelerated filer Accelerated filer Non-accelerated filer Smaller reporting company Indicate by check mark whether the registrant is a shell company (as defined in Rule 12b-2 of the Act). Yes No The aggregate market value of voting stock held by non-affiliates as of June 30, 2007 (based upon the closing price of $44.22 per common share as quoted on the New York Stock Exchange), was approximately $42.0 billion. For purposes of this computation, it is assumed that the shares of voting stock held by Directors, Officers and the Dow Employees’ Pension Plan Trust would be deemed to be stock held by affiliates. Non-affiliated common stock outstanding at June 30, 2007 was 949,152,650 shares. Total common stock outstanding at January 31, 2008 was 939,605,806 shares. DOCUMENTS INCORPORATED BY REFERENCE Part III: Proxy Statement for the Annual Meeting of Stockholders to be held on May 15, 2008.
Transcript
UNITED STATES SECURITIES AND EXCHANGE COMMISSION
Washington, D.C. 20549
FORM 10-K
ANNUAL REPORT PURSUANT TO SECTION 13 OR 15(d) OF THE SECURITIES EXCHANGE ACT OF 1934
For the fiscal year ended DECEMBER 31, 2007
Commission file number: 1-3433
THE DOW CHEMICAL COMPANY (Exact name of registrant as specified in its charter)
Delaware
(State or other jurisdiction of incorporation or organization)
38-1285128 (I.R.S. Employer Identification No.)
2030 DOW CENTER, MIDLAND, MICHIGAN 48674
(Address of principal executive offices) (Zip Code)
Registrant’s telephone number, including area code: 989-636-1000
Securities registered pursuant to Section 12(b) of the Act:
Title of each class Common Stock, par value $2.50 per share
Debentures, 6.85%, final maturity 2013
Name of each exchange on which registered Common Stock registered on the New York and Chicago Stock Exchanges
Debentures registered on the New York Stock Exchange Indicate by check mark if the registrant is a well-known seasoned issuer, as defined in Rule 405 of the Securities Act. Yes No
Indicate by check mark if the registrant is not required to file reports pursuant to Section 13 or Section 15(d) of the Act. Yes No
Indicate by check mark whether the registrant (1) has filed all reports required to be filed by Section 13 or 15(d) of the Securities Exchange Act of 1934 during the preceding 12 months (or for such shorter period that the registrant was required to file such reports), and (2) has been subject to such filing requirements for the past 90 days. Yes No
Indicate by check mark if disclosure of delinquent filers pursuant to Item 405 of Regulation S-K is not contained herein, and will not be contained, to the best of the registrant’s knowledge, in definitive proxy or information statements incorporated by reference in Part III of this Form 10-K or any amendment to this Form 10-K.
Indicate by check mark whether the registrant is a large accelerated filer, an accelerated filer, a non-accelerated filer, or a smaller reporting company. See the definitions of “large accelerated filer,” “accelerated filer” and “smaller reporting company”in Rule 12b-2 of the Exchange Act. Large accelerated filer Accelerated filer Non-accelerated filer Smaller reporting company
Indicate by check mark whether the registrant is a shell company (as defined in Rule 12b-2 of the Act). Yes No
The aggregate market value of voting stock held by non-affiliates as of June 30, 2007 (based upon the closing price of $44.22 per common share as quoted on the New York Stock Exchange), was approximately $42.0 billion. For purposes of this computation, it is assumed that the shares of voting stock held by Directors, Officers and the Dow Employees’ Pension Plan Trust would be deemed to be stock held by affiliates. Non-affiliated common stock outstanding at June 30, 2007 was 949,152,650 shares.
Total common stock outstanding at January 31, 2008 was 939,605,806 shares.
DOCUMENTS INCORPORATED BY REFERENCE Part III: Proxy Statement for the Annual Meeting of Stockholders to be held on May 15, 2008.
2
The Dow Chemical Company
ANNUAL REPORT ON FORM 10-K For the fiscal year ended December 31, 2007
TABLE OF CONTENTS
PAGE
PART I Item 1. Business. 3
Item 1A. Risk Factors. 11
Item 1B. Unresolved Staff Comments. 13
Item 2. Properties. 14
Item 3. Legal Proceedings. 15
Item 4. Submission of Matters to a Vote of Security Holders. 18
PART II
Item 5. Market for Registrant’s Common Equity, Related Stockholder Matters and Issuer Purchases of Equity Securities. 21
Item 6. Selected Financial Data. 22
Item 7. Management’s Discussion and Analysis of Financial Condition and Results of Operation. 24
Item 7A. Quantitative and Qualitative Disclosures About Market Risk. 54
Item 8. Financial Statements and Supplementary Data. 55
Item 9. Changes in and Disagreements With Accountants on Accounting and Financial Disclosure. 114
Item 9A. Controls and Procedures. 114
Item 9B. Other Information. 116
PART III
Item 10. Directors, Executive Officers and Corporate Governance. 117
Item 11. Executive Compensation. 117
Item 12. Security Ownership of Certain Beneficial Owners and Management and Related Stockholder Matters. 117
Item 13. Certain Relationships and Related Transactions, and Director Independence. 117
Item 14. Principal Accounting Fees and Services. 117
The Dow Chemical Company and Subsidiaries PART I, Item 1. Business.
3
THE COMPANY The Dow Chemical Company was incorporated in 1947 under Delaware law and is the successor to a Michigan corporation, of the same name, organized in 1897. Except as otherwise indicated by the context, the terms “Company” or “Dow” as used herein mean The Dow Chemical Company and its consolidated subsidiaries. On February 6, 2001, the merger of Union Carbide Corporation (“Union Carbide”) with a subsidiary of The Dow Chemical Company was completed, and Union Carbide became a wholly owned subsidiary of Dow.
The Company is engaged in the manufacture and sale of chemicals, plastic materials, agricultural and other specialized products and services.
The Company’s principal executive offices are located at 2030 Dow Center, Midland, Michigan 48674, telephone 989-636-1000. Its Internet website address is www.dow.com. All of the Company’s filings with the U.S. Securities and Exchange Commission are available free of charge through the Investor Relations page on this website, immediately upon filing. BUSINESS AND PRODUCTS Corporate Profile Dow is a diversified chemical company that combines the power of science and technology with the “Human Element” to constantly improve what is essential to human progress. The Company delivers a broad range of products and services to customers in approximately 160 countries, connecting chemistry and innovation with the principles of sustainability to help provide everything from fresh water, food and pharmaceuticals to paints, packaging and personal care products. In 2007, Dow had annual sales of $53.5 billion and employed approximately 45,900 people worldwide. The Company has 150 manufacturing sites in 35 countries and produces approximately 3,100 products. The following descriptions of the Company’s operating segments include a representative listing of products for each business.
PERFORMANCE PLASTICS Applications: automotive interiors, exteriors, under-the-hood and body engineered systems • building and construction, thermal and acoustic insulation, roofing • communications technology, telecommunication cables, electrical and electronic connectors • footwear • home and office furnishings: kitchen appliances, power tools, floor care products, mattresses, carpeting, flooring, furniture padding, office furniture • information technology equipment and consumer electronics • packaging, food and beverage containers, protective packaging • sports and recreation equipment • wire and cable insulation and jacketing materials for power utility and telecommunications
Dow Automotive serves the global automotive market and is a leading supplier of plastics, adhesives, sealants and other plastics-enhanced products for interior, exterior, under-the-hood, vehicle body structure and acoustical management technology solutions. With offices and application development centers around the world, Dow Automotive provides materials science expertise and comprehensive technical capabilities to its customers worldwide. • Products: AFFINITY™ polyolefin plastomers; AMPLIFY™ functional polymers; BETABRACE™ reinforcing
Dow Building Solutions manufactures and markets an extensive line of insulation, weather barrier, and oriented composite building solutions, as well as a line of cushion packaging foam solutions. The business is the recognized leader in extruded polystyrene (XPS) insulation, known industry-wide by its distinctive Blue color and the Dow STYROFOAM™ brand for more than 50 years. The business also manufactures foam solutions for a wide range of applications including cushion packaging, electronics protection and material handling.
The Dow Chemical Company and Subsidiaries PART I, Item 1. Business.
4
Business and Products – Continued • Products: EQUIFOAM™ comfort products; FROTH-PAK™ polyurethane spray foam; GREAT STUFF™
Dow Epoxy is a leading global producer of epoxy resins, intermediates and specialty resins for a wide range of industries and applications such as coatings, electrical laminates, civil engineering, adhesives and composites. With plants strategically located across four continents, the business is focused on providing customers around the world with differentiated solution-based epoxy products and innovative technologies and services. • Products: D.E.H.™ epoxy curing agents or hardeners; D.E.N.™ epoxy novolac resins; D.E.R.™ epoxy resins
(liquids, solids and solutions); Epoxy intermediates (Acetone, Allyl chloride, Bisphenol-A, Epichlorohydrin, OPTIM™ synthetic glycerine and Phenol); Specialty acrylic monomers (Glycidyl methacrylate, Hydroxyethyl acrylate and Hydroxypropyl acrylate); UCAR™ solution vinyl resins
The Polyurethanes and Polyurethane Systems business is a leading global producer of polyurethane raw materials and polyurethane systems. Differentiated by its ability to globally supply a high-quality, consistent and complete product range, this business emphasizes both existing and new business developments while facilitating customer success with a global market and technology network. • Products: ENFORCER™ Technology and ENHANCER™ Technology for polyurethane carpet and turf
Specialty Plastics and Elastomers is a business portfolio of specialty products including a broad range of engineering plastics and compounds, performance elastomers and plastomers, specialty copolymers, synthetic rubber, polyvinylidene chloride resins and films (PVDC), and specialty film substrates. The business serves such industries as automotive, civil construction, wire and cable, building and construction, consumer electronics and appliances, food and specialty packaging, and footwear. • Products: AFFINITY™ polyolefin plastomers (POPs); AMPLIFY™ functional polymers; CALIBRE™
The Technology Licensing and Catalyst business includes licensing and supply of related catalysts, process control software and services for the UNIPOL™ polypropylene process, the METEOR™ process for ethylene oxide (EO) and ethylene glycol (EG), the LP OXO™ process for oxo alcohols, the QBIS™ bisphenol A process, and Dow’s proprietary technology for production of purified terephthalic acid (PTA). Licensing of the UNIPOL™ polyethylene process and sale of related catalysts, including metallocene catalysts, are handled through Univation Technologies, LLC, a 50:50 joint venture of Union Carbide. • Products: LP OXO™ process technology and NORMAX™ catalysts; METEOR™ EO/EG process technology
and catalysts; PTA process technology; QBIS™ bisphenol A process technology and DOWEX™ QCAT™ catalyst; UNIPOL™ PP process technology and SHAC™ catalyst systems
The Performance Plastics segment also includes a portion of the results of the SCG-Dow Group, a group of Thailand-based joint ventures.
The Dow Chemical Company and Subsidiaries PART I, Item 1. Business.
5
PERFORMANCE CHEMICALS Applications: agricultural and pharmaceutical products and processing • building materials • chemical processing and intermediates • electronics • food processing and ingredients • gas treating solvents • household products • metal degreasing and dry cleaning • oil and gas treatment • paints, coatings, inks, adhesives, lubricants • personal care products • pulp and paper manufacturing, coated paper and paperboard • textiles and carpet • water purification
Designed Polymers is a business portfolio of products and systems characterized by unique chemistry, specialty functionalities, and people with deep expertise in regulated industries. Within Designed Polymers, Dow Water Solutions offers world-class brands and enabling component technologies designed to advance the science of desalination, water purification, trace contaminant removal and water recycling. Also in Designed Polymers, businesses such as Dow Wolff Cellulosics, Dow Biocides and ANGUS Chemical Company (a wholly owned subsidiary of Dow), develop and market a range of products that enhance or enable key physical and sensory properties of end-use products in applications such as food, pharmaceuticals, oil and gas, paints and coatings, personal care, and building and construction. • Products and Services: Acrolein derivatives; Basic nitroparaffins and nitroparaffin-based specialty chemicals;
The Dow Latex business is a major global supplier of latexes, for a wide range of industries and applications. It provides the broadest line of styrene/butadiene (S/B) products supporting customers in paper and paperboard (for magazines, catalogues and food packaging) applications, and the carpet and floor covering industry. UCAR Emulsion Systems (UES) manufactures and sells acrylic, vinyl acrylic, vinyl acetate ethylene (VAE), and S/B and styrene acrylic latexes and NEOCAR™ branched vinyl ester latexes for use in the architectural and industrial coatings, adhesives, construction products such as caulks and sealants, textile, and traffic paint. It also offers the broadest product range in the dispersion area and produces and markets UCAR™ POLYPHOBE™ rheology modifiers. • Products: Acrylic latex; EVOCAR™ specialty latex; FOUNDATIONS™ latex; NEOCAR™ branched vinyl
The Specialty Chemicals business provides products and services used as functional ingredients or processing aids in the manufacture of a diverse range of products. Applications include agricultural and pharmaceutical products and processing, building and construction, chemical processing and intermediates, electronics, food processing and ingredients, gas treating solvents, fuels and lubricants, oil and gas, household and institutional cleaners, coatings and paints, pulp and paper manufacturing, metal degreasing and dry cleaning, and transportation. Dow Haltermann Custom Processing provides contract and custom manufacturing services to other specialty chemical, agricultural chemical and biodiesel producers. • Products: Acrylic acid/Acrylic esters; AMBITROL™ and NORKOOL™ industrial coolants; Butyl
CARBITOL™ and Butyl CELLOSOLVE™ ethylene oxide; CARBOWAX™ and CARBOWAX™ SENTRY™ polyethylene glycols and methoxypolyethylene glycols; Diphenyloxide; DOW™ polypropylene glycols; DOWCAL™, DOWFROST™, DOWTHERM™, SYLTHERM and UCARTHERM™ heat transfer fluids; DOWFAX™, TERGITOL™ and TRITON™ surfactants; Ethanolamines; Ethyleneamines; Isopropanolamines; MAXIBOOST™ cleaning boosters; MAXICHECK™ solvent analysis test kits; MAXISTAB™ stabilizers; Propylene oxide-based glycol ethers; SAFE-TAINER™ closed-loop delivery system; SYNALOX™ lubricants; UCAR™ deicing fluids; UCARKLEAN™ amine management; UCARSOL™ formulated solvents; UCON™ fluids; VERSENE™ chelating agents; Fine and specialty chemicals from the Dow Haltermann Custom Processing business; Test and reference fuels, printing ink distillates, pure hydrocarbons and esters, and derivatives from Haltermann Products, a wholly owned subsidiary of Dow
The Performance Chemicals segment also includes the results of Dow Corning Corporation, and a portion of the results of the OPTIMAL Group of Companies and the SCG-Dow Group, all joint ventures of the Company.
The Dow Chemical Company and Subsidiaries PART I, Item 1. Business.
6
Business and Products – Continued
AGRICULTURAL SCIENCES Applications: control of weeds, insects and plant diseases for agriculture and pest management • agricultural seeds and traits (genes)
Dow AgroSciences is a global leader in providing pest management, agricultural and crop biotechnology products and solutions. The business develops, manufactures and markets products for crop production; weed, insect and plant disease management; and industrial and commercial pest management. Dow AgroSciences is building a leading plant genetics and biotechnology business in agricultural seeds, traits, healthy oils, and animal health. • Products: CLINCHER™ herbicide; DITHANE™ fungicide; FORTRESS™ fungicide; GARLON™ herbicide;
BASIC PLASTICS Applications: adhesives • appliances and appliance housings • agricultural films • automotive parts and trim • beverage bottles • bins, crates, pails and pallets • building and construction • coatings • consumer and durable goods • consumer electronics • disposable diaper liners • fibers and nonwovens • films, bags and packaging for food and consumer products • hoses and tubing • household and industrial bottles • housewares • hygiene and medical films • industrial and consumer films and foams • information technology • oil tanks and road equipment • plastic pipe • textiles • toys, playground equipment and recreational products • wire and cable compounds
The Polyethylene business is the world’s leading supplier of polyethylene-based solutions through sustainable product differentiation. Through the use of multiple catalyst and process technologies, the business offers customers one of the industry’s broadest ranges of polyethylene resins via a strong global network of local experts focused on partnering for long-term success. • Products: ASPUN™ fiber grade resins; ATTANE™ ultra low density polyethylene (ULDPE) resins;
CONTINUUM™ bimodal polyethylene resins; DOW™ high density polyethylene (HDPE) resins; DOW™ low density polyethylene (LDPE) resins; DOWLEX™ polyethylene resins; ELITE™ enhanced polyethylene (EPE) resins; TUFLIN™ linear low density polyethylene (LLDPE) resins; UNIVAL™ HDPE resins
The Polypropylene business, a major global polypropylene supplier, provides a broad range of products and solutions tailored to customer needs by leveraging Dow’s leading manufacturing and application technology, research and product development expertise, extensive market knowledge and strong customer relationships. • Products: DOW™ homopolymer polypropylene resins; DOW™ impact copolymer polypropylene resins;
DOW™ random copolymer polypropylene resins; INSPIRE™ performance polymers The Polystyrene business, the global leader in the production of polystyrene resins, is uniquely positioned with geographic breadth and participation in a diversified portfolio of applications. Through market and technical leadership and low cost capability, the business continues to improve product performance and meet customer needs. • Products: STYRON A-TECH™ and C-TECH™ advanced technology polystyrene resins and a full line of
STYRON™ general purpose polystyrene resins; STYRON™ high-impact polystyrene resins
The Basic Plastics segment also includes the results of Equipolymers and a portion of the results of EQUATE Petrochemical Company K.S.C. and the SCG-Dow Group, all joint ventures of the Company.
The Dow Chemical Company and Subsidiaries PART I, Item 1. Business.
7
BASIC CHEMICALS Applications: agricultural products • alumina • automotive antifreeze and coolant systems • carpet and textiles • chemical processing • dry cleaning • dust control • household cleaners and plastic products • inks • metal cleaning • packaging, food and beverage containers, protective packaging • paints, coatings and adhesives • personal care products • petroleum refining • pharmaceuticals • plastic pipe • pulp and paper manufacturing • snow and ice control • soaps and detergents • water treatment
The Core Chemicals business is a leading global producer of each of its basic chemical products, which are sold to many industries worldwide, and also serve as key raw materials in the production of a variety of Dow’s performance and plastics products. • Products: Acids; Alcohols; Aldehydes; Caustic soda; Chlorine; Chloroform; COMBOTHERM™ blended
The Ethylene Oxide/Ethylene Glycol business is a key supplier of ethylene glycol to MEGlobal, a 50:50 joint venture and a world leader in the manufacture and marketing of merchant monoethylene glycol and diethylene glycol. Dow also supplies ethylene oxide to internal derivatives businesses. Ethylene glycol is used in polyester fiber, polyethylene terephthalate (PET) for food and beverage container applications, polyester film and antifreeze. • Products: Ethylene glycol (EG); Ethylene oxide (EO)
The Basic Chemicals segment also includes the results of MEGlobal and a portion of the results of EQUATE Petrochemical Company K.S.C. and the OPTIMAL Group of Companies, all joint ventures of the Company.
HYDROCARBONS AND ENERGY Applications: polymer and chemical production • power
The Hydrocarbons and Energy business encompasses the procurement of fuels, natural gas liquids and crude oil-based raw materials, as well as the supply of monomers, power and steam principally for use in Dow’s global operations. The business regularly sells its byproducts; the business also buys and sells products in order to balance regional production capabilities and derivative requirements. The business also sells products to certain Dow joint ventures. Dow is the world leader in the production of olefins and aromatics. • Products: Benzene; Butadiene; Butylene; Cumene; Ethylene; Propylene; Styrene; Power, steam and other
utilities The Hydrocarbons and Energy segment also includes the results of Compañía Mega S.A. and a portion of the results of the SCG-Dow Group, both joint ventures of the Company.
Unallocated and Other includes the results of New Ventures (which includes new business incubation platforms focused on identifying and pursuing new commercial opportunities); Venture Capital; the Company’s insurance operations and environmental operations; and certain overhead and other cost recovery variances not allocated to the operating segments.
Industry Segments and Geographic Area Results See Note S to the Consolidated Financial Statements for disclosure of information by operating segment and geographic area.
The Dow Chemical Company and Subsidiaries PART I, Item 1. Business.
8
Business and Products – Continued Number of Products Dow manufactures and supplies approximately 3,100 products and services. No single product accounted for more than 5 percent of the Company’s consolidated net sales in 2007. Competition Historically, the chemical industry has operated in a competitive environment, and that environment is expected to continue. The Company experiences substantial competition in each of its operating segments and in each of the geographic areas in which it operates. In addition to other chemical companies, the chemical divisions of major international oil companies provide substantial competition in the United States and abroad. Dow competes worldwide on the basis of quality, price and customer service, and for 2007, continued to be the largest U.S. producer of chemicals and plastics, in terms of sales. Raw Materials The Company operates in an integrated manufacturing environment. Basic raw materials are processed through many stages to produce a number of products that are sold as finished goods at various points in those processes.
The two major raw material streams that feed the integrated production of the Company’s finished goods are chlorine-based and hydrocarbon-based raw materials.
Salt, limestone and natural brine are the base raw materials used in the production of chlor-alkali products and derivatives. The Company owns salt deposits in Louisiana, Michigan and Texas; Alberta, Canada; Brazil; and Germany. The Company also owns natural brine deposits in Michigan and limestone deposits in Texas.
The Company purchases hydrocarbon raw materials including liquefied petroleum gases, crude oil, naphtha, natural gas and condensate. These raw materials are used in the production of both saleable products and energy. The Company also purchases electric power, benzene, ethylene, propylene and styrene to supplement internal production. Expenditures for hydrocarbon feedstocks and energy accounted for 49 percent of the Company’s production costs and operating expenses for the year ended December 31, 2007. The Company purchases these raw materials on both short- and long-term contracts.
Other significant raw materials include acrylonitrile, aniline, bisphenol, co-monomers (for linear low density polyethylene), methanol, rubber, carbon black, ammonia, formaldehyde and toluene diamine. The Company purchases these raw materials on both short- and long-term contracts.
The Company had adequate supplies of raw materials during 2007, and expects to continue to have adequate supplies of raw materials in 2008. Method of Distribution All products and services are marketed primarily through the Company’s sales force, although in some instances more emphasis is placed on sales through distributors.
Twenty-one percent of the sales of the Basic Chemicals segment in 2007 were to one customer. The Company has a supply contract with this customer on an ongoing basis. In addition, sales to MEGlobal, a 50:50 joint venture with Petrochemical Industries Company of the State of Kuwait, represented approximately 16 percent of the sales in the Basic Chemicals segment. Excess ethylene glycol produced in Dow’s plants in the United States and Europe is sold to MEGlobal. Other than the sales to these customers, no significant portion of the business of any operating segment is dependent upon a single customer. Research and Development The Company is engaged in a continuous program of basic and applied research to develop new products and processes, to improve and refine existing products and processes, and to develop new applications for existing products. Research and development expenses were $1,305 million in 2007, $1,164 million in 2006 and $1,073 million in 2005. At December 31, 2007, the Company employed approximately 6,100 people in various research and development activities.
The Dow Chemical Company and Subsidiaries PART I, Item 1. Business.
9
Patents, Licenses and Trademarks The Company continually applies for and obtains U.S. and foreign patents. At December 31, 2007, the Company owned 2,424 active U.S. patents and 9,502 active foreign patents as follows:
Patents Owned at December 31, 2007 U.S. Foreign Performance Plastics 1,203 5,094 Performance Chemicals 362 1,329 Agricultural Sciences 537 1,715 Basic Plastics 149 817 Basic Chemicals 64 163 Hydrocarbons and Energy 30 229 Other 79 155 Total 2,424 9,502
Dow’s primary purpose in obtaining patents is to protect the results of its research for use in operations and licensing.
Dow is also party to a substantial number of patent licenses and other technology agreements. The Company had revenue related to patent and technology royalties totaling $247 million in 2007, $512 million in 2006 and $195 million in 2005. Revenue related to licensing was higher in 2006 due to lump sum licensing revenue that was earned in the first quarter of 2006. The Company incurred royalties to others of $57 million in 2007, $64 million in 2006 and $62 million in 2005. Dow also has a substantial number of trademarks and trademark registrations in the United States and in other countries, including the “Dow in Diamond” trademark. Although the Company considers that its patents, licenses and trademarks in the aggregate constitute a valuable asset, it does not regard its business as being materially dependent upon any single patent, license or trademark. Principal Partly Owned Companies Dow’s principal nonconsolidated affiliates at December 31, 2007, including direct or indirect ownership interest for each, are listed below:
• Compañía Mega S.A. – 28 percent – an Argentine company that owns a natural gas separation and fractionation plant, which provides feedstocks to the Company’s petrochemical plant located in Bahia Blanca, Argentina.
• Dow Corning Corporation – 50 percent – a U.S. company that manufactures silicone and silicone products. See Note J to the Consolidated Financial Statements.
• EQUATE Petrochemical Company K.S.C. – 42.5 percent – a Kuwait-based company that manufactures ethylene, polyethylene and ethylene glycol.
• Equipolymers – 50 percent – a company, headquartered in Horgen, Switzerland, that manufactures purified terephthalic acid, and manufactures and markets polyethylene terephthalate resins.
• MEGlobal – 50 percent – a company, headquartered in Dubai, United Arab Emirates, that manufactures and markets monoethylene glycol and diethylene glycol.
• The OPTIMAL Group of Companies [consisting of OPTIMAL Olefins (Malaysia) Sdn Bhd – 23.75 percent; OPTIMAL Glycols (Malaysia) Sdn Bhd – 50 percent; OPTIMAL Chemicals (Malaysia) Sdn Bhd – 50 percent] – Malaysian companies that operate an ethane/propane cracker, an ethylene glycol facility and a production facility for ethylene and propylene derivatives within a world-scale, integrated chemical complex located in Kerteh, Terengganu, Malaysia.
• The SCG-Dow Group – 49 percent [consisting of Pacific Plastics (Thailand) Limited; Siam Polyethylene Company Limited; Siam Polystyrene Company Limited; Siam Styrene Monomer Co., Ltd.; Siam Synthetic Latex Company Limited] – Thailand-based companies that manufacture polyurethanes, polyethylene, polystyrene, styrene and latex.
• Univation Technologies, LLC – 50 percent – a U.S. company that develops, markets and licenses polyethylene process technology and related catalysts.
See Note F to the Consolidated Financial Statements for additional information.
The Dow Chemical Company and Subsidiaries PART I, Item 1. Business.
10
Business and Products – Continued Financial Information About Foreign and Domestic Operations and Export Sales In 2007, the Company derived 66 percent of its sales and had 47 percent of its property investment outside the United States. While the Company’s international operations may be subject to a number of additional risks, such as changes in currency exchange rates, the Company does not regard its foreign operations, on the whole, as carrying any greater risk than its operations in the United States. Information on sales and long-lived assets by geographic area for each of the last three years appears in Note S to the Consolidated Financial Statements, and discussions of the Company’s risk management program for foreign exchange and interest rate risk management appear in Item 1A. Risk Factors, Item 7A. Quantitative and Qualitative Disclosures About Market Risk, and Note H to the Consolidated Financial Statements. Protection of the Environment Matters pertaining to the environment are discussed in Item 7. Management’s Discussion and Analysis of Financial Condition and Results of Operation, and Notes A and J to the Consolidated Financial Statements. Employees Personnel count was 45,856 at December 31, 2007; 42,578 at December 31, 2006; and 42,413 at December 31, 2005. During 2007, headcount was impacted by the addition of research and development employees in India and China in support of the Company’s growth initiatives; the addition of approximately 110 employees with the second quarter acquisition of Hyperlast Limited; and the addition of approximately 1,700 employees with the second quarter acquisition of Wolff Walsrode AG. During 2006, headcount was impacted by the addition of approximately 550 employees associated with the acquisition of Zhejiang Omex Environmental Engineering Co. LTD by FilmTec Corporation, a wholly owned subsidiary of the Company, and a reduction of approximately 260 employees due to the sale of the plastics division of Sentrachem Limited. Other Activities Dow engages in the property and casualty insurance and reinsurance business primarily through its Liana Limited subsidiaries.
The Dow Chemical Company and Subsidiaries PART I, Item 1A. Risk Factors.
11
The factors described below represent the Company’s principal risks. Except as otherwise indicated, these factors may or may not occur and the Company is not in a position to express a view on the likelihood of any such factor occurring. Other factors may exist that the Company does not consider to be significant based on information that is currently available or that the Company is not currently able to anticipate. Volatility in purchased feedstock and energy costs impact Dow’s operating costs and add variability to earnings. During 2007, purchased feedstock and energy costs continued to rise, adding an additional $2.5 billion of costs compared with 2006 and accounting for 49 percent of the Company’s total production costs and operating expenses in 2007, unchanged from 2006 and up from 47 percent in 2005. Purchased feedstock and energy costs are expected to remain high and volatile throughout 2008. The Company uses its feedstock flexibility and financial and physical hedging programs to lower overall feedstock costs. However, when these costs increase, the Company is not always able to immediately raise selling prices and, ultimately, its ability to pass on underlying cost increases is greatly dependent on market conditions. As a result, increases in these costs could negatively impact the Company’s results of operations. The earnings generated by the Company’s basic chemical and basic plastic products will vary from period to period based in part on the balance of supply relative to demand within the industry. The balance of supply relative to demand within the industry may be significantly impacted by the addition of new capacity. For basic commodities, capacity is generally added in large increments as world-scale facilities are built. This may disrupt industry balances and result in downward pressure on prices due to the increase in supply, which could negatively impact the Company’s results of operations. The businesses of many of Dow’s customers are cyclical in nature and sensitive to changes in general economic conditions. An economic downturn in the businesses or geographic areas in which Dow sells its products could reduce demand for these products and result in a decrease in sales volume that could have a negative impact on Dow’s results of operations. If key suppliers are unable to provide the raw materials required for production, Dow may not be able to obtain the raw materials from other sources on as favorable terms. The Company purchases hydrocarbon raw materials including liquefied petroleum gases, crude oil, naphtha, natural gas and condensate. The Company also purchases electric power, benzene, ethylene, propylene and styrene to supplement internal production, and other raw materials. If the Company’s key suppliers are unable to provide the raw materials required for production, it could have a negative impact on Dow’s results of operations. For example, during 2005, the Company experienced temporary supply disruptions related to two major hurricanes on the U.S. Gulf Coast. The Company experiences substantial competition in each of the operating segments and geographic areas in which it operates. Historically, the chemical industry has operated in a competitive environment, and that environment is expected to continue. In addition to other chemical companies, the chemical divisions of major international oil companies provide substantial competition. Dow competes worldwide on the basis of quality, price and customer service. Increased levels of competition could result in lower prices or lower sales volume, which would have a negative impact on the Company’s results of operations. Actual or alleged violations of environmental laws or permit requirements could result in restrictions or prohibitions on plant operations, substantial civil or criminal sanctions, as well as the assessment of strict liability and/or joint and several liability. The Company is subject to extensive federal, state, local and foreign laws, regulations, rules and ordinances relating to pollution, protection of the environment and the generation, storage, handling, transportation, treatment, disposal and remediation of hazardous substances and waste materials. At December 31, 2007, the Company had accrued obligations of $322 million for environmental remediation and restoration costs, including $28 million for the remediation of Superfund sites. This is management’s best estimate of the costs for remediation and restoration with respect to environmental matters for which the Company has accrued liabilities, although the ultimate cost with respect to these particular matters could range up to twice that amount. Costs and capital expenditures relating to environmental, health or safety matters are subject to evolving regulatory requirements and will depend on the timing of the promulgation and enforcement of specific standards which impose the requirements. Moreover, changes in environmental regulations could inhibit or interrupt the Company’s operations, or require modifications to its facilities. Accordingly, environmental, health or safety regulatory matters may result in significant unanticipated costs or liabilities.
The Dow Chemical Company and Subsidiaries PART I, Item 1A. Risk Factors.
12
Risk Factors – Continued The Company is party to a number of claims and lawsuits arising out of the normal course of business with respect to commercial matters, including product liability, governmental regulation and other actions. Certain of the claims and lawsuits facing the Company purport to be class actions and seek damages in very large amounts. All such claims are being contested. With the exception of the possible effect of the asbestos-related liability of Union Carbide Corporation (“Union Carbide”), described below, it is the opinion of the Company’s management that the possibility is remote that the aggregate of all such claims and lawsuits will have a material adverse impact on the Company’s consolidated financial statements.
Union Carbide is and has been involved in a large number of asbestos-related suits filed primarily in state courts during the past three decades. At December 31, 2007, Union Carbide’s asbestos-related liability for pending and future claims was $1.1 billion and its receivable for insurance recoveries related to its asbestos liability was $467 million. At December 31, 2007, Union Carbide also had receivables of $271 million for insurance recoveries for defense and resolution costs. It is the opinion of the Company’s management that it is reasonably possible that the cost of Union Carbide disposing of its asbestos-related claims, including future defense costs, could have a material adverse impact on the Company’s results of operations and cash flows for a particular period and on the consolidated financial position of the Company. Local, state and federal governments have begun a regulatory process that could lead to new regulations impacting the security of chemical plant locations and the transportation of hazardous chemicals. Growing public and political attention has been placed on protecting critical infrastructure, including the chemical industry, from security threats. Terrorist attacks and natural disasters have increased concern regarding the security of chemical production and distribution. In addition, local, state and federal governments have begun a regulatory process that could lead to new regulations impacting the security of chemical plant locations and the transportation of hazardous chemicals, which could result in higher operating costs and interruptions in normal business operations. Failure to develop new products could make the Company less competitive. The Company is engaged in a continuous program of basic and applied research to develop new products and processes, to improve and refine existing products and processes, and to develop new applications for existing products. Failure to develop new products could make the Company less competitive. Failure to protect the Company’s intellectual property could negatively affect its future performance and growth. The Company continually applies for and obtains U.S. and foreign patents to protect the results of its research for use in operations and licensing. Dow is also party to a substantial number of patent licenses and other technology agreements. The Company relies on patents, confidentiality agreements and internal security measures to protect its intellectual property. Failure to protect this intellectual property could negatively affect the Company’s future performance and growth. Weather-related matters could impact the Company’s results of operations. In 2005, two major hurricanes caused significant disruption in Dow’s operations on the U.S. Gulf Coast, logistics across the region and the supply of certain raw materials, which had an adverse impact on volume and cost for some of Dow’s products. If similar weather-related matters occur in the future, it could negatively affect Dow’s results of operations, due to the Company’s substantial presence on the U.S. Gulf Coast. The Company’s global business operations give rise to market risk exposure. The Company’s global business operations give rise to market risk exposure related to changes in foreign exchange rates, interest rates, commodity prices and other market factors such as equity prices. To manage such risks, Dow enters into hedging transactions, pursuant to established guidelines and policies. If Dow fails to effectively manage such risks, it could have a negative impact on the Company’s consolidated financial statements.
The Dow Chemical Company and Subsidiaries PART I, Item 1B. Unresolved Staff Comments.
13
UNRESOLVED STAFF COMMENTS None.
The Dow Chemical Company and Subsidiaries PART I, Item 2. Properties.
14
PROPERTIES The Company operates 150 manufacturing sites in 35 countries. Properties of Dow include facilities which, in the opinion of management, are suitable and adequate for the manufacture and distribution of Dow’s products. During 2007, the Company’s chemicals and plastics production facilities and plants operated at approximately 87 percent of capacity. The Company’s major production sites are as follows:
United States: Plaquemine, Louisiana; Hahnville, Louisiana; Midland, Michigan;
Freeport, Texas; Seadrift, Texas; Texas City, Texas; South Charleston, West Virginia.
Including the major production sites, the Company has plants and holdings in the following geographic areas:
United States: 42 manufacturing locations in 16 states. Canada: 6 manufacturing locations in 3 provinces. Europe: 49 manufacturing locations in 16 countries. Latin America: 26 manufacturing locations in 5 countries. Asia Pacific: 22 manufacturing locations in 8 countries. India, Middle East and Africa: 5 manufacturing locations in 4 countries.
All of Dow’s plants are owned or leased, subject to certain easements of other persons which, in the opinion of
management, do not substantially interfere with the continued use of such properties or materially affect their value. Dow leases ethylene plants in Fort Saskatchewan, Alberta, Canada, and Terneuzen, The Netherlands.
A summary of properties, classified by type, is provided in Note E to the Consolidated Financial Statements. Additional information regarding leased properties can be found in Note M to the Consolidated Financial Statements.
The Dow Chemical Company and Subsidiaries PART I, Item 3. Legal Proceedings.
15
LEGAL PROCEEDINGS Asbestos-Related Matters of Union Carbide Corporation Introduction Union Carbide Corporation (“Union Carbide”), a wholly owned subsidiary of the Company, is and has been involved in a large number of asbestos-related suits filed primarily in state courts during the past three decades. These suits principally allege personal injury resulting from exposure to asbestos-containing products and frequently seek both actual and punitive damages. The alleged claims primarily relate to products that Union Carbide sold in the past, alleged exposure to asbestos-containing products located on Union Carbide’s premises, and Union Carbide’s responsibility for asbestos suits filed against a former Union Carbide subsidiary, Amchem Products, Inc. (“Amchem”). In many cases, plaintiffs are unable to demonstrate that they have suffered any compensable loss as a result of such exposure, or that injuries incurred in fact resulted from exposure to Union Carbide’s products.
Influenced by the bankruptcy filings of numerous defendants in asbestos-related litigation and the prospects of various forms of state and national legislative reform, the rate at which plaintiffs filed asbestos-related suits against various companies, including Union Carbide and Amchem, increased in 2001, 2002 and the first half of 2003. Since then, the rate of filing has significantly abated. Union Carbide expects more asbestos-related suits to be filed against Union Carbide and Amchem in the future, and will aggressively defend or reasonably resolve, as appropriate, both pending and future claims.
The table below provides information regarding asbestos-related claims filed against Union Carbide and Amchem:
2007 2006 2005 Claims unresolved at January 1 111,887 146,325 203,416 Claims filed 10,157 16,386 34,394 Claims settled, dismissed or otherwise resolved (31,722) (50,824) (91,485) Claims unresolved at December 31 90,322 111,887 146,325 Claimants with claims against both UCC and
Amchem 28,937 38,529 48,647 Individual claimants at December 31 61,385 73,358 97,678
Plaintiffs’ lawyers often sue dozens or even hundreds of defendants in individual lawsuits on behalf of hundreds or even
thousands of claimants. As a result, the damages alleged are not expressly identified as to Union Carbide, Amchem or any other particular defendant, even when specific damages are alleged with respect to a specific disease or injury. In fact, there are no personal injury cases in which only Union Carbide and/or Amchem are the sole named defendants. For these reasons and based upon Union Carbide’s litigation and settlement experience, Union Carbide does not consider the damages alleged against Union Carbide and Amchem to be a meaningful factor in its determination of any potential asbestos liability. Estimating the Liability Based on a study completed by Analysis, Research & Planning Corporation (“ARPC”) in January 2003, Union Carbide increased its December 31, 2002 asbestos-related liability for pending and future claims for the 15-year period ending in 2017 to $2.2 billion, excluding future defense and processing costs. Since then, Union Carbide has compared current asbestos claim and resolution activity to the results of the most recent ARPC study at each balance sheet date to determine whether the accrual continues to be appropriate. In addition, Union Carbide has requested ARPC to review Union Carbide’s historical asbestos claim and resolution activity each November since 2004 to determine the appropriateness of updating the most recent ARPC study.
In November 2006, Union Carbide requested ARPC to review Union Carbide’s historical asbestos claim and resolution activity and determine the appropriateness of updating its most recent study from January 2005. In response to that request, ARPC reviewed and analyzed data through October 31, 2006 and concluded that the experience from 2004 through 2006 was sufficient for the purpose of forecasting future filings and values of asbestos claims filed against Union Carbide and Amchem, and could be used in place of previous assumptions to update the January study. The resulting study, completed by ARPC in December 2006, stated that the undiscounted cost of resolving pending and future asbestos-related claims against Union Carbide and Amchem, excluding future defense and processing costs, through 2021 was estimated to be between approximately $1.2 billion and $1.5 billion. As in its January 2003 and January 2005 studies, ARPC provided estimates for a longer period of time in its December 2006 study, but also reaffirmed its prior advice that forecasts for shorter periods of time are more accurate than those for longer periods of time.
The Dow Chemical Company and Subsidiaries PART I, Item 3. Legal Proceedings.
16
Legal Proceedings – Continued Based on ARPC’s December 2006 study and Union Carbide’s own review of the asbestos claim and resolution activity,
Union Carbide decreased its asbestos-related liability for pending and future claims to $1.2 billion at December 31, 2006 which covered the 15-year period ending in 2021 (excluding future defense and processing costs). The reduction was $177 million and was shown as “Asbestos-related credit” in the consolidated statements of income.
In November 2007, Union Carbide requested ARPC to review Union Carbide’s 2007 asbestos claim and resolution activity and determine the appropriateness of updating its December 2006 study. In response to that request, ARPC reviewed and analyzed data through October 31, 2007. In December 2007, ARPC stated that an update of its study would not provide a more likely estimate of future events than the estimate reflected in its study of the previous year and, therefore, the estimate in that study remained applicable. Based on Union Carbide’s own review of the asbestos claim and resolution activity and ARPC’s response, Union Carbide determined that no change to the accrual was required. At December 31, 2007, Union Carbide’s asbestos-related liability for pending and future claims was $1.1 billion.
At December 31, 2007, approximately 31 percent of the recorded liability related to pending claims and approximately 69 percent related to future claims. At December 31, 2006, approximately 25 percent of the recorded liability related to pending claims and approximately 75 percent related to future claims. Defense and Resolution Costs The following table provides information regarding defense and resolution costs related to asbestos-related claims filed against Union Carbide and Amchem:
The average resolution payment per asbestos claimant and the rate of new claim filings has fluctuated both up and down
since the beginning of 2001. Union Carbide’s management expects such fluctuations to continue in the future based upon a number of factors, including the number and type of claims settled in a particular period, the jurisdictions in which such claims arose, and the extent to which any proposed legislative reform related to asbestos litigation is being considered.
Union Carbide expenses defense costs as incurred. The pretax impact for defense and resolution costs, net of insurance, was $84 million in 2007, $45 million in 2006 and $75 million in 2005, and was reflected in “Cost of sales.” Insurance Receivables At December 31, 2002, Union Carbide increased the receivable for insurance recoveries related to its asbestos liability to $1.35 billion, substantially exhausting its asbestos product liability coverage. The insurance receivable related to the asbestos liability was determined by Union Carbide after a thorough review of applicable insurance policies and the 1985 Wellington Agreement, to which Union Carbide and many of its liability insurers are signatory parties, as well as other insurance settlements, with due consideration given to applicable deductibles, retentions and policy limits, and taking into account the solvency and historical payment experience of various insurance carriers. The Wellington Agreement and other agreements with insurers are designed to facilitate an orderly resolution and collection of Union Carbide’s insurance policies and to resolve issues that the insurance carriers may raise.
In September 2003, Union Carbide filed a comprehensive insurance coverage case, now proceeding in the Supreme Court of the State of New York, County of New York, seeking to confirm its rights to insurance for various asbestos claims and to facilitate an orderly and timely collection of insurance proceeds. This lawsuit was filed against insurers that are not signatories to the Wellington Agreement and/or do not otherwise have agreements in place with Union Carbide regarding their asbestos-related insurance coverage, in order to facilitate an orderly resolution and collection of such insurance policies and to resolve issues that the insurance carriers may raise. Although the lawsuit is continuing, through the end of 2007, Union Carbide has reached settlements with several of the carriers involved in this litigation.
Union Carbide’s receivable for insurance recoveries related to its asbestos liability was $467 million at December 31, 2007 and $495 million at December 31, 2006. At December 31, 2007 and December 31, 2006, all of the receivable for insurance recoveries was related to insurers that are not signatories to the Wellington Agreement and/or do not otherwise have agreements in place regarding their asbestos-related insurance coverage.
The Dow Chemical Company and Subsidiaries PART I, Item 3. Legal Proceedings.
17
In addition to the receivable for insurance recoveries related to its asbestos liability, Union Carbide had receivables for defense and resolution costs submitted to insurance carriers for reimbursement as follows:
Receivables for Costs Submitted to Insurance Carriers at December 31 In millions 2007 2006 Receivables for defense costs $ 18 $ 34 Receivables for resolution costs 253 266 Total $271 $300
After a review of its insurance policies, with due consideration given to applicable deductibles, retentions and policy
limits, after taking into account the solvency and historical payment experience of various insurance carriers; existing insurance settlements; and the advice of outside counsel with respect to the applicable insurance coverage law relating to the terms and conditions of its insurance policies, Union Carbide continues to believe that its recorded receivable for insurance recoveries from all insurance carriers is probable of collection. Summary The amounts recorded by Union Carbide for the asbestos-related liability and related insurance receivable described above were based upon current, known facts. However, future events, such as the number of new claims to be filed and/or received each year, the average cost of disposing of each such claim, coverage issues among insurers, and the continuing solvency of various insurance companies, as well as the numerous uncertainties surrounding asbestos litigation in the United States, could cause the actual costs and insurance recoveries for Union Carbide to be higher or lower than those projected or those recorded.
Because of the uncertainties described above, Union Carbide’s management cannot estimate the full range of the cost of resolving pending and future asbestos-related claims facing Union Carbide and Amchem. Union Carbide’s management believes that it is reasonably possible that the cost of disposing of Union Carbide’s asbestos-related claims, including future defense costs, could have a material adverse impact on Union Carbide’s results of operations and cash flows for a particular period and on the consolidated financial position of Union Carbide.
It is the opinion of Dow’s management that it is reasonably possible that the cost of Union Carbide disposing of its asbestos-related claims, including future defense costs, could have a material adverse impact on the Company’s results of operations and cash flows for a particular period and on the consolidated financial position of the Company. Environmental Matters The Company and the Texas Commission on Environmental Quality (the “TCEQ”) are in the process of combining 12 Notices of Enforcement (“NOEs”) issued by the TCEQ in relation to the Company’s Freeport, Texas, site into a single enforcement matter for resolution. Nine of the 12 initial penalty assessments associated with the NOEs were received by the Company in the second quarter of 2006. The 12 NOEs primarily relate to alleged fugitive air emissions, air emission events and environmental recordkeeping violations; and seek a combined civil penalty of $858,738. The TCEQ Staff and the Company have tentatively agreed to settle these and several additional, similar matters for a combined civil penalty of $648,904, half of which will be paid to the TCEQ, with the balance to be used to purchase low emission school buses for use near the Company’s Freeport, Texas site. This settlement remains subject to final approval by the TCEQ Commissioners.
On October 1, 2007, the Company received a separate NOE from the TCEQ related to alleged air emission events at the Company’s Freeport, Texas site. The NOE seeks a total civil penalty of $354,000. While the Company expects that the penalty will ultimately be reduced, resolution of the NOE may result in a civil penalty in excess of $100,000.
The Dow Chemical Company and Subsidiaries PART I, Item 4. Submission of Matters to a Vote of Security Holders.
18
SUBMISSION OF MATTERS TO A VOTE OF SECURITY HOLDERS No matter was submitted to a vote of security holders during the fourth quarter of 2007. EXECUTIVE OFFICERS OF THE REGISTRANT Set forth below is information related to the Company’s executive officers as of January 31, 2008. WILLIAM F. BANHOLZER, 51. DOW CORPORATE VICE PRESIDENT AND CHIEF TECHNOLOGY OFFICER. Employee of Dow since 2005. General Electric Company, Chemical Engineer 1983-1989. Laboratory Manager and Leader R&D Center 1989-1992. Engineering Manager of Superabrasives Business 1992-1997. Vice President of Global Engineering, GE Lighting 1997-1999. Vice President of Global Technology, GE Advanced Materials 1999-2005. Dow Corporate Vice President and Chief Technology Officer 2005 to date. Director of Dow Corning Corporation* and Mycogen Corporation*. Member of Dow Corning Corporation Corporate Responsibility Committee. Elected to the U.S. National Academy of Engineering in 2002. Elected NAE Councilor 2005. Member of American Chemical Society and American Institute of Chemical Engineers. Advisory Board member for chemistry and chemical engineering at University of Illinois and University of California, Berkeley. JULIE FASONE HOLDER, 55. DOW CORPORATE VICE PRESIDENT, CHIEF MARKETING & SALES AND REPUTATION OFFICER. Employee of Dow since 1975. Marketing Manager, Polyurethanes Business 1981-1984. District Sales Manager, Dow Latex 1984-1989. Group Marketing Manager for Formulation Products 1989-1994. Group Marketing Manager & Global Business Director, Performance Chemicals 1994-1997. Director of Sales and Marketing, Performance Chemicals 1997-2000. Business Vice President of Industrial Chemicals 2000-2004. Business Vice President, Specialty Plastics and Elastomers 2004-2005. Corporate Vice President, Human Resources, Diversity & Inclusion and Public Affairs 2005-2007. Dow Corporate Vice President, Chief Marketing & Sales and Reputation Officer January 2008 to date. Recipient of Dow Genesis Award in 1999 and The National Association for Female Executives Woman of Achievement Award in 2007. Director of Wolverine Bank and The Dow Chemical Company Foundation. GREGORY M. FREIWALD, 54. DOW CORPORATE VICE PRESIDENT, HUMAN RESOURCES, CORPORATE AFFAIRS AND AVIATION. Employee of Dow since 1979. Human Resources Manager, Chemical & Performance Business-U.S. Region 1992-1993. Human Resources Director for Executive, Finance, Law and Corporate 1993-1994. Latin America Human Resources and Quality Performance Director 1994-1996. Latin America Human Resources Leader and PBBPolisur Human Resources Integration Leader 1996-1997. Global Human Resources, Resources Center Director 1997-2001. Senior Human Resources Director for Global Human Resources, Resource Center and Human Resources Director for Geographic Council 2001-2004. Human Resources Vice President, Operations 2004-2005. Human Resources Vice President 2005-2006. Vice President, Corporate Affairs, Aviation and Executive Compensation 2006-2007. Corporate Vice President, Human Resources, Corporate Affairs and Aviation January 2008 to date. MICHAEL R. GAMBRELL, 54. DOW EXECUTIVE VICE PRESIDENT, BASIC PLASTICS AND CHEMICALS, AND MANUFACTURING AND ENGINEERING. Employee of Dow since 1976. Business Director for the North America Chlor-Alkali Assets Business 1989-1992. General Manager for the Plastic Lined Pipe Business 1992-1994. Vice President of Operations for Latin America 1994-1996. Corporate Director, Technology Centers and Global Process Engineering 1996-1998. Global Business Director of the Chlor-Alkali Assets Business 1998-2000. Business Vice President for EDC/VCM & ECU Management 2000-2003. Business Vice President for the Chlor-Vinyl Business 2003. Senior Vice President, Chemicals and Intermediates 2003-2005. Executive Vice President, Basic Plastics and Chemicals Portfolio 2005-2007. Executive Vice President, Basic Plastics and Chemicals, and Manufacturing and Engineering March 2007 to date. Board member of Oman Petrochemical Industries Company LLC*. Director of the National Association of Manufacturers. Board member and past chairman of World Chlorine Council. Member of U.S.-India Business Council. Recipient of the President’s Distinguished Alumnus Award from Rose-Hulman Institute of Technology 1996.
The Dow Chemical Company and Subsidiaries PART I, Item 4. Submission of Matters to a Vote of Security Holders.
19
HEINZ HALLER, 52. DOW EXECUTIVE VICE PRESIDENT, PERFORMANCE PLASTICS AND CHEMICALS. Employee of Dow 1980-1994 and since 2006. Dow sales representative, Emulsion Polymers, Specialty Chemicals and Chlorinated Solvents 1980-1994. Managing Director, Plüss-Staufer Ag 1994-1999. Chief Executive Officer, Red Bull Sauber AG and Sauber Petronas Engineering AG 2000-2002. Managing Director, Allianz Capital Partners GmbH 2002-2006. Dow Corporate Vice President, Strategic Development and New Ventures 2006-2007. Dow Executive Vice President May 2007 to date. Director of Mycogen Corporation* and Dow Corning Corporation*. Member of the Dow AgroSciences LLC* Members Committee. Director of the Michigan Molecular Institute. CHARLES J. KALIL, 56. DOW SENIOR VICE PRESIDENT, GENERAL COUNSEL AND CORPORATE SECRETARY. Employee of Dow since 1980. U.S. Department of Justice – Assistant U.S. Attorney, Eastern District of Michigan 1977-1980. General Counsel of Petrokemya (a former 50:50 joint venture of the Company) 1982-1983. Regional Counsel to Middle East/Africa 1983-1986. Senior Environmental Attorney 1986-1987. Litigation Staff Counsel and Group Leader 1987-1990. Senior Financial Law Counsel, Mergers and Acquisitions 1990-1992. General Counsel and Area Director of Government and Public Affairs for Dow Latin America 1992-1997. Special Counsel and Manager of INSITE™ legal issues 1997-2000. Assistant General Counsel for Corporate and Financial Law 2000-2003. Associate General Counsel for Corporate Legal Affairs 2003-2004. Dow Corporate Vice President and General Counsel November 2004-2007. Dow Senior Vice President and General Counsel March 2007 to date. Corporate Secretary 2005 to date. Board member of Dow Corning Corporation*, Dorinco Reinsurance Company*, Liana Limited* and Oman Petrochemical Industries Company LLC*. Member of the Conference Board’s Council of Chief Legal Officers. Member of the American Bar Association, District of Columbia Bar and the State Bar of Michigan. DAVID E. KEPLER, 55. DOW SENIOR VICE PRESIDENT, CHIEF SUSTAINABILITY OFFICER, CHIEF INFORMATION OFFICER AND CORPORATE DIRECTOR OF SHARED SERVICES. Employee of Dow since 1975. Computer Services Manager of Dow U.S.A. Eastern Division 1984-1988. Commercial Director of Dow Canada Performance Products 1989-1991. Director of Pacific Area Information Systems 1991-1993. Manager of Information Technology for Chemicals and Plastics 1993-1994. Director of Global Information Systems Services 1994-1995. Director of Global Information Application 1995-1998. Vice President 1998-2000. Chief Information Officer 1998 to date. Corporate Vice President with responsibility for eBusiness 2000 to date. Responsibility for Advanced Electronic Materials 2002-2003. Responsibility for Shared Services – Customer Service, Information Systems, Purchasing, Six Sigma, Supply Chain, and Work Process Improvement 2004 to date. Senior Vice President with responsibility for EH&S 2006 to date. Responsibility as Chief Sustainability Officer May 2007 to date. Director of Dorinco Reinsurance Company* and Liana Limited*. Director of Teradata Corporation. Member of U.S. Chamber of Commerce Board of Directors and Vice Chairman of the Great Lakes Region. Member of the American Chemical Society and the American Institute of Chemical Engineers. Chairman of the Chemical IT Council and Cyber Security Program. ANDREW N. LIVERIS, 53. DOW PRESIDENT, CHIEF EXECUTIVE OFFICER AND CHAIRMAN. DIRECTOR SINCE 2004. Employee of Dow since 1976. General manager of Dow's Thailand operations 1989-1992. Group business director for Emulsion Polymers and New Ventures 1992-1993. General manager of Dow's start-up businesses in Environmental Services 1993-1994. Vice President of Dow's start-up businesses in Environmental Services 1994-1995. President of Dow Chemical Pacific Limited* 1995-1998. Vice President of Specialty Chemicals 1998-2000. Business Group President for Performance Chemicals 2000-2003. President and Chief Operating Officer 2003-2004. President and Chief Executive Officer 2004 to date and Chairman 2006 to date. Director of Citigroup, Inc. and the United States Climate Action Partnership. Chairman Emeritus of the Board of the American Chemistry Council. Chairman of the Board of the International Council of Chemical Associations. Member of the American Australian Association, The Business Council, the Business Roundtable, the Detroit Economic Club, the New York Economic Club, the International Business Council, the National Petroleum Council, the Société de Chimie Industrielle, the U.S.-China Business Council and the World Business Council for Sustainable Development. Member of the Board of Trustees of Tufts University and the Herbert H. and Grace A. Dow Foundation.
The Dow Chemical Company and Subsidiaries PART I, Item 4. Submission of Matters to a Vote of Security Holders.
20
Executive Officers of the Registrant – Continued GEOFFERY E. MERSZEI, 56. DOW EXECUTIVE VICE PRESIDENT AND CHIEF FINANCIAL OFFICER. DIRECTOR SINCE 2005. Employee of Dow 1977-2001 and since 2005. Dow Middle East/Africa Credit Manager 1977-1980. Dow Asia Pacific Credit Manager 1980-1982. Dow Asia Pacific Finance and Credit Manager 1982-1983. Dow Germany and Eastern Europe Treasurer 1983-1986. Dow Foreign Exchange Manager 1986-1988. Director of Finance for Dow Asia Pacific 1988-1991. Director of Finance/Treasurer for Dow Europe 1991-1996. Dow Vice President and Treasurer 1996-2001. Alcan, Inc., Executive Vice President and Chief Financial Officer 2001-2005. Dow Executive Vice President and Chief Financial Officer 2005 to date. Board member of Dow Corning Corporation*, Dow Credit Corporation*, Dow Financial Services Inc.*, Mycogen Corporation*, and Oman Petrochemical Industries Company LLC*. Chairman of Dorinco Reinsurance Company*, Dow International Holdings, S.A.* and Liana Limited*. Board member of Chemical Financial Corporation. Chairman of the Conference Board’s Council of Financial Executives. Trustee and Executive Committee Member of the United States Council for International Business. FERNANDO RUIZ, 52. DOW CORPORATE VICE PRESIDENT AND TREASURER. Employee of Dow since 1980. Treasurer, Ecuador Region 1982-1984. Treasurer, Mexico Region 1984-1988. Financial Operations Manager, Corporate Treasury 1988-1991. Assistant Treasurer, USA Area 1991-1992. Senior Finance Manager, Corporate Treasury 1992-1996. Assistant Treasurer 1996-2001. Corporate Director of Insurance and Risk Management 2001. Corporate Vice President and Treasurer 2001 to date. President and Chief Executive Officer, Liana Limited* and Dorinco Reinsurance Company* 2001 to date. President of Dow Credit Corporation* 2001 to date. Director of Dow Financial Services Inc.* Member of Financial Executives International and Michigan State University (Eli Broad College of Business) Advisory Board. Member of DeVry, Inc. Board of Directors. WILLIAM H. WEIDEMAN, 53. DOW VICE PRESIDENT AND CONTROLLER. Employee of Dow since 1976. Controller of Texas Operations 1994-1996. Global Business Controller for Specialty Chemicals 1996-1998. Global Finance Director for Specialty Chemicals 1998-2000. Global Finance Director for Performance Chemicals 2000-2004. Finance Vice President, Chemicals and Intermediates and Dow Ventures 2004-2006. Group Finance Vice President for Basic Chemicals and Plastics Portfolio 2006. Vice President and Controller 2006 to date. Director of Diamond Capital Management, Inc.*, Dorinco Reinsurance Company* and Liana Limited*. Director of the Dow Chemical Employees’ Credit Union and Family and Children’s Services of Midland. Board and finance committee member of Mid Michigan Medical Center. Member of Financial Executives International Committee on Corporate Reporting, Member of Central Michigan University Accounting Advisory Committee and Central Michigan University Development Board. * A number of Company entities are referenced in the biographies and are defined as follows. Some of these entities have had various names over the years. The names and relationships to the Company, unless otherwise indicated, are stated in this footnote as they existed as of January 31, 2008. Dow Corning Corporation and Oman Petrochemical Industries Company LLC – companies ultimately 50 percent owned by Dow. Diamond Capital Management, Inc.; Dorinco Reinsurance Company; Dow AgroSciences LLC; Dow Chemical Pacific Limited; Dow Credit Corporation; Dow Financial Services Inc.; Dow International Holdings, S.A.; Liana Limited; and Mycogen Corporation – all ultimately wholly owned subsidiaries of Dow. Ownership by Dow described above may be either direct or indirect.
The Dow Chemical Company and Subsidiaries PART II, Item 5. Market for Registrant’s Common Equity,
Related Stockholder Matters and Issuer Purchases of Equity Securities.
21
MARKET FOR REGISTRANT’S COMMON EQUITY, RELATED STOCKHOLDER MATTERS AND ISSUER PURCHASES OF EQUITY SECURITIES The principal market for the Company’s common stock is the New York Stock Exchange.
Quarterly market and dividend information can be found in Quarterly Statistics at the end of Part II, Item 8. Financial Statements and Supplementary Data, following the Notes to the Consolidated Financial Statements.
At December 31, 2007, there were 98,699 registered common stockholders. The Company estimates that there were an additional 615,000 stockholders whose shares were held in nominee names at December 31, 2007. At January 31, 2008, there were 99,096 registered common stockholders.
On February 14, 2008, the Board of Directors announced a quarterly dividend of $0.42 per share, payable April 30, 2008, to stockholders of record on March 31, 2008. Since 1912, the Company has paid a cash dividend every quarter and, in each instance, Dow has maintained or increased the amount of the dividend, adjusted for stock splits. During that 95-year period, Dow has increased the amount of the quarterly dividend 47 times (approximately 12 percent of the time) and maintained the amount of the quarterly dividend approximately 88 percent of the time. The Company declared dividends of $1.635 per share in 2007, $1.50 per share in 2006 and $1.34 per share in 2005.
See Part III, Item 11. Executive Compensation for information relating to the Company’s equity compensation plans. The following table provides information regarding purchases of the Company’s common stock by the Company during
the three months ended December 31, 2007:
Issuer Purchases of Equity Securities
Period Total number of
shares purchased (1) Average price paid per share
Total number of shares purchased as part of the
Company’s publicly announced share
repurchase program (2)
Approximate dollar value of shares that may yet be
purchased under the Company’s publicly
announced share repurchase program (2)
October 2007 510,505 $44.86 449,500 $1,132,017,073 November 2007 4,295,600 $41.79 4,295,600 952,483,295 December 2007 2,425,752 $41.20 2,425,600 852,540,131 Fourth quarter 2007 7,231,857 $41.81 7,170,700 $ 852,540,131
(1) Includes 61,157 shares received from employees and non-employee directors to pay taxes owed to the Company as a result of the exercise of stock options or the delivery of deferred stock. For information regarding the Company’s stock option plans, see Note N to the Consolidated Financial Statements.
(2) On October 26, 2006, the Company announced that the Board of Directors had approved a new share buy-back program, authorizing up to $2 billion to be spent on the repurchase of the Company’s common stock. Purchases under this program began in March 2007, following the completion of the Company’s previous repurchase program.
In millions, except as noted (Unaudited) 2007 2006 2005Summary of Operations Net sales (1) 53,513$ 49,124$ 46,307$
Cost of sales (1) 46,400 41,526 38,276Research and development expenses 1,305 1,164 1,073Selling, general and administrative expenses 1,864 1,663 1,545Amortization of intangibles 72 50 55Purchased in-process research and development charges 57 - - Special charges, merger-related expenses, and restructuring 578 591 114Asbestos-related charge (credit) - (177) - Other income 1,446 1,096 1,719Interest expense - net 454 431 564Income (Loss) before income taxes and minority interests 4,229 4,972 6,399Provision (Credit) for income taxes 1,244 1,155 1,782Minority interests' share in income 98 93 82Preferred stock dividends - - - Income (Loss) before cumulative effect of changes in accounting principles 2,887 3,724 4,535 Cumulative effect of changes in accounting principles - - (20)Net income (loss) available for common stockholders 2,887$ 3,724$ 4,515$ Per share of common stock (in dollars): (2) Earnings (Loss) before cumulative effect of changes in accounting principles per common share - basic 3.03$ 3.87$ 4.71$ Earnings (Loss) per common share - basic 3.03 3.87 4.69 Earnings (Loss) before cumulative effect of changes in accounting principles per common share - diluted 2.99 3.82 4.64 Earnings (Loss) per common share - diluted 2.99 3.82 4.62 Cash dividends declared per share of common stock 1.635 1.50 1.34 Cash dividends paid per share of common stock 1.59 1.46 1.34 Book value per share of common stock 20.62 17.81 15.84Weighted-average common shares outstanding - basic (2) 953.1 962.3 963.2Weighted-average common shares outstanding - diluted (2) 965.6 974.4 976.8Convertible preferred shares outstanding - - -
Year-end Financial PositionTotal assets 48,801$ 45,581$ 45,934$ Working capital 6,209 6,608 6,741Property - gross 47,708 44,381 41,934Property - net 14,388 13,722 13,537Long-term debt and redeemable preferred stock 7,581 8,036 9,186Total debt 9,715 9,546 10,706Net stockholders' equity 19,389 17,065 15,324
Financial Ratios Research and development expenses as percent of net sales (1) 2.4% 2.4% 2.3%
Income (Loss) before income taxes and minority interests as percent of net sales (1) 7.9% 10.1% 13.8%Return on stockholders' equity (3) 14.9% 21.8% 29.5%Debt as a percent of total capitalization 31.8% 34.1% 39.1%
GeneralCapital expenditures 2,075$ 1,775$ 1,597$ Depreciation 1,959 1,904 1,904Salaries and wages paid 4,404 3,935 4,309Cost of employee benefits 1,130 1,125 988Number of employees at year-end (thousands) 45.9 42.6 42.4Number of Dow stockholders of record at year-end (thousands) (4) 98.7 103.1 105.6
(1) Adjusted for reclassification of freight on sales in 2000 and (2) Adjusted for 3-for-1 stock split in 2000. reclassification of insurance operations in 2002. (3) Included Temporary Equity in 1997-1999.
The Dow Chemical Company and SubsidiariesPART II, Item 6. Selected Financial Data
108.3 113.1 122.5 125.1 87.9 87.7 93.0 97.2(4) Stockholders of record as reported by the transfer agent. The Company estimates that there were an additional 615,000 stockholders whose shares were held in nominee names at December 31, 2007.
23
The Dow Chemical Company and Subsidiaries PART II, Item 7. Management’s Discussion and Analysis of Financial
Condition and Results of Operation.
24
Management’s Discussion and Analysis of Financial Condition and Results of Operation Page 2007 Overview 25 Results of Operation 26 Segment Results 31
Performance Plastics 31 Performance Chemicals 34 Agricultural Sciences 35 Basic Plastics 36 Basic Chemicals 37 Hydrocarbons and Energy 38 Sales Price and Volume Chart (Percent change from prior year) 40
Liquidity and Capital Resources 40 Cash Flow 40 Working Capital 41 Debt 42 Capital Expenditures 42 Contractual Obligations 43 Off-Balance Sheet Arrangements 44 Dividends 44
Critical Accounting Policies 45 Environmental Matters 48 Asbestos-Related Matters of Union Carbide Corporation 51
FORWARD-LOOKING INFORMATION The Private Securities Litigation Reform Act of 1995 provides a “safe harbor” for forward-looking statements made by or on behalf of The Dow Chemical Company and its subsidiaries (“Dow” or the “Company”). This section covers the current performance and outlook of the Company and each of its operating segments. The forward-looking statements contained in this section and in other parts of this document involve risks and uncertainties that may affect the Company’s operations, markets, products, services, prices and other factors as more fully discussed elsewhere and in filings with the U.S. Securities and Exchange Commission (“SEC”). These risks and uncertainties include, but are not limited to, economic, competitive, legal, governmental and technological factors. Accordingly, there is no assurance that the Company’s expectations will be realized. The Company assumes no obligation to provide revisions to any forward-looking statements should circumstances change, except as otherwise required by securities and other applicable laws. ABOUT DOW Dow is a diversified chemical company that combines the power of science and technology with the “Human Element” to constantly improve what is essential to human progress. The Company offers a broad range of products and services, connecting chemistry and innovation with the principles of sustainability to help provide everything from fresh water, food, and pharmaceuticals to paints, packaging and personal care products. Dow is the largest U.S. producer of chemicals and plastics, in terms of sales, with total sales of $53.5 billion in 2007. The Company conducts its worldwide operations through global businesses, which are reported in six operating segments: Performance Plastics, Performance Chemicals, Agricultural Sciences, Basic Plastics, Basic Chemicals, and Hydrocarbons and Energy.
In 2007, the Company sold its approximately 3,100 products and its services to customers in approximately 160 countries throughout the world. Thirty-eight percent of the Company’s sales were to customers in North America; 37 percent were in Europe; while the remaining 25 percent were to customers in Asia Pacific and Latin America. The Company employs approximately 45,900 people and has a broad, global reach with 150 manufacturing sites in 35 countries.
The Dow Chemical Company and Subsidiaries PART II, Item 7. Management’s Discussion and Analysis of Financial
Condition and Results of Operation.
25
2007 OVERVIEW The Company reported solid financial performance in 2007, including record sales and earnings per share that were among the Company’s highest. Dow’s results demonstrated the value of its balanced business and geographic portfolio with a solid 3 percent volume growth in the combined Performance businesses (Performance Plastics, Performance Chemicals and Agricultural Sciences) outpacing a more modest gain of 1 percent in the combined Basics businesses (Basic Plastics, Basic Chemicals, and Hydrocarbons and Energy). A healthy increase in demand in Europe, Asia Pacific and Latin America compensated for a 2 percent decline in volume in North America. Despite the fifth consecutive year of double-digit percentage increases in feedstock and energy costs, the Company’s focus on price and volume management, control of discretionary spending and capital expenditures, and active portfolio management delivered solid results.
With continued global economic growth, industry conditions remained sound with supply and demand roughly balanced for most of the Company’s products. Sales increased 9 percent from 2006 to $53.5 billion, establishing a new sales record for the Company. Continued volatility in feedstock and energy costs presented a challenge, impacting both costs and the ability of the Company to raise prices in a timely fashion. Despite these challenges, gains in price and volume helped to offset an increase of $2.5 billion in purchased feedstock and energy costs. The Company continued to exercise spending discipline, partially offsetting increased spending in targeted growth areas, such as the Performance businesses and emerging geographies, with decreases in other businesses or regions. The benefits of Dow’s strategic decision to invest for growth through joint ventures were again apparent in this year’s results, with Dow’s share of the earnings from nonconsolidated affiliates exceeding $1 billion for the first time in the Company’s history.
The Company balanced its investment in new facilities with decisions to shut down a number of less efficient assets around the world in its drive to improve the competitiveness of its global operations. Capital expenditures were held below $2.1 billion, slightly above the level of depreciation, without sacrificing the efficiency, safety and environmental performance of Dow’s manufacturing facilities. In addition, the Company’s performance against key environmental and safety metrics continued to improve in 2007.
With solid earnings and cash flow, the Company maintained its strong financial position in 2007, lowering its debt-to-capital ratio to 32 percent from 34 percent at the end of 2006 and 39 percent at the end of 2005. In April 2007, Dow’s Board of Directors increased the quarterly dividend by 12 percent, to an annual rate of $1.68 per share. Since January 2006, the Company has raised its dividend by 25 percent. In the first quarter of 2007, Dow completed the share repurchase program authorized in July 2005, and commenced purchases under a new $2 billion share buyback program announced in October 2006. For the year, the Company invested over $1.4 billion to repurchase 32 million shares, an increase of more than 75 percent over the 18 million shares repurchased in 2006.
During 2007, the Company continued to implement its strategy, which is designed to reduce earnings cyclicality and improve earnings growth by increasing investment in the Performance businesses, maintaining integration with the Basics businesses, and growing the Basics businesses through cost-advantaged joint ventures. Some of the actions taken during 2007 include:
• Dow started up its first-ever production facility in Russia, located in Kryukovo, outside Moscow. The plant produces STYROFOAM™ extruded polystyrene insulation boards for the Dow Building Solutions business.
• Dow introduced Propylene Glycol Renewable, a propylene glycol made from the glycerin that is generated during the manufacture of biodiesel, a diesel-fuel alternative produced from vegetable oil.
• Saudi Aramco and Dow signed a Memorandum of Understanding to move forward with their multibillion-dollar joint venture chemicals and plastics production complex near Ras Tanura, Saudi Arabia.
• Dow and Chevron Phillips Chemical Company LP announced plans for a 50:50 polystyrene and styrene monomer joint venture in the Americas.
• Beijing-based Shenhua Group and Dow agreed to a detailed feasibility study for a coal-to-chemicals joint venture in the Shaanxi Province, China.
• Dow completed the acquisition of Wolff Walsrode AG and certain related affiliates and assets (“Wolff Walsrode”) and formed Dow Wolff Cellulosics, a $1 billion specialty business focused on cellulosics and related chemistries and serving a broad spectrum of industry sectors.
• Dow AgroSciences and Monsanto signed a corn cross-licensing agreement, which breaks new ground in the commercialization of gene stacking technology.
• The Company signed a Memorandum of Understanding with Brazilian ethanol producer, Crystalsev, to form a joint venture to manufacture polyethylene from sugar cane.
The Dow Chemical Company and Subsidiaries PART II, Item 7. Management’s Discussion and Analysis of Financial
Condition and Results of Operation.
26
2007 Overview – Continued
• Dow AgroSciences acquired Agromen Tecnologia, substantially expanding its Brazilian corn seed business. This transaction followed two other related acquisitions in 2007 - The Netherlands-based Duo Maize and Austrian company Maize Technologies International - strengthening the Company’s global corn seed platform.
• Dow’s Polyurethanes Systems business acquired Danish company Edulan A/S, an independent polyurethane systems house specializing in rigid foam and elastomer technologies.
• Dow acquired three leading epoxy systems formulators: UPPC AG in Germany, and POLY-CARB Inc. and GNS Technologies in the United States.
• Dow and Petrochemical Industries Company (“PIC”) of the State of Kuwait, a wholly owned subsidiary of Kuwait Petroleum Corporation, announced plans to form a 50:50 joint venture petrochemical company with anticipated revenues of more than $11 billion and 5,000 employees worldwide.
• Dow announced plans to shut down a number of assets and make organizational changes within targeted support functions, in order to improve the competitiveness of its global operations. As a consequence, the Company recorded a charge of $590 million in the fourth quarter of 2007.
For 2008, there is some uncertainty in the economic outlook for the United States. With approximately two-thirds of
Dow’s sales outside the United States, the Company’s global footprint is expected to allow it to continue to capture growth in key regions of the world, such as Brazil, Eastern Europe/Russia, India and China. In addition, as the Company continues to implement its strategy, its focus will be on financial discipline and price/volume management which, coupled with the strong performance of the Company’s joint ventures, is expected to produce another solid year of earnings for Dow.
Dow’s results of operations and financial condition for the year ended December 31, 2007 are described in further detail in the following discussion and analysis. RESULTS OF OPERATION Dow reported record sales of $53.5 billion in 2007, up 9 percent from $49.1 billion in 2006 and up 16 percent from $46.3 billion in 2005. Compared with last year, prices rose 7 percent (with currency accounting for approximately 3 percent of the increase), with increases in all operating segments and in all geographic areas. In 2007, the most significant price increases were reported in Basic Plastics and Hydrocarbons and Energy, driven by continuing increases in feedstock and energy costs. In 2007, volume improved 2 percent from last year, with growth in all segments with the exception of a slight decline in Basic Chemicals. From a geographic standpoint, 2007 volume in the United States was down slightly, due in part to weakness in the housing and automotive industries, while Europe and the rest of the world reported significant volume growth. Growth was strong in Asia Pacific, up 8 percent from 2006, and Latin America, up 7 percent.
In 2006, sales rose 6 percent from 2005, as prices rose 5 percent, with increases in all operating segments except Agricultural Sciences, which was down 2 percent, and in all geographic areas. Volume increased 1 percent. Prices continued to be driven primarily by escalating feedstock and energy costs.
Sales in the United States accounted for 34 percent of total sales in 2007, compared with 37 percent in 2006 and 38 percent in 2005.
See the Sales Price and Volume table at the end of the section entitled “Segment Results” for details regarding the change in sales by operating segment and geographic area. In addition, sales and other information by operating segment and geographic area are provided in Note S to the Consolidated Financial Statements.
Selling Price Index2006=100
100
95
78
62
1072007
2006
2005
2004
2003
Sales Volume Index2006=100
100
99
101
95
1022007
2006
2005
2004
2003
The Dow Chemical Company and Subsidiaries PART II, Item 7. Management’s Discussion and Analysis of Financial
Condition and Results of Operation.
27
Gross margin for 2007 was $7.1 billion, compared with $7.6 billion in 2006 and $8.0 billion in 2005. Despite higher selling prices of nearly $3.3 billion, gross margin declined in 2007 compared with 2006, principally due to an increase of $2.5 billion in feedstock and energy costs, higher costs of other raw materials, the unfavorable impact of currency on costs, and increased freight costs. Gross margin for 2006 declined $433 million from 2005, principally due to an increase of $2.0 billion in feedstock and energy costs and increases of more than $400 million in the cost of other raw materials.
Dow’s global plant operating rate (for its chemicals and plastics businesses) was 87 percent of capacity in 2007, up from 85 percent of capacity in 2006 and 84 percent of capacity in 2005. Operating rates improved in 2007 for most of the Company’s businesses, reflecting a higher level of demand and the closure of some of the Company’s manufacturing facilities. In 2006, Dow’s operating rates improved for many of the Company’s Basics businesses. Overall, Dow’s operating rate for 2006 reflected the impact of planned maintenance turnarounds at several of Dow’s manufacturing facilities. Depreciation expense was $1,959 in 2007 and $1,904 million in 2006 and 2005.
Operating Rate(percent)
85%
84%
88%
82%
87%2007
2006
2005
2004
2003
Personnel count was 45,856 at December 31, 2007; 42,578 at December 31, 2006; and 42,413 at December 31, 2005. During 2007, headcount was impacted by the addition of research and development employees in India and China in support of the Company’s growth initiatives; the addition of approximately 110 employees with the second quarter acquisition of Hyperlast Limited; and the addition of approximately 1,700 employees with the second quarter acquisition of Wolff Walsrode. During 2006, headcount was impacted by the addition of approximately 550 employees associated with the acquisition of Zhejiang Omex Environmental Engineering Co. LTD by FilmTec Corporation, a wholly owned subsidiary of the Company, and a reduction of approximately 260 employees due to the sale of the plastics division of Sentrachem Limited.
Operating expenses (research and development, and selling, general and administrative expenses) totaled $3,169 million in 2007, up 12 percent from $2,827 million in 2006. Operating expenses were $2,618 million in 2005. Research and development (“R&D”) expenses were $1,305 million in 2007, compared with $1,164 million in 2006 and $1,073 million in 2005. Selling, general and administrative expenses were $1,864 million in 2007, compared with $1,663 million in 2006 and $1,545 million in 2005. Consistent with the Company’s strategy, approximately 75 percent of the increase in operating expenses in 2007 was related to spending for growth initiatives and product development in the Performance businesses, including expenses related to the 2007 acquisition of Wolff Walsrode and Hyperlast Limited, and for early stage research into new growth opportunities. The balance of the increase was related to the global expansion of the Company’s corporate branding campaign and other corporate expenses. Approximately 60 percent of the increase in operating expenses in 2006 was related to spending for growth initiatives in the Performance businesses, consistent with the Company’s strategy. The balance of the increase was principally due to the allocation of a portion of stock-based compensation expense to operating expenses in accordance with Statement of Financial Accounting Standards (“SFAS”) No. 123R. Prior to the adoption of SFAS No. 123R on January 1, 2006, all stock-based compensation expense was reflected in “Cost of sales.” (See Notes A and N to the Consolidated Financial Statements for additional information on this accounting standard.) Operating expenses were 5.9 percent of sales in 2007, 5.8 percent of sales in 2006 and 5.7 percent of sales in 2005.
Research and Development Expenses($ in millions and as a Percent of Net Sales)
2.4%
2.3%
2.5%
3.0%
$1,164
$1,073
$1,022
$981
2.4%$1,3052007
2006
2005
2004
2003
Selling, General and Administrative Expenses($ in millions and as a Percent of Net Sales)
3.4%
3.3%
3.6%
4.3%
$1,663
$1,545
$1,436
$1,392
3.5%$1,8642007
2006
2005
2004
2003
The Dow Chemical Company and Subsidiaries PART II, Item 7. Management’s Discussion and Analysis of Financial
Condition and Results of Operation.
28
Results of Operation – Continued The following table illustrates the relative size of the primary components of total production costs and operating
expenses of Dow. More information about each of these components can be found in other sections of Management’s Discussion and Analysis of Financial Condition and Results of Operation, Notes to the Consolidated Financial Statements, and Part II, Item 6. Selected Financial Data.
Production Costs and Operating Expenses Cost components as a percent of total 2007 2006 2005 Hydrocarbon feedstocks and energy 49% 49% 47% Salaries, wages and employee benefits 11 11 13 Maintenance 3 3 3 Depreciation 4 4 5 Restructuring charges 1 1 - Supplies, services and other raw materials 32 32 32 Total 100% 100% 100%
Amortization of intangibles was $72 million in 2007, $50 million in 2006 and $55 million in 2005. Amortization of
intangibles was up in 2007 due to acquisitions. During 2007, the Company performed impairment tests for goodwill in conjunction with its annual long-term financial planning process. As a result of this review, it was determined that no goodwill impairments existed. See Note G to the Consolidated Financial Statements for additional information regarding goodwill and other intangible assets.
On December 3, 2007, the Company’s Board of Directors approved a restructuring plan that includes the shutdown of a number of assets and organizational changes within targeted support functions to improve the efficiency and cost effectiveness of the Company’s global operations. As a result of these shutdowns and organizational changes, which are scheduled to be completed by the end of 2009, the Company recorded pretax restructuring charges totaling $590 million in 2007. The charges consisted of asset write-downs and write-offs of $422 million, costs associated with exit or disposal activities of $82 million and severance costs of $86 million. The impact of the charges is shown as “Restructuring charges” in the consolidated statements of income and was reflected in the Company’s segment results as follows: Performance Plastics $184 million, Performance Chemicals $85 million, Agricultural Sciences $77 million, Basic Plastics $88 million, Basic Chemicals $7 million, Hydrocarbons and Energy $44 million, and Unallocated and Other $105 million. When the restructuring plans have been fully implemented, the Company expects to realize ongoing annual savings of approximately $180 million. See Note B to the Consolidated Financial Statements for details on the restructuring charges.
On August 29, 2006, the Company’s Board of Directors approved a plan to shut down a number of assets around the world as the Company continued its drive to improve the competitiveness of its global operations. As a consequence of these shutdowns, which are scheduled to be completed in the first quarter of 2009, and other optimization activities, the Company recorded pretax restructuring charges totaling $591 million in 2006. The charges included asset write-downs and write-offs of $346 million, costs associated with exit or disposal activities of $172 million and severance costs of $73 million.. The charges are shown as “Restructuring charges” in the consolidated statements of income and are reflected in the Company’s segment results as follows: Performance Plastics $242 million, Performance Chemicals $12 million, Basic Plastics $16 million, Basic Chemicals $184 million, and Unallocated and Other $137 million. In 2007, the Company recorded a $12 million reduction of the 2006 restructuring charges, which included an $8 million reduction of the estimated severance costs and a $4 million reduction of the reserve for contract termination fees. These reductions impacted the Performance Plastics segment by $4 million and the Unallocated and Other segment by $8 million. When the restructuring plans have been fully implemented, the Company expects to realize ongoing annual savings of approximately $160 million. See Note B to the Consolidated Financial Statements for details on the restructuring charges.
In the fourth quarter of 2005, the Company recorded pretax charges totaling $114 million related to restructuring activities, as the Company continued to focus on financial discipline and made additional decisions regarding noncompetitive and underperforming assets, as well as decisions regarding the consolidation of manufacturing capabilities. The charges included costs of $67 million related to the closure of approximately 20 small plants around the world, losses of $12 million on asset sales, the write-off of an intangible asset of $10 million and employee-related expenses of $25 million (which was paid to 197 employees in the fourth quarter of 2005). The total of these charges is shown as “Restructuring charges” in the consolidated statements of income. The charges were recorded against the Company’s operating segments as follows: $28 million against Performance Plastics, $14 million against Performance Chemicals, $9 million against Agricultural Sciences, $12 million against Basic Plastics and $3 million against Basic Chemicals. Charges to Unallocated and Other amounted to $48 million. For additional information, see Note B to the Consolidated Financial Statements.
The Dow Chemical Company and Subsidiaries PART II, Item 7. Management’s Discussion and Analysis of Financial
Condition and Results of Operation.
29
During 2007, pretax charges totaling $57 million were recorded for purchased in-process research and development (“IPR&D”). See Note C to the Consolidated Financial Statements for information regarding these charges. Future costs required to bring the purchased IPR&D projects to technological feasibility are expected to be immaterial.
Following the December 2006 completion of a study to review Union Carbide’s asbestos claim and resolution activity, Union Carbide decreased its asbestos-related liability for pending and future claims (excluding future defense and processing costs) by $177 million. The reduction was shown as “Asbestos-related credit” in the 2006 consolidated statements of income and reflected in the results of Unallocated and Other. See Note J to the Consolidated Financial Statements for additional information regarding asbestos-related matters of Union Carbide.
Dow’s share of the earnings of nonconsolidated affiliates in 2007 was $1,122 million, compared with $959 million in 2006 and $964 million in 2005. Equity earnings in 2007 exceeded $1 billion for the first time in the Company’s history, reflecting increased earnings from EQUATE Petrochemical Company K.S.C. (“EQUATE”), MEGlobal and the OPTIMAL Group of Companies (“OPTIMAL”). Equity earnings in 2006 declined slightly from 2005 despite improved results from Dow Corning Corporation (“Dow Corning”), which was due in part to a favorable tax settlement reached in the second quarter of 2006; MEGlobal; Compañía Mega S.A.; and Univation Technologies, LLC. These improvements were offset by lower results from Equipolymers and Siam Polyethylene Company Limited (“Siam Polyethylene” which is part of the SCG-Dow Group), and the absence of equity earnings from UOP LLC (“UOP”) and DuPont Dow Elastomers L.L.C., both of which the Company exited in 2005. See Note F to the Consolidated Financial Statements for additional information on nonconsolidated affiliates.
Equity in Earnings of Nonconsolidated Affiliates(in millions)
$959
$964
$923
$322
$1,1222007
2006
2005
2004
2003
On December 13, 2007, the Company and PIC announced plans to form a 50:50 joint venture that will be a market-leading, global petrochemicals company. The joint venture, to be headquartered in the United States, will manufacture and market polyethylene, ethyleneamines, ethanolamines, polypropylene, and polycarbonate. To form the new joint venture, Dow will sell a 50 percent interest in the business assets included in the transaction to PIC. In turn, PIC and Dow will each contribute their assets into the joint venture. The resulting joint venture is expected to have revenues of more than $11 billion and employ more than 5,000 people worldwide. The transaction is subject to the completion of definitive agreements, customary conditions and regulatory approvals, and is anticipated to close in late 2008.
Sundry income - net includes a variety of income and expense items such as the gain or loss on foreign currency exchange, dividends from investments, and gains and losses on sales of investments and assets. Sundry income for 2007 was $324 million, up from $137 million in 2006 and down from $755 million in 2005. In 2007, the increase in net sundry income reflected the impact of favorable foreign exchange hedging results and gains on the sale of miscellaneous assets. In 2006, sundry income was reduced by the recognition of a loss contingency of $85 million (reflected in the Performance Plastics segment) related to a fine imposed by the European Commission (“EC”) associated with synthetic rubber industry matters (see Note J to the Consolidated Financial Statements for additional information). Sundry income for 2005 included a gain of $637 million on the sale of Union Carbide’s indirect 50 percent interest in UOP (reflected in the Performance Plastics segment) and a $70 million gain ($41 million reflected in the Basic Chemicals segment; $29 million reflected in the Basic Plastics segment) on the sale of a portion of Union Carbide’s interest in EQUATE in the first quarter of 2005. In November 2004, Union Carbide sold a 2.5 percent interest in EQUATE to National Bank of Kuwait for $104 million. In March 2005, these shares were sold to private Kuwaiti investors thereby completing the restricted transfer, which resulted in the first quarter gain and reduced Union Carbide’s ownership interest from 45 percent to 42.5 percent. Sundry income for 2005 was reduced by a cash donation of $100 million to The Dow Chemical Company Foundation for aid to education and community development and a loss of $31 million associated with the early extinguishment of $845 million of debt (both reflected in Unallocated and Other).
The Dow Chemical Company and Subsidiaries PART II, Item 7. Management’s Discussion and Analysis of Financial
Condition and Results of Operation.
30
Results of Operation – Continued Net interest expense (interest expense less capitalized interest and interest income) was $454 million in 2007, up slightly
from $431 million in 2006 and down significantly from $564 million in 2005. Interest income was $130 million in 2007, down from $185 million in 2006 principally due to lower levels of cash and cash equivalents. Interest income was $138 million in 2005. Interest expense (net of capitalized interest) and amortization of debt discount totaled $584 million in 2007, $616 million in 2006 and $702 million in 2005. Interest expense declined in 2007 due to a lower level of debt throughout the year versus 2006.
The provision for income taxes was $1,244 million in 2007, compared with $1,155 million in 2006 and $1,782 million in 2005. The Company’s effective tax rate fluctuates based on, among other factors, where income is earned and the level of income relative to tax credits available. For example, as the percentage of foreign sourced income increases, the Company’s effective tax rate declines. The Company’s tax rate is also influenced by equity earnings, since most of the earnings from the Company’s equity companies are taxed at the joint venture level. In 2007, the effective tax rate was 29.4 percent, compared with 23.2 percent in 2006 and 27.8 percent in 2005. The tax rate for 2007 was negatively impacted by a change in German tax law that was enacted in August and included a reduction in the German income tax rate. As a result of the change, the Company adjusted the value of its net deferred tax assets in Germany (using the lower tax rate) and recorded a charge of $362 million against the “Provision for income taxes” in the third quarter of 2007. The reduction in the German income tax rate, which was effective January 1, 2008, is expected to have a small incremental benefit to the Company’s effective tax rate in the future. Also in 2007, the Company changed the legal ownership structure of its investment in EQUATE, resulting in a favorable impact to the “Provision for income taxes” of $113 million in the fourth quarter of 2007. Excluding these items, the effective tax rate was 23.5 percent in 2007.
Based on tax strategies developed in Brazil during 2006, as well as projections of future earnings, it was determined that it was more likely than not that tax loss carryforwards would be utilized, resulting in a reversal of existing valuation allowances of $63 million. This impact, combined with strong financial results in jurisdictions with lower tax rates than the United States, enacted reductions in the tax rates in Canada and The Netherlands, and improved earnings from a number of the Company’s joint ventures, resulted in an effective tax rate for 2006 that was lower than the U.S. statutory rate. In the second quarter of 2005, the Company finalized its plan for the repatriation of foreign earnings subject to the requirements of the American Jobs Creation Act of 2004 (“AJCA”), resulting in a credit to the provision for income taxes of $113 million (see Notes A and R to the Consolidated Financial Statements). On January 23, 2006, the Company received an unfavorable tax ruling from the United States Court of Appeals for the Sixth Circuit reversing a prior decision by the United States District Court relative to corporate owned life insurance, resulting in a charge to the provision for income taxes of $137 million in the fourth quarter of 2005. Excluding these items, the effective tax rate was 24.5 percent in 2006 and 27.5 percent in 2005. The underlying factors affecting Dow’s overall effective tax rates are summarized in Note R to the Consolidated Financial Statements.
Minority interests’ share in income was $98 million in 2007, $93 million in 2006 and $82 million in 2005. Cumulative effect of change in accounting principle reflected an after-tax charge of $20 million in 2005 related to the
adoption of FASB Interpretation (“FIN”) No. 47, “Accounting for Conditional Asset Retirement Obligations,” on December 31, 2005. See Note A to the Consolidated Financial Statements for additional information regarding this change in accounting principle.
Net income available for common stockholders was $2,887 million in 2007 ($2.99 per share) compared with $3,724 million in 2006 ($3.82 per share) and $4,515 million in 2005 ($4.62 per share).
$3,724
$1,730
$4,515
$2,797
$2,8872007
2006
2005
2004
2003
Net Income Available for Common Stockholders(in millions)
The Dow Chemical Company and Subsidiaries PART II, Item 7. Management’s Discussion and Analysis of Financial
Condition and Results of Operation.
31
The following table summarizes the impact of certain items recorded in 2007, 2006 and 2005:
Pretax Impact (1)
Impact on Net Income (2)
Impact on EPS (3)
In millions, except per share amounts 2007 2006 2005 2007 2006 2005 2007 2006 2005 Restructuring charges $(578) $(591) $(114) $(436) $(445) $ (77) $(0.46) $(0.46) $(0.08)Purchased in-process research and
Loss contingency related to EC fine - (85) - - (84) - - (0.09) - Gain on sale of EQUATE shares - - 70 - - 46 - - 0.05 Gain on sale of interest in UOP - - 637 - - 402 - - 0.41 Loss on early extinguishment of debt - - (31) - - (20) - - (0.02)Cash donation for aid to education and
community development - - (100) - - (65) - - (0.07)Provision for income taxes:
structure - - - 113 - - 0.12 - - Cumulative effect of change in accounting
principle - - - - - (20) - - (0.02)Total $(635) $(499) $ 462 $(735) $(417) $ 242 $(0.77) $(0.43) $ 0.25 (1) Impact on “Income before Income Taxes and Minority Interests” (2) Impact on “Net Income Available for Common Stockholders” (3) Impact on “Earnings per common share - diluted”
SEGMENT RESULTS The Company uses EBIT (which Dow defines as earnings before interest, income taxes and minority interests) as its measure of profit/loss for segment reporting purposes. EBIT includes all operating items relating to the businesses and excludes items that principally apply to the Company as a whole. Additional information regarding the Company’s operating segments and a reconciliation of EBIT to “Net Income Available for Common Stockholders” can be found in Note S to the Consolidated Financial Statements. PERFORMANCE PLASTICS Performance Plastics sales were $15,116 million in 2007, up from $13,944 million in 2006 and $12,405 million in 2005. Compared with 2006, sales increased 8 percent, as prices, including the favorable impact of currency (which accounted for about half of the increase in prices), rose 6 percent and volume improved 2 percent. Prices improved in all geographic areas with particular strength in Europe and Latin America as improved industry supply/demand fundamentals in certain businesses and increasing raw material costs drove prices higher. The overall improvement in volume was limited by weakness in North America and the impact of significant lump sum technology licensing revenue that was realized in the first quarter of 2006 and did not recur in 2007. Outside North America, volume increased 8 percent, with solid gains across most businesses in Europe, Latin America and Asia Pacific. In 2006, volume improved 7 percent and prices increased 5 percent over 2005. Volume in 2006 benefited from the full-year impact of the addition of ENGAGE™, NORDEL™ and TYRIN™ elastomers, acquired by the Company when it divested its interest in DuPont Dow Elastomers L.L.C. (“DDE”) in 2005 (see Note F to the Consolidated Financial Statements) and from significant lump sum licensing revenue earned in the first quarter of 2006.
Performance Plastics - Sales(in millions)
$13,944
$12,405
$10,449
$8,694
$15,1162007
2006
2005
2004
2003
Performance Plastics - EBIT(in millions)
$1,629
$2,507
$1,075
$719
$1,3902007
2006
2005
2004
2003
The Dow Chemical Company and Subsidiaries PART II, Item 7. Management’s Discussion and Analysis of Financial
Condition and Results of Operation.
32
Segment Results – Continued
EBIT for 2007 was $1,390 million, compared with $1,629 million in 2006 and $2,507 million in 2005. Results for 2007 were negatively impacted by net restructuring charges of $180 million, which included $184 million related to the fourth quarter announced closure or impairment of a number of manufacturing facilities, offset by a $4 million reduction of the 2006 restructuring reserve for contract termination fees (see Note B to the Consolidated Financial Statements). The restructuring charges included the write-down of manufacturing assets, the write-off of obsolete capital spending and the accrual of contract termination fees associated with plant shutdown decisions. The most significant charges included impairment charges related to a rubber plant in Berre, France, and associated contract cancellation fees totaling $61 million; the write-down of the automotive sealants business in North America, Latin America and Asia Pacific which totaled $58 million; and the $29 million write-down of assets related to a fiber solution manufacturing plant in Tarragona, Spain. Results for 2006 were reduced by the recognition of a loss contingency of $85 million related to a fine imposed by the EC associated with synthetic rubber industry matters (see Note J to the Consolidated Financial Statements) and $242 million in asset restructuring costs as part of the plan announced by the Company in the third quarter of 2006, which included the permanent shutdown of the Company’s toluene diisocyanate (“TDI”) plant in Porto Marghera, Italy. Excluding the impact of these items, EBIT declined in 2007 primarily due to the lump sum technology licensing revenue that was earned in 2006 and that did not recur in 2007, and an increase in operating expenses related to the Company’s efforts to expand geographic markets and develop new technologies and product applications within the Performance Plastics segment. EBIT for 2005 included a gain of $637 million related to the sale of Union Carbide’s indirect 50 percent interest in UOP to a wholly owned subsidiary of Honeywell International, Inc. and charges totaling $28 million associated with the closure of six small manufacturing sites as part of the restructuring activities completed in the fourth quarter of 2005. Excluding the impact of these items, EBIT in 2006 improved over 2005 as higher selling prices and improved volumes more than offset the impact of increased raw material costs and lower equity earnings.
Dow Automotive sales for 2007 were up 11 percent from 2006 driven by a 7 percent increase in volume and a 4 percent increase in price, principally due to the favorable impact of currency. The business benefited from its broad geographic reach in 2007 as strong volume gains in Asia Pacific, Latin America and Europe more than compensated for weakness in the North American automotive industry. The ability to raise prices was limited by the weakness in North America and customer efforts to establish dual sourcing positions. EBIT for 2007 was reduced by $64 million of restructuring charges primarily associated with the Company’s decision in the fourth quarter of 2007 to exit the automotive sealants business in North America, Latin America and Asia Pacific. Excluding these charges, EBIT for the business declined in 2007 due to higher raw material costs, increased spending on product development and business growth initiatives, and higher costs associated with the consolidation of manufacturing operations in North America and Europe. When completed in 2009, this consolidation is expected to result in lower costs for the business.
Dow Building Solutions sales in 2007 established a new record for the business, up 6 percent from the previous sales record set in 2006, despite a 15-year low in new housing starts in North America. The improvement was driven by higher prices of 7 percent, including the favorable impact of currency, which more than offset a 1 percent decline in volume. Price improvement was widespread with increases noted in all geographic areas. The decline in volume, which was driven by weakness in U.S. residential construction, was mitigated in large part by solid demand in Europe and efforts by the business to shift focus in the United States to commercial construction. EBIT in 2007 was negatively impacted by restructuring charges of $21 million related to the closure of five small manufacturing plants. Excluding the impact of the restructuring charges, EBIT in 2007 was down from 2006 as higher raw material costs and increased spending on market expansion activities in emerging geographies and development work on new products and technology exceeded the benefit of higher selling prices.
Dow Epoxy sales in 2007 increased 7 percent compared with last year, reflecting a 10 percent increase in price and a 3 percent decline in volume. Prices improved in all geographic areas and across most businesses. Volume declined due to lower sales of intermediate products and the Company’s 2006 exit of the peroxymeric chemicals business, more than offsetting volume gains in the rest of the world. Results for 2007 included a restructuring charge of $2 million related to the Company’s fourth quarter of 2007 decision to exit the hydroxyalkyl acrylate business. Results for 2006 included a restructuring charge of $9 million related to the Company’s third quarter of 2006 decision to exit the peroxymeric chemicals business in North America, Europe and Asia Pacific. EBIT in 2007 declined versus 2006 as the favorable impact of higher selling prices was more than offset by lost margin on lower sales volume, higher operating expenses and margin compression from higher raw material costs.
Polyurethanes and Polyurethane Systems sales for 2007 increased 11 percent versus the prior year with price, including the favorable impact of currency, up 6 percent and volume up 5 percent. The increase in price was driven by tight industry supply/demand fundamentals for TDI. Volume improved significantly in 2007 for Polyurethane Systems due to the formation
The Dow Chemical Company and Subsidiaries PART II, Item 7. Management’s Discussion and Analysis of Financial
Condition and Results of Operation.
33
of the majority owned Dow Izolan joint venture in Russia and the acquisitions of Hyperlast Limited and Edulan A/S. EBIT for 2006 included significant restructuring charges associated with the Company’s decision to shut down the TDI facility in Porto Marghera, Italy. Excluding this impact, EBIT in 2007 increased from 2006 as higher selling prices and increased margin on volume gains more than offset the impact of higher raw material costs and operating expenses.
Specialty Plastics and Elastomers established a new sales record in 2007, up 13 percent versus 2006, due to a 7 percent increase in volume and a 6 percent improvement in price. The increases in both volume and price were broad-based with improvement in all geographic areas and most businesses. EBIT for 2007 included restructuring charges of $97 million, including impairment charges related to a rubber plant in Berre, France, and a fiber solution plant in Tarragona, Spain. EBIT for 2006 included a restructuring charge of $11 million related to the shutdown of the polyethylene wax plant in Sarnia, Ontario, Canada, and a loss contingency of $85 million related to the EC fine. Excluding these items, EBIT declined for the business as higher raw material costs, coupled with increased spending on plant maintenance and operations, more than offset the benefit of higher selling prices and increased sales volume.
Technology Licensing and Catalyst sales and EBIT were down significantly in 2007 due to lump sum licensing revenue earned in 2006 that did not recur in 2007. Performance Plastics Outlook for 2008 Performance Plastics sales are expected to increase in 2008 as the Company continues to invest in Performance businesses and pursue growth opportunities in developing geographic areas. Additional industry capacity for some products may result in downward pressure on pricing. Raw material costs are expected to remain challenging as higher feedstock and energy costs continue to drive prices higher.
Dow Automotive expects sales growth in line with automotive industry trends. Conditions in the North American automotive industry are expected to deteriorate further. To mitigate the impact of declining demand in North America, the business will focus on growth opportunities in Latin America and Eastern Europe, as well as expanding its position in Asia Pacific. Prices are expected to improve slightly in 2008 as producers attempt to recover some of the margin lost in 2007. New plants in Midland, Michigan and Schkopau, Germany are expected to start up in 2008. These facilities will replace older, less efficient plants, which are expected to close when the new facilities become fully operational.
Dow Building Solutions expects moderate volume improvement in 2008, led by continued growth in Europe and solid commercial construction demand in the United States. The business expects the U.S. residential construction industry to continue to struggle in 2008, potentially reaching the bottom in the second half of the year. Conditions in the U.S. credit market will be a key factor in how U.S. residential construction develops in 2008. Pricing is expected to rise slightly on a global basis in line with the outlook for feedstock and other raw material costs. Continued low pricing on oriented strand board is expected to keep pressure on polyisocyanurate rigid foam and extruded polystyrene sheathing in North America. Pricing pressure is also expected in Europe where additional industry capacity will come on line in 2008. The Company will continue to invest in the Dow Building Solutions business during 2008 as new foaming agent formulations, compliant with the Montreal Protocol, are implemented in North American manufacturing sites for the production of STYROFOAM™ XPS insulation.
Dow Epoxy volume is expected to increase in 2008 with three recent acquisitions - UPPC AG, POLY-CARB Inc. and GNS Technologies - driving growth in new systems applications; and continued strength in the key existing applications for electrical laminates, coatings and civil engineering. Margins are expected to come under some pressure from rising feedstock and energy costs as the addition of new industry capacity starting up in Asia Pacific in 2008 is expected to limit the ability of the business to raise prices.
Polyurethanes and Polyurethane Systems expect volume to grow in 2008, benefiting from the full-year integration of recent acquisitions (including Hyperlast Limited), as well as continued growth in insulation and other applications. Industry fundamentals are expected to be less tight in 2008 as industry production volume increases for key products. Prices are expected to increase in response to increasing feedstock and other raw material costs, although price increases may not fully offset these higher costs.
Specialty Plastics and Elastomers expect continued sales growth in 2008 driven primarily by higher volumes. Continued weakness in North America is expected to be offset by strength in Latin America, Europe and Asia Pacific. The infrastructure building industry remains strong, which should benefit the Wire & Cable business, and demand for packaging is expected to continue growing with food related applications, providing an opportunity for additional growth. While polycarbonate industry fundamentals remain challenging, demand is expected to continue to grow and should improve the industry supply/demand balance going forward.
Technology Licensing and Catalyst revenue is expected to remain solid in 2008 with volume remaining firm.
The Dow Chemical Company and Subsidiaries PART II, Item 7. Management’s Discussion and Analysis of Financial
Condition and Results of Operation.
34
Segment Results – Continued PERFORMANCE CHEMICALS Performance Chemicals sales increased 6 percent to $8,351 million in 2007, compared with $7,867 million in 2006; sales were $7,521 million in 2005. Compared with 2006, volume increased 2 percent, while prices rose 4 percent, largely due to the favorable impact of currency. The volume increase in 2007 was due in large part to the second quarter acquisition of Wolff Walsrode. In 2006, volume rose 4 percent from 2005 across most businesses in Europe, Latin America and Asia Pacific, while prices rose 1 percent.
Performance Chemicals - Sales(in millions)
$7,867
$7,521
$6,483
$5,372
$8,3512007
2006
2005
2004
2003
Performance Chemicals - EBIT(in millions)
$1,242
$1,435
$720
$756
$9492007
2006
2005
2004
2003
EBIT for 2007 was $949 million, compared with $1,242 million in 2006 and $1,435 million in 2005. Despite higher equity earnings from Dow Corning, EBIT declined in 2007 due to increases in raw material costs and higher operating expenses, as the businesses invested in new product development and growth initiatives, including integration costs associated with the acquisition of Wolff Walsrode. In addition, EBIT in 2007 was reduced by restructuring charges totaling $85 million and a $7 million charge for IPR&D related to the Wolff Walsrode acquisition. The restructuring charges included the write-down of manufacturing assets (due to plant closures in Aratu, Brazil; Freeport, Texas; and Midland, Michigan) totaling $43 million and the $42 million impairment write-down of the Company’s indirect 50 percent interest in Dow Reichhold Specialty Latex LLC. In 2006, EBIT declined as higher raw material and energy costs more than offset higher selling prices. In addition, EBIT in 2006 was reduced by restructuring charges totaling $12 million. In 2005, EBIT was negatively impacted by charges of $14 million related to the closure of five small manufacturing facilities. See Notes B and C to the Consolidated Financial Statements for additional information regarding restructuring charges and IPR&D.
Designed Polymers sales increased 23 percent versus 2006, with volume growth of 20 percent and price increases of 3 percent. The improvement in volume was primarily due to the second quarter acquisition of Wolff Walsrode. Excluding these sales, volume for the business was up 7 percent, driven by higher sales in biocides, methyl cellulosics, and Dow Water Solutions. The improvement in volume was across all geographic areas, with double-digit growth in Europe, Latin America and Asia Pacific. Compared with 2006, EBIT declined significantly due to higher operating expenses, including expenses related to the acquisition of Wolff Walsrode, and higher raw material costs. In addition, EBIT for 2007 was reduced by restructuring charges totaling $27 million related to the permanent closure of the cellulosics plant in Aratu, Brazil, and the shutdown of a small pharmaceutical plant in Midland, Michigan, as well as a $7 million IPR&D charge.
Dow Latex sales for 2007 were flat with 2006, as a 5 percent increase in price was offset by a 5 percent decline in volume. Compared with 2006, paper and carpet latex prices were higher in all geographic areas. Volume was down, however, primarily due to challenging conditions in both the paper and carpet industries. Carpet latex was down due to the slow housing industry in North America, while paper latex continued to be impacted by changes in the advertising industry as spending moves toward alternative media versus print and coated paper. Prices were slightly higher for specialty latex, however, volume declined due to sluggish demand for architectural coatings in North America. Despite higher selling prices, EBIT declined significantly in 2007 due to lower volumes and higher feedstock and energy costs. In addition, EBIT in 2007 was reduced by a charge of $42 million related to the write-down of the Company’s indirect 50 percent interest in Dow Reichhold Specialty Latex LLC.
Specialty Chemicals sales were up 2 percent versus 2006, with a 3 percent increase in price and a 1 percent decrease in volume. Compared with 2006, prices were up across all geographic areas except North America, principally driven by higher raw material costs. Volume declined slightly versus 2006 primarily due to planned and unplanned outages at OPTIMAL, which manufactures products that are sold by Dow in Asia Pacific. EBIT in 2007 declined as higher raw material and energy costs and lower operating rates more than offset improvements in price. In addition, EBIT in 2007 was reduced by restructuring charges totaling $16 million related to the write-down of two manufacturing facilities.
The Dow Chemical Company and Subsidiaries PART II, Item 7. Management’s Discussion and Analysis of Financial
Condition and Results of Operation.
35
Performance Chemicals Outlook for 2008 Performance Chemicals sales for 2008 are expected to increase as the Company benefits from growth opportunities related to the acquisition of Wolff Walsrode. Prices are expected to be higher across most major product lines reflecting good industry fundamentals, although excess industry supply and volatility of feedstock and energy costs will continue to put pressure on margins in Dow Latex.
Designed Polymers sales are expected to increase significantly with higher prices for methyl cellulosics and CELLOSIZE™ hydroxyethyl cellulose used in food ingredients, pharmaceuticals and personal care products. Price and volume improvements are also expected in Specialty Polymers, Dow Water Solutions, biocides, and the specialty chemical products of ANGUS Chemical Company.
Dow Latex sales are expected to decrease due to the slowdown in residential housing construction in North America, which will impact demand for specialty latex. In addition, some customers may seek lower cost alternatives to styrene-butadiene latex products in coated paper applications.
Specialty Chemicals prices are expected to decrease slightly due to declining monoethylene glycol prices, which will put pricing pressure on ethylene oxide derivative products, including amines and glycol ethers. AGRICULTURAL SCIENCES Sales for Agricultural Sciences were $3,779 million in 2007, compared with $3,399 million in 2006 and $3,364 million in 2005. Volume increased 9 percent, compared with 2006, while prices increased 2 percent. The increase in price was primarily driven by the favorable impact of currency which offset local currency price decreases associated with generic competition. Volume was up significantly across several product lines in 2007. Strong volume growth continued for new products including penoxsulam rice herbicide and aminopyralid herbicide for range and pasture, which reported sales almost double the levels of 2006. Demand in cereals applications drove fluroxypyr mixtures and florasulam sales higher, while glyphosate and its mixtures grew in conjunction with the global increase in corn acreage. Spinosad and chlorpyrifos sales both benefited from a mild winter and early spring in Europe, while low termite pressure and the slow housing construction in the United States adversely impacted sales of SENTRICON™ Termite Colony Elimination System and sulfuryl fluoride. Demand creation efforts continued to progress as several additional large restaurant chains chose to use Omega-9 oils, heart-healthy canola and sunflower oils derived from NEXERA™ seed, in their establishments. In 2006, volume increased 3 percent from 2005, while prices declined 2 percent, primarily due to highly competitive industry conditions in Brazil and the unfavorable impact of currency in Europe and Asia Pacific. Volume increased as sales of insecticides rebounded from the competitive pressures of 2005. In 2006, commodity herbicides also benefited from the adoption of herbicide-tolerant soybeans in Brazil and herbicide-tolerant corn in the United States, while increased sales of cotton, sunflower and canola seed more than offset lower sales of corn seed in the United States.
Agricultural Sciences - Sales(in millions)
$3,399
$3,364
$3,368
$3,008
$3,7792007
2006
2005
2004
2003
Agricultural Sciences - EBIT(in millions)
$415
$543
$586
$441
$4672007
2006
2005
2004
2003
EBIT in 2007 was $467 million versus $415 million in 2006 and $543 million in 2005. The increase in EBIT in 2007 was primarily the result of strong demand related to high farm commodity prices and increased acres planted, economic stability across Latin America, and marked improvement in seeds operations. EBIT in 2007 was negatively impacted by $77 million of restructuring charges primarily related to the impairment of the Company’s manufacturing site in Lauterbourg, France, and by IPR&D charges totaling $50 million related to recent acquisitions. See Notes B and C to the Consolidated Financial Statements for additional information regarding restructuring charges and IPR&D. In 2006, EBIT declined from 2005 due to downward pricing pressure in highly competitive industry conditions, product mix and an increase in raw material costs.
The Dow Chemical Company and Subsidiaries PART II, Item 7. Management’s Discussion and Analysis of Financial
Condition and Results of Operation.
36
Segment Results – Continued Agricultural Sciences Outlook for 2008 Agricultural Sciences sales for 2008 are expected to grow above the levels achieved in 2007. Volume is expected to increase in key regions as farm commodity prices and grower confidence remain high. Price is anticipated to be relatively flat despite pricing pressure from generic competition in agricultural chemicals. Growth is anticipated in Brazil, but at a lesser rate than experienced with the economic rebound in 2007. The launch of pyroxsulam (cereal herbicide) and continued ramp-up of newer products, such as spinetoram, penoxsulam, aminopyralid, and WIDESTRIKE™ and HERCULEX™ insect protection, are expected to continue to increase sales. In addition, demand for Omega-9 oils should continue to build momentum in the healthy oils market segment. Consistent with the Company’s strategy, the business expects to increase spending for the discovery and development of new products.
BASIC PLASTICS Sales for the Basic Plastics segment were $12,878 million in 2007, up 9 percent from $11,833 million in 2006. Sales were $11,007 million in 2005. Prices, including the favorable impact of currency, increased 8 percent in 2007, while volume increased 1 percent. Price increases were reported in all geographic areas, reflecting significantly higher feedstock and energy costs. While volume was significantly higher in Asia Pacific and Europe, higher prices, a very competitive industry environment, and growing concerns about the strength of the U.S. economy resulted in lower volume in North America which was also impacted by the shutdown of two production facilities at the end of 2006. In 2006, prices increased 7 percent over 2005, while volume increased 1 percent. The increase in selling prices reflected significantly higher feedstock and energy costs in 2006. While volume was up significantly in Asia Pacific and Latin America, volume declined in North America as customers reduced inventories.
Basic Plastics - Sales(in millions)
$11,833
$11,007
$9,284
$7,028
$12,8782007
2006
2005
2004
2003
Basic Plastics - EBIT(in millions)
$2,022
$2,398
$1,714
$658
$2,0062007
2006
2005
2004
2003
EBIT for 2007 was $2,006 million, down from $2,022 million in 2006 and $2,398 million in 2005. EBIT declined in 2007 as price increases were not sufficient to offset the significant increases in feedstock and other raw material costs. Compared with last year, equity earnings increased due to significantly higher earnings from EQUATE (due to planned maintenance turnarounds in 2006), partially offset by lower equity earnings from Siam Polyethylene and Equipolymers. EBIT in 2007 was reduced by restructuring charges totaling $88 million related to the announced shutdown of the polypropylene production facility at St. Charles Operations in Hahnville, Louisiana; the write-down of the Company’s 50 percent interest in Pétromont and Company, Limited Partnership; and the write-off of abandoned engineering costs. In 2006, EBIT declined from 2005 as price increases were not sufficient to offset the significant increases in feedstock and other raw material costs. Equity earnings from EQUATE and Siam Polyethylene in 2006 were also lower due to planned maintenance turnarounds. In addition, EBIT in 2006 was negatively impacted by restructuring charges totaling $16 million related to the shutdown of the polystyrene and polyethylene production facilities in Sarnia, Ontario, Canada.
Polyethylene sales increased 8 percent in 2007 as prices increased 6 percent and volume increased 2 percent. Prices rose in all geographic areas, except North America, in response to significantly higher feedstock and energy costs. In North America, prices declined slightly as highly competitive industry conditions and soft demand made it difficult to implement price increases. Substantial volume growth in Asia Pacific and Europe, combined with modest increases in North America and Latin America, more than offset a notable decline in South Africa due to the sale of the Company’s polyethylene manufacturing plant in that country in 2006. EBIT decreased slightly in 2007 as higher selling prices, lower operational costs, and higher equity earnings were more than offset by higher feedstock costs. EBIT in 2007 was reduced by a restructuring charge of $46 million related to the impairment write-down of the Company’s 50 percent interest in Pétromont and Company, Limited Partnership and the write-down of abandoned engineering costs of $16 million. EBIT in 2007 was favorably impacted by a gain on the sale of the low density polyethylene plant in Cubatao, Brazil, in the second quarter of 2007.
The Dow Chemical Company and Subsidiaries PART II, Item 7. Management’s Discussion and Analysis of Financial
Condition and Results of Operation.
37
Polypropylene sales increased 5 percent in 2007 as prices improved 10 percent and volume declined 5 percent. Polypropylene prices increased in 2007 in response to significantly higher propylene costs. Volume improved significantly in Europe where a tight supply/demand balance resulted in customers pre-buying product in anticipation of future price increases. Volume declined significantly in South Africa, resulting from the sale of the Company’s polypropylene manufacturing plant in 2006. Despite higher prices, EBIT declined from 2006 due to higher propylene costs, higher operating costs and a restructuring charge of $26 million related to the announced shutdown of the Company’s polypropylene manufacturing facility at St. Charles Operations in Hahnville, Louisiana.
Polystyrene sales increased 15 percent in 2007 as prices improved 13 percent and volume increased 2 percent. Prices improved in all geographic areas, driven by significantly higher feedstock and energy costs. Volume declined significantly in North America reflecting lower demand due to high polystyrene prices and the closure of the Company’s polystyrene manufacturing facility at Sarnia, Ontario, Canada in the fourth quarter of 2006. Volume was significantly higher in Asia Pacific due to the consolidation of the SAL Petrochemical (Zhangjiagang) Company Limited, after the Company acquired the remaining 50 percent interest in the joint venture in the first quarter of 2007. EBIT improved significantly from 2006 as higher prices and lower operating costs more than offset the increase in feedstock and energy costs. EBIT for 2006 was negatively impacted by a restructuring charge related to the shutdown of the polystyrene plant in Sarnia, Ontario, Canada. Basic Plastics Outlook for 2008 Feedstock and energy costs are expected to remain high during 2008, providing support for the maintenance of prices although some margin deterioration is expected. Demand for all products within the segment is expected to remain solid during the first half of the year; however, additional global production capacity scheduled for the second half of the year will likely result in increased industry competition.
While feedstock costs are expected to be higher in 2008, polyethylene margins are expected to remain near 2007 levels during the first half of the year. Industry supply/demand balances are expected to remain consistent with 2007, but may be impacted by new industry production capacity in late 2008. Equity earnings are expected to be lower in 2008, due to slightly higher raw material and operating costs at EQUATE and higher feedstock costs at Siam Polyethylene. In addition, equity losses are expected from a new joint venture announced in the third quarter of 2007 by Dow and Crystalsev, to design and build a world-scale facility to manufacture polyethylene from sugar cane, as that joint venture incurs costs associated with the initial feasibility study.
Polypropylene demand is expected to be comparable to 2007 and remain strong during the first half of the year. Margins should improve in North America as the shutdown of the production facility at St. Charles Operations results in a shift in product mix to higher margin products. North America volumes are expected to be negatively impacted by reduced export demand and planned maintenance shutdowns at the Company’s Seadrift and Oyster Creek facilities in Texas. In Europe, margins are expected to decline as significant new industry production capacity comes on-line in Europe and the Middle East during the second half of the year.
Within the polystyrene industry, demand growth is expected to remain low due to high prices and the volatility of raw materials costs, resulting in continued pressure on margins. The industry is expected to be highly competitive and industry restructuring will continue in 2008. The Company and Chevron Phillips Chemical Company LP signed a non-binding Memorandum of Understanding in the second quarter of 2007 relating to the formation of a joint venture involving assets from their respective polystyrene and styrene monomer businesses in the Americas. The new joint venture, subject to completion of definitive agreements and corporate and other approvals, is expected to begin operations in 2008.
In addition, in the fourth quarter of 2007, Dow and PIC announced plans to form a 50:50 joint venture to create a market-leading petrochemicals company. The global joint venture will include the manufacturing and marketing of polyethylene and polypropylene, among other products. The transaction is subject to the completion of definitive agreements, customary conditions and regulatory approvals, and is anticipated to close in late 2008. BASIC CHEMICALS Sales for Basic Chemicals were $5,863 million in 2007, compared with $5,560 million in 2006 and $5,643 million in 2005. Overall, sales increased 5 percent as prices rose 6 percent, including the favorable impact of currency which accounted for about one-third of the price increase. The increase in price was primarily due to price improvements in ethylene oxide/ethylene glycol (“EO/EG”) and solvents and intermediates, mainly driven by increases in feedstock and energy costs. Volume was down 1 percent in 2007 as volume growth in solvents and intermediates was more than offset by declines in EG and ethylene dichloride (“EDC”). Volume for EDC was down, principally in North America, due to the shutdown of the Company’s EDC production facility in Fort Saskatchewan, Alberta, Canada in the fourth quarter of 2006. In 2006, volume was down 2 percent from 2005, due to plant closures in the chlor-vinyl business and the expiration of a customer contract for vinyl acetate monomer at the end of 2005; prices increased 1 percent versus 2005.
The Dow Chemical Company and Subsidiaries PART II, Item 7. Management’s Discussion and Analysis of Financial
Condition and Results of Operation.
38
Segment Results – Continued Caustic soda sales were slightly higher in 2007 mainly due to increased volume. Vinyl chloride monomer (“VCM”) sales
were essentially flat, as an increase in price was offset by a decrease in volume. The decline in volume was primarily due to maintenance outages.
EO/EG sales increased 6 percent in 2007, as a 16 percent increase in prices, principally due to higher feedstock and energy costs, more than offset a 10 percent decrease in volume. EG volume declined in 2007 due to lack of supply related to planned and unplanned outages on the U.S. Gulf Coast and the restructuring of certain supply agreements.
Solvents and intermediates sales were up 24 percent in 2007, with a 13 percent increase in volume and an 11 percent increase in price. The significant improvement in volume was related to solid demand for oxo products for coatings applications. Price improvement was driven by increases in feedstock and energy costs and other raw material cost increases.
Basic Chemicals - Sales(in millions)
$5,560
$5,643
$5,439
$4,357
$5,8632007
2006
2005
2004
2003
Basic Chemicals - EBIT(in millions)
$813
$689
$1,129
$1,600
$334
2007
2006
2005
2004
2003
EBIT for Basic Chemicals was $813 million in 2007, compared with $689 million in 2006 and $1,129 million in 2005. Results for the segment in 2007 included restructuring charges of $7 million related to the write-off of capital project spending. In 2006, results included restructuring charges totaling $184 million related to the closure of the chlor-alkali plant at Fort Saskatchewan, Alberta, Canada, as well as a number of other small manufacturing facilities. Excluding these items from both periods, EBIT in 2007 declined from 2006 as sharply higher feedstock and energy costs and increases in other raw material costs more than offset the improvement in sales and higher equity earnings from EQUATE and MEGlobal. EBIT in 2006 declined from 2005 as significantly higher feedstock and energy costs and lower volume exceeded the benefits of improved plant operations and an increase in selling prices. Results for 2005 included a gain of $41 million associated with the sale of EQUATE shares, as well as a restructuring charge of $3 million related to the closure of a small manufacturing facility. Basic Chemicals Outlook for 2008 Caustic soda prices are expected to remain flat in 2008, while volume is expected to decline due to three significant maintenance turnarounds planned for 2008.
VCM sales are expected to increase in 2008 due to an anticipated increase in volume in Europe and Latin America, and expected increased prices driven by higher hydrocarbon and energy costs. Average industry operating rates for EG in 2008 are expected to be consistent with the average operating rate for 2007. However, 2008 supply/demand balance is expected to be tight early in the year, and then weaken slowly as a result of new industry capacity scheduled to come on-line late in the year, compressing margins. Equity earnings are expected to remain strong in 2008. The EG joint venture with PIC is expected to start production in the second half of 2008, adding to equity earnings.
Solvents and intermediates’ diversity of applications and increased geographic growth beyond North America and Asia Pacific will enable sustained demand for 2008. Sales volume is expected to grow slightly and margins should remain favorable despite continued high feedstock and energy costs, as no new industry capacity is scheduled to come on-line in 2008 in Asia Pacific and supply/demand is expected to remain balanced. HYDROCARBONS AND ENERGY Hydrocarbons and Energy sales were $7,105 million in 2007, compared with $6,205 million in 2006 and $6,061 million in 2005. In 2007, prices were up 12 percent and volume increased 3 percent from 2006. Prices increased in 2007 due to the continued rise in crude oil and feedstock costs, and tight supply/demand balances for certain hydrocarbon products. Volume increased in 2007 primarily due to additional U.S. power sales resulting from the fourth quarter 2006 acquisition of the Plaquemine Cogeneration Facility in Louisiana. In 2006, prices increased 11 percent and volume decreased 9 percent from 2005. Compared with 2005, prices rose following the rise in crude oil and feedstock costs; volume declined due to outages, both scheduled and unscheduled, at a number of the Company’s facilities.
The Dow Chemical Company and Subsidiaries PART II, Item 7. Management’s Discussion and Analysis of Financial
Condition and Results of Operation.
39
Hydrocarbons and Energy - Sales(in millions)
$6,205
$6,061
$4,876
$3,820
$7,1052007
2006
2005
2004
2003
The Hydrocarbons and Energy business transfers materials to Dow’s derivative businesses at cost, which results in EBIT that is at or near breakeven. In 2007, EBIT was a loss of $45 million due to restructuring charges of $44 million recorded in the fourth quarter principally due to the shutdown of the Company’s styrene monomer plant in Camaçari, Brazil, and the closure of storage wells in Fort Saskatchewan, Alberta, Canada (see Note B to the Consolidated Financial Statements). EBIT for the segment was at or near breakeven in 2006 and 2005.
The Company uses derivatives of crude oil and natural gas as feedstocks in its ethylene facilities, while natural gas is used as a fuel. The Company’s cost of purchased feedstocks and energy rose approximately $2.5 billion (11 percent) in 2007 due to increased prices. Crude oil prices increased for much of the year, and on average, 2007 prices were $7 per barrel higher than 2006 levels. Conversely, on average, North American natural gas prices continued the downward trend, and were approximately $0.13 per million Btu lower than in 2006, a decrease of approximately 2 percent.
100
91
72
56
1112007
2006
2005
2004
2003
Hydrocarbons and Energy Purchase Price Index2006=100
Hydrocarbons and Energy Outlook for 2008 Crude oil and natural gas prices are expected to remain volatile and sensitive to external factors such as weather, economic growth/sub-prime credit effects and geopolitical tensions. The Company expects crude oil prices, on average, to be higher than 2007. Ethylene margins are expected to be somewhat lower in 2008 due to global capacity growth, particularly in the Middle East, exceeding global demand growth. Ethylene margins could improve compared to these expectations, with stronger than anticipated demand and delayed startups of new capacity within the industry. The economic outlook is uncertain, and a faltering economy and/or major spike in crude oil prices may contribute to a decline in margins and volume. UNALLOCATED AND OTHER Sales for Unallocated and Other, which primarily relate to the Company’s insurance operations, were $421 million in 2007, compared with $316 million in 2006 and $306 million in 2005. Included in the results for Unallocated and Other are:
• results of insurance company operations, • gains and losses on sales of financial assets, • stock-based compensation expense, • changes in the allowance for doubtful receivables, • expenses related to New Ventures, • asbestos-related defense and resolution costs, • foreign exchange hedging results, and • certain overhead and other cost recovery variances not allocated to the operating segments EBIT was a loss of $897 million in 2007 compared with a loss of $594 million in 2006 and a loss of $1,048 million in
2005. EBIT for 2007 was reduced by 2007 restructuring charges totaling $105 million, including employee-related severance
The Dow Chemical Company and Subsidiaries PART II, Item 7. Management’s Discussion and Analysis of Financial
Condition and Results of Operation.
40
Segment Results – Continued
expenses of $86 million, pension curtailment costs and termination benefits of $15 million and asset write-offs of $4 million; franchise taxes of approximately $80 million; and higher performance-based compensation expenses (including stock-based compensation) of approximately $230 million. EBIT for 2007 was favorably impacted by improved results from insurance company operations, foreign exchange hedging results, and an $8 million favorable adjustment to the restructuring charge recorded in the third quarter of 2006 for employee-related severance.
EBIT for 2006 was negatively impacted by restructuring charges of $137 million (including employee-related severance expenses of $73 million, pension curtailment costs and termination benefits of $33 million, asset write-offs of $18 million related to the shutdown of several small facilities around the world, and asbestos abatement of $10 million and environmental remediation of $3 million related to the shutdown of all production facilities at the Company’s site in Sarnia, Ontario, Canada); performance-based stock compensation expenses of $86 million; other severance costs of $52 million; asbestos-related defense and resolution costs (net of insurance) of $45 million; and expenses of $59 million related to the Company’s corporate branding program. EBIT for 2006 was favorably impacted by a $177 million reduction in Union Carbide’s asbestos-related liability for pending and future claims (excluding future defense and processing costs). EBIT for 2005 was negatively impacted by charges totaling $48 million for restructuring activities in the fourth quarter of 2005 (including employee-related expenses of $25 million, the write-off of an intangible asset of $10 million and costs of $13 million related to the closure of three small plants), severance costs of $68 million, a cash donation of $100 million to The Dow Chemical Company Foundation, performance-based stock compensation expenses of $276 million, asbestos-related defense and resolution costs (net of insurance) of $75 million, and a loss of $31 million associated with the early extinguishment of debt.
See Note B to the Consolidated Financial Statements for information regarding the restructuring charges.
Sales Price and Volume 2007 2006 2005 Percent change from prior year Volume Price Total Volume Price Total Volume Price Total Operating Segments:
United States (1)% 2% 1% - 4% 4% (3)% 19% 16% Europe 5 12 17 1% 6 7 1 15 16 Rest of World 5 5 10 5 3 8 (5) 17 12
Total 2% 7% 9% 1% 5% 6% (2)% 17% 15% Price includes the impact of currency. Volume includes the impact of acquisitions and divestitures.
LIQUIDITY AND CAPITAL RESOURCES The Company’s cash flows from operating, investing and financing activities, as reflected in the Consolidated Statements of Cash Flows, are summarized in the following table:
Cash Flow Summary In millions 2007 2006 2005 Cash provided by (used in):
Net increase (decrease) in cash and cash equivalents $(1,021) $(1,049) $ 698
The Dow Chemical Company and Subsidiaries PART II, Item 7. Management’s Discussion and Analysis of Financial
Condition and Results of Operation.
41
Despite lower earnings, cash provided by operating activities in 2007 increased versus 2006 principally due to a reduction in cash contributed to the Company’s pension plans. Cash provided by operating activities decreased in 2006 versus 2005 primarily due to lower earnings, partially offset by lower pension contributions.
Cash used in investing activities in 2007 increased significantly compared with 2006 due to investments in consolidated companies (including $603 million for Wolff Walsrode and $151 million for Hyperlast Limited; see Notes C and G to the Consolidated Financial Statements), a $300 million increase in capital expenditures, several acquisitions of agricultural businesses, partially offset by a lower usage of cash to purchase previously leased assets. Cash used in investing activities in 2006 increased significantly compared with 2005, as cash usage in 2005 was reduced by proceeds of $867 million from the sale of Union Carbide’s 50 percent indirect interest in UOP.
Cash used in financing activities in 2007 decreased compared with 2006 as the issuance of promissory notes under the Company’s U.S. commercial paper program and higher proceeds from the sales of common stock (related to the exercise of stock options and the Employees’ Stock Purchase Plan), more than offset increases in purchases of treasury stock (related to the Company’s share repurchase programs) and dividends paid to shareholders. In May 2007, the quarterly dividend was increased 12 percent. Cash used in financing activities in 2006 increased compared with 2005 principally due to purchases of treasury stock (related to a share repurchase program authorized in July 2005) and an increase in dividends paid to stockholders. In February 2006, the quarterly dividend was increased 12 percent.
On August 29, 2006, the Board of Directors approved a plan (the “2006 Plan”) to shut down a number of the Company’s manufacturing facilities. These shutdowns are scheduled to be completed by the end of the first quarter of 2009. On December 3, 2007, the Board of Directors approved a restructuring plan (the “2007 Plan”) that includes the shutdown of a number of assets and organizational changes within targeted functions. These restructuring activities are expected to be completed by the end of 2009. The restructuring activities related to both the 2006 Plan and the 2007 Plan are expected to result in additional cash expenditures of approximately $338 million over the next few years related to severance costs, contract termination fees, asbestos abatement and environmental remediation (see Note B to the Consolidated Financial Statements). Dow expects to incur future costs related to its restructuring activities, as the Company continually looks for ways to enhance the efficiency and cost effectiveness of its operations, to ensure competitiveness across its businesses and across geographic areas. Future costs are expected to include demolition costs related to the closed facilities, which will be recognized as incurred. The Company also expects to incur additional employee-related costs, including involuntary termination benefits, related to its other optimization activities, and pension plan settlement costs. These costs cannot be reasonably estimated at this time.
Working Capital at December 31 In millions 2007 2006 Current assets $18,654 $17,209 Current liabilities 12,445 10,601 Working capital $ 6,209 $ 6,608 Current ratio 1.50:1 1.62:1
Working Capital(in millions)
$6,608
$6,741
$5,384
$3,578
$6,2092007
2006
2005
2004
2003
At December 31, 2007, trade receivables were $5.9 billion, up from $5.0 billion at December 31, 2006, consistent with the significant increase in sales. Days-sales-outstanding-in-receivables (excluding the impact of sales of receivables) was 38 days at December 31, 2007 compared with 39 days at December 31, 2006. At December 31, 2007, total inventories were $6.9 billion, up from $6.1 billion at December 31, 2006, principally due to the increase in feedstock and energy costs and higher plant operating rates. Days-sales-in-inventory at December 31, 2007 was 61 days versus 63 days at December 31, 2006.
The Dow Chemical Company and Subsidiaries PART II, Item 7. Management’s Discussion and Analysis of Financial
Condition and Results of Operation.
42
Liquidity and Capital Resources – Continued
Total Debt at December 31 In millions
2007
2006
Notes payable $1,548 $ 219 Long-term debt due within one year 586 1,291 Long-term debt 7,581 8,036 Total debt $9,715 $9,546 Debt as a percent of total capitalization 31.8% 34.1%
Debt as a Percent of Total Capitalization(percent)
34.1%
39.1%
47.9%
55.4%
31.8%2007
2006
2005
2004
2003
As part of its ongoing financing activities, Dow has the ability to issue promissory notes under its U.S. and Euromarket commercial paper programs. At December 31, 2007, there was $1.2 billion of commercial paper outstanding. In the event Dow has short-term liquidity needs and is unable to access these short-term markets for any reason, Dow has the ability to access liquidity through its committed and available $3 billion 5-year revolving credit facility with various U.S. and foreign banks. This credit facility matures in April 2011.
At December 31, 2007, the Company had $500 million of SEC-registered securities available for issuance under U.S. shelf registrations, Euro 5.0 billion (approximately $7.4 billion) available for issuance under the Company’s Euro Medium Term Note Program, as well as Japanese yen 50 billion (approximately $447 million) of securities available for issuance under a shelf registration filed with the Tokyo Stock Exchange on July 31, 2006. In addition, as a well-known seasoned issuer, the Company filed an automatic shelf registration for an unspecified amount of mixed securities with the SEC on February 23, 2007. Under this shelf registration, the Company may offer common stock, preferred stock, depositary shares, debt securities, warrants, stock purchase contracts and stock purchase units.
Dow’s public debt instruments and documents for its private funding transactions contain, among other provisions, certain covenants and default provisions. At December 31, 2007, the Company was in compliance with all of these covenants and default provisions. For information on Dow’s covenants and default provisions, see Note K to the Consolidated Financial Statements.
On July 14, 2005, the Board of Directors authorized the repurchase of up to 25 million shares of Dow common stock over the period ended on December 31, 2007 (the “2005 Program”). In 2005 and 2006, the Company purchased 18,798,407 shares of the Company’s common stock under the 2005 Program. During the first quarter of 2007, the Company purchased the remaining 6,201,593 shares under the 2005 Program, bringing the program to a close.
On October 26, 2006, the Company announced that its Board of Directors had approved a new share buy-back program, authorizing up to $2 billion to be spent on the repurchase of the Company’s common stock (the “2006 Program”). Purchases under the 2006 Program began in March 2007, following completion of the 2005 Program. In 2007, the Company purchased 26,225,207 shares of the Company’s common stock under the 2006 Program. For additional information, see PART II, Item 5. Market for Registrant’s Common Equity, Related Stockholder Matters and Issuer Purchases of Equity Securities. Capital Expenditures Capital spending for the year was $2,075 million, up 17 percent from $1,775 million in 2006. Capital spending was $1,597 million in 2005. In 2007, approximately 31 percent of the Company’s capital expenditures were directed toward additional capacity for new and existing products, compared with 33 percent in 2006. In 2007, approximately 23 percent was committed to projects related to environmental protection, safety, loss prevention and industrial hygiene compared with 24 percent in 2006. The remaining capital was utilized to maintain the Company’s existing asset base, including projects related to productivity improvements, energy conservation and facilities support.
The Dow Chemical Company and Subsidiaries PART II, Item 7. Management’s Discussion and Analysis of Financial
Condition and Results of Operation.
43
Capital Expenditures(in millions)
$1,775
$1,597
$1,333
$1,100
$2,0752007
2006
2005
2004
2003
Major projects underway during 2007 included the construction of a regional headquarters facility in Shanghai, China; Dow Automotive production facilities in Midland, Michigan, and Schkopau, Germany, for glass bonding and primer products; a facility for the production of octene in Tarragona, Spain; a multi-product facility for the production of isopropanolamines in Plaquemine, Louisiana; a new train for the production of METHOCELTM cellulose ethers in Midland, Michigan; a new polyols plant in Terneuzen, The Netherlands; and the expansion of ethyleneamines and ethanolamines production facilities in Hahnville, Louisiana. Additional major projects included upgrades to isopropanol production facilities in Texas City, Texas; and the replacement of furnaces used in the production of ethylene and several projects to upgrade chlor-alkali production facilities in Freeport, Texas. Because the Company designs and builds most of its capital projects in-house, it had no material capital commitments other than for the purchase of materials from fabricators and construction labor. Contractual Obligations The following tables summarize the Company’s contractual obligations, commercial commitments and expected cash requirements for interest at December 31, 2007. Additional information related to these obligations can be found in Notes J, K, L, M and R to the Consolidated Financial Statements.
Contractual Obligations at December 31, 2007 Payments Due by Year
In millions 2008 2009 2010 2011 2012 2013 and
beyond Total Long-term debt – current and noncurrent $ 586 $ 777 $1,065 $1,548 $1,006 $ 3,185 $ 8,167 Deferred income tax liabilities – noncurrent (1) - - - - - 854 854 Pension and other postretirement benefits 279 236 240 240 242 1,777 3,014 Other noncurrent obligations (2) 294 250 172 110 60 2,988 3,874 FIN No. 48 obligations, including interest and penalties (3) 383 - - - - 661 1,044 Other contractual obligations:
Minimum operating lease commitments 231 200 171 117 93 441 1,253 Purchase commitments – take or pay and
Expected cash requirements for interest 504 472 421 359 276 4,223 6,255 Total $4,565 $3,806 $3,653 $3,494 $2,621 $19,385 $37,524 (1) Deferred tax liabilities may vary according to changes in tax laws, tax rates and the operating results of the Company. As a result, it is
impractical to determine whether there will be a cash impact to an individual year. All noncurrent deferred income tax liabilities have been reflected in “2013 and beyond.”
(2) Annual payments to resolve asbestos litigation will vary based on changes in defense strategies, changes in state and national law, and claims filing and resolution rates. As a result, it is impractical to determine the anticipated payments in any given year. Therefore, the majority of the noncurrent asbestos-related liability of $1,001 million has been reflected in “2013 and beyond.”
(3) Due to uncertainties in the timing of the effective settlement of tax positions with the respective taxing authorities, the Company is unable to determine the timing of payments related to its FIN No. 48 noncurrent obligations, including interest and penalties. These amounts are therefore reflected in “2013 and beyond.”
(4) Includes outstanding purchase orders and other commitments greater than $1 million, obtained through a survey of the Company.
The Dow Chemical Company and Subsidiaries PART II, Item 7. Management’s Discussion and Analysis of Financial
Condition and Results of Operation.
44
Liquidity and Capital Resources – Continued Off-Balance Sheet Arrangements Guarantees arise during the ordinary course of business from relationships with customers and nonconsolidated affiliates when the Company undertakes an obligation to guarantee the performance of others if specific triggering events occur. Information regarding the Company's outstanding guarantees at December 31, 2007 is disclosed in Note J to the Consolidated Financial Statements.
The Company leases an ethylene facility in The Netherlands from an owner trust that is a variable interest entity (“VIE”). Dow is not the primary beneficiary of the owner trust and, therefore, is not required to consolidate the owner trust. Additional information regarding this VIE can be found in Note M to the Consolidated Financial Statements. Dividends On February 14, 2008 the Board of Directors announced a quarterly dividend of $0.42 per share, payable April 30, 2008, to stockholders of record on March 31, 2008. Since 1912, the Company has paid a cash dividend every quarter and, in each instance, Dow has maintained or increased the amount of the dividend, adjusted for stock splits. During that 95-year period, Dow has increased the amount of the quarterly dividend 47 times (approximately 12 percent of the time) and maintained the amount of the quarterly dividend approximately 88 percent of the time. The Company declared dividends of $1.635 per share in 2007, $1.50 per share in 2006 and $1.34 per share in 2005. Outlook for 2008 In 2007, the Company continued to strengthen its financial position. Despite the fifth consecutive year of double-digit percentage increases in feedstock and energy costs, coupled with softening economic conditions in the United States, the diversity of Dow’s business and geographic portfolio, as well as record financial performance by its joint ventures, resulted in solid net income for the Company. Working capital was reduced by $399 million, despite higher sales levels, as the Company reduced its working capital ratios. Capital expenditures were $2.1 billion, slightly higher than depreciation. These actions enabled the Company to further reduce its ratio of debt to total capitalization to 31.8 percent, down from 59.2 percent at the end of 2002. The Company does not intend to reduce this ratio further in 2008.
In 2008, the Company will continue to implement its strategy to improve long-term earnings growth and earnings consistency. While the economic outlook is unclear, primarily in the United States, the Company expects continued economic growth in the rest of the world, particularly in emerging geographies. Volatility in feedstock and energy costs is expected to continue, adding uncertainty to the outlook. The Company will maintain its financial discipline while increasing its investment in targeted growth opportunities, principally in its Performance businesses and in emerging geographies. Capital expenditures are expected to increase in 2008, but should remain close to the level of depreciation. These expenditures are planned at a level sufficient to maintain the safety and reliability of the Company's facilities while modestly increasing capacity in selected high-value businesses.
Approximately $1.7 billion in debt will become due in 2008, including approximately $1.2 billion of commercial paper. While the Company expects to have sufficient cash to meet its scheduled debt obligations in 2008, the Company intends to repay this debt with the issuance of new debt.
Dow and PIC announced plans in December 2007 to form a 50:50 petrochemicals joint venture. To form the new joint venture, Dow will sell to PIC a 50 percent interest in the business assets included in the transaction for approximately $9.5 billion (pretax). In turn, PIC and Dow will each contribute their assets into the joint venture. The transaction is subject to the completion of definitive agreements, customary conditions and regulatory approvals, and is anticipated to close in late 2008. OTHER MATTERS Recent Accounting Pronouncements See Note A to the Consolidated Financial Statements for a summary of significant accounting policies and recent accounting pronouncements.
The Dow Chemical Company and Subsidiaries PART II, Item 7. Management’s Discussion and Analysis of Financial
Condition and Results of Operation.
45
Critical Accounting Policies The preparation of financial statements and related disclosures in accordance with accounting principles generally accepted in the United States of America (“U.S. GAAP”) requires management to make judgments, assumptions and estimates that affect the amounts reported in the Consolidated Financial Statements and accompanying notes. Note A to the Consolidated Financial Statements describes the significant accounting policies and methods used in the preparation of the Consolidated Financial Statements. Following are the Company’s critical accounting policies impacted by judgments, assumptions and estimates:
Litigation The Company is subject to legal proceedings and claims arising out of the normal course of business. The Company routinely assesses the likelihood of any adverse judgments or outcomes to these matters, as well as ranges of probable losses. A determination of the amount of the reserves required, if any, for these contingencies is made after thoughtful analysis of each known issue and an actuarial analysis of historical claims experience for incurred but not reported matters. Dow has an active risk management program consisting of numerous insurance policies secured from many carriers. These policies provide coverage that is utilized to minimize the impact, if any, of the legal proceedings. The required reserves may change in the future due to new developments in each matter. For further discussion, see Note J to the Consolidated Financial Statements.
Asbestos-Related Matters of Union Carbide Corporation Union Carbide Corporation (“Union Carbide”), a wholly owned subsidiary of the Company, and a former Union Carbide subsidiary, Amchem Products, Inc. (“Amchem”), are and have been involved in a large number of asbestos-related suits filed primarily in state courts during the past three decades. Based on a study completed by Analysis, Research & Planning Corporation (“ARPC”) in January 2003, Union Carbide increased its December 31, 2002 asbestos-related liability for pending and future claims for the 15-year period ending in 2017 to $2.2 billion, excluding future defense and processing costs. Union Carbide also increased the receivable for insurance recoveries related to its asbestos liability to $1.35 billion at December 31, 2002. Since then, Union Carbide has compared current asbestos claim and resolution activity to the results of the most recent ARPC study at each balance sheet date to determine whether the accrual continues to be appropriate. In addition, Union Carbide has requested ARPC to review Union Carbide’s historical asbestos claim and resolution activity each November since 2004 to determine the appropriateness of updating the most recent ARPC study.
In November 2006, Union Carbide requested ARPC to review Union Carbide’s historical asbestos claim and resolution activity and determine the appropriateness of updating its most recent study from January 2005. In response to that request, ARPC reviewed and analyzed data through October 31, 2006 and concluded that the experience from 2004 through 2006 was sufficient for the purpose of forecasting future filings and values of asbestos claims filed against UCC and Amchem, and could be used in place of previous assumptions to update the January 2005 study. The resulting study, completed by ARPC in December 2006, stated that the undiscounted cost of resolving pending and future asbestos-related claims against UCC and Amchem, excluding future defense and processing costs, through 2021 was estimated to be between approximately $1.2 billion and $1.5 billion. As in its January 2003 and January 2005 studies, ARPC provided estimates for a longer period of time in its December 2006 study, but also reaffirmed its prior advice that forecasts for shorter periods of time are more accurate than those for longer periods of time.
Based on ARPC’s December 2006 study and Union Carbide’s own review of the asbestos claim and resolution activity, Union Carbide decreased its asbestos-related liability for pending and future claims $177 million to $1.2 billion at December 31, 2006 which covered the 15-year period ending in 2021, excluding future defense and processing costs.
Following the completion of the review by ARPC in December 2007, as well as Union Carbide’s own review of the asbestos claim and resolution activity, Union Carbide determined that no change to the related liability for pending and future claims was required. At December 31, 2007, Union Carbide’s asbestos-related liability for pending and future claims was $1.1 billion.
Union Carbide’s receivable for insurance recoveries related to its asbestos liability was $467 million at December 31, 2007 and $495 million at December 31, 2006. In addition, Union Carbide had receivables of $271 million at December 31, 2007 and $300 million at December 31, 2006 for insurance recoveries for defense and resolution costs.
The amounts recorded by Union Carbide for the asbestos-related liability and related insurance receivable were based upon current, known facts. However, future events, such as the number of new claims to be filed and/or received each year, the average cost of disposing of each such claim, coverage issues among insurers, and the continuing solvency of various insurance companies, as well as the numerous uncertainties surrounding asbestos litigation in the United States, could cause the actual costs and insurance recoveries for Union Carbide to be higher or lower than those projected or those recorded.
The Dow Chemical Company and Subsidiaries PART II, Item 7. Management’s Discussion and Analysis of Financial
Condition and Results of Operation.
46
Critical Accounting Policies – Continued
For additional information, see Legal Proceedings, Asbestos-Related Matters of Union Carbide Corporation in Management’s Discussion and Analysis of Financial Condition and Results of Operation, and Note J to the Consolidated Financial Statements. Environmental Matters The Company determines the costs of environmental remediation of its facilities and formerly owned facilities based on evaluations of current law and existing technologies. Inherent uncertainties exist in such evaluations primarily due to unknown conditions, changing governmental regulations and legal standards regarding liability, and evolving technologies. The recorded liabilities are adjusted periodically as remediation efforts progress, or as additional technical or legal information becomes available. In the case of landfills and other active waste management facilities, Dow recognizes the costs over the useful life of the facility. At December 31, 2007, the Company had accrued obligations of $322 million for environmental remediation and restoration costs, including $28 million for the remediation of Superfund sites. This is management’s best estimate of the costs for remediation and restoration with respect to environmental matters for which the Company has accrued liabilities, although the ultimate cost with respect to these particular matters could range up to twice that amount. The Company had accrued obligations of $347 million at December 31, 2006, for environmental remediation and restoration costs, including $31 million for the remediation of Superfund sites. For further discussion, see Environmental Matters in Management’s Discussion and Analysis of Financial Condition and Results of Operation and Notes A and J to the Consolidated Financial Statements. Pension and Other Postretirement Benefits The amounts recognized in the consolidated financial statements related to pension and other postretirement benefits are determined from actuarial valuations. Inherent in these valuations are assumptions including expected return on plan assets, discount rates at which the liabilities could be settled at December 31, 2007, rate of increase in future compensation levels, mortality rates and health care cost trend rates. These assumptions are updated annually and are disclosed in Note L to the Consolidated Financial Statements. In accordance with U.S. GAAP, actual results that differ from the assumptions are accumulated and amortized over future periods and, therefore, affect expense recognized and obligations recorded in future periods. The U.S. pension plans represent approximately 74 percent of the Company’s pension plan assets and 68 percent of the pension obligations. The following information relates to the U.S. plans only; a similar approach is used for the Company’s non-U.S. plans.
The Company determined the expected long-term rate of return on assets by performing a detailed analysis of historical and expected returns based on the strategic asset allocation approved by the Board of Directors and the underlying return fundamentals of each asset class. The Company’s historical experience with the pension fund asset performance was also considered. The long-term rate of return assumption used for determining net periodic pension expense for 2007 was 8.79 percent. This assumption was changed to 8.50 percent for determining 2008 net periodic pension expense. The Company’s historical actual return averaged 7.94 percent for the ten-year period ending December 31, 2007. The actual rate of return in 2007 was 13.1 percent. Future actual pension expense will depend on future investment performance, changes in future discount rates and various other factors related to the population of participants in the Company’s pension plans.
The discount rates utilized to measure the pension and other postretirement obligations of the U.S. qualified plans are based on the yield on high-quality fixed income investments at the measurement date. Future expected actuarially determined cash flows of Dow’s major U.S. plans are matched against the Citigroup Pension Discount Curve (Above Median) to arrive at a single discount rate by plan. The resulting discount rate increased from 5.98 percent at December 31, 2006 to 6.75 percent at December 31, 2007.
The value of the U.S. qualified plan assets increased from $11.2 billion at December 31, 2006 to $11.9 billion at December 31, 2007. The Company made contributions of $15 million to the U.S. qualified plans in 2007. The favorable impact of asset returns combined with an increase in the assumed discount rate, resulted in an improvement in the funded status of $1.3 billion from December 31, 2006 to December 31, 2007. At December 31, 2007, the U.S. qualified plans were overfunded on a projected benefit obligation basis by $1.6 billion.
For 2008, the Company maintained its assumption of 4.5 percent for the long-term rate of increase in compensation levels for the principal U.S. qualified plans. Since 2002, the Company has used a generational mortality table to determine the duration of its pension and other postretirement obligations.
The Dow Chemical Company and Subsidiaries PART II, Item 7. Management’s Discussion and Analysis of Financial
Condition and Results of Operation.
47
The following discussion relates to all of the Company’s pension plans. The Company bases the determination of pension expense or income on a market-related valuation of plan assets,
which reduces year-to-year volatility. This market-related valuation recognizes investment gains or losses over a five-year period from the year in which they occur. Investment gains or losses for this purpose represent the difference between the expected return calculated using the market-related value of plan assets and the actual return based on the market value of plan assets. Since the market-related value of plan assets recognizes gains or losses over a five-year period, the future value of plan assets will be impacted when previously deferred gains or losses are recorded. Over the life of the plan, both gains and losses have been recognized and amortized. At December 31, 2007, net gains of $522 million remain to be recognized in the calculation of the market-related value of plan assets. These net gains will result in decreases in future pension expense as they are recognized in the market-related value of assets and are a component of the total net loss of $1,065 million shown under “Amounts recognized in AOCI - pretax” in the table entitled “Change in Projected Benefit Obligations, Plan Assets and Funded Status of all Significant Plans” included in Note L to the Consolidated Financial Statements. The other $1,587 million of net losses represents cumulative changes in plan experience and actuarial assumptions. The net increase in the market-related value of assets due to the recognition of prior gains and losses is presented in the following table:
Net Increase in Market-Related Asset Value Due to Recognition of Prior Asset Gains and Losses In millions 2008 $174 2009 154 2010 142 2011 52 Total $522
Based on the revised pension assumptions and changes in the market-related value of assets due to the recognition of
prior asset gains, the Company expects to reduce expense by approximately $167 million for all pension and other postretirement benefits in 2008 compared with 2007.
A 25 basis point increase or decrease in the long-term return on assets assumption would change the Company’s total pension expense for 2008 by approximately $38 million. A 25 basis point increase in the discount rate assumption would lower the Company’s total pension expense for 2008 by approximately $15 million. A 25 basis point decrease in the discount rate would increase pension expense by approximately $29 million. A 25 basis point change in the long-term return and discount rate assumptions would have an immaterial impact on the other postretirement benefit expense for 2008.
Income Taxes Deferred tax assets and liabilities are determined based on temporary differences between the financial reporting and tax bases of assets and liabilities, applying enacted tax rates expected to be in effect for the year in which the differences are expected to reverse. Based on the evaluation of available evidence, both positive and negative, the Company recognizes future tax benefits, such as net operating loss carryforwards and tax credit carryforwards, to the extent that realizing these benefits is considered to be more likely than not.
At December 31, 2007, the Company had a net deferred tax asset balance of $1.5 billion, after valuation allowances of $323 million.
In evaluating the ability to realize the deferred tax assets, the Company relies principally on forecasted taxable income using historical and projected future operating results, the reversal of existing temporary differences and the availability of tax planning strategies.
At December 31, 2007, the Company had deferred tax assets for tax loss and tax credit carryforwards of $2.1 billion, $41 million of which is subject to expiration in the years 2008-2012. In order to realize these deferred tax assets for tax loss and tax credit carryforwards, the Company needs taxable income of approximately $8.1 billion across multiple jurisdictions. The taxable income needed to realize the deferred tax assets for tax loss and tax credit carryforwards that are subject to expiration between 2008-2012 is approximately $372 million.
The Company recognizes the financial statement effects of an uncertain income tax position when it is more likely than not, based on the technical merits, that the position will be sustained upon examination. At December 31, 2007, the Company had uncertain tax positions for both domestic and foreign issues of $892 million.
The Dow Chemical Company and Subsidiaries PART II, Item 7. Management’s Discussion and Analysis of Financial
Condition and Results of Operation.
48
Critical Accounting Policies – Continued The Company accrues for other tax contingencies when it is probable that a liability to a taxing authority has been
incurred and the amount of the contingency can be reasonably estimated. At December 31, 2007, the Company had a non-income tax contingency reserve for both domestic and foreign issues of $226 million.
For additional information, see Notes A and R to the Consolidated Financial Statements. Environmental Matters Environmental Policies Dow is committed to world-class environmental, health and safety (“EH&S”) performance, as demonstrated by a long-standing commitment to Responsible Care®, as well as a strong commitment to achieve the Company’s 2015 Sustainability Goals – goals that set the standard for sustainability in the chemical industry by focusing on improvements in Dow’s local corporate citizenship and product stewardship, and by actively pursuing methods to reduce the Company’s environmental impact.
To meet the Company’s public commitments, as well as the stringent laws and government regulations related to environmental protection and remediation to which its global operations are subject, Dow has well-defined policies, requirements and management systems. Dow’s EH&S Management System (“EMS”) defines the “who, what, when and how” needed for the businesses to achieve the Company’s policies, requirements, performance objectives, leadership expectations and public commitments. EMS is designed to minimize the long-term cost of environmental protection and to comply with these laws and regulations. To ensure effective utilization, the EMS is integrated into a company-wide management system for EH&S, Operations, Quality and Human Resources.
It is Dow’s policy to adhere to a waste management hierarchy that minimizes the impact of wastes and emissions on the environment. First, Dow works to eliminate or minimize the generation of waste and emissions at the source through research, process design, plant operations and maintenance. Second, Dow finds ways to reuse and recycle materials. Finally, unusable or non-recyclable hazardous waste is treated before disposal to eliminate or reduce the hazardous nature and volume of the waste. Treatment may include destruction by chemical, physical, biological or thermal means. Disposal of waste materials in landfills is considered only after all other options have been thoroughly evaluated. Dow has specific requirements for waste that is transferred to non-Dow facilities, including the periodic auditing of these facilities. Dow believes third-party verification is a cornerstone of world-class EH&S performance and building public trust. As such, numerous Dow sites in Europe, Latin America, Australia and North America have received third-party verification of Dow’s compliance with Responsible Care® and with outside specifications such as ISO-14001. During 2007, five U.S. sites were audited by Lloyd’s Register Quality Assurance, and found to be in conformance with Responsible Care® Management System requirements.
Dow’s EH&S policies helped the Company achieve excellent safety performance in 2007. Dow’s personal injury and illness OSHA (Occupational Safety and Health Administration) rate and Injury and Illness Severity rate were both on target with the reductions necessary to achieve the 2015 goals, and the lowest in the Company’s history. Tragically, one fatality occurred in 2007, when a Dow employee, traveling on behalf of the Company, was a passenger on a commercial airliner that crashed upon landing in Sao Paulo, Brazil.
Reductions in leaks, breaks and spills in 2007 also exceeded the improvements necessary to reach the 2015 goals, and were the lowest recorded in the Company’s history. Improvement in environmental compliance remains a top management priority, with initiatives underway to further improve compliance in 2008.
Detailed information on Dow’s performance regarding environmental matters and goals can be found online on Dow’s Environment, Health and Safety webpage at www.dow.com. Chemical Security Growing public and political attention has been placed on protecting critical infrastructure, including the chemical industry, from security threats. Terrorist attacks and natural disasters have increased concern about the security of chemical production and distribution. In response to the increasing call by many, including Dow and the American Chemistry Council, for uniform performance-based national standards for securing the U.S. chemical industry, U.S. Chemical Plant Security legislation was passed in 2006, and the Department of Homeland Security (“DHS”) is now implementing the regulations known as the Chemical Facility Anti-Terrorism Standards. Further, the U.S. Transportation Security Administration (“TSA”) and the U.S. Department of Transportation are expected to finalize regulations covering the rail transportation of chemicals in the early part of 2008 as required by the 9/11 Commission Act of 2007.
The focus on security is not new to Dow. A comprehensive, multi-level security plan for the Company has been maintained since 1988. This plan was activated in response to the events of 9/11. Dow continues to improve its security plans, placing emphasis on the safety of Dow communities and people by being prepared to meet risks at any level and to address
The Dow Chemical Company and Subsidiaries PART II, Item 7. Management’s Discussion and Analysis of Financial
Condition and Results of Operation.
49
both internal and external identifiable risks. Dow’s security plans also are developed to avert interruptions of normal business work operations which could materially and adversely affect the Company’s results of operations, liquidity and financial condition.
Dow played a key role in the development and implementation of the American Chemistry Council’s Responsible Care® Security Code that requires all aspects of security – including facility, transportation, and cyberspace – be assessed and gaps addressed. Through the Company’s global implementation of the Security Code, Dow has permanently heightened the level of security – not just in the United States, but worldwide. Dow employs approximately 500 employees and contractors in its Emergency Services and Security department worldwide. Dow committed over $100 million in capital over a ten-year period for plant security, supply chain and cyberspace security enhancements, regulatory compliance and response capabilities as well as other components of Dow’s security program. These costs are not considered material to the Company’s consolidated financial statements.
Through the implementation of the Responsible Care® Security Code, including voluntary security enhancements and upgrades made since 2002, Dow is well positioned to comply with the new U.S. chemical facility regulations and other regulatory frameworks. In addition, Dow was the first chemical company to receive SAFETY Act coverage in 2007 from the DHS for the Company’s Coast Guard covered sites (under the Maritime Transportation Security Act of 2002). This unprecedented certification helps validate Dow’s efforts and provides additional liability coverage in the event of a terrorist attack.
Dow continues to work collaboratively across the supply chain on Responsible Care®, Supply Chain Design, Emergency Preparedness, Shipment Visibility and Hazmat Routing. Dow is a leader in the implementation of advanced track and trace technologies. The breakthrough Next Generation Rail Tank Car project with Union Pacific Railroad and Union Tank Car Company continues to make progress with cooperation agreements signed with Transport Canada, The Federal Railroad Administration, and the TSA. Further, Dow’s Distribution Risk Review process that has been in place for decades was expanded to address potential threats in all modes of transportation across the Company’s supply chain. To reduce vulnerabilities, Dow maintains security measures that meet or exceed regulatory and industry security standards in all areas in which the Company operates.
Dow continually works to strengthen partnerships with local responders, law enforcement, and security agencies, and to enhance confidence in the integrity of the Company’s security and risk management program, as well as strengthen its preparedness and response capabilities. Dow also works closely with its supply chain partners and strives to educate lawmakers, regulators and communities about the Company’s resolve and actions to date which are mitigating security and crisis threats.
Climate Change There is a growing political and scientific consensus that emissions of greenhouse gases (“GHG”) due to human activities continue to alter the composition of the global atmosphere in ways that are affecting the climate. Political debates continue about how to implement fair and effective GHG mitigation efforts. Dow takes global climate change very seriously and is not waiting for the resolution of the debate. Dow is committed to reducing its GHG intensity (pounds of GHG per pound of product), developing climate-friendly products and processes and, over the longer term, implementing technology solutions to achieve even greater climate change improvements. Since 1990, Dow has reduced its absolute GHG emissions by more than 20 percent, a more rapid reduction than required by Kyoto Protocol targets, and has achieved a 22 percent improvement in energy intensity (the amount of energy required to produce one pound of product). In doing so, it has avoided consuming more than 900 trillion Btus, a savings that when converted to electricity would be more than sufficient to supply the electricity consumed by residential users in the State of California for one year. This trend could reverse, however, depending on business growth, capacity utilization and the pace of new technology development.
Dow also contributes to the climate change solution by producing products that help others reduce GHG emissions, such as lightweight plastics for automobiles and insulation for energy efficient homes and appliances. Dow has demonstrated its commitment to technological innovation and conservation though its exploration of renewable energy sources. For example, in 2007, Dow and Crystalsev, one of Brazil’s largest ethanol companies, signed a Memorandum of Understanding which calls for plans to design and build a world-scale facility to manufacture polyethylene from sugar cane. In the United States, Dow Building Solutions announced plans to build a 505 kilowatt solar farm at Dow’s Pittsburg, California site. This project will be the largest solar installation in Dow and the first commercial pilot for the Company, providing the energy equivalent to power 400 homes.
Gains made toward Dow’s Energy Efficiency goal will directly impact progress in meeting its 2015 Climate Change goal, which is to reduce GHG intensity by 2.5 percent a year per pound of product, from a 2005 baseline. Dow is studying the lifecycle impact of its products on climate change and additional global projects that could offset the Company’s overall GHG emissions through carbon dioxide reduction.
The Dow Chemical Company and Subsidiaries PART II, Item 7. Management’s Discussion and Analysis of Financial
Condition and Results of Operation.
50
Environmental Matters – Continued A new Energy & Climate Change Policy and Issue Management Team was formed in 2007 to help establish Dow as a
leader in providing energy and climate change solutions. The team is also tasked with developing and implementing a comprehensive climate change strategy and to advocate for an international framework that establishes clear pathways to help slow, stop and reverse the rate of GHG emissions. Environmental Remediation Dow accrues the costs of remediation of its facilities and formerly owned facilities based on current law and existing technologies. The nature of such remediation includes, for example, the management of soil and groundwater contamination and the closure of contaminated landfills and other waste management facilities. In the case of landfills and other active waste management facilities, Dow recognizes the costs over the useful life of the facility. The accounting policies adopted to properly reflect the monetary impacts of environmental matters are discussed in Note A to the Consolidated Financial Statements. To assess the impact on the financial statements, environmental experts review currently available facts to evaluate the probability and scope of potential liabilities. Inherent uncertainties exist in such evaluations primarily due to unknown conditions, changing governmental regulations and legal standards regarding liability, and evolving technologies. These liabilities are adjusted periodically as remediation efforts progress or as additional technical or legal information become available. Dow had an accrued liability of $294 million at December 31, 2007, related to the remediation of current or former Dow-owned sites. The liability related to remediation at December 31, 2006 was $316 million.
In addition to current and former Dow-owned sites, under the Federal Comprehensive Environmental Response, Compensation and Liability Act and equivalent state laws (hereafter referred to collectively as “Superfund Law”), Dow is liable for remediation of other hazardous waste sites where Dow allegedly disposed of, or arranged for the treatment or disposal of, hazardous substances. Dow readily cooperates in the remediation of these sites where the Company’s liability is clear, thereby minimizing legal and administrative costs. Because Superfund Law imposes joint and several liability upon each party at a site, Dow has evaluated its potential liability in light of the number of other companies that also have been named potentially responsible parties (“PRPs”) at each site, the estimated apportionment of costs among all PRPs, and the financial ability and commitment of each to pay its expected share. The Company’s remaining liability for the remediation of Superfund sites at December 31, 2007 was $28 million ($31 million at December 31, 2006). The Company has not recorded any third-party recovery related to these sites as a receivable.
Information regarding environmental sites is provided below:
Environmental Sites Dow-owned Sites (1) Superfund Sites (2) 2007 2006 2007 2006 Number of sites at January 1 251 245 64 72 Sites added during year 3 8 31 8 Sites closed during year (3) (2) (1) (16)Number of sites at December 31 251 251 94 64
(1) Dow-owned sites are sites currently or formerly owned by Dow, where remediation obligations are imposed (in the United States) by the Resource Conservation Recovery Act or analogous state law. 153 of these sites were formerly owned by Dowell Schlumberger, Inc., a group of companies in which the Company previously owned a 50 percent interest. Dow sold its interest in Dowell Schlumberger in 1992.
(2) Superfund sites are sites, including sites not owned by Dow, where remediation obligations are imposed by Superfund Law.
The Company’s manufacturing sites in Freeport, Texas, and Midland, Michigan, are the sites for which the Company has
the largest environmental remediation accruals. From the start of operations at the Freeport site in the 1940s until the mid-1970s, manufacturing wastes were typically placed in on-site pits and landfills. The resulting soil and groundwater contamination is being assessed and remediated under the provisions of the Resource Conservation Recovery Act (“RCRA”), in concert with the state of Texas. At December 31, 2007, the Company had an accrual of $37 million ($47 million at December 31, 2006) related to environmental remediation at the Freeport manufacturing site. In 2007, $6 million ($8 million in 2006) was spent on environmental remediation at the Freeport site.
Similar to the Freeport site, in the early days of operations at the Midland site, manufacturing wastes were usually disposed of on-site, resulting in soil and groundwater contamination, which has been contained and managed on-site under a series of RCRA permits and regulatory agreements. The most recent Hazardous Waste Operating License for the Midland site, issued in 2003, also included provisions for the Company to conduct an investigation to determine the nature and extent of off-site contamination from historic Midland site operations. The scope of the investigation includes Midland area soils;
The Dow Chemical Company and Subsidiaries PART II, Item 7. Management’s Discussion and Analysis of Financial
Condition and Results of Operation.
51
Tittabawassee and Saginaw River sediment and floodplain soils; and Saginaw Bay, and requires the Company to conduct interim response actions. See Note J to the Consolidated Financial Statements for additional information. At December 31, 2007, the Company had an accrual of $36 million ($41 million at December 31, 2006) for environmental remediation and investigation associated with the Midland site. In 2007, the Company spent $52 million ($20 million in 2006) on environmental remediation at the Midland site.
In total, the Company’s accrued liability for probable environmental remediation and restoration costs was $322 million at December 31, 2007, compared with $347 million at the end of 2006. This is management’s best estimate of the costs for remediation and restoration with respect to environmental matters for which the Company has accrued liabilities, although the ultimate cost with respect to these particular matters could range up to twice that amount. It is the opinion of the Company’s management that the possibility is remote that costs in excess of those disclosed will have a material adverse impact on the Company’s consolidated financial statements.
The amounts charged to income on a pretax basis related to environmental remediation totaled $92 million in 2007, $125 million in 2006 and $79 million in 2005. Capital expenditures for environmental protection were $189 million in 2007, $193 million in 2006 and $150 million in 2005. Asbestos-Related Matters of Union Carbide Corporation Introduction Union Carbide Corporation (“Union Carbide”), a wholly owned subsidiary of the Company, is and has been involved in a large number of asbestos-related suits filed primarily in state courts during the past three decades. These suits principally allege personal injury resulting from exposure to asbestos-containing products and frequently seek both actual and punitive damages. The alleged claims primarily relate to products that Union Carbide sold in the past, alleged exposure to asbestos-containing products located on Union Carbide’s premises, and Union Carbide’s responsibility for asbestos suits filed against a former Union Carbide subsidiary, Amchem Products, Inc. (“Amchem”). In many cases, plaintiffs are unable to demonstrate that they have suffered any compensable loss as a result of such exposure, or that injuries incurred in fact resulted from exposure to Union Carbide’s products.
Influenced by the bankruptcy filings of numerous defendants in asbestos-related litigation and the prospects of various forms of state and national legislative reform, the rate at which plaintiffs filed asbestos-related suits against various companies, including Union Carbide and Amchem, increased in 2001, 2002 and the first half of 2003. Since then, the rate of filing has significantly abated. Union Carbide expects more asbestos-related suits to be filed against Union Carbide and Amchem in the future, and will aggressively defend or reasonably resolve, as appropriate, both pending and future claims.
The table below provides information regarding asbestos-related claims filed against Union Carbide and Amchem:
2007 2006 2005 Claims unresolved at January 1 111,887 146,325 203,416 Claims filed 10,157 16,386 34,394 Claims settled, dismissed or otherwise resolved (31,722) (50,824) (91,485) Claims unresolved at December 31 90,322 111,887 146,325 Claimants with claims against both UCC and
Amchem 28,937 38,529 48,647 Individual claimants at December 31 61,385 73,358 97,678
Plaintiffs’ lawyers often sue dozens or even hundreds of defendants in individual lawsuits on behalf of hundreds or even
thousands of claimants. As a result, the damages alleged are not expressly identified as to Union Carbide, Amchem or any other particular defendant, even when specific damages are alleged with respect to a specific disease or injury. In fact, there are no personal injury cases in which only Union Carbide and/or Amchem are the sole named defendants. For these reasons and based upon Union Carbide’s litigation and settlement experience, Union Carbide does not consider the damages alleged against Union Carbide and Amchem to be a meaningful factor in its determination of any potential asbestos liability. Estimating the Liability Based on a study completed by Analysis, Research & Planning Corporation (“ARPC”) in January 2003, Union Carbide increased its December 31, 2002 asbestos-related liability for pending and future claims for the 15-year period ending in 2017 to $2.2 billion, excluding future defense and processing costs. Since then, Union Carbide has compared current asbestos claim and resolution activity to the results of the most recent ARPC study at each balance sheet date to determine whether the accrual continues to be appropriate. In addition, Union Carbide has requested ARPC to review Union Carbide’s historical asbestos claim and resolution activity each November since 2004 to determine the appropriateness of updating the most recent ARPC study.
The Dow Chemical Company and Subsidiaries PART II, Item 7. Management’s Discussion and Analysis of Financial
Condition and Results of Operation.
52
Asbestos-Related Matters of Union Carbide Corporation – Continued
In November 2006, Union Carbide requested ARPC to review Union Carbide’s historical asbestos claim and resolution activity and determine the appropriateness of updating its most recent study from January 2005. In response to that request, ARPC reviewed and analyzed data through October 31, 2006 and concluded that the experience from 2004 through 2006 was sufficient for the purpose of forecasting future filings and values of asbestos claims filed against Union Carbide and Amchem, and could be used in place of previous assumptions to update the January 2005 study. The resulting study, completed by ARPC in December 2006, stated that the undiscounted cost of resolving pending and future asbestos-related claims against Union Carbide and Amchem, excluding future defense and processing costs, through 2021 was estimated to be between approximately $1.2 billion and $1.5 billion. As in its January 2003 and January 2005 studies, ARPC provided estimates for a longer period of time in its December 2006 study, but also reaffirmed its prior advice that forecasts for shorter periods of time are more accurate than those for longer periods of time.
Based on ARPC’s December 2006 study and Union Carbide’s own review of the asbestos claim and resolution activity, Union Carbide decreased its asbestos-related liability for pending and future claims to $1.2 billion at December 31, 2006 which covered the 15-year period ending in 2021 (excluding future defense and processing costs). The reduction was $177 million and was shown as “Asbestos-related credit” in the consolidated statements of income.
In November 2007, Union Carbide requested ARPC to review Union Carbide’s 2007 asbestos claim and resolution activity and determine the appropriateness of updating its 2006 study. In response to that request, ARPC reviewed and analyzed data through October 31, 2007. In December 2007, ARPC stated that an update of its study would not provide a more likely estimate of future events than the estimate reflected in its study of the previous year and, therefore, the estimate in that study remained applicable. Based on Union Carbide’s own review of the asbestos claim and resolution activity and ARPC’s response, Union Carbide determined that no change to the accrual was required. At December 31, 2007, Union Carbide’s asbestos-related liability for pending and future claims was $1.1 billion.
At December 31, 2007, approximately 31 percent of the recorded liability related to pending claims and approximately 69 percent related to future claims. At December 31, 2006, approximately 25 percent of the recorded liability related to pending claims and approximately 75 percent related to future claims. Defense and Resolution Costs The following table provides information regarding defense and resolution costs related to asbestos-related claims filed against Union Carbide and Amchem:
The average resolution payment per asbestos claimant and the rate of new claim filings has fluctuated both up and down
since the beginning of 2001. Union Carbide’s management expects such fluctuations to continue in the future based upon a number of factors, including the number and type of claims settled in a particular period, the jurisdictions in which such claims arose, and the extent to which any proposed legislative reform related to asbestos litigation is being considered.
Union Carbide expenses defense costs as incurred. The pretax impact for defense and resolution costs, net of insurance, was $84 million in 2007, $45 million in 2006 and $75 million in 2005, and was reflected in “Cost of sales.” Insurance Receivables At December 31, 2002, Union Carbide increased the receivable for insurance recoveries related to its asbestos liability to $1.35 billion, substantially exhausting its asbestos product liability coverage. The insurance receivable related to the asbestos liability was determined by Union Carbide after a thorough review of applicable insurance policies and the 1985 Wellington Agreement, to which Union Carbide and many of its liability insurers are signatory parties, as well as other insurance settlements, with due consideration given to applicable deductibles, retentions and policy limits, and taking into account the solvency and historical payment experience of various insurance carriers. The Wellington Agreement and other agreements with insurers are designed to facilitate an orderly resolution and collection of Union Carbide’s insurance policies and to resolve issues that the insurance carriers may raise.
The Dow Chemical Company and Subsidiaries PART II, Item 7. Management’s Discussion and Analysis of Financial
Condition and Results of Operation.
53
In September 2003, Union Carbide filed a comprehensive insurance coverage case, now proceeding in the Supreme Court of the State of New York, County of New York, seeking to confirm its rights to insurance for various asbestos claims and to facilitate an orderly and timely collection of insurance proceeds. This lawsuit was filed against insurers that are not signatories to the Wellington Agreement and/or do not otherwise have agreements in place with Union Carbide regarding their asbestos-related insurance coverage, in order to facilitate an orderly resolution and collection of such insurance policies and to resolve issues that the insurance carriers may raise. Although the lawsuit is continuing, through the end of 2007, Union Carbide has reached settlements with several of the carriers involved in this litigation.
Union Carbide’s receivable for insurance recoveries related to its asbestos liability was $467 million at December 31, 2007 and $495 million at December 31, 2006. At December 31, 2007 and December 31, 2006, all of the receivable for insurance recoveries was related to insurers that are not signatories to the Wellington Agreement and/or do not otherwise have agreements in place regarding their asbestos-related insurance coverage.
In addition to the receivable for insurance recoveries related to its asbestos liability, Union Carbide had receivables for defense and resolution costs submitted to insurance carriers for reimbursement as follows:
Receivables for Costs Submitted to Insurance Carriers at December 31 In millions 2007 2006 Receivables for defense costs $ 18 $ 34 Receivables for resolution costs 253 266 Total $271 $300
After a review of its insurance policies, with due consideration given to applicable deductibles, retentions and policy
limits, after taking into account the solvency and historical payment experience of various insurance carriers; existing insurance settlements; and the advice of outside counsel with respect to the applicable insurance coverage law relating to the terms and conditions of its insurance policies, Union Carbide continues to believe that its recorded receivable for insurance recoveries from all insurance carriers is probable of collection. Summary The amounts recorded by Union Carbide for the asbestos-related liability and related insurance receivable described above were based upon current, known facts. However, future events, such as the number of new claims to be filed and/or received each year, the average cost of disposing of each such claim, coverage issues among insurers, and the continuing solvency of various insurance companies, as well as the numerous uncertainties surrounding asbestos litigation in the United States, could cause the actual costs and insurance recoveries for Union Carbide to be higher or lower than those projected or those recorded.
Because of the uncertainties described above, Union Carbide’s management cannot estimate the full range of the cost of resolving pending and future asbestos-related claims facing Union Carbide and Amchem. Union Carbide’s management believes that it is reasonably possible that the cost of disposing of Union Carbide’s asbestos-related claims, including future defense costs, could have a material adverse impact on Union Carbide’s results of operations and cash flows for a particular period and on the consolidated financial position of Union Carbide.
It is the opinion of Dow’s management that it is reasonably possible that the cost of Union Carbide disposing of its asbestos-related claims, including future defense costs, could have a material adverse impact on the Company’s results of operations and cash flows for a particular period and on the consolidated financial position of the Company.
The Dow Chemical Company and Subsidiaries PART II, Item 7A. Quantitative and Qualitative Disclosures About Market Risk.
54
Dow’s business operations give rise to market risk exposure due to changes in foreign exchange rates, interest rates, commodity prices and other market factors such as equity prices. To manage such risks effectively, the Company enters into hedging transactions, pursuant to established guidelines and policies, which enable it to mitigate the adverse effects of financial market risk. Derivatives used for this purpose are designated as hedges per SFAS No. 133, “Accounting for Derivative Instruments and Hedging Activities,” where appropriate. A secondary objective is to add value by creating additional non-specific exposure within established limits and policies; derivatives used for this purpose are not designated as hedges per SFAS No. 133. The potential impact of creating such additional exposures is not material to the Company’s results.
The global nature of Dow’s business requires active participation in the foreign exchange markets. As a result of investments, production facilities and other operations on a global basis, the Company has assets, liabilities and cash flows in currencies other than the U.S. dollar. The primary objective of the Company’s foreign exchange risk management is to optimize the U.S. dollar value of net assets and cash flows, keeping the adverse impact of currency movements to a minimum. To achieve this objective, the Company hedges on a net exposure basis using foreign currency forward contracts, over-the-counter option contracts, cross-currency swaps, and nonderivative instruments in foreign currencies. Main exposures are related to assets and liabilities denominated in the currencies of Europe, Asia Pacific and Canada; bonds denominated in foreign currencies – mainly the Euro; and economic exposure derived from the risk that currency fluctuations could affect the U.S. dollar value of future cash flows. The majority of the foreign exchange exposure is related to European currencies and the Japanese yen.
The main objective of interest rate risk management is to reduce the total funding cost to the Company and to alter the interest rate exposure to the desired risk profile. Dow uses interest rate swaps, “swaptions,” and exchange-traded instruments to accomplish this objective. The Company’s primary exposure is to the U.S. dollar yield curve.
Dow has a portfolio of equity securities derived from its acquisition and divestiture activity. This exposure is managed in a manner consistent with the Company’s market risk policies and procedures.
Inherent in Dow’s business is exposure to price changes for several commodities. Some exposures can be hedged effectively through liquid tradable financial instruments. Feedstocks for ethylene production and natural gas constitute the main commodity exposures. Over-the-counter and exchange traded instruments are used to hedge these risks when feasible.
Dow uses value at risk (“VAR”), stress testing and scenario analysis for risk measurement and control purposes. VAR estimates the potential gain or loss in fair market values, given a certain move in prices over a certain period of time, using specified confidence levels. On an ongoing basis, the Company estimates the maximum gain or loss that could arise in one day, given a two-standard-deviation movement in the respective price levels. These amounts are immaterial in comparison to the size of the equity of the Company. The VAR methodology used by Dow is based primarily on a variance/covariance statistical model. The year-end VAR and average daily VAR for the aggregate of non-trading and trading positions for 2007 and 2006 are shown below:
Total Daily VAR at December 31* 2007 2006 In millions Year-end Average Year-end Average Foreign exchange $7 $5 $3 $4 Interest rate $57 $44 $34 $43 Equity exposures, net of hedges $15 $16 $9 $3 Commodities $17 $11 $14 $19 *Using a 95 percent confidence level
See Note H to the Consolidated Financial Statements for further disclosure regarding market risk.
The Dow Chemical Company and Subsidiaries PART II, Item 8. Financial Statements and Supplementary Data.
55
Management’s Report on Internal Control Over Financial Reporting Management is responsible for establishing and maintaining adequate internal control over financial reporting. The Company’s internal control framework and processes are designed to provide reasonable assurance to management and the Board of Directors regarding the reliability of financial reporting and the preparation of the Company’s consolidated financial statements in accordance with accounting principles generally accepted in the United States of America.
The Company’s internal control over financial reporting includes those policies and procedures that: • pertain to the maintenance of records that, in reasonable detail, accurately and fairly reflect the transactions and
dispositions of the assets of the Company; • provide reasonable assurance that transactions are recorded properly to allow for the preparation of financial
statements in accordance with generally accepted accounting principles, and that receipts and expenditures of the Company are being made only in accordance with authorizations of management and Directors of the Company;
• provide reasonable assurance regarding prevention or timely detection of unauthorized acquisition, use, or disposition of the Company’s assets that could have a material effect on the consolidated financial statements; and
• provide reasonable assurance as to the detection of fraud. Because of its inherent limitations, any system of internal control over financial reporting can provide only reasonable
assurance and may not prevent or detect misstatements. Management assessed the effectiveness of the Company’s internal control over financial reporting and concluded that, as
of December 31, 2007, such internal control is effective. In making this assessment, management used the criteria set forth by the Committee of Sponsoring Organizations of the Treadway Commission (“COSO”) in Internal Control—Integrated Framework.
The Company’s independent auditors, Deloitte & Touche LLP, with direct access to the Company’s Board of Directors through its Audit Committee, have audited the consolidated financial statements prepared by the Company. Their report on the consolidated financial statements is included herein. Deloitte & Touche LLP’s report on the Company’s internal control over financial reporting is included in Part II, Item 9A. Controls and Procedures. /s/ ANDREW N. LIVERIS /s/ GEOFFERY E. MERSZEI Andrew N. Liveris Geoffery E. Merszei President, Chief Executive Officer and Executive Vice President and Chief Financial Officer Chairman of the Board /s/ WILLIAM H. WEIDEMAN William H. Weideman Vice President and Controller February 13, 2008
The Dow Chemical Company and Subsidiaries PART II, Item 8. Financial Statements and Supplementary Data.
56
Report of Independent Registered Public Accounting Firm To the Board of Directors and Stockholders of The Dow Chemical Company: We have audited the accompanying consolidated balance sheets of The Dow Chemical Company and subsidiaries (the "Company") as of December 31, 2007 and 2006, and the related consolidated statements of income, stockholders' equity, comprehensive income and cash flows for each of the three years in the period ended December 31, 2007. Our audits also included the financial statement schedule listed in the Index at Item 15 (a) 2. These financial statements and financial statement schedule are the responsibility of the Company's management. Our responsibility is to express an opinion on the financial statements and financial statement schedule based on our audits.
We conducted our audits in accordance with the standards of the Public Company Accounting Oversight Board (United States). Those standards require that we plan and perform the audit to obtain reasonable assurance about whether the financial statements are free of material misstatement. An audit includes examining, on a test basis, evidence supporting the amounts and disclosures in the financial statements. An audit also includes assessing the accounting principles used and significant estimates made by management, as well as evaluating the overall financial statement presentation. We believe that our audits provide a reasonable basis for our opinion.
In our opinion, such consolidated financial statements present fairly, in all material respects, the financial position of The Dow Chemical Company and subsidiaries at December 31, 2007 and 2006, and the results of their operations and their cash flows for each of the three years in the period ended December 31, 2007, in conformity with accounting principles generally accepted in the United States of America. Also, in our opinion, such financial statement schedule, when considered in relation to the basic consolidated financial statements taken as a whole, presents fairly, in all material respects, the information set forth therein.
As discussed in Notes A and L to the consolidated financial statements, effective December 31, 2006, the Company changed its method of accounting for defined benefit pension and other postretirement plans to conform to Statement of Financial Accounting Standards No. 158.
We have also audited, in accordance with the standards of the Public Company Accounting Oversight Board (United States), the Company's internal control over financial reporting as of December 31, 2007, based on the criteria established in Internal Control—Integrated Framework issued by the Committee of Sponsoring Organizations of the Treadway Commission and our report dated February 14, 2008 expressed an unqualified opinion on the Company's internal control over financial reporting. /s/ DELOITTE & TOUCHE LLP Deloitte & Touche LLP Midland, Michigan February 14, 2008
(In millions, except per share amounts) For the years ended December 31 2007 2006 2005Net Sales 53,513$ 49,124$ 46,307$
Cost of sales 46,400 41,526 38,276 Research and development expenses 1,305 1,164 1,073 Selling, general and administrative expenses 1,864 1,663 1,545 Amortization of intangibles 72 50 55 Restructuring charges 578 591 114 Purchased in-process research and development charges 57 - - Asbestos-related credit - 177 - Equity in earnings of nonconsolidated affiliates 1,122 959 964 Sundry income - net 324 137 755 Interest income 130 185 138 Interest expense and amortization of debt discount 584 616 702
Income before Income Taxes and Minority Interests 4,229 4,972 6,399 Provision for income taxes 1,244 1,155 1,782 Minority interests' share in income 98 93 82
Income before Cumulative Effect of Change in Accounting Principle 2,887 3,724 4,535 Cumulative effect of change in accounting principle - - (20)
Net Income Available for Common Stockholders 2,887$ 3,724$ 4,515$ Share Data
Earnings before cumulative effect of change in accounting principle per common share - basic 3.03$ 3.87$ 4.71$ Earnings per common share - basic 3.03$ 3.87$ 4.69$ Earnings before cumulative effect of change in accounting principle per common share - diluted 2.99$ 3.82$ 4.64$ Earnings per common share - diluted 2.99$ 3.82$ 4.62$ Common stock dividends declared per share of common stock 1.635$ 1.50$ 1.34$ Weighted-average common shares outstanding - basic 953.1 962.3 963.2Weighted-average common shares outstanding - diluted 965.6 974.4 976.8
See Notes to the Consolidated Financial Statements.
The Dow Chemical Company and SubsidiariesConsolidated Statements of Income
57
(In millions, except share amounts) At December 31 2007 2006Assets
Current Assets Cash and cash equivalents 1,736$ 2,757$ Marketable securities and interest-bearing deposits 1 153Accounts and notes receivable: Trade (net of allowance for doubtful receivables - 2007: $118; 2006: $122) 5,944 4,988 Other 3,740 3,060Inventories 6,885 6,058Deferred income tax assets - current 348 193Total current assets 18,654 17,209
Other Assets Goodwill 3,572 3,242Other intangible assets (net of accumulated amortization - 2007: $721; 2006: $620) 781 457Deferred income tax assets - noncurrent 2,126 4,006Asbestos-related insurance receivables - noncurrent 696 725Deferred charges and other assets 2,621 1,054Total other assets 9,796 9,484
Total Assets 48,801$ 45,581$ Liabilities and Stockholders' Equity
Current Liabilities Notes payable 1,548$ 219$ Long-term debt due within one year 586 1,291Accounts payable: Trade 4,555 3,825 Other 1,981 1,849Income taxes payable 728 569Deferred income tax liabilities - current 117 251Dividends payable 418 382Accrued and other current liabilities 2,512 2,215Total current liabilities 12,445 10,601
Deferred income tax liabilities - noncurrent 854 999Pension and other postretirement benefits - noncurrent 3,014 3,094Asbestos-related liabilities - noncurrent 1,001 1,079Other noncurrent obligations 3,103 3,342Total other noncurrent liabilities 7,972 8,514
Minority Interest in Subsidiaries 414 365Preferred Securities of Subsidiaries 1,000 1,000Stockholders' Equity
Common stock (authorized 1,500,000,000 shares of $2.50 par value each; issued 981,377,562 shares) 2,453 2,453Additional paid-in capital 902 830Retained earnings (includes cummulative effect of adopting FIN No. 48 of $(290)) 18,004 16,987Accumulated other comprehensive loss (170) (2,235)Treasury stock at cost (2007: 41,011,018 shares; 2006: 23,326,570 shares) (1,800) (970)Net stockholders' equity 19,389 17,065
Total Liabilities and Stockholders' Equity 48,801$ 45,581$ See Notes to the Consolidated Financial Statements.
The Dow Chemical Company and SubsidiariesConsolidated Balance Sheets
58
(In millions) For the years ended December 31 2007 2006 2005Operating Activities
Net Income Available for Common Stockholders 2,887$ 3,724$ 4,515$ Adjustments to reconcile net income to net cash provided by operating activities: Cumulative effect of change in accounting principle - - 20 Depreciation and amortization 2,190 2,074 2,079 Purchased in-process research and development charges 57 - - Provision for deferred income tax 494 104 740 Earnings of nonconsolidated affiliates in excess of dividends received (348) (343) (469) Minority interests' share in income 98 93 82 Pension contributions (183) (575) (1,031) Net gain on sales of ownership interests in nonconsolidated affiliates - - (732) Net gain on sales of investments (143) (19) (33) Net gain on sales of property, businesses and consolidated companies (108) (130) (56) Other net gain (75) (12) (29) Restructuring charges 577 586 41 Asbestos-related credit - (177) - Tax benefit - nonqualified stock option exercises - - 85 Excess tax benefits from share-based payment arrangements (31) (11) - Changes in assets and liabilities: Accounts and notes receivable (1,002) 242 (469) Inventories (712) (758) (240) Accounts payable 799 (129) 106 Other assets and liabilities (16) (515) (135)Cash provided by operating activities 4,484 4,154 4,474
Investing Activities Capital expenditures (2,075) (1,775) (1,597)Proceeds from sales of property, businesses and consolidated companies 211 296 105Acquisitions of businesses (143) - - Purchase of previously leased assets (30) (208) (263) Investments in consolidated companies (867) (111) (109)Investments in nonconsolidated affiliates (78) (103) (208) Distributions from nonconsolidated affiliates 63 6 41 Proceeds from sales of ownership interests in nonconsolidated affiliates 30 10 956 Purchases of investments (1,952) (1,405) (1,400)
Proceeds from sales and maturities of investments 1,983 1,383 1,379Cash used in investing activities (2,858) (1,907) (1,096)
Financing Activities Changes in short-term notes payable 1,220 23 74Payments on long-term debt (1,354) (1,359) (1,559)Proceeds from issuance of long-term debt 21 - 4Purchases of treasury stock (1,462) (739) (68)Proceeds from sales of common stock 379 223 398Excess tax benefits from share-based payment arrangements 31 11 - Distributions to minority interests (51) (57) (70)Dividends paid to stockholders (1,512) (1,404) (1,287)Cash used in financing activities (2,728) (3,302) (2,508)
Effect of Exchange Rate Changes on Cash 81 6 (172)Summary
Increase (Decrease) in cash and cash equivalents (1,021) (1,049) 698Cash and cash equivalents at beginning of year 2,757 3,806 3,108Cash and cash equivalents at end of year 1,736$ 2,757$ 3,806$
See Notes to the Consolidated Financial Statements.
The Dow Chemical Company and SubsidiariesConsolidated Statements of Cash Flows
59
(In millions) For the years ended December 31 2007 2006 2005Common Stock
Balance at beginning and end of year 2,453$ 2,453$ 2,453$ Additional Paid-in Capital
Balance at beginning of year 830 661 274 Stock-based compensation 72 169 387 Balance at end of year 902 830 661
Unearned ESOP SharesBalance at beginning of year - (1) (12)Shares allocated to ESOP participants - 1 11Balance at end of year - - (1)
Retained EarningsBalance at beginning of year 16,987 14,719 11,527Net income 2,887 3,724 4,515Dividends declared on common stock (1,548) (1,438) (1,292)Other (32) (18) (31)Impact of the adoption of FIN No. 48 (290) - - Balance at end of year 18,004 16,987 14,719
Accumulated Other Comprehensive LossUnrealized Gains on Investments at beginning of year 42 11 41 Unrealized gains (losses) 29 31 (30) Balance at end of year 71 42 11Cumulative Translation Adjustments at beginning of year (12) (663) 301 Translation adjustments 735 651 (964) Balance at end of year 723 (12) (663)Minimum Pension Liability at beginning of year - (1,312) (1,357) Adjustments - 1,147 45 Balance at end of year, prior to Dec. 31, 2006 adoption of SFAS No. 158 - (165) (1,312) Reversal of Minimum Pension Liability under SFAS No. 158 - 165 - Recognition of prior service cost and net loss under SFAS No. 158 - (2,192) - Pension and Other Postretirement Benefit Plans at beginning of year (2,192) - - Net prior service cost (74) - - Net gain 1,277 - - Pension and Other Postretirement Benefit Plans at end of year (989) (2,192) - Accumulated Derivative Gain (Loss) at beginning of year (73) 15 38 Net hedging results 20 (127) 227 Reclassification to earnings 78 39 (250) Balance at end of year 25 (73) 15Total accumulated other comprehensive loss (170) (2,235) (1,949)
Treasury StockBalance at beginning of year (970) (559) (995)Purchases (1,455) (746) (68)Issuance to employees and employee plans 625 335 504Balance at end of year (1,800) (970) (559)
Net Stockholders' Equity 19,389$ 17,065$ 15,324$ See Notes to the Consolidated Financial Statements.
The Dow Chemical Company and SubsidiariesConsolidated Statements of Stockholders' Equity
60
(In millions) For the years ended December 31 2007 2006 2005Net Income Available for Common Stockholders 2,887$ 3,724$ 4,515$ Other Comprehensive Income (Loss), Net of Tax (tax amounts shown below
for 2007, 2006, 2005)Unrealized gains (losses) on investments: Unrealized holding gains (losses) during the period (net of tax of $42, $30, $(7)) 70 61 (21) Less: Reclassification adjustments for net amounts included in net income (net of tax of $(22), $(16), $(6)) (41) (30) (9)Cumulative translation adjustments (net of tax of $5, $(39), $(29)) 735 651 (964)Minimum pension liability adjustments (net of tax of $-, $657, $26) - 1,147 45Defined benefit pension plans: Prior service cost arising during period (net of tax of $(53)) (88) - - Net gain arising during period (net of tax of $630) 1,150 - - Less: Amortization of prior service cost included in net periodic pension costs (net of tax of $5) 14 - - Less: Amortization of net loss included in net periodic pension costs (net of tax of $67) 127 - - Net gains (losses) on cash flow hedging derivative instruments (net of tax of $14, $(39), $8) 98 (88) (23)Total other comprehensive income (loss) 2,065 1,741 (972)
Comprehensive Income 4,952$ 5,465$ 3,543$ See Notes to the Consolidated Financial Statements.
The Dow Chemical Company and SubsidiariesConsolidated Statements of Comprehensive Income
61
The Dow Chemical Company and Subsidiaries Notes to the Consolidated Financial Statements
62
Table of Contents Note Page
A Summary of Significant Accounting Policies and Recent Accounting Pronouncements 62 B Restructuring 67 C Acquisitions 72 D Inventories 74 E Property 74 F Nonconsolidated Affiliates and Related Company Transactions 75 G Goodwill and Other Intangible Assets 77 H Financial Instruments 79 I Supplementary Information 83 J Commitments and Contingent Liabilities 84 K Notes Payable, Long-Term Debt and Available Credit Facilities 90 L Pension Plans and Other Postretirement Benefits 92 M Leased Property and Variable Interest Entities 97 N Stock-Based Compensation 97 O Limited Partnership 102 P Preferred Securities of Subsidiaries 102 Q Stockholders’ Equity 102 R Income Taxes 103 S Operating Segments and Geographic Areas 106
NOTE A – SUMMARY OF SIGNIFICANT ACCOUNTING POLICIES AND RECENT ACCOUNTING PRONOUNCEMENTS SUMMARY OF SIGNIFICANT ACCOUNTING POLICIES Principles of Consolidation and Basis of Presentation The accompanying consolidated financial statements of The Dow Chemical Company and its subsidiaries (“Dow” or the “Company”) were prepared in accordance with accounting principles generally accepted in the United States of America (“U.S. GAAP”) and include the assets, liabilities, revenues and expenses of all majority-owned subsidiaries over which the Company exercises control and, when applicable, entities for which the Company has a controlling financial interest or is the primary beneficiary. Intercompany transactions and balances are eliminated in consolidation. Investments in nonconsolidated affiliates (20-50 percent owned companies, joint ventures and partnerships) are accounted for on the equity basis.
Certain reclassifications of prior years’ amounts have been made to conform to the presentation adopted for 2007. Use of Estimates in Financial Statement Preparation The preparation of financial statements in accordance with U.S. GAAP requires the use of estimates and assumptions that affect the reported amounts of assets and liabilities, the disclosure of contingent assets and liabilities at the date of the financial statements, and the reported amounts of revenues and expenses during the reporting period. The Company’s consolidated financial statements include amounts that are based on management’s best estimates and judgments. Actual results could differ from those estimates. Foreign Currency Translation The local currency has been primarily used as the functional currency throughout the world. Translation gains and losses of those operations that use local currency as the functional currency are included in the consolidated balance sheets as “Accumulated other comprehensive income (loss)” (“AOCI”). Where the U.S. dollar is used as the functional currency, foreign currency gains and losses are reflected in income.
The Dow Chemical Company and Subsidiaries Notes to the Consolidated Financial Statements
63
Environmental Matters Accruals for environmental matters are recorded when it is probable that a liability has been incurred and the amount of the liability can be reasonably estimated based on current law and existing technologies. These accruals are adjusted periodically as assessment and remediation efforts progress or as additional technical or legal information becomes available. Accruals for environmental liabilities are included in the consolidated balance sheets as “Other noncurrent obligations” at undiscounted amounts. Accruals for related insurance or other third-party recoveries for environmental liabilities are recorded when it is probable that a recovery will be realized and are included in the consolidated balance sheets as “Accounts and notes receivable - Other.”
Environmental costs are capitalized if the costs extend the life of the property, increase its capacity, and/or mitigate or prevent contamination from future operations. Environmental costs are also capitalized in recognition of legal asset retirement obligations resulting from the acquisition, construction and/or normal operation of a long-lived asset. Costs related to environmental contamination treatment and cleanup are charged to expense. Estimated future incremental operations, maintenance and management costs directly related to remediation are accrued when such costs are probable and reasonably estimable. Cash and Cash Equivalents Cash and cash equivalents include time deposits and readily marketable securities with original maturities of three months or less. Financial Instruments The Company calculates the fair value of financial instruments using quoted market prices whenever available. When quoted market prices are not available for various types of financial instruments (such as forwards, options and swaps), the Company uses standard pricing models with market-based inputs, which take into account the present value of estimated future cash flows.
The Company utilizes derivative instruments to manage exposures to currency exchange rates, commodity prices and interest rate risk. The fair values of all derivative instruments are recognized as assets or liabilities at the balance sheet date. Changes in the fair value of these instruments are reported in income or AOCI, depending on the use of the derivative and whether it qualifies for hedge accounting treatment under the provisions of Statement of Financial Accounting Standards (“SFAS”) No. 133, “Accounting for Derivative Instruments and Hedging Activities,” as amended and interpreted.
Gains and losses on derivative instruments that qualify as cash flow hedges are recorded in AOCI, to the extent the hedges are effective, until the underlying transactions are recognized in income. To the extent effective, gains and losses on derivative and nonderivative instruments used as hedges of the Company’s net investment in foreign operations are recorded in AOCI as part of the cumulative translation adjustment. The ineffective portions of cash flow hedges and hedges of net investment in foreign operations, if any, are recognized in income immediately.
Gains and losses on derivative instruments designated and qualifying as fair value hedging instruments, as well as the offsetting losses and gains on the hedged items, are reported in income in the same accounting period. Derivative instruments not designated as hedges are marked-to-market at the end of each accounting period with the results included in income. Inventories Inventories are stated at the lower of cost or market. On January 1, 2006, the Company began using normal capacity of production facilities (as defined by SFAS No. 151, “Inventory Costs - an amendment of ARB No. 43, Chapter 4”) to calculate per unit costs of inventories. Prior to 2006, the Company used nameplate capacity. By subsidiary, the method of determining cost varies among last-in, first-out (“LIFO”); first-in, first-out (“FIFO”); and average cost, and is used consistently from year to year. Property Land, buildings and equipment, including property under capital lease agreements, are carried at cost less accumulated depreciation. Depreciation is based on the estimated service lives of depreciable assets and is calculated using the straight-line method. For most assets capitalized through 1996, the declining balance method was used. Fully depreciated assets are retained in property and depreciation accounts until they are removed from service. In the case of disposals, assets and related depreciation are removed from the accounts, and the net amounts, less proceeds from disposal, are included in income.
The Dow Chemical Company and Subsidiaries Notes to the Consolidated Financial Statements
64
NOTE A – Summary of Significant Accounting Policies and Recent Accounting Pronouncements – Continued Impairment and Disposal of Long-Lived Assets The Company evaluates long-lived assets and certain identifiable intangible assets for impairment whenever events or changes in circumstances indicate that the carrying amount of an asset may not be recoverable. When undiscounted future cash flows are not expected to be sufficient to recover an asset’s carrying amount, the asset is written down to its fair value. Long-lived assets to be disposed of other than by sale are classified as held and used until they are disposed of. Long-lived assets to be disposed of by sale are classified as held for sale and are reported at the lower of carrying amount or fair value less cost to sell, and depreciation is ceased. Investments Investments in debt and marketable equity securities, including warrants, are classified as trading, available-for-sale, or held-to-maturity. Investments classified as trading are reported at fair value with unrealized gains and losses included in income. Those classified as available-for-sale are reported at fair value with unrealized gains and losses recorded in AOCI. Those classified as held-to-maturity are recorded at amortized cost. The cost of investments sold is determined by specific identification.
The excess of the cost of investments in subsidiaries over the values assigned to assets and liabilities is shown as goodwill and is subject to the impairment provisions of SFAS No. 142, “Goodwill and Other Intangible Assets.” Absent any impairment indicators, recorded goodwill is tested for impairment in conjunction with the annual planning and budgeting process by comparing the fair value of each reporting unit, determined using a discounted cash flow method, with its carrying value. Revenue Sales are recognized when the revenue is realized or realizable, and has been earned, in accordance with the U.S. Securities and Exchange Commission’s Staff Accounting Bulletin (“SAB”) No. 104, “Revenue Recognition in Financial Statements.” Approximately 98 percent of the Company’s sales are related to sales of product. The remaining 2 percent is related to the Company’s service offerings, insurance operations, and licensing of patents and technology. Revenue for product sales is recognized as risk and title to the product transfer to the customer, which usually occurs at the time shipment is made. Substantially all of the Company’s products are sold FOB (free on board) shipping point or, with respect to countries other than the United States, an equivalent basis. As such, title to the product passes when the product is delivered to the freight carrier. Dow’s standard terms of delivery are included in its contracts of sale, order confirmation documents and invoices. Freight costs and any directly related associated costs of transporting finished product to customers are recorded as “Cost of sales.”
The Company’s primary service offerings are in the form of contract manufacturing services and services associated with Dow AgroSciences’ termite solution, SENTRICON™ Termite Colony Elimination System. Revenue associated with these service offerings is recognized when services are rendered, according to contractual agreements.
Revenue related to the Company’s insurance operations includes third-party insurance premiums, which are earned over the terms of the related insurance policies and reinsurance contracts. Revenue related to the initial licensing of patents and technology is recognized when earned; revenue related to running royalties is recognized according to licensee production levels. Legal Costs The Company expenses legal costs, including those legal costs expected to be incurred in connection with a loss contingency, as incurred. Severance Costs The Company routinely reviews its operations around the world in an effort to ensure competitiveness across its businesses and geographic areas. When the reviews result in a workforce reduction related to the shutdown of facilities or other optimization activities, severance benefits are provided to employees primarily under Dow’s ongoing benefit arrangements. These severance costs are accrued (under SFAS No. 112, “Employers’ Accounting for Postemployment Benefits – an amendment of FASB Statements No. 5 and 43”) once management commits to a plan of termination including the number of employees to be terminated, their job classifications or functions, their location(s) and the expected completion date.
The Dow Chemical Company and Subsidiaries Notes to the Consolidated Financial Statements
65
Income Taxes The Company accounts for income taxes using the asset and liability method. Under this method, deferred tax assets and liabilities are recognized for the future tax consequences of temporary differences between the carrying amounts and tax bases of assets and liabilities using enacted rates.
Annual tax provisions include amounts considered sufficient to pay assessments that may result from examinations of prior year tax returns; however, the amount ultimately paid upon resolution of issues raised may differ from the amounts accrued.
The Company recognizes the financial statement effects of an uncertain income tax position when it is more likely than not, based on the technical merits, that the position will be sustained upon examination. The Company accrues for other tax contingencies when it is probable that a liability to a taxing authority has been incurred and the amount of the contingency can be reasonably estimated. The current portion of uncertain income tax positions is included in “Income taxes payable” and the long-term portion is included in “Other noncurrent obligations” in the consolidated balance sheets.
Provision is made for taxes on undistributed earnings of foreign subsidiaries and related companies to the extent that such earnings are not deemed to be permanently invested. Earnings per Common Share The calculation of earnings per common share is based on the weighted-average number of the Company’s common shares outstanding for the applicable period. The calculation for diluted earnings per common share reflects the effect of all potential dilutive common shares that were outstanding during the respective periods. RECENT ACCOUNTING PRONOUNCEMENTS Accounting for Uncertainty in Income Taxes In June 2006, the Financial Accounting Standards Board (“FASB”) issued FASB Interpretation (“FIN”) No. 48, “Accounting for Uncertainty in Income Taxes,” which clarifies the accounting for uncertainty in income taxes recognized in an enterprise’s financial statements in accordance with SFAS No. 109, “Accounting for Income Taxes.” The interpretation prescribes a recognition threshold and measurement attribute for the financial statement recognition and measurement of a tax position taken or expected to be taken in a tax return. The interpretation also provides guidance on derecognition, classification, interest and penalties, accounting in interim periods, disclosure, and transition. FIN No. 48 was effective for fiscal years beginning after December 15, 2006.
On January 1, 2007, the Company adopted the provisions of FIN No. 48. The cumulative effect of adoption was a $290 million reduction of retained earnings. See Note R for further information on income taxes.
Accounting for Stock-Based Compensation On January 1, 2006, the Company adopted revised SFAS No. 123 (“SFAS No. 123R”), “Share-Based Payment.” The fair value recognition provisions of SFAS No. 123, “Accounting for Stock-Based Compensation,” and SFAS No. 123R were materially consistent under the Company’s equity plans; therefore, adoption of this standard had an immaterial impact on the Company’s consolidated financial statements.
In November 2005, the FASB issued FASB Staff Position (“FSP”) No. 123R-3, “Transition Election Related to Accounting for the Tax Effects of Share-Based Payment Awards.” The FSP, which became effective in November 2005, required an entity to follow either the transition guidance for the additional-paid-in-capital pool as prescribed in SFAS No. 123R or the alternative transition method described in the FSP. An entity that adopted SFAS No. 123R using the modified prospective application may make a one-time election to adopt the transition method described in the FSP, and may take up to one year from the latter of its initial adoption of SFAS No. 123R or the effective date of the FSP to evaluate the available transition alternatives and make its one-time election. The Company adopted the alternative transition method provided in the FSP for calculating the tax effects of stock-based compensation under SFAS No. 123R.
See Note N for disclosures related to stock-based compensation. Accounting for Asset Retirement Obligations In March 2005, the FASB issued FIN No. 47, “Accounting for Conditional Asset Retirement Obligations,” which clarifies the term conditional asset retirement obligation as used in SFAS No. 143, “Accounting for Asset Retirement Obligations,” as a legal obligation to perform an asset retirement activity in which the timing and/or method of settlement are conditional on a future event that may or may not be within the control of the Company. FIN No. 47 was effective for the Company on December 31, 2005.
The Dow Chemical Company and Subsidiaries Notes to the Consolidated Financial Statements
66
NOTE A – Summary of Significant Accounting Policies and Recent Accounting Pronouncements – Continued
Dow has 150 manufacturing sites in 35 countries. Most of these sites contain numerous individual manufacturing operations, particularly at the Company’s larger sites. Asset retirement obligations are recorded in the period in which they are incurred and reasonably estimable, including those obligations for which the timing and/or method of settlement are conditional on a future event that may or may not be within the control of the Company. Retirement of assets may involve such efforts as remediation and treatment of asbestos, contractually required demolition, and other related activities, depending on the nature and location of the assets, and are typically realized only upon demolition of those facilities. In identifying asset retirement obligations, the Company considers identification of legally enforceable obligations, changes in existing law, estimates of potential settlement dates and the calculation of an appropriate discount rate to be used in calculating the fair value of the obligations. Dow has a well-established global process to identify, approve and track the demolition of retired or to-be-retired facilities; no assets are retired from service until this process has been followed. Dow typically forecasts demolition projects based on the usefulness of the assets; environmental, health and safety concerns; and other similar considerations. Under this process, as demolition projects are identified and approved, reasonable estimates may then be determined for the time frames during which any related asset retirement obligations are expected to be settled. For those assets where a range of potential settlement dates may be reasonably estimated, obligations are recorded.
Assets that have not been submitted/reviewed for potential demolition activities are considered to have continued usefulness and are generally still operating “normally.” Therefore, without a plan to demolish the assets or the expectation of a plan, such as shortening the useful life of assets for depreciation purposes under the requirements of SFAS No. 144, “Accounting for the Impairment or Disposal of Long-Lived Assets,” Dow is unable to reasonably forecast a time frame to use for present value calculations. As such, Dow has not recognized obligations for individual plants/buildings at its 150 manufacturing sites where estimates of potential settlement dates cannot be reasonably made. In addition, the Company has not recognized conditional asset retirement obligations for the capping of its approximately 45 underground storage wells at Dow-owned sites when there are no plans or expectations of plans to exit the sites. Dow routinely reviews all changes to the list of items under consideration for demolition to determine if an adjustment to the value of the asset retirement obligation is required.
Adoption of FIN No. 47 on December 31, 2005 resulted in the recognition of an asset retirement obligation of $34 million and a charge of $20 million (net of tax of $12 million), which was included in “Cumulative effect of change in accounting principle” in the fourth quarter of 2005. The discount rate used to calculate the Company’s asset retirement obligations was 4.6 percent.
If the amortization of asset retirement cost and accretion of asset retirement obligation provisions of FIN No. 47 had been in effect during 2005, the impact on “Income before Cumulative Effect of Change in Accounting Principle” and “Net Income Available for Common Stockholders” would have been immaterial. Further, the impact on earnings per common share (both basic and diluted) would have been less than $0.01.
See Note J for the Company’s disclosures related to asset retirement obligations. Other Accounting Pronouncements In November 2004, the FASB issued SFAS No. 151, “Inventory Costs – an amendment of ARB No. 43, Chapter 4,” which clarifies the accounting for abnormal amounts of idle facility expense, freight, handling costs, and wasted material (spoilage) and also requires that the allocation of fixed production overhead be based on the normal capacity of the production facilities. SFAS No. 151 was effective for inventory costs incurred during fiscal years beginning after June 15, 2005. Because the Company previously used nameplate capacity to calculate product costs, the adoption of SFAS No. 151 on January 1, 2006 had an immaterial favorable impact on the Company’s consolidated financial statements.
In December 2004, the FASB issued FSP No. FAS 109-2, “Accounting and Disclosure Guidance for the Foreign Earnings Repatriation Provision within the American Jobs Creation Act of 2004,” which provides a practical exception to the SFAS No. 109 requirement to reflect the effect of a new tax law in the period of enactment by allowing additional time beyond the financial reporting period to evaluate the effects on plans for reinvestment or repatriation of unremitted foreign earnings. The American Jobs Creation Act of 2004 (the “AJCA”) introduced a special one-time dividends received deduction on the repatriation of certain foreign earnings to a U.S. taxpayer, provided certain criteria are met. In May 2005, tax authorities released the clarifying language necessary to enable the Company to finalize its plan for the repatriation and reinvestment of foreign earnings subject to the requirements of the AJCA, resulting in a credit of $113 million to “Provision for income taxes” in the second quarter of 2005.
In September 2006, the FASB issued SFAS No. 158, “Employers’ Accounting for Defined Benefit Pension and Other Postretirement Plans - an amendment of FASB Statements No. 87, 88, 106, and 132(R).” The Statement, which was effective December 31, 2006 for the Company, required employers to recognize the funded status of defined benefit postretirement plans as an asset or liability on the balance sheet and to recognize changes in that funded status through comprehensive income. See Note L for the impact of adopting the Statement.
The Dow Chemical Company and Subsidiaries Notes to the Consolidated Financial Statements
67
SAB No. 74 Disclosures for Accounting Standards Issued But Not Yet Adopted In September 2006, the FASB issued SFAS No. 157, “Fair Value Measurements,” which defines fair value, establishes a framework for measuring fair value in U.S. GAAP, and expands disclosures about fair value measurements. The Statement applies under other accounting pronouncements that require or permit fair value measurements and is effective for fiscal years beginning after November 15, 2007. The Company’s existing fair value measurements are consistent with the guidance of the Statement. Therefore, adoption of the Statement on January 1, 2008, is not expected to have a material impact on the Company’s consolidated financial statements in the first quarter of 2008. Since the Company uses a December 31 measurement date for its pension and other postretirement plans, the Company is still evaluating the impact of adopting the Statement for its plan assets.
In February 2007, the FASB issued SFAS No. 159, “The Fair Value Option for Financial Assets and Financial Liabilities - Including an amendment of FASB Statement No. 115,” which permits entities to choose to measure many financial instruments and certain other items at fair value. SFAS No. 159 is effective as of the beginning of an entity’s first fiscal year that begins after November 15, 2007, which was January 1, 2008 for the Company. The Company did not elect the fair value option for existing eligible items under SFAS No. 159; therefore, the Statement had no impact on the Company’s consolidated financial statements at January 1, 2008.
In April 2007, the FASB issued FSP No. FIN 39-1, “Amendment of FASB Interpretation No. 39.” This FSP replaces certain terms in FIN No. 39 with “derivative instruments” (as defined in SFAS No. 133, “Accounting for Derivative Instruments and Hedging Activities”) and permits the offsetting of fair value amounts recognized for the right to reclaim cash collateral or the obligation to return cash collateral against fair value amounts recognized for derivative instruments executed with the same counterparty under the same master netting arrangement. The FSP is effective for fiscal years beginning after November 15, 2007. The Company evaluated the guidance in the FSP and determined that it will have no impact on the Company’s consolidated financial statements at January 1, 2008.
In December 2007, the FASB issued SFAS No. 141R, “Business Combinations”. The Statement establishes revised principles and requirements for how the Company will recognize and measure assets and liabilities acquired in a business combination. The Statement is effective for business combinations completed on or after the beginning of the first annual reporting period beginning on or after December 15, 2008, which begins January 1, 2009 for the Company.
In December 2007, the FASB issued SFAS No. 160, “Noncontrolling Interests in Consolidated Financial Statements, an amendment of ARB No. 51”. The Statement establishes accounting and reporting standards for the noncontrolling interest in a subsidiary and for the deconsolidation of a subsidiary. The Statement is effective on or after the beginning of the first annual reporting period beginning on or after December 15, 2008, which begins January 1, 2009 for the Company. The Company is currently evaluating the impact of adopting the Statement. NOTE B – RESTRUCTURING 2007 Restructuring On December 3, 2007, the Company’s Board of Directors approved a restructuring plan that includes the shutdown of a number of assets and organizational changes within targeted support functions to improve the efficiency and cost effectiveness of the Company’s global operations. As a result of these shutdowns and organizational changes, which are scheduled to be completed by the end of 2009, the Company recorded pretax restructuring charges totaling $590 million in the fourth quarter of 2007. The charges consisted of asset write-downs and write-offs of $422 million, costs associated with exit or disposal activities of $82 million and severance costs of $86 million. The impact of the charges is shown as “Restructuring charges” in the consolidated statements of income and was reflected in the Company’s segment results as shown in the following table, which also reflects adjustments made in 2007 to the 2006 restructuring charges, as discussed in the section titled “2006 Restructuring”:
The Dow Chemical Company and Subsidiaries Notes to the Consolidated Financial Statements
68
NOTE B – Restructuring – Continued
2007 Restructuring Charges by Operating Segment
In millions
Impairment of Long-Lived Assets,
Other Intangible Assets and Equity
Investments
Costs associated with Exit or
Disposal Activities Severance
Costs Total Performance Plastics $153 $31 - $184 Performance Chemicals 81 4 - 85 Agricultural Sciences 58 19 - 77 Basic Plastics 88 - - 88 Basic Chemicals 7 - - 7 Hydrocarbons and Energy 31 13 - 44 Unallocated and Other 4 15 $86 105 Total restructuring charges related
to 2007 plan $422 $82 $86 $590 Adjustments to 2006 restructuring
charges:
Performance Plastics - (4) - (4) Unallocated and Other - - (8) (8)
Net 2007 Restructuring Charges $422 $78 $78 $578 Details regarding the components of the 2007 restructuring charges are discussed below: Impairment of Long-Lived Assets, Other Intangible Assets and Equity Investments The restructuring charges related to the write-down or write-off of assets and equity investments in 2007 totaled $422 million and included the impact of plant closures and impairments of $273 million. The most significant plant write-downs affected Dow’s facilities located in Lauterbourg, France; Camaçari, Brazil; Aratu, Brazil; Tarragona, Spain; Hahnville, Louisiana; and Berre, France; and assets related to the exit of the automotive sealants business in North America, Latin America and Asia Pacific. Details regarding these write-downs are as follows:
• Due to overcapacity within the industry, a disadvantaged cost position, and increasing pressure from generic suppliers, the Company launched an information/consultation process with local employee representatives on a closure project in the fourth quarter of 2007 and recorded an asset impairment charge related to its agricultural products manufacturing site located in Lauterbourg, France. A $44 million write-down of the net book value of the related buildings, machinery and equipment against the Agricultural Sciences segment was recorded in the fourth quarter of 2007.
• The Company evaluated the economic and financial feasibility of its styrene plant in Camaçari, Brazil, and due to raw material competitiveness, the age of the facility, as well as the ready availability of styrene within the global marketplace, the Company announced the idling of the facility in the fourth quarter of 2007 and recorded a $14 million write-down of the net book value of the related buildings, machinery and equipment against the Hydrocarbons and Energy segment.
• The Company will close its hydroxyethyl cellulose manufacturing facility located in Aratu, Brazil, in the first quarter of 2008, due to a number of factors, including capacity limitations, high structural and raw material costs, and older technology. A $12 million write-down of the net book value of the related buildings, machinery and equipment was recorded against the Performance Chemicals segment in the fourth quarter of 2007.
• The Company has determined that the operating costs of its fiber solution manufacturing plant in Tarragona, Spain, cannot be sustained. The Company will evaluate more economically viable alternative manufacturing options. As a result, the Company recorded a $29 million impairment write-down of the net book value of the related buildings, machinery and equipment against the Performance Plastics segment in the fourth quarter of 2007.
The Dow Chemical Company and Subsidiaries Notes to the Consolidated Financial Statements
69
• Due to a number of factors, including the inability to secure an economically sustainable source of propylene and the use of older technologies at the plant, Union Carbide decided in the fourth quarter of 2007 to shut down its polypropylene facility at St. Charles Operations in Hahnville, Louisiana. As a result of the shutdown, a $23 million write-down of the net book value of the related buildings, machinery and equipment was recorded against the Basic Plastics segment in the fourth quarter of 2007.
• The Company determined that it would not be possible to renegotiate an economically viable contract manufacturing agreement to continue the operations of the rubber plant located in Berre, France. A $27 million impairment write-down of the net book value of the related buildings, machinery and equipment was recorded against the Performance Plastics segment in the fourth quarter of 2007.
• The Company has assessed the long-term profitability of its participation in the automotive sealants business and has determined that the projected results are inconsistent with the financial performance expected of a market-facing business. As a result, in the fourth quarter of 2007, the Company made the decision to exit the automotive sealants business in North America, Asia Pacific and Latin America in the next 9 to 18 months; the business will explore strategic options within Europe. A $58 million write-down of the net book value of the related buildings, machinery and equipment against the Performance Plastics segment was recorded in the fourth quarter of 2007.
In addition to the write-downs described above, the restructuring charges for plant closures included $66 million related to the shutdown of several small production facilities and the closure of certain storage wells in Canada.
The restructuring charges in the fourth quarter of 2007 also included the write-down of investments in nonconsolidated affiliates of $99 million. The most significant write-downs were related to the Company’s investment in Pétromont and Company, Limited Partnership (“Pétromont”) and Dow Reichhold Specialty Latex LLC. Details regarding these write-downs are as follows:
• Due to an unfavorable financial outlook, reflecting significant long-term economic challenges, the Company determined in the fourth quarter of 2007 that its equity investment in Pétromont, a 50 percent owned company, was other than temporarily impaired and recorded a $46 million write-down of its interest in Pétromont against the Basic Plastics segment.
• Due to the loss of a significant portion of business and the lack of replacement business opportunities, the Company determined its equity investment in Dow Reichold Specialty Latex LLC, a 50 percent owned company to be other than temporarily impaired and recorded a $42 million write-down of its interest in Dow Reichhold Specialty Latex LLC against the Performance Chemicals segment in the fourth quarter of 2007.
In addition to the write-downs described above, the restructuring charges for investments in nonconsolidated affiliates included $11 million related to the dissolution of two smaller joint ventures.
The restructuring charges in the fourth quarter of 2007 also included the write-off of capital project spending ($37 million), and trademarks and patents ($2 million) which the Company determined to be of no further value; as well as spare parts and catalysts ($11 million) associated with the plant closures. These write-offs were principally related to the businesses involved in the shutdown of assets and were therefore reflected in the results of various operating segments. Costs Associated with Exit or Disposal Activities The restructuring charges for costs associated with exit or disposal activities totaled $82 million in 2007 and included contract termination fees of $53 million, pension curtailment costs and termination benefits of $15 million, environmental remediation of $7 million and $7 million of other related costs.
Contract termination fees of $53 million represent the Company’s best estimate of the fair value to negotiate the settlement of the early cancellation of several service and supply agreements principally related to the shutdown of manufacturing assets within the Performance Plastics and Agricultural Sciences segments. Severance Costs As a result of the Company’s decision to shut down assets around the world, and complete other workforce optimization activities, the restructuring charges recorded in 2007 included severance of $86 million for the separation of approximately 978 employees under the terms of Dow’s ongoing benefit arrangements, primarily over the next two years. These costs were charged against Unallocated and Other. At December 31, 2007, severance of approximately $1 million had been paid to 12 employees and a liability of $85 million remained for approximately 966 employees.
The Dow Chemical Company and Subsidiaries Notes to the Consolidated Financial Statements
70
NOTE B – Restructuring – Continued The following table summarizes the activities related to the Company’s restructuring reserve:
2007 Restructuring Activities In millions
Impairment of Long-Lived Assets,
Other Intangible Assets and Equity
Investments
Costs associated with Exit or Disposal
Activities Severance
Costs TotalRestructuring charges incurred in
the fourth quarter of 2007 $ 422 $82 $86 $ 590 Cash payments - - (1) (1)Charges against reserve (422) (3) - (425)Reserve balance at December 31, 2007 - $79 $85 $ 164
Dow expects to incur future costs related to its restructuring activities, as the Company continually looks for ways to
enhance the efficiency and cost effectiveness of its operations, and to ensure competitiveness across its businesses and across geographic areas. Future costs are expected to include demolition costs related to the closed facilities, which will be recognized as incurred. The Company also expects to incur additional employee-related costs, including involuntary termination benefits, related to its other optimization activities, and pension plan settlement costs. These costs cannot be reasonably estimated at this time. 2006 Restructuring On August 29, 2006, the Company’s Board of Directors approved a plan to shut down a number of assets around the world as the Company continued its drive to improve the competitiveness of its global operations. As a consequence of these shutdowns, which are scheduled to be completed by the first quarter of 2009, and other optimization activities, the Company recorded pretax restructuring charges totaling $591 million in 2006. The charges consisted of asset write-downs and write-offs of $346 million, costs associated with exit or disposal activities of $172 million and severance costs of $73 million. The impact of the charges is shown as “Restructuring charges” in the consolidated statements of income and was reflected in the Company’s segment results as follows: 2006 Restructuring Charges by Operating Segment
In millions
Impairment of Long-Lived Assets
and Other Intangible Assets
Costs associated with Exit or Disposal
Activities Severance
Costs Total Performance Plastics $174 $ 68 - $242 Performance Chemicals 10 2 - 12 Basic Plastics 15 1 - 16 Basic Chemicals 129 55 - 184 Unallocated and Other 18 46 $73 137 Total $346 $172 $73 $591
Details regarding the components of the restructuring charges are discussed below: Impairment of Long-Lived Assets and Other Intangible Assets The restructuring charges related to the write-down or write-off of assets in 2006 totaled $346 million and included the impact of plant closures of $269 million. The most significant plant closures affected Dow’s facilities in Porto Marghera, Italy, and Fort Saskatchewan, Alberta, and Sarnia, Ontario, Canada. Details regarding these shutdowns are as follows: • In Porto Marghera, Italy, the Company’s toluene diisocyanate (“TDI”) plant was shut down for planned maintenance
in early August 2006. Business fundamentals in the TDI business were weak due to excess global capacity. As a result, the Company decided to permanently close the facility at the end of August, resulting in a $115 million write-down of the net book value of the related buildings, machinery and equipment against the Performance Plastics segment in the third quarter of 2006.
The Dow Chemical Company and Subsidiaries Notes to the Consolidated Financial Statements
71
• Substantial capital costs would be required to address efficiency issues at the Company’s chlor-alkali and direct chlorination ethylene dichloride plants in Fort Saskatchewan, Alberta, Canada. Based on an analysis of the discounted future cash flows, management determined that an investment in these facilities could not be justified. As a result, the Company shut down the facilities at the end of October 2006, resulting in a $74 million write-down of the net book value of the related buildings, machinery and equipment against the Basic Chemicals segment in the third quarter of 2006.
• Assessments by the businesses located in Sarnia, Ontario, Canada, were triggered by the suspension of ethylene shipments through the Cochin Pipeline, a subsidiary of BP Canada Energy Resources Company, due to safety concerns. The assessments highlighted a variety of issues related to the effectiveness, efficiency and long-term sustainability of the Sarnia-based assets. Based on these assessments, the Company decided to cease all production activity at the Sarnia site by the end of the first quarter of 2009 as follows:
• The low density polyethylene plant was shut down in the third quarter of 2006. • The polystyrene plant ceased production in December 2006. • Latex production from the UCAR Emulsion Systems facility was shut down in the fourth quarter of 2007. • The polyols plant is expected to be shut down in the first quarter of 2009.
The closure of manufacturing plants in 2006 resulted in a $24 million write-down of the net book value of the machinery and equipment in the third quarter of 2006 (with $11 million reflected in Performance Plastics, $10 million in Basic Plastics, and $3 million in Unallocated and Other).
In addition to the larger shutdowns described above, the restructuring charges for plant closures included $56 million
related to the shutdown of several small production facilities, a terminal, and a research and development facility. The restructuring charges in the third quarter of 2006 also included the write-off of capital project spending ($47 million)
and technology assets ($18 million) which the Company determined to be of no further value, as well as spare parts and catalysts ($12 million) associated with the plant closures. These write-offs were principally related to the businesses involved in the shutdown of assets and were therefore reflected in the results of various operating segments. Costs Associated with Exit or Disposal Activities The restructuring charges for costs associated with exit or disposal activities totaled $172 million in 2006 and included contract termination fees of $65 million, environmental remediation of $60 million, pension curtailment costs and termination benefits of $33 million, and asbestos abatement of $14 million.
Contract termination fees of $65 million represented the Company’s best estimate of the fair value to negotiate the settlement of the early cancellation of several supply agreements principally related to the shutdown of manufacturing assets primarily within the Performance Plastics segment. In the second quarter of 2007, the Company reached agreements with certain suppliers regarding the early cancellation of supply agreements, resulting in a $4 million reduction of the restructuring reserve for contract termination fees. The adjustment was credited against the Performance Plastics segment.
The restructuring charges for environmental remediation of $60 million and asbestos abatement of $14 million principally related to the shutdown of the Company’s facilities in Canada. The charges were therefore reflected in various operating segments.
According to the restructuring plan for Canada, the chlor-alkali and direct chlorination ethylene dichloride plants in Fort Saskatchewan were shut down at the end of October 2006; the Sarnia site will cease all production by the end of the first quarter of 2009. As such, for purposes of calculating the Company’s obligation associated with Dow’s defined benefit plans in Canada, the expected years of future service of active employees has been significantly reduced. In addition, the Company is obligated to provide certain termination benefits. As a result, the restructuring charge included pension curtailment costs and termination benefits of $33 million in 2006. These costs were reflected in Unallocated and Other. Severance Costs As a result of the Company’s plans to shut down assets around the world, and conduct other optimization activities principally in Europe, the restructuring charges recorded in 2006 included severance of $73 million for the separation of approximately 810 employees under the terms of Dow’s ongoing benefit arrangements, primarily over two years. These costs were charged against Unallocated and Other. At December 31, 2006, severance of $4 million had been paid to 115 employees and a liability of $69 million remained for approximately 695 employees. During 2007, severance of $25 million was paid to 245 employees, bringing the total payments against the program to $29 million paid to 360 employees. In the fourth quarter of 2007, a reduction of $8 million was recorded against the estimated program costs. At December 31, 2007, a liability of $39 million (including foreign currency impact) remained for approximately 410 employees.
The Dow Chemical Company and Subsidiaries Notes to the Consolidated Financial Statements
72
NOTE B – Restructuring – Continued The following table summarizes the activities related to the Company’s restructuring reserve:
2006 Restructuring Activities In millions
Impairment of Long-Lived Assets
and Other Intangible Assets
Costs associated with Exit or Disposal
Activities Severance
Costs TotalRestructuring charges incurred in
the third quarter of 2006 $ 327 $171 $ 81 $ 579 Adjustments to reserve 19 1 (8) 12 Cash payments - (1) (4) (5)Charges against reserve (346) - - (346)Reserve balance at December 31, 2006 - $171 $ 69 $ 240 Adjustments to reserve - (4) (8) (12)Cash payments - (53) (25) (78)Foreign currency impact - 21 3 24 Reserve balance at December 31, 2007 - $135 $ 39 $ 174
2005 Restructuring In the fourth quarter of 2005, the Company recorded pretax charges totaling $114 million related to restructuring activities, as the Company continued to focus on financial discipline and made additional decisions regarding noncompetitive and underperforming assets, as well as decisions regarding the consolidation of manufacturing capabilities. The charges included costs of $67 million related to the closure of approximately 20 small plants around the world, losses of $12 million on asset sales, the write-off of an intangible asset of $10 million and employee-related expenses of $25 million (paid to 197 employees in the fourth quarter of 2005). The total of these charges is shown as “Restructuring charges” in the consolidated statements of income. The charges were recorded against the Company’s operating segments as follows: $28 million against Performance Plastics, $14 million against Performance Chemicals, $9 million against Agricultural Sciences, $12 million against Basic Plastics and $3 million against Basic Chemicals. Charges to Unallocated and Other amounted to $48 million. NOTE C – ACQUISITIONS Acquisition of Wolff Walsrode Consistent with the Company’s strategy to invest in its Performance businesses, the Company announced on December 18, 2006, that it had reached an agreement with the Bayer Group to acquire Wolff Walsrode AG and certain related affiliates and assets (“Wolff Walsrode”), subject to regulatory approval. Wolff Walsrode, headquartered in Bomlitz, Germany, specializes in cellulose derivatives, food casings and site services. Following approval from the European Commission on June 20, 2007, Dow acquired Wolff Walsrode on June 30, 2007 for a cash purchase price of approximately $603 million.
On July 2, 2007, the Company announced the creation of a new specialty business unit, Dow Wolff Cellulosics, which combined the newly acquired Wolff Walsrode with Dow’s Water Soluble Polymers business. Dow Wolff Cellulosics will encompass cellulosics and related chemistries, providing application formulation expertise and other technical services to a broad range of strategic industry sectors, including construction, paint, personal care, pharmaceuticals, food and a number of specialty industrial applications.
The Dow Chemical Company and Subsidiaries Notes to the Consolidated Financial Statements
73
The following table summarizes the values of the assets acquired and liabilities assumed at the date of the acquisition, as well as adjustments that have been made primarily as a result of final valuations.
Assets Acquired and Liabilities Assumed In millions
(1) Includes a $7 million write-off of purchased in-process research and development, the addition of transaction costs of $7 million in the second half of 2007 and $12 million of working capital adjustments.
(2) See Note G for additional information. The Company evaluated the materiality of assets acquired, liabilities assumed and results of operations, individually and
in the aggregate, and concluded that such assets, liabilities and results of operations were not material to the consolidated financial statements.
Beginning in the third quarter of 2007, the results of Wolff Walsrode’s operations were reflected in the Company’s consolidated income statement. Purchased In-Process Research and Development Purchased in-process research and development (“IPR&D”) represents the value assigned in a business combination to acquired research and development projects that, as of the date of the acquisition, had not established technological feasibility and had no alternative future use. Amounts assigned to IPR&D meeting these criteria must be charged to expense as part of the allocation of the purchase price of the business combination.
The Company recorded pretax charges totaling $57 million in 2007 for IPR&D projects associated with several recent acquisitions. The estimated values assigned to the IPR&D projects were determined primarily based on a discounted cash flow model and are shown below:
In-Process Research and Development Projects Acquired In millions Date of Acquisition
Estimated Value Assigned
to IPR&D Germplasm from Maize Technologies International May 1, 2007 $ 2 Manufacturing process R&D from Wolff Walsrode June 30, 2007 7 Germplasm from Agromen Tecnologia Ltda. August 1, 2007 26 Germplasm from Duo Maize August 30, 2007 3 Intellectual property for crop trait discovery from Exelixis
Plant Sciences September 4, 2007 19 Total $57
The 2007 charges were shown as “Purchased in-process research and development charges” in the consolidated
statements of income. IPR&D of $50 million related to projects within the Agricultural Sciences segment. The $7 million charge related to IPR&D acquired from Wolff Walsrode impacted the results of the Performance Chemicals segment.
The Dow Chemical Company and Subsidiaries Notes to the Consolidated Financial Statements
74
NOTE D – INVENTORIES The following table provides a breakdown of inventories:
Inventories at December 31 In millions 2007 2006 Finished goods $4,085 $3,498 Work in process 1,595 1,319 Raw materials 566 672 Supplies 639 569 Total inventories $6,885 $6,058
The reserves reducing inventories from a FIFO basis to a LIFO basis amounted to $1,511 million at December 31, 2007
and $1,092 million at December 31, 2006. Inventories valued on a LIFO basis, principally hydrocarbon and U.S. chemicals and plastics product inventories, represented 34 percent of the total inventories at December 31, 2007 and 38 percent of total inventories at December 31, 2006.
A reduction of certain inventories resulted in the liquidation of some of the Company’s LIFO inventory layers, increasing pretax income $321 million in 2007, $97 million in 2006 and $110 million in 2005. NOTE E – PROPERTY
Property at December 31 Estimated
In millions Useful Lives
(Years)
2007
2006 Land - $ 602 $ 582 Land and waterway improvements 15-25 1,286 1,206 Buildings 5-55 3,717 3,376 Machinery and equipment 3-20 36,266 33,457 Utility and supply lines 5-20 2,253 2,133 Other property 3-30 1,770 1,982 Construction in progress - 1,814 1,645 Total property $47,708 $44,381
In millions 2007 2006 2005 Depreciation expense $1,959 $1,904 $1,904 Manufacturing maintenance and repair costs $1,482 $1,376 $1,289 Capitalized interest $85 $73 $56
The Dow Chemical Company and Subsidiaries Notes to the Consolidated Financial Statements
75
NOTE F – NONCONSOLIDATED AFFILIATES AND RELATED COMPANY TRANSACTIONS The Company’s investments in related companies accounted for by the equity method (“nonconsolidated affiliates”) were $3,089 million at December 31, 2007 and $2,735 million at December 31, 2006. At December 31, 2007, the carrying amount of the Company’s investments in nonconsolidated affiliates was $64 million more than its share of the investees’ net assets, exclusive of Dow Corning Corporation (“Dow Corning”), MEGlobal, Equipolymers and EQUATE Petrochemical Company K.S.C. (“EQUATE”), which are discussed separately below. This difference was $65 million at December 31, 2006. Dividends received from the Company’s nonconsolidated affiliates were $774 million in 2007, $616 million in 2006 and $495 million in 2005.
On May 15, 1995, Dow Corning, in which the Company is a 50 percent shareholder, voluntarily filed for protection under Chapter 11 of the U.S. Bankruptcy Code (see Note J). As a result, the Company fully reserved its investment in Dow Corning and reserved its 50 percent share of equity earnings from that time through the third quarter of 2000. A difference between the Company’s 50 percent share of the underlying equity of Dow Corning and the carrying value of this investment has existed since May 1995. In November 2000, following affirmation of the Bankruptcy Court’s order confirming the Joint Plan of Reorganization (the “Joint Plan”), the Company reviewed the value of its investment in Dow Corning, revised its assessment of the recoverability of its investment, and determined that it had adequately provided for the other-than-temporary decline associated with the bankruptcy. On June 1, 2004, Dow Corning’s Joint Plan became effective and Dow Corning emerged from bankruptcy. The Company considers the difference between the carrying value of its investment in Dow Corning and its 50 percent share of Dow Corning’s equity to be permanent. The difference was $227 million at December 31, 2007 and December 31, 2006.
At December 31, 2007, the Company’s investment in MEGlobal was $274 million less than the Company’s proportionate share of MEGlobal’s underlying net assets ($281 million less at December 31, 2006). This amount represents the difference between the value of certain assets of the joint venture and the Company’s related valuation on a U.S. GAAP basis, of which $84 million is being amortized over the remaining useful lives of the assets and $190 million represents the Company’s share of the joint venture’s goodwill.
At December 31, 2007, the Company’s investment in Equipolymers was $48 million less than the Company’s proportionate share of Equipolymers’ underlying net assets ($49 million less at December 31, 2006). This amount represents the difference between the value of certain assets of the joint venture and the Company’s related valuation on a U.S. GAAP basis, of which $11 million is being amortized over the remaining useful lives of the assets and $37 million represents the Company’s share of the joint venture’s goodwill.
At December 31, 2007, the Company’s investment in EQUATE equaled its proportionate share of the underlying net assets (and was $17 million less at December 31, 2006). The $17 million difference at December 31, 2006 represented the difference between EQUATE’s value of certain assets and the Company’s related valuation on a U.S. GAAP basis and was fully amortized in 2007.
In November 2004, Union Carbide Corporation (“Union Carbide”) sold a 2.5 percent interest in EQUATE to National Bank of Kuwait for $104 million. In March 2005, these shares were sold to private Kuwaiti investors thereby completing the restricted transfer and reducing Union Carbide’s ownership interest from 45 percent to 42.5 percent. A pretax gain of $70 million was recorded in the first quarter of 2005 related to the sale of these shares.
On January 3, 2005, the Company and E.I. du Pont de Nemours and Company (“DuPont”) announced that the Company had exercised its option to acquire certain assets relating to ethylene elastomers and chlorinated elastomers from DuPont Dow Elastomers L.L.C. (“DDE”), including ENGAGE™, NORDEL™ and TYRIN™ elastomers, through an equity redemption transaction involving the Company’s equity interest in DDE. As a result of this option exercise, DuPont purchased the Company’s remaining equity interest in DDE for $87 million; the dissolution of the joint venture, which was completed on June 30, 2005, resulted in a pretax gain of $31 million in the second quarter of 2005. The Company decreased its investment in nonconsolidated affiliates and recorded $324 million in net property, $122 million in inventories, and $48 million in other net assets.
On November 30, 2005, Union Carbide completed the sale of its indirect 50 percent interest in UOP LLC (“UOP”) to a wholly owned subsidiary of Honeywell International, Inc. for a purchase price of $867 million, resulting in a pretax gain of $637 million in the fourth quarter of 2005.
All of the nonconsolidated affiliates in which the Company has investments are privately held companies; therefore, quoted market prices are not available.
The Dow Chemical Company and Subsidiaries Notes to the Consolidated Financial Statements
76
NOTE F – Nonconsolidated Affiliates and Related Company Transactions – Continued Principal Nonconsolidated Affiliates Dow’s principal nonconsolidated affiliates and the Company’s direct or indirect ownership interest for each at December 31, 2007, 2006 and 2005 are shown below:
Principal Nonconsolidated Affiliates at December 31 Ownership Interest 2007 2006 2005Compañía Mega S.A. 28% 28% 28%Dow Corning Corporation 50% 50% 50%EQUATE Petrochemical Company K.S.C. 42.5% 42.5% 42.5%Equipolymers 50% 50% 50%MEGlobal 50% 50% 50%The OPTIMAL Group of Companies:
OPTIMAL Chemicals (Malaysia) Sdn Bhd 50% 50% 50%OPTIMAL Glycols (Malaysia) Sdn Bhd 50% 50% 50%OPTIMAL Olefins (Malaysia) Sdn Bhd 23.75% 23.75% 23.75%
The SCG-Dow Group: Pacific Plastics (Thailand) Limited 49% 49% 49%Siam Polyethylene Company Limited 49% 49% 49%Siam Polystyrene Company Limited 49% 49% 49%Siam Styrene Monomer Co., Ltd. 49% 49% 49%Siam Synthetic Latex Company Limited 49% 49% 49%
Univation Technologies, LLC 50% 50% 50%
The Company’s investment in its principal nonconsolidated affiliates was $2,488 million at December 31, 2007 and $2,107 million at December 31, 2006. Equity earnings from these companies were $1,072 million in 2007, $883 million in 2006 and $893 million in 2005. The summarized financial information presented below represents the combined accounts (at 100 percent) of the principal nonconsolidated affiliates.
Summarized Balance Sheet Information at December 31 In millions 2007 2006 Current assets $ 6,943 $ 5,795 Noncurrent assets 9,669 7,574 Total assets $16,612 $13,369 Current liabilities $ 3,165 $ 2,505 Noncurrent liabilities 6,700 4,858 Total liabilities $ 9,865 $ 7,363
Summarized Income Statement Information In millions 2007 2006 2005(1) Sales $13,884 $11,916 $12,834 Gross profit $3,492 $3,168 $3,129 Net income $2,464 $1,960 $1,993 (1) The summarized income statement information for 2005 includes the results for
DDE from January 1, 2005 through June 30, 2005, and the results for UOP from January 1, 2005 through November 30, 2005. The Company has service agreements with some of these entities, including contracts to manage the operations of
manufacturing sites and the construction of new facilities; licensing and technology agreements; and marketing, sales, purchase and lease agreements.
The Dow Chemical Company and Subsidiaries Notes to the Consolidated Financial Statements
77
Excess ethylene glycol produced in Dow’s plants in the United States and Europe is sold to MEGlobal and represented 2 percent of total net sales in 2007, 2006 and 2005. In addition, the Company sells ethylene to MEGlobal as a raw material for its ethylene glycol plants in Canada. The impact of these sales to MEGlobal by operating segment is summarized below:
Impact of Sales to MEGlobal by Operating Segment Percent of segment sales 2007 2006 2005 Basic Chemicals 16% 15% 15% Hydrocarbons and Energy 4% 4% 4%
Overall, transactions with other nonconsolidated affiliates and balances due to and due from these entities were not
material to the consolidated financial statements. NOTE G – GOODWILL AND OTHER INTANGIBLE ASSETS The following table shows changes in the carrying amount of goodwill for the year ended December 31, 2007, by operating segment:
Goodwill In millions
Performance Plastics
Performance Chemicals
Agricultural Sciences
Basic Plastics
Hydrocarbons and Energy Total
Balance at January 1, 2007 $ 915 $850 $1,320 $ 94 $63 $3,242 Goodwill related to 2007
Adjustments to goodwill related to 2006 acquisition of Zhejiang Omex Environmental Engineering Co. LTD - (52) - - - (52)
Balance at December 31, 2007 $1,034 $995 $1,380 $100 $63 $3,572
On May 1, 2007, Dow Chemical Company Limited, a wholly owned subsidiary of the Company, acquired Hyperlast Limited, British Vita’s polyurethane systems business, for $151 million. The recording of the acquisition resulted in goodwill of $71 million and intangible assets of $62 million as shown below. None of the goodwill is expected to be deductible for tax purposes.
Hyperlast Limited Intangible Assets In millions
Gross Carrying Amount
Weighted-average Amortization
Period Intangible assets with finite lives:
Trademarks $10 15 years Other (customer-related) 52 14 years Total $62 14 years
The Dow Chemical Company and Subsidiaries Notes to the Consolidated Financial Statements
78
NOTE G – Goodwill and Other Intangible Assets – Continued
On June 30, 2007, the Company completed the acquisition of Wolff Walsrode. The recording of the acquisition resulted in goodwill of $201 million and intangible assets of $156 million as shown below. None of the goodwill is expected to be deductible for tax purposes. See Note C for additional information related to purchase price adjustments.
Wolff Walsrode Intangible Assets In millions
Estimated Gross Carrying
Amount
Weighted-average Amortization
Period Intangible assets with finite lives:
Intellectual property $ 46 10 years Trademarks 6 10 years Software 7 5 years Other (customer-related) 97 5 years Total $156 7 years On July 11, 2006, FilmTec Corporation, a wholly owned subsidiary of the Company, completed the acquisition of
Zhejiang Omex Environmental Engineering Co. LTD (“Omex”). The initial recording of the acquisition resulted in goodwill of $100 million, none of which is expected to be deductible for tax purposes. In the second quarter of 2007, the Company completed the purchase price allocation related to the acquisition of Omex, resulting in the recording of $51 million of intangible assets as follows:
Omex Intangible Assets In millions
Gross Carrying Amount
Weighted-average Amortization
Period Intangible assets with finite lives:
Trademarks $23 10 years Patents 19 17 years Other 9 2-5 years Total $51 11 years
On August 1, 2007, Dow AgroSciences acquired the corn seed business of Agromen Tecnologia Ltda for $116 million.
The recording of the acquisition resulted in goodwill of $59 million and intellectual property of $14 million with a weighted-average amortization period of six years. All of the goodwill is expected to be deductible for tax purposes.
Goodwill Impairments During the fourth quarter of 2007, the Company performed impairment tests for goodwill in conjunction with its annual long-term financial planning process. As a result of this review, it was determined that no goodwill impairments existed. Other Intangible Assets The following table provides information regarding the Company’s other intangible assets:
The Dow Chemical Company and Subsidiaries Notes to the Consolidated Financial Statements
79
During 2007, the Company acquired software for $31 million. The weighted-average amortization period for the acquired software is five years.
In 2006, the Company wrote off obsolete technology assets (from “Licenses and intellectual property” in the above table) with a net book value of $18 million in conjunction with other restructuring activities (see Note B). The write-off was included in “Restructuring charges” in the consolidated statements of income and reflected in the Performance Plastics segment ($15 million) and Unallocated and Other ($3 million).
In 2005, following a review of non-strategic and underperforming assets, the Company wrote off the $10 million net book value of other intangible assets received in a 1992 acquisition. The charge was included in “Restructuring charges” in Unallocated and Other.
The following table provides information regarding amortization expense:
Amortization Expense In millions 2007 2006 2005 Other intangible assets, excluding software $72 $50 $55 Software, included in “Cost of sales” $47 $45 $45
Total estimated amortization expense for the next five fiscal years is as follows:
Estimated Amortization Expense for Next Five Years In millions 2008 $130 2009 $121 2010 $118 2011 $107 2012 $77
NOTE H – FINANCIAL INSTRUMENTS Investments The Company’s investments in marketable securities are primarily classified as available-for-sale.
Investing Results In millions 2007 2006 2005 Proceeds from sales of available-for-sale securities $1,994 $1,305 $1,180 Gross realized gains $137 $55 $52 Gross realized losses $(23) $(42) $(19)
The following table summarizes the contractual maturities of the Company’s investments in debt securities:
Contractual Maturities of Debt Securities at December 31, 2007 In millions Amortized Cost Fair Value Within one year $ 168 $ 168 One to five years 415 424 Six to ten years 655 681 After ten years 262 280 Total $1,500 $1,553
The Dow Chemical Company and Subsidiaries Notes to the Consolidated Financial Statements
80
NOTE H – Financial Instruments – Continued
Fair Value of Financial Instruments at December 31 2007 2006 In millions Cost Gain Loss Fair Value Cost Gain Loss Fair Value Marketable securities (1):
(1) Included in “Marketable securities and interest-bearing deposits” and “Other investments” in the consolidated balance sheets. (2) Cost includes fair value adjustments per SFAS No. 133 of $26 million in 2007 and $(20) million in 2006.
Cost approximates fair value for all other financial instruments. The following tables provide the fair value and gross unrealized losses of the Company’s investments that were deemed
to be temporarily impaired at December 31, 2007 and 2006, aggregated by investment category and length of time that individual securities have been in a continuous unrealized loss position:
Temporarily Impaired Securities at December 31, 2007 Less than 12 months 12 months or more Total
In millions Fair
Value Unrealized
Losses Fair
Value Unrealized
Losses Fair
Value Unrealized
Losses Debt securities:
U.S. Treasury obligations and direct obligations of U.S. government agencies $ 14 - $ 6 - $ 20 -
Federal agency mortgage-backed securities - - 4 - 4 -
The Dow Chemical Company and Subsidiaries Notes to the Consolidated Financial Statements
81
Portfolio managers and external investment managers regularly review all of the Company’s holdings to determine if any investments are other-than-temporarily impaired. The analysis includes reviewing the amount of the temporary impairment, as well as the length of time it has been impaired. In addition, specific guidelines for each instrument type are followed to determine if an other-than-temporary impairment has occurred.
For debt securities, the credit rating of the issuer, current credit rating trends and the trends of the issuer’s overall sector are considered in determining impairment. As a matter of policy, the Company does not invest in debt securities that are below investment grade.
For equity securities, the Company’s investment guidelines require investment in Standard & Poor’s (“S&P”) 500 companies and allow investment in up to 25 companies outside of the S&P 500. These holdings are primarily large cap stocks and, therefore, the likelihood of them becoming other-than-temporarily impaired is not as high as with other less established companies. The Company has the ability and the intent to hold these investments until they provide an acceptable return.
The aggregate cost of the Company’s cost method investments totaled $102 million at December 31, 2007 and $80 million at December 31, 2006. Due to the nature of these investments, the fair market value for impairment testing is not readily determinable. These investments are reviewed for liquidation events. There were no material liquidation events or circumstances at December 31, 2007 that would result in an adjustment to the cost basis of these investments. Of the $80 million cost method investments at December 31, 2006, none were liquidated during 2007.
Risk Management The Company’s risk management program for interest rate, foreign currency and commodity risks is based on fundamental, mathematical and technical models that take into account the implicit cost of hedging. Risks created by derivative instruments and the mark-to-market valuations of positions are strictly monitored at all times, using value at risk and stress tests. Credit risk arising from these contracts is not significant because the counterparties to the contracts are primarily major international financial institutions and, to a lesser extent, major chemical and petroleum companies. The Company does not anticipate losses from credit risk, and the net cash requirements arising from risk management activities are not expected to be material in 2008. The Company reviews its overall financial strategies and impacts from using derivatives in its risk management program with the Company’s Executive Leadership Committee and the Board of Directors’ Audit Committee and revises its strategies as market conditions dictate.
In addition, the Company minimizes concentrations of credit risk through its global orientation in diverse businesses with a large number of diverse customers and suppliers. No significant concentration of credit risk existed at December 31, 2007. Interest Rate Risk Management The Company enters into various interest rate contracts with the objective of lowering funding costs or altering interest rate exposures related to fixed and variable rate obligations. In these contracts, the Company agrees with other parties to exchange, at specified intervals, the difference between fixed and floating interest amounts calculated on an agreed-upon notional principal amount. Foreign Currency Risk Management The Company’s global operations require active participation in foreign exchange markets. The Company enters into foreign exchange forward contracts and options, and cross-currency swaps to hedge various currency exposures or create desired exposures. Exposures primarily relate to assets, liabilities and bonds denominated in foreign currencies, as well as economic exposure, which is derived from the risk that currency fluctuations could affect the dollar value of future cash flows related to operating activities. The primary business objective of the activity is to optimize the U.S. dollar value of the Company’s assets, liabilities and future cash flows with respect to exchange rate fluctuations. Assets and liabilities denominated in the same foreign currency are netted, and only the net exposure is hedged. At December 31, 2007, the Company had forward contracts, options and cross-currency swaps to buy, sell or exchange foreign currencies. These contracts, options and cross-currency swaps had various expiration dates, primarily in the first quarter of 2008. Commodity Risk Management The Company has exposure to the prices of commodities in its procurement of certain raw materials. The primary purpose of commodity hedging activities is to manage the price volatility associated with these forecasted inventory purchases. At December 31, 2007, the Company had futures contracts, options and swaps to buy, sell or exchange commodities. These agreements had various expiration dates in 2008 and 2009.
The Dow Chemical Company and Subsidiaries Notes to the Consolidated Financial Statements
82
NOTE H – Financial Instruments – Continued Accounting for Derivative Instruments and Hedging Activities At December 31, 2007, the Company had no open interest rate swaps designated as fair value hedges of underlying fixed rate debt obligations. At December 31, 2006, the Company had interest rate swaps in a net loss position of $12 million designated as fair value hedges of underlying fixed rate debt obligations. These hedges had various expiration dates in 2007 through 2011. The mark-to-market effects of both the fair value hedge instruments and the underlying debt obligations were recorded as unrealized gains and losses in interest expense and are directly offsetting to the extent the hedges are effective. The effective portion of the mark-to-market effects of cash flow hedge instruments is recorded in “Accumulated other comprehensive income (loss)” (“AOCI”) until the underlying interest payment affects income. The net loss from previously terminated interest rate cash flow hedges included in AOCI at December 31, 2007 was $16 million after tax ($25 million after tax at December 31, 2006). The amount to be reclassified from AOCI to interest expense within the next 12 months is expected to be a net loss of $8 million after tax. The unrealized amounts in AOCI will fluctuate based on changes in the fair value of open contracts at the end of each reporting period. Interest rate cash flow hedges outstanding at December 31, 2007 were immaterial. During 2007, 2006 and 2005, there was no material impact on the consolidated financial statements due to interest rate hedge ineffectiveness. Net gains recorded in interest expense related to fair value hedge terminations were $10 million in 2007, $16 million in 2006 and $20 million in 2005. Unamortized losses relating to terminated fair value hedges were $26 million at December 31, 2007 and unamortized gains relating to terminated fair value hedges were $32 million at December 31, 2006. Net losses related to cash flow hedge terminations recorded in “Cost of sales” were $11 million in 2007, 2006 and 2005.
Commodity swaps, futures and option contracts with maturities of not more than 36 months are utilized and designated as cash flow hedges of forecasted commodity purchases. Current open contracts hedge forecasted transactions until December 2009. The effective portion of the mark-to-market effect of the cash flow hedge instrument is recorded in AOCI until the underlying commodity purchase affects income. The net gain from commodity hedges included in AOCI at December 31, 2007 was $48 million after tax ($36 million after tax loss at December 31, 2006). A net after-tax gain of approximately $31 million is expected to be reclassified from AOCI to “Cost of sales” in the consolidated statements of income within the next 12 months. The unrealized amounts in AOCI will fluctuate based on changes in the fair value of open contracts at the end of each reporting period. During 2007, 2006 and 2005, there was no material impact on the consolidated financial statements due to commodity hedge ineffectiveness.
In addition, the Company utilizes option and swap instruments that are effective as economic hedges of commodity price exposures, but do not meet the hedge accounting criteria of SFAS No. 133, “Accounting for Derivative Instruments and Hedging Activities,” as amended and interpreted. At December 31, 2007, the Company had derivative assets of $3 million and derivative liabilities of $6 million related to these instruments, with the related mark-to-market effects included in “Cost of sales” in the consolidated statements of income. At December 31, 2006, the Company had derivative assets of $1 million and derivative liabilities of $37 million related to these instruments.
At December 31, 2007, the Company had foreign currency forward contracts in a net loss position of $4 million ($2 million at December 31, 2006) designated as cash flow hedges of underlying forecasted purchases of feedstocks in Europe. Current open contracts hedge forecasted transactions until July 2008. The effective portion of the mark-to-market effects of the foreign currency forward contracts is recorded in AOCI until the underlying feedstock purchase affects income. The net loss from the foreign currency hedges included in AOCI at December 31, 2007 was $4 million after tax ($1 million after tax at December 31, 2006). A net after-tax loss of approximately $4 million is expected to be reclassified from AOCI to “Cost of sales” in the consolidated statements of income within the next 12 months. The unrealized amounts in AOCI will fluctuate based on changes in the fair value of open contracts at the end of each reporting period. During 2007, 2006 and 2005, there was no material impact on the consolidated financial statements due to foreign currency hedge ineffectiveness.
The results of hedges of the Company’s net investment in foreign operations included in the cumulative translation adjustment in AOCI was a net loss of $100 million after tax at December 31, 2007 ($174 million after tax at December 31, 2006). During 2007, 2006 and 2005, there was no material impact on the consolidated financial statements due to hedge ineffectiveness.
Derivative assets, excluding commodity and foreign exchange derivative assets expected to settle in 2008, are included in “Deferred charges and other assets” in the consolidated balance sheets; commodity derivative assets expected to settle in 2008 are included in “Accounts and notes receivable – Other.” Foreign exchange derivative liabilities are included in “Accounts payable – Other;” other derivative liabilities are included in “Accrued and other current liabilities.” The short-cut method under SFAS No. 133 is being used when the criteria are met. The Company anticipates volatility in AOCI and net income from its cash flow hedges. The amount of volatility varies with the level of derivative activities and market conditions during any period. The Company also uses other derivative instruments that are not designated as hedging instruments, primarily to manage foreign currency and interest rate exposure, the impact of which was not material to the consolidated financial statements.
The Dow Chemical Company and Subsidiaries Notes to the Consolidated Financial Statements
83
NOTE I – SUPPLEMENTARY INFORMATION Accrued and Other Current Liabilities “Accrued and other current liabilities” were $2,512 million at December 31, 2007 and $2,215 million at December 31, 2006. Accrued payroll, which is a component of “Accrued and other current liabilities,” was $704 million at December 31, 2007 and $435 million at December 31, 2006. No other component of accrued liabilities was more than 5 percent of total current liabilities.
Sundry Income – Net In millions 2007 2006 2005 Gain on sales of assets and securities (1) $171 $156 $806 Foreign exchange gain 73 21 20 Dividend income 9 6 7 Other – net (2) 71 (46) (78) Total sundry income – net $324 $137 $755 (1) 2005 included a gain of $637 million on the sale of Union Carbide’s indirect 50 percent interest
in UOP and a gain of $70 million on the sale of a 2.5 percent interest in EQUATE. (2) 2006 included the recognition of a loss contingency of $85 million related to a fine imposed by
the European Commission associated with synthetic rubber industry matters (see Note J for additional information). 2005 included a cash donation of $100 million to The Dow Chemical Company Foundation.
Other Supplementary Information In millions 2007 2006 2005 Cash payments for interest $671 $673 $788 Cash payments for income taxes $966 $1,390 $848 Provision for doubtful receivables (1) $2 $(20) $58 (1) Included in “Selling, general and administrative expenses” in the consolidated statements of
income.
Earnings Per Share Calculations 2007 2006 2005 In millions, except per share amounts Basic Diluted Basic Diluted Basic Diluted Income before cumulative effect of
change in accounting principle $2,887 $2,887 $3,724 $3,724 $4,535 $4,535 Cumulative effect of change in
accounting principle - - - - (20) (20)Net income available for common
stockholders $2,887 $2,887 $3,724 $3,724 $4,515 $4,515 Weighted-average common shares
outstanding 953.1 953.1 962.3 962.3 963.2 963.2 Add dilutive effect of stock options and
awards - 12.5 - 12.1 - 13.6 Weighted-average common shares for
EPS calculations 953.1 965.6 962.3 974.4 963.2 976.8 Earnings per common share before
cumulative effect of change in accounting principle $3.03 $2.99 $3.87 $3.82 $4.71 $4.64
Earnings per common share $3.03 $2.99 $3.87 $3.82 $4.69 $4.62 Stock options and deferred stock
(1) Outstanding options to purchase shares of common stock and deferred stock awards that were not included in the calculation of diluted earnings per share because the effect of including them would have been antidilutive.
The Dow Chemical Company and Subsidiaries Notes to the Consolidated Financial Statements
84
NOTE I – Supplementary Information – Continued Sales of Accounts Receivable Since 1997, the Company has routinely sold, without recourse, a participation in pools of qualifying trade accounts receivable. According to the agreements of the various programs, Dow maintains the servicing of these receivables. As receivables in the pools are collected, new receivables are added. The maximum amount of receivables available for sale in the pools was $2,324 million in 2007, $1,658 million in 2006 and $1,593 million in 2005. The average monthly participation in the pools was $271 million in 2007, $135 million in 2006 and $349 million in 2005.
The net cash flow in any given period represents the discount on sales, which is recorded as interest expense. The average monthly discount was not material in 2007, 2006 and 2005. NOTE J – COMMITMENTS AND CONTINGENT LIABILITIES Litigation Breast Implant Matters On May 15, 1995, Dow Corning Corporation (“Dow Corning”), in which the Company is a 50 percent shareholder, voluntarily filed for protection under Chapter 11 of the Bankruptcy Code to resolve litigation related to Dow Corning’s breast implant and other silicone medical products. On June 1, 2004, Dow Corning’s Joint Plan of Reorganization (the “Joint Plan”) became effective and Dow Corning emerged from bankruptcy. The Joint Plan contains release and injunction provisions resolving all tort claims brought against various entities, including the Company, involving Dow Corning’s breast implant and other silicone medical products.
To the extent not previously resolved in state court actions, cases involving Dow Corning’s breast implant and other silicone medical products filed against the Company were transferred to the U.S. District Court for the Eastern District of Michigan (the “District Court”) for resolution in the context of the Joint Plan. On October 6, 2005, all such cases then pending in the District Court against the Company were dismissed. Should cases involving Dow Corning’s breast implant and other silicone medical products be filed against the Company in the future, they will be accorded similar treatment. It is the opinion of the Company’s management that the possibility is remote that a resolution of all future cases will have a material adverse impact on the Company’s consolidated financial statements.
As part of the Joint Plan, Dow and Corning Incorporated have agreed to provide a credit facility to Dow Corning in an aggregate amount of $300 million. The Company’s share of the credit facility is $150 million and is subject to the terms and conditions stated in the Joint Plan. At December 31, 2007, no draws had been taken against the credit facility. DBCP Matters Numerous lawsuits have been brought against the Company and other chemical companies, both inside and outside of the United States, alleging that the manufacture, distribution or use of pesticides containing dibromochloropropane (“DBCP”) has caused personal injury and property damage, including contamination of groundwater. It is the opinion of the Company’s management that the possibility is remote that the resolution of such lawsuits will have a material adverse impact on the Company’s consolidated financial statements. Environmental Matters Accruals for environmental matters are recorded when it is probable that a liability has been incurred and the amount of the liability can be reasonably estimated, based on current law and existing technologies. At December 31, 2007, the Company had accrued obligations of $322 million for environmental remediation and restoration costs, including $28 million for the remediation of Superfund sites. This is management’s best estimate of the costs for remediation and restoration with respect to environmental matters for which the Company has accrued liabilities, although the ultimate cost with respect to these particular matters could range up to twice that amount. Inherent uncertainties exist in these estimates primarily due to unknown conditions, changing governmental regulations and legal standards regarding liability, and evolving technologies for handling site remediation and restoration. At December 31, 2006, the Company had accrued obligations of $347 million for environmental remediation and restoration costs, including $31 million for the remediation of Superfund sites.
The following table summarizes the activity in the Company’s accrued obligations for environmental matters for the years ended December 31, 2007 and 2006:
Accrued Obligations for Environmental Matters In millions 2007 2006 Balance at January 1 $ 347 $ 339 Additional accruals 113 130 Charges against reserve (152) (124)Adjustments to reserve 14 2 Balance at December 31 $ 322 $ 347
The Dow Chemical Company and Subsidiaries Notes to the Consolidated Financial Statements
85
The amounts charged to income on a pretax basis related to environmental remediation totaled $92 million in 2007, $125 million in 2006 and $79 million in 2005. Capital expenditures for environmental protection were $189 million in 2007, $193 million in 2006 and $150 million in 2005.
Midland Site Environmental Matters On June 12, 2003, the Michigan Department of Environmental Quality (“MDEQ”) issued a Hazardous Waste Operating License (the “License”) to the Company’s Midland, Michigan manufacturing site (the “Midland site”), which included provisions requiring the Company to conduct an investigation to determine the nature and extent of off-site contamination in Midland area soils; Tittabawassee and Saginaw River sediment and floodplain soils; and Saginaw Bay. The License required the Company, by August 11, 2003, to propose a detailed Scope of Work for the off-site investigation for the City of Midland and the Tittabawassee River and floodplain for review and approval by the MDEQ. Revised Scopes of Work were approved by the MDEQ on October 18, 2005. The Company was required to submit a Scope of Work for the investigation of the Saginaw River and Saginaw Bay by August 11, 2007. The Company submitted the Scope of Work for the Saginaw River and Saginaw Bay on July 13, 2007. The Company received a Notice of Deficiency dated August 29, 2007, from the MDEQ with respect to the Scope of Work for the Saginaw River and Saginaw Bay. The Company submitted a revised Scope of Work for the Saginaw River and Saginaw Bay to the MDEQ on October 15, 2007.
Discussions between the Company and the MDEQ that occurred in 2004 and early 2005 regarding how to proceed with off-site corrective action under the License resulted in the execution of the Framework for an Agreement Between the State of Michigan and The Dow Chemical Company (the “Framework”) on January 20, 2005. The Framework committed the Company to propose a remedial investigation work plan by the end of 2005, conduct certain studies, and take certain immediate interim remedial actions in the City of Midland and along the Tittabawassee River.
Remedial Investigation Work Plans The Company submitted Remedial Investigation Work Plans for the City of Midland and for the Tittabawassee River on December 29, 2005. By letters dated March 2, 2006 and April 13, 2006, the MDEQ provided two Notices of Deficiency (“Notices”) to the Company regarding the Remedial Investigation Work Plans. The Company responded, as required, to some of the items in the Notices on May 1, 2006, and as required responded to the balance of the items and submitted revised Remedial Investigation Work Plans on December 1, 2006. In response to subsequent discussions with the MDEQ, the Company submitted further revised Remedial Investigation Work Plans on September 17, 2007, for the Tittabawassee River and on October 15, 2007, for the City of Midland.
Studies Conducted On July 12, 2006, the MDEQ approved the sampling for the first six miles of the Tittabawassee River. On December 1, 2006, the MDEQ approved the Sampling and Analysis Plan in Support of Bioavailability Study for Midland (the “Plan”). The results of the Plan were provided to the MDEQ on March 22, 2007. On May 3, 2007, the MDEQ approved the GeoMorph® Pilot Site Characterization Report for the first six miles and approved this approach for the balance of the Tittabawassee River with some qualifications. On July 12, 2007, the MDEQ approved, with qualifications, the sampling for the next 11 miles of the Tittabawassee River. Interim Remedial Actions The Company has been working with the MDEQ to implement Interim Response Activities and Pilot Corrective Action Plans in specific areas in and along the Tittabawassee River, where elevated levels of dioxins and furans were found during the investigation of the first six miles of the river.
Removal Actions On June 27, 2007, the U.S. Environmental Protection Agency (“EPA”) sent a letter to the Company demanding that the Company enter into consent orders under Section 106 of the Comprehensive Environmental Response, Compensation, and Liability Act (“CERCLA”) for three areas identified during investigation of the first six miles of the Tittabawassee River as areas for interim remedial actions under MDEQ oversight. The EPA sought a commitment that the Company immediately engage in remedial actions to remove soils and sediments. Three removal orders were negotiated and were signed on July 12, 2007, and the soil and sediment required to be removed by these orders has been completed. On November 15, 2007, the Company and the EPA entered into a CERCLA removal order requiring the Company to remove sediment in the Saginaw River where elevated concentrations were identified during investigative work conducted on the Saginaw River. The sediment removal work was completed in December 2007.
The Dow Chemical Company and Subsidiaries Notes to the Consolidated Financial Statements
86
NOTE J – Commitments and Contingent Liabilities – Continued The Framework also contemplates that the Company, the State of Michigan and other federal and tribal governmental
entities will negotiate the terms of an agreement or agreements to resolve potential governmental claims against the Company related to historical off-site contamination associated with the Midland site. The Company and the governmental parties began to meet in the fall of 2005 and entered into a Confidentiality Agreement in December 2005. The Company continues to conduct negotiations with the governmental parties under the Federal Alternative Dispute Resolution Act.
On September 12, 2007, the EPA issued a press release reporting that they were withdrawing from the alternative dispute resolution process. On September 28, 2007, the Company entered into a Funding and Participation Agreement with the natural resource damage trustees that addressed the Company’s payment of past costs incurred by the trustees, payment of the costs of a trustee coordinator and a process to review additional cooperative studies that the Company might agree to fund or conduct with the natural resource damage trustees.
On October 10, 2007, the EPA presented a Special Notice letter to the Company offering to enter into negotiations for an administrative order on consent for the Company to conduct or fund a remedial investigation, a feasibility study, interim remedial actions and a remedial design for the Tittabawassee River, Saginaw River, and Saginaw Bay. The Company agreed to enter into negotiations and submitted its Good Faith Offer to the EPA on December 10, 2007. On January 4, 2008, the EPA terminated negotiations under the Special Notice Letter.
At the end of 2007, the Company had an accrual for off-site corrective action of $5 million (included in the total accrued obligation of $322 million at December 31, 2007) based on the range of activities that the Company proposed and discussed implementing with the MDEQ and which is set forth in the Framework. At December 31, 2006, the accrual for off-site corrective action was $7 million (included in the total accrued obligation of $347 million at December 31, 2006).
Environmental Matters Summary It is the opinion of the Company’s management that the possibility is remote that costs in excess of those disclosed will have a material adverse impact on the Company’s consolidated financial statements. Asbestos-Related Matters of Union Carbide Corporation Union Carbide Corporation (“Union Carbide”), a wholly owned subsidiary of the Company, is and has been involved in a large number of asbestos-related suits filed primarily in state courts during the past three decades. These suits principally allege personal injury resulting from exposure to asbestos-containing products and frequently seek both actual and punitive damages. The alleged claims primarily relate to products that Union Carbide sold in the past, alleged exposure to asbestos-containing products located on Union Carbide’s premises, and Union Carbide’s responsibility for asbestos suits filed against a former Union Carbide subsidiary, Amchem Products, Inc. (“Amchem”). In many cases, plaintiffs are unable to demonstrate that they have suffered any compensable loss as a result of such exposure, or that injuries incurred in fact resulted from exposure to Union Carbide’s products.
Influenced by the bankruptcy filings of numerous defendants in asbestos-related litigation and the prospects of various forms of state and national legislative reform, the rate at which plaintiffs filed asbestos-related suits against various companies, including Union Carbide and Amchem, increased in 2001, 2002 and the first half of 2003. Since then, the rate of filing has significantly abated. Union Carbide expects more asbestos-related suits to be filed against Union Carbide and Amchem in the future, and will aggressively defend or reasonably resolve, as appropriate, both pending and future claims.
Based on a study completed by Analysis, Research & Planning Corporation (“ARPC”) in January 2003, Union Carbide increased its December 31, 2002 asbestos-related liability for pending and future claims for the 15-year period ending in 2017 to $2.2 billion, excluding future defense and processing costs. Since then, Union Carbide has compared current asbestos claim and resolution activity to the results of the most recent ARPC study at each balance sheet date to determine whether the accrual continues to be appropriate. In addition, Union Carbide has requested ARPC to review Union Carbide’s historical asbestos claim and resolution activity each November since 2004 to determine the appropriateness of updating the most recent ARPC study.
In November 2006, Union Carbide requested ARPC to review Union Carbide’s historical asbestos claim and resolution activity and determine the appropriateness of updating its most recent study from January 2005. In response to that request, ARPC reviewed and analyzed data through October 31, 2006 and concluded that the experience from 2004 through 2006 was sufficient for the purpose of forecasting future filings and values of asbestos claims filed against Union Carbide and Amchem, and could be used in place of previous assumptions to update its January 2005 study. The resulting study, completed by ARPC in December 2006, stated that the undiscounted cost of resolving pending and future asbestos-related claims against Union Carbide and Amchem, excluding future defense and processing costs, through 2021 was estimated to be between approximately $1.2 billion and $1.5 billion. As in its January 2003 and January 2005 studies, ARPC provided estimates for a longer period of time in its December 2006 study, but also reaffirmed its prior advice that forecasts for shorter periods of time are more accurate than those for longer periods of time.
The Dow Chemical Company and Subsidiaries Notes to the Consolidated Financial Statements
87
Based on ARPC’s December 2006 study and Union Carbide’s own review of the asbestos claim and resolution activity, Union Carbide decreased its asbestos-related liability for pending and future claims to $1.2 billion at December 31, 2006 which covered the 15-year period ending in 2021, excluding future defense and processing costs. The reduction was $177 million and was shown as “Asbestos-related credit” in the consolidated statements of income for 2006.
In November 2007, Union Carbide requested ARPC to review Union Carbide’s 2007 asbestos claim and resolution activity and determine the appropriateness of updating its December 2006 study. In response to that request, ARPC reviewed and analyzed data through October 31, 2007. In December 2007, ARPC stated that an update of its study would not provide a more likely estimate of future events than the estimate reflected in its study of the previous year and, therefore, the estimate in that study remained applicable. Based on Union Carbide’s own review of the asbestos claim and resolution activity and ARPC’s response, Union Carbide determined that no change to the accrual was required. At December 31, 2007, Union Carbide’s asbestos-related liability for pending and future claims was $1.1 billion.
At December 31, 2007, approximately 31 percent of the recorded liability related to pending claims and approximately 69 percent related to future claims. At December 31, 2006, approximately 25 percent of the recorded liability related to pending claims and approximately 75 percent related to future claims.
At December 31, 2002, Union Carbide increased the receivable for insurance recoveries related to its asbestos liability to $1.35 billion, substantially exhausting its asbestos product liability coverage. The insurance receivable related to the asbestos liability was determined by Union Carbide after a thorough review of applicable insurance policies and the 1985 Wellington Agreement, to which Union Carbide and many of its liability insurers are signatory parties, as well as other insurance settlements, with due consideration given to applicable deductibles, retentions and policy limits, and taking into account the solvency and historical payment experience of various insurance carriers. The Wellington Agreement and other agreements with insurers are designed to facilitate an orderly resolution and collection of Union Carbide’s insurance policies and to resolve issues that the insurance carriers may raise.
In September 2003, Union Carbide filed a comprehensive insurance coverage case, now proceeding in the Supreme Court of the State of New York, County of New York, seeking to confirm its rights to insurance for various asbestos claims and to facilitate an orderly and timely collection of insurance proceeds. This lawsuit was filed against insurers that are not signatories to the Wellington Agreement and/or do not otherwise have agreements in place with Union Carbide regarding their asbestos-related insurance coverage, in order to facilitate an orderly resolution and collection of such insurance policies and to resolve issues that the insurance carriers may raise. Although the lawsuit is continuing, through the end of 2007, Union Carbide has reached settlements with several of the carriers involved in this litigation.
Union Carbide’s receivable for insurance recoveries related to its asbestos liability was $467 million at December 31, 2007 and $495 million at December 31, 2006. At December 31, 2007 and December 31, 2006, all of the receivable for insurance recoveries was related to insurers that are not signatories to the Wellington Agreement and/or do not otherwise have agreements in place regarding their asbestos-related insurance coverage.
In addition to the receivable for insurance recoveries related to its asbestos liability, Union Carbide had receivables for defense and resolution costs submitted to insurance carriers for reimbursement as follows:
Receivables for Costs Submitted to Insurance Carriers at December 31 In millions 2007 2006 Receivables for defense costs $ 18 $ 34 Receivables for resolution costs 253 266 Total $271 $300
Union Carbide expenses defense costs as incurred. The pretax impact for defense and resolution costs, net of insurance,
was $84 million in 2007, $45 million in 2006 and $75 million in 2005, and was reflected in “Cost of sales.” After a review of its insurance policies, with due consideration given to applicable deductibles, retentions and policy
limits, after taking into account the solvency and historical payment experience of various insurance carriers; existing insurance settlements; and the advice of outside counsel with respect to the applicable insurance coverage law relating to the terms and conditions of its insurance policies, Union Carbide continues to believe that its recorded receivable for insurance recoveries from all insurance carriers is probable of collection.
The amounts recorded by Union Carbide for the asbestos-related liability and related insurance receivable described above were based upon current, known facts. However, future events, such as the number of new claims to be filed and/or received each year, the average cost of disposing of each such claim, coverage issues among insurers, and the continuing solvency of various insurance companies, as well as the numerous uncertainties surrounding asbestos litigation in the United States, could cause the actual costs and insurance recoveries for Union Carbide to be higher or lower than those projected or those recorded.
The Dow Chemical Company and Subsidiaries Notes to the Consolidated Financial Statements
88
NOTE J – Commitments and Contingent Liabilities – Continued Because of the uncertainties described above, Union Carbide’s management cannot estimate the full range of the cost of
resolving pending and future asbestos-related claims facing Union Carbide and Amchem. Union Carbide’s management believes that it is reasonably possible that the cost of disposing of Union Carbide’s asbestos-related claims, including future defense costs, could have a material adverse impact on Union Carbide’s results of operations and cash flows for a particular period and on the consolidated financial position of Union Carbide.
It is the opinion of Dow’s management that it is reasonably possible that the cost of Union Carbide disposing of its asbestos-related claims, including future defense costs, could have a material adverse impact on the Company’s results of operations and cash flows for a particular period and on the consolidated financial position of the Company. Synthetic Rubber Industry Matters In 2003, the U.S., Canadian and European competition authorities initiated separate investigations into alleged anticompetitive behavior by certain participants in the synthetic rubber industry. Certain subsidiaries of the Company (but as to the investigation in Europe only) have responded to requests for documents and are otherwise cooperating in the investigations.
On June 10, 2005, the Company received a Statement of Objections from the European Commission (the “EC”) stating that it believed that the Company and certain subsidiaries of the Company (the “Dow Entities”), together with other participants in the synthetic rubber industry, engaged in conduct in violation of European competition laws with respect to the butadiene rubber and emulsion styrene butadiene rubber businesses. In connection therewith, on November 29, 2006, the EC issued its decision alleging infringement of Article 81 of the Treaty of Rome and imposed a fine of Euro 64.575 million (approximately $85 million) on the Dow Entities. Several other companies were also named and fined. Subsequently, the Company has been named in various related U.S. civil actions. In the fourth quarter of 2006, the Company recognized a loss contingency of $85 million related to the fine. The Company has appealed the EC’s decision.
Additionally, on March 10, 2007, the Company received a Statement of Objections from the EC stating that it believed that DuPont Dow Elastomers L.L.C. (“DDE”), a former 50:50 joint venture with E.I. du Pont de Nemours and Company (“DuPont”), together with other participants in the synthetic rubber industry, engaged in conduct in violation of European competition laws with respect to the polychloroprene business. This Statement of Objections specifically names the Company, in its capacity as a former joint venture owner of DDE. On December 5, 2007, the EC announced its decision to impose a fine on the Company, among others, in the amount of Euro 48.675 million (approximately $72 million). The Company previously transferred its joint venture ownership interest in DDE to DuPont in 2005, and DDE then changed its name to DuPont Performance Elastomers L.L.C. (“DPE”). Based on agreements reached between the Company and DuPont in 2004, DuPont will determine DPE’s response to this decision, including whether to appeal, while the Company will determine its response, including whether to appeal. Further, based on the Company’s allocation agreement with DuPont, the Company’s share of this fine, regardless of any appeal, will not have a material adverse impact on the Company’s consolidated financial statements. Polyurethane Subpoena Matter On February 16, 2006, the Company, among others, received a subpoena from the U.S. Department of Justice (“DOJ”) as part of an antitrust investigation of polyurethane chemicals, including methylene diphenyl diisocyanate, toluene diisocyanate and polyols. On December 10, 2007, the Company received notice from the DOJ that it has closed its investigation of potential antitrust violations involving these products. Other Litigation Matters In addition to breast implant, DBCP, environmental, synthetic rubber industry, and polyurethane subpoena matters, the Company is party to a number of other claims and lawsuits arising out of the normal course of business with respect to commercial matters, including product liability, governmental regulation and other actions. Certain of these actions purport to be class actions and seek damages in very large amounts. All such claims are being contested. Dow has an active risk management program consisting of numerous insurance policies secured from many carriers at various times. These policies provide coverage that will be utilized to minimize the impact, if any, of the contingencies described above. Summary Except for the possible effect of Union Carbide’s asbestos-related liability described above, it is the opinion of the Company’s management that the possibility is remote that the aggregate of all claims and lawsuits will have a material adverse impact on the Company’s consolidated financial statements.
The Dow Chemical Company and Subsidiaries Notes to the Consolidated Financial Statements
89
Purchase Commitments The Company has numerous agreements for the purchase of ethylene-related products globally. The purchase prices are determined primarily on a cost-plus basis. Total purchases under these agreements were $1,624 million in 2007, $1,356 million in 2006 and $1,175 million in 2005. The Company’s take-or-pay commitments associated with these agreements at December 31, 2007 are included in the table below.
The Company also has various commitments for take or pay and throughput agreements. Such commitments are at prices not in excess of current market prices. The terms of all but one of these agreements extend from one to 25 years. One agreement has terms extending to 80 years. The determinable future commitment for this agreement is included for 10 years in the following table which presents the fixed and determinable portion of obligations under the Company’s purchase commitments at December 31, 2007:
Fixed and Determinable Portion of Take or Pay and Throughput Obligations at December 31, 2007 In millions 2008 $ 2,136 2009 1,845 2010 1,578 2011 1,117 2012 941 2013 and beyond 5,212 Total $12,829
In addition to the take or pay obligations at December 31, 2007, the Company had outstanding commitments which
ranged from one to six years for steam, electrical power, materials, property and other items used in the normal course of business of approximately $234 million. Such commitments were at prices not in excess of current market prices. Guarantees The Company provides a variety of guarantees, as described more fully in the following sections. Guarantees Guarantees arise during the ordinary course of business from relationships with customers and nonconsolidated affiliates when the Company undertakes an obligation to guarantee the performance of others (via delivery of cash or other assets) if specified triggering events occur. With guarantees, such as commercial or financial contracts, non-performance by the guaranteed party triggers the obligation of the Company to make payments to the beneficiary of the guarantee. The majority of the Company’s guarantees relates to debt of nonconsolidated affiliates, which have expiration dates ranging from less than one year to eight years, and trade financing transactions in Latin America and Asia Pacific, which typically expire within one year of their inception. Residual Value Guarantees The Company provides guarantees related to leased assets specifying the residual value that will be available to the lessor at lease termination through sale of the assets to the lessee or third parties. The following tables provide a summary of the final expiration, maximum future payments and recorded liability reflected in the consolidated balance sheets for each type of guarantee:
Guarantees at December 31, 2007 In millions
Final Expiration
Maximum Future Payments
Recorded Liability
Guarantees 2014 $ 354 $22 Residual value guarantees 2015 1,035 5 Total guarantees $1,389 $27
The Dow Chemical Company and Subsidiaries Notes to the Consolidated Financial Statements
90
NOTE J – Commitments and Contingent Liabilities – Continued
Guarantees at December 31, 2006 In millions
Final Expiration
Maximum Future Payments
Recorded Liability
Guarantees 2014 $ 340 $20 Residual value guarantees 2015 1,044 6 Total guarantees $1,384 $26
Asset Retirement Obligations The Company has recognized asset retirement obligations for the following activities: demolition and remediation activities at manufacturing sites in the United States, Canada and Europe; capping activities at landfill sites in the United States, Canada, Italy and Brazil; and asbestos encapsulation as a result of planned demolition and remediation activities at manufacturing and administrative sites in the United States, Canada and Europe. See Note A for additional information.
The aggregate carrying amount of asset retirement obligations recognized by the Company was $116 million at December 31, 2007 and $106 million at December 31, 2006.
The following table shows changes in the aggregate carrying amount of the Company’s asset retirement obligations:
Asset Retirement Obligations In millions 2007 2006Balance at January 1 $106 $ 92 Additional accruals 25 22 Liabilities settled (22) (12)Accretion expense 1 2 Revisions in estimated cash flows - - Other 6 2 Balance at December 31 $116 $106
In accordance with FIN No. 47, the Company has recognized conditional asset retirement obligations related to asbestos
encapsulation as a result of planned demolition and remediation activities at manufacturing and administrative sites in the United States, Canada and Europe. At December 31, 2007, the aggregate carrying amount of conditional asset retirement obligations recognized by the Company was $45 million ($49 million at December 31, 2006).
The discount rate used to calculate the Company’s asset retirement obligations at December 31, 2007 was 5.08 percent (4.6 percent at December 31, 2006). These obligations are included in the consolidated balance sheets as “Other noncurrent obligations.”
As described in Note A, the Company has not recognized conditional asset retirement obligations for which a fair value cannot be reasonably estimated in its consolidated financial statements. It is the opinion of the Company’s management that the possibility is remote that such conditional asset retirement obligations, when estimable, will have a material adverse impact on the Company’s consolidated financial statements based on current costs.
NOTE K – NOTES PAYABLE, LONG-TERM DEBT AND AVAILABLE CREDIT FACILITIES
Notes Payable at December 31 In millions 2007 2006 Commercial paper $1,162 - Notes payable to banks 321 $186 Notes payable to related companies 65 33 Total notes payable $1,548 $219 Year-end average interest rates 5.27% 5.28%
The Dow Chemical Company and Subsidiaries Notes to the Consolidated Financial Statements
91
Long-Term Debt at December 31 In millions
2007 Average
Rate
2007
2006 Average
Rate
2006 Promissory notes and debentures:
Final maturity 2007 - - 5.04% $ 510 Final maturity 2008 5.75% $ 497 5.75% 494 Final maturity 2009 6.76% 686 6.75% 688 Final maturity 2010 9.13% 276 9.13% 278 Final maturity 2011 6.13% 808 6.13% 806 Final maturity 2012 6.00% 909 6.00% 911 Final maturity 2013 and thereafter 7.57% 2,020 7.56% 2,003
Other facilities: U.S. dollar loans – various rates and maturities 5.23% 1 0.34% 1 Foreign currency loans – various rates and maturities 3.13% 58 0.66% 40 Medium-term notes, varying maturities through 2022 6.17% 576 5.92% 748 Foreign medium-term notes, various rates and
maturities 4.13% 1 5.38% 1 Foreign medium-term notes, final maturity 2007, Euro - - 5.63% 666 Foreign medium-term notes, final maturity 2010, Euro 4.37% 587 4.37% 524 Foreign medium-term notes, final maturity 2011, Euro 4.63% 718 4.63% 645 Pollution control/industrial revenue bonds, varying
maturities through 2033 4.84% 1,004 5.09% 1,006 Capital lease obligations - 50 - 40
Unamortized debt discount - (24) - (34) Long-term debt due within one year - (586) - (1,291) Total long-term debt - $7,581 - $ 8,036
Annual Installments on Long-Term Debt for Next Five Years In millions 2008 $586 2009 $777 2010 $1,065 2011 $1,548 2012 $1,006
At December 31, 2007, the Company had an unused and committed $3 billion 5-year revolving credit facility with various U.S. and foreign banks, with a maturity date of April 2011, in support of its commercial paper borrowings and working capital requirements.
The Company’s outstanding public debt of $8.2 billion has been issued under indentures which contain, among other provisions, covenants with which the Company must comply while the underlying notes are outstanding. Such covenants include obligations to not allow liens on principal U.S. manufacturing facilities, enter into sale and lease-back transactions with respect to principal U.S. manufacturing facilities, or merge or consolidate with any other corporation or sell or convey all or substantially all of the Company’s assets. Failure of the Company to comply with any of these covenants could result in a default under the applicable indenture which would allow the note holders to accelerate the due date of the outstanding principal and accrued interest on the subject notes.
The Company’s primary credit agreements contain covenant and default provisions in addition to the covenants set forth above with respect to the Company’s public debt. Significant other covenants and defaults include:
(a) the obligation to maintain the ratio of the Company’s consolidated indebtedness to consolidated capitalization at no greater than 0.65 to 1.00 at any time the aggregate outstanding amount of loans under the primary credit agreements exceeds $500 million,
The Dow Chemical Company and Subsidiaries Notes to the Consolidated Financial Statements
92
NOTE K – Notes Payable, Long-Term Debt and Available Credit Facilities – Continued (b) a default if the Company or an applicable subsidiary fails to make any payment on indebtedness of $50 million or
more when due, or any other default under the applicable agreement permits the acceleration of $200 million or more of principal, or results in the acceleration of $100 million or more of principal, and
(c) a default if the Company or any applicable subsidiary fails to discharge or stay within 30 days after the entry of a final judgment of more than $200 million.
Failure of the Company to comply with any of the covenants could result in a default under the applicable credit agreement which would allow the lenders to not fund future loan requests and to accelerate the due date of the outstanding principal and accrued interest on any outstanding loans.
At December 31, 2007, the Company was in compliance with all of the covenants and default provisions referred to above. NOTE L – PENSION PLANS AND OTHER POSTRETIREMENT BENEFITS Pension Plans The Company has defined benefit pension plans that cover employees in the United States and a number of other countries. The U.S. qualified plan covering the parent company is the largest plan. Benefits are based on length of service and the employee’s three highest consecutive years of compensation. Employees hired after January 1, 2008 will participate in a new pension plan, under which benefits will be based on a set percentage of annual pay, plus interest.
The Company’s funding policy is to contribute to those plans when pension laws and/or economics either require or encourage funding. In 2007, Dow contributed $183 million to its pension plans, including contributions to fund benefit payments for its non-qualified supplemental plans. Dow expects to contribute $175 million to its pension plans in 2008.
The weighted-average assumptions used to determine pension plan obligations and net periodic benefit costs for the plans are provided in the two tables below:
Weighted Average Assumptions for All Pension Plans
Benefit Obligations at December 31
Net Periodic Costs for the Year
2007 2006 2007 2006 Discount rate 6.30% 5.59% 5.56% 5.39% Rate of increase in future compensation levels 4.13% 4.15% 4.12% 4.27% Expected long-term rate of return on plan assets - - 8.30% 7.96%
Weighted-Average Assumptions for U.S. Pension Plans
Benefit Obligations at December 31
Net Periodic Costs for the Year
2007 2006 2007 2006 Discount rate 6.75% 5.98% 5.98% 5.72% Rate of increase in future compensation levels 4.50% 4.50% 4.50% 4.50% Expected long-term rate of return on plan assets - - 8.79% 8.75%
The Company determines the expected long-term rate of return on plan assets by performing a detailed analysis of
historical and expected returns based on the strategic asset allocation approved by the Board of Directors and the underlying return fundamentals of each asset class. The Company’s historical experience with the pension fund asset performance is also considered. The discount rates utilized to measure the pension and other postretirement obligations of the U.S. qualified plans are based on the yield on high-quality fixed income investments at the measurement date. Future expected actuarially determined cash flows of Dow’s major U.S. plans are matched against the Citigroup Pension Discount Curve (Above Median) to arrive at a single discount rate by plan.
The accumulated benefit obligation (“ABO”) for all defined benefit pension plans was $14.7 billion at December 31, 2007 and $15.0 billion at December 31, 2006.
Pension Plans with Accumulated Benefit Obligations in Excess of Plan Assets at December 31 In millions 2007 2006 Projected benefit obligation $1,843 $1,493 Accumulated benefit obligation $1,677 $1,339 Fair value of plan assets $314 $139
The Dow Chemical Company and Subsidiaries Notes to the Consolidated Financial Statements
93
In addition to the U.S. qualified plan, U.S. employees are eligible to participate in defined contribution plans (Employee Savings Plans) by contributing a portion of their compensation, which is partially matched by the Company. Defined contribution plans also cover employees in some subsidiaries in other countries, including Argentina, Australia, Brazil, Spain and the United Kingdom. Contributions charged to income for defined contribution plans were $125 million in 2007, $84 million in 2006 and $66 million in 2005.
Other Postretirement Benefits The Company provides certain health care and life insurance benefits to retired employees. The Company’s plans outside of the United States are insignificant; therefore, this discussion relates to the U.S. plans only. The plans provide health care benefits, including hospital, physicians’ services, drug and major medical expense coverage, and life insurance benefits. For employees hired before January 1, 1993, the plans provide benefits supplemental to Medicare when retirees are eligible for these benefits. The Company and the retiree share the cost of these benefits, with the Company portion increasing as the retiree has increased years of credited service, although there is a cap on the Company portion. The Company has the ability to change these benefits at any time. Employees hired after January 1, 2008 are not covered under the plans.
The Company funds most of the cost of these health care and life insurance benefits as incurred. In 2007, Dow did not make any contributions to its other postretirement benefit plan trusts. Likewise, Dow does not expect to contribute assets to its other postretirement benefits plan trusts in 2008.
The weighted-average assumptions used to determine other postretirement benefit obligations and net periodic benefit costs for the U.S. plans are provided below:
U.S. Plan Assumptions for Other Postretirement Benefits
Benefit Obligations at December 31
Net Periodic Costs for the Year
2007 2006 2007 2006 Discount rate 6.57% 5.89% 5.89% 5.60% Expected long-term rate of return on plan assets - - 9.00% 8.75% Initial health care cost trend rate 10.30% 8.79% 8.79% 9.50% Ultimate health care cost trend rate 6.00% 6.00% 6.00% 6.00% Year ultimate trend rate to be reached 2014 2011 2011 2011
Increasing the assumed medical cost trend rate by one percentage point in each year would increase the accumulated
postretirement benefit obligation at December 31, 2007 by $31 million and the net periodic postretirement benefit cost for the year by $2 million. Decreasing the assumed medical cost trend rate by one percentage point in each year would decrease the accumulated postretirement benefit obligation at December 31, 2007 by $28 million and the net periodic postretirement benefit cost for the year by $1 million. Impact of Remeasurements An expense remeasurement of the Company’s pension and other postretirement benefit plans was completed in the third quarter of 2006, due to curtailments as defined in SFAS No. 88, “Employers’ Accounting for Settlements and Curtailments of Defined Benefit Pension Plans and for Termination Benefits,” related to workforce reductions (see Note B). The remeasurement in the third quarter of 2006 resulted in a $3 million increase in net periodic pension cost for 2006. Adoption of SFAS No. 158 In September 2006, the FASB issued SFAS No. 158, “Employers’ Accounting for Defined Benefit Pension and Other Postretirement Plans.” As required, the Company adopted this statement effective December 31, 2006. The following table provides a breakdown of the incremental effect of applying this statement on individual line items in the consolidated balance sheet at December 31, 2006:
The Dow Chemical Company and Subsidiaries Notes to the Consolidated Financial Statements
94
NOTE L – Pension Plans and Other Postretirement Benefits – Continued
Incremental Effect of Applying SFAS No. 158 In millions
Before Application of SFAS No. 158
Incremental Effect of
Applying SFAS No. 158
After Application of SFAS No. 158
Deferred income tax assets – current $228 $ (35) $193 Investment in nonconsolidated affiliates $2,829 (94) $2,735 Deferred income tax assets – noncurrent $2,973 1,033 $4,006 Deferred charges and other assets $3,586 (2,532) $1,054 Total Assets $47,209 $(1,628) $45,581 Accrued and other current liabilities $2,309 $ (94) $2,215 Pension and other postretirement benefits – noncurrent $2,601 493 $3,094 Accumulated other comprehensive loss (“AOCI”) $(208) (2,027) $(2,235) Total Liabilities and Stockholders’ Equity $47,209 $(1,628) $45,581
Net Periodic Benefit Cost for All Significant Plans Defined Benefit Pension Plans Other Postretirement Benefits In millions 2007 2006 2005 2007 2006 2005 Service cost $ 289 $ 288 $ 279 $ 21 $ 22 $ 24 Interest cost 881 827 815 113 115 124 Expected return on plan assets (1,179) (1,100) (1,056) (34) (27) (27)Amortization of prior service cost (credit) 23 22 24 (4) (4) (7)Amortization of unrecognized loss 191 222 123 3 7 10 Termination benefits/curtailment cost (1) 11 33 2 6 - 6 Net periodic benefit cost $ 216 $ 292 $ 187 $105 $113 $130
(1) See Note B for information regarding termination benefits/curtailment costs recorded in 2007 and 2006.
Other Changes in Plan Assets and Benefit Obligations Recognized in Other Comprehensive Income Defined Benefit Pension Plans Other Postretirement Benefits In millions 2007 2007 Net gain $(1,593) $(201) Prior service cost 140 2 Amortization of prior service cost (credit) (23) 4 Amortization of unrecognized loss (191) (3) Total recognized in other comprehensive income (1,667) (198) Total recognized in net periodic benefit cost and other comprehensive income $(1,451)
$ (93)
The Dow Chemical Company and Subsidiaries Notes to the Consolidated Financial Statements
95
Change in Projected Benefit Obligation, Plan Assets and Funded Status of All Significant Plans
In millions Defined
Benefit Pension Plans Other
Postretirement Benefits Change in projected benefit obligation 2007 2006 2007 2006 Benefit obligation at beginning of year $15,850 $15,617 $2,057 $2,168 Service cost 289 288 21 22 Interest cost 881 827 113 115 Plan participants’ contributions 23 33 - - Amendments 143 72 1 29 Actuarial changes in assumptions and experience (1,354) (580) (186) (60) Acquisition/divestiture/other activity 140 85 - (55) Benefits paid (918) (848) (146) (164) Currency impact 553 327 23 2 Termination benefits/curtailment cost (credit) (3) 29 7 - Benefit obligation at end of year $15,604 $15,850 $1,890 $2,057 Change in plan assets Fair value of plan assets at beginning of year $14,958 $13,324 $ 383 $ 377 Actual return on plan assets 1,424 1,577 49 44 Currency impact 437 241 - - Employer contributions 183 575 - 26 Plan participants’ contributions 19 28 - - Acquisition/divestiture/other activity 27 61 - (64) Benefits paid (918) (848) - - Fair value of plan assets at end of year $16,130 $14,958 $ 432 $ 383 Funded status at end of year $526 $(892) $(1,458) $(1,674)
Net Amounts recognized in the consolidated balance sheets at December 31: Noncurrent assets $ 2,080 $ 541 - - Current liabilities (43) (40) $ (58) $ (60) Noncurrent liabilities (1,511) (1,393) (1,400) (1,614) Net amounts recognized in the consolidated balance sheets $ 526 $ (892) $(1,458) $(1,674)
Amounts recognized in AOCI – pretax at December 31: Net loss $1,065 $2,849 $ 3 $207 Prior service cost (credit) 273 156 (20) (26) Balance in AOCI at end of year – pretax $1,338 $3,005 $(17) $181
In 2008, an estimated net loss of $39 million and prior service cost of $31 million for the defined benefit pension plans
will be amortized from AOCI to net periodic benefit cost. In 2008, prior service credit of $4 million for other postretirement benefit plans will be amortized from AOCI to net periodic benefit cost.
The Company uses a December 31 measurement date for all of its plans.
The Dow Chemical Company and Subsidiaries Notes to the Consolidated Financial Statements
96
NOTE L – Pension Plans and Other Postretirement Benefits – Continued Estimated Future Benefit Payments The estimated future benefit payments, reflecting expected future service, as appropriate, are presented in the following table:
Estimated Future Benefit Payments at December 31, 2007
Plan Assets Plan assets consist mainly of equity and fixed income securities of U.S. and foreign issuers, and may include alternative investments such as real estate, private equity and other absolute return strategies. At December 31, 2007, plan assets totaled $16.1 billion and included Company common stock with a value of $16 million (less than 1 percent of total plan assets). At December 31, 2006, plan assets totaled $15.0 billion and included Company common stock with a value of $189 million (1 percent of total plan assets).
Weighted-Average Allocation of All Plan Assets at December 31 2007 2006 Equity securities 51% 54% Debt securities 30% 28% Alternative investments 19% 18% Total 100% 100%
Weighted-Average Allocation of U.S. Plan Assets at December 31 2007 2006 Equity securities 53% 57% Debt securities 26% 24% Alternative investments 21% 19% Total 100% 100%
Investment Strategy and Risk Management for Plan Assets The Company’s investment strategy for the plan assets is to manage the assets in order to pay retirement benefits to plan participants while minimizing cash contributions from the Company over the life of the plans. This is accomplished by diversifying investments in various asset classes and earning an acceptable long-term rate of return consistent with an acceptable degree of risk, while considering the liquidity needs of the plans.
The plans are permitted to use derivative instruments for investment purposes, as well as for hedging the underlying asset and liability exposure and re-balancing the asset allocation. The plans use value at risk and other risk measures to monitor risk in the portfolios.
Strategic Weighted Average Target Allocation of U.S. Plan Assets Asset Category Target Allocation Range Equity securities 48% +/- 10% Debt securities 35% +/- 10% Alternative investments 17% +/- 8% Total 100%
The Dow Chemical Company and Subsidiaries Notes to the Consolidated Financial Statements
97
NOTE M – LEASED PROPERTY AND VARIABLE INTEREST ENTITIES Leased Property The Company routinely leases premises for use as sales and administrative offices, warehouses and tanks for product storage, motor vehicles, railcars, computers, office machines, and equipment under operating leases. In addition, the Company leases a gas turbine and aircraft in the United States, and ethylene plants in Canada and The Netherlands. At the termination of the leases, the Company has the option to purchase these plants and certain other leased equipment and buildings based on a fair market value determination.
Rental expenses under operating leases, net of sublease rental income, were $445 million in 2007, $441 million in 2006 and $451 million in 2005. Future minimum rental payments under operating leases with remaining non-cancelable terms in excess of one year are as follows:
Minimum Operating Lease Commitments at December 31, 2007 In millions 2008 $ 231 2009 200 2010 171 2011 117 2012 93 2013 and thereafter 441 Total $1,253
Variable Interest Entities The Company leases an ethylene facility in The Netherlands from an owner trust that is a variable interest entity (“VIE”). Dow is not the primary beneficiary of the owner trust and is, therefore, not required to consolidate the owner trust. Based on a valuation completed in mid-2003 when Dow entered into the lease, the facility was valued at $394 million. Upon expiration of the lease, which matures in 2014, Dow may purchase the facility for an amount based upon a fair market value determination. At December 31, 2007, Dow had provided to the owner trust a residual value guarantee of $363 million, which represents Dow’s maximum exposure to loss under the lease. Given the productive nature of the facility, it is probable that the facility will have continuing value to Dow or the owner trust in excess of the residual value guarantee.
In September 2001, Hobbes Capital S.A. (“Hobbes”), a consolidated foreign subsidiary of the Company, issued $500 million of preferred securities in the form of equity certificates. The certificates provide a floating rate of return (which may be reinvested) based on London Interbank Offered Rate (LIBOR), and may be redeemed in September 2008 and at seven-year intervals thereafter. The equity certificates have been classified as “Preferred Securities of Subsidiaries” in the consolidated balance sheets. The preferred return is included in “Minority interests’ share in income” in the consolidated statements of income. Reinvested preferred returns are included in “Minority Interest in Subsidiaries” in the consolidated balance sheets. Under FIN No. 46R, Hobbes is a VIE and the Company is the primary beneficiary. NOTE N – STOCK-BASED COMPENSATION The Company grants stock-based compensation to employees and non-employee directors in the form of the Employees’ Stock Purchase Plans and stock option plans, which include deferred and restricted stock. Information regarding these plans is provided below. Accounting for Stock-Based Compensation In December 2004, the FASB issued SFAS No. 123R, “Share-Based Payment,” which replaced SFAS No. 123, “Accounting for Stock-Based Compensation,” and superseded Accounting Principles Board (“APB”) Opinion No. 25, “Accounting for Stock Issued to Employees.” This statement, which requires that the cost of all share-based payment transactions be recognized in the financial statements, established fair value as the measurement objective and required entities to apply a fair value based measurement method in accounting for share-based payment transactions. As issued, the statement applied
The Dow Chemical Company and Subsidiaries Notes to the Consolidated Financial Statements
98
NOTE N – Stock-Based Compensation – Continued to all awards granted, modified, repurchased or cancelled after July 1, 2005, and unvested portions of previously issued and outstanding awards. On April 14, 2005, the SEC announced the adoption of a new rule that amended the compliance date for SFAS No. 123R, allowing companies to implement the statement at the beginning of their next fiscal year that began after June 15, 2005, which was January 1, 2006 for the Company. Effective January 1, 2006, the Company began expensing stock-based compensation newly issued in 2006 to employees in accordance with the fair value based measurement method of accounting set forth in SFAS No. 123R, using the modified prospective method.
The Company grants stock-based compensation awards which vest over a specified period or upon employees meeting certain performance and retirement eligibility criteria. The Company has historically amortized these awards over the specified vesting period and recognized any unrecognized compensation cost at the date of retirement (the “nominal vesting period approach”). The Company will continue applying the nominal vesting period approach to the portion of outstanding awards that were unvested as of December 31, 2005, until the awards are fully vested. SFAS No. 123R specifies that an award is vested when the employee’s right to the award is no longer contingent upon providing additional service (the “non-substantive vesting period approach”). The Company began applying this approach to all stock-based compensation awarded after December 31, 2005. The fair value of equity instruments issued to employees is measured on the date of grant and is recognized over the vesting period or from the grant date to the date on which retirement eligibility provisions have been met and additional service is no longer required. The application of the nominal vesting period approach to the unvested outstanding awards at the end of 2005 and application of the non-substantive vesting period approach to stock-based compensation awarded beginning in 2006 did not have a material impact on the Company’s consolidated financial statements.
Prior to the adoption of SFAS No. 123R, the Company expensed stock options granted after January 1, 2003, when the fair value provisions of SFAS No. 123 were adopted for new grants of equity instruments (which include stock options, deferred stock grants, and subscriptions to purchase shares under the Company’s Employees’ Stock Purchase Plan (“ESPP”)) to employees. Prior to the adoption of SFAS No. 123, the Company accounted for its stock-based awards in accordance with APB Opinion No. 25. The following table provides actual results for 2007 and 2006 and pro forma results for 2005 as if the fair value based measurement method had been applied to all outstanding and unvested awards, including stock options, deferred stock grants, and subscriptions to purchase shares under the Company’s ESPP, in each period presented:
In millions, except per share amounts 2007 2006 2005 Net income, as reported $2,887 $3,724 $4,515 Add: Stock-based compensation expense included in
reported net income, net of tax 181 173 267 Deduct: Total stock-based compensation expense
determined using the fair value based measurement method for all awards, net of tax (181) (173) (236)
Pro forma net income $2,887 $3,724 $4,546 Earnings per share (in dollars):
Basic – as reported $3.03 $3.87 $4.69 Basic – pro forma $3.03 $3.87 $4.72 Diluted – as reported $2.99 $3.82 $4.62 Diluted – pro forma $2.99 $3.82 $4.65
Prior to 2006, the Company estimated the fair value of stock options and subscriptions to purchase shares under the
ESPP using a binomial option-pricing model. Since the beginning of 2006, the Company has used a lattice-based option valuation model to estimate the fair value of stock options and subscriptions to purchase shares under the ESPP. The weighted-average assumptions used to calculate total stock-based compensation are included in the following table:
2007 2006 2005 Dividend yield 3.5% 3.3% 2.6% Expected volatility 23.33% 25.67% 22.22% Risk-free interest rate 4.89% 4.55% 3.65% Expected life of stock options granted during period 6 years 6 years 5 years Life of Employees’ Stock Purchase Plan 6.6 months 6.6 months 5 months
The Dow Chemical Company and Subsidiaries Notes to the Consolidated Financial Statements
99
The dividend yield assumption for all periods was based on the Company’s current declared dividend as a percentage of the stock price on the grant date. The expected volatility assumption for 2007 and 2006 was based on an equal weighting of the historical daily volatility and current implied volatility from exchange-traded options for the contractual term of the options. The expected volatility assumption determined for 2005 was based entirely on the historical daily volatility of the Company’s stock. The risk-free interest rate for 2007 and 2006 was based on the weighted-average of U.S. Treasury strip rates over the contractual term of the options. The risk-free interest rate for 2005 was based on zero-coupon U.S. Treasury securities with maturities equal to the expected life of the option. Based on an analysis of historical exercise patterns, exercise rates were developed that resulted in an average life of 6 years for 2007 and 2006. The expected life of the option for 2005 was based on historical data resulting in a 5-year life. EMPLOYEES’ STOCK PURCHASE PLANS On February 13, 2003, the Board of Directors authorized a 10-year ESPP, which was approved by stockholders at the Company’s annual meeting on May 8, 2003. Under each annual offering, most employees are eligible to purchase shares of common stock of the Company valued at up to 10 percent of their annual base earnings. The value is determined using the plan price multiplied by the number of shares subscribed to by the employee. The plan price of the stock is set each year at no less than 85 percent of market price. Approximately 59 percent of the eligible employees enrolled in the annual plan for 2007; approximately 52 percent of the eligible employees enrolled in 2006; and approximately 40 percent enrolled in 2005. Employees’ Stock Purchase Plans 2007
Shares in thousands Shares Exercise
Price*Outstanding at beginning of year - - Granted 5,328 $30.81Exercised (4,677) $30.81Forfeited/Expired (651) $30.81Outstanding and exercisable at end of year - - *Weighted-average per share
Additional Information about ESPPs In millions, except per share amounts 2007 2006 2005 Weighted-average fair value per share of purchase rights granted $10.62 $7.83 $6.77 Total compensation expense for ESPPs $57 $34 $19
Related tax benefit $21 $12 $7 Total amount of cash received from the exercise of purchase rights $145 $101 $135 Total intrinsic value of purchase rights exercised* $65 $15 $41
Related tax benefit $24 $6 $15 *Difference between the market price at exercise and the price paid by the employee to exercise the purchase rights
STOCK OPTION PLANS Under the 1988 Award and Option Plan (the “1988 Plan”), a plan approved by stockholders, the Company may grant options or shares of common stock to its employees subject to certain annual and individual limits. The terms of the grants are fixed at the grant date. At December 31, 2007, there were 25,254,077 shares available for grant under this plan.
No additional grants will be made under the 1994 Non-Employee Directors’ Stock Plan, which previously allowed the Company to grant up to 300,000 options to non-employee directors. At December 31, 2007, there were 56,250 options outstanding under this plan.
No additional grants will be made under the 1998 Non-Employee Directors’ Stock Plan, which previously allowed the Company to grant up to 600,000 options to non-employee directors. At December 31, 2007, there were 160,900 options outstanding under this plan.
The exercise price of each stock option equals the market price of the Company’s stock on the date of grant. Options vest from one to three years, and have a maximum term of 10 years.
The Dow Chemical Company and Subsidiaries Notes to the Consolidated Financial Statements
100
NOTE N – Stock-Based Compensation – Continued The following table provides stock option activity for 2007:
Stock Options 2007
Shares in thousands Shares Exercise
Price*Outstanding at beginning of year 48,597 $37.20 Granted 7,679 $43.58 Exercised (7,704) $31.30 Forfeited/Expired (570) $38.01 Outstanding at end of year 48,002 $39.16
Remaining contractual life in years 5.66 Aggregate intrinsic value (in millions) $180
Exercisable at end of year 33,053 $36.66 Remaining contractual life in years 4.42 Aggregate intrinsic value (in millions) $178
*Weighted-average per share
Additional Information about Stock Options In millions, except per share amounts 2007 2006 2005 Weighted-average fair value per share of options granted $9.81 $10.31 $10.47 Total compensation expense for stock option plans $86 $87 $68
Related tax benefit $32 $32 $25 Total amount of cash received from the exercise of options $235 $122 $263 Total intrinsic value of options exercised* $103 $49 $216
Related tax benefit $38 $18 $80 *Difference between the market price at exercise and the price paid by the employee to exercise the options
Total unrecognized compensation cost related to unvested stock option awards was $39 million at December 31, 2007
and is expected to be recognized over a weighted-average period of 1.36 years. Deferred and Restricted Stock Under the 1988 Plan, the Company grants deferred stock to certain employees. The grants vest after a designated period of time, generally two to five years. Deferred Stock 2007
Shares in thousands Shares Grant Date
Fair Value*Nonvested at beginning of year 5,443 $44.90 Granted 1,902 $43.61Vested (584) $33.88Canceled (128) $45.28Nonvested at end of year 6,633 $45.49*Weighted-average per share
Additional Information about Deferred Stock In millions, except per share amounts 2007 2006 2005 Weighted-average fair value per share of deferred stock granted $43.61 $43.34 $52.45 Total fair value of deferred stock vested and delivered (1) $24 $48 $123
Related tax benefit $9 $18 $45 Total compensation expense for deferred stock awards $76 $67 $60
Related tax benefit $28 $25 $22 (1) Includes the fair value of shares vested in prior years and delivered in the reporting year.
The Dow Chemical Company and Subsidiaries Notes to the Consolidated Financial Statements
101
Total unrecognized compensation cost related to deferred stock awards was $112 million at December 31, 2007 and is expected to be recognized over a weighted-average period of 1.95 years. At December 31, 2007, approximately 266,000 deferred shares with a grant date weighted-average fair value per share of $43.38 had previously vested, but were not issued. These shares are scheduled to be issued to employees within one to four years or upon retirement.
Also under the 1988 Plan, the Company has granted performance deferred stock awards that vest when the Company attains specified performance targets over a pre-determined period, generally two to five years. Compensation expense related to performance deferred stock awards is recognized over the lesser of the service or performance period. The following table shows the performance deferred stock awards granted:
Performance Deferred Stock Awards
Shares in millions Performance Period
Target Shares
Granted*
Weighted-average Fair Value per
Share 2007 January 1, 2007 – December 31, 2009 1.0 $43.59 2006 January 1, 2006 – December 31, 2008 0.9 $36.78 2005 January 1, 2005 – December 31, 2007 1.0 $55.77 * At the end of the performance period, the actual number of shares issued can range from
zero to 250 percent of the target shares granted for the 2007 performance period and from zero to 200 percent of the target shares granted for the 2006 and 2005 performance periods. The following table shows changes in nonvested performance deferred stock:
Performance Deferred Stock 2007
Shares in thousands Shares Grant Date
Fair Value*Nonvested at beginning of year 3,498 $37.28 Granted 983 $43.59 Vested (2,544) $37.40 Canceled (76) $40.67 Nonvested at end of year 1,861 $40.32 *Weighted-average per share
Additional Information about Performance Deferred Stock In millions, except per share amounts 2007 2006 2005 Total fair value of performance deferred stock vested and
Total compensation expense for performance deferred stock awards
$69 $86 $276
Related tax benefit $26 $32 $101 (1) Includes the fair value of shares vested in prior years and delivered in the reporting year.
Total unrecognized compensation cost related to performance deferred stock awards was $24 million at December 31, 2007 and is expected to be recognized over a weighted-average period of 1.34 years. At December 31, 2007, approximately 5.8 million performance deferred shares with a grant date weighted-average fair value of $34.67 per share were vested, but not issued. These shares are scheduled to be issued in April 2008.
In addition, the Company is authorized to grant up to 300,000 deferred shares of common stock to executive officers of the Company under the 1994 Executive Performance Plan.
Under the 2003 Non-Employee Directors’ Stock Incentive Plan, a plan approved by stockholders, the Company may grant up to 1.5 million shares (including options, restricted stock and deferred stock) to non-employee directors over the 10-year duration of the program, subject to an annual aggregate award limit of 25,000 shares for each individual director. In 2007, 48,400 stock options with a weighted-average fair value of $9.83 per share and 9,200 shares of restricted stock with a weighted-average fair value of $41.97 per share were issued under this plan. The restricted stock issued under this plan cannot be sold, assigned, pledged or otherwise transferred by the non-employee director, until the director is no longer a member of the Board.
The Dow Chemical Company and Subsidiaries Notes to the Consolidated Financial Statements
102
NOTE O – LIMITED PARTNERSHIP In early 1998, a subsidiary of the Company purchased the 20 percent limited partner interests of outside investors in a consolidated subsidiary, Chemtech Royalty Associates L.P., for a fair value of $210 million in accordance with wind-up provisions in the partnership agreement. The limited partnership was renamed Chemtech II L.P. (“Chemtech II”). In June 1998, the Company contributed assets with an aggregate fair value of $783 million (through a wholly owned subsidiary) to Chemtech II and an outside investor acquired a limited partner interest in Chemtech II totaling 20 percent in exchange for $200 million. In September 2000, the Company contributed additional assets with an aggregate fair value of $18 million (through a wholly owned subsidiary) to Chemtech II.
Chemtech II is a separate and distinct legal entity from the Company and its affiliates, and has separate assets, liabilities, business and operations. Chemtech II affords the Company a diversified source of funding through a cost effective minority equity participation. The partnership has a general partner, a wholly owned subsidiary of the Company, which directs business activities and has fiduciary responsibilities to the partnership and its other members.
The outside investor in Chemtech II receives a cumulative annual priority return on its investment and participates in residual earnings. The partnership agreement was renegotiated in June 2003, resulting in a new cumulative annual priority return of $8 million. Chemtech II will not terminate unless a termination or liquidation event occurs. The outside investor may cause such an event to occur in 2008. Upon wind-up, liquidation or termination, the partners’ capital accounts will be redeemed at current fair values.
For financial reporting purposes, the assets (other than intercompany loans, which are eliminated), liabilities, results of operations and cash flows of the partnership and subsidiaries are included in the Company’s consolidated financial statements, and the outside investor’s limited partner interest is included in “Minority Interest in Subsidiaries” in the consolidated balance sheets.
NOTE P – PREFERRED SECURITIES OF SUBSIDIARIES The following transactions were entered into for the purpose of providing diversified sources of funds to the Company.
In July 1999, Tornado Finance V.O.F., a consolidated foreign subsidiary of the Company, issued $500 million of preferred securities in the form of preferred partnership units. The units provide a distribution of 7.965 percent, may be redeemed in 2009 or thereafter, and may be called at any time by the subsidiary. The preferred partnership units are classified as “Preferred Securities of Subsidiaries” in the consolidated balance sheets. The distributions are included in “Minority interests’ share in income” in the consolidated statements of income.
In September 2001, Hobbes Capital S.A., a consolidated foreign subsidiary of the Company, issued $500 million of preferred securities in the form of equity certificates. The certificates provide a floating rate of return (which may be reinvested) based on the London Interbank Offered Rate (LIBOR), and may be redeemed in September 2008 and at seven-year intervals thereafter. The equity certificates are classified as “Preferred Securities of Subsidiaries” in the consolidated balance sheets. The preferred return is included in “Minority interests’ share in income” in the consolidated statements of income. Reinvested preferred returns are included in “Minority Interest in Subsidiaries” in the consolidated balance sheets. NOTE Q – STOCKHOLDERS’ EQUITY There are no significant restrictions limiting the Company’s ability to pay dividends.
Undistributed earnings of nonconsolidated affiliates included in retained earnings were $1,962 million at December 31, 2007 and $1,599 million at December 31, 2006.
On July 14, 2005, the Board of Directors authorized the repurchase of up to 25 million shares of Dow common stock over the period ending on December 31, 2007 (the “2005 Program”). Prior to that authorization (and since August 3, 1999 when the Board of Directors terminated its 1997 authorization which allowed the Company to repurchase shares of Dow common stock), the only shares purchased by the Company were those shares received from employees and non-employee directors to pay taxes owed to the Company as a result of the exercise of stock options or the delivery of deferred stock (see Note N for information regarding the Company’s stock option plans). In 2005 and 2006, the Company purchased in total 18,798,407 shares of the Company’s common stock under the 2005 program. During the first quarter of 2007, the Company purchased 6,201,593 shares of the Company’s common stock under the 2005 Program, bringing the program to a close.
On October 26, 2006, the Company announced that its Board of Directors had approved a share buy-back program, authorizing up to $2 billion to be spent on the repurchase of the Company’s common stock (the “2006 Program”). Purchases under the 2006 Program began in March 2007, following the completion of the 2005 Program. In 2007, the Company purchased 26,225,207 shares of the Company’s common stock under the 2006 Program.
The Dow Chemical Company and Subsidiaries Notes to the Consolidated Financial Statements
103
The total number of treasury shares purchased by the Company, including shares received from employees and non-employee directors to pay taxes owed to the Company as a result of the exercise of stock options or the delivery of deferred stock, was 33,275,995 in 2007; 18,694,453 in 2006 and 1,492,548 in 2005.
The number of treasury shares issued to employees under the Company’s option and purchase programs was 15.6 million in 2007, 9.6 million in 2006 and 15.7 million in 2005.
Reserved Treasury Stock at December 31 Shares in millions 2007 2006 2005 Stock option and deferred stock plans 41.0 23.3 14.2
Employee Stock Ownership Plan The Company has the Dow Employee Stock Ownership Plan (the “ESOP”), which is an integral part of The Dow Chemical Company Employees’ Savings Plan. A significant majority of full-time employees in the United States are eligible to participate in the ESOP through the allocation of shares of the Company’s common stock.
In 1990, Union Carbide sold shares of its stock to its ESOP (the “UCC ESOP”) for a $325 million note with a maturity date of December 31, 2005, and an interest rate of 10 percent. The UCC ESOP shares were converted into shares of Dow common stock on February 6, 2001. On December 27, 2001, the UCC ESOP and the ESOP were merged into one ESOP trust and the UCC ESOP note was restructured with a maturity date of December 31, 2023, and an interest rate of 6.96 percent. The outstanding balance of the note was $1 million at December 31, 2005. On December 31, 2006, the trustee made the final payment on the ESOP note and released the remaining shares held by the ESOP. The receivable from the ESOP was reflected as “Unearned ESOP shares” in the consolidated balance sheets as a reduction of “Stockholders’ Equity.”
At December 31, 2007, 10 million common shares held by the ESOP were outstanding, all of which have been allocated to participants’ accounts. Shares held by the ESOP are treated as outstanding shares in the determination of basic and diluted earnings per share. NOTE R – INCOME TAXES Operating loss carryforwards amounted to $5,439 million at December 31, 2007 and $4,858 million at December 31, 2006. At December 31, 2007, $362 million of the operating loss carryforwards were subject to expiration in 2008 through 2012. The remaining operating loss carryforwards expire in years beyond 2012 or have an indefinite carryforward period. Tax credit carryforwards at December 31, 2007 amounted to $681 million, net of FIN No. 48 positions, of which $3 million is subject to expiration in 2008 through 2012. The remaining tax credit carryforwards expire in years beyond 2012. At December 31, 2006, prior to the adoption of FIN No. 48, tax credit carryforwards totaled $1,081 million.
Undistributed earnings of foreign subsidiaries and related companies that are deemed to be permanently invested amounted to $7,752 million at December 31, 2007, $5,951 million at December 31, 2006 and $4,299 million at December 31, 2005. It is not practicable to calculate the unrecognized deferred tax liability on those earnings.
The Company had valuation allowances, which were primarily related to the realization of recorded tax benefits on tax loss carryforwards from operations in the United States, Brazil and Switzerland, of $323 million at December 31, 2007 and $446 million at December 31, 2006.
The tax rate for 2007 was negatively impacted by a change in German tax law that was enacted in August and included a reduction in the German income tax rate, which was effective January 1, 2008. As a result of the change, the Company adjusted the value of its net deferred tax assets in Germany (using the lower tax rate) and recorded a charge of $362 million against the “Provision for income taxes” in the third quarter of 2007. Additionally, during 2007, the Company determined that it was more likely than not that certain tax loss carryforwards in the United States and Brazil would be utilized due to positive financial performance, adherence to fiscal discipline and improved forecasted earnings, which resulted in net reversals of valuation allowances of $71 million related to the United States and $45 million related to Brazil. In addition, the Company changed the legal ownership structure of its investment in EQUATE, resulting in a favorable impact to the “Provision for income taxes” of $113 million in the fourth quarter of 2007. These events, combined with enacted changes in the tax rates in Canada and Italy, strong financial results in jurisdictions with lower tax rates than the United States and improved earnings from a number of the Company’s joint ventures, partially offset by the impact of FIN No. 48, resulted in an effective tax rate for 2007 that was lower than the U.S. statutory rate. The Company’s reported effective tax rate for 2007 was 29.4 percent.
The Dow Chemical Company and Subsidiaries Notes to the Consolidated Financial Statements
104
NOTE R – Income Taxes – Continued During 2006, the Company developed tax planning strategies in Brazil and determined that it was more likely than
not that tax loss carryforwards would be utilized, resulting in a reversal of valuation allowances of $63 million. This impact, combined with strong financial results in jurisdictions with lower tax rates than the United States, enacted reductions in the tax rates in Canada and The Netherlands, and improved earnings from a number of the Company’s joint ventures, resulted in an effective tax rate for 2006 that was lower than the U.S. statutory rate. The Company’s reported effective tax rate for 2006 was 23.2 percent.
The American Jobs Creation Act of 2004 (the “AJCA”), which was signed into law in October 2004, introduced a special one-time dividends received deduction on the repatriation of certain foreign earnings to a U.S. taxpayer, provided certain criteria are met. In May 2005, tax authorities released the clarifying language necessary to enable the Company to finalize its plan for the repatriation and reinvestment of foreign earnings subject to the requirements of the AJCA, resulting in a credit of $113 million to the “Provision for income taxes” in the second quarter of 2005.
On January 23, 2006, the Company received an unfavorable tax ruling from the United States Court of Appeals for the Sixth Circuit reversing a prior decision by the United States District Court relative to corporate owned life insurance, resulting in a charge of $137 million to the “Provision for income taxes” in the fourth quarter of 2005.
The Company’s tax rate for 2005 was lower than the U.S. statutory rate due to strong financial results in jurisdictions with lower tax rates than the United States, improved earnings from a number of joint ventures, and the impact of the repatriation provisions under the AJCA, offset by the unfavorable tax ruling on corporate owned life insurance. The Company’s reported effective tax rate for 2005 was 27.8 percent.
Domestic and Foreign Components of Income before Income Taxes and Minority Interests In millions 2007 2006 2005 Domestic $ 229 $2,244 $2,715 Foreign 4,000 2,728 3,684 Total $4,229 $4,972 $6,399
Reconciliation to U.S. Statutory Rate In millions 2007 2006 2005 Taxes at U.S. statutory rate $1,480 $1,740 $2,240 Equity earnings effect (396) (331) (287) Change in legal ownership structure of EQUATE (113) - - Foreign rates other than 35% (1) (739) (517) (409) German tax law change 362 - - U.S. tax effect of foreign earnings and dividends 480 272 160 Unrecognized tax benefits 166 - - Tax contingency reserve adjustments - 177 3 Benefit of repatriation under AJCA - - (113) Unfavorable tax ruling - - 137 Other – net 4 (186) 51 Total tax provision $1,244 $1,155 $1,782 Effective tax rate 29.4% 23.2% 27.8% (1) Includes the effect of changes in valuation allowances for foreign entities as follows: a decrease of
$53 million in 2007, a decrease of $61 million in 2006 and an increase of $14 million in 2005.
Provision (Credit) for Income Taxes 2007 2006 2005 In millions Current Deferred Total Current Deferred Total Current Deferred Total Federal $ 77 $141 $ 218 $ 367 $ 401 $ 768 $ 255 $535 $ 790 State and local 87 4 91 82 (99) (17) 46 20 66 Foreign 586 349 935 602 (198) 404 741 185 926 Total $750 $494 $1,244 $1,051 $ 104 $1,155 $1,042 $740 $1,782
The Dow Chemical Company and Subsidiaries Notes to the Consolidated Financial Statements
Uncertain Tax Positions On January 1, 2007, the Company adopted the provisions of FIN No. 48. The cumulative effect of adoption was a $290 million reduction of retained earnings. At December 31, 2007, the total amount of unrecognized tax benefits was $892 million ($865 million at January 1, 2007), of which $864 million would impact the effective tax rate, if recognized ($704 million at January 1, 2007).
Interest and penalties associated with uncertain tax positions are recognized as components of the “Provision for income taxes,” and totaled $29 million in 2007. The Company’s accrual for interest and penalties was $152 million at December 31, 2007 and $123 million at January 1, 2007.
Total Gross Unrecognized Tax Benefits (in millions) 2007 Balance at January 1 $865 Increases related to positions taken on items from prior years 99 Decreases related to positions taken on items from prior years (164) Increases related to positions taken in 2007 110 Settlement of uncertain tax positions with tax authorities (1) Decreases due to expiration of statutes of limitations (17) Balance at December 31 $892
The Company is currently under examination in a number of tax jurisdictions for 1998-2006. It is reasonably possible
that these examinations may be resolved within twelve months. As a result, it is reasonably possible that the total gross unrecognized tax benefits of the Company will be reduced by approximately $285 million. The amount of settlement remains uncertain and it is reasonably possible that before settlement, the amount of gross unrecognized tax benefits may increase by approximately $40 million or decrease by approximately $20 million. The impact on the Company’s results of operations is expected to be immaterial.
Tax years that remain subject to examination for the Company’s major tax jurisdictions are shown below:
Tax Years Subject to Examination for Major Tax Jurisdictions at December 31, 2007 1989 – 2007 United States – state and local income tax 2001 – 2007 Argentina Canada United States – federal income tax 2002 – 2007 Brazil Germany 2003 – 2007 Italy Spain 2005 – 2007 France Switzerland United Kingdom 2007 The Netherlands
The Dow Chemical Company and Subsidiaries Notes to the Consolidated Financial Statements
106
NOTE R – Income Taxes – Continued The reserve for non-income tax contingencies related to issues in the United States and foreign locations was
$226 million at December 31, 2007 and $223 million at December 31, 2006. This is management’s best estimate of the potential liability for non-income tax contingencies. Inherent uncertainties exist in estimates of tax contingencies due to changes in tax law, both legislated and concluded through the various jurisdictions’ tax court systems. It is the opinion of the Company’s management that the possibility is remote that costs in excess of those accrued will have a material adverse impact on the Company’s consolidated financial statements. NOTE S – OPERATING SEGMENTS AND GEOGRAPHIC AREAS Dow is a diversified, worldwide manufacturer and supplier of approximately 3,100 products. The Company’s products are used primarily as raw materials in the manufacture of customer products and services. The Company serves the following industries: appliance; automotive; agricultural; building and construction; chemical processing; electronics; furniture; housewares; oil and gas; packaging; paints, coatings and adhesives; personal care; pharmaceutical; processed foods; pulp and paper; textile and carpet; utilities; and water treatment.
Dow conducts its worldwide operations through global businesses, which are aggregated into reportable operating segments based on the nature of the products and production processes, end-use markets, channels of distribution and regulatory environment. The Company’s reportable operating segments are Performance Plastics, Performance Chemicals, Agricultural Sciences, Basic Plastics, Basic Chemicals, and Hydrocarbons and Energy. Unallocated and Other contains the reconciliation between the totals for the reportable segments and the Company’s totals. It also represents the operating segments that do not meet the quantitative threshold for determining reportable segments, research and other expenses related to new business development activities, and other corporate items not allocated to the reportable operating segments.
The Corporate Profile included below describes the operating segments, how they are aggregated, and the types of products and services from which their revenues are derived.
Corporate Profile Dow is a diversified chemical company that combines the power of science and technology with the “Human Element” to constantly improve what is essential to human progress. The Company delivers a broad range of products and services to customers in approximately 160 countries, connecting chemistry and innovation with the principles of sustainability to help provide everything from fresh water, food and pharmaceuticals to paints, packaging and personal care products. In 2007, Dow had annual sales of $53.5 billion and employed approximately 45,900 people worldwide. The Company has 150 manufacturing sites in 35 countries and produces approximately 3,100 products. The following descriptions of the Company’s operating segments include a representative listing of products for each business.
PERFORMANCE PLASTICS Applications: automotive interiors, exteriors, under-the-hood and body engineered systems • building and construction, thermal and acoustic insulation, roofing • communications technology, telecommunication cables, electrical and electronic connectors • footwear • home and office furnishings: kitchen appliances, power tools, floor care products, mattresses, carpeting, flooring, furniture padding, office furniture • information technology equipment and consumer electronics • packaging, food and beverage containers, protective packaging • sports and recreation equipment • wire and cable insulation and jacketing materials for power utility and telecommunications
Dow Automotive serves the global automotive market and is a leading supplier of plastics, adhesives, sealants and other plastics-enhanced products for interior, exterior, under-the-hood, vehicle body structure and acoustical management technology solutions. With offices and application development centers around the world, Dow Automotive provides materials science expertise and comprehensive technical capabilities to its customers worldwide. • Products: AFFINITY™ polyolefin plastomers; AMPLIFY™ functional polymers; BETABRACE™
Dow Building Solutions manufactures and markets an extensive line of insulation, weather barrier, and oriented composite building solutions, as well as a line of cushion packaging foam solutions. The business is the recognized leader in extruded polystyrene (XPS) insulation, known industry-wide by its distinctive Blue color and the Dow STYROFOAM™ brand for more than 50 years. The business also manufactures foam solutions for a wide range of applications including cushion packaging, electronics protection and material handling. • Products: EQUIFOAM™ comfort products; FROTH-PAK™ polyurethane spray foam; GREAT STUFF™
Dow Epoxy is a leading global producer of epoxy resins, intermediates and specialty resins for a wide range of industries and applications such as coatings, electrical laminates, civil engineering, adhesives and composites. With plants strategically located across four continents, the business is focused on providing customers around the world with differentiated solution-based epoxy products and innovative technologies and services. • Products: D.E.H.™ epoxy curing agents or hardeners; D.E.N.™ epoxy novolac resins; D.E.R.™ epoxy resins
(liquids, solids and solutions); Epoxy intermediates (Acetone, Allyl chloride, Bisphenol-A, Epichlorohydrin, OPTIM™ synthetic glycerine and Phenol); Specialty acrylic monomers (Glycidyl methacrylate, Hydroxyethyl acrylate and Hydroxypropyl acrylate); UCAR™ solution vinyl resins
The Polyurethanes and Polyurethane Systems business is a leading global producer of polyurethane raw materials and polyurethane systems. Differentiated by its ability to globally supply a high-quality, consistent and complete product range, this business emphasizes both existing and new business developments while facilitating customer success with a global market and technology network. • Products: ENFORCER™ Technology and ENHANCER™ Technology for polyurethane carpet and turf
Specialty Plastics and Elastomers is a business portfolio of specialty products including a broad range of engineering plastics and compounds, performance elastomers and plastomers, specialty copolymers, synthetic rubber, polyvinylidene chloride resins and films (PVDC), and specialty film substrates. The business serves such industries as automotive, civil construction, wire and cable, building and construction, consumer electronics and appliances, food and specialty packaging, and footwear. • Products: AFFINITY™ polyolefin plastomers (POPs); AMPLIFY™ functional polymers; CALIBRE™
The Technology Licensing and Catalyst business includes licensing and supply of related catalysts, process control software and services for the UNIPOL™ polypropylene process, the METEOR™ process for ethylene oxide (EO) and ethylene glycol (EG), the LP OXO™ process for oxo alcohols, the QBIS™ bisphenol A process, and Dow’s proprietary technology for production of purified terephthalic acid (PTA). Licensing of the UNIPOL™ polyethylene process and sale of related catalysts, including metallocene catalysts, are handled through Univation Technologies, LLC, a 50:50 joint venture of Union Carbide.
The Dow Chemical Company and Subsidiaries Notes to the Consolidated Financial Statements
108
NOTE S – Operating Segments and Geographic Areas – Continued • Products: LP OXO™ process technology and NORMAX™ catalysts; METEOR™ EO/EG process technology
and catalysts; PTA process technology; QBIS™ bisphenol A process technology and DOWEX™ QCAT™ catalyst; UNIPOL™ PP process technology and SHAC™ catalyst systems
The Performance Plastics segment also includes a portion of the results of the SCG-Dow Group, a group of Thailand-based joint ventures.
PERFORMANCE CHEMICALS Applications: agricultural and pharmaceutical products and processing • building materials • chemical processing and intermediates • electronics • food processing and ingredients • gas treating solvents • household products • metal degreasing and dry cleaning • oil and gas treatment • paints, coatings, inks, adhesives, lubricants • personal care products • pulp and paper manufacturing, coated paper and paperboard • textiles and carpet • water purification
Designed Polymers is a business portfolio of products and systems characterized by unique chemistry, specialty functionalities, and people with deep expertise in regulated industries. Within Designed Polymers, Dow Water Solutions offers world-class brands and enabling component technologies designed to advance the science of desalination, water purification, trace contaminant removal and water recycling. Also in Designed Polymers, businesses such as Dow Wolff Cellulosics, Dow Biocides and ANGUS Chemical Company (a wholly owned subsidiary of Dow), develop and market a range of products that enhance or enable key physical and sensory properties of end-use products in applications such as food, pharmaceuticals, oil and gas, paints and coatings, personal care, and building and construction. • Products and Services: Acrolein derivatives; Basic nitroparaffins and nitroparaffin-based specialty chemicals;
The Dow Latex business is a major global supplier of latexes, for a wide range of industries and applications. It provides the broadest line of styrene/butadiene (S/B) products supporting customers in paper and paperboard (for magazines, catalogues and food packaging) applications, and the carpet and floor covering industry. UCAR Emulsion Systems (UES) manufactures and sells acrylic, vinyl acrylic, vinyl acetate ethylene (VAE), and S/B and styrene acrylic latexes and NEOCAR™ branched vinyl ester latexes for use in the architectural and industrial coatings, adhesives, construction products such as caulks and sealants, textile, and traffic paint. It also offers the broadest product range in the dispersion area and produces and markets UCAR™ POLYPHOBE™ rheology modifiers. • Products: Acrylic latex; EVOCAR™ specialty latex; FOUNDATIONS™ latex; NEOCAR™ branched vinyl
The Specialty Chemicals business provides products and services used as functional ingredients or processing aids in the manufacture of a diverse range of products. Applications include agricultural and pharmaceutical products and processing, building and construction, chemical processing and intermediates, electronics, food processing and ingredients, gas treating solvents, fuels and lubricants, oil and gas, household and institutional cleaners, coatings and paints, pulp and paper manufacturing, metal degreasing and dry cleaning, and transportation. Dow Haltermann Custom Processing provides contract and custom manufacturing services to other specialty chemical, agricultural chemical and biodiesel producers. • Products: Acrylic acid/Acrylic esters; AMBITROL™ and NORKOOL™ industrial coolants; Butyl
CARBITOL™ and Butyl CELLOSOLVE™ ethylene oxide; CARBOWAX™ and CARBOWAX™ SENTRY™ polyethylene glycols and methoxypolyethylene glycols; Diphenyloxide; DOW™ polypropylene glycols; DOWCAL™, DOWFROST™, DOWTHERM™, SYLTHERM and UCARTHERM™ heat transfer fluids; DOWFAX™, TERGITOL™ and TRITON™ surfactants; Ethanolamines; Ethyleneamines;
The Dow Chemical Company and Subsidiaries Notes to the Consolidated Financial Statements
109
Isopropanolamines; MAXIBOOST™ cleaning boosters; MAXICHECK™ solvent analysis test kits; MAXISTAB™ stabilizers; Propylene oxide-based glycol ethers; SAFE-TAINER™ closed-loop delivery system; SYNALOX™ lubricants; UCAR™ deicing fluids; UCARKLEAN™ amine management; UCARSOL™ formulated solvents; UCON™ fluids; VERSENE™ chelating agents; Fine and specialty chemicals from the Dow Haltermann Custom Processing business; Test and reference fuels, printing ink distillates, pure hydrocarbons and esters, and derivatives from Haltermann Products, a wholly owned subsidiary of Dow
The Performance Chemicals segment also includes the results of Dow Corning Corporation, and a portion of the results of the OPTIMAL Group of Companies and the SCG-Dow Group, all joint ventures of the Company.
AGRICULTURAL SCIENCES Applications: control of weeds, insects and plant diseases for agriculture and pest management • agricultural seeds and traits (genes)
Dow AgroSciences is a global leader in providing pest management, agricultural and crop biotechnology products and solutions. The business develops, manufactures and markets products for crop production; weed, insect and plant disease management; and industrial and commercial pest management. Dow AgroSciences is building a leading plant genetics and biotechnology business in agricultural seeds, traits, healthy oils, and animal health. • Products: CLINCHER™ herbicide; DITHANE™ fungicide; FORTRESS™ fungicide; GARLON™ herbicide;
BASIC PLASTICS Applications: adhesives • appliances and appliance housings • agricultural films • automotive parts and trim • beverage bottles • bins, crates, pails and pallets • building and construction • coatings • consumer and durable goods • consumer electronics • disposable diaper liners • fibers and nonwovens • films, bags and packaging for food and consumer products • hoses and tubing • household and industrial bottles • housewares • hygiene and medical films • industrial and consumer films and foams • information technology • oil tanks and road equipment • plastic pipe • textiles • toys, playground equipment and recreational products • wire and cable compounds
The Polyethylene business is the world’s leading supplier of polyethylene-based solutions through sustainable product differentiation. Through the use of multiple catalyst and process technologies, the business offers customers one of the industry’s broadest ranges of polyethylene resins via a strong global network of local experts focused on partnering for long-term success. • Products: ASPUN™ fiber grade resins; ATTANE™ ultra low density polyethylene (ULDPE) resins;
CONTINUUM™ bimodal polyethylene resins; DOW™ high density polyethylene (HDPE) resins; DOW™ low density polyethylene (LDPE) resins; DOWLEX™ polyethylene resins; ELITE™ enhanced polyethylene (EPE) resins; TUFLIN™ linear low density polyethylene (LLDPE) resins; UNIVAL™ HDPE resins
The Polypropylene business, a major global polypropylene supplier, provides a broad range of products and solutions tailored to customer needs by leveraging Dow’s leading manufacturing and application technology, research and product development expertise, extensive market knowledge and strong customer relationships. • Products: DOW™ homopolymer polypropylene resins; DOW™ impact copolymer polypropylene resins;
DOW™ random copolymer polypropylene resins; INSPIRE™ performance polymers The Polystyrene business, the global leader in the production of polystyrene resins, is uniquely positioned with geographic breadth and participation in a diversified portfolio of applications. Through market and technical leadership and low cost capability, the business continues to improve product performance and meet customer needs. • Products: STYRON A-TECH™ and C-TECH™ advanced technology polystyrene resins and a full line of
STYRON™ general purpose polystyrene resins; STYRON™ high-impact polystyrene resins
The Dow Chemical Company and Subsidiaries Notes to the Consolidated Financial Statements
110
NOTE S – Operating Segments and Geographic Areas – Continued The Basic Plastics segment also includes the results of Equipolymers and a portion of the results of EQUATE Petrochemical Company K.S.C. and the SCG-Dow Group, all joint ventures of the Company.
BASIC CHEMICALS Applications: agricultural products • alumina • automotive antifreeze and coolant systems • carpet and textiles • chemical processing • dry cleaning • dust control • household cleaners and plastic products • inks • metal cleaning • packaging, food and beverage containers, protective packaging • paints, coatings and adhesives • personal care products • petroleum refining • pharmaceuticals • plastic pipe • pulp and paper manufacturing • snow and ice control • soaps and detergents • water treatment
The Core Chemicals business is a leading global producer of each of its basic chemical products, which are sold to many industries worldwide, and also serve as key raw materials in the production of a variety of Dow’s performance and plastics products. • Products: Acids; Alcohols; Aldehydes; Caustic soda; Chlorine; Chloroform; COMBOTHERM™ blended
The Ethylene Oxide/Ethylene Glycol business is a key supplier of ethylene glycol to MEGlobal, a 50:50 joint venture and a world leader in the manufacture and marketing of merchant monoethylene glycol and diethylene glycol. Dow also supplies ethylene oxide to internal derivatives businesses. Ethylene glycol is used in polyester fiber, polyethylene terephthalate (PET) for food and beverage container applications, polyester film and antifreeze. • Products: Ethylene glycol (EG); Ethylene oxide (EO)
The Basic Chemicals segment also includes the results of MEGlobal and a portion of the results of EQUATE Petrochemical Company K.S.C. and the OPTIMAL Group of Companies, all joint ventures of the Company.
HYDROCARBONS AND ENERGY Applications: polymer and chemical production • power
The Hydrocarbons and Energy business encompasses the procurement of fuels, natural gas liquids and crude oil-based raw materials, as well as the supply of monomers, power and steam principally for use in Dow’s global operations. The business regularly sells its byproducts; the business also buys and sells products in order to balance regional production capabilities and derivative requirements. The business also sells products to certain Dow joint ventures. Dow is the world leader in the production of olefins and aromatics. • Products: Benzene; Butadiene; Butylene; Cumene; Ethylene; Propylene; Styrene; Power, steam and other
utilities The Hydrocarbons and Energy segment also includes the results of Compañía Mega S.A. and a portion of the results of the SCG-Dow Group, both joint ventures of the Company.
Unallocated and Other includes the results of New Ventures (which includes new business incubation platforms focused on identifying and pursuing new commercial opportunities); Venture Capital; the Company’s insurance operations and environmental operations; and certain overhead and other cost recovery variances not allocated to the operating segments.
The Dow Chemical Company and Subsidiaries Notes to the Consolidated Financial Statements
111
Transfers of products between operating segments are generally valued at cost. However, transfers of products to Agricultural Sciences from other segments are generally valued at market-based prices; the revenues generated by these transfers are provided in the following table:
Operating Segment Information
In millions Performance
Plastics Performance
Chemicals Agricultural
Sciences Basic
Plastics Basic
Chemicals Hydrocarbons
and Energy Unallocated
and Other
Total 2007 Sales to external customers $15,116 $8,351 $3,779 $12,878 $5,863 $7,105 $ 421 $53,513 Intersegment revenues 32 63 - 5 72 - (172) - Equity in earnings of
affiliates 196 647 23 498 538 397 (14) 2,285 Depreciation and amortization 622 388 131 448 378 108 4 2,079 Capital expenditures 230 334 95 246 230 462 - 1,597 (1) See Note B for information regarding restructuring activities. (2) See Note C for information regarding purchased in-process research and development. (3) The Company uses EBIT (which Dow defines as earnings before interest, income taxes and minority interests) as its measure of profit/loss for segment
reporting purposes. EBIT by operating segment includes all operating items relating to the businesses; items that principally apply to the Company as a whole are assigned to Unallocated and Other. A reconciliation of EBIT to “Net Income Available for Common Stockholders” is provided below:
In millions 2007 2006 2005 EBIT $4,683 $5,403 $6,963 + Interest income 130 185 138 - Interest expense and amortization of debt discount 584 616 702 - Provision for income taxes 1,244 1,155 1,782 - Minority interests’ share in income 98 93 82 + Cumulative effect of change in accounting principle - - (20)Net Income Available for Common Stockholders $2,887 $3,724 $4,515
(4) See Note J for information regarding the asbestos-related credit.
The Dow Chemical Company and Subsidiaries Notes to the Consolidated Financial Statements
112
NOTE S – Operating Segments and Geographic Areas – Continued The Company operates 150 manufacturing sites in 35 countries. The United States is home to 42 of these sites,
representing 53 percent of the Company’s long-lived assets. Sales are attributed to geographic areas based on customer location; long-lived assets are attributed to geographic areas based on asset location.
Geographic Area Information In millions United States Europe (1) Rest of World Total 2007 Sales to external customers $18,271 $19,614 $15,628 $53,513 Long-lived assets (2) $7,586 $4,542 $2,260 $14,388 2006 Sales to external customers $18,172 $16,776 $14,176 $49,124 Long-lived assets (2) $7,505 $3,946 $2,271 $13,722 2005 Sales to external customers $17,524 $15,561 $13,222 $46,307 Long-lived assets (2) $7,314 $3,676 $2,547 $13,537 (1) Sales to customers in the Middle East and Africa, previously reported with Europe, are now aligned with Rest of World;
prior year sales have been adjusted to reflect this realignment. (2) Long-lived assets in Germany represented approximately 14 percent of the total at December 31, 2007 and 11 percent of
the total at December 31, 2006 and December 31, 2005.
In millions, except per share amounts (Unaudited)2007 1st 2nd 3rd 4th YearNet sales 12,432$ 13,265$ 13,589$ 14,227$ 53,513$ Cost of sales 10,605 11,398 11,864 12,533 46,400 Gross Margin 1,827 1,867 1,725 1,694 7,113 Restructuring (charges) credit - 4 - (582) (578) Purchased in-process research and development (charges) credit - - (59) 2 (57) Net income available for common stockholders 973 1,039 403 472 2,887 Earnings per common share - basic (1) 1.01 1.09 0.42 0.50 3.03Earnings per common share - diluted (1) 1.00 1.07 0.42 0.49 2.99Common stock dividends declared per share of common stock 0.375 0.42 0.42 0.42 1.635
Market price range of common stock: (2) High 47.26 47.60 47.96 47.43 47.96 Low 39.02 43.71 38.89 39.20 38.89
2006 1st 2nd 3rd 4th YearNet sales 12,020$ 12,509$ 12,359$ 12,236$ 49,124$ Cost of sales 9,803 10,624 10,600 10,499 41,526 Gross Margin 2,217 1,885 1,759 1,737 7,598 Restructuring charges - - (579) (12) (591) Asbestos-related credit - - - 177 177 Net income available for common stockholders 1,214 1,023 512 975 3,724 Earnings per common share - basic (1) 1.25 1.06 0.53 1.02 3.87Earnings per common share - diluted 1.24 1.05 0.53 1.00 3.82Common stock dividends declared per share of common stock 0.375 0.375 0.375 0.375 1.50
Market price range of common stock: (2) High 45.15 43.10 39.98 41.55 45.15 Low 40.26 37.01 33.00 38.13 33.00See Notes to the Consolidated Financial Statements.
(1) Due to a decline in the share count, the sum of the four quarters does not equal the earnings per share amount calculated for the year.(2) Composite price as reported by the New York Stock Exchange.
The Dow Chemical Company and SubsidiariesSelected Quarterly Financial Data
113
The Dow Chemical Company and Subsidiaries PART II
114
ITEM 9. CHANGES IN AND DISAGREEMENTS WITH ACCOUNTANTS ON ACCOUNTING AND FINANCIAL DISCLOSURE. Not applicable. ITEM 9A. CONTROLS AND PROCEDURES. Evaluation of Disclosure Controls and Procedures As of the end of the period covered by this Annual Report on Form 10-K, the Company carried out an evaluation, under the supervision and with the participation of the Company’s Disclosure Committee and the Company’s management, including the Chief Executive Officer and the Chief Financial Officer, of the effectiveness of the design and operation of the Company’s disclosure controls and procedures pursuant to paragraph (b) of Exchange Act Rules 13a-15 and 15d-15. Based upon that evaluation, the Chief Executive Officer and the Chief Financial Officer concluded that the Company’s disclosure controls and procedures were effective. Changes in Internal Control Over Financial Reporting There were no changes in the Company’s internal control over financial reporting identified in connection with the evaluation required by paragraph (d) of Exchange Act Rules 13a-15 or 15d-15 that was conducted during the last fiscal quarter that have materially affected, or are reasonably likely to materially affect, the Company’s internal control over financial reporting. Management’s Report on Internal Control Over Financial Reporting Management is responsible for establishing and maintaining adequate internal control over financial reporting. The Company’s internal control framework and processes are designed to provide reasonable assurance to management and the Board of Directors regarding the reliability of financial reporting and the preparation of the Company’s consolidated financial statements in accordance with accounting principles generally accepted in the United States of America.
The Company’s internal control over financial reporting includes those policies and procedures that: • pertain to the maintenance of records that, in reasonable detail, accurately and fairly reflect the transactions and
dispositions of the assets of the Company; • provide reasonable assurance that transactions are recorded properly to allow for the preparation of financial
statements in accordance with generally accepted accounting principles, and that receipts and expenditures of the Company are being made only in accordance with authorizations of management and Directors of the Company;
• provide reasonable assurance regarding prevention or timely detection of unauthorized acquisition, use, or disposition of the Company’s assets that could have a material effect on the consolidated financial statements; and
• provide reasonable assurance as to the detection of fraud. Because of its inherent limitations, any system of internal control over financial reporting can provide only reasonable
assurance and may not prevent or detect misstatements. Management assessed the effectiveness of the Company’s internal control over financial reporting and concluded that, as
of December 31, 2007, such internal control is effective. In making this assessment, management used the criteria set forth by the Committee of Sponsoring Organizations of the Treadway Commission (“COSO”) in Internal Control—Integrated Framework.
The Company’s independent auditors, Deloitte & Touche LLP, with direct access to the Company’s Board of Directors through its Audit Committee, have audited the consolidated financial statements prepared by the Company. Their report on the consolidated financial statements is included in Part II, Item 8. Financial Statements and Supplementary Data. Deloitte & Touche LLP’s report on the Company’s internal control over financial reporting is included herein. /s/ ANDREW N. LIVERIS /s/ GEOFFERY E. MERSZEI Andrew N. Liveris Geoffery E. Merszei President, Chief Executive Officer and Executive Vice President and Chief Financial Officer Chairman of the Board /s/ WILLIAM H. WEIDEMAN William H. Weideman Vice President and Controller February 13, 2008
The Dow Chemical Company and Subsidiaries PART II
115
Report of Independent Registered Public Accounting Firm To the Board of Directors and Stockholders of The Dow Chemical Company: We have audited the internal control over financial reporting of The Dow Chemical Company and subsidiaries (“the Company”) as of December 31, 2007, based on criteria established in Internal Control — Integrated Framework issued by the Committee of Sponsoring Organizations of the Treadway Commission. The Company's management is responsible for maintaining effective internal control over financial reporting and for its assessment of the effectiveness of internal control over financial reporting, included in the accompanying Management’s Report on Internal Control Over Financial Reporting. Our responsibility is to express an opinion on the Company's internal control over financial reporting based on our audit.
We conducted our audit in accordance with the standards of the Public Company Accounting Oversight Board (United States). Those standards require that we plan and perform the audit to obtain reasonable assurance about whether effective internal control over financial reporting was maintained in all material respects. Our audit included obtaining an understanding of internal control over financial reporting, assessing the risk that a material weakness exists, testing and evaluating the design and operating effectiveness of internal control based on the assessed risk, and performing such other procedures as we considered necessary in the circumstances. We believe that our audit provides a reasonable basis for our opinion.
A company's internal control over financial reporting is a process designed by, or under the supervision of, the company's principal executive and principal financial officers, or persons performing similar functions, and effected by the company's board of directors, management, and other personnel to provide reasonable assurance regarding the reliability of financial reporting and the preparation of financial statements for external purposes in accordance with generally accepted accounting principles. A company's internal control over financial reporting includes those policies and procedures that (1) pertain to the maintenance of records that, in reasonable detail, accurately and fairly reflect the transactions and dispositions of the assets of the company; (2) provide reasonable assurance that transactions are recorded as necessary to permit preparation of financial statements in accordance with generally accepted accounting principles, and that receipts and expenditures of the company are being made only in accordance with authorizations of management and directors of the company; and (3) provide reasonable assurance regarding prevention or timely detection of unauthorized acquisition, use, or disposition of the company's assets that could have a material effect on the financial statements.
Because of the inherent limitations of internal control over financial reporting, including the possibility of collusion or improper management override of controls, material misstatements due to error or fraud may not be prevented or detected on a timely basis. Also, projections of any evaluation of the effectiveness of the internal control over financial reporting to future periods are subject to the risk that the controls may become inadequate because of changes in conditions, or that the degree of compliance with the policies or procedures may deteriorate.
In our opinion, the Company maintained, in all material respects, effective internal control over financial reporting as of December 31, 2007, based on the criteria established in Internal Control — Integrated Framework issued by the Committee of Sponsoring Organizations of the Treadway Commission.
We have also audited, in accordance with the standards of the Public Company Accounting Oversight Board (United States), the consolidated financial statements and financial statement schedule listed in the Index at Item 15 (a) 2. as of and for the year ended December 31, 2007 of the Company and our report dated February 14, 2008 expressed an unqualified opinion on those financial statements and financial statement schedule. /s/ DELOITTE & TOUCHE LLP Deloitte & Touche LLP Midland, Michigan February 14, 2008
The Dow Chemical Company and Subsidiaries PART II
116
ITEM 9B. OTHER INFORMATION. None.
The Dow Chemical Company and Subsidiaries PART III
117
ITEM 10. DIRECTORS, EXECUTIVE OFFICERS AND CORPORATE GOVERNANCE. Information relating to Directors, certain executive officers and certain corporate governance matters (including identification of Audit Committee members and financial expert(s)) is contained in the definitive Proxy Statement for the Annual Meeting of Stockholders of The Dow Chemical Company to be held on May 15, 2008, and is incorporated herein by reference. See also the information regarding executive officers of the registrant set forth in Part I under the caption “Executive Officers of the Registrant” in reliance on General Instruction G to Form 10-K.
On July 10, 2003, the Board of Directors of the Company adopted a code of ethics that applies to its principal executive officer, principal financial officer and principal accounting officer, and is incorporated herein by reference to Exhibit 14 to the Company’s Annual Report on Form 10-K for the year ended December 31, 2003. ITEM 11. EXECUTIVE COMPENSATION. Information relating to executive compensation and the Company’s equity compensation plans is contained in the definitive Proxy Statement for the Annual Meeting of Stockholders of The Dow Chemical Company to be held on May 15, 2008, and is incorporated herein by reference. ITEM 12. SECURITY OWNERSHIP OF CERTAIN BENEFICIAL OWNERS AND MANAGEMENT AND RELATED STOCKHOLDER MATTERS. Information with respect to beneficial ownership of Dow common stock by each Director and all Directors and executive officers of the Company as a group is contained in the definitive Proxy Statement for the Annual Meeting of Stockholders of The Dow Chemical Company to be on held May 15, 2008, and is incorporated herein by reference.
Information relating to any person who beneficially owns in excess of 5 percent of the total outstanding shares of Dow common stock is contained in the definitive Proxy Statement for the Annual Meeting of Stockholders of The Dow Chemical Company to be on held May 15, 2008, and is incorporated herein by reference.
Information with respect to compensation plans under which equity securities are authorized for issuance is contained in the definitive Proxy Statement for the Annual Meeting of Stockholders of The Dow Chemical Company to be held on May 15, 2008, and is incorporated herein by reference. ITEM 13. CERTAIN RELATIONSHIPS AND RELATED TRANSACTIONS, AND DIRECTOR INDEPENDENCE. There were no reportable relationships or related transactions in 2007.
Information relating to director independence is contained in the definitive Proxy Statement for the Annual Meeting of Stockholders of The Dow Chemical Company to be held on May 15, 2008, and is incorporated herein by reference. ITEM 14. PRINCIPAL ACCOUNTING FEES AND SERVICES. Information with respect to fees and services related to the Company’s independent auditors, Deloitte & Touche LLP, and the disclosure of the Audit Committee’s pre-approval policies and procedures are contained in the definitive Proxy Statement for the Annual Meeting of Stockholders of The Dow Chemical Company to be held on May 15, 2008, and are incorporated herein by reference.
The Dow Chemical Company and Subsidiaries PART IV
118
ITEM 15. EXHIBITS, FINANCIAL STATEMENT SCHEDULES.
(a) The following documents are filed as part of this report: (1) The Company’s 2007 Consolidated Financial Statements and the Report of Independent Registered Public
Accounting Firm are included in Part II, Item 8. Financial Statements and Supplementary Data.
(2) Financial Statement Schedules – The following Financial Statement Schedule should be read in conjunction with the Consolidated Financial Statements and Report of Independent Registered Public Accounting Firm included in Part II, Item 8 of this Annual Report on Form 10-K:
Schedule II Valuation and Qualifying Accounts
Schedules other than the one listed above are omitted due to the absence of conditions under which they are required or because the information called for is included in the Consolidated Financial Statements or the Notes to the Consolidated Financial Statements.
(3) Exhibits – See the Exhibit Index on pages 121-124 of this Annual Report on Form 10-K for exhibits filed with
this Annual Report on Form 10-K or incorporated by reference. The following exhibits, listed on the Exhibit Index, are filed with this Annual Report on Form 10-K:
Exhibit No. Description of Exhibit
10(s) A copy of the Summary Plan Description for The Dow Chemical Company Company-Paid Life Insurance Plan, Employee-Paid Life Insurance Plan, and Dependent Life Insurance Plan, amended and restated on February 7, 2008, for the Plan Year beginning January 1, 2008.
10(t) A copy of the Summary Plan Description for The Dow Chemical Company Retiree Company-Paid Life Insurance Plan, Retiree Optional Life Insurance Plan, and Retiree Dependent Life Insurance Plan, amended and restated on October 1, 2007, effective as of January 1, 2008.
10(u) A copy of the Amended and Restated 2003 Non-Employee Directors’ Stock Incentive Plan, adopted by the Board of Directors of The Dow Chemical Company on December 10, 2007; originally incorporated by reference to Appendix C to the definitive Proxy Statement for the Annual Meeting of Stockholders of The Dow Chemical Company held on May 8, 2003; as Section 13(a) thereof was amended by the Board of Directors of The Dow Chemical Company on October 11, 2007, incorporated by reference to Exhibit 10(ii) to The Dow Chemical Company Quarterly Report on Form 10-Q for the quarter ended September 30, 2007.
10(jj) A copy of a form of a Change in Control Executive Severance Agreement - Tier 1. 10(kk) A copy of a form of a Change in Control Executive Severance Agreement - Tier 2. 21 Subsidiaries of The Dow Chemical Company. 23(a) Consent of Independent Registered Public Accounting Firm. 23(b) Analysis, Research & Planning Corporation’s Consent. 31(a) Certification Pursuant to Section 302 of the Sarbanes-Oxley Act of 2002. 31(b) Certification Pursuant to Section 302 of the Sarbanes-Oxley Act of 2002. 32(a) Certification Pursuant to Section 906 of the Sarbanes-Oxley Act of 2002. 32(b) Certification Pursuant to Section 906 of the Sarbanes-Oxley Act of 2002.
A copy of any exhibit can be obtained via the Internet through the Company’s Investor Relations webpage on www.dow.com, or the Company will provide a copy of any exhibit upon receipt of a written request for the particular exhibit or exhibits desired. All requests should be addressed to the Vice President and Controller of the Company at the address of the Company’s principal executive offices.
The Dow Chemical Company and Subsidiaries Schedule II Valuation and Qualifying Accounts
(In millions) For the Years Ended December 31
119
COLUMN A COLUMN B COLUMN C COLUMN D COLUMN E Balance Deductions Balance
at Beginning Additions to from at End Description of Year Reserves Reserves of Year
2007 RESERVES DEDUCTED FROM ASSETS TO WHICH THEY APPLY:
For doubtful receivables $122 14 18 (a) $118
Other investments and noncurrent receivables $365 122 14 $473
2006 RESERVES DEDUCTED FROM ASSETS TO WHICH THEY APPLY:
For doubtful receivables $169 9 56 (a) $122
Other investments and noncurrent receivables $329 47 11 $365
2005 RESERVES DEDUCTED FROM ASSETS TO WHICH THEY APPLY:
For doubtful receivables $136 52 19 (a) $169
Other investments and noncurrent receivables $319 29 19 $329
2007 2006 2005 (a) Deductions represent:
Notes and accounts receivable written off $22 $44 $12 Credits to profit and loss - 1 3 Miscellaneous other (4) 11 4
$18 $56 $19
The Dow Chemical Company and Subsidiaries Signatures
120
Pursuant to the requirements of Section 13 or 15(d) of the Securities Exchange Act of 1934, the Registrant has duly caused this Annual Report on Form 10-K to be signed on its behalf by the undersigned, thereunto duly authorized, on the 18th day of February 2008.
THE DOW CHEMICAL COMPANY By: /s/ W. H. WEIDEMAN W. H. Weideman, Vice President and Controller Pursuant to the requirements of the Securities Exchange Act of 1934, this Annual Report on Form 10-K has been signed on the 18th day of February 2008 by the following persons in the capacities indicated: /s/ A. A. ALLEMANG A. A. Allemang, Director and Senior Advisor
/s/ G. E. MERSZEI G. E. Merszei, Director, Executive Vice President and Chief Financial Officer
/s/ J. K. BARTONJ. K. Barton, Director
/s/ D. H. REILLEY D. H. Reilley, Director
/s/ J. A. BELL J. A. Bell, Director
/s/ J. M. RINGLER J. M. Ringler, Director
/s/ J. M. FETTIG J. M. Fettig, Director
/s/ R. G. SHAW R. G. Shaw, Director
/s/ B. H. FRANKLIN B. H. Franklin, Director
/s/ P. G. STERN P. G. Stern, Presiding Director
/s/ J. B. HESS J. B. Hess, Director
/s/ W. H. WEIDEMAN W. H. Weideman, Vice President and Controller
/s/ A. N. LIVERISA. N. Liveris, Director, President, Chief Executive Officer and Chairman of the Board
The Dow Chemical Company and Subsidiaries Exhibit Index
EXHIBIT NO. DESCRIPTION
121
2 Agreement and Plan of Merger dated as of August 3, 1999 among Union Carbide Corporation, The Dow Chemical Company and Transition Sub Inc., incorporated by reference to Annex A to the proxy statement/prospectus included in The Dow Chemical Company’s Registration Statement on Form S-4, File No. 333-88443, filed October 5, 1999.
3(i) The Restated Certificate of Incorporation of The Dow Chemical Company as filed with the Secretary of
State, State of Delaware on May 11, 2007, incorporated by reference to Exhibit 3(i) to The Dow Chemical Company Quarterly Report on Form 10-Q for the quarter ended June 30, 2007.
3(ii) The Bylaws of The Dow Chemical Company, as amended and re-adopted in full on April 13, 2006,
effective May 11, 2006, incorporated by reference to Exhibit 3(ii) to The Dow Chemical Company Quarterly Report on Form 10-Q for the quarter ended March 31, 2006; as amended and re-adopted in full on February 13, 2008, effective June 1, 2008, incorporated by reference to Exhibit 99.1 to The Dow Chemical Company Current Report on Form 8-K filed on February 15, 2008.
4 Indenture, dated as of April 1, 1992, between The Dow Chemical Company and the First National Bank of
Chicago, as trustee (incorporated by reference to Exhibit 4.1 to The Dow Chemical Company’s Registration Statement on Form S-3, File No. 333-88617 (the "S-3 Registration Statement")), as amended by the Supplemental Indenture, dated as of January 1, 1994, between The Dow Chemical Company and The First National Bank of Chicago, as trustee (incorporated by reference to Exhibit 4.2 to the S-3 Registration Statement), as amended by the Second Supplemental Indenture, dated as of October 1, 1999, between The Dow Chemical Company and Bank One Trust Company, N.A. (formerly The First National Bank of Chicago), as trustee (incorporated by reference to Exhibit 4.3 to the S-3 Registration Statement), as amended by the Third Supplemental Indenture, dated as of May 15, 2001, between The Dow Chemical Company and Bank One Trust Company, N.A. (formerly The First National Bank of Chicago), as trustee (incorporated by reference to Exhibit 4.4 to The Dow Chemical Company’s Registration Statement on Form S-4, File No. 333-67368); and all other such indentures that define the rights of holders of long-term debt of The Dow Chemical Company and its consolidated subsidiaries as shall be requested to be furnished to the Securities and Exchange Commission pursuant to Item 601(b)(4)(iii)(A) of Regulation S-K.
10(a) The Dow Chemical Company Executives’ Supplemental Retirement Plan, amended and restated on
December 31, 2006, effective as of January 1, 2005, incorporated by reference to Exhibit 10(a) to The Dow Chemical Company Annual Report on Form 10-K for the year ended December 31, 2006.
10(b) The Dow Chemical Company 1979 Award and Option Plan, as amended through May 1983 (included as
part of and incorporated by reference to the Prospectus contained in Post-Effective Amendment No. 4 to The Dow Chemical Company’s Registration Statement on Form S-8, File No. 2-64560, filed June 23, 1983), as amended April 12, 1984 (incorporated by reference to Exhibit 10(ff) to The Dow Chemical Company Annual Report on Form 10-K for the year ended December 31, 1984), as amended April 18, 1985 (incorporated by reference to Exhibit 10(fff) to The Dow Chemical Company Annual Report on Form 10-K for the year ended December 31, 1985), as amended October 30, 1987 (incorporated by reference to Exhibit 10(j) to The Dow Chemical Company Annual Report on Form 10-K for the year ended December 31, 1987).
10(c) The Dow Chemical Company Voluntary Deferred Compensation Plan for Outside Directors (for deferrals
made through December 31, 2004), as amended effective as of July 1, 1994, incorporated by reference to Exhibit 10(f) to The Dow Chemical Company Annual Report on Form 10-K for the year ended December 31, 1994, as amended in the manner described in the definitive Proxy Statement for the Annual Meeting of Stockholders of The Dow Chemical Company held on May 14, 1998, incorporated by reference.
10(d) Intentionally left blank. 10(e) The Dow Chemical Company Dividend Unit Plan, incorporated by reference to Exhibit 10(j) to The Dow
Chemical Company Annual Report on Form 10-K for the year ended December 31, 1992.
The Dow Chemical Company and Subsidiaries Exhibit Index
EXHIBIT NO. DESCRIPTION
122
10(f) The Dow Chemical Company 1988 Award and Option Plan (included as part of and incorporated by
reference to the Prospectus contained in The Dow Chemical Company’s Registration Statement on Form S-8, File No. 33-21748, filed May 16, 1988); as amended during 1991 (incorporated by reference to Exhibit 10(k) to The Dow Chemical Company Annual Report on Form 10-K for the year ended December 31, 1991); as amended effective as of January 1, 1997 (incorporated by reference to Appendix A to the definitive Proxy Statement for the Annual Meeting of Stockholders of The Dow Chemical Company held on May 15, 1997); as amended pursuant to shareholder approval granted on May 9, 2002 (incorporated by reference to Agenda Item 3 of the definitive Proxy Statement for the Annual Meeting of Stockholders of The Dow Chemical Company held on May 9, 2002); as Section 15.08(i) thereof was amended and restated by a resolution adopted by the Board of Directors of The Dow Chemical Company on February 9, 2006 (incorporated by reference to Exhibit 10(f) to The Dow Chemical Company Quarterly Report on Form 10-Q for the quarter ended March 31, 2007).
10(g) Intentionally left blank. 10(h) The Dow Chemical Company 1994 Executive Performance Plan, incorporated by reference to the definitive
Proxy Statement for the Annual Meeting of Stockholders of The Dow Chemical Company held on May 12, 1994.
10(i) The Dow Chemical Company 1994 Non-Employee Directors’ Stock Plan, incorporated by reference to
Exhibit 10(o) to The Dow Chemical Company Annual Report on Form 10-K for the year ended December 31, 1994.
10(j) Intentionally left blank. 10(k) A written description of the 1998 Non-Employee Directors’ Stock Incentive Plan, incorporated by reference
to the definitive Proxy Statement for the Annual Meeting of Stockholders of The Dow Chemical Company held on May 14, 1998.
10(l) A written description of compensation for Directors of The Dow Chemical Company, incorporated by
reference to the definitive Proxy Statement for the Annual Meeting of Stockholders of The Dow Chemical Company to be held on May 15, 2008.
10(m) A written description of the manner in which compensation is set for the Executive Officers of The Dow
Chemical Company, incorporated by reference to the definitive Proxy Statement for the Annual Meeting of Stockholders of The Dow Chemical Company to be held on May 15, 2008.
10(n) A resolution adopted by the Board of Directors of The Dow Chemical Company on May 5, 1971, and most
recently amended on July 9, 1998, describing the employee compensation program for decelerating Directors, incorporated by reference to Exhibit 10(p) to The Dow Chemical Company Annual Report on Form 10-K for the year ended December 31, 1998; as amended, re-adopted in full and restated on March 21, 2003, incorporated by reference to Exhibit 10(n) to The Dow Chemical Company Quarterly Report on Form 10-Q for the quarter ended March 31, 2003; as amended, re-adopted in full and restated on February 10, 2005, incorporated by reference to Exhibit 10(n) to The Dow Chemical Company Quarterly Report on Form 10-Q for the quarter ended March 31, 2005.
10(o) The template used for The Dow Chemical Company Key Employee Insurance Program (“KEIP”), which
provides benefits using insurance policies that replace benefits otherwise payable under The Dow Chemical Company Executives’ Supplemental Retirement Plan and Company-Paid Life Insurance Plan, incorporated by reference to Exhibit 10(o) to The Dow Chemical Company Annual Report on Form 10-K for the year ended December 31, 2002. KEIP is a component of the annual pension benefits listed in and incorporated by reference to the definitive Proxy Statement for the Annual Meeting of Stockholders of The Dow Chemical Company to be held on May 15, 2008.
The Dow Chemical Company and Subsidiaries Exhibit Index
EXHIBIT NO. DESCRIPTION
123
10(p) The Dow Chemical Company Elective Deferral Plan (for deferrals made through December 31, 2004), amended and restated as of September 1, 2006, incorporated by reference to Exhibit 10(p) to The Dow Chemical Company Quarterly Report on Form 10-Q for the quarter ended September 30, 2006.
10(q) Intentionally left blank. 10(r) Intentionally left blank. 10(s) A copy of the Summary Plan Description for The Dow Chemical Company Company-Paid Life Insurance
Plan, Employee-Paid Life Insurance Plan, and Dependent Life Insurance Plan, amended and restated on February 7, 2008, for the Plan Year beginning January 1, 2008.
10(t) A copy of the Summary Plan Description for The Dow Chemical Company Retiree Company-Paid Life
Insurance Plan, Retiree Optional Life Insurance Plan, and Retiree Dependent Life Insurance Plan, amended and restated on October 1, 2007, effective as of January 1, 2008.
10(u) A copy of the Amended and Restated 2003 Non-Employee Directors’ Stock Incentive Plan, adopted by the
Board of Directors of The Dow Chemical Company on December 10, 2007; originally incorporated by reference to Appendix C to the definitive Proxy Statement for the Annual Meeting of Stockholders of The Dow Chemical Company held on May 8, 2003; as Section 13(a) thereof was amended by the Board of Directors of The Dow Chemical Company on October 11, 2007, incorporated by reference to Exhibit 10(ii) to The Dow Chemical Company Quarterly Report on Form 10-Q for the quarter ended September 30, 2007.
10(v) Non-Qualified Stock Option Agreement Pursuant to The Dow Chemical Company 1994 Non-Employee
Directors’ Stock Plan, incorporated by reference to Exhibit 10.1 to The Dow Chemical Company Current Report on Form 8-K filed on September 3, 2004.
10(w) Non-Qualified Stock Option Agreement Pursuant to The Dow Chemical Company 2003 Non-Employee
Directors’ Stock Incentive Plan, incorporated by reference to Exhibit 10(w) to The Dow Chemical Company Quarterly Report on Form 10-Q for the quarter ended September 30, 2004.
10(x) Performance Shares Deferred Stock Agreement Pursuant to The Dow Chemical Company 1988 Award and
Option Plan, incorporated by reference to Exhibit 10(x) to The Dow Chemical Company Quarterly Report on Form 10-Q for the quarter ended September 30, 2004.
10(y) Deferred Stock Agreement Pursuant to The Dow Chemical Company 1988 Award and Option Plan,
incorporated by reference to Exhibit 10(y) to The Dow Chemical Company Quarterly Report on Form 10-Q for the quarter ended September 30, 2004.
10(z) Non-Qualified Stock Option Agreement Pursuant to The Dow Chemical Company 1988 Award and Option
Plan, incorporated by reference to Exhibit 10(z) to The Dow Chemical Company Quarterly Report on Form 10-Q for the quarter ended September 30, 2004.
10(aa) Settlement Agreement and General Release between Richard L. Manetta and The Dow Chemical Company
dated December 10, 2004, incorporated by reference to Exhibit 10.1 to The Dow Chemical Company Current Report on Form 8-K filed on December 16, 2004.
10(bb) Deferred Compensation Agreement between Richard L. Manetta and The Dow Chemical Company dated
December 10, 2004, incorporated by reference to Exhibit 10.2 to The Dow Chemical Company Current Report on Form 8-K filed on December 16, 2004.
10(cc) The Dow Chemical Company Voluntary Deferred Compensation Plan for Non-Employee Directors,
effective for deferrals after January 1, 2005, incorporated by reference to Exhibit 10(cc) to The Dow Chemical Company Annual Report on Form 10-K for the year ended December 31, 2004.
The Dow Chemical Company and Subsidiaries Exhibit Index
EXHIBIT NO. DESCRIPTION
124
10(dd) The Dow Chemical Company Elective Deferral Plan, effective for deferrals after January 1, 2005, amended
on November 1, 2006, incorporated by reference to Exhibit 10(dd) to The Dow Chemical Company Annual Report on Form 10-K for the year ended December 31, 2006.
10(ee) The template for communication to employee Directors who are decelerating pursuant to The Dow
Chemical Company Retirement Policy for Employee Directors, incorporated by reference to Exhibit 10(ee) to The Dow Chemical Company Quarterly Report on Form 10-Q for the quarter ended June 30, 2005.
10(ff) Purchase and Sale Agreement dated as of September 30, 2005 between Catalysts, Adsorbents and Process
Systems, Inc. and Honeywell Specialty Materials LLC, incorporated by reference to Exhibit 10(ff) to The Dow Chemical Company Quarterly Report on Form 10-Q for the quarter ended September 30, 2005.
10(gg) Employment agreement with Geoffery Merszei, Executive Vice President and Chief Financial Officer,
incorporated by reference to Exhibit 10(gg) to The Dow Chemical Company Annual Report on Form 10-K for the year ended December 31, 2005.
10(hh) Employment agreement dated June 18, 2005, between William F. Banholzer and The Dow Chemical
Company, incorporated by reference to the Current Report on Form 8-K filed on March 16, 2006. 10(ii) Intentionally left blank. 10(jj) A copy of a form of a Change in Control Executive Severance Agreement - Tier 1. 10(kk) A copy of a form of a Change in Control Executive Severance Agreement - Tier 2. 14 Code of Ethics for Principal Executive Officer, Principal Financial Officer and Principal Accounting
Officer, incorporated by reference to Exhibit 14 to The Dow Chemical Company Annual Report on Form 10-K for the year ended December 31, 2003.
21 Subsidiaries of The Dow Chemical Company. 23(a) Consent of Independent Registered Public Accounting Firm. 23(b) Analysis, Research & Planning Corporation’s Consent. 31(a) Certification Pursuant to Section 302 of the Sarbanes-Oxley Act of 2002. 31(b) Certification Pursuant to Section 302 of the Sarbanes-Oxley Act of 2002. 32(a) Certification Pursuant to Section 906 of the Sarbanes-Oxley Act of 2002. 32(b) Certification Pursuant to Section 906 of the Sarbanes-Oxley Act of 2002.
The Dow Chemical Company and Subsidiaries Trademark Listing
The following registered service mark of American Chemistry Council appears in this report: Responsible Care The following trademark of Dow Corning Corporation appears in this report: SYLTHERM Dow is a distributor of SYLTHERM products manufactured by Dow Corning Corporation The following trademark of Ann Arbor Technical Services, Inc. appears in this report: GeoMorph
126
This page intentionally left blank
127
Selected Exhibits
EXHIBIT 23(a) Consent of Independent Registered Public Accounting Firm
128
To the Board of Directors and Stockholders of The Dow Chemical Company: We consent to the incorporation by reference of our reports dated February 14, 2008, relating to the consolidated financial statements and financial statement schedule (which report expresses an unqualified opinion and includes an explanatory paragraph relating to a change in method of accounting for defined benefit pension and other postretirement plans to conform to Statement of Financial Accounting Standards No. 158), of The Dow Chemical Company, and the effectiveness of internal control over financial reporting appearing in this Annual Report on Form 10-K of The Dow Chemical Company for the year ended December 31, 2007, in the following Registration Statements of The Dow Chemical Company: Form S-3: Nos. 333-101647 333-140859 Form S-4: No. 333-88443 Form S-8: Nos. 2-64560 33-21748 33-51453 33-52841 33-58205 33-61795 333-27381 333-40271 333-43730 333-49183 333-67414 333-88443 333-91027 333-103518 333-103519 333-105080 333-115185 333-122932 333-145015 333-147074 /s/ DELOITTE & TOUCHE LLP Deloitte & Touche LLP
Midland, Michigan February 14, 2008
EXHIBIT 23(b) Analysis, Research & Planning Corporation’s Consent
129
The Dow Chemical Company: Analysis, Research & Planning Corporation (“ARPC”) hereby consents to the use of ARPC’s name and the reference to ARPC’s reports in this Annual Report on Form 10-K of The Dow Chemical Company for the year ended December 31, 2007, and the incorporation by reference thereof in the following Registration Statements of The Dow Chemical Company: Form S-3: Nos. 333-101647 333-140859 Form S-4: No. 333-88443 Form S-8: Nos. 2-64560 33-21748 33-51453 33-52841 33-58205 33-61795 333-27381 333-40271 333-43730 333-49183 333-67414 333-88443 333-91027 333-103518 333-103519 333-105080 333-115185 333-122932 333-145015 333-147074 /s/ B. THOMAS FLORENCE B. Thomas Florence President Analysis, Research & Planning Corporation February 15, 2008
The Dow Chemical Company and Subsidiaries EXHIBIT 31(a)
130
Certification Pursuant to Section 302 of the Sarbanes-Oxley Act of 2002
I, Andrew N. Liveris, certify that: 1. I have reviewed this annual report on Form 10-K of The Dow Chemical Company; 2. Based on my knowledge, this report does not contain any untrue statement of a material fact or omit to state a material
fact necessary to make the statements made, in light of the circumstances under which such statements were made, not misleading with respect to the period covered by this report;
3. Based on my knowledge, the financial statements, and other financial information included in this report, fairly present
in all material respects the financial condition, results of operations and cash flows of the registrant as of, and for, the periods presented in this report;
4. The registrant's other certifying officer and I are responsible for establishing and maintaining disclosure controls and
procedures (as defined in Exchange Act Rules 13a-15(e) and 15d-15(e)) and internal control over financial reporting (as defined in Exchange Act Rules 13a-15(f) and 15d-15(f)) for the registrant and have: a) designed such disclosure controls and procedures, or caused such disclosure controls and procedures to be designed
under our supervision, to ensure that material information relating to the registrant, including its consolidated subsidiaries, is made known to us by others within those entities, particularly during the period in which this report is being prepared;
b) designed such internal control over financial reporting, or caused such internal control over financial reporting to be designed under our supervision, to provide reasonable assurance regarding the reliability of financial reporting and the preparation of financial statements for external purposes in accordance with generally accepted accounting principles;
c) evaluated the effectiveness of the registrant's disclosure controls and procedures and presented in this report our conclusions about the effectiveness of the disclosure controls and procedures, as of the end of the period covered by this report based on such evaluation; and
d) disclosed in this report any change in the registrant’s internal control over financial reporting that occurred during the registrant’s most recent fiscal quarter (the registrant’s fourth fiscal quarter in the case of an annual report) that has materially affected, or is reasonably likely to materially affect, the registrant’s internal control over financial reporting; and
5. The registrant's other certifying officer and I have disclosed, based on our most recent evaluation of internal control over
financial reporting, to the registrant's auditors and the audit committee of registrant's board of directors (or persons performing the equivalent function): a) all significant deficiencies and material weaknesses in the design or operation of internal control over financial
reporting which are reasonably likely to adversely affect the registrant's ability to record, process, summarize and report financial information; and
b) any fraud, whether or not material, that involves management or other employees who have a significant role in the registrant's internal control over financial reporting.
Date: February 18, 2008 /s/ ANDREW N. LIVERIS Andrew N. Liveris President, Chief Executive Officer and Chairman of the Board
The Dow Chemical Company and Subsidiaries EXHIBIT 31(b)
131
Certification Pursuant to Section 302 of the Sarbanes-Oxley Act of 2002
I, Geoffery E. Merszei, certify that: 1. I have reviewed this annual report on Form 10-K of The Dow Chemical Company; 2. Based on my knowledge, this report does not contain any untrue statement of a material fact or omit to state a material
fact necessary to make the statements made, in light of the circumstances under which such statements were made, not misleading with respect to the period covered by this report;
3. Based on my knowledge, the financial statements, and other financial information included in this report, fairly present
in all material respects the financial condition, results of operations and cash flows of the registrant as of, and for, the periods presented in this report;
4. The registrant's other certifying officer and I are responsible for establishing and maintaining disclosure controls and
procedures (as defined in Exchange Act Rules 13a-15(e) and 15d-15(e)) and internal control over financial reporting (as defined in Exchange Act Rules 13a-15(f) and 15d-15(f)) for the registrant and have: a) designed such disclosure controls and procedures, or caused such disclosure controls and procedures to be designed
under our supervision, to ensure that material information relating to the registrant, including its consolidated subsidiaries, is made known to us by others within those entities, particularly during the period in which this report is being prepared;
b) designed such internal control over financial reporting, or caused such internal control over financial reporting to be designed under our supervision, to provide reasonable assurance regarding the reliability of financial reporting and the preparation of financial statements for external purposes in accordance with generally accepted accounting principles;
c) evaluated the effectiveness of the registrant's disclosure controls and procedures and presented in this report our conclusions about the effectiveness of the disclosure controls and procedures, as of the end of the period covered by this report based on such evaluation; and
d) disclosed in this report any change in the registrant’s internal control over financial reporting that occurred during the registrant’s most recent fiscal quarter (the registrant’s fourth fiscal quarter in the case of an annual report) that has materially affected, or is reasonably likely to materially affect, the registrant’s internal control over financial reporting; and
5. The registrant's other certifying officer and I have disclosed, based on our most recent evaluation of internal control over
financial reporting, to the registrant's auditors and the audit committee of registrant's board of directors (or persons performing the equivalent function): a) all significant deficiencies and material weaknesses in the design or operation of internal control over financial
reporting which are reasonably likely to adversely affect the registrant's ability to record, process, summarize and report financial information; and
b) any fraud, whether or not material, that involves management or other employees who have a significant role in the registrant's internal control over financial reporting.
Date: February 18, 2008 /s/ GEOFFERY E. MERSZEI Geoffery E. Merszei Executive Vice President and Chief Financial Officer
The Dow Chemical Company and Subsidiaries EXHIBIT 32(a)
132
Certification Pursuant to Section 906 of the Sarbanes-Oxley Act of 2002
I, Andrew N. Liveris, President, Chief Executive Officer and Chairman of the Board of The Dow Chemical Company (the “Company”), certify that: 1. the Annual Report on Form 10-K of the Company for the year ended December 31, 2007 as filed with the Securities and
Exchange Commission (the “Report”) fully complies with the requirements of Section 13(a) or 15(d) of the Securities Exchange Act of 1934; and
2. the information contained in the Report fairly presents, in all material respects, the financial condition and results of
operations of the Company. /s/ ANDREW N. LIVERIS Andrew N. Liveris President, Chief Executive Officer and Chairman of the Board February 18, 2008
The Dow Chemical Company and Subsidiaries EXHIBIT 32(b)
133
Certification Pursuant to Section 906 of the Sarbanes-Oxley Act of 2002
I, Geoffery E. Merszei, Executive Vice President and Chief Financial Officer of The Dow Chemical Company (the “Company”), certify that: 1. the Annual Report on Form 10-K of the Company for the year ended December 31, 2007 as filed with the Securities and
Exchange Commission (the “Report”) fully complies with the requirements of Section 13(a) or 15(d) of the Securities Exchange Act of 1934; and
2. the information contained in the Report fairly presents, in all material respects, the financial condition and results of
operations of the Company. /s/ GEOFFERY E. MERSZEI Geoffery E. Merszei Executive Vice President and Chief Financial Officer February 18, 2008
134
This page intentionally left blank
135
This page intentionally left blank
Stockholder return
The form of the charts above is in accordance with requirements of the U.S. Securities and Exchange Commission. Stockholders are cautioned against drawing any conclusions from the data contained therein, as past results are not necessarily indicative of future performance. These charts do not reflect the Company’s forecast of future financial performance.
The charts below illustrate the cumulative total return to Dow stockholders over certain periods of time. They depict a hypothetical $100 investment in Dow common stock on December 31 of the first year of the charts, and show the value of that investment over time until December 31, 2007, with all dividends reinvested in stock. Hypothetical investments of $100 in the Standard & Poor’s 500 Stock Index and the Standard & Poor’s 500 Chemicals Index are shown for comparison.
Five-Year Cumulative Total Return in $December 31, Dow Chemical S&P 500 S&P 500 Chemicals
2002 100.00 100.00 100.00
2003 145.84 128.67 126.51
2004 179.09 142.66 150.73
2005 163.31 149.66 149.80
2006 154.41 173.28 174.44
2007 158.44 182.79 222.12
Ten-Year Cumulative Total Return in $December 31, Dow Chemical S&P 500 S&P 500 Chemicals
1997 100.00 100.00 100.00
1998 93.02 128.58 93.69
1999 140.88 155.63 109.48
2000 120.16 141.46 99.57
2001 115.24 124.66 98.43
2002 105.81 97.12 99.08
2003 154.31 124.96 125.35
2004 189.49 138.55 149.34
2005 172.79 145.35 148.43
2006 163.38 168.29 172.84
2007 167.65 177.53 220.08
Five-Year Cumulative Total Return Ten-Year Cumulative Total Return


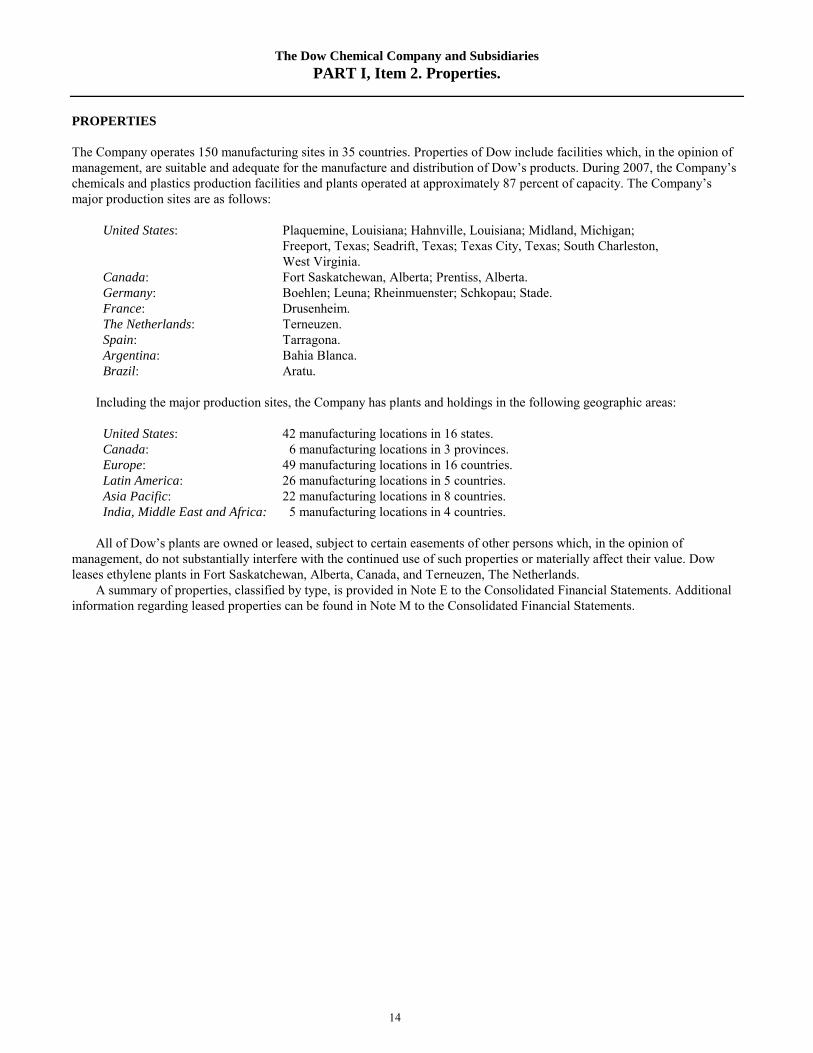
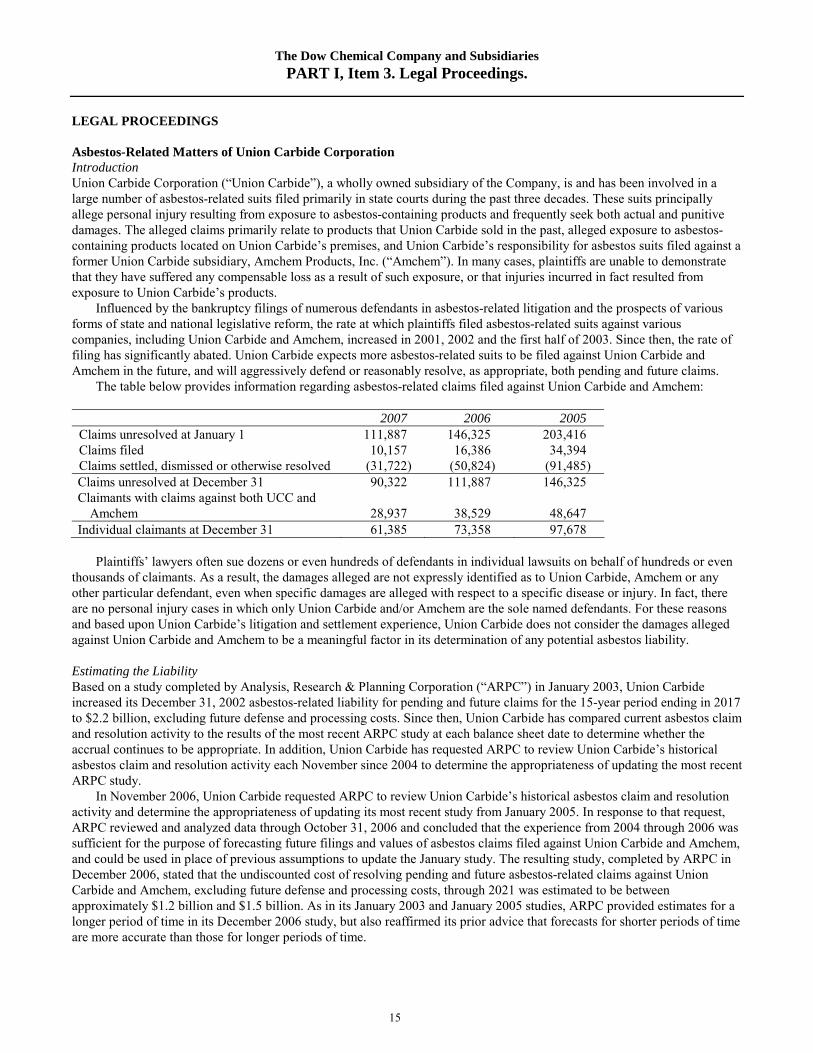


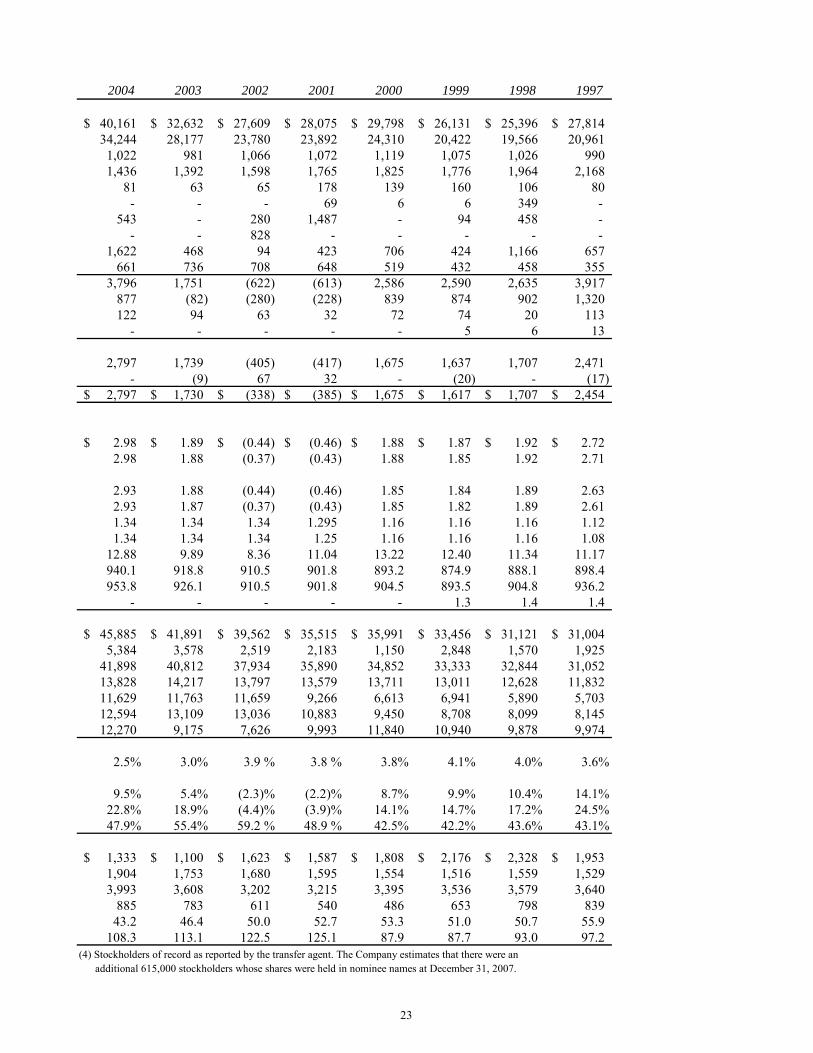


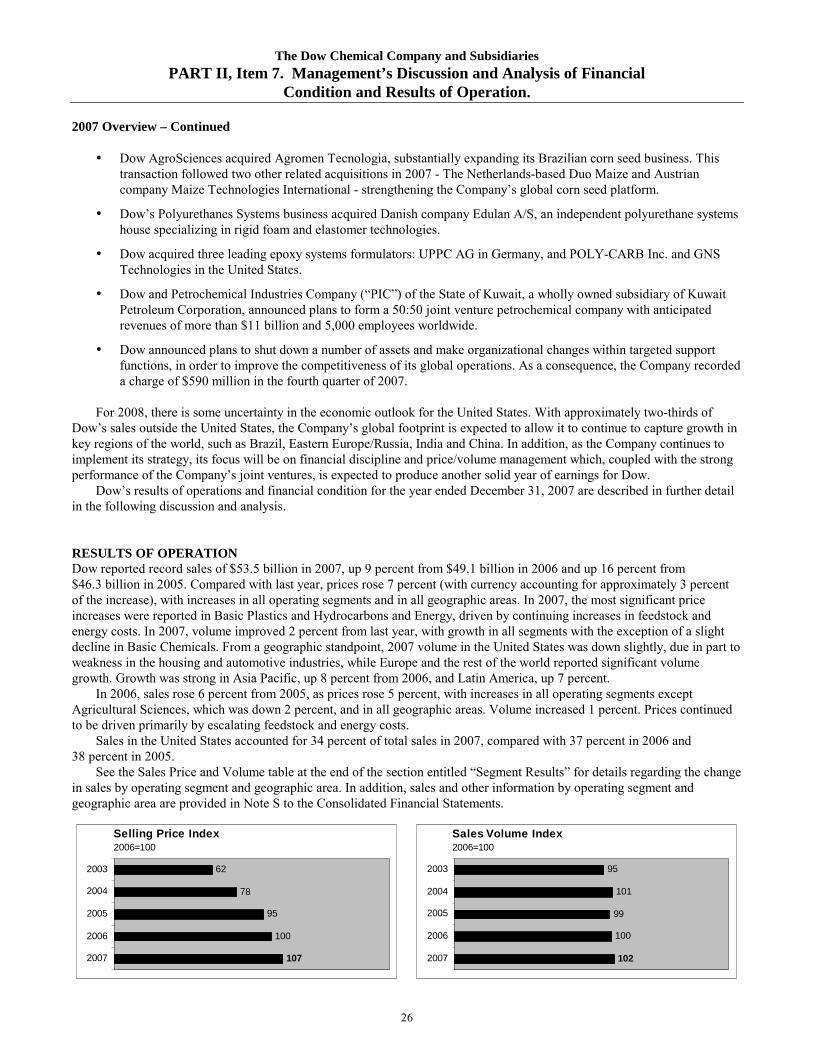


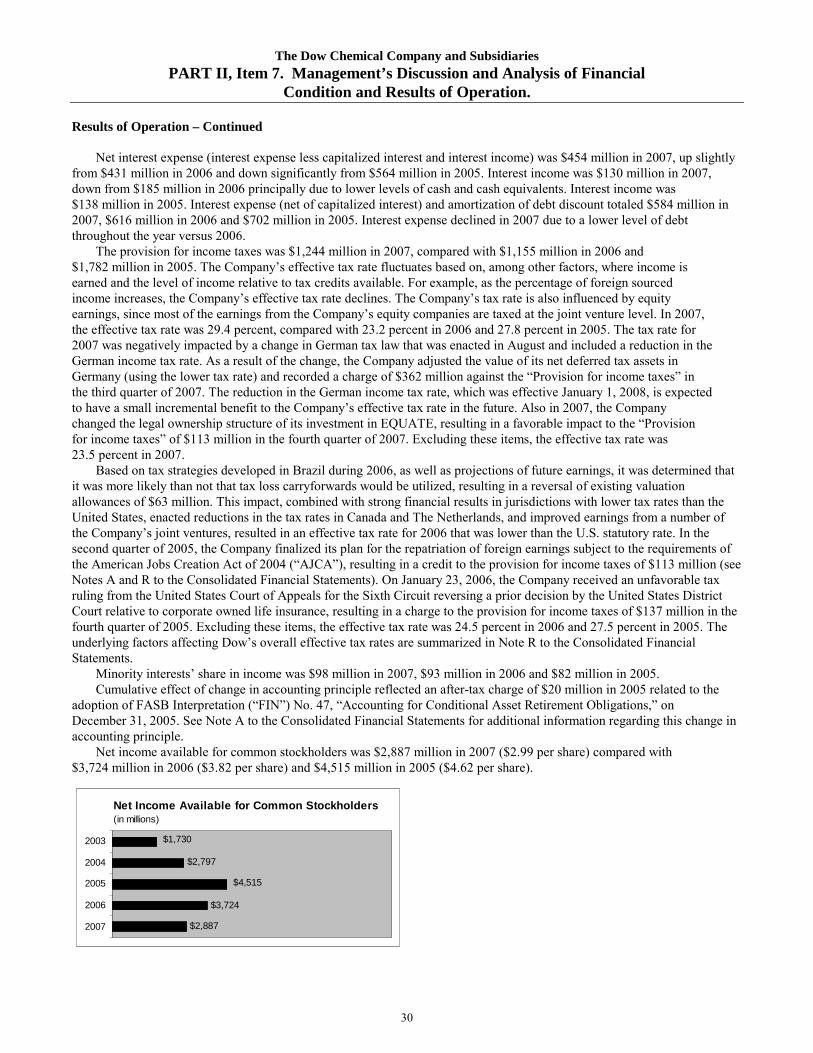

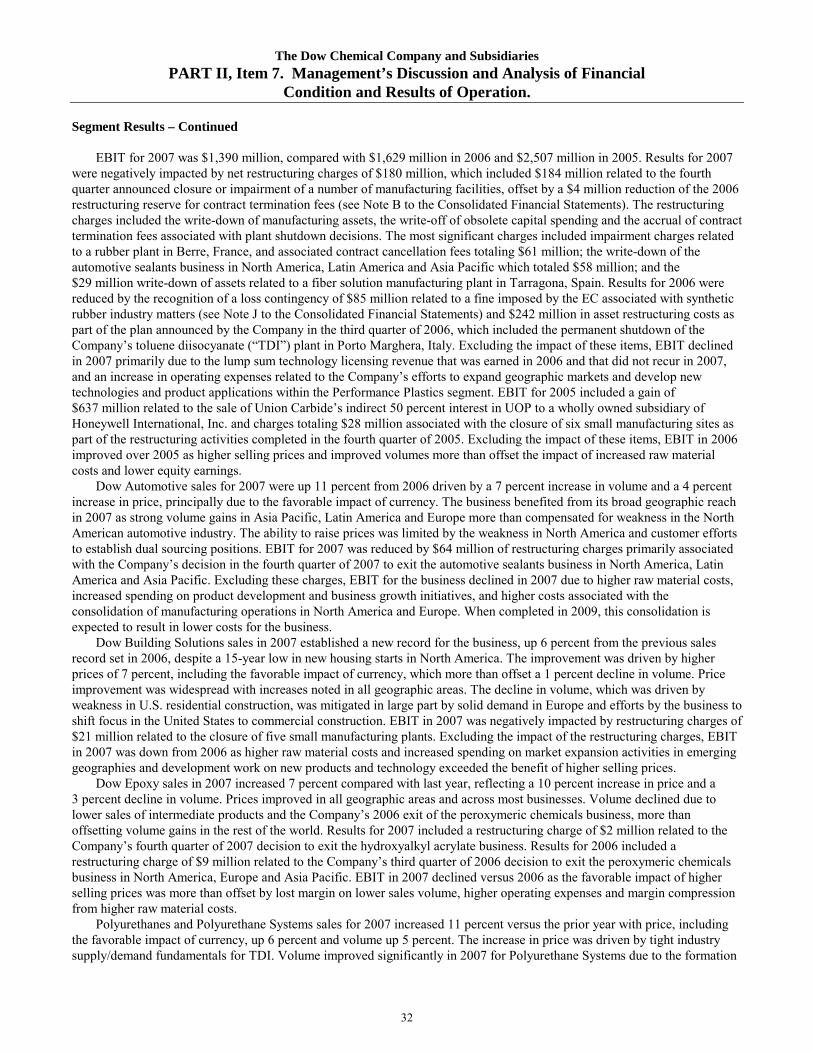


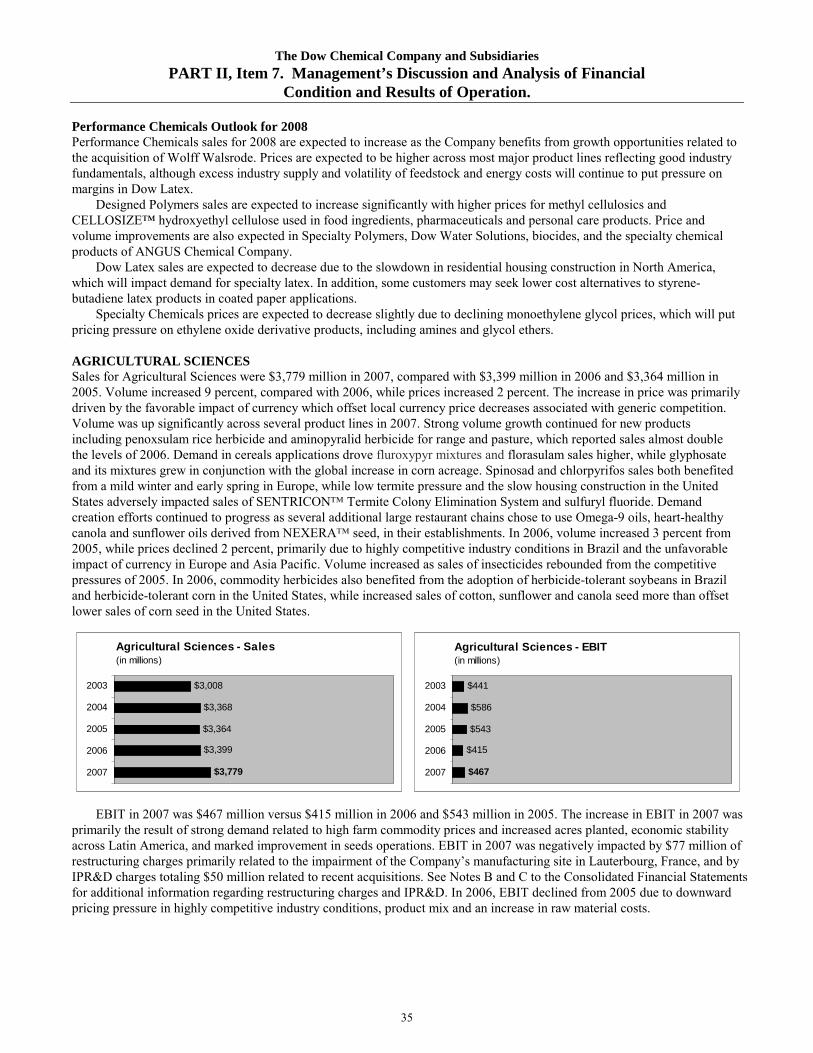
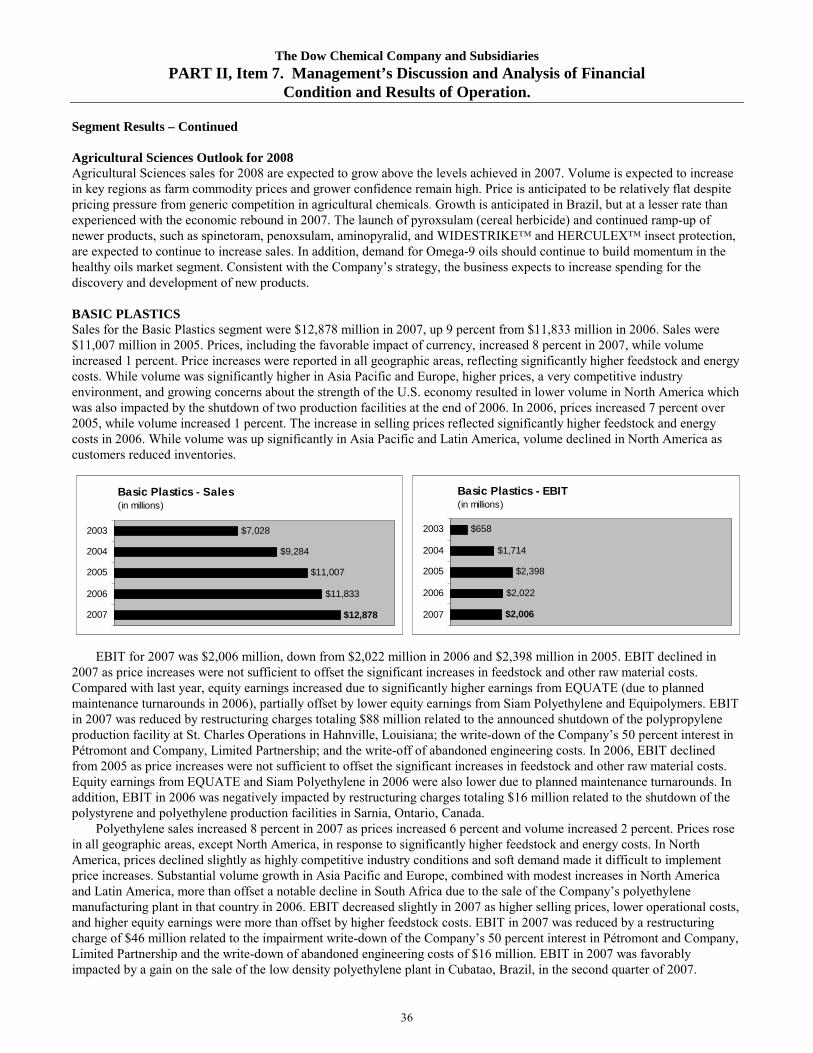


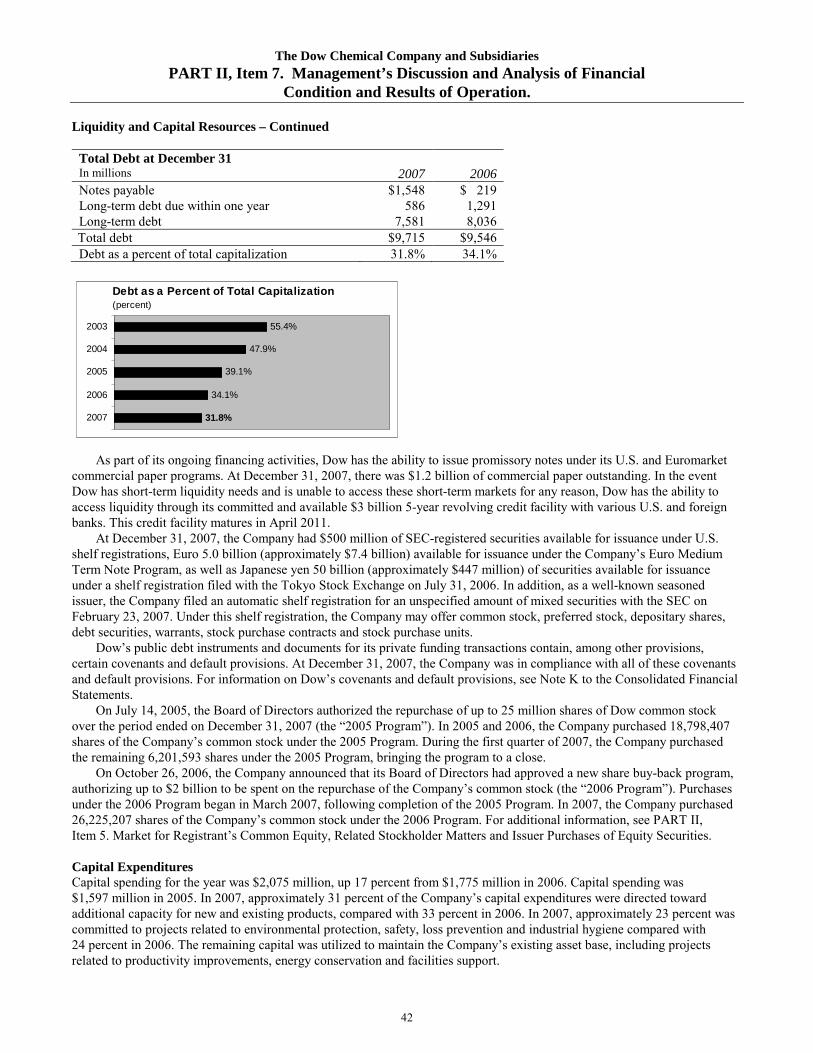
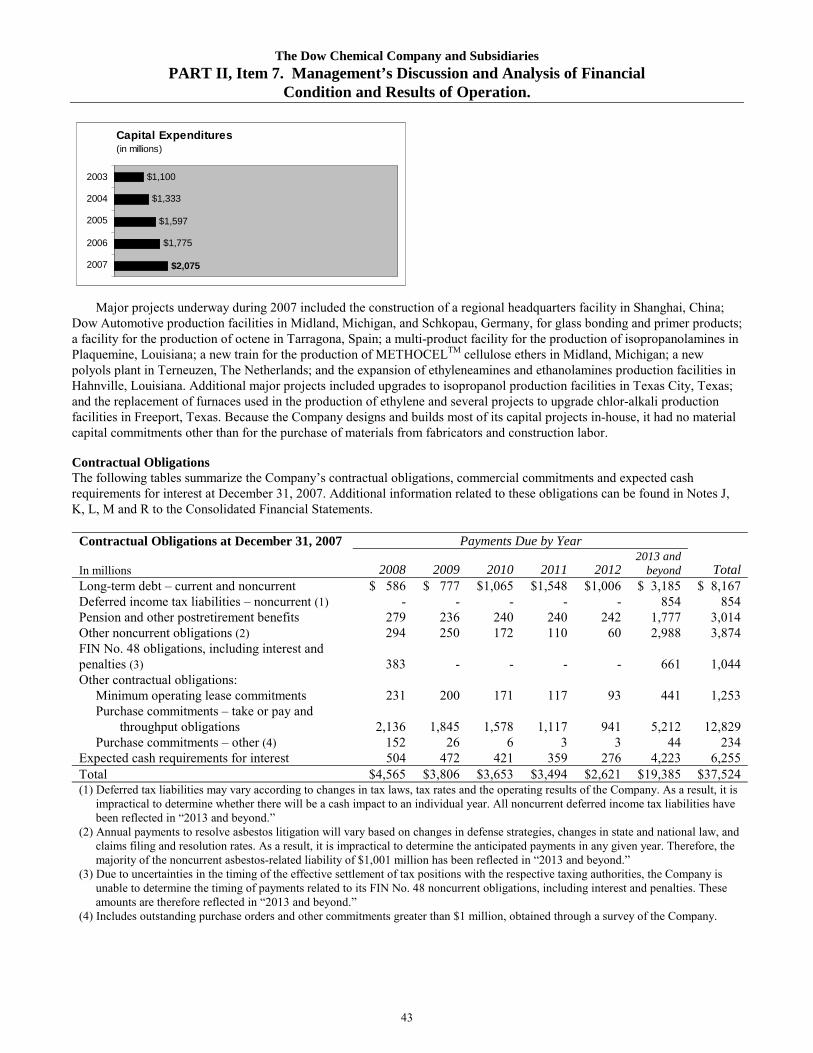


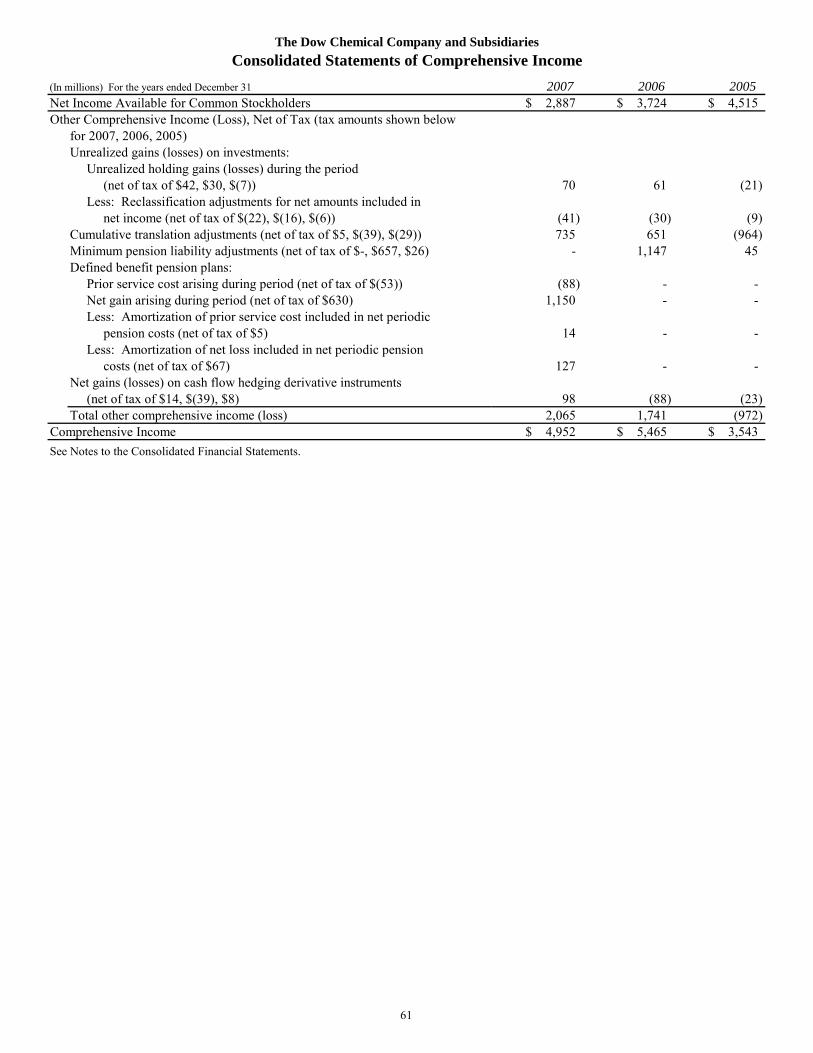


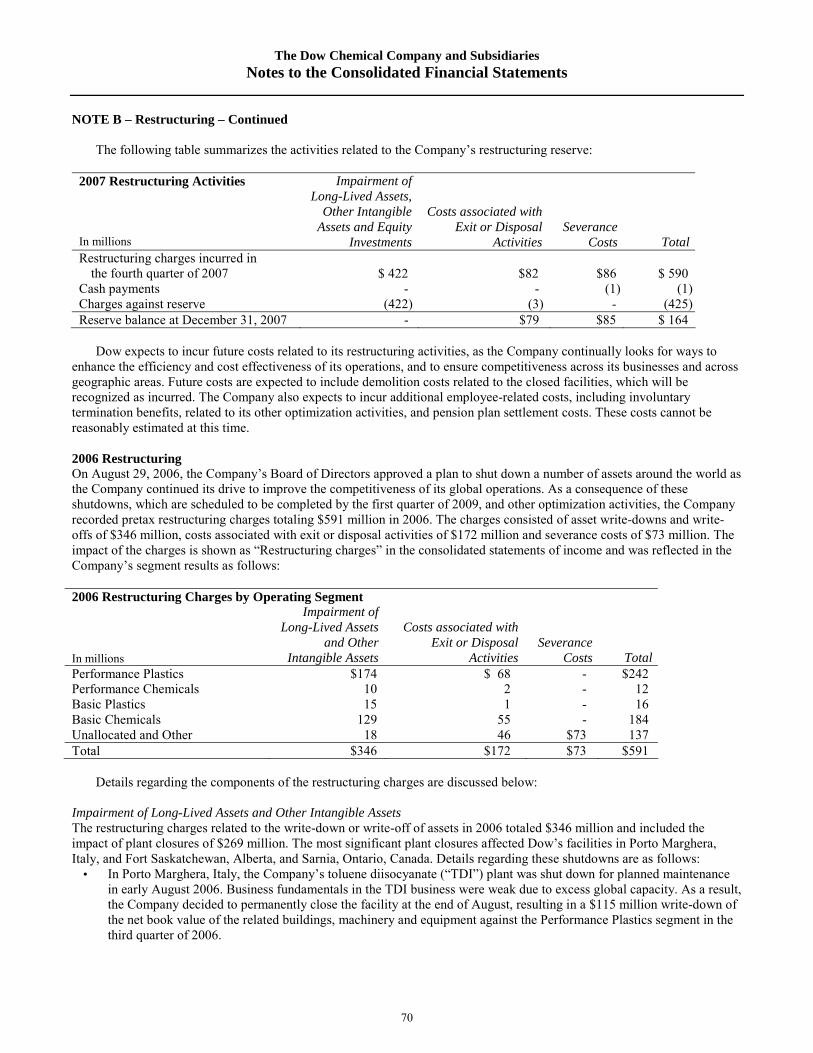


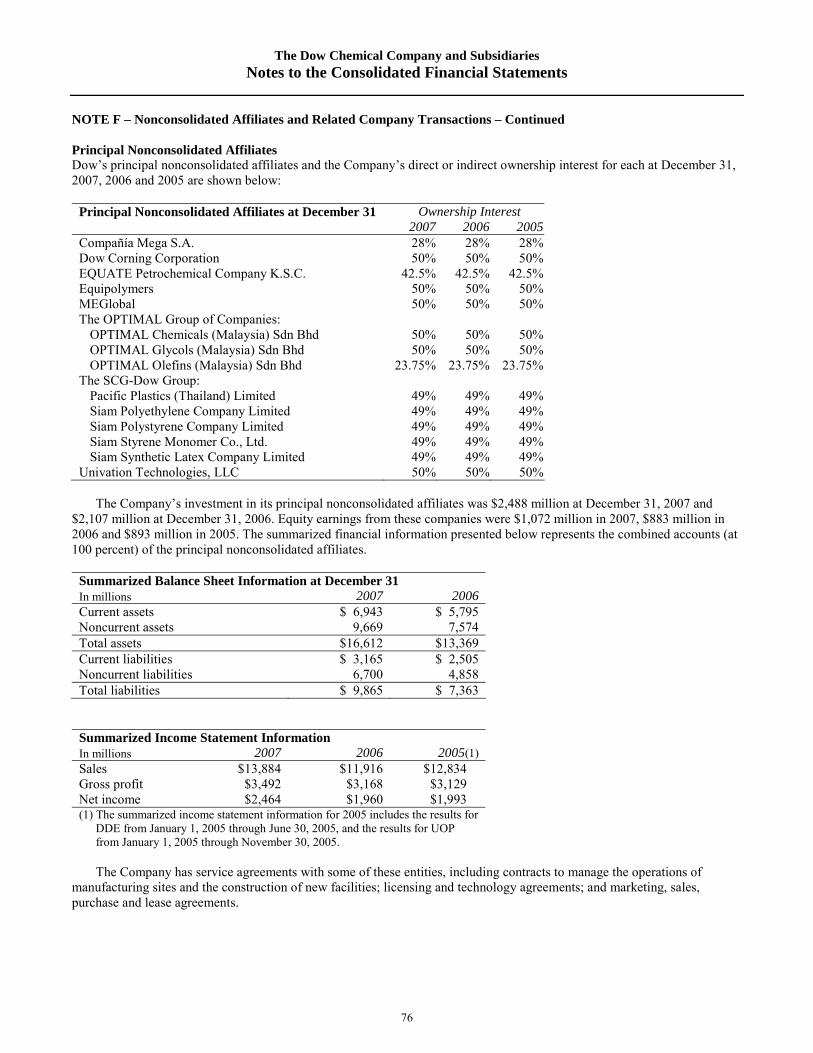


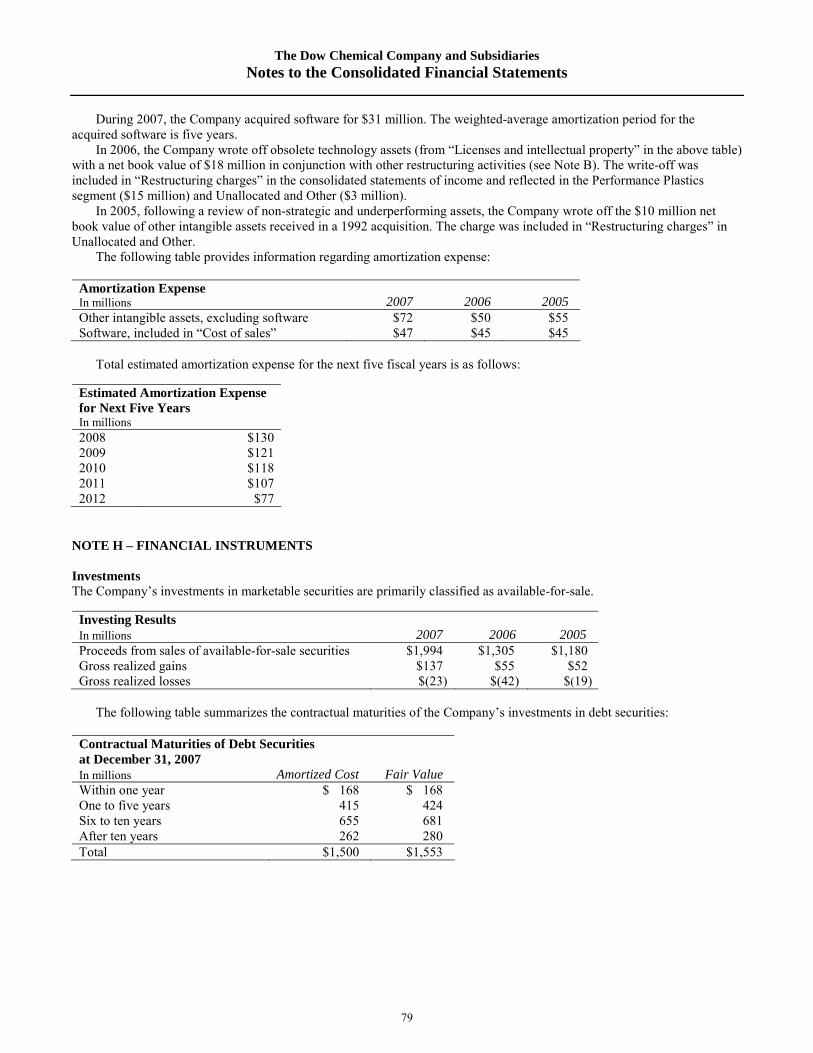


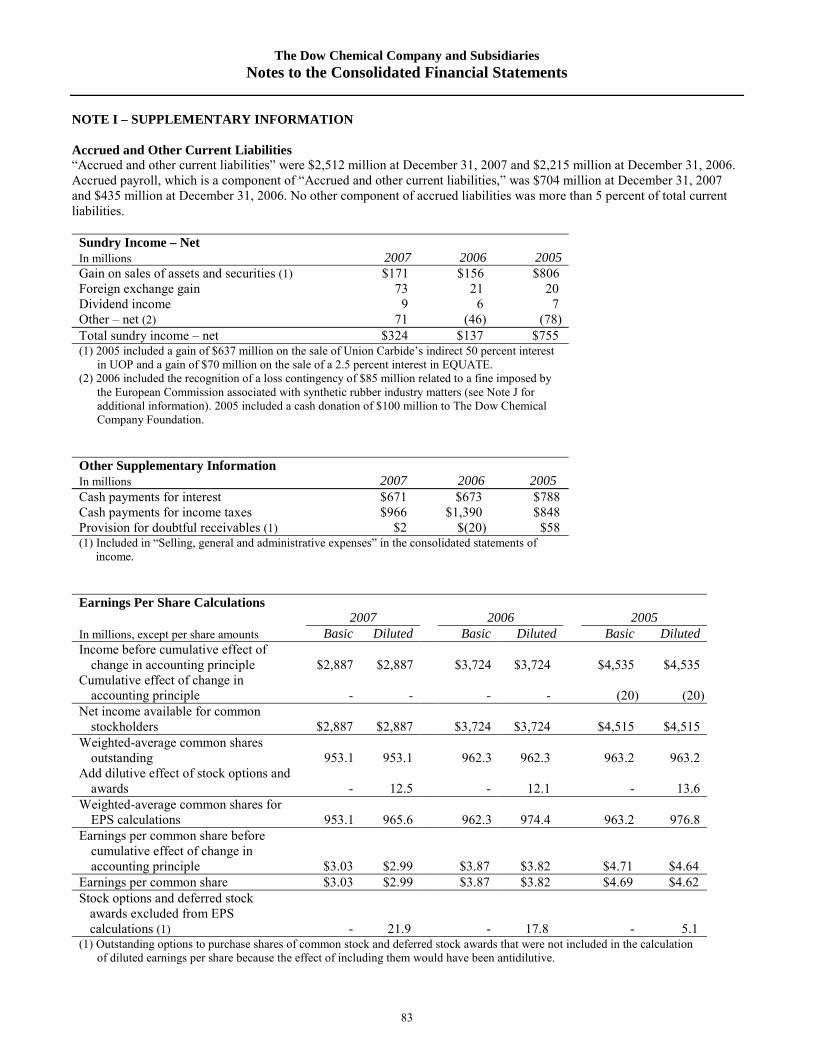


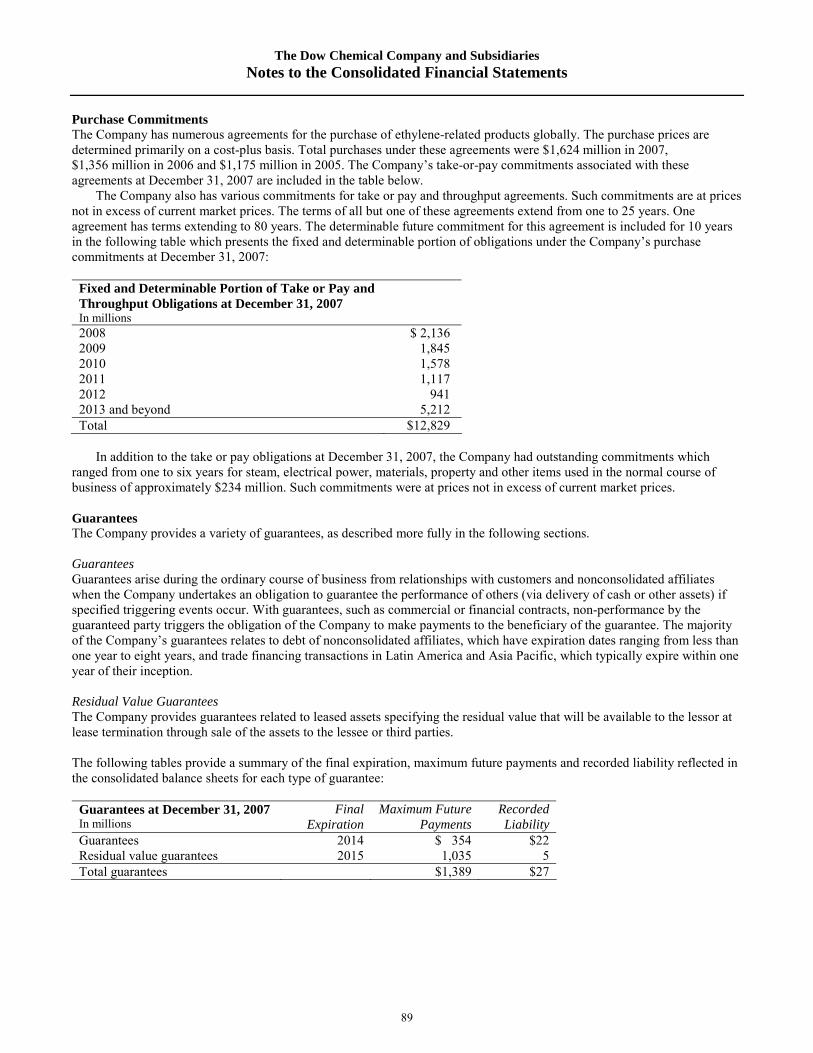
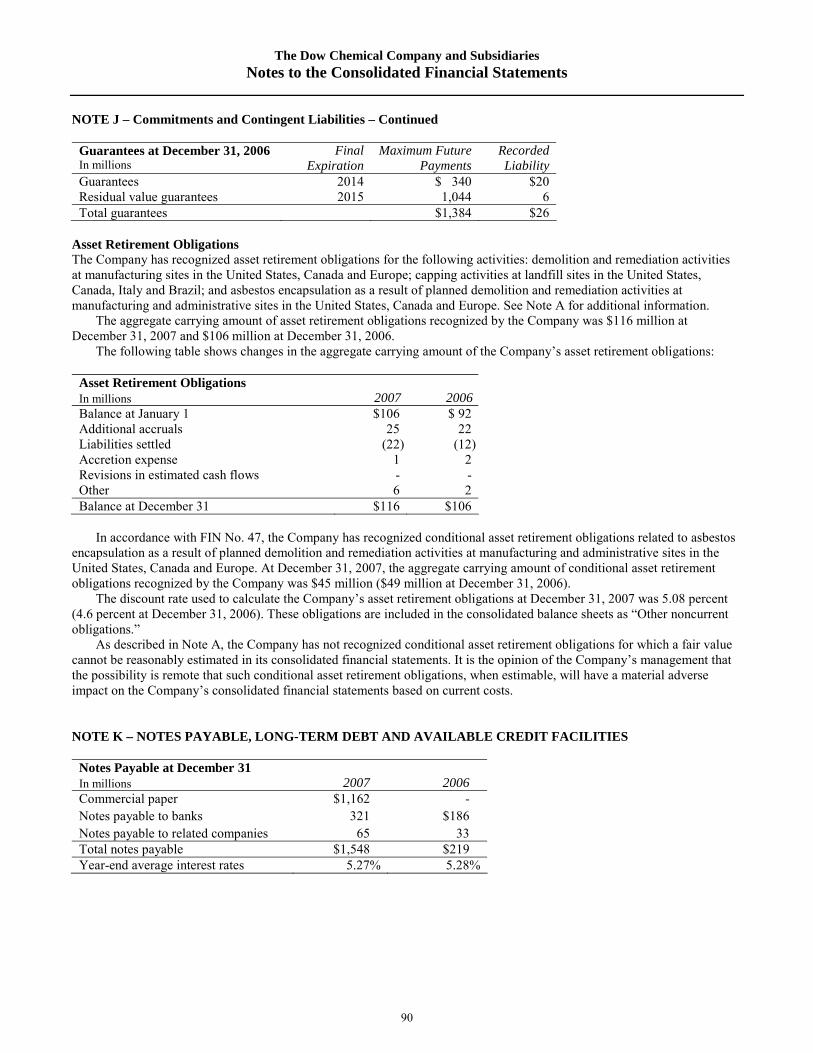

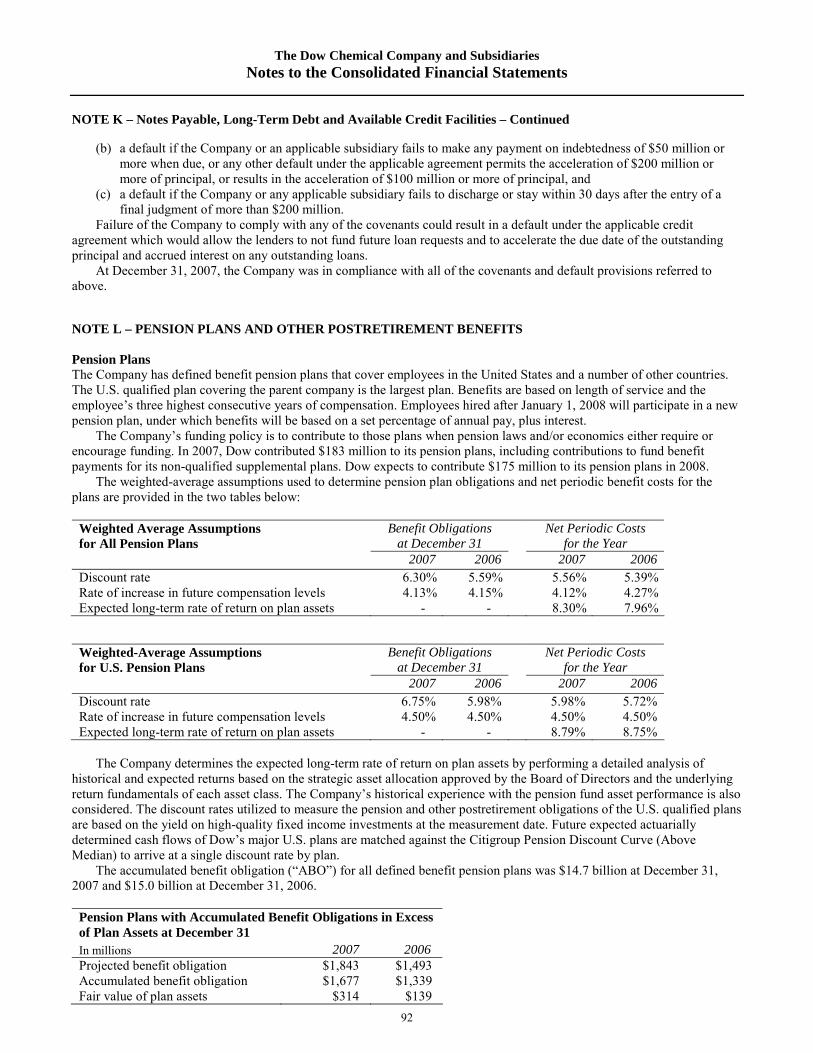

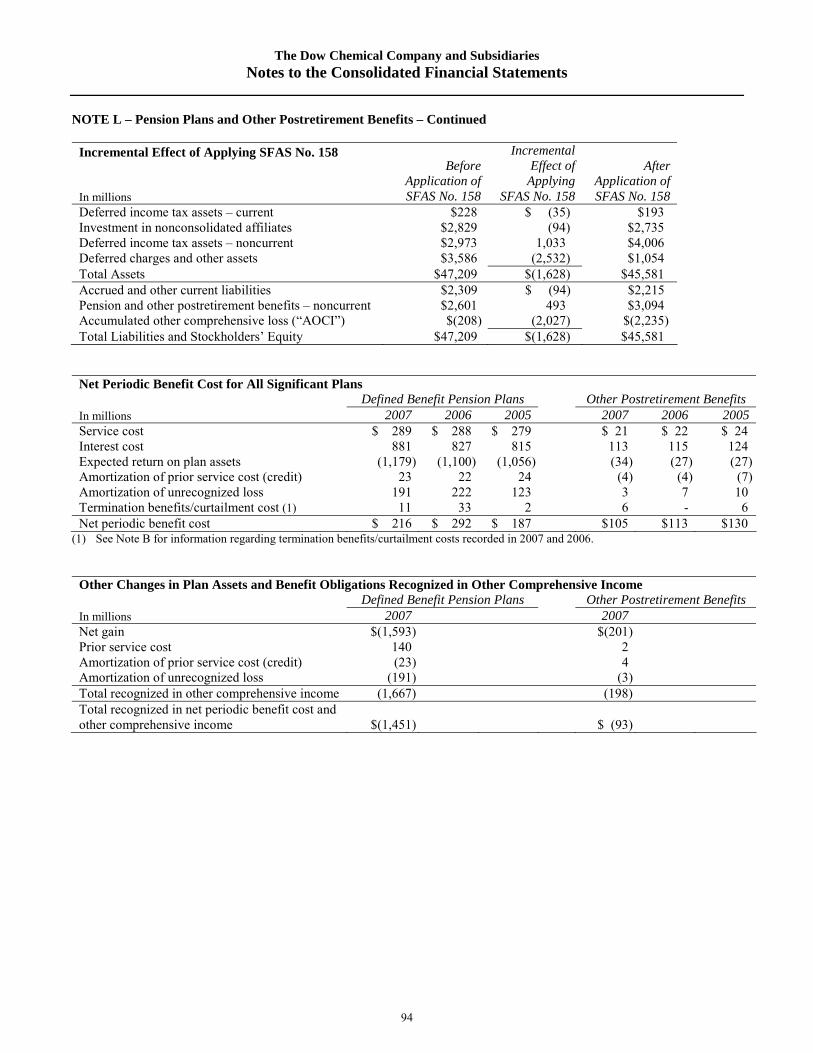


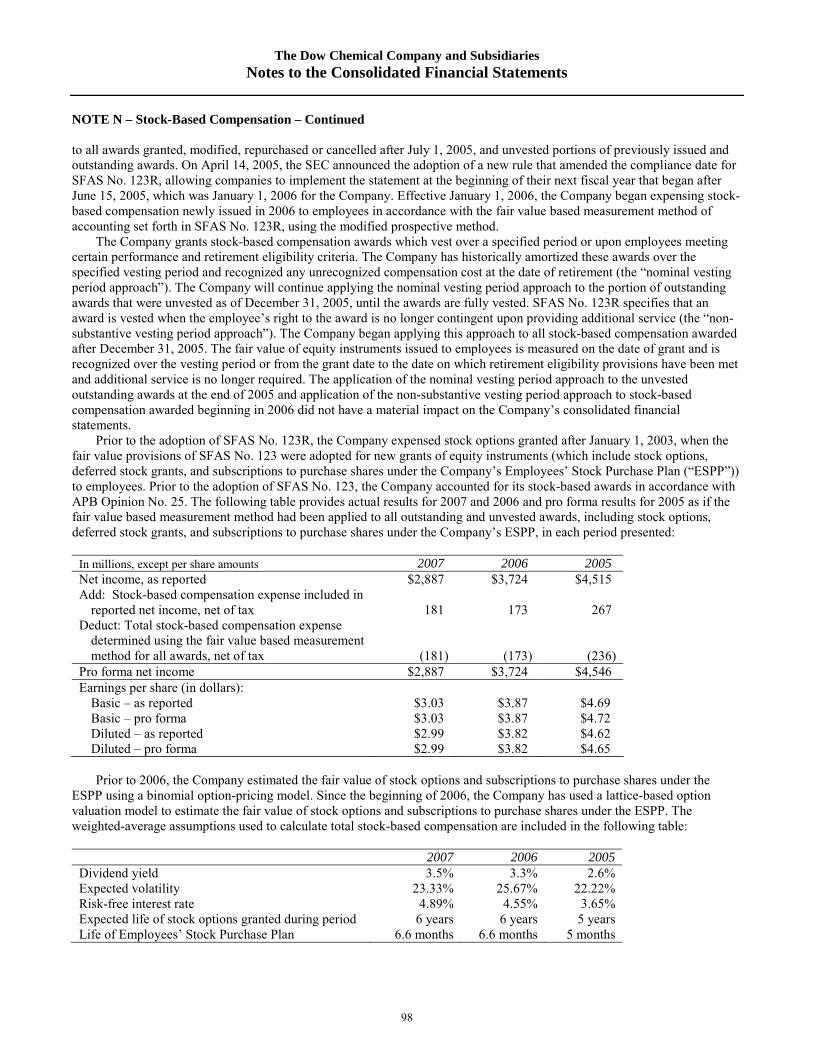

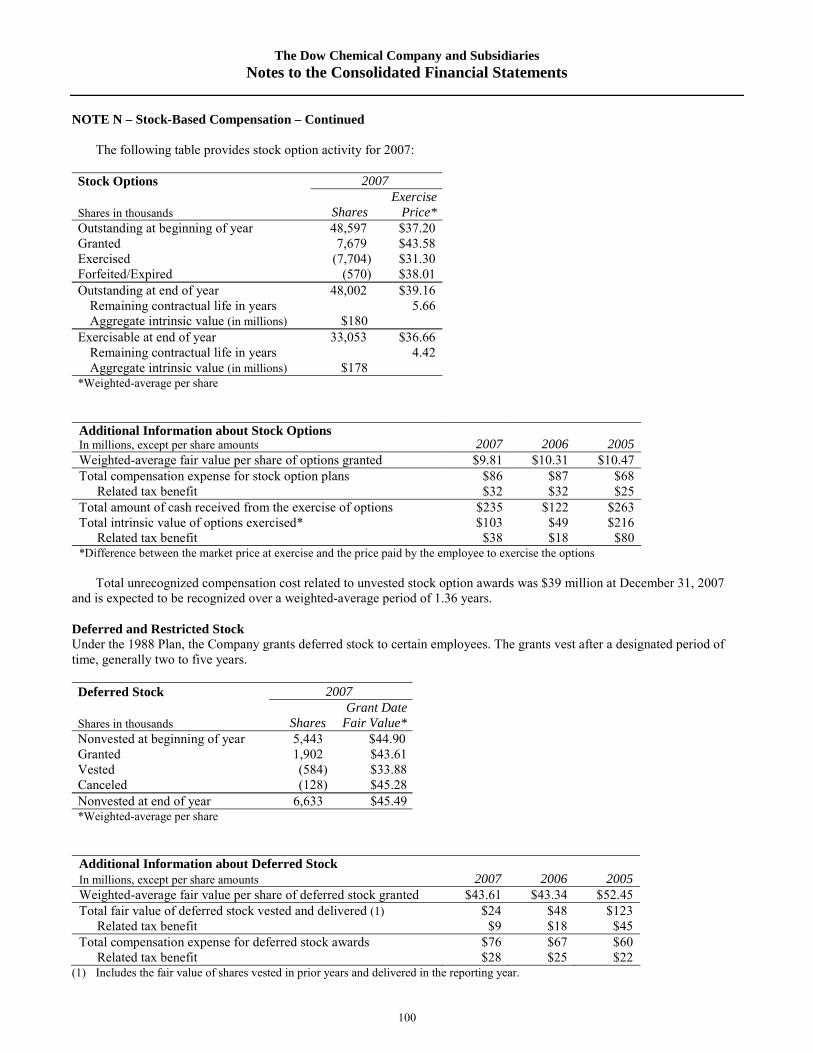


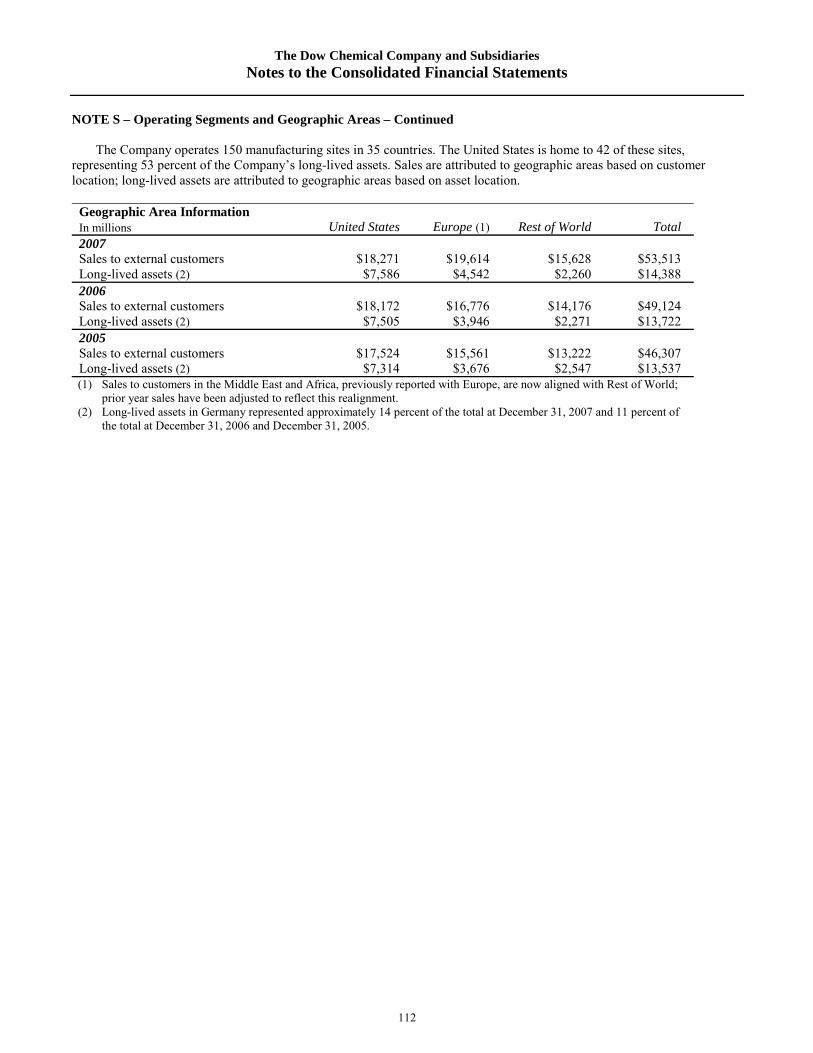
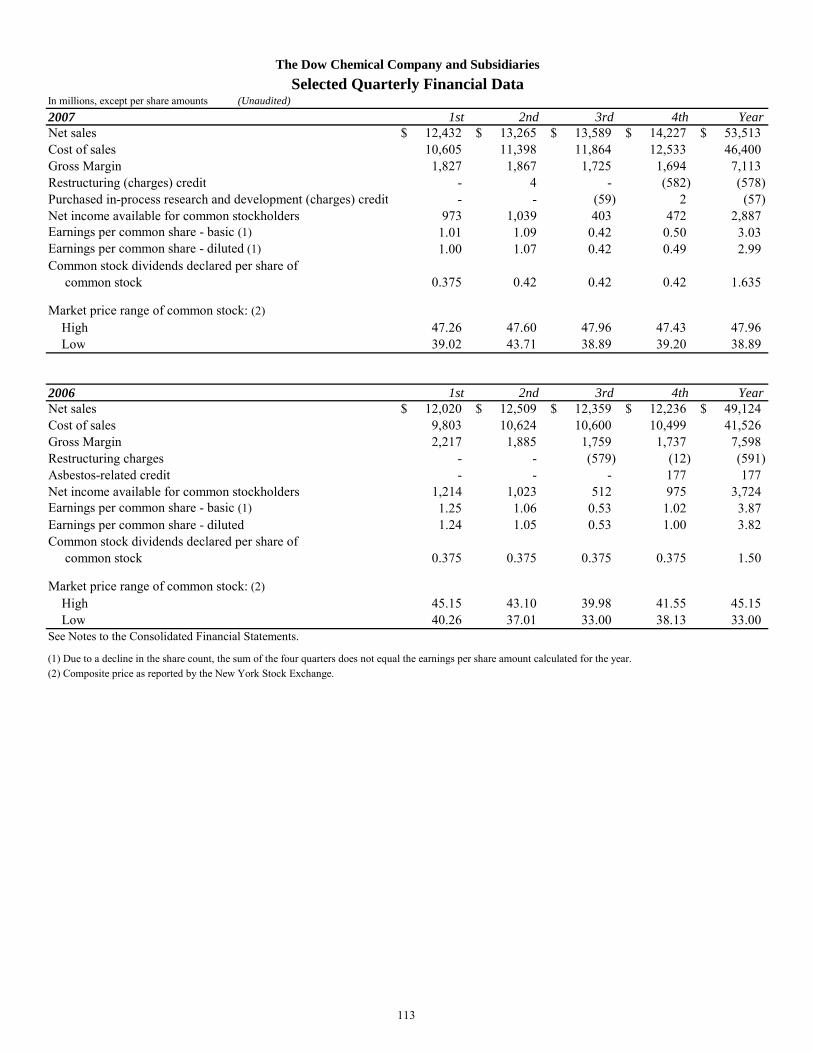


![Date: 20170419 Chemical Company and... · Page: 3 I. Overview [1] In these reasons, I refer to the plaintiffs Dow Chemical Company, Dow Global Technologies Inc and Dow Chemical Canada](https://static.documents.pub/doc/80x56/5b6414c47f8b9af5448ccff3/date-chemical-company-and-page-3-i-overview-1-in-these-reasons-i-refer.jpg)


