+ All Categories
Home > Documents > The Downward Spiral of Compact Fluorescent Lamps in the Pacific Northwest

The Downward Spiral of Compact Fluorescent Lamps in the Pacific Northwest

Date post: 20-Feb-2022
Category:
Upload: others
View: 4 times
Download: 0 times
Share this document with a friend
12
1 The Downward Spiral of Compact Fluorescent Lamps in the Pacific Northwest an Overestimation of the Saturation Point or Natural Fluctuations in the Adoption Path? by Christine Jerko, Sr. Economist, Northwest Energy Efficiency Alliance, 421 SW 6 th Ave., Portland, OR 97204 (503) 688 5448, [email protected] Abstract In 2008, 25 million Compact Fluorescent Lamps (CFLs) were sold in the Pacific Northwest. This number dropped to 15 million by 2011, far below 27 million as predicted with the Scurve and historic data 1 . The adoption path used to model the CFLs is a form of a logistic curve, commonly used to model new product adoption, from introduction to saturation (Meade and Islam). Using an ‘S-curve’ or logistic function worked adequately to model CFL sales prior to the economic decline of 2009. Also, in theory, the tail end of the adoption curve should be predicable with the passage of Energy Independence and Security Act of 2007 (EISA). The lighting standards, phased in between January 1, 2012 and 2015, in the legislation should ensure a relatively high CFL saturation rate. However, the precipitous decline in sales between 2009 and 2011 suggests a more ominous future of the CFL. Multiple possibilities may explain the overestimation. First, is that a key diffusion model assumption, the ‘saturation’ point, has been overvalued. Currently, the diffusion model assumes a maximum saturation with a market share of 67% 2 , whereas Chandrasekaran and Tellis found the average maximum penetration potential, based on hundreds of products, to be 52% 3 . The other possibility is that the CFL market is experiencing natural fluctuations common to product adoption. The premise of the adoption theory is that groups of potential customers would adopt a new product at different rates of time, reaching a maximum saturation point. One of the defining characteristics of the groups of adopters was disposable income. The economic decline of 2009 has not only decreased disposable income, but has potentially altered the adoption groups leading to change in consumers’ purchasing decisions. Lastly, a fundamental shift may have occurred in the market rendering the Scurve an inappropriate forecasting tool. This research provides a discussion regarding the adoptive path of CFLs in the Pacific Northwest and whether greater potential exists based on comparisons with the adoption of other products, along with quantitative relationships with other factors such as income, and utility incentives. What would have happened to the CFL forecast using the Scurve in the absence of EISA? Next, this paper compares the forecasts with a diffusion curve adjusted for a peak saturation point in 2008 with a simple linear regression of CFLs with GPD to see which the better predictor was in 2009, 2010, and 2011. Lastly, the discussion concludes with possible outcomes due to EISA. 1 Data is collected by Fluid Market Strategies, Inc. for The Northwest Energy Efficiency Alliance (NEEA). NEEA engaged in a regional CFL Market Transformation programs from 1997 through 2007. Since 2007, NEEA has continued to track and forecast CFL savings for the Pacific Northwest. 2 The basis for the 67% was The Energy Independence and Security Act of 2007 which phases in efficiency levels for lighting starting in 2012 and becomes the most stringent by 2014. 3 This comparison would be much more dramatic if Chandrasekaran and Tellis removed entertainment and social networking/communication products which have much higher penetration rates than durable goods.
Transcript

1

The Downward Spiral of Compact Fluorescent Lamps in the Pacific Northwest – an

Overestimation of the Saturation Point or Natural Fluctuations in the Adoption Path?

by

Christine Jerko, Sr. Economist,

Northwest Energy Efficiency Alliance,

421 SW 6th

Ave., Portland, OR 97204

(503) 688 5448, [email protected]

Abstract

In 2008, 25 million Compact Fluorescent Lamps (CFLs) were sold in the Pacific Northwest. This number dropped

to 15 million by 2011, far below 27 million as predicted with the ‘S’ curve and historic data1. The adoption path

used to model the CFLs is a form of a logistic curve, commonly used to model new product adoption, from

introduction to saturation (Meade and Islam). Using an ‘S-curve’ or logistic function worked adequately to model

CFL sales prior to the economic decline of 2009. Also, in theory, the tail end of the adoption curve should be

predicable with the passage of Energy Independence and Security Act of 2007 (EISA). The lighting standards,

phased in between January 1, 2012 and 2015, in the legislation should ensure a relatively high CFL saturation rate.

However, the precipitous decline in sales between 2009 and 2011 suggests a more ominous future of the CFL.

Multiple possibilities may explain the overestimation. First, is that a key diffusion model assumption, the

‘saturation’ point, has been overvalued. Currently, the diffusion model assumes a maximum saturation with a

market share of 67%2, whereas Chandrasekaran and Tellis found the average maximum penetration potential, based

on hundreds of products, to be 52%3. The other possibility is that the CFL market is experiencing natural

fluctuations common to product adoption. The premise of the adoption theory is that groups of potential customers

would adopt a new product at different rates of time, reaching a maximum saturation point. One of the defining

characteristics of the groups of adopters was disposable income. The economic decline of 2009 has not only

decreased disposable income, but has potentially altered the adoption groups leading to change in consumers’

purchasing decisions. Lastly, a fundamental shift may have occurred in the market rendering the ‘S’ curve an

inappropriate forecasting tool.

This research provides a discussion regarding the adoptive path of CFLs in the Pacific Northwest and whether

greater potential exists based on comparisons with the adoption of other products, along with quantitative

relationships with other factors such as income, and utility incentives. What would have happened to the CFL

forecast using the ‘S’ curve in the absence of EISA? Next, this paper compares the forecasts with a diffusion curve

adjusted for a peak saturation point in 2008 with a simple linear regression of CFLs with GPD to see which the

better predictor was in 2009, 2010, and 2011. Lastly, the discussion concludes with possible outcomes due to EISA.

1 Data is collected by Fluid Market Strategies, Inc. for The Northwest Energy Efficiency Alliance (NEEA). NEEA engaged in a

regional CFL Market Transformation programs from 1997 through 2007. Since 2007, NEEA has continued to track and forecast

CFL savings for the Pacific Northwest. 2 The basis for the 67% was The Energy Independence and Security Act of 2007 which phases in efficiency levels for lighting

starting in 2012 and becomes the most stringent by 2014. 3 This comparison would be much more dramatic if Chandrasekaran and Tellis removed entertainment and social

networking/communication products which have much higher penetration rates than durable goods.

2

Introduction – The State of CFLs in the Pacific Northwest

Energy conservation programs aimed at transforming the lighting market via compact fluorescent lamps (CFLs) in

the Pacific Northwest began in earnest in 1997.4 Pacific Northwest utilities began promoting CFLs in 2001, due to

the energy crisis in the Pacific Northwest (Marquardt). Utility offerings included CFL coupons, give-aways, and

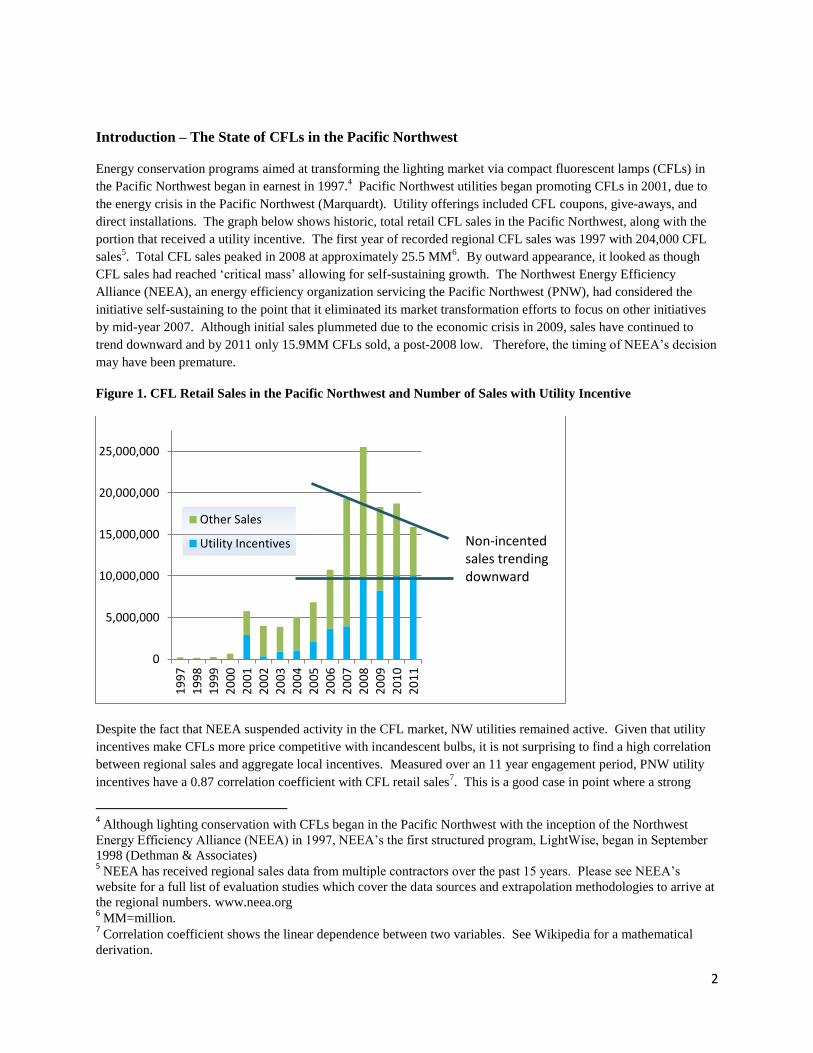
direct installations. The graph below shows historic, total retail CFL sales in the Pacific Northwest, along with the

portion that received a utility incentive. The first year of recorded regional CFL sales was 1997 with 204,000 CFL

sales5. Total CFL sales peaked in 2008 at approximately 25.5 MM

6. By outward appearance, it looked as though

CFL sales had reached ‘critical mass’ allowing for self-sustaining growth. The Northwest Energy Efficiency

Alliance (NEEA), an energy efficiency organization servicing the Pacific Northwest (PNW), had considered the

initiative self-sustaining to the point that it eliminated its market transformation efforts to focus on other initiatives

by mid-year 2007. Although initial sales plummeted due to the economic crisis in 2009, sales have continued to

trend downward and by 2011 only 15.9MM CFLs sold, a post-2008 low. Therefore, the timing of NEEA’s decision

may have been premature.

Figure 1. CFL Retail Sales in the Pacific Northwest and Number of Sales with Utility Incentive

Despite the fact that NEEA suspended activity in the CFL market, NW utilities remained active. Given that utility

incentives make CFLs more price competitive with incandescent bulbs, it is not surprising to find a high correlation

between regional sales and aggregate local incentives. Measured over an 11 year engagement period, PNW utility

incentives have a 0.87 correlation coefficient with CFL retail sales7. This is a good case in point where a strong

4 Although lighting conservation with CFLs began in the Pacific Northwest with the inception of the Northwest

Energy Efficiency Alliance (NEEA) in 1997, NEEA’s the first structured program, LightWise, began in September

1998 (Dethman & Associates) 5 NEEA has received regional sales data from multiple contractors over the past 15 years. Please see NEEA’s

website for a full list of evaluation studies which cover the data sources and extrapolation methodologies to arrive at

the regional numbers. www.neea.org 6 MM=million.

7 Correlation coefficient shows the linear dependence between two variables. See Wikipedia for a mathematical

derivation.

0

5,000,000

10,000,000

15,000,000

20,000,000

25,000,000

19

97

19

98

19

99

20

00

20

01

20

02

20

03

20

04

20

05

20

06

20

07

20

08

20

09

20

10

20

11

Other Sales

Utility Incentives Non-incented sales trending downward

3

correlation coefficient provides poor predictive power. Recent utility incentive levels show little correlation. Over

the last five years, the Correlation Coefficient between utility incentives and retail CFL sales is 0.05. Further detail

shows in 2008 PNW utility incentives accounted for 9.7 MM bulbs or 38% of the purchases, while utilities supplied

approximately 10.1 MM incented bulbs in 2011 for 63% of total sales.8 Utility incentive totals have remained

somewhat static over the last four years, while overall sales dropped.

Bhandarkar offers two intuitive reasons for declining sales that are frequently echoed in the energy efficiency

community. First, declines in disposable income have priced groups of adopters out of the market. Second,

consumers are not happy with color and quality issues. The latter reason implies continued will not influence

consumers to replace their incandescent bulbs prior to EISA timelines. The first reason implies that segments of the

population must have the necessary disposable income to overcome the price discrepancy between the incandescent

bulb and a CFL. For instance, Vermont Energy has had relatively unique increased CFL success primarily due to

aggressive incentive campaigns, such as their $.99 bulb promotion (Badger and Reed).

The Pacific Northwest suffered the same fate as most of the country with declining 2009 sales, due in large part to

the national economic downturn (Bonn, and The Cadmus Group, Inc./Energy Services and Nexus Market Research,

Inc.). However, CFLs were expected to rebound relative to incandescent bulb sales with improvements in the

economy, assuming economy improvements also increased disposable income. Another phenomena with regard to

the overall market trend, is that as CFLs replace incandescent bulbs, the size of the sales market will decline since

the life of a CFL is 5 times that of an incandescent bulb. CFL sales should eventually drop and hold steady at the

replacement/burn-out rate. Despite the eventual theoretical drop in CFL sales, market share, should increase as they

replace incandescent bulb sales. In actuality, market share dropped from 34% market share to 26% market share

between 2008 and 20119.

The next graph shows changes in CFL sales relative to the economy in the Pacific Northwest. During the 15 year

time frame, GDP change is negative only one year. This negative change occurs between the years 2008 and 2009,

where year on year change is -.02%. The second most precipitous decline in growth occurs between 2000 and 2001

with growth at 0.009%. Declines in CFL growth occur concurrently or immediately following these economic

slowdowns. Although not proven to show causality, the Correlation Coefficient between gross sales in CFLs and

gross domestic product (GDP) in the Pacific Northwest is 0.93. As with utility incentives, the last 5 years of data

have almost no correlation with sales, -0.23 and may be a poor predictor of future CFL sales.

Alternative to specific income effects, it may be the case that CFLs reached their maximum saturation ‘naturally’.

Chandrasekaran and Tellis (henceforth C&T) reviewed dozen of adoption studies of new products and found the

average of these products to have a market penetration ceiling of 52%. Whereas, NEEA adopted a ceiling of 67%

according to their current interpretation of the EISA standards. An over-estimation of the CFL market saturation

would lead to an overly optimistic CFL forecast. Further, C&T identified that Brown Goods, electronics and social

media goods, took off much faster than other goods as they promote social status, thus implying higher maximum

penetration. There is no reference that this author is aware of, of CFLs being linked to social status, and therefore, it

may be safe to assume, given complaints about product quality and cheaper short-run alternatives (incandescent

bulbs) that CFLs may fall on the lower end of the spectrum with regard to ceiling penetration of new products.

8 The free-ridership is not addressed in this paper.

9 Market share was determined by assumptions about the market size and CFL sales number that are evaluated

annually and approved by NEEA’s Cost-effectiveness Advisory Committee, comprised of utility members and

stakeholders. Please, reference NEEA’s website for historic Cost-effectiveness Advisory Committee packets that

contain the individual assumptions and sources for assumptions.

4

Figure 2. Percentage in CFL Retail Bulbs Sales and Gross Domestic Product in the Pacific Northwest

Adoption of ‘Energy Efficiency’ Innovation

Historically, NEEA has used a logistic or ‘S’ curve to estimate CFL sales trajectories. The underlying theory behind

the ‘S’ curve is based on Roger’s adoption of innovation. This theory says that groups of adopters, with similar

categorical traits, adopt innovation at differing rates. Roger’s shows that economic status is highly correlated with

the initial adoption of a new technology. The other groups are characterized by similar socio-economic status and

education levels. Rogers categorizes adoptive groups according to a normal distribution, which cumulatively shapes

the ‘S’ curve. A summary of Roger’s adopter categories is below (Table 1). The adopter illustration was taken from

Wikipedia (Figure 3).

Table 1. Summary of Roger’s 5 Adopter Categories

Adopter

Category

Definition

Innovators Innovators are the first individuals to adopt an innovation with the following attributes:

Risk takers, youngest in age, highest social class, highly educated, have great financial

lucidity, very social and have closest contact to scientific sources and interaction with other

innovators.

Early

Adopters

This is the second fastest category of individuals who adopt an innovation with the following

characteristics:

Highest degree of opinion leadership among the other adopter categories, younger in age, have

a higher social status, have more financial lucidity, advanced education, and are more socially

forward than late adopters.

Early

Majority

The middle group to adopt innovation with the following characteristics:

Above average social status, contact with early adopters, and seldom hold positions of opinion

leadership in a system.

Late

Majority

Second to last group to adopt with the following characteristics:

Skeptical of innovation, below average social status, very little financial lucidity and therefore

less willing to take on the risk of innovation failure, in contact with others in late majority and

early majority

Laggards Last to adopt innovation with the following characteristics:

Show little to no opinion leadership, advanced in age, have an aversion to change-agents, focus

on “traditions”, likely to have the lowest social status, lowest financial fluidity, in contact with

only family and close friends

5

Figure 3. Normally distributed adoption classes and cumulative adoption curve.

Several examples illustrating ‘S’ curve adoption paths and characteristics of new products exist in the literature.

Meade, N. and Chandrasekaran, D. and G. J. Tellis provide comprehensive reviews with several supporting authors

on the subject of the adoption of new products. The literature shows the wide expanse of adoption curve

applications and outcomes. New products achieve varying degrees of success. For example, a new product may

reach maximum saturation, such as a refrigerator in every household. Or a product may reach full or near saturation,

then become ‘extinct’ with the development of a newer technology. A good case in point is the VHS extinction with

the advent of DVDs, nicely illustrated in Coplans paper. Extinction occurs during the ‘Decline’ stage, the fourth of

four stages, in the adoption process. The tables below list the 4 stages and 4 turning points of new product

adoption. The fourth turning point, called the Saddle Point, is a more recently studied phenomenon that Goldenberg,

Libai, and Muller (2002) found in 50% of the 32 product categories they examined. The Saddle Point is illustrated

in Figure 4. It is possible that CFLs are experiencing a Saddle Point. A temporary downturn in market share may

have been created as some adopters may have been pushed into latter adopter categories due to a sustained decrease

in disposable income.

Table 2. Characteristics of Adoption Curves: Turning Points and Stages

Instead of a Saddle Point, CFLs may be in the ‘Decline’ stage (Table 2). C&T cite some drivers of Slowdown:

every 1% increase in price leads to a 5% increase in the probability of a Slowdown; and every 1% decrease in GNP

Turning Points Definition

Commercialization

The date a new product is first sold to a

mass market

Takeoff

First dramatic and sustained increase

in a new product's sales

Slowdown

Beginning of a period of temporarily

decreasing product sales after takeoff

Saddle Point

First trough in new product sales

following post takeoff peak

6

is associated with a 17% increase in the probability of Slowdown. Higher upfront costs, despite sometime

significant long term savings, are a common obstacle to the adoption of energy efficient technologies (Heinzle; and

Gallagher and Randell). Meade and Islam state that diffusion of innovation will cease if critical mass is not

achieved, “as may occur if there is a discontinuity in the distribution of adoption thresholds.” It is unknown whether

the recent turn in economic events was substantial enough to cause such a discontinuity.

Table 3. Characteristics of Adoption Curves: Turning Points and Stages

Figure 4 illustrates the temporal relationship between the adoptive turning points and stages.

Figure 4. Illustration of Adoption Characteristics

The driving factors behind the CFL forecast in any year are the assumptions around the terminus of the ‘S’ curves

the history of prior years’ sales. The lower portion of the ‘S’ curve is shaped to fit through historic CFL sales data.

The terminus is an estimation based on anticipated socket saturation. Below, the figure shows NEEA estimation of

CFL forecasts as of March 2009. In this figure, 2008 was the last year of point-of-sales data for retail CFLs in the

region. Market Share is defined as percentage of CFLs to all medium screw-based bulbs sales10

. According to this

estimation, a 41% market share was projected for 2009 which equated to approximately 29 million gross CFL sales.

This is 4 million more than the prior year. It is important to note that the market size is dynamic as shorter life

incandescent bulbs are replaced with longer-life CFLs.

10

Total lighting market sales estimation is based on of national shipments, the Pacific Northwest’s percentage of

national households. A burn-out model of both incandescent bulbs and CFL’s is applied.

Stages Definition

Introduction

Period from a new product's

commercializaiton until its takeoff

Growth

Period from a new product's takeoff

until its slowdown

Maturity

Period from a product's slowdown

until sales steadily decline

Decline

Sales steadily decline until a products

demise

7

Figure 3. NEEA’s Logistic Curve CFL Forecast as of March 2009

NEEA’s assumptions are updated annually11

. Figure 4 shows the adjusted forecast given 2009 retail sales data.

2009 gross sales were approximately 18.3 million. Additionally, NEEA updated there terminus assumption to be

consistent with the Regional Technical Forum’s 67%. Basically, the Regional Technical Forum’s analysis of the

legislation concluded that approximately 33% of the sockets in the PNW households would not be EISA compliant.

This assertion alone may over exaggerate CFL potential because consumers with a strong aversion to CFL and the

economic means can purchase alternatives, such as LEDs. It should also be noted that the lower end of the curve

was no longer fit through the historic data and a bit of art was applied in an attempt to be more conservative with

forecasts.

Figure 4. NEEA’s Logistic Curve CFL Forecast as of March 2010

11

All major market assumptions receive annual review. If assumption updates, such as retirement rates or hours of

operation change, then retroactive changes may be applied to the market size. Further, new data sources may have

been uncovered that would have updated historic CFL sales.

8

2010 was estimated to have a 37% market share. Although not shown, the 2010 sales and market share of 29%,

were far below predicted. Recognizing a fundamental shift in sales trend, NEEA abandoned the ‘S’ curve for the

2011 forecast. With no budget for market intelligence during the forecast year and a strong desire to be conservative

with its forecast to its funders, NEEA simply applied a linear trend downward from 2009 and 2010. The downward

linear trend provided a better estimate than would have occurred otherwise. Given that 2011 sales continued to

decline, and any ‘S’ curve market share would have been upward sloping, the ‘S’ curve abandonment was a good

decision.

In light of the CFLs departure from the ‘S’ curve and economic anomalies, NEEA wanted to investigate forecast

alternatives to glean possible insights into future forecast activities. The alternative forecasts are provided in the

following section.

Growth Curves and Forecasting Methodologies

As mentioned earlier, NEEA’s forecast of CFLs was largely driven by adoption of innovation theory and the ‘S’

curve. This next section sets up an alternative scenario where the pre-EISA forecast is treated independently.

Additionally, a simple linear forecast using cumulative sales and cumulative regional GDP was estimated. Forecasts

for Oregon, Washington, Idaho, and Montana, from state budgetary offices, were used to forecast CFLs.

‘S’ Curve

The terminus was reset to equal the average saturation rate for researched durable goods of 52%. The ‘S’ curve used

for the forecast follows an excel adaption (Garcia) of a logistic function which allows for diffusion dynamics

where represents the initial market share, is the upper bound or saturation point, is the steepness of the curve,

is the year in which ‘take-off’ occurs, and e is the number of years it takes for market transformation. The choice of

the terminus or saturation point was somewhat arbitrary, but not unlike a choice that would have been made in the

absence of EISA. A 20% decrement from the average saturation rate for new products was chosen given the relative

unpopularity of CFLs to other durable goods (Green). This equates to a maximum penetration rate of 42%. 20

years is the market transformation period. It is also assumed that energy crisis of 2001 caused outlier effects not

indicative of average market forces in 2001, 2002, and 2003. The data was smoothed between years 2000 and 2004.

Mean square errors were minimized between 1997 and 2008.

Figure 5 below shows the re-estimation of the ‘S’ curve and resulting ‘S’ forecast. What was formerly a 41%

market share forecast, dropped to 35%. The result would have been 25.2 MM bulbs, given a total market size of

approximately 70 MM medium screw-based bulbs with the models current retirement/replacement assumptions.

The ‘S’ was re-estimated two more times to minimize mean square errors with the updated sales data in 2009 and

2010. The estimated 2010 and 2011 market shares with the curve updates were 36% and the 38%. The updated

2011 curve is shown in Figure 6.

Lastly, the 2011 base case forecast using the original, EISA driven saturation point of 67%, applied the same

methodology as used for 2009 and 2010.

9

Figure 5. 2009 CFL Market Share Forecast with a Reduced Saturation Point of 42%

Figure 6. 2011 CFL Market Share Forecast with a Reduced Saturation Point of 42%

GDP

Since income is a primary driver of the ‘S’ curve theory, GDP is the other forecast avenue examined. Population

weighted regional average GDP was developed from year prior forecasts from the state offices of Oregon,

Washington, Idaho and Montana. Simple linear extrapolation was used to forecast CFL sales.

10

Results

Table 4 shows the forecast results from the base case ‘S’ curve against the ‘S’ curve with the non-EISA driven

terminus and the GDP forecasts.

Table 4. Comparison of Forecasts with Saturation Ceilings with and Without EISA Standards

Although the forecasts are significantly improved they are still substantially off of the mark. The results using

regional GDP are an improvement.

Table 5. Comparison of Original Forecast Using 67% Saturation Ceiling with Regional GDP forecast

The forecast using GDP projections provided a much better forecast compared to the updated ‘S’ curve.

Observations and Notes on Lighting Standards

The first observation is that the ‘S’ curve was not robust enough to continue modeling CFL sales in the Pacific

Northwest after the economic downturn of 2008. Even if the adoption process was exhibiting a saddle point in

recent years, a readjustment of the terminus could not provide remotely reasonable forecast sales estimates. If one

were to force the ‘S’ curve to predict the last three years, would require an extremely low terminus that would make

all of the prior years’ estimates nonsensical. Instead it appears as though a structure break, due to the 2008

economic collapse, has resulted. Given consumers heightened sensitivity to disposable income, first cost has

become a priority over long-run energy savings.

Whether CFL will rebound is a moot point due to the passage of The Energy Independence and Security Act (EISA)

2007. The table below shows the manufacturing and shipping standards imposed by the bill. EISA does not make it

illegal for customers to use older vintages of light bulbs, effectively incandescent light bulbs, consumers will

eventually no longer be able to purchase them.

Year

Estimated Bulb Sales

using 'S' Curve with 67%

Saturation Ceiling

Estimated Bulb Sales

using 'S' Curve with 46%

Saturation Ceiling Actual Sales

2009 28.9 MM 24.8 MM 18.2 MM

2010 23.9 MM 22.9 MM 18.8 MM

2011 27.2 MM 23.0 MM 15.9 MM

Year

Estimated Bulb Sales

using 'S' Curve with 67%

Saturation Ceiling

Using Linear Estimation

with regional Gross

Domestic Product Actual Sales

2009 28.9 MM 19.7 MM 18.2 MM

2010 23.9 MM 20.6 MM 18.8 MM

2011 27.2 MM 21.6 MM 15.9 MM

11

Table 6. Timeframe of EISA Manufacturing and Shipping Standards

Effective Date Lumens Min. Lamp Life (hrs) Current Wattage Maximum Allowable Watts

Jan 1, 2012 1490-2600 1000 100 72

Jan 1, 2013 1050-1489 1000 75 53

Jan 1, 2014 750-1049 1000 60 43

Jan 1, 2015 310-749 1000 40 29

As long as EISA is not repealed, the PNW can expect to see saturation close to 70%. The RBSA estimates that 29%

of household sockets are currently filled with CFLs and another 42% are covered by EISA or approximately 107

million CFLs (Storm, Baylon, and Geraghty).

There are two directions that consumers may take. First, consumers may suddenly fully embrace CFLs and fill their

remaining household sockets with these bulbs. Or, consumers may rebel against the legislation and purchase

halogena and LED alternatives. However, one could extrapolate from the GDP experiment above. The results may

provide some evidence that consumers are very concerned with disposable income. If that continues to be the case,

then the original 67% maximum saturation point may not be that far off the mark, as the current competing

technologies are not expected to be price competitive in the near future (Blacker).

References

Badger, C. and Reed, G. “Breaking the Habit…Life beyond the CFL for Efficiency Programs” ACEEE Summer

Study 2010.

Bhandarkar, V., “For Replacement Lamps, LEDs are Different,” Strategically Speaking, Strategies Unlimited.

(2009), Web.

Blacker, J. “Market Study of EISA Compliant Light Bulbs” Prepared for Northwest Energy Efficiency Alliance,

March 15, 2012.

Bonn, L., Efficiency Vermont, “A Tale of Two CFL Markets: An Untapped Channel and the Revitalization of an

Existing One,” (2012), presented at ACEEE Summer Study.

The Cadmus Group, Inc./Energy Services and Nexus Market Research, Inc. “Colorado Home Lighting Program

Process and Impact Evaluation Report,” (2010) Prepared for Xcel Energy.

CALMAC Study: “Codes and Standards Program Savings Estimate, For 2005 Building Standards and 2006/2007

Appliance Standards” (2005) ID: SCE0241.01

Chandrasekaran, D. and G. J. Tellis, “A Critical Review of Marketing Research on Diffusion of New Products.”

Review of Marketing Research (2007): pp. 39 – 80; Marshall School of Business Working Paper No. MKT 01-08.

Coplan, J., “Diagnosing the DVD Disappointment: A Life Cycle View,” (2006) The Leonard N. Stern School of

Business, Clucksman Institute for Research in Securities.

Dethman, L., “Market Progress Evaluation Report, LightWise, No.2” (1999) Dethman Associates with data from

Gilmore Research Group, Prepared for Northwest Energy Efficiency Alliance, Report #E99-038

12

Dunsky P., Boulanger, F., Dusky Energy Consulting and Mathot, P, BC Hydro, “Screening DSM: When the TRC

Blocks Efficiency, What’s Next?” (2012), presented at ACEEE Summer Study: 0193-000199.

Gallagher, K. and Randell, J. “What Makes U.S. Energy Consumers Tick?” Issues in Science and Technology

(2012) Volume 28. Source Issue 4. ISSN: 0748-5492.

Garcia, J.C.M., “Modeling market adoption in Excel with a simplified s-curve,” 8020World.com (2007), Web.

Geller, H., “Policies and Programs for Increasing the Adoption of High-Efficiency Lighting in Homes in the

Southwest,” (2005) Prepared for U.S. Department of Energy Building America Program through the Midwest

Research Institute National Renewable Energy Laboratory Division. Boulder, CO.

Heinzle, S. “Disclosure of Energy Operating Cost Information: A Silver Bullet for Overcoming the Energy-

Efficiency Gap?” Journal of Consumer Policy (2012) 35:43-64.

Hewitt, D. and Hobart, S., New Building Institute, “Net Zero by 2010: Where Do We Stand with the Policies,

Programs and Projects Necessary to Achieve this Goal?” (2012), presented at ACEEE Summer Study.

Marquardt, Ryan, Zero Waste Alliance “Compact Fluorescent Bulb Recycling: Program Case Studies and

Recommendations” (2001), prepared for Portland General Electric. Portland, OR

Meade, N., “The Use of Growth Curves in Forecasting Market Development-a Review and Appraisal,” Journal of

Forecasting (1984) 3,429-451.

Meade, N. and T. Islam, “Modeling and forecasting the diffusion of innovation – A 25-year review,” International

Journal of Forecasting 22 (2006), 519 – 545.

Regional Technical Forum, Unit Energy Savings Measures and Supporting Documentation. (2011)

ResCFLLighting_v2_2.xls, Portland, OR.

Rogers, E.M., Diffusion of Innovations (Fourth Edition). (1995), New York: The Free Press.

Storm, P., Baylon, D.,and Geraghty, K. “Residential Building Stock Assessment: Single Family Characteristics and

Energy Use” Prepared for Northwest Energy Efficiency Alliance, June 5, 2012


Recommended