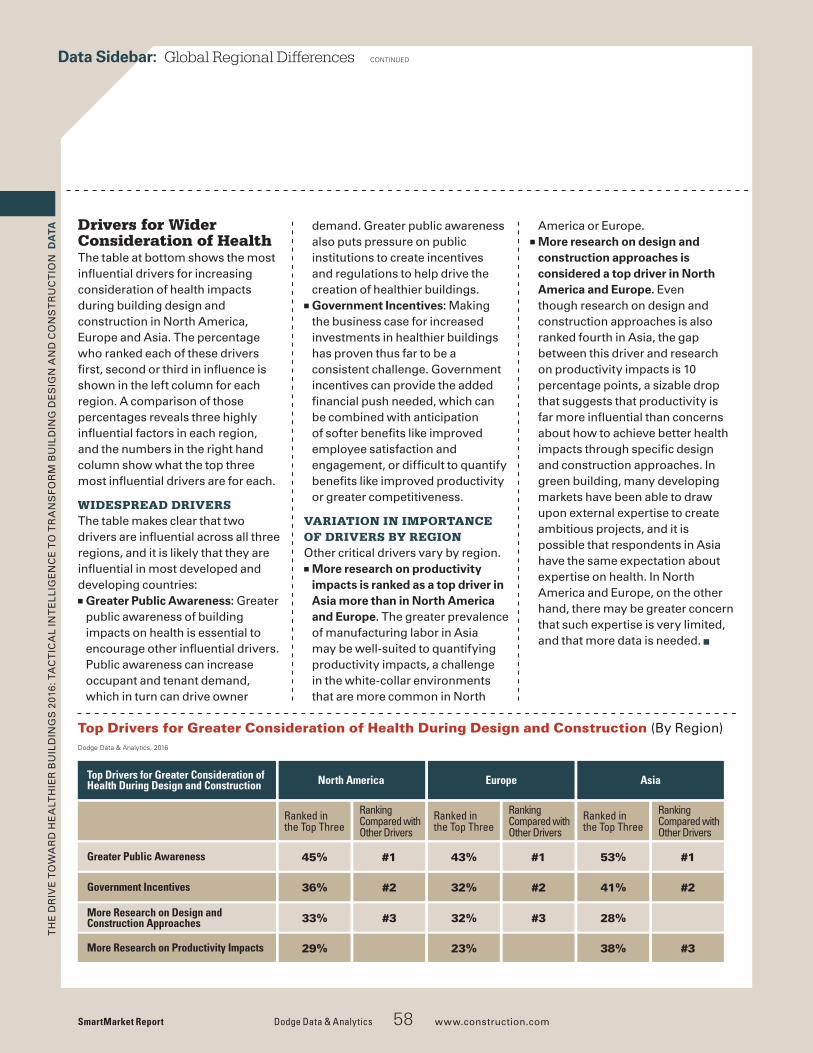
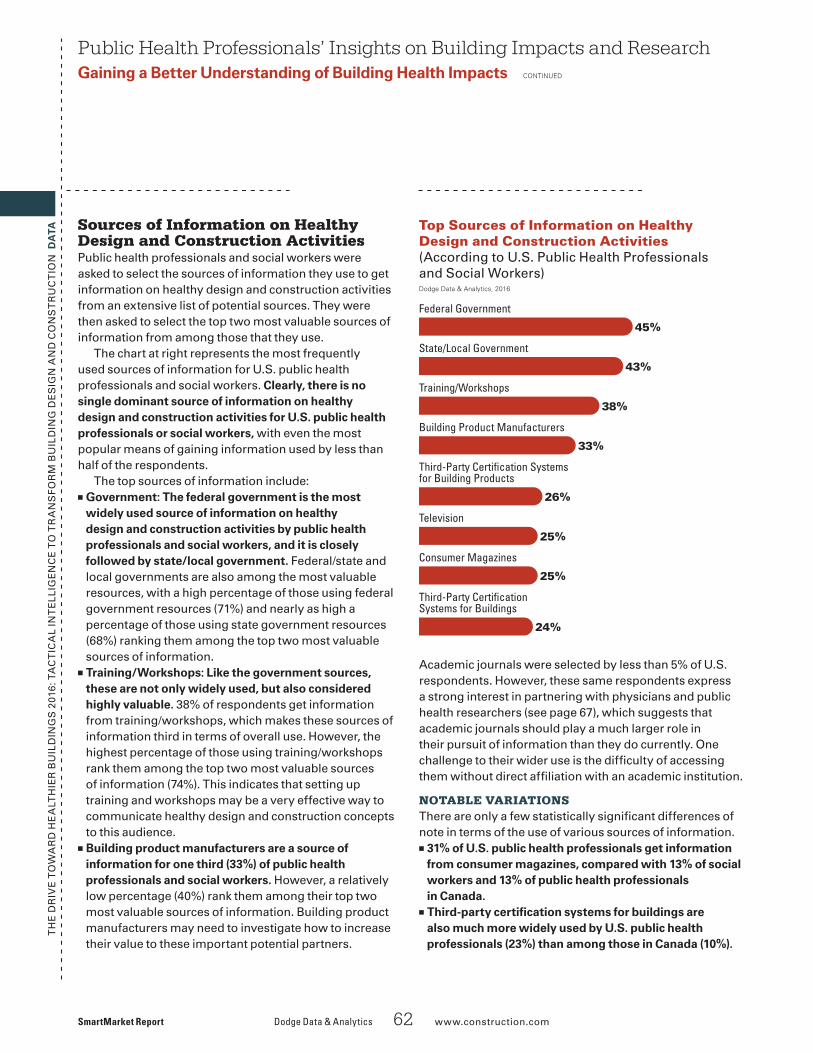
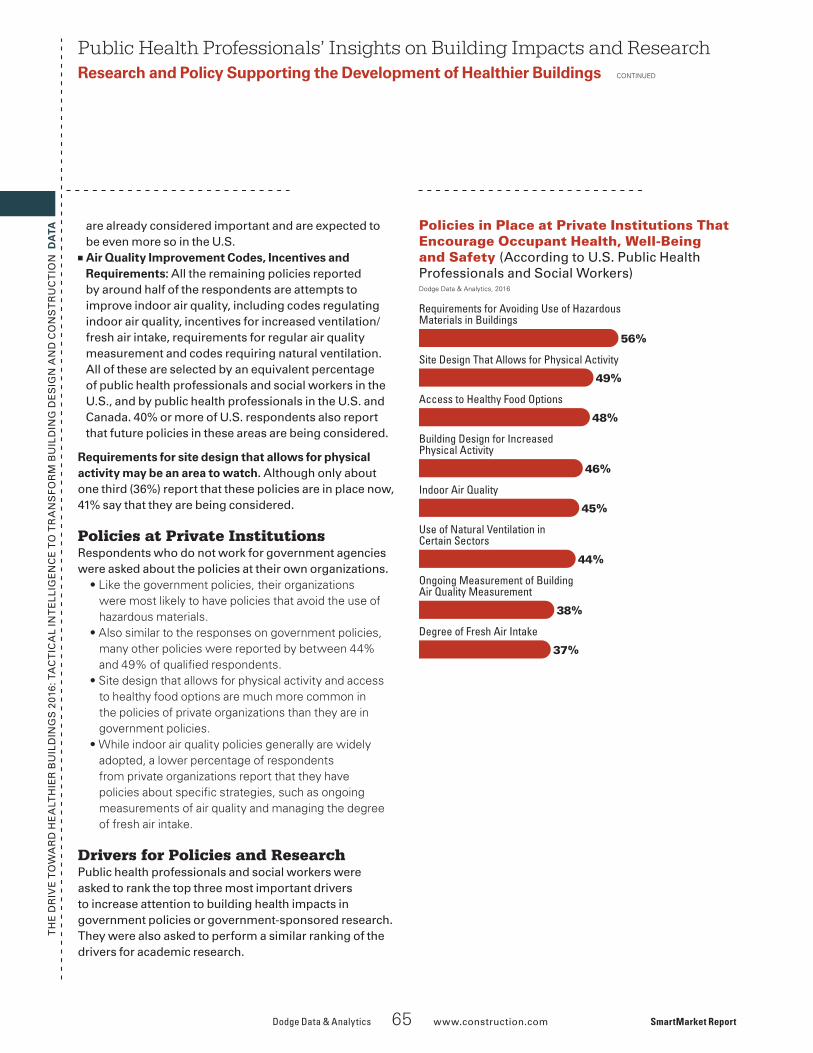
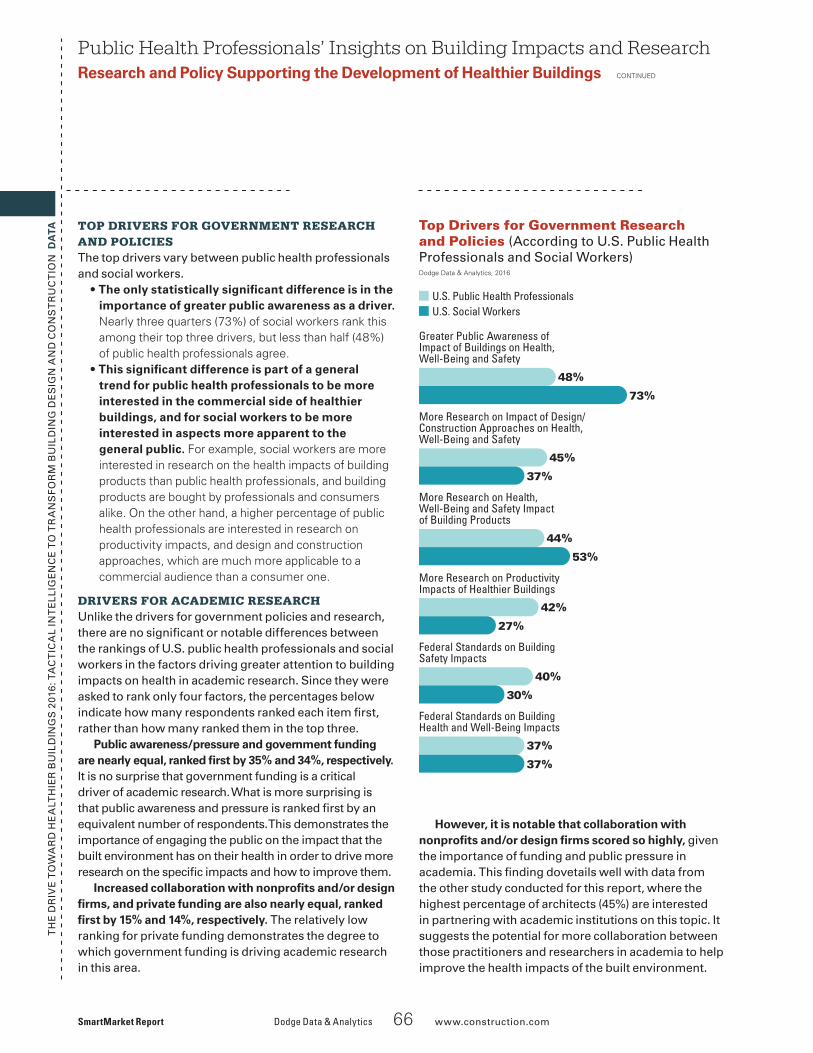
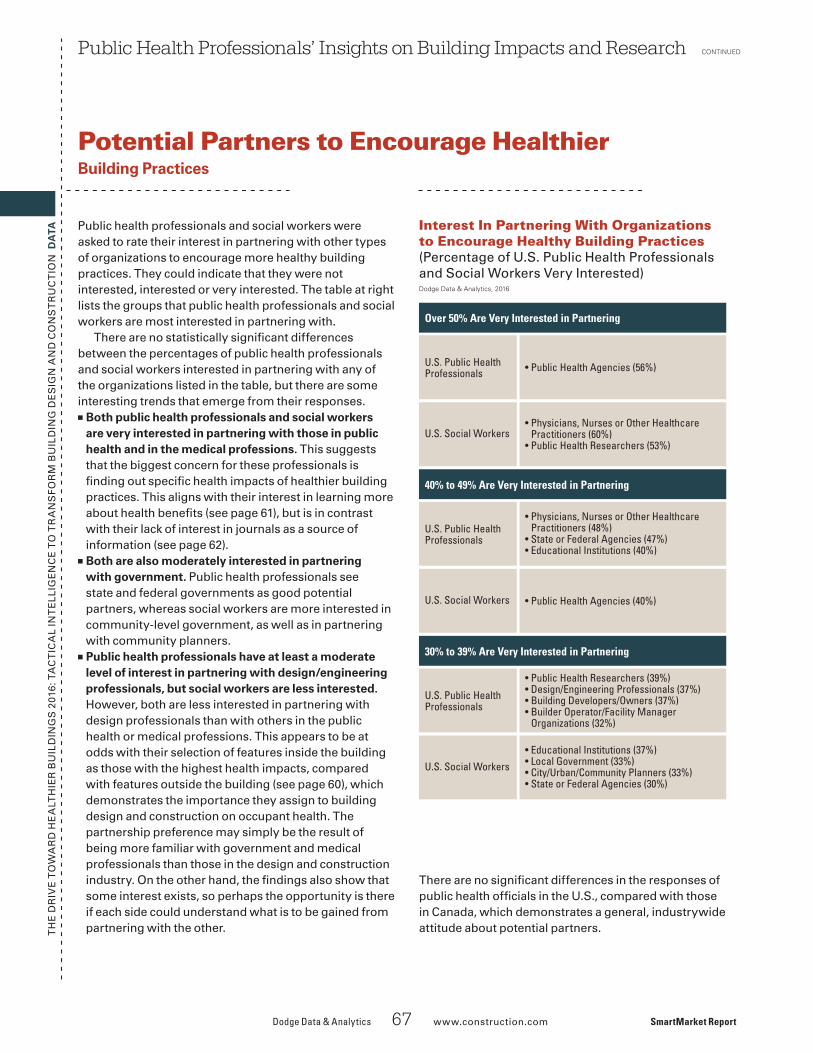
SmartMarket Report The Drive Toward Healthier Buildings 2016: Tactical Intelligence to Transform Building Design and Construction Premier Partners: Contributing Partners: Supporting Partners: Research Partners: AMERICAN SOCIETY OF INTERIOR DESIGNERS
Transcript
SmartMarket Report
The Drive Toward Healthier Buildings 2016:Tactical Intelligence to Transform Building Design and Construction
Premier Partners:
Contributing Partners:
Supporting Partners: Research Partners:
AMERICANSOCIETY OF INTERIOR DESIGNERS
■ Design and Construction Intelligence
SmartMarket Report
Dodge Data & Analytics
Chief Executive OfficerMichael Petrullo
Dodge Data & Analytics Research & Analytics/ Industry Insights
Senior Director, Research & AnalyticsBurleigh Morton
Senior Director, Industry Insights Research Stephen A. Jones
Director, Industry Insights Research Donna Laquidara-Carr, Ph.D., LEED AP
Reproduction or dissemination of any information contained herein is granted only by contract or prior written permission from Dodge Data & Analytics.
About Dodge Data & AnalyticsDodge Data & Analytics is a technology-driven construction project data, analytics and insights provider. Dodge provides trusted market intelligence that helps construction professionals grow their business, and is rede�ning and recreating the business tools and processes on which the industry relies. Dodge is creating an integrated platform that uni�es and simpli�es the design, bid and build process, bringing data on people, projects and products into a single hub for the entire industry, from building product manufacturers to contractors and specialty trades to architects and engineers. The company’s products include Dodge Global Network, Dodge SpecShare®, Dodge BuildShare®, Dodge MarketShare™, and the ConstructionPoints and Sweets family of products.
To learn more,visit www.construction.com.
McGraw Hill Construction is now
New name. Same smart people, products and
services, committed to helping your business grow.
We have a new email address.
Deliveries that you have been receiving from MHC Analytics,
list of approved senders to ensure your deliveries are
directed to your inbox and not your junk mail folder.
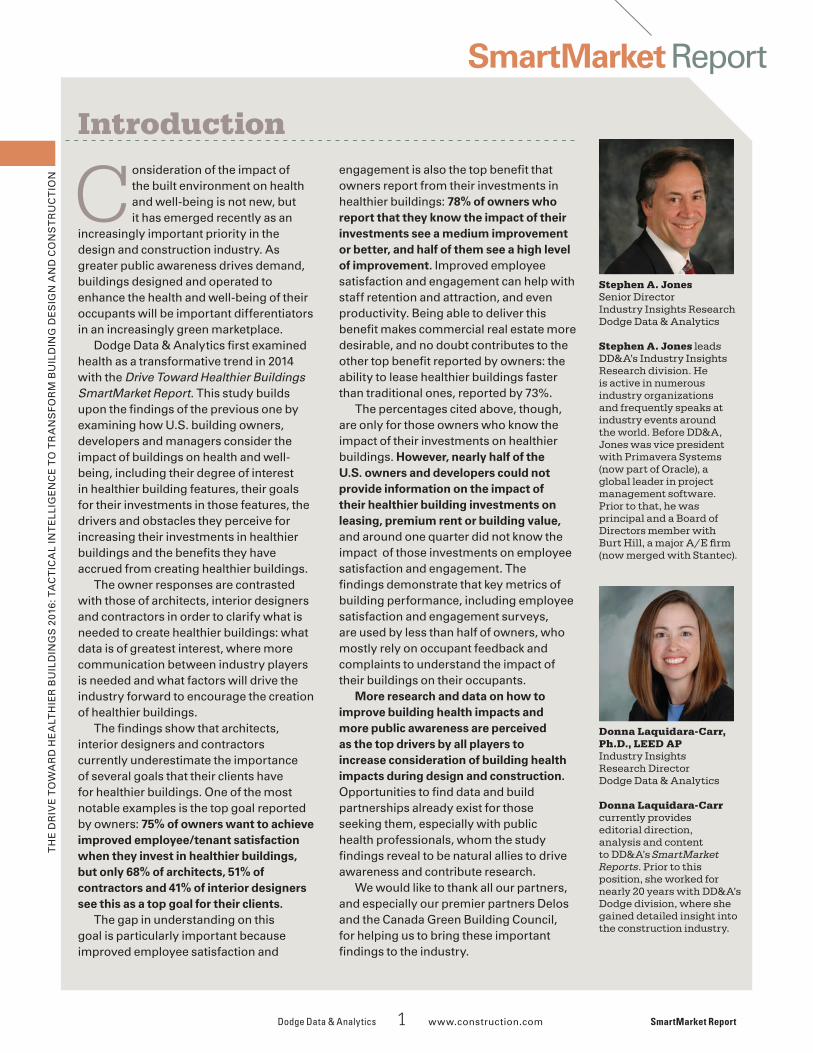
Introduction
Stephen A. JonesSenior DirectorIndustry Insights ResearchDodge Data & Analytics
Stephen A. Jones leads DD&A’s Industry Insights Research division. He is active in numerous industry organizations and frequently speaks at industry events around the world. Before DD&A, Jones was vice president with Primavera Systems (now part of Oracle), a global leader in project management software. Prior to that, he was principal and a Board of Directors member with Burt Hill, a major A/E firm (now merged with Stantec).
Donna Laquidara-Carr, Ph.D., LEED AP Industry Insights Research DirectorDodge Data & Analytics
Donna Laquidara-Carr currently provides editorial direction, analysis and content to DD&A’s SmartMarket Reports. Prior to this position, she worked for nearly 20 years with DD&A’s Dodge division, where she gained detailed insight into the construction industry.
TH
E D
RIV
E T
OW
AR
D H
EA
LTH
IER
BU
ILD
ING
S 2
016:
TA
CT
ICA
L IN
TE
LLIG
EN
CE
TO
TR
AN
SF
OR
M B
UIL
DIN
G D
ES
IGN
AN
D C
ON
ST
RU
CT
ION
SmartMarket Report
Dodge Data & Analytics 1 www.construction.com SmartMarket Report
Consideration of the impact of the built environment on health and well-being is not new, but it has emerged recently as an
increasingly important priority in the design and construction industry. As greater public awareness drives demand, buildings designed and operated to enhance the health and well-being of their occupants will be important differentiators in an increasingly green marketplace.
Dodge Data & Analytics �rst examined health as a transformative trend in 2014 with the Drive Toward Healthier Buildings SmartMarket Report. This study builds upon the �ndings of the previous one by examining how U.S. building owners, developers and managers consider the impact of buildings on health and well-being, including their degree of interest in healthier building features, their goals for their investments in those features, the drivers and obstacles they perceive for increasing their investments in healthier buildings and the bene�ts they have accrued from creating healthier buildings.
The owner responses are contrasted with those of architects, interior designers and contractors in order to clarify what is needed to create healthier buildings: what data is of greatest interest, where more communication between industry players is needed and what factors will drive the industry forward to encourage the creation of healthier buildings.
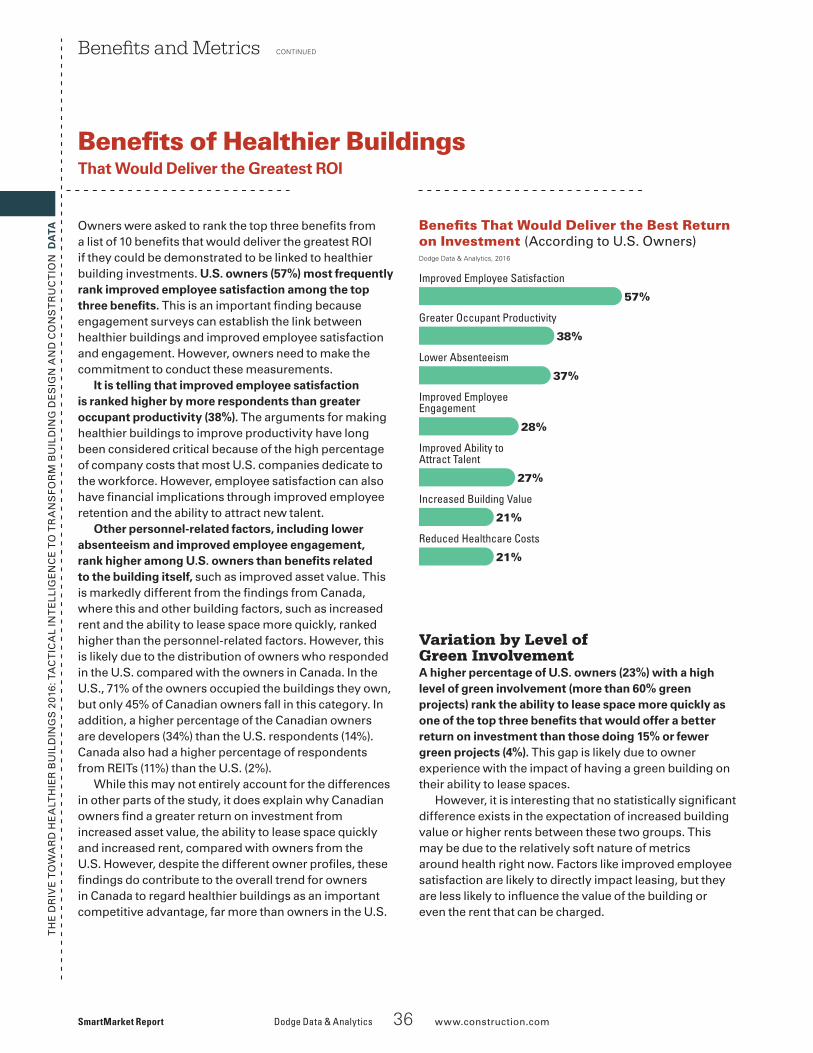
The �ndings show that architects, interior designers and contractors currently underestimate the importance of several goals that their clients have for healthier buildings. One of the most notable examples is the top goal reported by owners: 75% of owners want to achieve improved employee/tenant satisfaction when they invest in healthier buildings, but only 68% of architects, 51% of contractors and 41% of interior designers see this as a top goal for their clients.
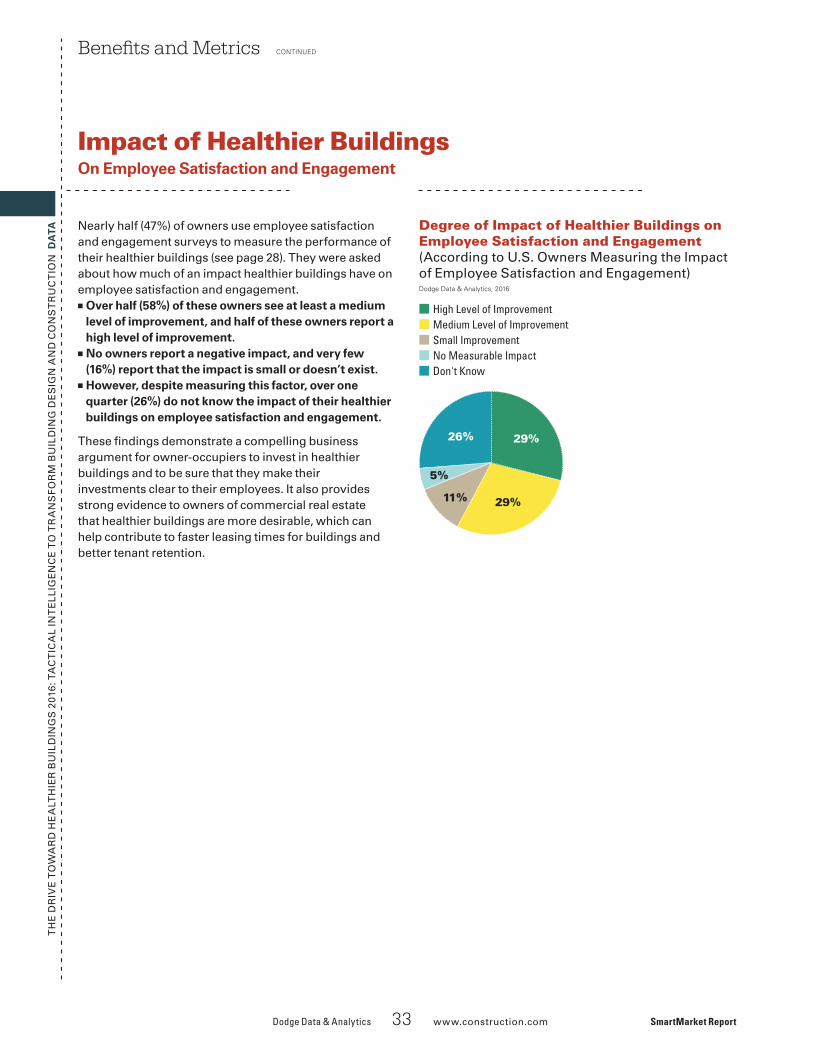
The gap in understanding on this goal is particularly important because improved employee satisfaction and
engagement is also the top bene�t that owners report from their investments in healthier buildings: 78% of owners who report that they know the impact of their investments see a medium improvement or better, and half of them see a high level of improvement. Improved employee satisfaction and engagement can help with staff retention and attraction, and even productivity. Being able to deliver this bene�t makes commercial real estate more desirable, and no doubt contributes to the other top bene�t reported by owners: the ability to lease healthier buildings faster than traditional ones, reported by 73%.
The percentages cited above, though, are only for those owners who know the impact of their investments on healthier buildings. However, nearly half of the U.S. owners and developers could not provide information on the impact of their healthier building investments on leasing, premium rent or building value, and around one quarter did not know the impact of those investments on employee satisfaction and engagement. The �ndings demonstrate that key metrics of building performance, including employee satisfaction and engagement surveys, are used by less than half of owners, who mostly rely on occupant feedback and complaints to understand the impact of their buildings on their occupants.
More research and data on how to improve building health impacts and more public awareness are perceived as the top drivers by all players to increase consideration of building health impacts during design and construction. Opportunities to �nd data and build partnerships already exist for those seeking them, especially with public health professionals, whom the study �ndings reveal to be natural allies to drive awareness and contribute research.
We would like to thank all our partners, and especially our premier partners Delos and the Canada Green Building Council, for helping us to bring these important �ndings to the industry.
TACTICAL INTELLIGENCE TO TRANSFORM BUILDING DESIGN AND CONSTRUCTION
SmartMarket Report Dodge Data & Analytics 2 www.construction.com
Cov
er Il
lust
ratio
n: L
OU
LOU
& T
UM
MIE
; Opp
osite
Lef
t: P
hoto
grap
h C
ourt
esy
of W
illia
m B
row
ning
; Opp
osite
Rig
ht: P
hoto
grap
h C
ourt
esy
of V
DM
O A
rchi
tes
/ Tom
Dal
y
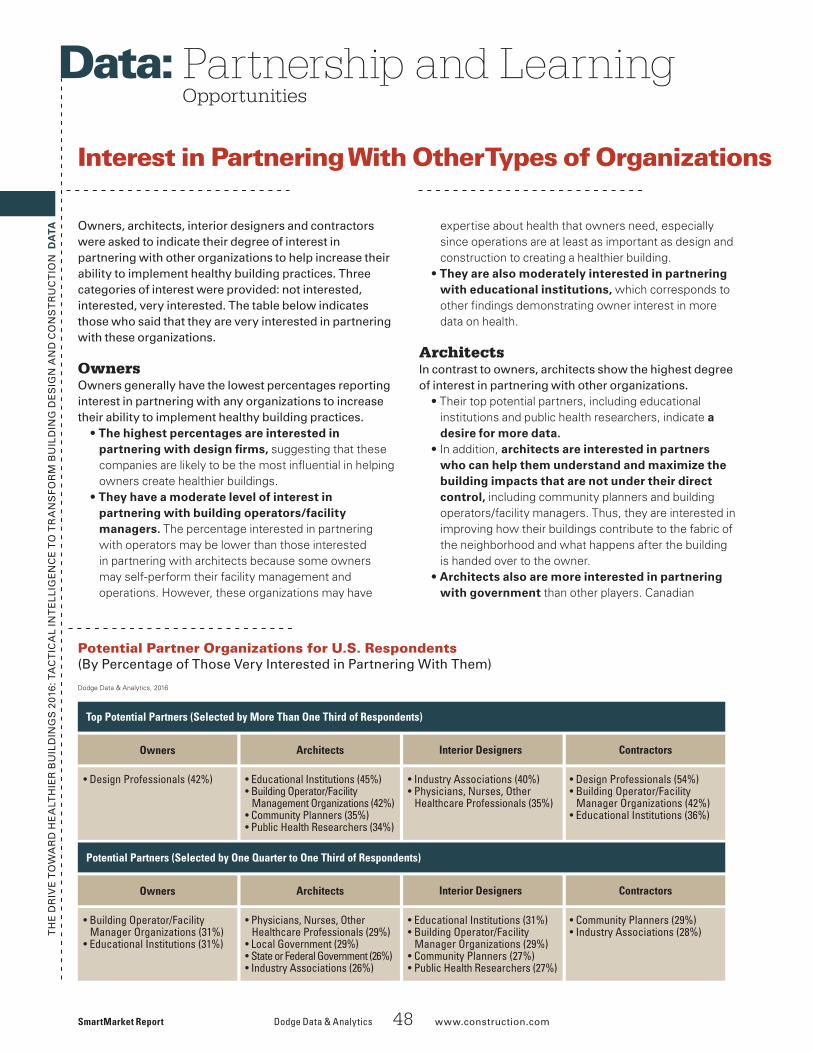
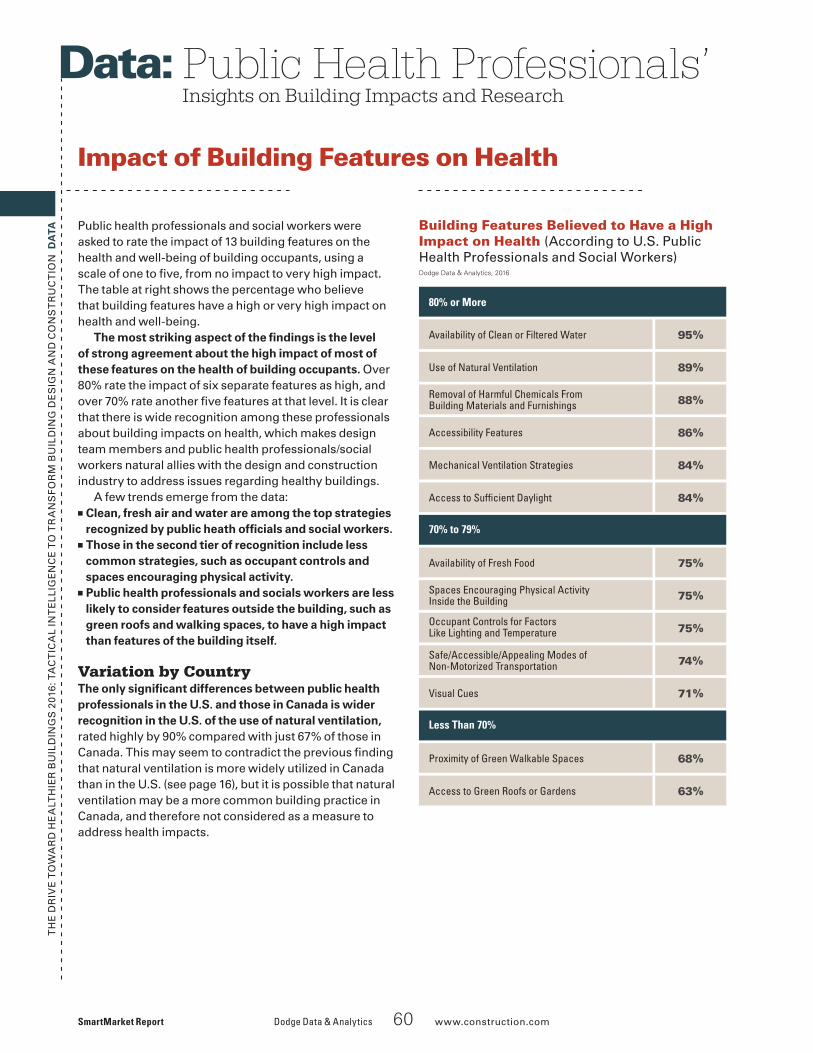
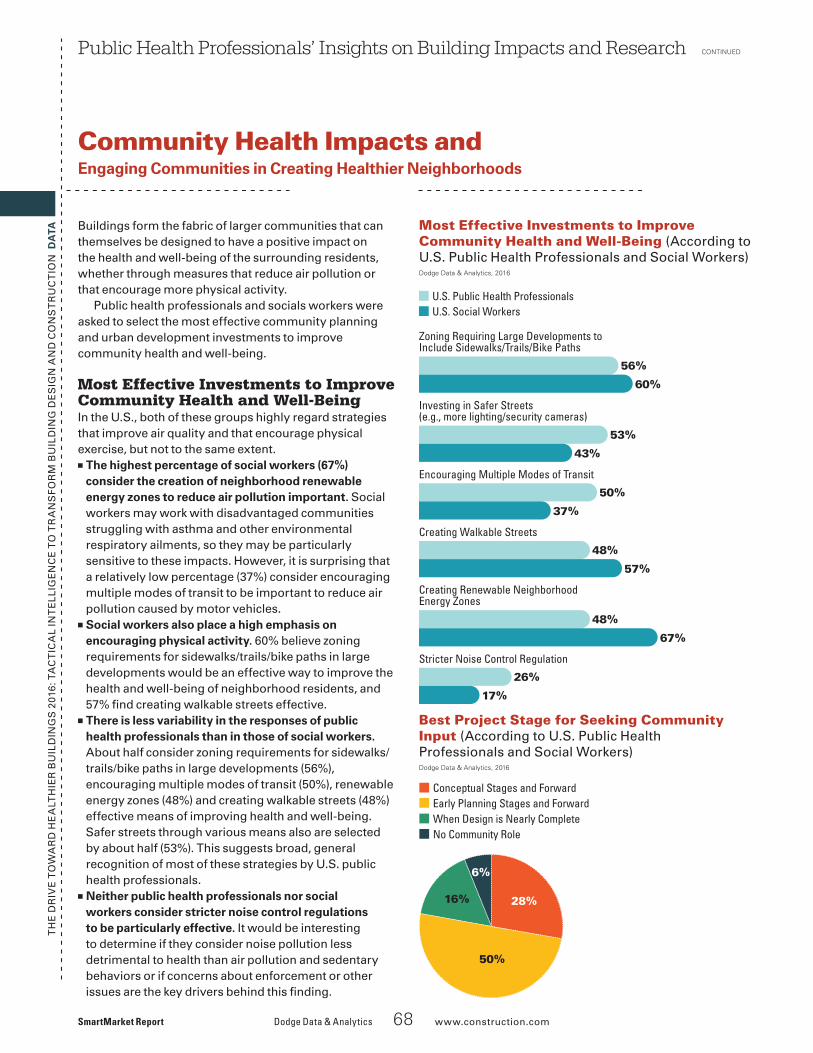
60 Public Health Professionals’ Insights on Building Impacts and Research 60 Impact of Building Features on Health
61 Gaining a Better Understanding of Building Impacts on Occupant Health and Well-Being
63 Top Outcomes Expected From Consideration of Occupant Health and Well-Being
64 Research and Policy Supporting the Development of Healthier Buildings
67 Potential Partners to Encourage Healthier Building Practices
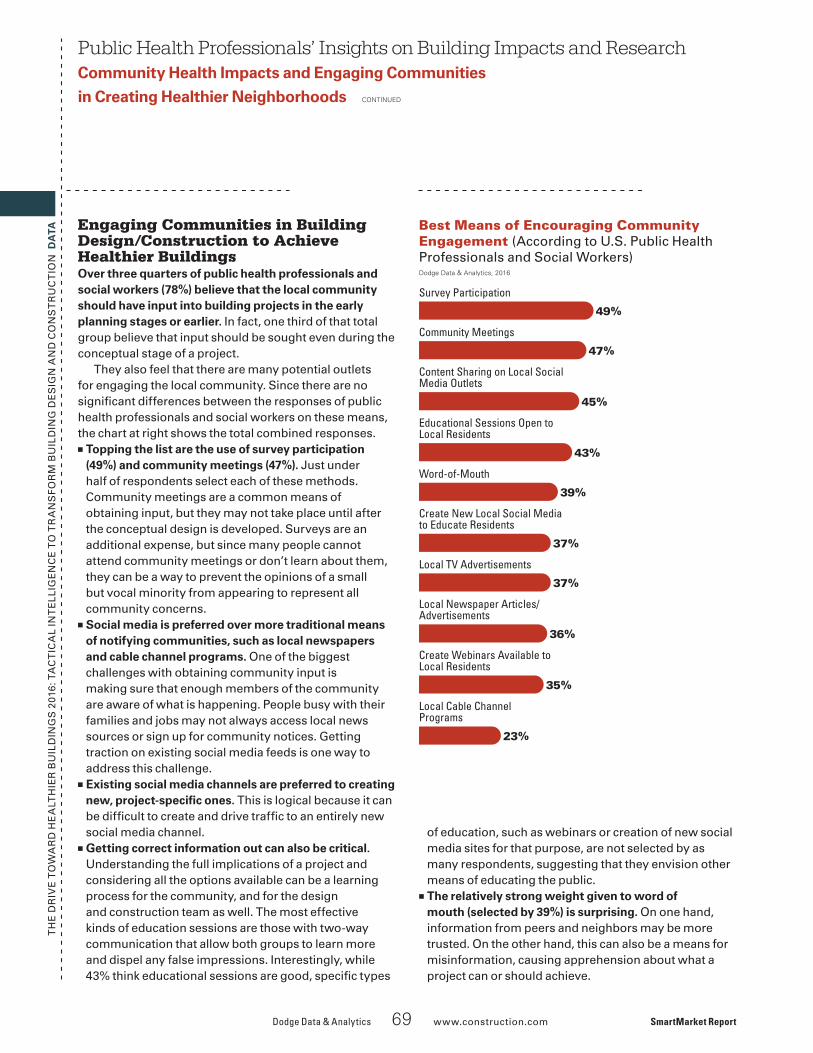
68 Community Health Impacts and Engaging Communities in Creating Healthier Neighborhoods
Thought Leader Interviews53 Carol D. Corr, Board of Directors, American Institute of Architects, San Francisco
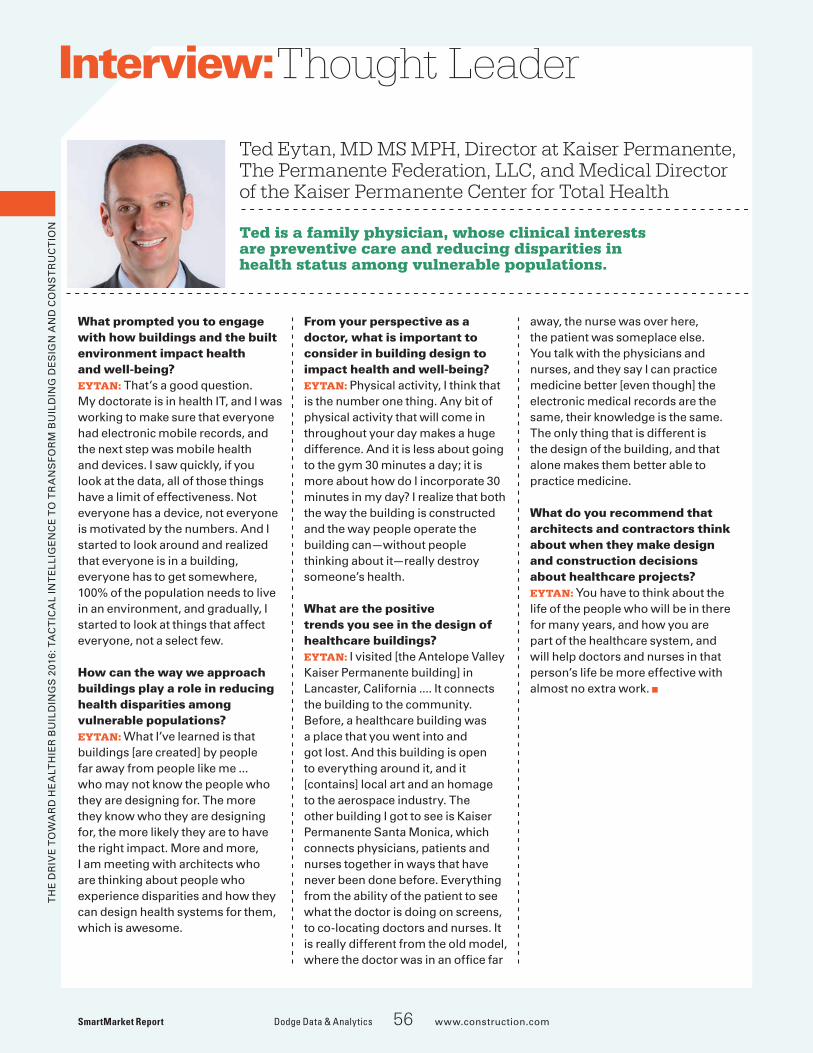
56 Ted Eytan, MD MS MPH, Director at Kaiser Permanente, the Permanente Federation, LLC, and Medical Director of the Kaiser Permanente Center for Total Health
Case Studies 26 Prioritizing Health in Affordable Housing
The Rose Apartment Building, Minneapolis, Minnesota
38 Proving Ground for Healthier Of�ce Design TD Centre 23rd Floor Renovation, Toronto, Canada
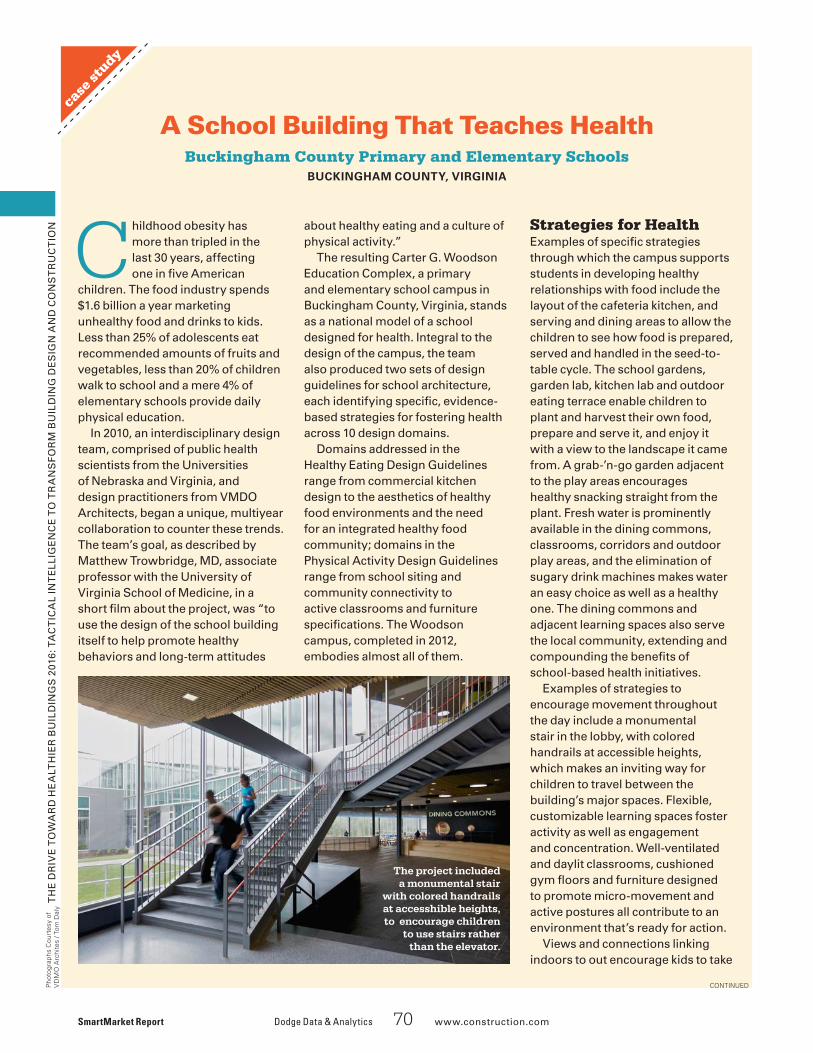
70 A School Building That Teaches Health Buckingham County Primary and Elementary Schools, Buckingham County, Virginia
72 Methodology
73 Resources
Dodge Data & Analytics 3 www.construction.com SmartMarket Report
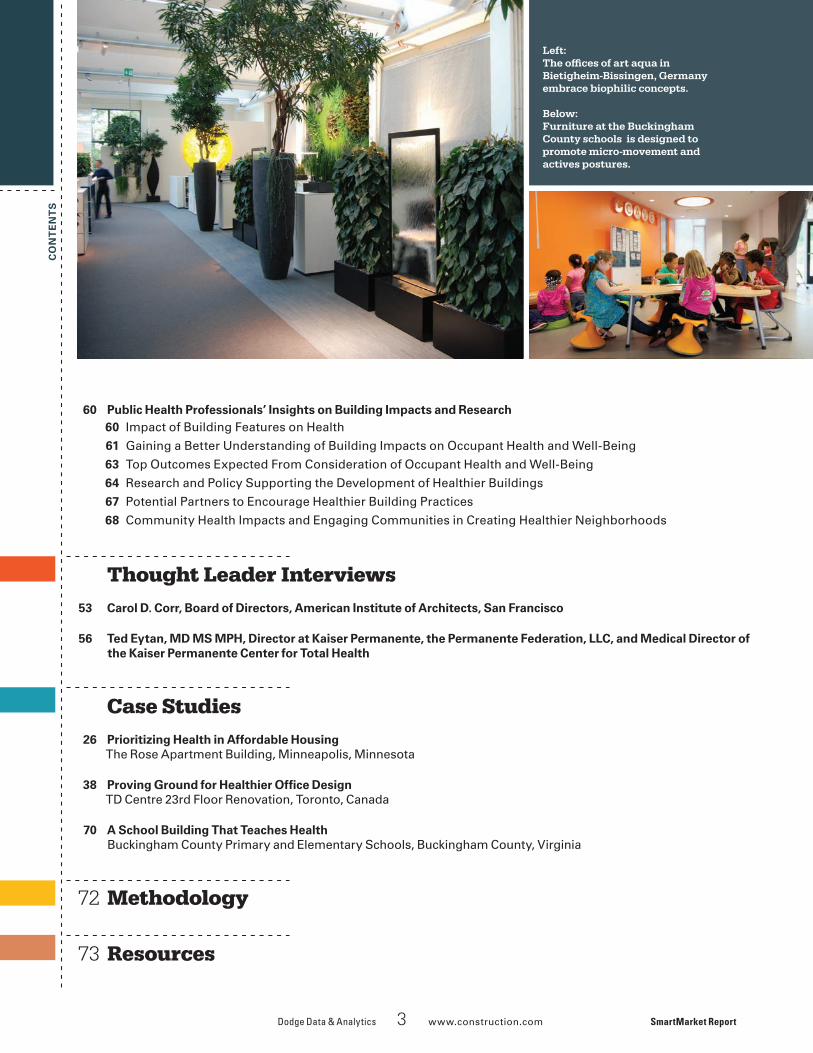
Left:The offices of art aqua in Bietigheim-Bissingen, Germany embrace biophilic concepts.
Below:Furniture at the Buckingham County schools is designed to promote micro-movement and actives postures.
CO
NT
EN
TS
TH
E D
RIV
E T
OW
AR
D H
EA
LTH
IER
BU
ILD
ING
S 2
016:
TA
CT
ICA
L IN
TE
LLIG
EN
CE
TO
TR
AN
SF
OR
M B
UIL
DIN
G D
ES
IGN
AN
D C
ON
ST
RU
CT
ION Investments in healthier buildings are poised to be a transformative
trend in the design and construction industry.For that potential to be realized, though, architects, interior designers and contractors need to better understand the priorities of their clients, owners need to pursue the data demonstrating speci�c business and �nancial bene�ts, and the industry as a whole needs to recognize and pursue valuable partners like public health professionals for furthering public awareness, policies promoting healthier buildings and better data on building health impacts.
Increasing the In�uence of Building Health Impacts on Design and Construction DecisionsEven though consideration of building health impacts are in�uential for about two thirds (67%) of U.S. owners when they make design and construction decisions, more owners are in�uenced by other factors like cost savings during design and construction (85%), aesthetics (74%) and energy performance (74%). In�uencing more owners to prioritize health is critical to increase investments in healthier buildings.
However, the priorities noted above can be leveraged to increase healthier building investments through:
• Consideration of cost on a building lifecycle basis rather than separate capital and operating costs
• More data and wider understanding of the benefits of healthier buildings
• Recognition of how healthier buildings can be more aesthetically appealing, through healthier building strategies such as daylighting and biophilic elements
• More education about balancing energy and health concerns
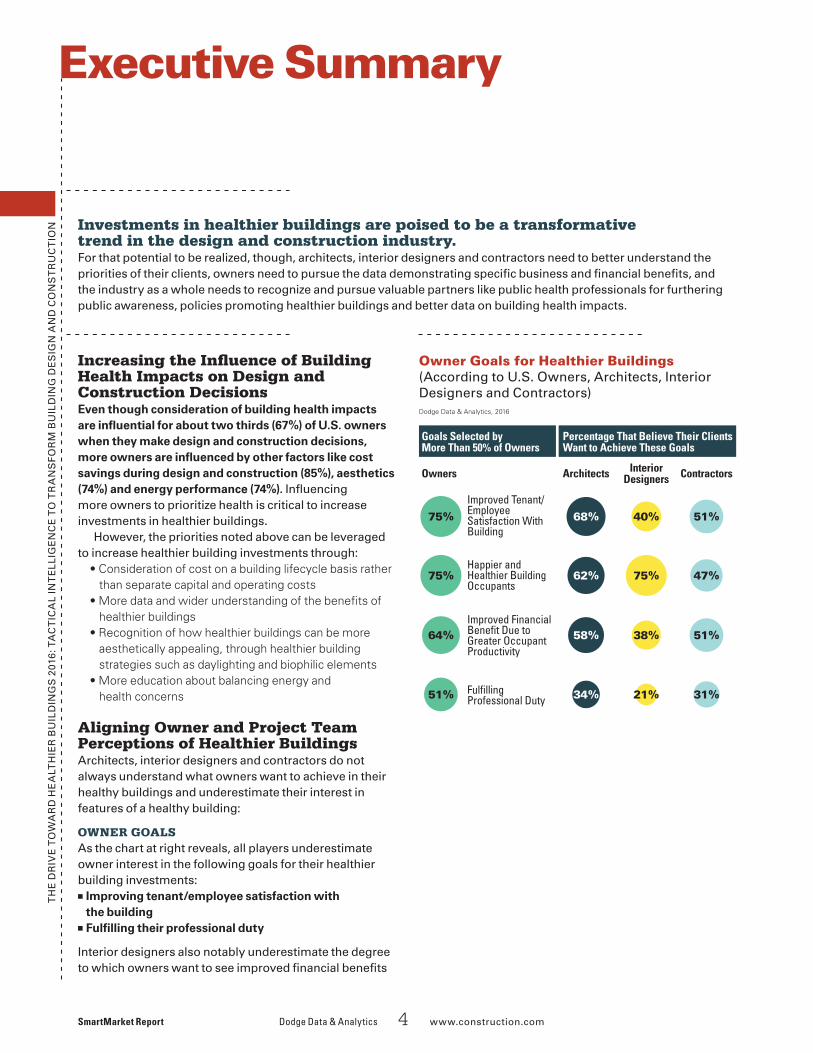
Aligning Owner and Project Team Perceptions of Healthier BuildingsArchitects, interior designers and contractors do not always understand what owners want to achieve in their healthy buildings and underestimate their interest in features of a healthy building:
OWNER GOALSAs the chart at right reveals, all players underestimate owner interest in the following goals for their healthier building investments:■ Improving tenant/employee satisfaction with
the building■ Ful�lling their professional duty
Interior designers also notably underestimate the degree to which owners want to see improved �nancial bene�ts
Executive Summary
SmartMarket Report Dodge Data & Analytics 4 www.construction.com
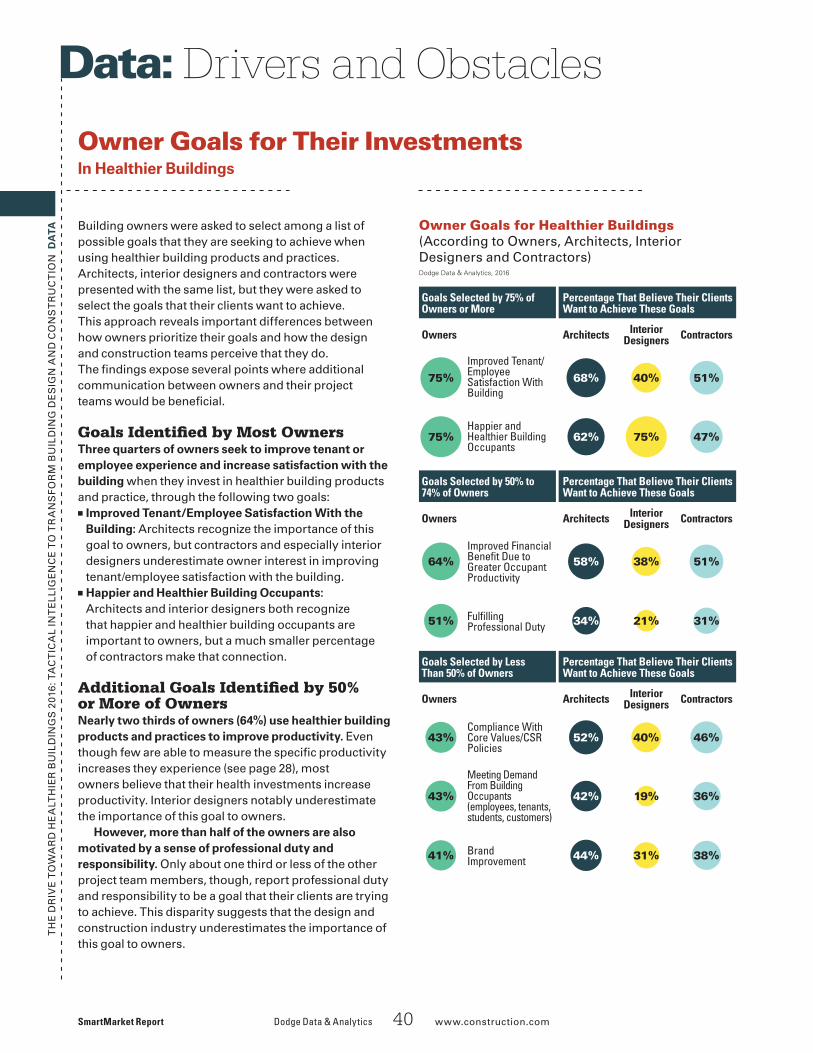
Owner Goals for Healthier Buildings (According to U.S. Owners, Architects, Interior Designers and Contractors)
8_02_HealthSMR_Batch8_ES_OwnerGoals_#01
Dodge Data & Analytics, 2016
Improved Tenant/ Employee Satisfaction With Building
Happier and Healthier Building Occupants
Improved Financial Bene�t Due to Greater Occupant Productivity
Ful�lling Professional Duty
ContractorsInteriorDesignersArchitectsOwners
Goals Selected by More Than 50% of Owners
Percentage That Believe Their ClientsWant to Achieve These Goals
68% 75%
75%
64%
51%
40% 51%
62% 75% 47%
58% 38% 51%
34% 21% 31%
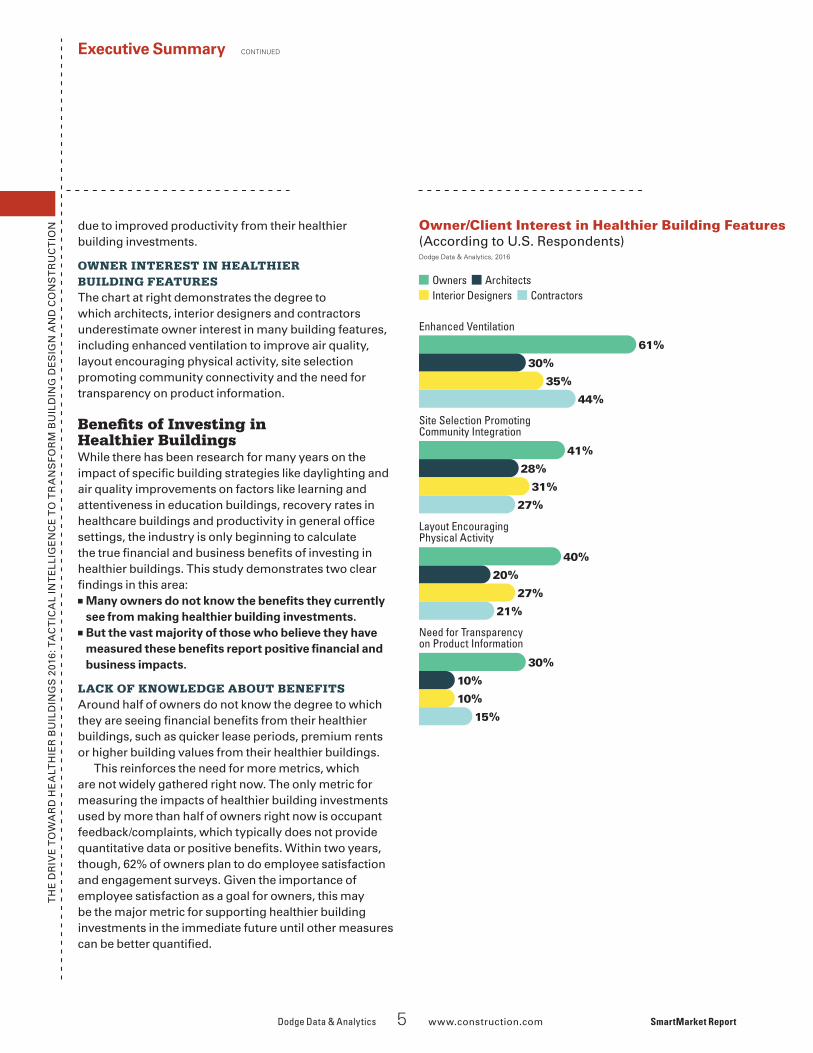
Owner/Client Interest in Healthier Building Features(According to U.S. Respondents)
TH
E D
RIV
E T
OW
AR
D H
EA
LTH
IER
BU
ILD
ING
S 2
016:
TA
CT
ICA
L IN
TE
LLIG
EN
CE
TO
TR
AN
SF
OR
M B
UIL
DIN
G D
ES
IGN
AN
D C
ON
ST
RU
CT
ION due to improved productivity from their healthier
building investments.
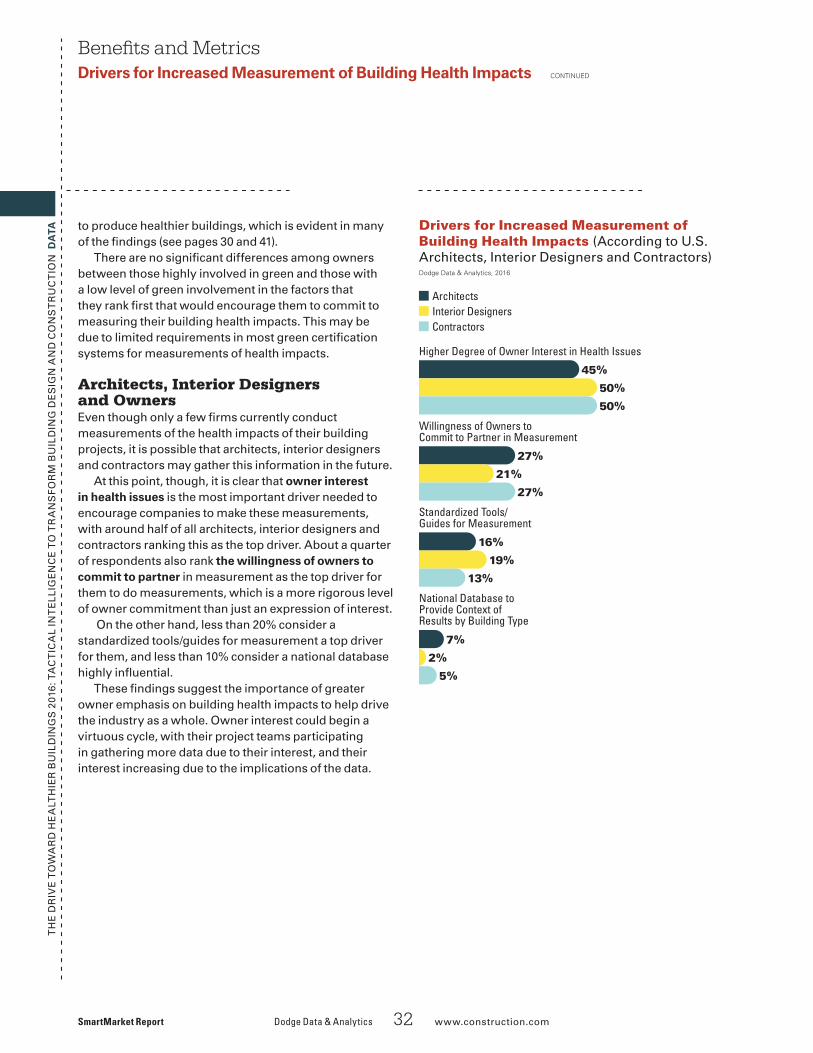
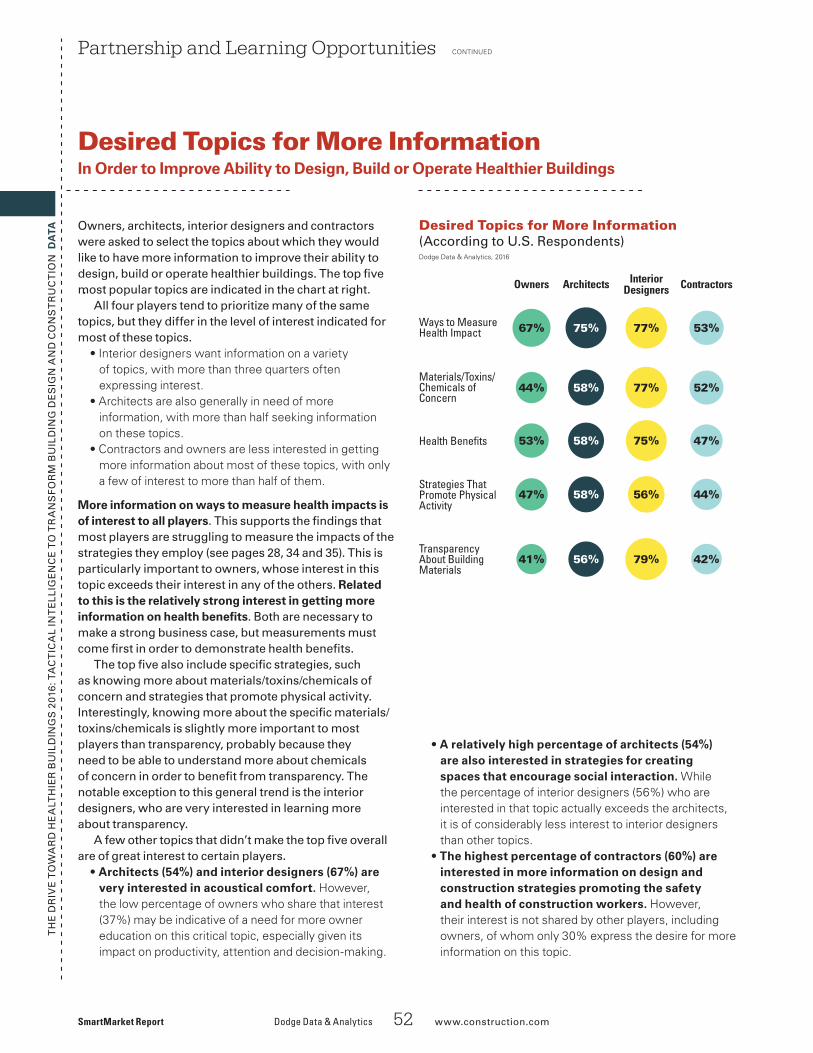
OWNER INTEREST IN HEALTHIER BUILDING FEATURESThe chart at right demonstrates the degree to which architects, interior designers and contractors underestimate owner interest in many building features, including enhanced ventilation to improve air quality, layout encouraging physical activity, site selection promoting community connectivity and the need for transparency on product information.
Bene�ts of Investing in Healthier Buildings While there has been research for many years on the impact of speci�c building strategies like daylighting and air quality improvements on factors like learning and attentiveness in education buildings, recovery rates in healthcare buildings and productivity in general of�ce settings, the industry is only beginning to calculate the true �nancial and business bene�ts of investing in healthier buildings. This study demonstrates two clear �ndings in this area:■ Many owners do not know the bene�ts they currently
see from making healthier building investments.■ But the vast majority of those who believe they have
measured these bene�ts report positive �nancial and business impacts.
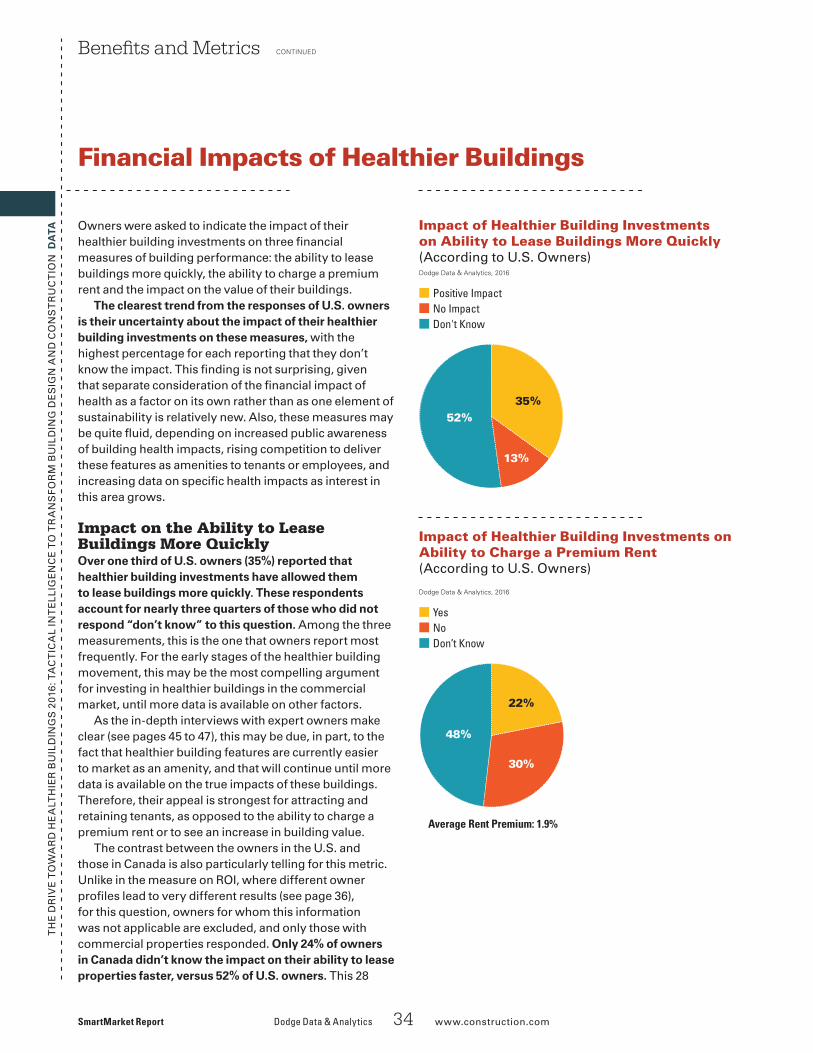
LACK OF KNOWLEDGE ABOUT BENEFITSAround half of owners do not know the degree to which they are seeing �nancial bene�ts from their healthier buildings, such as quicker lease periods, premium rents or higher building values from their healthier buildings.
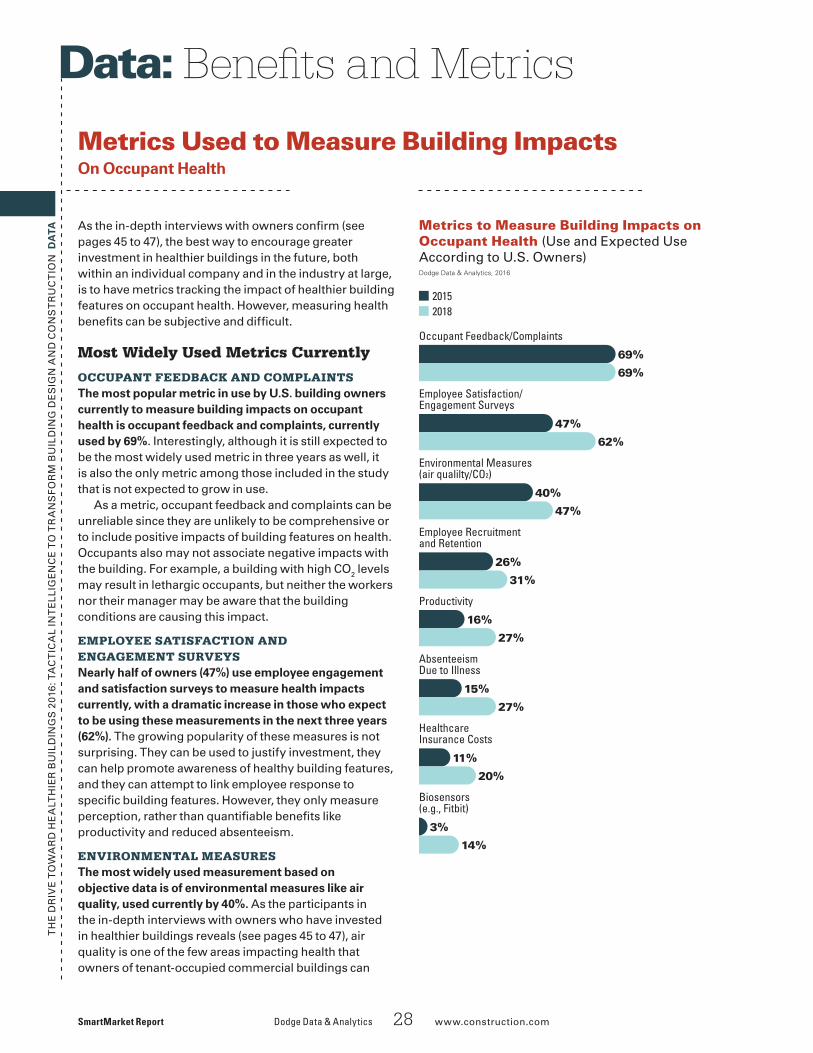
This reinforces the need for more metrics, which are not widely gathered right now. The only metric for measuring the impacts of healthier building investments used by more than half of owners right now is occupant feedback/complaints, which typically does not provide quantitative data or positive bene�ts. Within two years, though, 62% of owners plan to do employee satisfaction and engagement surveys. Given the importance of employee satisfaction as a goal for owners, this may be the major metric for supporting healthier building investments in the immediate future until other measures can be better quanti�ed.
Executive Summary CONTINUED
Dodge Data & Analytics 5 www.construction.com SmartMarket Report
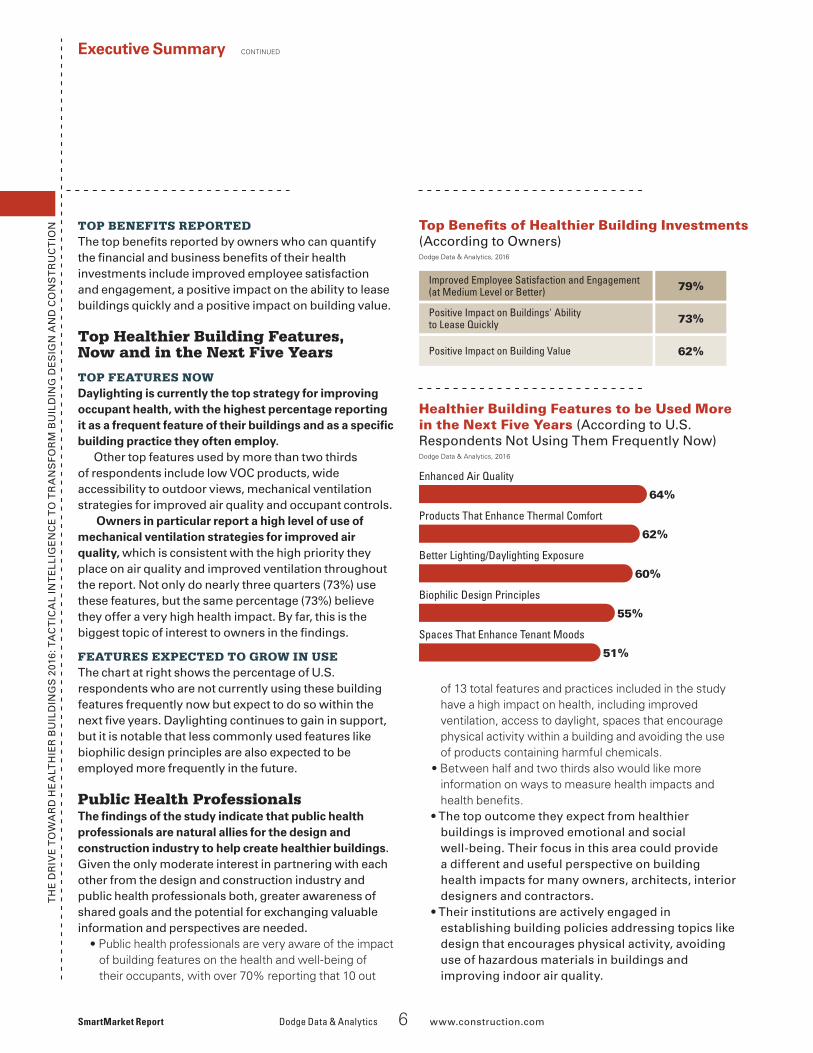
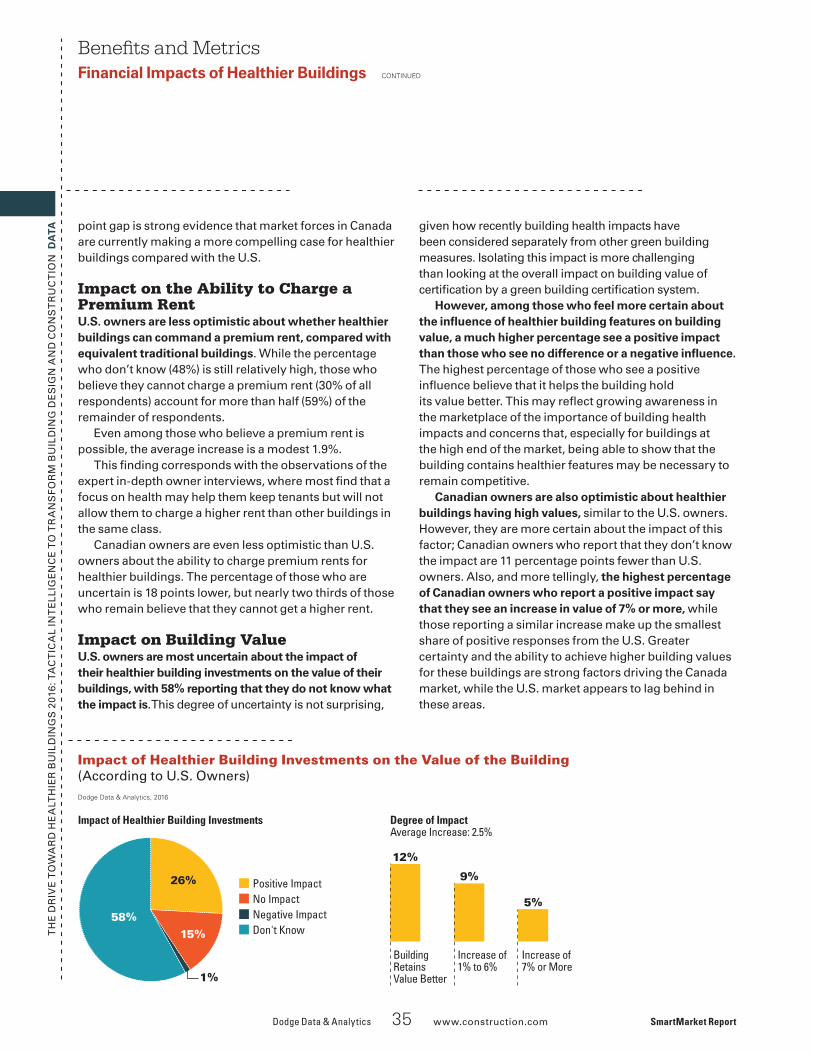
The top bene�ts reported by owners who can quantify the �nancial and business bene�ts of their health investments include improved employee satisfaction and engagement, a positive impact on the ability to lease buildings quickly and a positive impact on building value.
Top Healthier Building Features, Now and in the Next Five Years
TOP FEATURES NOWDaylighting is currently the top strategy for improving occupant health, with the highest percentage reporting it as a frequent feature of their buildings and as a speci�c building practice they often employ.
Other top features used by more than two thirds of respondents include low VOC products, wide accessibility to outdoor views, mechanical ventilation strategies for improved air quality and occupant controls.
Owners in particular report a high level of use of mechanical ventilation strategies for improved air quality, which is consistent with the high priority they place on air quality and improved ventilation throughout the report. Not only do nearly three quarters (73%) use these features, but the same percentage (73%) believe they offer a very high health impact. By far, this is the biggest topic of interest to owners in the �ndings.
FEATURES EXPECTED TO GROW IN USEThe chart at right shows the percentage of U.S. respondents who are not currently using these building features frequently now but expect to do so within the next �ve years. Daylighting continues to gain in support, but it is notable that less commonly used features like biophilic design principles are also expected to be employed more frequently in the future.
Public Health ProfessionalsThe �ndings of the study indicate that public health professionals are natural allies for the design and construction industry to help create healthier buildings. Given the only moderate interest in partnering with each other from the design and construction industry and public health professionals both, greater awareness of shared goals and the potential for exchanging valuable information and perspectives are needed.
• Public health professionals are very aware of the impact of building features on the health and well-being of their occupants, with over 70% reporting that 10 out
Executive Summary CONTINUED
SmartMarket Report Dodge Data & Analytics 6 www.construction.com
of 13 total features and practices included in the study have a high impact on health, including improved ventilation, access to daylight, spaces that encourage physical activity within a building and avoiding the use of products containing harmful chemicals.
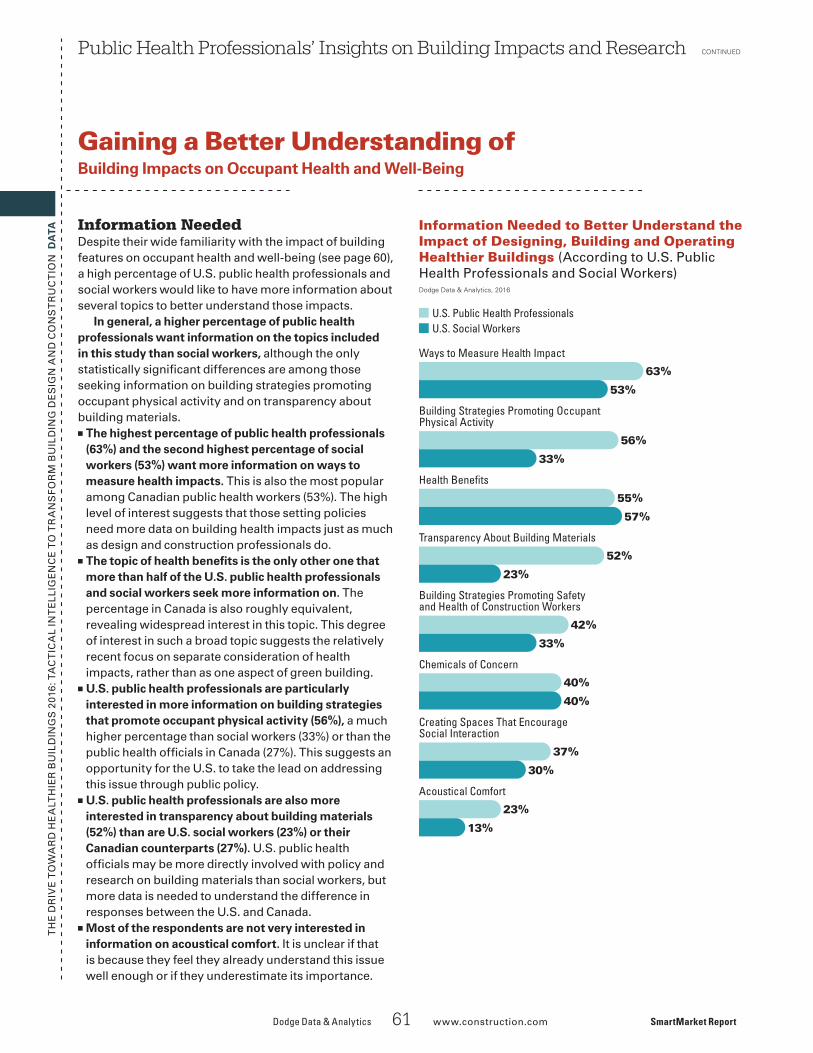
• Between half and two thirds also would like more information on ways to measure health impacts and health benefits.
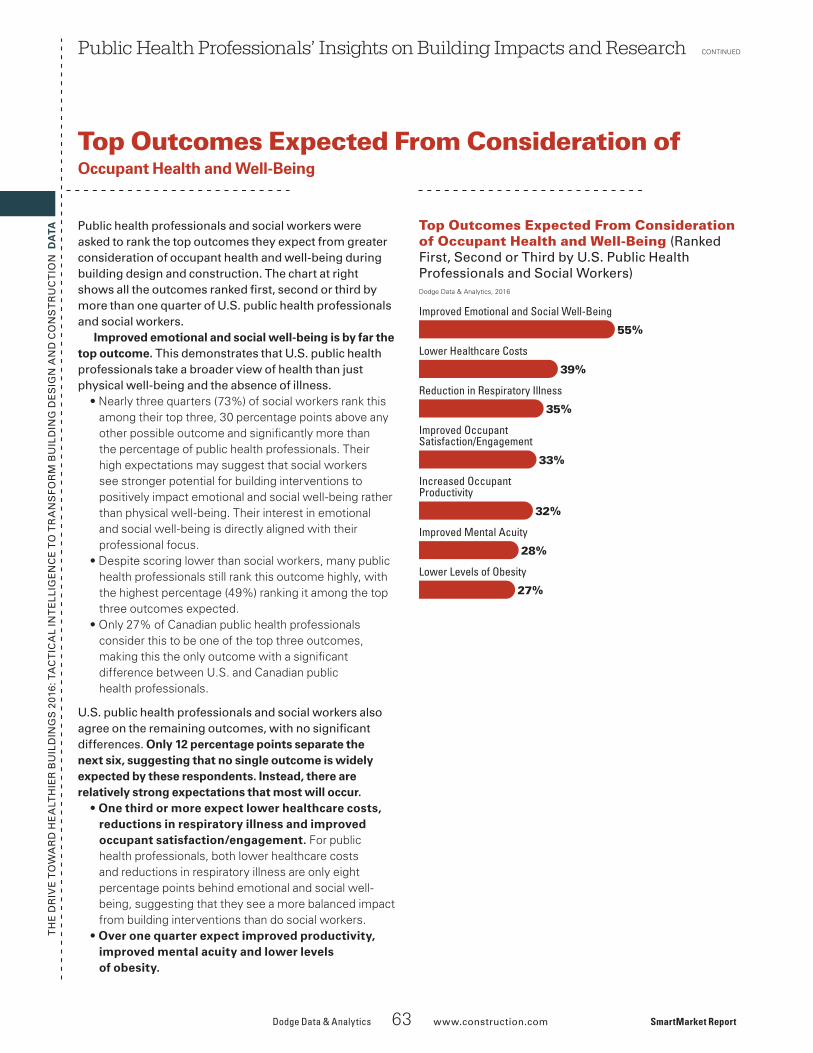
• The top outcome they expect from healthier buildings is improved emotional and social well-being. Their focus in this area could provide a different and useful perspective on building health impacts for many owners, architects, interior designers and contractors.
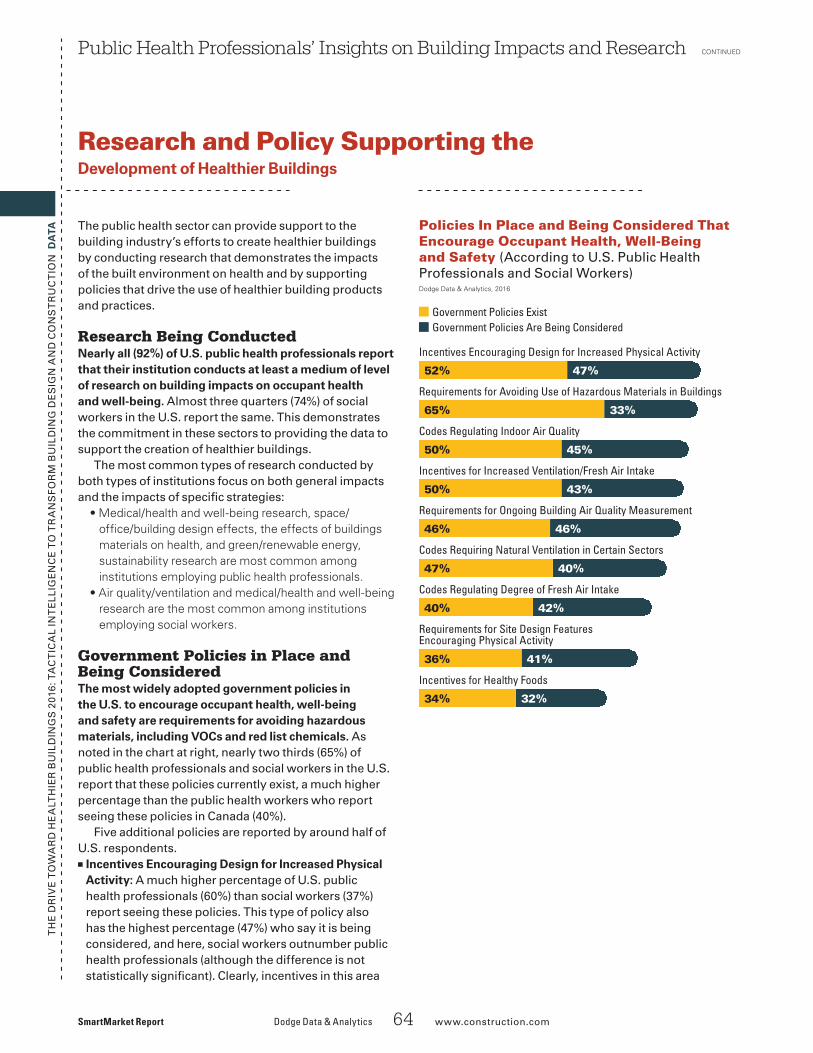
• Their institutions are actively engaged in establishing building policies addressing topics like design that encourages physical activity, avoiding use of hazardous materials in buildings and improving indoor air quality.
Dodge Data & Analytics, 2016
8_05_HealthSMR_Batch8_ES_TableofBenefits_#01
Improved Employee Satisfaction and Engagement (at Medium Level or Better) 79%
Positive Impact on Buildings' Ability to Lease Quickly 73%
Positive Impact on Building Value 62%
Top Bene�ts of Healthier Building Investments (According to Owners)
Healthier Building Features to be Used More in the Next Five Years (According to U.S. Respondents Not Using Them Frequently Now)
8_04_HealthSMR_Batch8_ES_Future Features_#01
Dodge Data & Analytics, 2016
64%
Enhanced Air Quality
62%
Products That Enhance Thermal Comfort
60%
Better Lighting/Daylighting Exposure
55%
Biophilic Design Principles
51%
Spaces That Enhance Tenant Moods
IntroductionData:
Dodge Data & Analytics 7 www.construction.com SmartMarket Report
TH
E D
RIV
E T
OW
AR
D H
EA
LTH
IER
BU
ILD
ING
S 2
016:
TA
CT
ICA
L IN
TE
LLIG
EN
CE
TO
TR
AN
SF
OR
M B
UIL
DIN
G D
ES
IGN
AN
D C
ON
ST
RU
CT
ION
DA
TA
Construction Industry Survey
A s attention increasingly shifts in the construction industry toward the impacts of buildings on the health and well-being of occupants, the need for data on this topic
increases. Certainly, data on the impacts of speci�c building strategies is critical, and a 2015 study by the Harvard T.H. Chan School of Public Health, done in association with Syracuse University and the SUNY Upstate Medical School, has been an important addition to the growing body of knowledge about how factors like indoor air quality, lighting and acoustical comfort contribute to occupant productivity and decision-making.
For more investments to be made in healthier buildings, though, it is equally critical to understand how construction industry practitioners regard building health impacts in comparison to other priorities, what their goals are for healthier buildings, what will drive further engagement with healthier building design and construction, and which healthier building practices are in use and are seen to be most effective. This kind of tactical knowledge is essential to support efforts to increase investment and to demonstrate areas where more research and data are needed. It can also help build a more cohesive and effective project team, aligned around the goals most important to their clients.
In 2014, Dodge Data & Analytics published The Drive Toward Healthier Buildings SmartMarket Report to begin to build this understanding. Now, the most recent study takes a deeper, more tactical look at how the insights of industry players differ. Understanding the degree of engagement among building owners with building health impacts, their key priorities and the drivers encouraging them to invest more in creating healthier buildings in the future will help architects, interior designers and contractors better ful�ll or exceed the expectations of their clients. It can also help them to proactively drive owner demand for healthier buildings.
The new study also reveals the bene�ts building owners believe they are getting from their investments in healthier buildings, including greater employee/tenant satisfaction and the ability to lease healthier buildings more quickly than traditional ones. In addition, the study provides insight into the best resources for improving the ability to deliver healthier buildings, from the most valuable potential partners in these efforts to the best sources of information on healthier building products and practices. It offers the essential insights needed by building industry professionals to join in the drive toward healthier buildings.
Notes About the DataThe data and analysis in this report are based on an online survey conducted with owners, architects, interior designers and contractors in the first quarter of 2016. 975 responses to the survey were received. The analysis in this report focuses primarily on the 671 responses received from the U.S. respondents, which include the following:
Throughout the analysis, comparisons are made with the findings from Canada, which include 185 total responses. Generally, total responses are compared, but comparisons are also made between U.S. and Canadian owners and architects because the number of Canadian owner (53) and architect (109) responses are sufficient to allow for statistically significant comparisons.
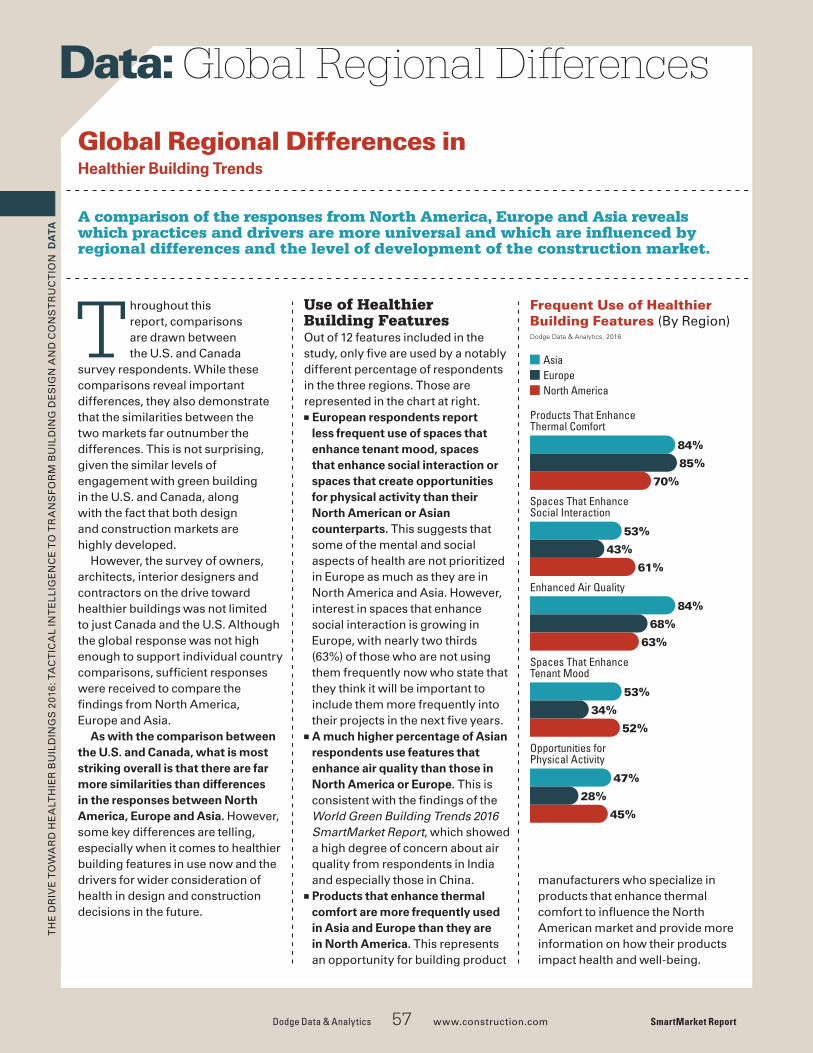
The remainder of the respondents came from 43 countries globally. A comparison of the responses from North America, Europe and Asia can be found on pages 57 and 58.
In order to explore the importance of the green building movement in driving attention to building impacts on health, the analysis also includes any notable differences between the U.S. respondents with a high level of involvement in green building (those with green projects accounting for more than 60% of their overall work by value) and those with a low level of green involvement (15% or fewer green projects). Those with a high level of green involvement account for 28% of the total U.S. respondents, and those with a low level of green involvement account for 30%.
More information on the survey responses can be found in the methodology on page 72.
SmartMarket Report Dodge Data & Analytics 8 www.construction.com
TH
E D
RIV
E T
OW
AR
D H
EA
LTH
IER
BU
ILD
ING
S 2
016:
TA
CT
ICA
L IN
TE
LLIG
EN
CE
TO
TR
AN
SF
OR
M B
UIL
DIN
G D
ES
IGN
AN
D C
ON
ST
RU
CT
ION
DA
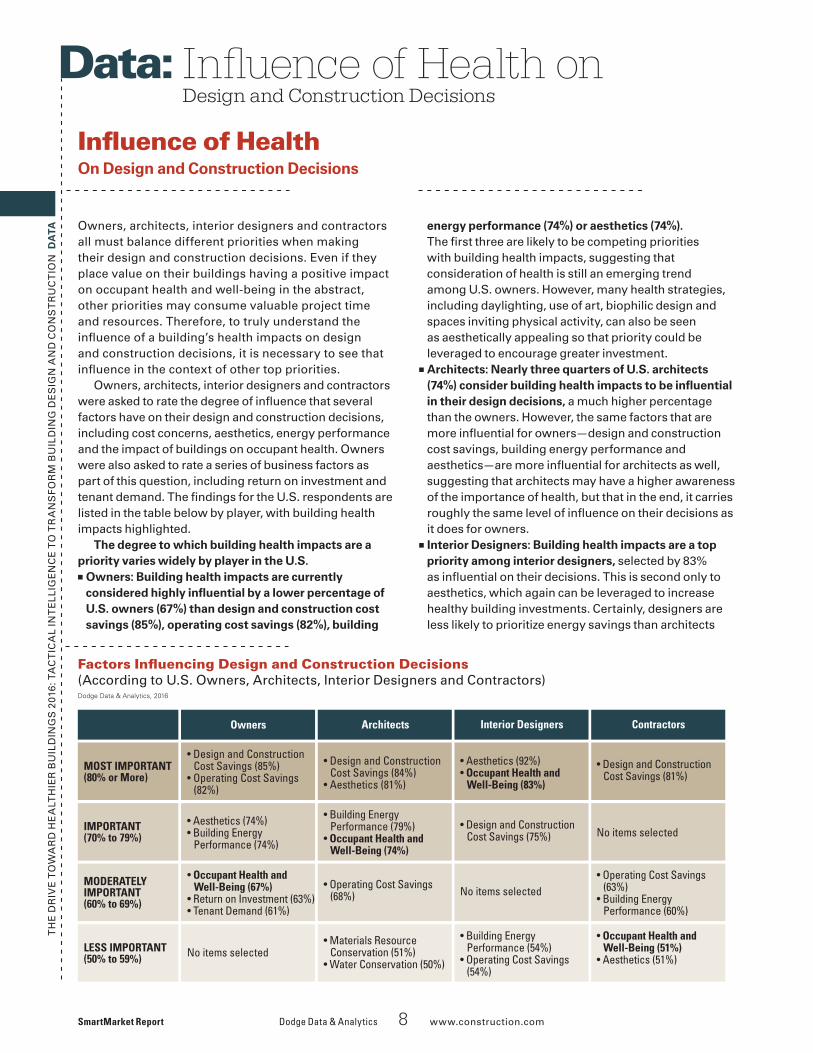
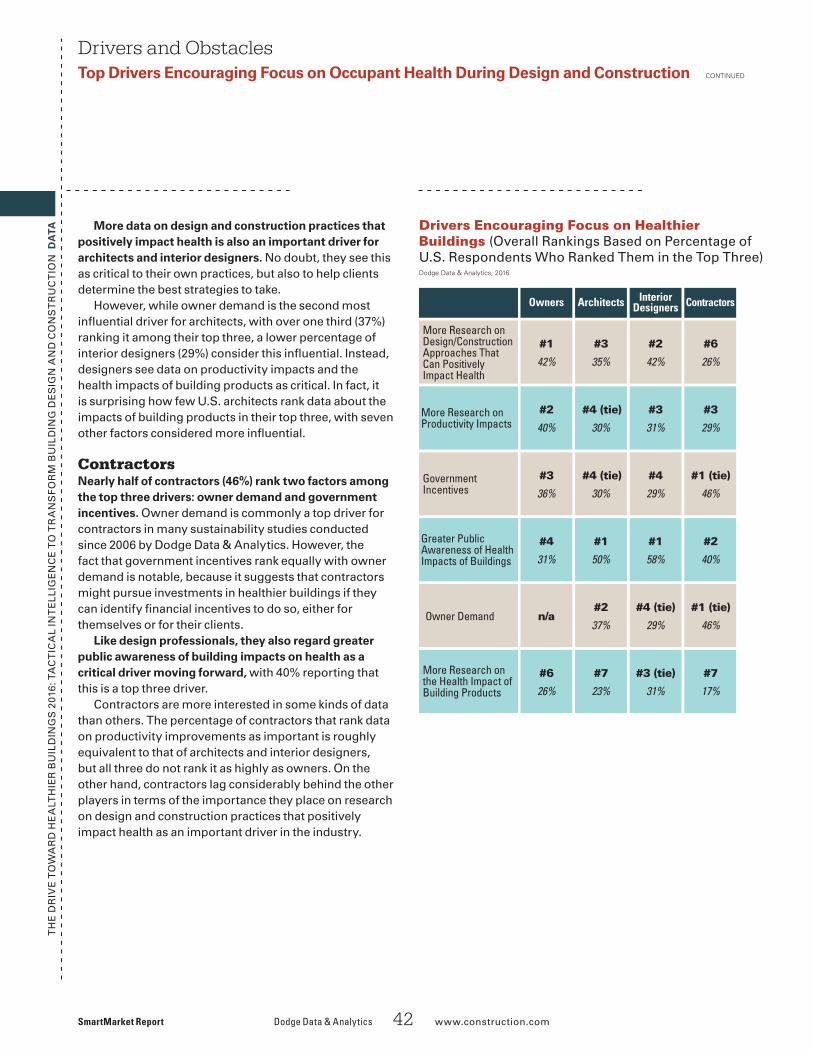
TA Owners, architects, interior designers and contractors all must balance different priorities when making their design and construction decisions. Even if they place value on their buildings having a positive impact on occupant health and well-being in the abstract, other priorities may consume valuable project time and resources. Therefore, to truly understand the in�uence of a building’s health impacts on design and construction decisions, it is necessary to see that in�uence in the context of other top priorities.
Owners, architects, interior designers and contractors were asked to rate the degree of in�uence that several factors have on their design and construction decisions, including cost concerns, aesthetics, energy performance and the impact of buildings on occupant health. Owners were also asked to rate a series of business factors as part of this question, including return on investment and tenant demand. The �ndings for the U.S. respondents are listed in the table below by player, with building health impacts highlighted.
The degree to which building health impacts are a priority varies widely by player in the U.S.■ Owners: Building health impacts are currently
considered highly in�uential by a lower percentage of U.S. owners (67%) than design and construction cost savings (85%), operating cost savings (82%), building
In�uence of Health On Design and Construction Decisions
energy performance (74%) or aesthetics (74%). The �rst three are likely to be competing priorities with building health impacts, suggesting that consideration of health is still an emerging trend among U.S. owners. However, many health strategies, including daylighting, use of art, biophilic design and spaces inviting physical activity, can also be seen as aesthetically appealing so that priority could be leveraged to encourage greater investment.
■ Architects: Nearly three quarters of U.S. architects (74%) consider building health impacts to be in�uential in their design decisions, a much higher percentage than the owners. However, the same factors that are more in�uential for owners—design and construction cost savings, building energy performance and aesthetics—are more in�uential for architects as well, suggesting that architects may have a higher awareness of the importance of health, but that in the end, it carries roughly the same level of in�uence on their decisions as it does for owners.
■ Interior Designers: Building health impacts are a top priority among interior designers, selected by 83% as in�uential on their decisions. This is second only to aesthetics, which again can be leveraged to increase healthy building investments. Certainly, designers are less likely to prioritize energy savings than architects
Influence of Health onDesign and Construction Decisions
Data:
Factors In�uencing Design and Construction Decisions(According to U.S. Owners, Architects, Interior Designers and Contractors)Dodge Data & Analytics, 2016
TA or owners would be, but it is notable that building health impacts are in�uential for a higher percentage of designers than design and construction cost savings.
■ Contractors: Only around half (51%) of contractors report being in�uenced by building health impacts as a priority, by far the lowest percentage of any player. Contractors may believe that the building design determines its health impacts, but in fact, contractors can in�uence those impacts through product selection and through the use of healthier building practices like checking air quality before delivering the project. The best way to encourage greater contractor involvement with improving building health impacts will come from owner expectations and pressure.
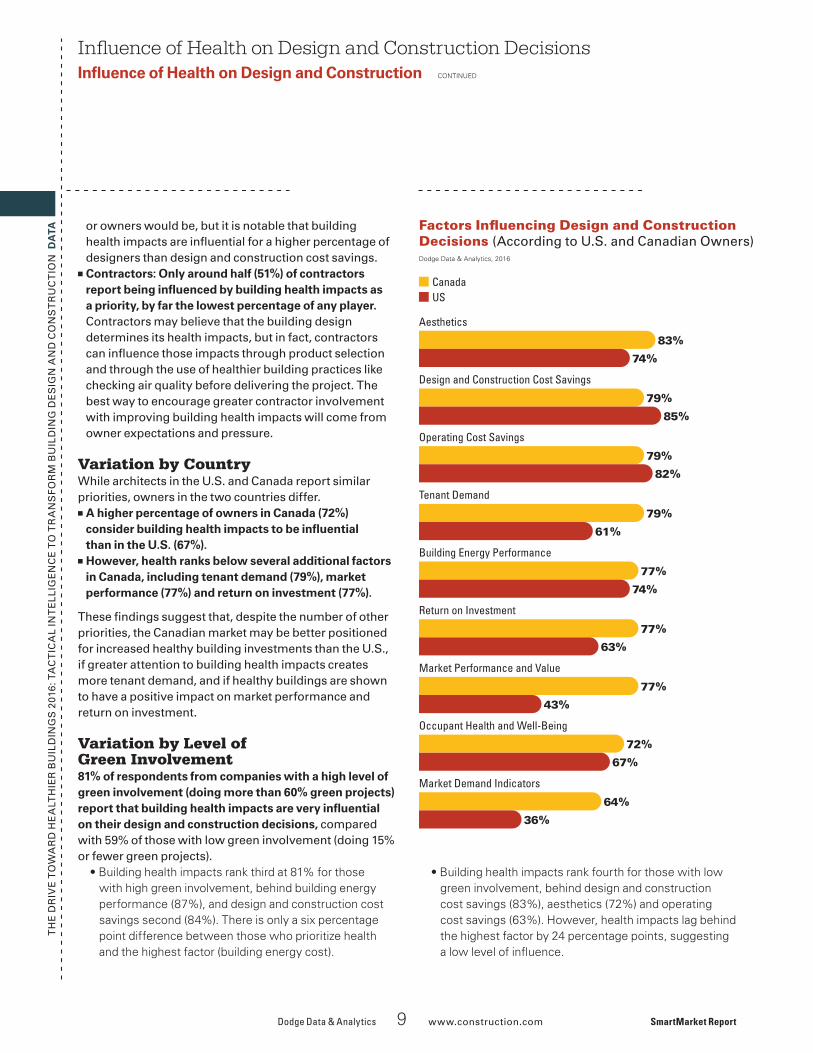
Variation by CountryWhile architects in the U.S. and Canada report similar priorities, owners in the two countries differ.
■ A higher percentage of owners in Canada (72%) consider building health impacts to be in�uential than in the U.S. (67%).
■ However, health ranks below several additional factors in Canada, including tenant demand (79%), market performance (77%) and return on investment (77%).
These �ndings suggest that, despite the number of other priorities, the Canadian market may be better positioned for increased healthy building investments than the U.S., if greater attention to building health impacts creates more tenant demand, and if healthy buildings are shown to have a positive impact on market performance and return on investment.
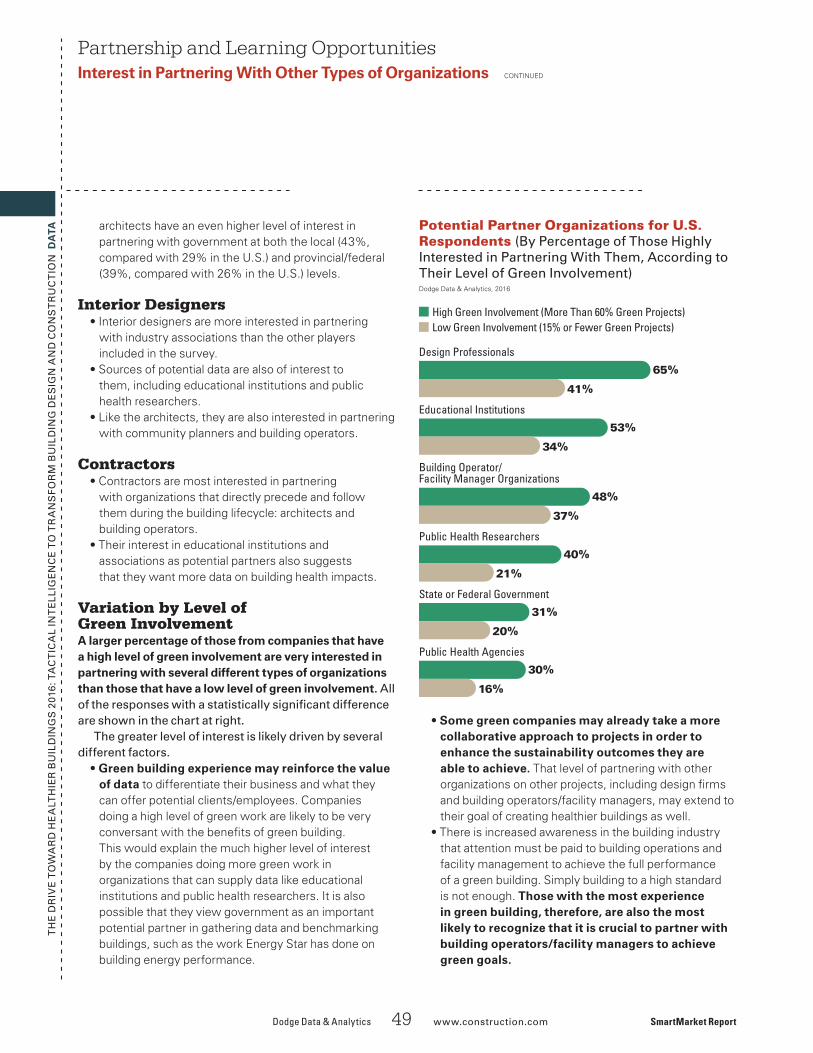
Variation by Level of Green Involvement81% of respondents from companies with a high level of green involvement (doing more than 60% green projects) report that building health impacts are very in�uential on their design and construction decisions, compared with 59% of those with low green involvement (doing 15% or fewer green projects).
• Building health impacts rank third at 81% for those with high green involvement, behind building energy performance (87%), and design and construction cost savings second (84%). There is only a six percentage point difference between those who prioritize health and the highest factor (building energy cost).
Influence of Health on Design and Construction DecisionsIn�uence of Health on Design and Construction CONTINUED
• Building health impacts rank fourth for those with low green involvement, behind design and construction cost savings (83%), aesthetics (72%) and operating cost savings (63%). However, health impacts lag behind the highest factor by 24 percentage points, suggesting a low level of influence.
Dodge Data & Analytics 9 www.construction.com SmartMarket Report
Factors In�uencing Design and Construction Decisions (According to U.S. and Canadian Owners)
SmartMarket Report Dodge Data & Analytics 10 www.construction.com
TH
E D
RIV
E T
OW
AR
D H
EA
LTH
IER
BU
ILD
ING
S 2
016:
TA
CT
ICA
L IN
TE
LLIG
EN
CE
TO
TR
AN
SF
OR
M B
UIL
DIN
G D
ES
IGN
AN
D C
ON
ST
RU
CT
ION
DA
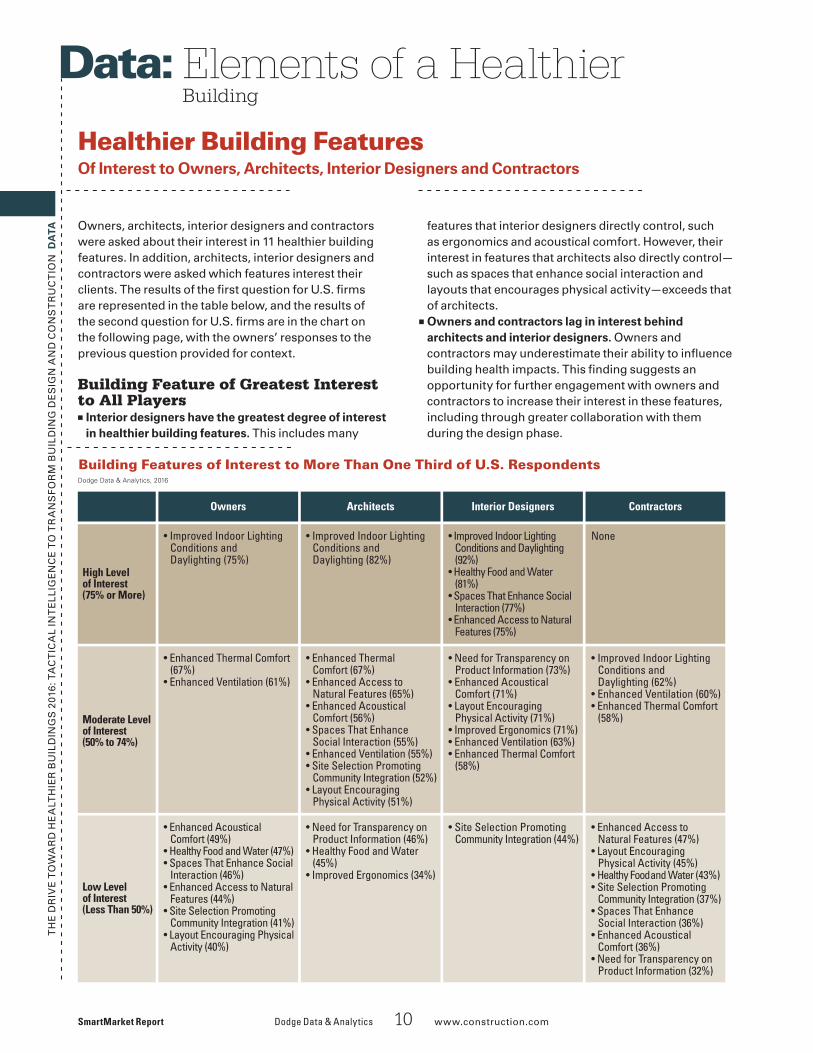
TA Owners, architects, interior designers and contractors were asked about their interest in 11 healthier building features. In addition, architects, interior designers and contractors were asked which features interest their clients. The results of the �rst question for U.S. �rms are represented in the table below, and the results of the second question for U.S. �rms are in the chart on the following page, with the owners’ responses to the previous question provided for context.
Building Feature of Greatest Interest to All Players
■ Interior designers have the greatest degree of interest in healthier building features. This includes many
Healthier Building Features Of Interest to Owners, Architects, Interior Designers and Contractors
features that interior designers directly control, such as ergonomics and acoustical comfort. However, their interest in features that architects also directly control—such as spaces that enhance social interaction and layouts that encourages physical activity—exceeds that of architects.
■ Owners and contractors lag in interest behind architects and interior designers. Owners and contractors may underestimate their ability to in�uence building health impacts. This �nding suggests an opportunity for further engagement with owners and contractors to increase their interest in these features, including through greater collaboration with them during the design phase.
Elements of a HealthierBuilding
Data:
Building Features of Interest to More Than One Third of U.S. RespondentsDodge Data & Analytics, 2016
• Healthy Food and Water (43%)• Site Selection Promoting
Community Integration (37%)• Spaces That Enhance
Social Interaction (36%)• Enhanced Acoustical
Comfort (36%)• Need for Transparency on
Product Information (32%)
TH
E D
RIV
E T
OW
AR
D H
EA
LTH
IER
BU
ILD
ING
S 2
016:
TA
CT
ICA
L IN
TE
LLIG
EN
CE
TO
TR
AN
SF
OR
M B
UIL
DIN
G D
ES
IGN
AN
D C
ON
ST
RU
CT
ION
DA
TA
■ Interior designers are the only players with a high level of interest in product transparency. Since architects and contractors specify and/or procure products, this is a notable gap. The challenge in understanding the relevance of product disclosures may contribute to the low performance among other players.
■ The top three features for all players are:• Improved Indoor Lighting Conditions and
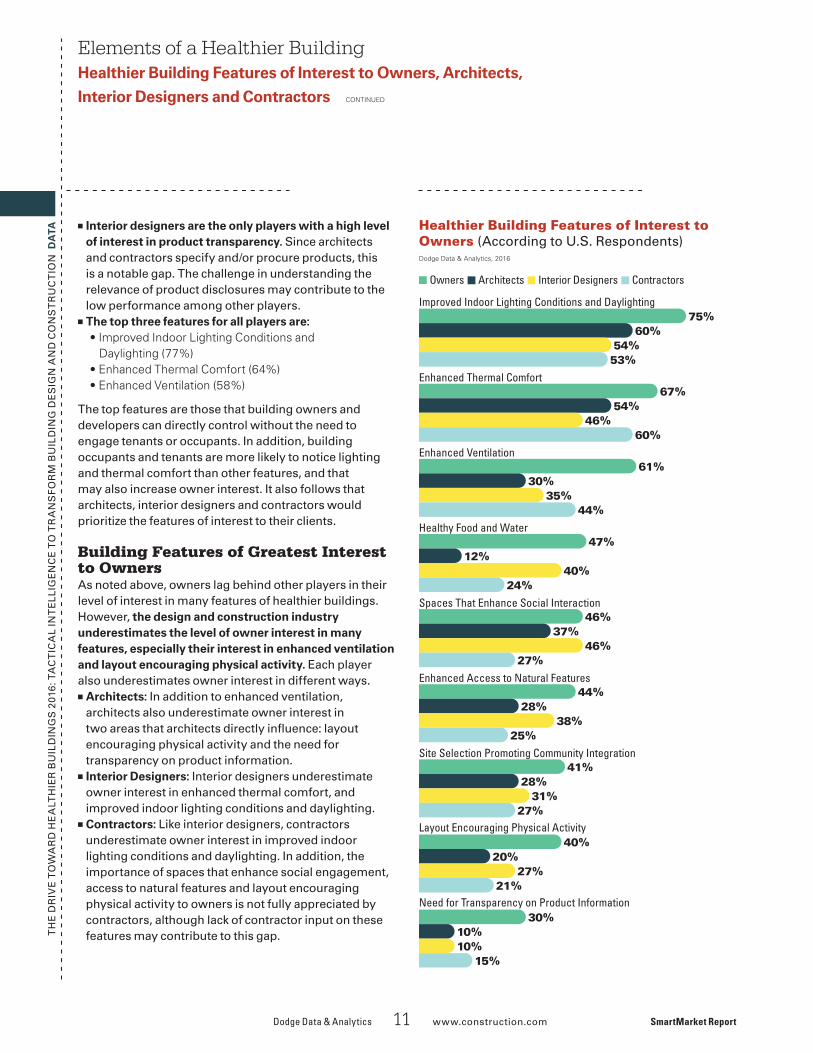
The top features are those that building owners and developers can directly control without the need to engage tenants or occupants. In addition, building occupants and tenants are more likely to notice lighting and thermal comfort than other features, and that may also increase owner interest. It also follows that architects, interior designers and contractors would prioritize the features of interest to their clients.
Building Features of Greatest Interest to OwnersAs noted above, owners lag behind other players in their level of interest in many features of healthier buildings. However, the design and construction industry underestimates the level of owner interest in many features, especially their interest in enhanced ventilation and layout encouraging physical activity. Each player also underestimates owner interest in different ways. ■ Architects: In addition to enhanced ventilation,
architects also underestimate owner interest in two areas that architects directly in�uence: layout encouraging physical activity and the need for transparency on product information.
■ Interior Designers: Interior designers underestimate owner interest in enhanced thermal comfort, and improved indoor lighting conditions and daylighting.
■ Contractors: Like interior designers, contractors underestimate owner interest in improved indoor lighting conditions and daylighting. In addition, the importance of spaces that enhance social engagement, access to natural features and layout encouraging physical activity to owners is not fully appreciated by contractors, although lack of contractor input on these features may contribute to this gap.
Elements of a Healthier BuildingHealthier Building Features of Interest to Owners, Architects,
Interior Designers and Contractors CONTINUED
Dodge Data & Analytics 11 www.construction.com SmartMarket Report
Healthier Building Features of Interest to Owners (According to U.S. Respondents)
Improved Indoor Lighting Conditions and Daylighting
Enhanced Thermal Comfort
Enhanced Ventilation
Healthy Food and Water
Spaces That Enhance Social Interaction
Enhanced Access to Natural Features
Site Selection Promoting Community Integration
Layout Encouraging Physical Activity
Need for Transparency on Product Information
60%54%53%
54%46%
60%
30%35%
44%
12%40%
24%
37%46%
27%
28%38%
25%
28%31%
27%
20%27%
21%
75%
67%
61%
47%
46%
44%
41%
40%
30%10%10%
15%
TH
E D
RIV
E T
OW
AR
D H
EA
LTH
IER
BU
ILD
ING
S 2
016:
TA
CT
ICA
L IN
TE
LLIG
EN
CE
TO
TR
AN
SF
OR
M B
UIL
DIN
G D
ES
IGN
AN
D C
ON
ST
RU
CT
ION
DA
TA Variation by Level of Green InvolvementA signi�cantly higher percentage of those doing more than 60% of their projects green are interested in some features than those doing 15% or fewer green projects:
• Enhanced Thermal Comfort: 74%, compared with 63%
Elements of a Healthier BuildingHealthier Building Features of Interest to Owners, Architects,
Interior Designers and Contractors CONTINUED
• Spaces That Enhance Social Interaction: 61%, compared with 49%
• Enhanced Design/Layout That Encourages Physical Activity: 57%, compared with 46%
• Need for Transparency on Product Information: 52%, compared with 38%
SmartMarket Report Dodge Data & Analytics 12 www.construction.com
Use of Healthier Building Features
Frequently Used Healthier Building Features (According to All U.S. Respondents) Dodge Data & Analytics, 2016
3_02_HealthSMR_Batch3_B2_FeaturesUsed_#01
Used Frequently/Always by 70% or More
Better Lighting/Daylighting Exposure 74%
Used Frequently/Always by 60% to 69%
Products That Enhance Thermal Comfort 69%
Spaces That Enhance Social Interaction 60%
Used Frequently/Always by 50% to 59%
Enhanced Air Quality 59%
Products That Enhance Acoustical Comfort 58%
Excluding Materials of Concern 55%
Occupant Controls 55%
Used Frequently/Always by Less Than 50%
Opportunities for Physical Activity 44%
Accessibility Features Above Code Requirements 41%
Ergonomic Furnishings 39%
Biophilic Design Principles 25%
Spaces That Enhance Tenant Mood 50%
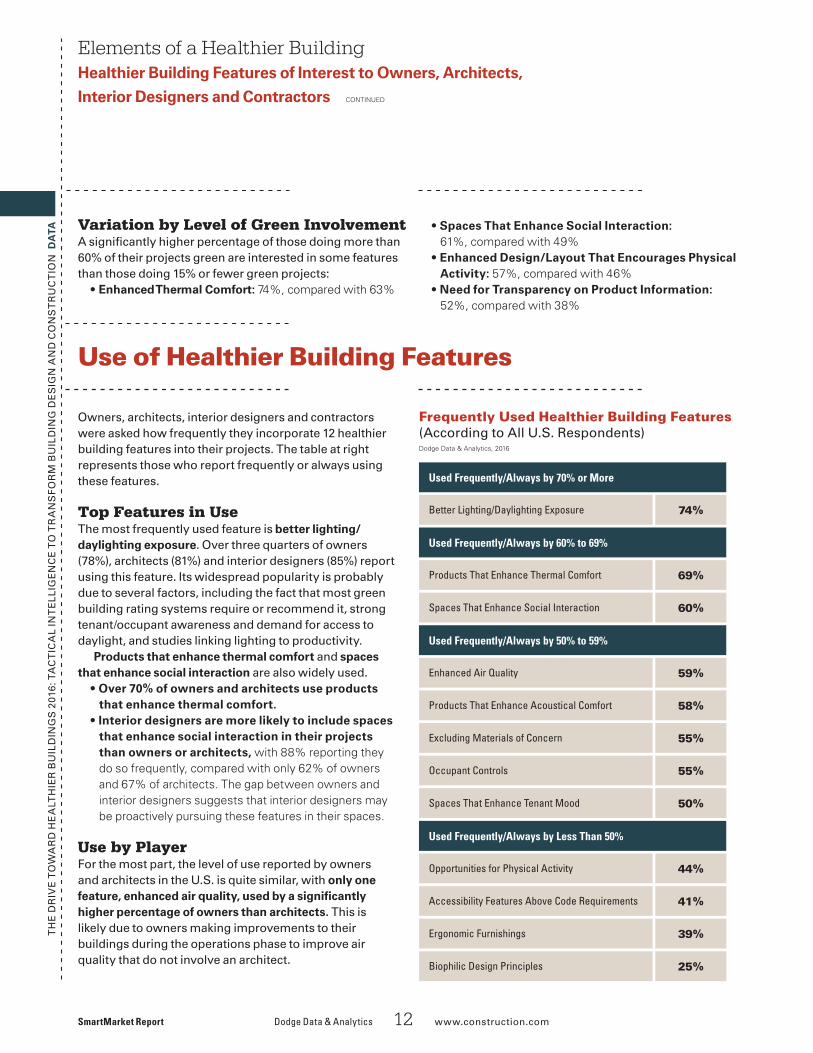
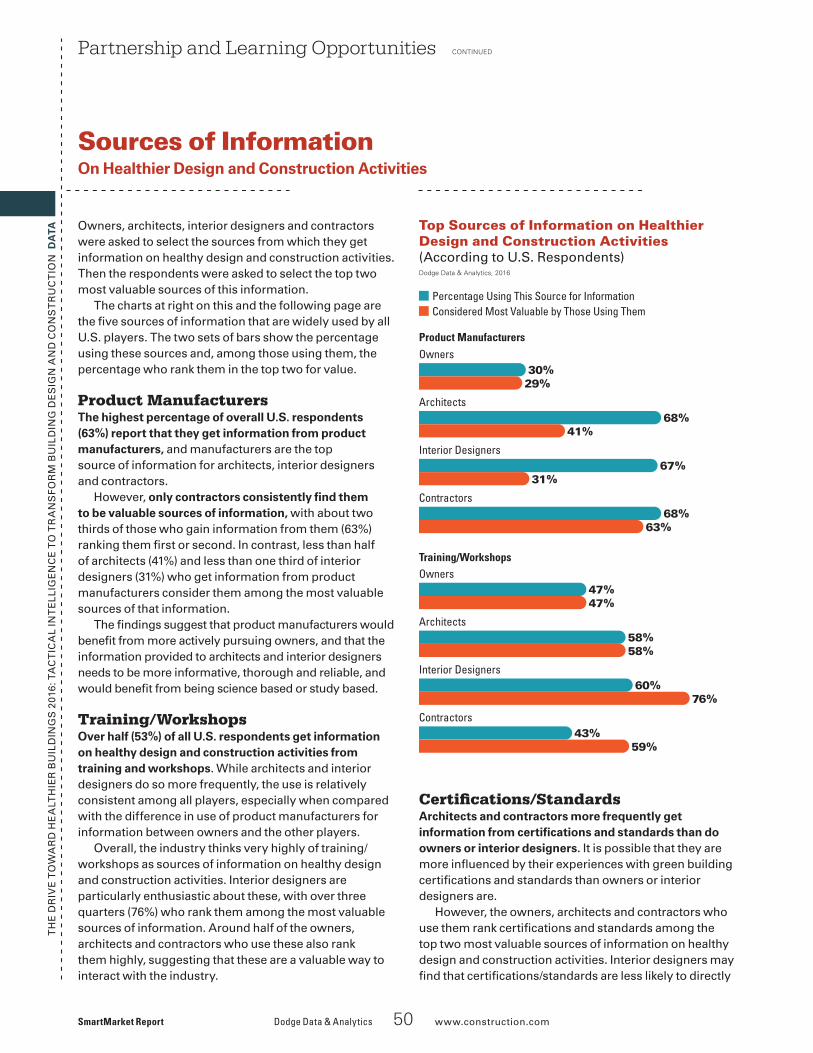
Owners, architects, interior designers and contractors were asked how frequently they incorporate 12 healthier building features into their projects. The table at right represents those who report frequently or always using these features.
Top Features in Use The most frequently used feature is better lighting/daylighting exposure. Over three quarters of owners (78%), architects (81%) and interior designers (85%) report using this feature. Its widespread popularity is probably due to several factors, including the fact that most green building rating systems require or recommend it, strong tenant/occupant awareness and demand for access to daylight, and studies linking lighting to productivity.
Products that enhance thermal comfort and spaces that enhance social interaction are also widely used.
• Over 70% of owners and architects use products that enhance thermal comfort.
• Interior designers are more likely to include spaces that enhance social interaction in their projects than owners or architects, with 88% reporting they do so frequently, compared with only 62% of owners and 67% of architects. The gap between owners and interior designers suggests that interior designers may be proactively pursuing these features in their spaces.
Use by PlayerFor the most part, the level of use reported by owners and architects in the U.S. is quite similar, with only one feature, enhanced air quality, used by a signi�cantly higher percentage of owners than architects. This is likely due to owners making improvements to their buildings during the operations phase to improve air quality that do not involve an architect.
TH
E D
RIV
E T
OW
AR
D H
EA
LTH
IER
BU
ILD
ING
S 2
016:
TA
CT
ICA
L IN
TE
LLIG
EN
CE
TO
TR
AN
SF
OR
M B
UIL
DIN
G D
ES
IGN
AN
D C
ON
ST
RU
CT
ION
DA
TA Signi�cantly more interior designers use three of the 12 features than the other players—spaces that enhance social interaction (88%), spaces that enhance tenant moods/attitudes (83%) and ergonomic furnishings (75%).
Contractors have signi�cantly lower levels of use of all 12 features than other players. The only features selected by more than half of contractors include products that enhance thermal comfort (59%), better lighting/daylighting exposure (55%) and accessibility features above code requirements (54%).
Features Likely to Increase in Use in the Next Five Years
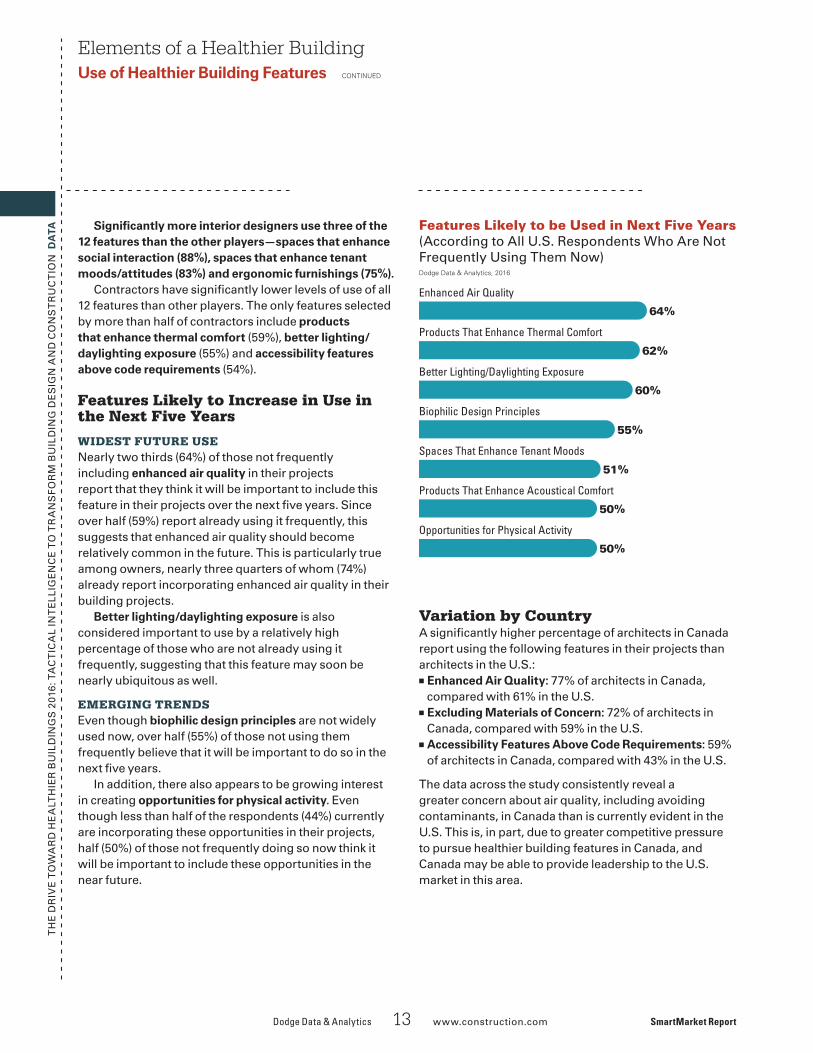
WIDEST FUTURE USENearly two thirds (64%) of those not frequently including enhanced air quality in their projects report that they think it will be important to include this feature in their projects over the next �ve years. Since over half (59%) report already using it frequently, this suggests that enhanced air quality should become relatively common in the future. This is particularly true among owners, nearly three quarters of whom (74%) already report incorporating enhanced air quality in their building projects.
Better lighting/daylighting exposure is also considered important to use by a relatively high percentage of those who are not already using it frequently, suggesting that this feature may soon be nearly ubiquitous as well.
EMERGING TRENDSEven though biophilic design principles are not widely used now, over half (55%) of those not using them frequently believe that it will be important to do so in the next �ve years.
In addition, there also appears to be growing interest in creating opportunities for physical activity. Even though less than half of the respondents (44%) currently are incorporating these opportunities in their projects, half (50%) of those not frequently doing so now think it will be important to include these opportunities in the near future.
Elements of a Healthier BuildingUse of Healthier Building Features CONTINUED
Dodge Data & Analytics 13 www.construction.com SmartMarket Report
Features Likely to be Used in Next Five Years(According to All U.S. Respondents Who Are Not Frequently Using Them Now)
1_04_HealthSMR_Batch1_B4_Future Features_#01
Dodge Data & Analytics, 2016
64%
Enhanced Air Quality
62%
Products That Enhance Thermal Comfort
60%
Better Lighting/Daylighting Exposure
55%
Biophilic Design Principles
51%
Spaces That Enhance Tenant Moods
50%
Products That Enhance Acoustical Comfort
50%
Opportunities for Physical Activity
Variation by CountryA signi�cantly higher percentage of architects in Canada report using the following features in their projects than architects in the U.S.:■ Enhanced Air Quality: 77% of architects in Canada,
compared with 61% in the U.S. ■ Excluding Materials of Concern: 72% of architects in
Canada, compared with 59% in the U.S.■ Accessibility Features Above Code Requirements: 59%
of architects in Canada, compared with 43% in the U.S.
The data across the study consistently reveal a greater concern about air quality, including avoiding contaminants, in Canada than is currently evident in the U.S. This is, in part, due to greater competitive pressure to pursue healthier building features in Canada, and Canada may be able to provide leadership to the U.S. market in this area.
TH
E D
RIV
E T
OW
AR
D H
EA
LTH
IER
BU
ILD
ING
S 2
016:
TA
CT
ICA
L IN
TE
LLIG
EN
CE
TO
TR
AN
SF
OR
M B
UIL
DIN
G D
ES
IGN
AN
D C
ON
ST
RU
CT
ION
DA
TAElements of a Healthier BuildingUse of Healthier Building Features CONTINUED
SmartMarket Report Dodge Data & Analytics 14 www.construction.com
1_03_HealthSMR_Batch1_B3_FeaturesUsed_Green_#01
Dodge Data & Analytics, 2016
Better Lighting/Daylighting Exposure
Products That Enhance Thermal Comfort
Enhanced Air Quality
Spaces That Enhance Social Interaction
Occupant Controls
Products That Enhance Acoustical Comfort
Excluding Materials of Concern
Spaces That Enhance Tenant Mood
Opportunities for Physical Activity
Accessibility Features Above Code Requirements
Ergonomic Furnishings
Biophilic Design Principles
More Than 60% Green Projects 15% or Fewer Green Projects
86%
66%
82%
64%
77%
47%
73%
52%
71%
46%
70%
51%
67%
48%
62%
42%
62%
34%
50%
34%
48%
30%
32%
15%
Frequently Used Healthier Building Features(According to U.S. Respondents, by Level of Green Involvement)
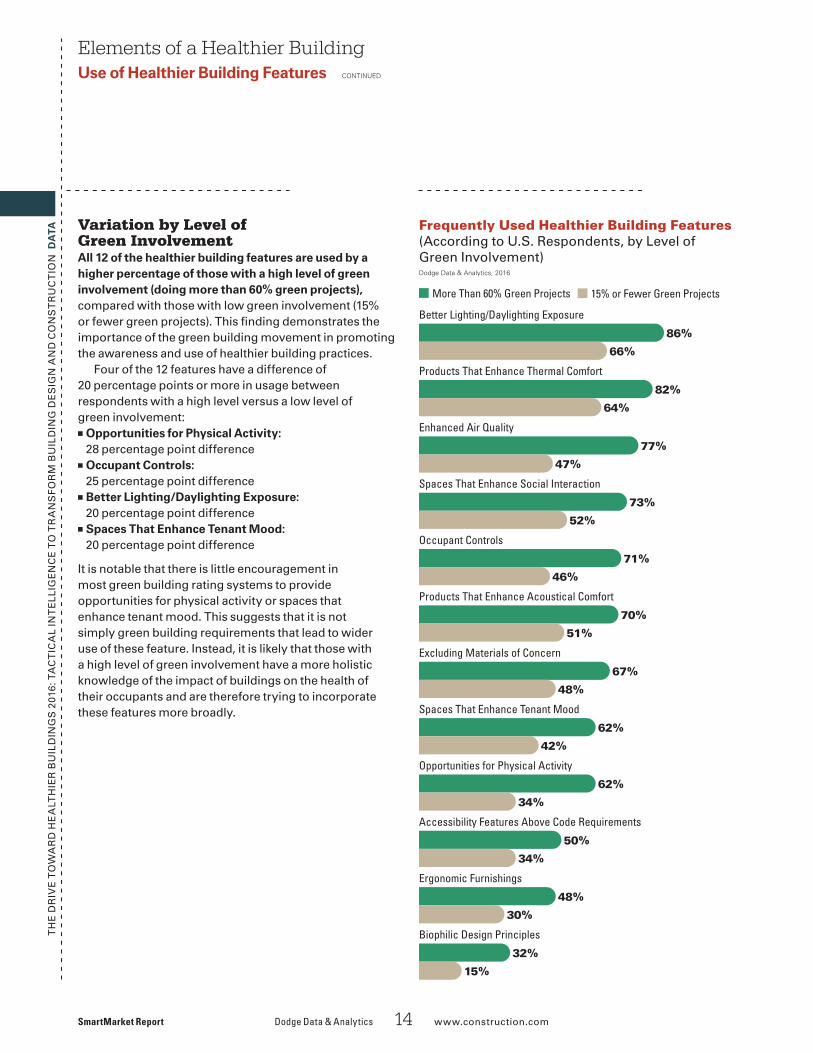
Variation by Level of Green InvolvementAll 12 of the healthier building features are used by a higher percentage of those with a high level of green involvement (doing more than 60% green projects),compared with those with low green involvement (15% or fewer green projects). This �nding demonstrates the importance of the green building movement in promoting the awareness and use of healthier building practices.
Four of the 12 features have a difference of 20 percentage points or more in usage between respondents with a high level versus a low level of green involvement:■ Opportunities for Physical Activity:
28 percentage point difference■ Occupant Controls:
25 percentage point difference■ Better Lighting/Daylighting Exposure:
20 percentage point difference■ Spaces That Enhance Tenant Mood:
20 percentage point difference
It is notable that there is little encouragement in most green building rating systems to provide opportunities for physical activity or spaces that enhance tenant mood. This suggests that it is not simply green building requirements that lead to wider use of these feature. Instead, it is likely that those with a high level of green involvement have a more holistic knowledge of the impact of buildings on the health of their occupants and are therefore trying to incorporate these features more broadly.
TH
E D
RIV
E T
OW
AR
D H
EA
LTH
IER
BU
ILD
ING
S 2
016:
TA
CT
ICA
L IN
TE
LLIG
EN
CE
TO
TR
AN
SF
OR
M B
UIL
DIN
G D
ES
IGN
AN
D C
ON
ST
RU
CT
ION
DA
TA Owners, architects, interior designers and contractors were asked how frequently in the last three years they used 14 design and construction strategies on their projects in order to have a positive impact on the health of building occupants.
For analysis, the products and practices have been divided into four categories—air quality strategies, strategies that impact mental and emotional health, strategies that encourage physical activity or access to the outdoors, and controls. Of course, there is a great deal of overlap in these categories: for example, access to the outdoors may have a positive impact on mental and emotional health. Therefore, the categories are intended only to aid analysis of the data, and should not be considered mutually exclusive.
Before examining the four categories, there are some general trends about the overall use of these products and practices worth noting.
General Trends
BY PLAYERThe level of use reported by contractors for these products and practices is consistently lower than that reported by at least one other player, and frequently multiple players, for every product and practice included in the study.
A key factor may be the phrasing of the question. Respondents were asked to consider what they used in order to have a positive impact. The lagging responses of contractors suggests that they are not considering these features speci�cally in terms of their health impacts. This suggests that there is an opportunity for contractors, particularly those with green building experience, to differentiate themselves from their competition by actively engaging in the selection of practices and products that enhance occupant health.
Another trend supports this conclusion. Contractors are also far more likely than other players to use speci�c products and practices due to client request. In fact, they report this at a signi�cantly higher level than architects for all 14 products and practices, and at a higher level than interior designers for �ve products/practices.
BY LEVEL OF GREEN INVOLVEMENT All of the 14 building products and practices included in the study are also used by a signi�cantly higher percentage of respondents whose �rms do more than 60% green projects, compared with those doing 16%
Elements of a Healthier Building CONTINUED
Dodge Data & Analytics 15 www.construction.com SmartMarket Report
Use of Products and Practices To Have a Positive Impact on Occupant Health
1_05_HealthSMR_Batch1_C7_AirQuality_Players_#01
Dodge Data & Analytics, 2016
OwnersArchitects
Interior DesignersContractors
73%
76%
21%
65%
Mechanical Ventilation Strategies to Improve Air Quality
69%
85%
83%
73%
Low VOC Products
51%
63%
29%
56%
CO2 Sensors
40%
52%
17%
46%
MERV 8+ Filters or Higher
28%
62%
29%
NA
Natural Ventilation
Frequently Used Air Quality Strategies (According to U.S. Respondents)
or fewer green projects. Again, this demonstrates how green building has promoted greater awareness of and use of healthier building practices.
BY PROJECT SECTORWhile there are exceptions, education is generally the sector in the U.S. with the highest level of use of the 14 products and practices reported in the survey. Use is also strong in the healthcare and of�ce sectors. In contrast, hotel and retail, with their more transient occupants, experience much lower use of most of the products and practices that impact health.
TH
E D
RIV
E T
OW
AR
D H
EA
LTH
IER
BU
ILD
ING
S 2
016:
TA
CT
ICA
L IN
TE
LLIG
EN
CE
TO
TR
AN
SF
OR
M B
UIL
DIN
G D
ES
IGN
AN
D C
ON
ST
RU
CT
ION
DA
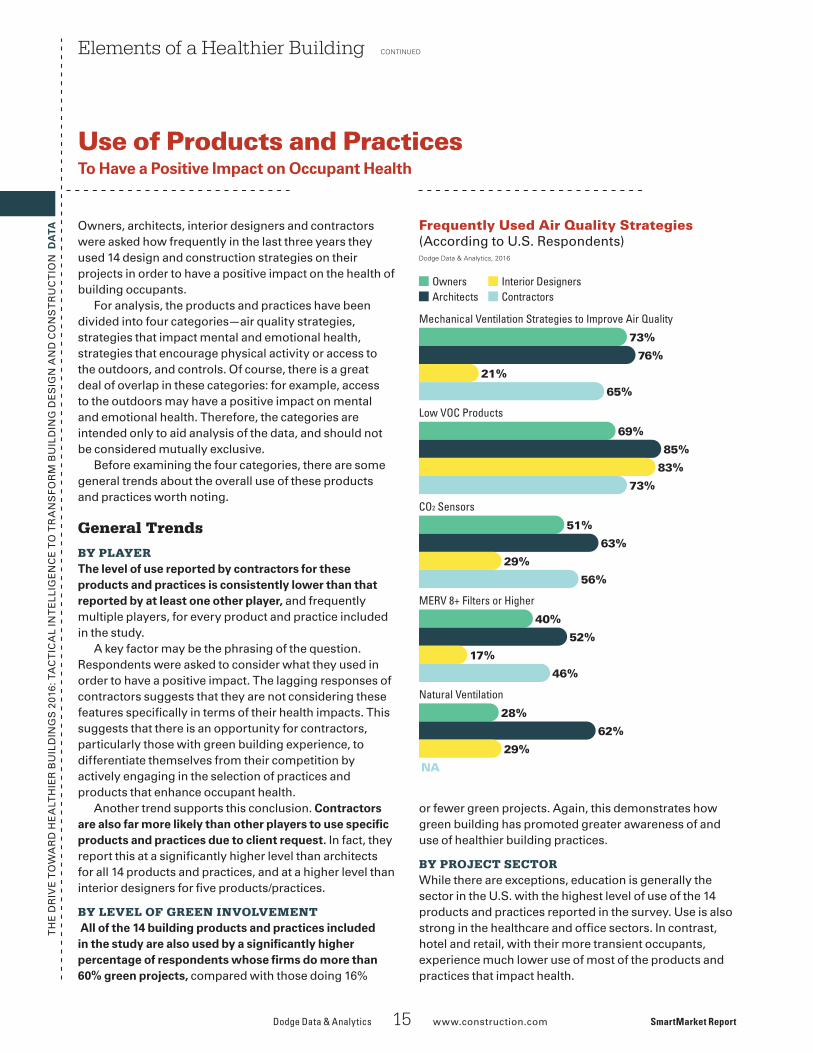
TA Air Quality Strategies
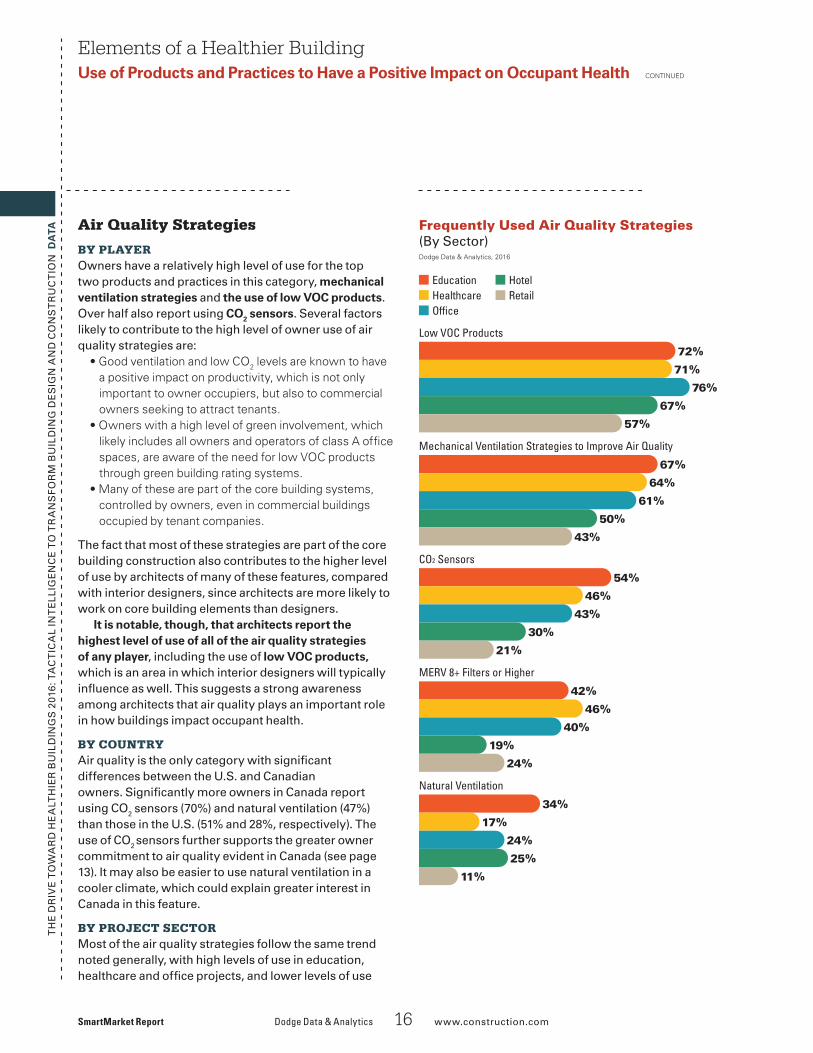
BY PLAYEROwners have a relatively high level of use for the top two products and practices in this category, mechanical ventilation strategies and the use of low VOC products. Over half also report using CO2 sensors. Several factors likely to contribute to the high level of owner use of air quality strategies are:
• Good ventilation and low CO2 levels are known to have a positive impact on productivity, which is not only important to owner occupiers, but also to commercial owners seeking to attract tenants.
• Owners with a high level of green involvement, which likely includes all owners and operators of class A office spaces, are aware of the need for low VOC products through green building rating systems.
• Many of these are part of the core building systems, controlled by owners, even in commercial buildings occupied by tenant companies.
The fact that most of these strategies are part of the core building construction also contributes to the higher level of use by architects of many of these features, compared with interior designers, since architects are more likely to work on core building elements than designers.
It is notable, though, that architects report the highest level of use of all of the air quality strategies of any player, including the use of low VOC products,which is an area in which interior designers will typically in�uence as well. This suggests a strong awareness among architects that air quality plays an important role in how buildings impact occupant health.
BY COUNTRYAir quality is the only category with signi�cant differences between the U.S. and Canadian owners. Signi�cantly more owners in Canada report using CO2 sensors (70%) and natural ventilation (47%) than those in the U.S. (51% and 28%, respectively). The use of CO2 sensors further supports the greater owner commitment to air quality evident in Canada (see page 13). It may also be easier to use natural ventilation in a cooler climate, which could explain greater interest in Canada in this feature.
BY PROJECT SECTORMost of the air quality strategies follow the same trend noted generally, with high levels of use in education, healthcare and of�ce projects, and lower levels of use
Elements of a Healthier BuildingUse of Products and Practices to Have a Positive Impact on Occupant Health CONTINUED
SmartMarket Report Dodge Data & Analytics 16 www.construction.com
Frequently Used Air Quality Strategies (By Sector)
1_09_HealthSMR_Batch1_C9_Air Quality_ProjType_#01
Dodge Data & Analytics, 2016
EducationHealthcareOf�ce
HotelRetail
72%
71%
76%
67%
57%
Low VOC Products
67%
64%
61%
50%
43%
Mechanical Ventilation Strategies to Improve Air Quality
54%
46%
43%
30%
21%
CO2 Sensors
42%
46%
40%
19%
24%
MERV 8+ Filters or Higher
34%
17%
24%
25%
11%
Natural Ventilation
TH
E D
RIV
E T
OW
AR
D H
EA
LTH
IER
BU
ILD
ING
S 2
016:
TA
CT
ICA
L IN
TE
LLIG
EN
CE
TO
TR
AN
SF
OR
M B
UIL
DIN
G D
ES
IGN
AN
D C
ON
ST
RU
CT
ION
DA
TA in hotel and retail projects. In fact, the percentages of frequent use of air quality strategies in the education and of�ces sectors are roughly equivalent to those in the healthcare sector. Given the need for high standards of air quality in hospitals and other medical facilities, results that are approximately in line with those in education and of�ce suggest the high level of attention that is paid to air quality in these other two sectors.
The only product or practice that deviates from the general pattern among the air quality strategies is the use of natural ventilation, which is much higher in education than in other sectors. This may be in�uenced by the seasonal use of many educational buildings.
USE REQUESTED BY CLIENTSLess than half of architects and interior designers report that they are using any of the air quality strategies due to client request. This demonstrates that there is wide recognition among design �rms of the importance of air quality in promoting health.
A relatively high percentage of contractors, in contrast, report using the air quality strategies due to client request, including 70% for use of low VOC products and 65% for mechanical ventilation strategies. However, fewer contractors rely on client request for using air quality strategies than for other healthier products and practices, all of which are reported by more than 70%.
PERCEIVED VALUE OF SPECIFIC PRODUCTS OR PRACTICESRespondents using �ve of the 14 products and practices were asked to rate their impact on building occupant health. Three out of the �ve were air quality strategies: ■ Mechanical Ventilation Strategies That Improve Air
Quality: Over three quarters (77%) of respondents using these strategies consider them to have a high impact on occupant health, and all but 1% of the rest believe they have a medium impact. In fact, more owners (73%) consider mechanical ventilation strategies to have a high impact than any of the other four products or practices. This suggests that the respondents willing to invest in these relatively costly strategies do so because they �nd them important.
■ Low VOC Products: Two thirds (66%) of all respondents consider this to have a high impact. Interior designers are particularly enthusiastic, with 80% reporting a high impact. It also is widely recognized by owners, with 63% reporting a high impact, second only to mechanical ventilation strategies.
Elements of a Healthier BuildingUse of Products and Practices to Have a Positive Impact on Occupant Health CONTINUED
Dodge Data & Analytics 17 www.construction.com SmartMarket Report
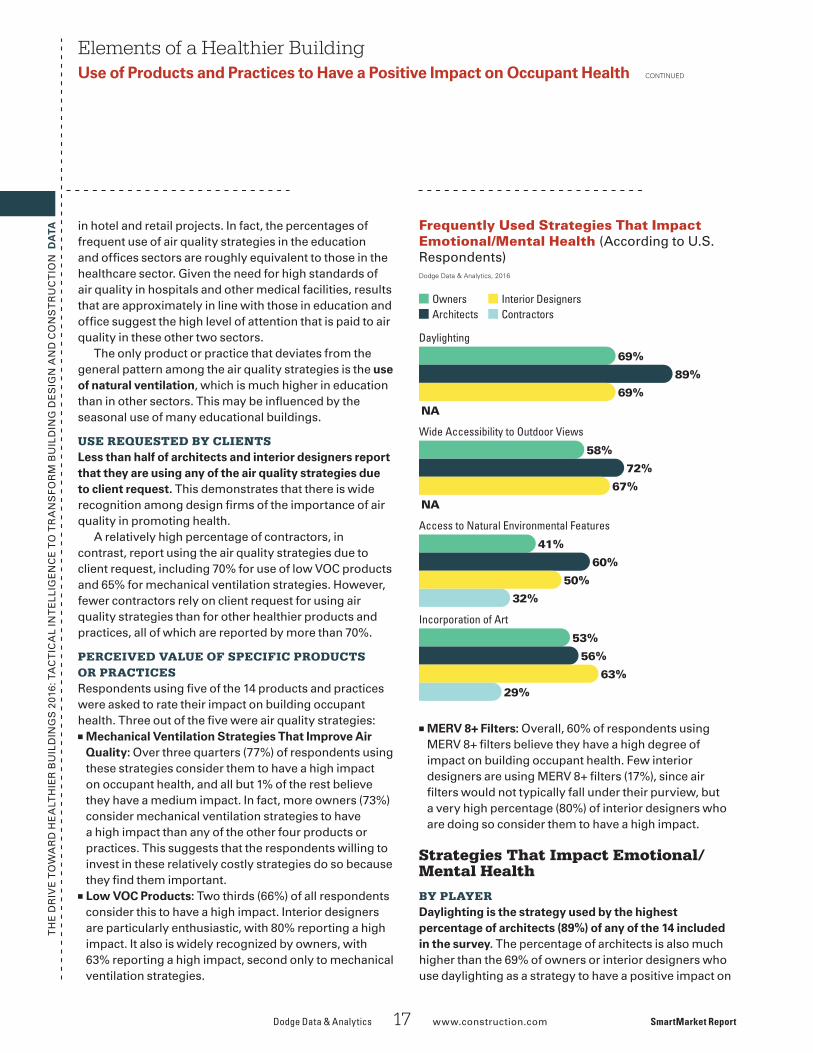
Frequently Used Strategies That Impact Emotional/Mental Health (According to U.S. Respondents)
■ MERV 8+ Filters: Overall, 60% of respondents using MERV 8+ �lters believe they have a high degree of impact on building occupant health. Few interior designers are using MERV 8+ �lters (17%), since air �lters would not typically fall under their purview, but a very high percentage (80%) of interior designers who are doing so consider them to have a high impact.
Strategies That Impact Emotional/Mental Health
BY PLAYERDaylighting is the strategy used by the highest percentage of architects (89%) of any of the 14 included in the survey. The percentage of architects is also much higher than the 69% of owners or interior designers who use daylighting as a strategy to have a positive impact on
TH
E D
RIV
E T
OW
AR
D H
EA
LTH
IER
BU
ILD
ING
S 2
016:
TA
CT
ICA
L IN
TE
LLIG
EN
CE
TO
TR
AN
SF
OR
M B
UIL
DIN
G D
ES
IGN
AN
D C
ON
ST
RU
CT
ION
DA
TA health. (Contractors were not asked about daylighting.) In contrast, there is no statistically signi�cant
difference between the percentage of architects (72%) and interior designers (67%) who provide wide accessibility to outdoor views in order to positively impact occupant health. However, a lower percentage of owners are actively pursuing this practice (58%), which suggests that architects and designers are pursuing this approach without direct requests from owners.
Incorporating art is the least widely used of the strategies that impact emotional/mental health, with only a little over half of the architects (56%) and owners (53%) using art for a positive impact, and very few contractors (29%) doing so.
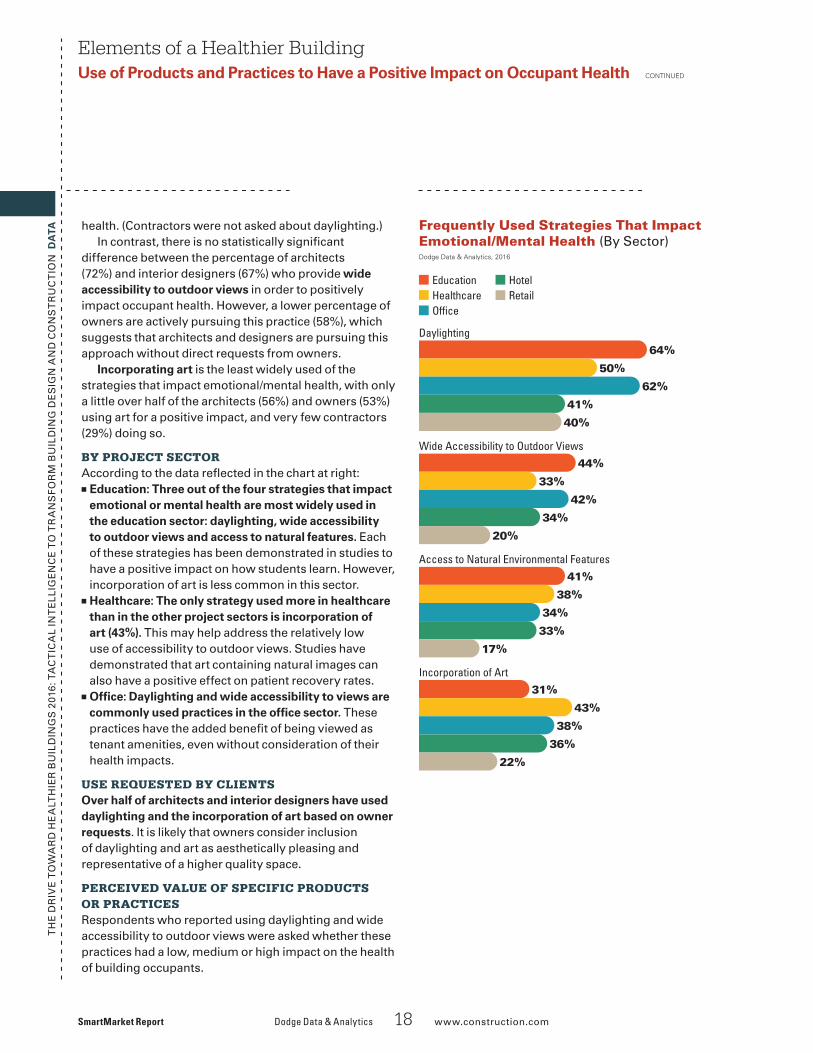
BY PROJECT SECTORAccording to the data re�ected in the chart at right:■ Education: Three out of the four strategies that impact
emotional or mental health are most widely used in the education sector: daylighting, wide accessibility to outdoor views and access to natural features. Each of these strategies has been demonstrated in studies to have a positive impact on how students learn. However, incorporation of art is less common in this sector.
■ Healthcare: The only strategy used more in healthcare than in the other project sectors is incorporation of art (43%). This may help address the relatively low use of accessibility to outdoor views. Studies have demonstrated that art containing natural images can also have a positive effect on patient recovery rates.
■ Of�ce: Daylighting and wide accessibility to views are commonly used practices in the of�ce sector. These practices have the added bene�t of being viewed as tenant amenities, even without consideration of their health impacts.
USE REQUESTED BY CLIENTSOver half of architects and interior designers have used daylighting and the incorporation of art based on owner requests. It is likely that owners consider inclusion of daylighting and art as aesthetically pleasing and representative of a higher quality space.
PERCEIVED VALUE OF SPECIFIC PRODUCTS OR PRACTICESRespondents who reported using daylighting and wide accessibility to outdoor views were asked whether these practices had a low, medium or high impact on the health of building occupants.
Elements of a Healthier BuildingUse of Products and Practices to Have a Positive Impact on Occupant Health CONTINUED
SmartMarket Report Dodge Data & Analytics 18 www.construction.com
Building Strategies ThatEncourage Physical Activity
35%
25%
30%
14%
13%
26%
25%
26%
23%
10%
Accessible Green Roofs or Gardens
EducationHealthcareOf�ce
HotelRetail
■ Daylighting: 81% of architects and 97% of interior designers believe daylighting has a high impact on health. Owners are more skeptical, with only 54% reporting a high impact. However, nearly all of the remaining owners (43%) report a medium impact, suggesting that owners do broadly understand the health value of daylighting.
■ Wide Accessibility to Outdoor Views: Most interior designers (94%) believe that this practice has a high impact, but architects and owners are more measured in their response. Owners, in particular, are nearly evenly divided between a high impact (49%) and a medium impact (40%), and a relatively large 11% see a low impact, suggesting the need for more education on the value of outdoor views.
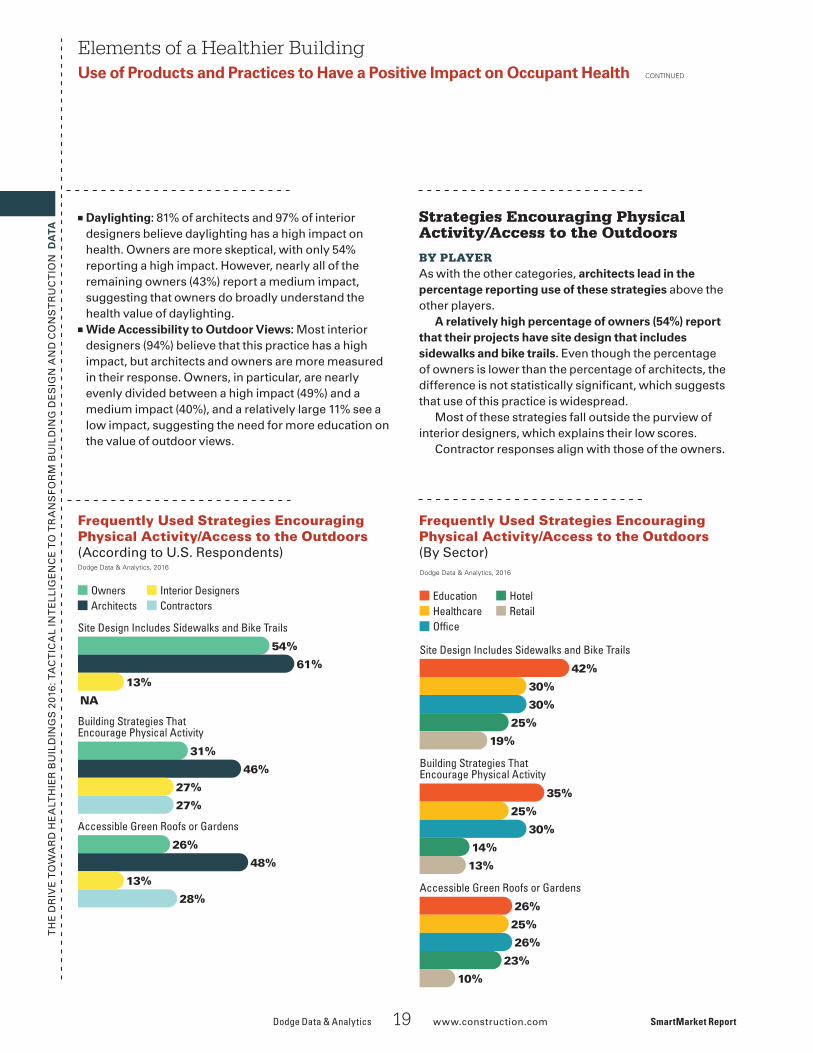
Strategies Encouraging Physical Activity/Access to the Outdoors
BY PLAYERAs with the other categories, architects lead in the percentage reporting use of these strategies above the other players.
A relatively high percentage of owners (54%) report that their projects have site design that includes sidewalks and bike trails. Even though the percentage of owners is lower than the percentage of architects, the difference is not statistically signi�cant, which suggests that use of this practice is widespread.
Most of these strategies fall outside the purview of interior designers, which explains their low scores.
Contractor responses align with those of the owners.
TH
E D
RIV
E T
OW
AR
D H
EA
LTH
IER
BU
ILD
ING
S 2
016:
TA
CT
ICA
L IN
TE
LLIG
EN
CE
TO
TR
AN
SF
OR
M B
UIL
DIN
G D
ES
IGN
AN
D C
ON
ST
RU
CT
ION
DA
TA BY PROJECT SECTORLess than half of respondents use these practices on the �ve project sectors included in the study—education, healthcare, of�ce, hotel and retail. Clearly, physical activity is not a driving concern for any of these sectors.
The widest use of strategies encouraging physical activity and access to the outdoors occurs in the education sector. It is notable, though, that accessible roofs and gardens is one of the few practices as widely adopted in the hotel sector as in the of�ce, healthcare and education sectors.
USE REQUESTED BY CLIENTSAt least half of architects (58%), interior designers (50%) and contractors (75%) using accessible green roofs or gardens due so at client request. This �nding is logical since these spaces are quite expensive and would need direct client support for inclusion.
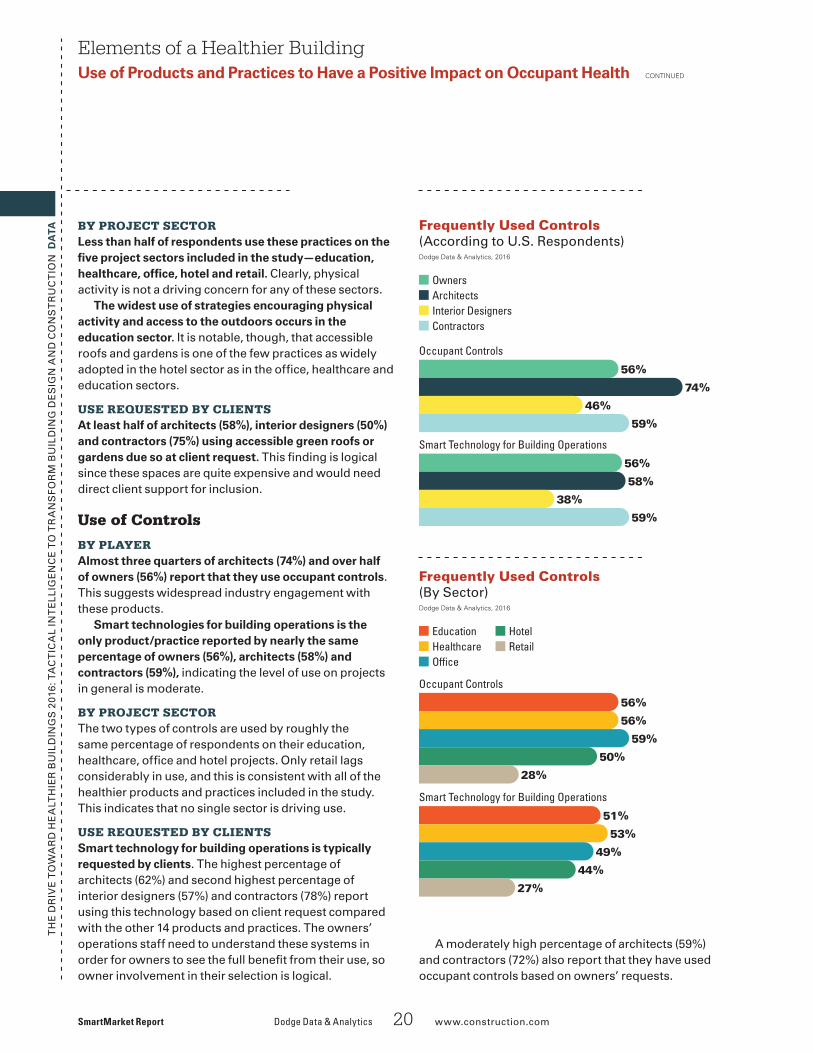
Use of Controls
BY PLAYERAlmost three quarters of architects (74%) and over half of owners (56%) report that they use occupant controls. This suggests widespread industry engagement with these products.
Smart technologies for building operations is the only product/practice reported by nearly the same percentage of owners (56%), architects (58%) and contractors (59%), indicating the level of use on projects in general is moderate.
BY PROJECT SECTORThe two types of controls are used by roughly the same percentage of respondents on their education, healthcare, of�ce and hotel projects. Only retail lags considerably in use, and this is consistent with all of the healthier products and practices included in the study. This indicates that no single sector is driving use.
USE REQUESTED BY CLIENTSSmart technology for building operations is typically requested by clients. The highest percentage of architects (62%) and second highest percentage of interior designers (57%) and contractors (78%) report using this technology based on client request compared with the other 14 products and practices. The owners’ operations staff need to understand these systems in order for owners to see the full bene�t from their use, so owner involvement in their selection is logical.
Elements of a Healthier BuildingUse of Products and Practices to Have a Positive Impact on Occupant Health CONTINUED
SmartMarket Report Dodge Data & Analytics 20 www.construction.com
Frequently Used Controls(According to U.S. Respondents)
Frequently Used Controls (By Sector)
A moderately high percentage of architects (59%) and contractors (72%) also report that they have used occupant controls based on owners’ requests.
1_08_HealthSMR_Batch1_C7_Controls_Players_#02
Dodge Data & Analytics, 2016
OwnersArchitectsInterior DesignersContractors
56%
74%
46%
59%
Occupant Controls
56%
58%
38%
59%
Smart Technology for Building Operations
TH
E D
RIV
E T
OW
AR
D H
EA
LTH
IER
BU
ILD
ING
S 2
016:
TA
CT
ICA
L IN
TE
LLIG
EN
CE
TO
TR
AN
SF
OR
M B
UIL
DIN
G D
ES
IGN
AN
D C
ON
ST
RU
CT
ION
DA
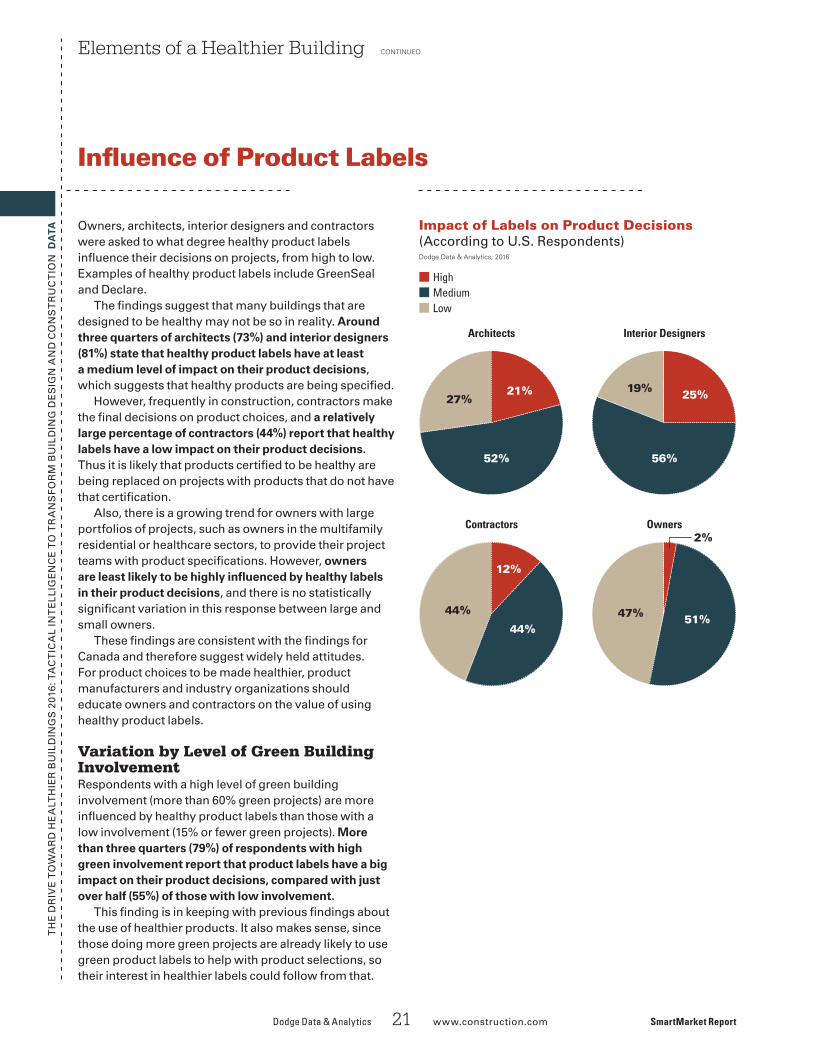
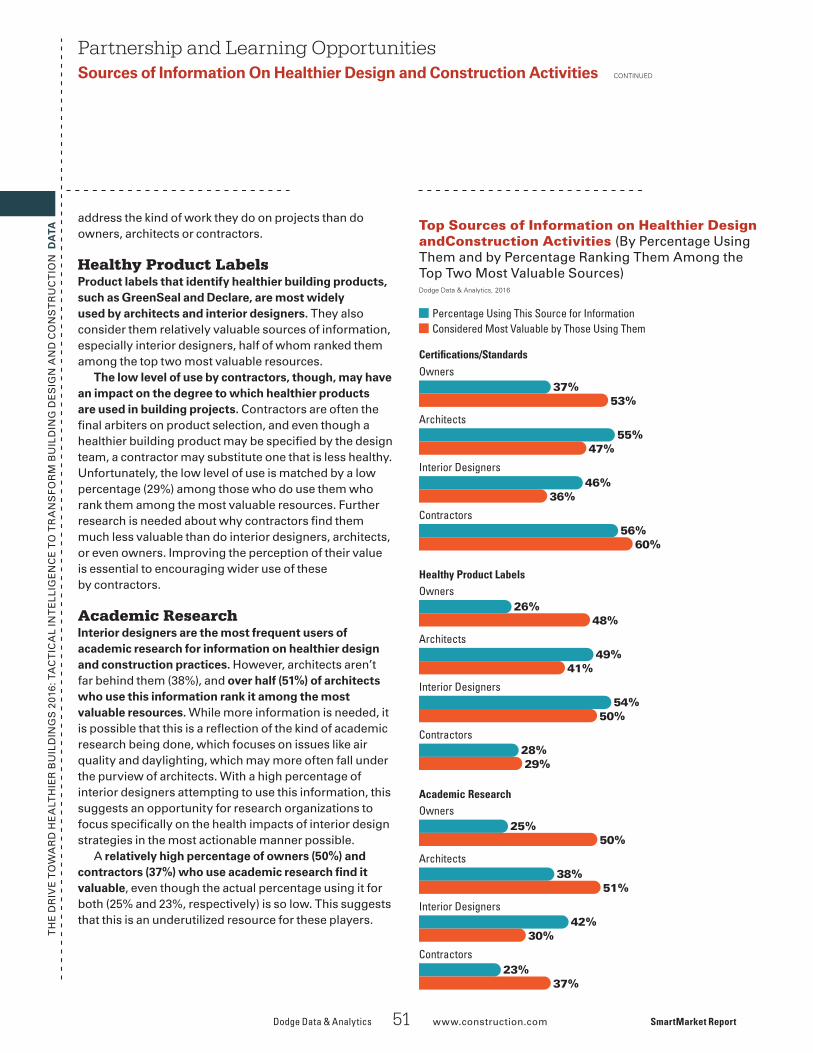
TA Owners, architects, interior designers and contractors were asked to what degree healthy product labels in�uence their decisions on projects, from high to low. Examples of healthy product labels include GreenSeal and Declare.
The �ndings suggest that many buildings that are designed to be healthy may not be so in reality. Around three quarters of architects (73%) and interior designers (81%) state that healthy product labels have at least a medium level of impact on their product decisions, which suggests that healthy products are being speci�ed.
However, frequently in construction, contractors make the �nal decisions on product choices, and a relatively large percentage of contractors (44%) report that healthy labels have a low impact on their product decisions. Thus it is likely that products certi�ed to be healthy are being replaced on projects with products that do not have that certi�cation.
Also, there is a growing trend for owners with large portfolios of projects, such as owners in the multifamily residential or healthcare sectors, to provide their project teams with product speci�cations. However, owners are least likely to be highly in�uenced by healthy labels in their product decisions, and there is no statistically signi�cant variation in this response between large and small owners.
These �ndings are consistent with the �ndings for Canada and therefore suggest widely held attitudes. For product choices to be made healthier, product manufacturers and industry organizations should educate owners and contractors on the value of using healthy product labels.
Variation by Level of Green Building InvolvementRespondents with a high level of green building involvement (more than 60% green projects) are more in�uenced by healthy product labels than those with a low involvement (15% or fewer green projects). More than three quarters (79%) of respondents with high green involvement report that product labels have a big impact on their product decisions, compared with just over half (55%) of those with low involvement.
This �nding is in keeping with previous �ndings about the use of healthier products. It also makes sense, since those doing more green projects are already likely to use green product labels to help with product selections, so their interest in healthier labels could follow from that.
Elements of a Healthier Building CONTINUED
Dodge Data & Analytics 21 www.construction.com SmartMarket Report
In�uence of Product Labels
Impact of Labels on Product Decisions (According to U.S. Respondents)Dodge Data & Analytics, 2016
HighMediumLow
21%27%
52%
25%19%
56%
2_01_HealthSMR_Batch2_C11_ProductLabels_#01
Architects Interior Designers
12%
44%
44%
2%
47% 51%
Contractors Owners
TH
E D
RIV
E T
OW
AR
D H
EA
LTH
IER
BU
ILD
ING
S 2
016:
TA
CT
ICA
L IN
TE
LLIG
EN
CE
TO
TR
AN
SF
OR
M B
UIL
DIN
G D
ES
IGN
AN
D C
ON
ST
RU
CT
ION
DA
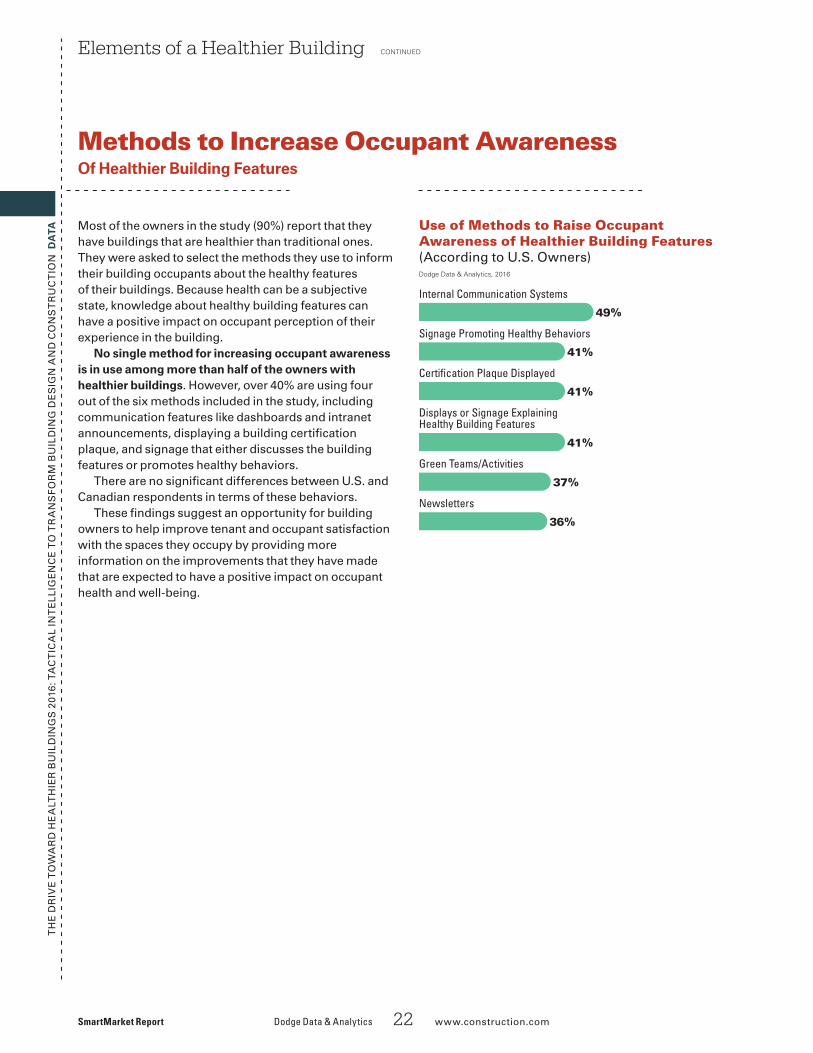
TA Most of the owners in the study (90%) report that they have buildings that are healthier than traditional ones. They were asked to select the methods they use to inform their building occupants about the healthy features of their buildings. Because health can be a subjective state, knowledge about healthy building features can have a positive impact on occupant perception of their experience in the building.
No single method for increasing occupant awareness is in use among more than half of the owners with healthier buildings. However, over 40% are using four out of the six methods included in the study, including communication features like dashboards and intranet announcements, displaying a building certi�cation plaque, and signage that either discusses the building features or promotes healthy behaviors.
There are no signi�cant differences between U.S. and Canadian respondents in terms of these behaviors.
These �ndings suggest an opportunity for building owners to help improve tenant and occupant satisfaction with the spaces they occupy by providing more information on the improvements that they have made that are expected to have a positive impact on occupant health and well-being.
Elements of a Healthier Building CONTINUED
SmartMarket Report Dodge Data & Analytics 22 www.construction.com
Methods to Increase Occupant Awareness Of Healthier Building Features
Use of Methods to Raise Occupant Awareness of Healthier Building Features (According to U.S. Owners)
Displays or Signage ExplainingHealthy Building Features
41%
37%
Green Teams/Activities
36%
Newsletters
TH
E D
RIV
E T
OW
AR
D H
EA
LTH
IER
BU
ILD
ING
S 2
016:
TA
CT
ICA
L IN
TE
LLIG
EN
CE
TO
TR
AN
SF
OR
M B
UIL
DIN
G D
ES
IGN
AN
D C
ON
ST
RU
CT
ION
Healthy Materials: From Spec to Site and Beyond
The industrywide movement toward increased product transparency is making it easier to specify materials with reduced health and environmental impacts. But writing better materials into the spec is one thing; getting them into the building is something else again.
Dodge Data & Analytics 23 www.construction.com SmartMarket Report
Sidebar: Getting Healthy Materials Into the Building
Healthier materials may be less familiar, cost a little more or involve doing things a little
differently. Chances are, sooner or later, someone will propose a substitute. If that proposal comes after the user groups that prioritized healthy choices have disbanded, and the pressures of budget and schedule have intensi�ed, subbing in a cheaper or more readily available alternate offers an easy way to proceed. And that’s not even counting the substitutions that happen by accident.
Championing Health Through Construction“There has to be somebody who is the champion,” says Paul Mellblom, principal of MSR Design, architects of the Rose, a 90-unit mixed-income housing development in Minneapolis that tackled the Living Building Challenge’s materials Red List. (For more information on this project, see the case study on page 26.) “It needs to be someone thorough, with full access to the site, who feels entitled to speak on behalf of higher aspirations.”
On the Rose, that champion was MSR’s project manager, Rhys MacPherson. Once construction began, MacPherson was on site almost daily, banishing a PVC-containing drywall compound that had been shipped to make up a short order, or explaining to workers why their fast-drying touch-ups had to
stop. With hindsight, MacPherson recommends making the spec language around the materials priority stronger, highlighting speci�c provisions in color, and holding orientation meetings not just for lead subcontractors, but for everyone joining the site.
Although they share the basic requirements of commitment and attention, key strategies for getting healthy materials from spec to site vary with building size and type. For the 878,000 square-foot UCSF Medical Center at Mission Bay, designed by William McDonough+Partners in association with Stantec (formerly Anshen+Allen), an integrated project delivery method, which co-located the project team on site, fostered a strong project culture around the healthy materials priority. In addition, to ensure that proposed substitutions met the same health standards as products that had been screened for toxins by an independent materials consultant, subcontractors were required to cover the consultant’s screening fee for their proposed alternate. “We didn’t get any random substitutions,” says Tyler Krehlik, project architect on UCSF Mission Bay, “and we got very well-documented substitution requests for materials that weren’t even part of the screen.”
Consolidating AchievementsAt the end of the day, air quality
testing is the only way to have con�dence that a project has achieved its health objectives, says Mellblom. On the Rose, initial air testing revealed that trades were using noncompliant products to speed close-out, and two apartments had been supplied with added-formaldehyde cabinets. These mistakes remedied, the project passed with �ying colors.
But the healthy materials priority doesn’t stop there. Complementing their portfolio-wide eco-cleaning protocol, the building’s owners, Aeon and Hope Community, issued baskets of healthy and environmentally responsible cleaning products to each household moving into the Rose, along with information about the healthy materials choices that had been made on their behalf and the best ways to maintain them.
Ultimately, regardless of their health bene�ts, materials have to speak for themselves. “I can’t explain away a problem,” says Mary Phillips, UCSF’s project manager. “If the material doesn’t hold up, then we can’t use it in future.” If, however, a wall can be repainted or a piece of �ooring replaced next to a patient room without off-gassing, then a material has proven itself the best choice for multiple reasons. “Over time there may be challenges,” says Phillips, “but there are a lot of advocates for healthy materials in our ongoing operations group, and it will stay a priority.” n
TH
E D
RIV
E T
OW
AR
D H
EA
LTH
IER
BU
ILD
ING
S 2
016:
TA
CT
ICA
L IN
TE
LLIG
EN
CE
TO
TR
AN
SF
OR
M B
UIL
DIN
G D
ES
IGN
AN
D C
ON
ST
RU
CT
ION
The concept of biophilia postulates an innate need for connection with nature, a need which must be met
for humans to thrive—physically, mentally and socially— and which, as our species becomes ever more urban, requires deliberate consideration in the design of built environments.
Increasingly, research quantifying the bene�ts of connection to nature con�rms that biophilic design can reduce stress, improve cognitive function and creativity, enhance well-being and expedite healing.
Patient views to nature correlate with 8.5% shorter hospital stays, and patients with sunny rooms request 22% less pain medication.
Ten percent of employee absences can be attributed to architecture with no connection to nature, and an employee’s view is the primary predictor of absenteeism.
Children learn 20%–26% faster in natural daylight, and their progress along a universal curve of cognitive development increases with exposure to grass and trees.
The effects on health of living on a block with an extra 10 trees equate to the effects of a $10,000 boost in income or seven year drop in age.
Viewing a �owering meadow type of green roof for as little as 40 seconds sustains attention, resulting in signi�cantly fewer task errors.
All these �ndings are just a sampling from myriad studies focused on the health effects of a
Biophilic Design and Impacts on Well-Being
A daylit of�ce is more pleasant than a basement, and a park view preferable to a parking lot. Are these just preferences—nice to have? Or can they be justi�ed in the speci�c terms of a project’s goals, such as learning, healing, productivity or rest?
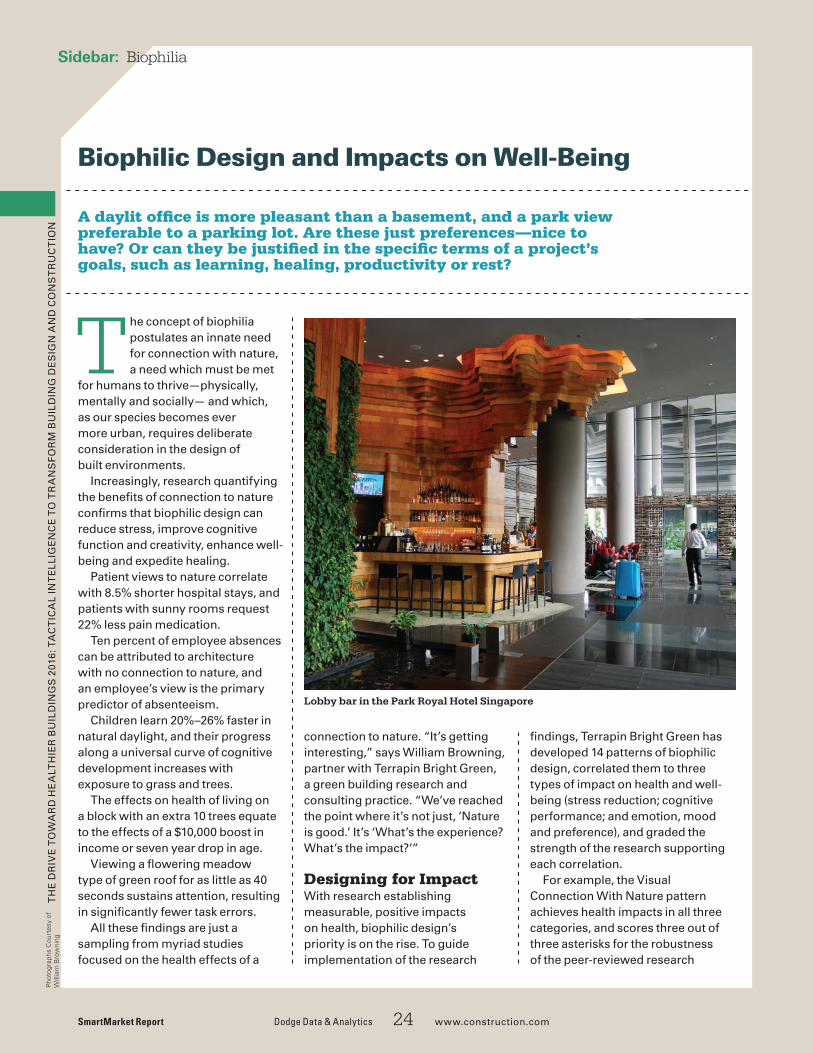
SmartMarket Report Dodge Data & Analytics 24 www.construction.com
Sidebar: Biophilia
connection to nature. “It’s getting interesting,” says William Browning, partner with Terrapin Bright Green, a green building research and consulting practice. “We’ve reached the point where it’s not just, ‘Nature is good.’ It’s ‘What’s the experience? What’s the impact?’”
Designing for ImpactWith research establishing measurable, positive impacts on health, biophilic design’s priority is on the rise. To guide implementation of the research
�ndings, Terrapin Bright Green has developed 14 patterns of biophilic design, correlated them to three types of impact on health and well-being (stress reduction; cognitive performance; and emotion, mood and preference), and graded the strength of the research supporting each correlation.
For example, the Visual Connection With Nature pattern achieves health impacts in all three categories, and scores three out of three asterisks for the robustness of the peer-reviewed research
Lobby bar in the Park Royal Hotel Singapore
Pho
togr
aphs
Cou
rtes
y of
W
illia
m B
row
ning
TH
E D
RIV
E T
OW
AR
D H
EA
LTH
IER
BU
ILD
ING
S 2
016:
TA
CT
ICA
L IN
TE
LLIG
EN
CE
TO
TR
AN
SF
OR
M B
UIL
DIN
G D
ES
IGN
AN
D C
ON
ST
RU
CT
ION
Dodge Data & Analytics 25 www.construction.com SmartMarket Report
Sidebar: Biophilia CONTINUED
supporting its health impacts. Another pattern, Dynamic and Diffuse Light, registers under the stress reduction heading only, with two out of three asterisks for its research. And although both patterns reduce stress, the speci�cs of their impacts differ: Visual Connection lowers blood pressure and heart rate, and Dynamic and Diffuse Light improves visual comfort and circadian system functioning. The point is to select patterns best suited to the circumstances and priorities of the project.
Not all projects lend themselves to views of greenery, water features or even a plant in the corner, but subtle and ingenious strategies can achieve biophilic effects under constrained circumstances at very little cost. To introduce biophilic patterns in ways that would be compatible with a food-safe environment, for example, the interior walls of Clif Bar & Company’s new 200,000 square-foot industrial bakery are washed with daylight to allow workers inside to experience the light’s changing color and angle over the course of a day. Customers also send the company images of themselves out in nature with a Clif Bar, and the bakery selects two of these images a day and projects them onto a high white wall in the bakery.
It’s important to note that the biophilic patterns aren’t a checklist. More isn’t necessarily better. Browning has had calls from enthusiasts who proudly announce that they’ve applied 12 of the 14 patterns in a single project. In fact, some of the patterns contradict one another. The Refuge pattern, for example, correlates with improved concentration, attention and
perception of safety, and the Risk/Peril pattern correlates with strong dopamine or pleasure responses. “If you do just two or three [patterns],” says Browning, “that’s a great way to make a signi�cant impact.”
Like It or NotBut responses to nature are not universal. Aesthetic preferences matter, and they vary: One person’s pastoral roof meadow is another person’s scruffy mess. “People don’t always like the aesthetics of ecological design,” says Angela Loder, an adjunct professor at the University of Denver, whose own research has established a 50%
increase in ability to concentrate just by looking out at a green roof, and has also identi�ed signi�cant differences in how green roofs, such as the award-winning one on Chicago’s City Hall, are perceived. “Nature comes with a lot of cultural values,” says Loder, “and to ignore that is setting up for failure.” If a manicured-lawn type is just plain irritated by what looks like an abandoned lot, the desired health impacts won’t be delivered.
That doesn’t mean a complex roof meadow should be replaced with a carpet of sedum if someone complains. Talking helps, says Loder. When people verbalize their impressions, not only can what they say suggest a way forward, but the act of verbalizing can change their �rst impressions, and open a pathway for healing effects. Symbols of care can also help: for example, a mown edge around a wild meadow, bird houses or signage. Change can also come just from letting people sit with a design: Loder found that people who watched a roof meadow over a number of seasons came to understand that they weren’t the only ones affected, that the roof’s value for birds and insects counted. Seeing the roof in passing, they were reminded of the larger rhythms of nature, and gained a much deeper sense of peace and calm than focusing on their likes and dislikes would have achieved.
“Giving people these small spaces for respite has been found to be deeply restorative,” says Loder, “and it gives them a sense that the space takes care of them, not just as a productive worker, but as a whole person.” Ironically, she adds, that makes them more productive. n
Exterior of the Park Royal Hotel Singapore
TH
E D
RIV
E T
OW
AR
D H
EA
LTH
IER
BU
ILD
ING
S 2
016:
TA
CT
ICA
L IN
TE
LLIG
EN
CE
TO
TR
AN
SF
OR
M B
UIL
DIN
G D
ES
IGN
AN
D C
ON
ST
RU
CT
ION
The Rose, a 145,000 square-foot, 90-unit apartment building that revitalizes a blighted
corner in Minneapolis, is an extraordinary, even heroic, endeavour: a mixed-income housing development that takes on the Living Building Challenge.
In 2010, after more than a decade of increasingly ambitious achievements for the sustainability of its projects, Aeon, developers in collaboration with Hope Community of the Rose, determined that, “for all the work, our impact wasn’t really affecting residents as much as we thought it would,” says Gina Ciganik, formerly vice president of housing development at Aeon, and now senior advisor on housing innovation at the Healthy Building Network. In
the Living Building Challenge’s (LBC)holistic concept of sustainability, and in its explicit focus on equity and health, Aeon saw an opportunity to develop a model for healthy, sustainable housing that could be replicated across the affordable housing sector.
With only $154 per square foot to back this aspiration, however (and even that represented a premium over the $122 state funding mandate), the Rose’s project team knew their budget wouldn’t stretch to full compliance with all seven of the LBC’s category petals. Instead, says Ciganik, the team used the LBC as a framework, which they checked against the values of affordable housing: “We took the LBC on, and modi�ed it for our world.”
As a pilot project in the LBC
Framework for Affordable Housing, the Rose targeted a concept of best-in-class that the team developed in discussion with the International Living Futures Institute, overseer of the LBC. Project goals prioritized the following: the equity, health and happiness, and beauty petals; the 2030 challenge to reduce energy use by 70% below baseline; and water use reduction as much as practical. Part way through the design, a group of the Rose’s philanthropic funders urged the team to tackle the LBC’s materials Red List, a list of chemicals detrimental to human and environmental health not uncommonly found in building products. With that, the healthy materials priority moved to center stage.
Material Well-Being“Typically in affordable housing, the deciding factors are �rst cost, maintainability and durability,” says Paul Mellblom, principal at MSR Design, architects of the Rose. “Adding in lifecycle cost and health changed the way we looked at the building.”
To maximize the bene�ts to residents of healthy material choices, the design team focused their efforts on optimizing materials from the drywall in. They identi�ed 40 material categories for air quality improvement and reduced toxicity, including, for example, �ooring, cabinetry, countertops, window shades, lighting and paints.
The Rose’s healthy, durable alternatives added less than 1% to total construction cost. Identifying these alternatives, however, was a labor-intensive process few affordable housing developments
case st
udy
Prioritizing Health in Affordable HousingThe Rose Apartment Building
MINNEAPOLIS, MINNESOTA
SmartMarket Report Dodge Data & Analytics 26 www.construction.com
CONTINUEDPho
togr
aphs
Cou
rtes
y of
D
on W
ong
Pho
togr
aphy
The Rose is a mixed-income housing development that takes on the Living Building Challenge.
case st
udyT
HE
DR
IVE
TO
WA
RD
HE
ALT
HIE
R B
UIL
DIN
GS
201
6: T
AC
TIC
AL
INT
ELL
IGE
NC
E T
O T
RA
NS
FO
RM
BU
ILD
ING
DE
SIG
N A
ND
CO
NS
TR
UC
TIO
N
Dodge Data & Analytics 27 www.construction.com SmartMarket Report
can undertake. To help counter that, the Healthy Building Network (HBN) is developing a database of affordable housing’s most commonly used materials, region by region, as part of an initiative to engage manufacturers in improving products the sector needs. “By 2018,” predicts Ciganik, “products like those in the Rose will be the standard.”
In terms of avoided hazard, an ongoing study by HBN and Parsons School of Design has established that the Rose’s �ooring choice alone—a bio-based tile instead of standard vinyl—eliminated 11.2 tons of toxins from the building, 250 pounds per apartment. Air quality testing prior to turning apartments over to residents registered volatile organic compound levels typically between 20 and 30 micrograms per cubic meter: compared to the target maximum of 500, practically nothing.
The difference is palpable: Construction workers conducting �nal checks couldn’t open a door and smell whether �oors had been waxed and countertops wiped down; they had to walk in and look. “That got us thinking about the person whose job that is,” says James Lehnhoff, vice president of housing development at Aeon. “It’s not only residents whose health these choices affect.”
A Breath of Fresh AirWith materials optimized for health, the main hazards for indoor air quality became pollutants from a nearby highway intersection, and from occupant activities. So, where typical multifamily housing relies on a pressurized corridor to deliver conditioned air under apartment doors, with additional
fresh air supplied through windows and imperfectly sealed walls, at the Rose a dedicated outdoor air system (DOAS) feeds �ltered and tempered fresh air into each unit, with roof-exhausted fans in kitchens and bathrooms providing faster air changes as required. “The ventilation system really does act like the lungs of the building,” says Rhys MacPherson, project manager at MSR.
Doubling the code-required ventilation rate with the DOAS’s �ve-stage �ltration system imposed an energy penalty, however. The Rose was targeting (and ultimately achieved) an energy use intensity (EUI) of 31 kBtu/sq ft/yr, a 72% reduction compared with its building type baseline EUI of 111. But the DOAS notched the EUI up by six to eight points. “It would have been easy not to do DOAS, and been right at net zero ready,” says MacPherson. Instead, the team met its energy goal by tightening up the building envelope: a �uid-applied membrane and high-performance windows improved both energy performance and the barrier to highway pollutants, including noise.
The project’s goal of serving the health and well-being of residents also extends to mental health, with larger-than-standard operable windows providing daylight and views to greenery for each unit. Linking the project’s two buildings, a courtyard designed for all ages provides play spaces, tree-lined walks, seating and gathering spaces, and highlights the ecology of the site with rain gardens and a variety of plantings. A 5,000 square-foot community garden, with a full-time facilitator, offers the opportunity
to grow food and to connect with neighbors. At one third green space, the Rose transforms a contaminated site into a place where residents of all income levels, ages and family con�gurations can thrive, a beacon of well-being in one of the city’s poorest neighborhoods.
“Regardless of income,” says Lehnhoff, “people should have access to a healthy, well-built, energy-ef�cient home.” n
The Rose Apartment BuildingMINNEAPOLIS, MINNESOTA
Project Facts and Figures
OwnerAeon and Hope Community
ArchitectMSR Design
MEP EngineersKarges-Faulconbridge, Inc.
Structural EngineersMeyer Borgman Johnson
Civil Engineer and Landscape ArchitectWeis Builders, Inc.
Size145,000 Sq. Ft. and 90 Units (47 Affordable Units)
Construction Completed2015
Green and Healthier Building Features
■■ Daylighting: 50%
■■ Views to Outdoors: 64%
■■ Within 15 Feet of an Operable Window: 54%
■■ EUI: 31 kBtu/sq ft/yr
■■ Onsite Rainwater Management: 90%
■■ Potable Water Use Reduction: 48%
stats
CONTINUED
SmartMarket Report Dodge Data & Analytics 28 www.construction.com
TH
E D
RIV
E T
OW
AR
D H
EA
LTH
IER
BU
ILD
ING
S 2
016:
TA
CT
ICA
L IN
TE
LLIG
EN
CE
TO
TR
AN
SF
OR
M B
UIL
DIN
G D
ES
IGN
AN
D C
ON
ST
RU
CT
ION
DA
TA As the in-depth interviews with owners con�rm (see pages 45 to 47), the best way to encourage greater investment in healthier buildings in the future, both within an individual company and in the industry at large, is to have metrics tracking the impact of healthier building features on occupant health. However, measuring health bene�ts can be subjective and dif�cult.
Most Widely Used Metrics Currently
OCCUPANT FEEDBACK AND COMPLAINTSThe most popular metric in use by U.S. building owners currently to measure building impacts on occupant health is occupant feedback and complaints, currently used by 69%. Interestingly, although it is still expected to be the most widely used metric in three years as well, it is also the only metric among those included in the study that is not expected to grow in use.
As a metric, occupant feedback and complaints can be unreliable since they are unlikely to be comprehensive or to include positive impacts of building features on health. Occupants also may not associate negative impacts with the building. For example, a building with high CO2 levels may result in lethargic occupants, but neither the workers nor their manager may be aware that the building conditions are causing this impact.
EMPLOYEE SATISFACTION AND ENGAGEMENT SURVEYSNearly half of owners (47%) use employee engagement and satisfaction surveys to measure health impacts currently, with a dramatic increase in those who expect to be using these measurements in the next three years (62%). The growing popularity of these measures is not surprising. They can be used to justify investment, they can help promote awareness of healthy building features, and they can attempt to link employee response to speci�c building features. However, they only measure perception, rather than quanti�able bene�ts like productivity and reduced absenteeism.
ENVIRONMENTAL MEASURESThe most widely used measurement based on objective data is of environmental measures like air quality, used currently by 40%. As the participants in the in-depth interviews with owners who have invested in healthier buildings reveals (see pages 45 to 47), air quality is one of the few areas impacting health that owners of tenant-occupied commercial buildings can
Metrics Used to Measure Building Impacts On Occupant Health
Benefits and MetricsData:
Metrics to Measure Building Impacts on Occupant Health (Use and Expected Use According to U.S. Owners)
2_03_HealthSMR_Batch2_D1_D4_Metrics
Dodge Data & Analytics, 2016
20152018
69%
69%
Occupant Feedback/Complaints
Employee Satisfaction/ Engagement Surveys
47%
62%
Environmental Measures (air qualilty/CO2)
40%
47%
Employee Recruitmentand Retention
26%
31%
16%
27%
Productivity
AbsenteeismDue to Illness
15%
27%
HealthcareInsurance Costs
11%
20%
Biosensors(e.g., Fitbit)
3%
14%
TH
E D
RIV
E T
OW
AR
D H
EA
LTH
IER
BU
ILD
ING
S 2
016:
TA
CT
ICA
L IN
TE
LLIG
EN
CE
TO
TR
AN
SF
OR
M B
UIL
DIN
G D
ES
IGN
AN
D C
ON
ST
RU
CT
ION
DA
TA directly control, and it is also one of the few areas with studies directly relating it to productivity improvements. However, as one owner pointed out, while there is a great deal of evidence suggesting that fresh air improves productivity, there is little evidence for exactly how much fresh air is the optimum amount in a building. Since improving air quality can have a negative impact on energy use, many owners would bene�t from data that would help them to determine how to balance these two priorities appropriately.
It is surprising, though, that only a slightly higher percentage (47%) plan to measure air quality in the next three years. More data is needed to determine why owners are not investing in these measurements, whether it is the price of sensors, concerns about the cost of a system overhaul if air quality is less than desired, concerns about liability or just lack of interest.
Metrics Expecting Greatest Growth in UseIn addition to employee engagement and satisfaction surveys, three other metrics may be more widely used in the next three years.■ Productivity: 11 point growth over 2015 in those who
expect to use this measure. Productivity measures can be challenging in white collar of�ces, especially in ways that link the improvements to speci�c building strategies, but many believe productivity increases make the strongest �nancial argument for investing in healthier buildings.
■ Absenteeism Due to Illness: 12 percentage point increase in those who expect to use this measure.Absenteeism is linked directly to productivity. While it is relatively easy to obtain basic absenteeism statistics, there are many factors beyond the building that in�uence absenteeism, so it is dif�cult to tie trends in absenteeism to speci�c building improvements.
■ Biosensors: 11 percentage point increase in those who expect to use this measure. Many people in the U.S. now wear devices tracking basic information about their health, including their level of physical activity, heart rate and sleeping patterns. However, there are no legal parameters for sharing the data gathered by these devices currently, and in Europe, concerns about data privacy are currently being debated. Still the popularity of these devices and the willingness of consumers to share data may yield valuable information for companies seeking to better understand the impacts of their buildings on the health of their occupants.
Benefits and MetricsMetrics Used to Measure Building Impacts On Occupant Health CONTINUED
Metrics Considered Most Important by Those Not Currently Using ThemBetween 40% and 50% of U.S. owners who are not using the following six metrics currently consider them important to quantify health impacts if they could be more easily measured:
• Absenteeism Due to Illness (50%)• Attentiveness/Ability to Concentrate (48%)• Productivity (45%)• Occupant Feedback/Complaints (44%)• Environmental Measurements (41%)• Employee Satisfaction/Engagement Surveys (40%)
The top three are frequently identi�ed as valuable metrics that are dif�cult to measure, but the other three are more surprising, since tools already exist to effectively measure and track them.
Variation by Country, Green Involvement or Company SizeIt is notable that there are only a few signi�cant differences regarding the use of metrics. For example, over half (55%) of owners with a high level of green involvement (more than 60% green projects) report tracking environmental measures, compared with a little over a quarter (29%) of those doing 15% or fewer green projects. However, there is no signi�cant difference in any of the other measures for those doing a high volume of green work versus those doing few green projects.
Similarly, no statistically signi�cant differences exist between owners in the U.S. versus Canada.
These �ndings demonstrate that most owners across the industry share the same fundamental challenges when it comes to measuring their building health impacts.
Dodge Data & Analytics 29 www.construction.com SmartMarket Report
TH
E D
RIV
E T
OW
AR
D H
EA
LTH
IER
BU
ILD
ING
S 2
016:
TA
CT
ICA
L IN
TE
LLIG
EN
CE
TO
TR
AN
SF
OR
M B
UIL
DIN
G D
ES
IGN
AN
D C
ON
ST
RU
CT
ION
DA
TA Owners were asked why they conduct measurements of the impacts of their buildings on occupant health and well-being and were allowed to select all the reasons offered in the survey that applied to them. Three tiers of reasons emerged from their responses.
■ Top Tier: The only reason agreed upon by more than 50% of U.S. owners is that measuring health impacts is the right thing to do, selected by 64%. This �nding is reminiscent of studies done by Dodge Data & Analytics on the green building movement in 2008, where the right thing to do was the most important driver for adopting green. It will be interesting to see if market forces overtake concern about doing the right thing for health, as they did with green.
■ Second Tier: Several options were selected by roughly one third to one half of the respondents. • Industry leadership and the ability to attract
tenants/employees and students lead the pack, selected by nearly half (47%) of owners. These two business factors may prove to be key drivers in the near future, as companies begin to distinguish themselves on this issue in the U.S. However, industry leadership is currently a more important driver among Canadian owners than those in the U.S., per the lower chart at right.
• 41% of owners view health metrics tactically and want to be able to understand health impacts to inform future design decisions. This indicates the need for data. The desire to inform future design decisions is more commonly reported by owners with more than 60% green projects (44%) than by those doing 15% or fewer of their projects green (18%).
• The popularity of LEED and growing familiarity with the WELL building standard is why nearly one third (33%) of owners measure health impacts to meet the requirements of a building standard.
■ Lowest Tier: Less than 20% of owners are motivated to measure health impacts because they think it will lead to increased building value or reduced health insurance premiums, or because they need to respond to organizational mandates or competitive pressure. Here again, as the chart at right shows, U.S. owners differ from Canadian owners, who expect increased building value and see strong competitive pressure. As the U.S. healthier building market matures, and as public awareness of building health impacts increase, many of these factors are likely to be more in�uential in the future.
Benefits and Metrics CONTINUED
SmartMarket Report Dodge Data & Analytics 30 www.construction.com
Current Reasons Why Owners Use Metrics To Gauge Impacts of Buildings on Occupant Health
Reasons Why Owners Use Building Health Impact Metrics (According to U.S. Owners)
Reasons Why Owners Measure Building Health Impacts (Reasons With a Signi�cant Difference Between U.S. and Canadian Owners)2_04_HealthSMR_Batch2_D6_WhyMeasure_#02
Dodge Data & Analytics, 2016
64%
Right Thing to Do
47%
Improve Company Reputation/Industry Leadership
47%
Attract/Retain Tenants, Employees, Students
41%
Inform Future Design Decisions
Required for BuildingCerti�cation/Standards
33%
18%
Government Mandates
17%
Increased Building Value
17%
Organizational Mandates
Reduced HealthInsurance Premiums
17%
16%
Competitive Pressure
Dodge Data & Analytics, 2016
U.S. Canada
Improve Company Reputation/Industry Leadership
2_05_HealthSMR_Batch2_D6_WhyMeasure_Countries_#02
17%
Increased Building Value
33%
Competitive Pressure
47%
65%
37%
16%
TH
E D
RIV
E T
OW
AR
D H
EA
LTH
IER
BU
ILD
ING
S 2
016:
TA
CT
ICA
L IN
TE
LLIG
EN
CE
TO
TR
AN
SF
OR
M B
UIL
DIN
G D
ES
IGN
AN
D C
ON
ST
RU
CT
ION
DA
TABenefits and Metrics CONTINUED
Dodge Data & Analytics 31 www.construction.com SmartMarket Report
Drivers for Increased Measurement Of Building Health Impacts
Measurement of the impacts of investments made in creating healthier buildings are needed to create a strong business case for increased investment in healthier building products and practices. Gathering such data requires owner commitment and may entail participation by other members of the project team. Therefore, owners, architects, interior designers and contractors were asked to select the top factors that would have the greatest impact on their organizations’ commitment to measuring building health impacts in the future.
Owners had a different list of options than architects, interior designers and contractors, although there were a couple of common variables. Therefore, separate charts have been created that re�ect the percentages who ranked each item �rst. The owner chart at right also includes a comparison with the responses from Canada, and the chart on page 32 compares the responses from architects, interior designers and contractors in the U.S.
OwnersApproximately one third of U.S. owners rank two factors �rst: standardized tools/guides for measurement (36%) and greater occupant interest in building health impacts (33%).
• Occupant interest is an important driver among Canadian owners as well.
• Standardized tools/guides for measurement, on the other hand, are more important to U.S. owners than to those from Canada, with more than double the percentage of U.S. owners (36%) selecting this than owners from Canada (15%). Currently, Canadian owners feel greater competitive pressure to conduct measures (see page 30), so this result may suggest that the Canadian market has begun to work out the right measures to use to aid their ability to compete based on their building health impacts.
Less than 20% of owners in the U.S. or Canada rank the willingness of design �rms or contractors to engage in the process of measurement �rst in drivers that will encourage future measurement. Perhaps most owners presume that their design and construction teams are more likely to measure based on owner in�uence, rather than the other way around.
While very few U.S. owners (3%) are interested in a national database to provide context of results by building type, 19% of Canadian owners rank this �rst as a future driver for measurement. This is further evidence of the greater competitive pressure experienced in Canada
Drivers for Increased Measurement of Building Health Impacts (According to U.S. Owners)
Willingness of Owners toCommit to Partner in Measurement
27%
21%
27%
Standardized Tools/Guides for Measurement
16%
19%
13%
National Database toProvide Context ofResults by Building Type
7%
2%
5%
to produce healthier buildings, which is evident in many of the �ndings (see pages 30 and 41).
There are no signi�cant differences among owners between those highly involved in green and those with a low level of green involvement in the factors that they rank �rst that would encourage them to commit to measuring their building health impacts. This may be due to limited requirements in most green certi�cation systems for measurements of health impacts.
Architects, Interior Designers and OwnersEven though only a few �rms currently conduct measurements of the health impacts of their building projects, it is possible that architects, interior designers and contractors may gather this information in the future.
At this point, though, it is clear that owner interest in health issues is the most important driver needed to encourage companies to make these measurements, with around half of all architects, interior designers and contractors ranking this as the top driver. About a quarter of respondents also rank the willingness of owners to commit to partner in measurement as the top driver for them to do measurements, which is a more rigorous level of owner commitment than just an expression of interest.
On the other hand, less than 20% consider a standardized tools/guides for measurement a top driver for them, and less than 10% consider a national database highly in�uential.
These �ndings suggest the importance of greater owner emphasis on building health impacts to help drive the industry as a whole. Owner interest could begin a virtuous cycle, with their project teams participating in gathering more data due to their interest, and their interest increasing due to the implications of the data.
TH
E D
RIV
E T
OW
AR
D H
EA
LTH
IER
BU
ILD
ING
S 2
016:
TA
CT
ICA
L IN
TE
LLIG
EN
CE
TO
TR
AN
SF
OR
M B
UIL
DIN
G D
ES
IGN
AN
D C
ON
ST
RU
CT
ION
DA
TA Nearly half (47%) of owners use employee satisfaction and engagement surveys to measure the performance of their healthier buildings (see page 28). They were asked about how much of an impact healthier buildings have on employee satisfaction and engagement.
■ Over half (58%) of these owners see at least a medium level of improvement, and half of these owners report a high level of improvement.
■ No owners report a negative impact, and very few (16%) report that the impact is small or doesn’t exist.
■ However, despite measuring this factor, over one quarter (26%) do not know the impact of their healthier buildings on employee satisfaction and engagement.
These �ndings demonstrate a compelling business argument for owner-occupiers to invest in healthier buildings and to be sure that they make their investments clear to their employees. It also provides strong evidence to owners of commercial real estate that healthier buildings are more desirable, which can help contribute to faster leasing times for buildings and better tenant retention.
Benefits and Metrics CONTINUED
Dodge Data & Analytics 33 www.construction.com SmartMarket Report
Impact of Healthier Buildings On Employee Satisfaction and Engagement
Degree of Impact of Healthier Buildings on Employee Satisfaction and Engagement (According to U.S. Owners Measuring the Impact of Employee Satisfaction and Engagement)Dodge Data & Analytics, 2016
High Level of ImprovementMedium Level of ImprovementSmall ImprovementNo Measurable ImpactDon't Know
29%
29%
26%
11%
5%
2_09_HealthSMR_Batch2_D8_EmployeeSat_#01
TH
E D
RIV
E T
OW
AR
D H
EA
LTH
IER
BU
ILD
ING
S 2
016:
TA
CT
ICA
L IN
TE
LLIG
EN
CE
TO
TR
AN
SF
OR
M B
UIL
DIN
G D
ES
IGN
AN
D C
ON
ST
RU
CT
ION
DA
TA Owners were asked to indicate the impact of their healthier building investments on three �nancial measures of building performance: the ability to lease buildings more quickly, the ability to charge a premium rent and the impact on the value of their buildings.
The clearest trend from the responses of U.S. owners is their uncertainty about the impact of their healthier building investments on these measures, with the highest percentage for each reporting that they don’t know the impact. This �nding is not surprising, given that separate consideration of the �nancial impact of health as a factor on its own rather than as one element of sustainability is relatively new. Also, these measures may be quite �uid, depending on increased public awareness of building health impacts, rising competition to deliver these features as amenities to tenants or employees, and increasing data on speci�c health impacts as interest in this area grows.
Impact on the Ability to Lease Buildings More QuicklyOver one third of U.S. owners (35%) reported that healthier building investments have allowed them to lease buildings more quickly. These respondents account for nearly three quarters of those who did not respond “don’t know” to this question. Among the three measurements, this is the one that owners report most frequently. For the early stages of the healthier building movement, this may be the most compelling argument for investing in healthier buildings in the commercial market, until more data is available on other factors.
As the in-depth interviews with expert owners make clear (see pages 45 to 47), this may be due, in part, to the fact that healthier building features are currently easier to market as an amenity, and that will continue until more data is available on the true impacts of these buildings. Therefore, their appeal is strongest for attracting and retaining tenants, as opposed to the ability to charge a premium rent or to see an increase in building value.
The contrast between the owners in the U.S. and those in Canada is also particularly telling for this metric. Unlike in the measure on ROI, where different owner pro�les lead to very different results (see page 36), for this question, owners for whom this information was not applicable are excluded, and only those with commercial properties responded. Only 24% of owners in Canada didn’t know the impact on their ability to lease properties faster, versus 52% of U.S. owners. This 28
Benefits and Metrics CONTINUED
SmartMarket Report Dodge Data & Analytics 34 www.construction.com
Financial Impacts of Healthier Buildings
Impact of Healthier Building Investments on Ability to Lease Buildings More Quickly (According to U.S. Owners)Dodge Data & Analytics, 2016
Positive ImpactNo ImpactDon't Know
35%52%
13%
2_11_HealthSMR_Batch2_D10_Leasing_#01Impact of Healthier Building Investments on Ability to Charge a Premium Rent(According to U.S. Owners)
Dodge Data & Analytics, 2016
YesNoDon’t Know
22%
48%
30%
2_12_HealthSMR_Batch2_D11_PremiumRent_#01
Average Rent Premium: 1.9%
TH
E D
RIV
E T
OW
AR
D H
EA
LTH
IER
BU
ILD
ING
S 2
016:
TA
CT
ICA
L IN
TE
LLIG
EN
CE
TO
TR
AN
SF
OR
M B
UIL
DIN
G D
ES
IGN
AN
D C
ON
ST
RU
CT
ION
DA
TA point gap is strong evidence that market forces in Canada are currently making a more compelling case for healthier buildings compared with the U.S.
Impact on the Ability to Charge a Premium RentU.S. owners are less optimistic about whether healthier buildings can command a premium rent, compared with equivalent traditional buildings. While the percentage who don’t know (48%) is still relatively high, those who believe they cannot charge a premium rent (30% of all respondents) account for more than half (59%) of the remainder of respondents.
Even among those who believe a premium rent is possible, the average increase is a modest 1.9%.
This �nding corresponds with the observations of the expert in-depth owner interviews, where most �nd that a focus on health may help them keep tenants but will not allow them to charge a higher rent than other buildings in the same class.
Canadian owners are even less optimistic than U.S. owners about the ability to charge premium rents for healthier buildings. The percentage of those who are uncertain is 18 points lower, but nearly two thirds of those who remain believe that they cannot get a higher rent.
Impact on Building ValueU.S. owners are most uncertain about the impact of their healthier building investments on the value of their buildings, with 58% reporting that they do not know what the impact is. This degree of uncertainty is not surprising,
Benefits and MetricsFinancial Impacts of Healthier Buildings CONTINUED
given how recently building health impacts have been considered separately from other green building measures. Isolating this impact is more challenging than looking at the overall impact on building value of certi�cation by a green building certi�cation system.
However, among those who feel more certain about the in�uence of healthier building features on building value, a much higher percentage see a positive impact than those who see no difference or a negative in�uence. The highest percentage of those who see a positive in�uence believe that it helps the building hold its value better. This may re�ect growing awareness in the marketplace of the importance of building health impacts and concerns that, especially for buildings at the high end of the market, being able to show that the building contains healthier features may be necessary to remain competitive.
Canadian owners are also optimistic about healthier buildings having high values, similar to the U.S. owners. However, they are more certain about the impact of this factor; Canadian owners who report that they don’t know the impact are 11 percentage points fewer than U.S. owners. Also, and more tellingly, the highest percentage of Canadian owners who report a positive impact say that they see an increase in value of 7% or more, while those reporting a similar increase make up the smallest share of positive responses from the U.S. Greater certainty and the ability to achieve higher building values for these buildings are strong factors driving the Canada market, while the U.S. market appears to lag behind in these areas.
Dodge Data & Analytics 35 www.construction.com SmartMarket Report
Dodge Data & Analytics, 2016
Positive ImpactNo ImpactNegative ImpactDon't Know
26%
15%58%
1%
2_10_HealthSMR_Batch2_D9_BuildingValue_#01
9%
Increase of1% to 6%
Increase of7% or More
5%
BuildingRetainsValue Better
12%
Impact of Healthier Building Investments Degree of ImpactAverage Increase: 2.5%
Impact of Healthier Building Investments on the Value of the Building(According to U.S. Owners)
TH
E D
RIV
E T
OW
AR
D H
EA
LTH
IER
BU
ILD
ING
S 2
016:
TA
CT
ICA
L IN
TE
LLIG
EN
CE
TO
TR
AN
SF
OR
M B
UIL
DIN
G D
ES
IGN
AN
D C
ON
ST
RU
CT
ION
DA
TA Owners were asked to rank the top three bene�ts from a list of 10 bene�ts that would deliver the greatest ROI if they could be demonstrated to be linked to healthier building investments. U.S. owners (57%) most frequently rank improved employee satisfaction among the top three bene�ts. This is an important �nding because engagement surveys can establish the link between healthier buildings and improved employee satisfaction and engagement. However, owners need to make the commitment to conduct these measurements.
It is telling that improved employee satisfaction is ranked higher by more respondents than greater occupant productivity (38%). The arguments for making healthier buildings to improve productivity have long been considered critical because of the high percentage of company costs that most U.S. companies dedicate to the workforce. However, employee satisfaction can also have �nancial implications through improved employee retention and the ability to attract new talent.
Other personnel-related factors, including lower absenteeism and improved employee engagement, rank higher among U.S. owners than bene�ts related to the building itself, such as improved asset value. This is markedly different from the �ndings from Canada, where this and other building factors, such as increased rent and the ability to lease space more quickly, ranked higher than the personnel-related factors. However, this is likely due to the distribution of owners who responded in the U.S. compared with the owners in Canada. In the U.S., 71% of the owners occupied the buildings they own, but only 45% of Canadian owners fall in this category. In addition, a higher percentage of the Canadian owners are developers (34%) than the U.S. respondents (14%). Canada also had a higher percentage of respondents from REITs (11%) than the U.S. (2%).
While this may not entirely account for the differences in other parts of the study, it does explain why Canadian owners �nd a greater return on investment from increased asset value, the ability to lease space quickly and increased rent, compared with owners from the U.S. However, despite the different owner pro�les, these �ndings do contribute to the overall trend for owners in Canada to regard healthier buildings as an important competitive advantage, far more than owners in the U.S.
Benefits and Metrics CONTINUED
Variation by Level of Green InvolvementA higher percentage of U.S. owners (23%) with a high level of green involvement (more than 60% green projects) rank the ability to lease space more quickly as one of the top three bene�ts that would offer a better return on investment than those doing 15% or fewer green projects (4%). This gap is likely due to owner experience with the impact of having a green building on their ability to lease spaces.
However, it is interesting that no statistically signi�cant difference exists in the expectation of increased building value or higher rents between these two groups. This may be due to the relatively soft nature of metrics around health right now. Factors like improved employee satisfaction are likely to directly impact leasing, but they are less likely to in�uence the value of the building or even the rent that can be charged.
SmartMarket Report Dodge Data & Analytics 36 www.construction.com
Bene�ts of Healthier Buildings That Would Deliver the Greatest ROI
Bene�ts That Would Deliver the Best Return on Investment (According to U.S. Owners)
2_08_HealthSMR_Batch2_D12_BestROI_#01
Dodge Data & Analytics, 2016
57%
Improved Employee Satisfaction
38%
Greater Occupant Productivity
37%
Lower Absenteeism
Improved EmployeeEngagement
28%
Improved Ability toAttract Talent
27%
21%
Increased Building Value
21%
Reduced Healthcare Costs
TH
E D
RIV
E T
OW
AR
D H
EA
LTH
IER
BU
ILD
ING
S 2
016:
TA
CT
ICA
L IN
TE
LLIG
EN
CE
TO
TR
AN
SF
OR
M B
UIL
DIN
G D
ES
IGN
AN
D C
ON
ST
RU
CT
ION
Building Technologies That Support Positive Health Impacts
From early design to post-occupancy, a mix of new technologies along with new applications of existing technologies is helping the drive toward healthier buildings.
Dodge Data & Analytics 37 www.construction.com SmartMarket Report
Sidebar: Technology
Designers, contractors and owners have more tools available to them today that are better
at monitoring and analyzing the performance of buildings, says Lisa Bate, regional managing principal, North America, for B+H Architects, Toronto. “From my perspective, the return on investment component of green buildings is starting to get proven,” she said. “Where we’re really making strides now is in the data and proof in promoting healthier and more productive buildings that we live, work and play in.”
Improving Air QualityOn several projects, including B+H’s Shanghai of�ce, the �rm uses an app called Qlear, which offers cloud-based solutions for monitoring the performance of interior spaces. Using sensors installed in a building, Bate says the system can facilitate monitoring of energy use, air quality, sound, light and motion. For example, she says the �rm typically uses Qlear to track CO2
levels, �ne particulate matter (PM2.5) levels, air temperature, relative humidity and VOCs in spaces.
“I look at our of�ce in Shanghai, for example, and I see that PM2.5 is terrible outside, but PM2.5 is good inside,” she says. “But I also see that CO2 is through the roof because the landlord has turned off the fresh air intake. We can call the landlord and tell them that our system is �tted with amazing �lters, so please turn
on the fresh air intake.”The �rm can also better calculate
future performance in the buildings it designs. Bate says the �rm couples data gleaned from Qlear with its global database of materials—populated by suppliers—that it uses for speci�cations. The database is third-party veri�ed through the China-based organization Green Idea, Green Actions. For example, a VOC calculator can access its materials database to help predict the potential impact of off-gassing.
“A client in Asia that we were working with used to leave (new or renovated) buildings empty for six months for a �ush-out period,” she said. “What we found is by using QLEAR and by accessing the data that comes to us from suppliers, we could analyze a building and tell them that two weeks or 10 years would be the same for off-gassing. We saved them �ve and a half months of rent.”
Replicating NatureTechnology can also help designers apply biophilic concepts to buildings. Although biophilic design promotes connection with nature—such as daylighting, natural materials and water features—technology can help facilitate and replicate those effects. For example, Bill Browning, founding partner of Terrapin Bright Green, New York, says controls within mechanical systems can be used to vary air�ow, just like in nature. “There are buildings in Japan where, every
now and then, a breeze will come through the space,” he says. “That breeze is not from a window, but generated by controls within the mechanical system.”
Browning also says research in psychoacoustics could lead to the use of sound systems for masking the din of an of�ce. “What researchers are �nding is that the sound of moving water is very effective, so there are folks playing around with using the sound of water for noise cancellation,” he says.
Nancy Clanton, president of Clanton & Associates, Boulder, Colo., sees potential in advances in LED lighting technology to make spaces healthier. “We are able to do things with solid-state lighting that we could never do with legacy systems,” she says. “We can change color, reduce glare and get better distribution. And control systems love LEDs.”
For example, LEDs could help interior lighting match up better with human circadian rhythms. “During the day, we’re okay with higher color temperature, but at night our preference is lower color temperature,” she says. “There’s a big push in interior lighting to do color-tuning. Right now, it’s generation one, where they take two white LEDs—one cool and one warm—and blend them. It’s fooling the eye. But generation two will be the actual spectrum. The technology is de�nitely there, and the control systems are there, but it hasn’t been applied to architectural lighting yet. That’s coming in the future.” n
TH
E D
RIV
E T
OW
AR
D H
EA
LTH
IER
BU
ILD
ING
S 2
016:
TA
CT
ICA
L IN
TE
LLIG
EN
CE
TO
TR
AN
SF
OR
M B
UIL
DIN
G D
ES
IGN
AN
D C
ON
ST
RU
CT
ION In recent years, TD Centre
in Toronto has served as a proving ground for design and construction standards. As part
of a multiyear modernization effort, TD Bank Group has renovated 50 individual �oors, updating its design standards with each new project. For its �nal modernization project at TD Centre, the company helped set worldwide standards with the �rst project to achieve WELL certi�cation. TD23—located on the 23rd �oor of a 56-�oor tower—met WELL Certi�ed Gold requirements through a unique set of design, construction and occupant well-being efforts.
As the �rst project of its kind, building out the 25,826-sq-ft �oor presented both challenges and bene�ts, says Martha MacInnis, design director in Enterprise Real Estate at TD Bank Group. “There were no precedents, so we got to blaze the path,” she says. “We have seen updates to WELL [Building Standards] that were probably a result of the back and forth we had to clarify requirements. It was cool to see it evolve.”
Delivering a �rst-of-its-kind project required a highly engaged project team. The TD23 team was comprised of internal TD architecture and design staff, project management, facilities maintenance and client relationship management representatives, along with the project team members listed on the opposite page. “All parties are very familiar with TD design standards and the speci�c location of the project, which was extremely helpful when performing the gap analysis of TD’s standards versus WELL requirements and also understanding the technical details and challenges of working within the
building,” MacInnis says.HOK designed TD21, which
achieved LEED Platinum certi�cation and helped establish several current TD design standards. Genny Rose, senior project manager at HOK, says the team was able to compare its designs for TD23 with those established on TD21.
“We used that as a jumping off point and compared LEED to WELL to see where we had to increase the level of documentation or speci�cation of product and ensure we met the WELL Standard,” she says. “Some things were higher and some lower.”
The �oor’s design follows the same basic look and feel of other TD Centre �oors, but with wellness enhancements. Craig Smith, project manager at Claybar Construction, says that �nishes and furnishings match TD standards used on other �oors that Claybar has worked on, but with greater focus on reducing VOCs. “Our paints were even lower
VOC than what’s required in the building,” he says. “The mastics for the �oor were green. Everything that is behind the scenes to make it look the same was very different.”
Four Areas of FocusTo meet WELL preconditions and the 25 optimization features required for Gold certi�cation, the team focused on four key areas—improved air and water quality; offering �tness opportunities to enhance worker well-being; providing healthy snacks; and increasing wellness awareness.
To encourage hydration throughout the workday, sink locations and dedicated drinking water stations are located every 100 feet within the of�ce. An enhanced water �ltration system, which features UV and carbon �ltration technology, ensures that dissolved mineral concentrations meet WELL requirements.
In order to meet air quality standards for WELL, TD worked with
case st
udy
Proving Ground for Healthier Of�ce DesignTD Centre 23rd Floor Renovation
TORONTO, CANADA
SmartMarket Report Dodge Data & Analytics 38 www.construction.com
CONTINUED
Spaces at TD23 were designed to enhance
occupant health and well-being.
Pho
togr
aphs
cou
rtes
y of
TD
Ban
k
case st
udyT
HE
DR
IVE
TO
WA
RD
HE
ALT
HIE
R B
UIL
DIN
GS
201
6: T
AC
TIC
AL
INT
ELL
IGE
NC
E T
O T
RA
NS
FO
RM
BU
ILD
ING
DE
SIG
N A
ND
CO
NS
TR
UC
TIO
N
Dodge Data & Analytics 39 www.construction.com SmartMarket Report
Cadillac Fairview to install carbon �ltration in the building’s HVAC system. The �lters reduced levels of harmful chemicals, such as VOCs, in the air. The �ltration was installed to the base building system, so its efforts may also improve air quality on additional �oors within the building.
Although standing workspaces are available on other �oors at TD Centre, there are more of them on TD23 than other �oors in order to encourage workplace movement. At any given time, 30% of the space’s occupants may be using a standing desk. The changes in workstation style, combined with lighting strategies, help support more natural daylight for all occupants.
The overall layout of the �oor is very similar to other TD Centre �oors, with some exceptions. The �oor is divided into neighborhoods with 10 to 30 workstations in each one, Rose says. Each neighborhood has a hub with a variety of meeting spaces, including conference rooms, huddle rooms and one-on-one coaching rooms.
One unique space designed to meet WELL requirements is the tranquillity lounge. “It allows staff to go into a quiet space where there are no computers and there are lower light levels,” she says. “There are different types of seating—sectionals, recliners, pillows, stools—that allow the individual to go in and take a moment to sit quietly.”
Constructing these spaces to WELL standards required higher levels of storage and cleaning by crews, Smith says. All vacuums were out�tted with HEPA �lters and air scrubbers were used to circulate clean air through the work areas.
Isolated storage areas were also built for items such as furniture, carpet, fabrics and ceiling tiles. “We had air scrubbers in the storage areas to keep dust from settling into the products themselves,” he says. “Everything had to be wrapped and if we opened an item, it had to be rewrapped.”
Post OccupancyMuch of the team’s efforts focus on post-occupancy wellness programs. Employees are provided incentives such as gym and �tness studio discounts, public transportation bene�ts, bike share discounts and a list of recommended free health tracking apps. They are also given healthy food options.
TD also designated several employees as WELL Champions. Since occupying the �oor, the group has scheduled a health fair and ongoing wellness lectures from healthcare professionals to further expose employees to opportunities to improve their well-being.
TD opted to undertake preliminary environmental testing before certi�cation that included air and water quality performance testing as well as measuring light and acoustic parameters. MacInnis says the benchmark testing was instrumental in understanding potential gaps.
Costs and Bene�tsMacInnis says the cost of TD23 was roughly 9% higher compared with similar �oors in the building. Of that escalation, MacInnis says about 5% is attributed to fees and other soft costs. Furniture is less than 2%, and construction is less than 2%.
Through its WELL certi�cation efforts, MacInnis says TD sees
the potential for reduction in healthcare claims, increases in productivity and enhanced employee engagement. TD also anticipates that costs will come down on future projects that pursue WELL with the evolution of its corporate design standards and increased knowledge of the WELL Building Standard and certi�cation process. “We have implemented both corporate and retail WELL pilots in our portfolio and will be performing pre- and post-occupancy surveys to determine the impact of WELL certi�cation in an effort to inform a more comprehensive corporate strategy for WELL,” she says. n
TD Centre 23rd Floor Renovation TORONTO, CANADA
Project Facts and Figures
ProjectOf�ce Renovation
Area25,826 Sq Ft
CompletedSeptember 2015
Project OwnerTD Bank
Landlord/ Building OwnerCadillac Fairview
Landlord RepresentativeJLL
Project ArchitectHOK
EngineerHH Angus & Associates
ContractorsMarant Claybar Construction
ConsultantsBGIS Delos
WELL Certi�cationGold
stats
CONTINUED
SmartMarket Report Dodge Data & Analytics 40 www.construction.com
TH
E D
RIV
E T
OW
AR
D H
EA
LTH
IER
BU
ILD
ING
S 2
016:
TA
CT
ICA
L IN
TE
LLIG
EN
CE
TO
TR
AN
SF
OR
M B
UIL
DIN
G D
ES
IGN
AN
D C
ON
ST
RU
CT
ION
DA
TA Building owners were asked to select among a list of possible goals that they are seeking to achieve when using healthier building products and practices. Architects, interior designers and contractors were presented with the same list, but they were asked to select the goals that their clients want to achieve. This approach reveals important differences between how owners prioritize their goals and how the design and construction teams perceive that they do. The �ndings expose several points where additional communication between owners and their project teams would be bene�cial.
Goals Identi�ed by Most OwnersThree quarters of owners seek to improve tenant or employee experience and increase satisfaction with the building when they invest in healthier building products and practice, through the following two goals:
■ Improved Tenant/Employee Satisfaction With the Building: Architects recognize the importance of this goal to owners, but contractors and especially interior designers underestimate owner interest in improving tenant/employee satisfaction with the building.
■ Happier and Healthier Building Occupants: Architects and interior designers both recognize that happier and healthier building occupants are important to owners, but a much smaller percentage of contractors make that connection.
Additional Goals Identi�ed by 50%or More of OwnersNearly two thirds of owners (64%) use healthier building products and practices to improve productivity. Even though few are able to measure the speci�c productivity increases they experience (see page 28), most owners believe that their health investments increase productivity. Interior designers notably underestimate the importance of this goal to owners.
However, more than half of the owners are also motivated by a sense of professional duty and responsibility. Only about one third or less of the other project team members, though, report professional duty and responsibility to be a goal that their clients are trying to achieve. This disparity suggests that the design and construction industry underestimates the importance of this goal to owners.
Owner Goals for Their Investments In Healthier Buildings
Drivers and ObstaclesData:
Owner Goals for Healthier Buildings(According to Owners, Architects, Interior Designers and Contractors)
2_13_HealthSMR_Batch2_B4_OwnerGoals_US_#01
Dodge Data & Analytics, 2016
Improved Tenant/ Employee Satisfaction With Building
Happier and Healthier Building Occupants
Improved Financial Bene�t Due to Greater Occupant Productivity
Ful�lling Professional Duty
Compliance With Core Values/CSR Policies
Meeting Demand From Building Occupants (employees, tenants, students, customers)
BrandImprovement
ContractorsInteriorDesignersArchitectsOwners
ContractorsInteriorDesignersArchitectsOwners
ContractorsInteriorDesignersArchitectsOwners
Goals Selected by 75% ofOwners or More
Percentage That Believe Their ClientsWant to Achieve These Goals
Goals Selected by 50% to74% of Owners
Percentage That Believe Their ClientsWant to Achieve These Goals
Goals Selected by LessThan 50% of Owners
Percentage That Believe Their ClientsWant to Achieve These Goals
68% 75%
75%
64%
51%
43%
43%
41%
40% 51%
62% 75% 47%
58% 38% 51%
34% 21% 31%
52% 40% 46%
42% 19% 36%
44% 31% 38%
TH
E D
RIV
E T
OW
AR
D H
EA
LTH
IER
BU
ILD
ING
S 2
016:
TA
CT
ICA
L IN
TE
LLIG
EN
CE
TO
TR
AN
SF
OR
M B
UIL
DIN
G D
ES
IGN
AN
D C
ON
ST
RU
CT
ION
DA
TA Additional Disparities Between Owners and Other PlayersArchitects overestimate the importance of compliance with core values/corporate social responsibility (CSR) as a goal for owners. In fact, this is the only goal selected by a higher percentage of another player than the percentage of owners who consider it important.
Even though it is selected by less than half of owners, interior designers still notably underestimate the importance of meeting demand from building occupants as an owner goal.
Drivers and ObstaclesOwner Goals for Their Investments In Healthier Buildings CONTINUED
Variation by CountryThe only signi�cant difference between U.S. and Canadian owners in terms of the goals they want to achieve is that far more Canadian owners (60%) are seeking brand improvement/value from their investments in healthier buildings than U.S. owners (41%). Again, this suggests that competitive pressure to have healthier buildings in their portfolio is a notable factor driving many owners in Canada, but that the same level of urgency is currently not found in the U.S.
Dodge Data & Analytics 41 www.construction.com SmartMarket Report
Owners, architects, interior designers and contractors were asked to rank the top three from 13 potential drivers to increase focus on the health of building occupants during the design and construction process. The smaller number in italics in the table on page 42 lists the percentage who rank each driver �rst, second or third. The number in bold shows how those percentages are ranked against each other for each player, with a potential ranking of 1 to 13. Two conclusions can be drawn from these �ndings:■ Five top drivers are relatively in�uential for all players.■ The degree of in�uence of each driver varies by player.
This suggests that those seeking to encourage more focus on healthier buildings during the design and construction process can focus on �ve key drivers, but that different drivers may be more effective with different players. Therefore, analysis below will be conducted by player, focusing primarily on the drivers that in�uence each player the most.
OwnersThe most important driver for owners is having access to more data, both on the speci�c practices to use in order to positively impact health and on the impact of those practices on productivity. Owners are clearly interested in basic information on how to enhance
Top Drivers Encouraging Focus on Occupant HealthDuring Design and Construction
health and on making the business case for those investments. Productivity is particularly important to that business case because even small productivity improvements can have profound �nancial implications for most owners.
In addition, owners regard government incentives as an important driver, again likely due to their impact on making an effective business case for health impacts.
U.S. owners are even more data driven than their Canadian counterparts.
• A significantly higher percentage of U.S. owners (40%) rank data on productivity impacts in their top three than do Canadian owners (21%).
• Likewise, U.S. owners (26%) are more likely to rank data on product impacts on health as a top-three driver than those in Canada (11%).
Architects and Interior DesignersAt least half of architects and interior designers rank public awareness of building health impacts among their top three drivers. Public awareness is not only the top driver for both, but it also leads the next most important driver by 13 percentage points or more. Clearly, architects and interior designers believe wider general recognition will drive owners to recognize the importance of making these investments.
TH
E D
RIV
E T
OW
AR
D H
EA
LTH
IER
BU
ILD
ING
S 2
016:
TA
CT
ICA
L IN
TE
LLIG
EN
CE
TO
TR
AN
SF
OR
M B
UIL
DIN
G D
ES
IGN
AN
D C
ON
ST
RU
CT
ION
DA
TADrivers and ObstaclesTop Drivers Encouraging Focus on Occupant Health During Design and Construction CONTINUED
More data on design and construction practices that positively impact health is also an important driver for architects and interior designers. No doubt, they see this as critical to their own practices, but also to help clients determine the best strategies to take.
However, while owner demand is the second most in�uential driver for architects, with over one third (37%) ranking it among their top three, a lower percentage of interior designers (29%) consider this in�uential. Instead, designers see data on productivity impacts and the health impacts of building products as critical. In fact, it is surprising how few U.S. architects rank data about the impacts of building products in their top three, with seven other factors considered more in�uential.
ContractorsNearly half of contractors (46%) rank two factors among the top three drivers: owner demand and government incentives. Owner demand is commonly a top driver for contractors in many sustainability studies conducted since 2006 by Dodge Data & Analytics. However, the fact that government incentives rank equally with owner demand is notable, because it suggests that contractors might pursue investments in healthier buildings if they can identify �nancial incentives to do so, either for themselves or for their clients.
Like design professionals, they also regard greater public awareness of building impacts on health as a critical driver moving forward, with 40% reporting that this is a top three driver.
Contractors are more interested in some kinds of data than others. The percentage of contractors that rank data on productivity improvements as important is roughly equivalent to that of architects and interior designers, but all three do not rank it as highly as owners. On the other hand, contractors lag considerably behind the other players in terms of the importance they place on research on design and construction practices that positively impact health as an important driver in the industry.
SmartMarket Report Dodge Data & Analytics 42 www.construction.com
Drivers Encouraging Focus on Healthier Buildings (Overall Rankings Based on Percentage of U.S. Respondents Who Ranked Them in the Top Three)Dodge Data & Analytics, 2016
InteriorDesigners ContractorsOwners Architects
2_14_HealthSMR_Batch2_C1_Drivers_#01
#1
42%
#2
40%
#3
36%
#4
31%
n/a
#6
26%
#3
35%
#4 (tie)
30%
#4 (tie)
30%
#1
50%
#2
37%
#7
23%
#2
42%
#3
31%
#4
29%
#1
58%
#4 (tie)
29%
#3 (tie)
31%
#6
26%
#3
29%
#1 (tie)
46%
#2
40%
#1 (tie)
46%
#7
17%
More Research on the Health Impact of Building Products
Owner Demand
Greater Public Awareness of Health Impacts of Buildings
Government Incentives
More Research on Productivity Impacts
More Research on Design/Construction Approaches That Can Positively Impact Health
TH
E D
RIV
E T
OW
AR
D H
EA
LTH
IER
BU
ILD
ING
S 2
016:
TA
CT
ICA
L IN
TE
LLIG
EN
CE
TO
TR
AN
SF
OR
M B
UIL
DIN
G D
ES
IGN
AN
D C
ON
ST
RU
CT
ION
DA
TA Owners, architects, interior designers and contractors were asked to rank the top three of 13 potential challenges to incorporating occupant health in the design and construction process. The smaller number in italics in the table at right lists the percentage who rank each driver �rst, second or third. The number in bold shows how those percentages are ranked against each other for each player, with a potential ranking of 1 to 13.
In general, there is greater agreement among all players on the top challenges than there was on the key drivers for increased consideration of occupant health during design and construction (see pages 41 and 42).
■ All of the players consider budget concerns to be the biggest challenge. Not only is that the top challenge for each player, but at least three quarters of them all ranked it in their top three. However, as one of the expert owners who participated in the in-depth interviews (see page 45) said, if you can make a good business case based on productivity or �nancial measurements, budget challenges are less of a concern. The Dodge Data & Analytics research on green building since 2006 has supported that assertion, with concerns about higher �rst costs as an obstacle decreasing in most cases as the business bene�ts of green became clearer.
■ Lack of client interest is a signi�cant challenge reported by architects, interior designers and contractors. This is probably at least in part why a high percentage of each of these players also believes that greater public awareness of building health impacts is a critical driver for greater attention on health (see pages 41 and 42).
■ Owners and contractors are particularly concerned about the need to prioritize other items over health impacts, such as energy ef�ciency. It is possible for strategies that enhance health, such as increased access to fresh air, to have a negative impact on energy savings. Those doing a high level of green projects (35%) are more concerned about balancing these priorities than those doing few green projects (22%). A few of the owners who participated in the in-depth interviews recognize the challenge, but they regard it as a question of �nding the appropriate balance rather than prioritizing one over the other (see page 45).
■ Concern about the business case is shared by all players, but especially owners. A good business case can help address budget concerns, lack of client interest and competing priorities, and likewise, an unclear business case will exacerbate the other challenges. This
Drivers and Obstacles CONTINUED
is also considered a challenge by 39% of those doing a high level of green work, compared with 25% of those doing few green projects.
■ The greatest difference among the most common challenges is that interior designers are far more concerned about the obstacle presented by contractor and/or owner lack of expertise than architects are. Over half (54%) of interior designers consider this a challenge, compared with less than one third (32%) of architects. This concern may explain why so few interior designers consider owner demand to be a major driver (see page 42).
Dodge Data & Analytics 43 www.construction.com SmartMarket Report
Top Challenges to Incorporating Occupant Health In the Design and Construction Process
Challenges to Incorporating Occupant Health in the Design and Construction Process (Overall Rankings Based on Percentage of U.S. Respondents Who Ranked Them in the Top Three)Dodge Data & Analytics, 2016
InteriorDesigners ContractorsOwners Architects
2_15_HealthSMR_Batch2_C2_Obstacles_#01
#1
78%
#2
46%
#3
40%
n/a
n/a
#1
75%
#4
26%
#3
32%
#2
55%
#3 (tie)
32%
#1
75%
#10
2%
#4
25%
#3
52%
#2
54%
#1
79%
#3
33%
#4
32%
#2
44%
n/a
Lack of Client Interest
Unclear Business Case for Prioritizing Health and Well-Being
Need to Prioritize Other Items (such as energy performance)
Budget Concerns
Contractor and/or Owner Lack of Expertise
TH
E D
RIV
E T
OW
AR
D H
EA
LTH
IER
BU
ILD
ING
S 2
016:
TA
CT
ICA
L IN
TE
LLIG
EN
CE
TO
TR
AN
SF
OR
M B
UIL
DIN
G D
ES
IGN
AN
D C
ON
ST
RU
CT
ION
Unlike certi�cation programs such as LEED or the WELL Building Standard,
which take effect at the project scale, GRESB’s unit of assessment is the organization. Its focus on business strategy, management practices and performance at the organizational level complements and aggregates project-level initiatives.
“We recognize that health and well-being have been emerging as an important source of value creation and also an important source of risk management among our major participants,” says Chris Pyke, GRESB’s chief operating of�cer. “Our goal was to put some new metrics in the �eld to better inform investors, companies and funds about what constitutes leadership in the market today.”
Health ModuleGRESB’s new health and well-being module, which for now is an optional supplement to the main GRESB assessment, comprises 10 questions focusing on four areas: whether a real estate company or fund has assigned leadership to the health and well-being initiative, has developed clear policies and clear direction, understands its needs, and is taking concrete action and monitoring relevant outcomes. Programs under assessment are separated according to which constituency they serve—employees or tenants and/or customers—to allow investors,
What Makes a Healthier Portfolio? GRESB’s New Health and Well-Being Module Aims to Find Out
Since 2009, the Global Real Estate Sustainability Benchmark (GRESB) has been assessing the environmental, social and governance (ESG) performance of property companies, fund managers and developers worldwide. This year, for the �rst time, GRESB included a module focused on health and well-being.
SmartMarket Report Dodge Data & Analytics 44 www.construction.com
Sidebar: Healthier Portfolio
funds and companies to distinguish between actions that support internal operations and those that create value for others.
One of the �rms participating in the module is Kilroy Realty, a West Coast commercial real estate �rm whose portfolio contains more than 14 million square feet of property from San Diego to Seattle. “We see health as something that the market is really beginning to care about,” says Sara Neff, senior vice president with responsibility for sustainability at Kilroy. “As in all aspects of our sustainability program, we want to demonstrate leadership.”
Kilroy’s health and well-being initiatives stem primarily from its ongoing engagement with LEED—and such health-promoting credits as indoor air quality, operable windows, daylight and views, and thermal comfort—and are evolving to include priorities identi�ed in the WELL Building Standard, such as accessible, inviting stairs and onsite �tness facilities. Kilroy has also conducted air testing on a number of its buildings, and is exploring ways to expand the initiative. As well as tallying these self-explanatory wellness initiatives, the new GRESB module has raised Kilroy’s awareness of the health impacts of its participation in community programs such as tree planting, blood drives, food drives and Earth Day events.
What It Means for CompaniesThe GRESB Health and Well-being Module for the real estate sector, “signals to investors that health is another parameter they should be looking at when they’re evaluating the sustainability of a company,” according to Neff. Compared with the environmental bene�ts of green building, the health bene�ts are more tangible, she says, and imply the potential for “even more increased leasing and reduced [vacancies].”
No change without challenge, though, and, for Kilroy, synthesizing a cross-company program from the disparate departments that are working on employee and tenant health initiatives takes a bit of work. “What we’re struggling with is capacity,” says Neff. “Sustainability people are already stretched pretty thin, especially as reporting requirements get more rigorous and more varied. Figuring out how to do all the base programs in addition to focusing on health is something that we’re all trying to wrap our brains around.”
This �rst year, about 10% of GRESB’s 700-plus participants (who together represent more than 61,000 properties with an asset value of $2.3 trillion), have tackled the new module. GRESB is anticipating an uptick in years to come; in the meantime, says Pyke, “we think that’s pretty indicative of where the issue is right now.” Results from the module will be available in September. n
TH
E D
RIV
E T
OW
AR
D H
EA
LTH
IER
BU
ILD
ING
S 2
016:
TA
CT
ICA
L IN
TE
LLIG
EN
CE
TO
TR
AN
SF
OR
M B
UIL
DIN
G D
ES
IGN
AN
D C
ON
ST
RU
CT
ION
DA
TA
Owner Insights
Owner Insights On Investing in Healthier Buildings
Dodge Data & Analytics conducted a series of 13 in-depth interviews with executives from building owners, developers, operators and advisors from the U.S. and Canada who are leading the industry in their efforts to address the impacts of their buildings on occupant health and well-being.
Data:
Dodge Data & Analytics 45 www.construction.com SmartMarket Report
The best way to increase investment in healthier buildings is to understand what leaders in the market
are doing, what they perceive to be the drivers for greater investment, what obstacles they are concerned about, and what metrics and bene�ts they are seeing.
Therefore, Dodge Data & Analytics interviewed decision-makers at 13 companies that own, invest in, advise about or manage buildings. Six of the companies are based in the U.S. and seven in Canada. While the participants in these con�dential interviews cover a wide range of roles and responsibilities, for simplicity’s sake, all are referred to generically as owners in the analysis, unless their speci�c role provides an important context for the insights they shared.
Current Efforts to Address Health and Well-BeingThe 13 owners included in the study have implemented a wide range of healthier building design and construction practices so far, with a few common themes appearing in many of the responses.■ Several owners have implemented
healthier building practices to improve tenant satisfaction or meet the requirements of green building rather than speci�cally to impact health and well-being. This is an indication of the relatively recent focus on health
and well-being impact as a separate building attribute.
■ Building Certi�cation systems are important to the efforts of most owners. Several report that they are still in the phase of examining the WELL building certi�cation system to either determine if they want to implement it widely in their own buildings or create their own internal standards based on it. Other in�uential certi�cation systems mentioned include LEED and BOMA Best.
■ Improved air quality is mentioned by most owners who report doing speci�c building design or operational strategies to improve health. As one owner points out, there is quantitative evidence that “if you change the air quality, you will create better outcomes,” but they have not seen similar evidence for other health-related improvements, such as better water quality or opportunities for increased physical activity. Also, the owners of commercial real estate properties who participated pointed out that food and water are often under the control of tenants, but that air quality is an area that they can directly impact.
■ The types of strategies used to address building impact on health varied by type of owner. Many commercial real estate owners noted that they are limited in terms of the speci�c strategies available to them. Two of the companies involved in direct building
operations regard communications of their building and programmatic features that enhance health as their most critical strategy. The owners of healthcare and multifamily buildings noted their improvements to acoustics, and the multifamily building owner also noted that water �ltration was an important feature that their tenants care about.
Drivers for Investment in Healthier BuildingsThere is some agreement among the owners about the top drivers for increased investment in healthier buildings. However, the degree of in�uence of some drivers is impacted by the type of respondent: commercial real estate owners and advisors tend to be motivated differently from owner-occupiers and operators.
BETTER DATA ON OUTCOMESSeveral owners agree that better data is needed to drive increased investment in healthier buildings by their companies and clients. While many feel satis�ed with the data available on the impact of improved air quality and lighting, many feel that other healthy building features, such as spaces that encourage physical activity, suffer from a lack of clear quanti�able evidence that can be used with tenants and clients as the basis for the return on investment they can expect.
At least one owner clari�es, though, actionable data that can
TH
E D
RIV
E T
OW
AR
D H
EA
LTH
IER
BU
ILD
ING
S 2
016:
TA
CT
ICA
L IN
TE
LLIG
EN
CE
TO
TR
AN
SF
OR
M B
UIL
DIN
G D
ES
IGN
AN
D C
ON
ST
RU
CT
ION
DA
TA support a clear business plan or be quickly explained to prospective tenants is what is really needed. “We don’t need a peer-review study by 17 scientists, but I need something good enough to be able to say, ‘Here’s a direct linkage.’ It doesn’t have to happen every day in every of�ce ... [I need] broad evidence to suggest there are speci�c outcomes of productivity and [reduced] absenteeism.”
MARKET DIFFERENTIATIONAmong a list of eight potential drivers for investment that owners were asked to rate in terms of their in�uence on increasing their company’s investment in healthier buildings, market differentiation is the only one with high ratings by 11 out of the 13 owners. It was selected by owners involved in commercial real estate who need to compete for tenants, but it was also selected by the owner of healthcare buildings who need to compete for patients and staff.
Even one of the two owners who only ranked this as moderately in�uential points out its role in their decisions, “It is all [about] the business case. If we can demonstrate [that healthier buildings investments are] a differentiator, it brings more value to the case.” Another states emphatically, “If we can lease our space faster and at higher rents, and that is because we’re differentiating ourselves in the market, then it is worth every penny and [a great deal] more.”
BUILDING ASSET VALUEThis factor is particularly important to those directly involved in commercial real estate and less important to owner-occupiers.
SmartMarket Report Dodge Data & Analytics 46 www.construction.com
Data Sidebar: Owner Insights CONTINUED
Many believe that higher asset values are not only in�uential in their own companies but are most likely to move the market. As one owner states, “There’s a whole lot of people in the company who are all about doing the right thing, but at the end of the day, there are shareholders whom we all report to ... And every single time we talk about this, people ask, ‘What is the return on investment, what am I going to get out it, and why am I doing it?’ The soft rationale of why people should do it, they understand, but the question always comes down to ‘What is the �nancial incentive and how is it going to set me apart?” Because at the end of the day, unless you have a very, very inspired leader, it’s about money.”
Another owner points out that market differentiation and increased building asset value are related drivers: “Market differentiation leads to higher asset value. Higher asset value is related to demand for the buildings.”
TENANT DEMANDThe Canadian owners believe that tenant demand will need to be a critical driver in the future, even though many are not seeing strong tenant demand right now. None of the U.S. owners interviewed refer speci�cally to tenant demand as a critical driver. This difference is also re�ected in the �ndings of the quantitative study in this report, where market demand is much more in�uential in Canada than in the U.S.
This is not an indication that U.S. owners do not care about tenant demand. Instead, it suggests that the U.S. market is lagging slightly behind the Canadian one in terms
of awareness of building impacts on health and well-being in the marketplace. Even though demand in Canada has been limited to major public owners, there is enough for them to see the potential of increased tenant demand in the future. In the U.S., a tenant advisor is blunt in asserting that tenants do not understand it, so increasing their awareness and that of building owners is the essential �rst step.
With little direct demand in the marketplace now, a few U.S. and Canadian owners state that providing healthier buildings for their tenants that may offer greater productivity is part of their mandate as a building owner and is therefore driving their investments. As one states, “We run Class A of�ce buildings, and we want to be the top of the market in every market we are in. So if the evidence shows that better air quality equals more productive and smarter people, then that’s what we want to be selling.”
One Canadian owner also points out that, while they are not seeing strong tenant demand for healthier building features currently, they expect to see it in the future, and they are incorporating healthier building features in order to get ahead of the market on this issue.
Obstacles to Increased Investment in Healthier BuildingsThe issue with knowledge about how building design, construction and operation can enhance occupant health and well-being is not con�ned to tenants. Many of the U.S. owners, in particular, point to lack of data and lack of industry knowledge as the most important obstacle to greater
MethodologyDodge Data & Analytics conducted telephone interviews with representatives from 13 companies that own, develop, advise on or operate buildings in the U.S. and Canada.
• These companies range from those that operate solely in the U.S. or Canada, in regions like North America or globally.
• Respondents include executives in charge of the efforts at their companies, including a vice president, several at the director level and a general manager. Eight of the respondents were in the sustainability departments at their companies, with the remainder in other building-related departments.
• All of the companies are relatively large. Numbers of employees reported range from 1,000 to 60,000. Asset values reported range from $300 million to $32 billion. Total square feet managed range from 25 million to 40 million.
This article expands upon a version that looks solely at the seven Canadian owners, with signi�cant overlap in the analysis and conclusions, based on similarities between the Canadian and U.S. responses. That article is published in The Drive Toward Healthier Buildings in Canada, a report written by Dodge Data & Analytics and published by the Canada Green Building Council.
TH
E D
RIV
E T
OW
AR
D H
EA
LTH
IER
BU
ILD
ING
S 2
016:
TA
CT
ICA
L IN
TE
LLIG
EN
CE
TO
TR
AN
SF
OR
M B
UIL
DIN
G D
ES
IGN
AN
D C
ON
ST
RU
CT
ION
DA
TA
Dodge Data & Analytics 47 www.construction.com SmartMarket Report
Data Sidebar: Owner Insights CONTINUED
investment in healthier buildings. When asked about the greatest obstacle, for example, one states, “It’s a lack of a road map of how to get there right now. There’s the WELL building rating system, but no one really understands that right now. There are some studies popping up here and there that have caught headlines, but no one really knows how to approach it.”
The other major obstacle pointed out by many is the cost of doing healthier buildings and creating the business case. Many owners consider budget limitations a top obstacle to increased investment.
A few U.S. owners link these two obstacles together. One owner points out that it is more dif�cult to get healthier building products, comparing the challenge to trying to �nd green products over a decade ago.
A couple of U.S. owners also think lack of design and construction expertise is expensive. One owner explains this connection: “The lack of expertise and budget concerns go hand in hand because if someone doesn’t know how to do something, they have to pad their proposals, so of course it is going to look really expensive. And you pair a really expensive program with the uncertainty of outcomes and lack of data, and you have what we call a bleeding-edge technology, which is where people lose money.” Another succinctly comments that “we are paying for the learning curve right now.”
MetricsFew of the owners are tracking speci�c metrics on their building performance. Several Canadian
owners did report tracking air quality measures, but only one U.S. owner discussed this metric, and they are currently in the process of �guring out how to track it.
Part of the challenge reported by these owners is even determining which metrics are meaningful, both to those in their industry and to their clients. As one states, “Nobody knows what VOCs are, nobody knows what PM2.5 is. People barely know what CO2 is, and then you are doing it on a parts per million basis? And even if they did know [what that means], they don’t know what’s good or bad. Is 30 parts per million great or is that what leads to cancer?”
Bene�tsWith few metrics in place, it is not surprising that few owners had de�nitive answers on hard bene�ts that they are seeing from their healthier building investments. Improved brand awareness and value is the most commonly mentioned bene�t among these owners.
When asked which bene�t would have the greatest impact on ROI, most of the owners, including the healthcare owner, point to productivity. This is commonly accepted as having the greatest potential �nancial impact.
However, the only owner whose portfolio includes multifamily housing had a different perspective: “If we can show that a healthier building has a positive effect on children and has a positive effect on how they perform in school or on their levels of happiness, that would be the home run that everyone understands.” n
expertise about health that owners need, especially since operations are at least as important as design and construction to creating a healthier building.
• They are also moderately interested in partnering with educational institutions, which corresponds to other �ndings demonstrating owner interest in more data on health.
ArchitectsIn contrast to owners, architects show the highest degree of interest in partnering with other organizations.
• Their top potential partners, including educational institutions and public health researchers, indicate a desire for more data.
• In addition, architects are interested in partners who can help them understand and maximize the building impacts that are not under their direct control, including community planners and building operators/facility managers. Thus, they are interested in improving how their buildings contribute to the fabric of the neighborhood and what happens after the building is handed over to the owner.
• Architects also are more interested in partnering with government than other players. Canadian
SmartMarket Report Dodge Data & Analytics 48 www.construction.com
TH
E D
RIV
E T
OW
AR
D H
EA
LTH
IER
BU
ILD
ING
S 2
016:
TA
CT
ICA
L IN
TE
LLIG
EN
CE
TO
TR
AN
SF
OR
M B
UIL
DIN
G D
ES
IGN
AN
D C
ON
ST
RU
CT
ION
DA
TA Owners, architects, interior designers and contractors were asked to indicate their degree of interest in partnering with other organizations to help increase their ability to implement healthy building practices. Three categories of interest were provided: not interested, interested, very interested. The table below indicates those who said that they are very interested in partnering with these organizations.
OwnersOwners generally have the lowest percentages reporting interest in partnering with any organizations to increase their ability to implement healthy building practices.
• The highest percentages are interested in partnering with design �rms, suggesting that these companies are likely to be the most in�uential in helping owners create healthier buildings.
• They have a moderate level of interest in partnering with building operators/facility managers. The percentage interested in partnering with operators may be lower than those interested in partnering with architects because some owners may self-perform their facility management and operations. However, these organizations may have
Interest in Partnering With Other Types of Organizations
Partnership and LearningOpportunities
Data:
Potential Partner Organizations for U.S. Respondents (By Percentage of Those Very Interested in Partnering With Them)
Dodge Data & Analytics, 2016
3_03_HealthSMR_Batch3_E1_Partners_#01
Top Potential Partners (Selected by More Than One Third of Respondents)
Interior Designers ContractorsOwners Architects
• Educational Institutions (45%)• Building Operator/Facility
Management Organizations (42%)• Community Planners (35%)• Public Health Researchers (34%)
• Design Professionals (42%) • Design Professionals (54%)• Building Operator/Facility
• Industry Associations (40%)• Physicians, Nurses, Other
Healthcare Professionals (35%)
Interior Designers ContractorsOwners Architects
• Physicians, Nurses, Other Healthcare Professionals (29%)
• Local Government (29%)• State or Federal Government (26%)• Industry Associations (26%)
• Building Operator/Facility Manager Organizations (31%)
• Educational Institutions (31%)
• Community Planners (29%)• Industry Associations (28%)
• Educational Institutions (31%)• Building Operator/Facility
Manager Organizations (29%)• Community Planners (27%)• Public Health Researchers (27%)
Potential Partners (Selected by One Quarter to One Third of Respondents)
TH
E D
RIV
E T
OW
AR
D H
EA
LTH
IER
BU
ILD
ING
S 2
016:
TA
CT
ICA
L IN
TE
LLIG
EN
CE
TO
TR
AN
SF
OR
M B
UIL
DIN
G D
ES
IGN
AN
D C
ON
ST
RU
CT
ION
DA
TAPartnership and Learning OpportunitiesInterest in Partnering With Other Types of Organizations CONTINUED
architects have an even higher level of interest in partnering with government at both the local (43%, compared with 29% in the U.S.) and provincial/federal (39%, compared with 26% in the U.S.) levels.
Interior Designers• Interior designers are more interested in partnering
with industry associations than the other players included in the survey.
• Sources of potential data are also of interest to them, including educational institutions and public health researchers.
• Like the architects, they are also interested in partnering with community planners and building operators.
Contractors• Contractors are most interested in partnering
with organizations that directly precede and follow them during the building lifecycle: architects and building operators.
• Their interest in educational institutions and associations as potential partners also suggests that they want more data on building health impacts.
Variation by Level of Green InvolvementA larger percentage of those from companies that have a high level of green involvement are very interested in partnering with several different types of organizations than those that have a low level of green involvement. All of the responses with a statistically signi�cant difference are shown in the chart at right.
The greater level of interest is likely driven by several different factors.
• Green building experience may reinforce the value of data to differentiate their business and what they can offer potential clients/employees. Companies doing a high level of green work are likely to be very conversant with the bene�ts of green building. This would explain the much higher level of interest by the companies doing more green work in organizations that can supply data like educational institutions and public health researchers. It is also possible that they view government as an important potential partner in gathering data and benchmarking buildings, such as the work Energy Star has done on building energy performance.
Dodge Data & Analytics 49 www.construction.com SmartMarket Report
Dodge Data & Analytics, 2016
High Green Involvement (More Than 60% Green Projects)Low Green Involvement (15% or Fewer Green Projects)
65%
41%
Design Professionals
Educational Institutions
53%
34%
Building Operator/Facility Manager Organizations
4_01_HealthSMR_Batch4_E1_PartnersGreen_#01
48%
37%
Public Health Researchers
40%
21%
31%
20%
State or Federal Government
Public Health Agencies
30%
16%
• Some green companies may already take a more collaborative approach to projects in order to enhance the sustainability outcomes they are able to achieve. That level of partnering with other organizations on other projects, including design �rms and building operators/facility managers, may extend to their goal of creating healthier buildings as well.
• There is increased awareness in the building industry that attention must be paid to building operations and facility management to achieve the full performance of a green building. Simply building to a high standard is not enough. Those with the most experience in green building, therefore, are also the most likely to recognize that it is crucial to partner with building operators/facility managers to achieve green goals.
Potential Partner Organizations for U.S. Respondents (By Percentage of Those Highly Interested in Partnering With Them, According to Their Level of Green Involvement)
TH
E D
RIV
E T
OW
AR
D H
EA
LTH
IER
BU
ILD
ING
S 2
016:
TA
CT
ICA
L IN
TE
LLIG
EN
CE
TO
TR
AN
SF
OR
M B
UIL
DIN
G D
ES
IGN
AN
D C
ON
ST
RU
CT
ION
DA
TA
Certi�cations/StandardsArchitects and contractors more frequently get information from certi�cations and standards than do owners or interior designers. It is possible that they are more in�uenced by their experiences with green building certi�cations and standards than owners or interior designers are.
However, the owners, architects and contractors who use them rank certi�cations and standards among the top two most valuable sources of information on healthy design and construction activities. Interior designers may �nd that certi�cations/standards are less likely to directly
Owners, architects, interior designers and contractors were asked to select the sources from which they get information on healthy design and construction activities. Then the respondents were asked to select the top two most valuable sources of this information.
The charts at right on this and the following page are the �ve sources of information that are widely used by all U.S. players. The two sets of bars show the percentage using these sources and, among those using them, the percentage who rank them in the top two for value.
Product ManufacturersThe highest percentage of overall U.S. respondents (63%) report that they get information from product manufacturers, and manufacturers are the top source of information for architects, interior designers and contractors.
However, only contractors consistently �nd them to be valuable sources of information, with about two thirds of those who gain information from them (63%) ranking them �rst or second. In contrast, less than half of architects (41%) and less than one third of interior designers (31%) who get information from product manufacturers consider them among the most valuable sources of that information.
The �ndings suggest that product manufacturers would bene�t from more actively pursuing owners, and that the information provided to architects and interior designers needs to be more informative, thorough and reliable, and would bene�t from being science based or study based.
Training/WorkshopsOver half (53%) of all U.S. respondents get information on healthy design and construction activities from training and workshops. While architects and interior designers do so more frequently, the use is relatively consistent among all players, especially when compared with the difference in use of product manufacturers for information between owners and the other players.
Overall, the industry thinks very highly of training/workshops as sources of information on healthy design and construction activities. Interior designers are particularly enthusiastic about these, with over three quarters (76%) who rank them among the most valuable sources of information. Around half of the owners, architects and contractors who use these also rank them highly, suggesting that these are a valuable way to interact with the industry.
Partnership and Learning Opportunities CONTINUED
SmartMarket Report Dodge Data & Analytics 50 www.construction.com
Sources of Information On Healthier Design and Construction Activities
Top Sources of Information on Healthier Design and Construction Activities (According to U.S. Respondents)Dodge Data & Analytics, 2016
Percentage Using This Source for InformationConsidered Most Valuable by Those Using Them
TAPartnership and Learning OpportunitiesSources of Information On Healthier Design and Construction Activities CONTINUED
Dodge Data & Analytics 51 www.construction.com SmartMarket Report
Top Sources of Information on Healthier Design andConstruction Activities (By Percentage Using Them and by Percentage Ranking Them Among the Top Two Most Valuable Sources)
address the kind of work they do on projects than do owners, architects or contractors.
Healthy Product LabelsProduct labels that identify healthier building products, such as GreenSeal and Declare, are most widely used by architects and interior designers. They also consider them relatively valuable sources of information, especially interior designers, half of whom ranked them among the top two most valuable resources.
The low level of use by contractors, though, may have an impact on the degree to which healthier products are used in building projects. Contractors are often the �nal arbiters on product selection, and even though a healthier building product may be speci�ed by the design team, a contractor may substitute one that is less healthy. Unfortunately, the low level of use is matched by a low percentage (29%) among those who do use them who rank them among the most valuable resources. Further research is needed about why contractors �nd them much less valuable than do interior designers, architects, or even owners. Improving the perception of their value is essential to encouraging wider use of these by contractors.
Academic ResearchInterior designers are the most frequent users of academic research for information on healthier design and construction practices. However, architects aren’t far behind them (38%), and over half (51%) of architects who use this information rank it among the most valuable resources. While more information is needed, it is possible that this is a re�ection of the kind of academic research being done, which focuses on issues like air quality and daylighting, which may more often fall under the purview of architects. With a high percentage of interior designers attempting to use this information, this suggests an opportunity for research organizations to focus speci�cally on the health impacts of interior design strategies in the most actionable manner possible.
A relatively high percentage of owners (50%) and contractors (37%) who use academic research �nd it valuable, even though the actual percentage using it for both (25% and 23%, respectively) is so low. This suggests that this is an underutilized resource for these players.
Dodge Data & Analytics, 2016
Percentage Using This Source for InformationConsidered Most Valuable by Those Using Them
TA Owners, architects, interior designers and contractors were asked to select the topics about which they would like to have more information to improve their ability to design, build or operate healthier buildings. The top five most popular topics are indicated in the chart at right.
All four players tend to prioritize many of the same topics, but they differ in the level of interest indicated for most of these topics.
• Interior designers want information on a variety of topics, with more than three quarters often expressing interest.
• Architects are also generally in need of more information, with more than half seeking information on these topics.
• Contractors and owners are less interested in getting more information about most of these topics, with only a few of interest to more than half of them.
More information on ways to measure health impacts is of interest to all players. This supports the findings that most players are struggling to measure the impacts of the strategies they employ (see pages 28, 34 and 35). This is particularly important to owners, whose interest in this topic exceeds their interest in any of the others. Related to this is the relatively strong interest in getting more information on health benefits. Both are necessary to make a strong business case, but measurements must come first in order to demonstrate health benefits.
The top five also include specific strategies, such as knowing more about materials/toxins/chemicals of concern and strategies that promote physical activity. Interestingly, knowing more about the specific materials/toxins/chemicals is slightly more important to most players than transparency, probably because they need to be able to understand more about chemicals of concern in order to benefit from transparency. The notable exception to this general trend is the interior designers, who are very interested in learning more about transparency.
A few other topics that didn’t make the top five overall are of great interest to certain players.
• Architects (54%) and interior designers (67%) are very interested in acoustical comfort. However, the low percentage of owners who share that interest (37%) may be indicative of a need for more owner education on this critical topic, especially given its impact on productivity, attention and decision-making.
Partnership and Learning Opportunities CONTINUED
• A relatively high percentage of architects (54%) are also interested in strategies for creating spaces that encourage social interaction. While the percentage of interior designers (56%) who are interested in that topic actually exceeds the architects, it is of considerably less interest to interior designers than other topics.
• The highest percentage of contractors (60%) are interested in more information on design and construction strategies promoting the safety and health of construction workers. However, their interest is not shared by other players, including owners, of whom only 30% express the desire for more information on this topic.
SmartMarket Report Dodge Data & Analytics 52 www.construction.com
Desired Topics for More InformationIn Order to Improve Ability to Design, Build or Operate Healthier Buildings
Desired Topics for More Information(According to U.S. Respondents)
4_04_HealthSMR_Batch4_E2_InfoNeededCircles_#01
Dodge Data & Analytics, 2016
Ways to Measure Health Impact
Materials/Toxins/Chemicals ofConcern
Health Bene�ts
Strategies That Promote Physical Activity
Transparency About Building Materials
ContractorsInteriorDesignersArchitectsOwners
67% 75% 77%
44% 58% 77%
53% 58% 75%
47% 56%
41% 56% 79%
53%
52%
47%
44%
42%
58%
TH
E D
RIV
E T
OW
AR
D H
EA
LTH
IER
BU
ILD
ING
S 2
016:
TA
CT
ICA
L IN
TE
LLIG
EN
CE
TO
TR
AN
SF
OR
M B
UIL
DIN
G D
ES
IGN
AN
D C
ON
ST
RU
CT
ION
Carol serves as secretary of the board and board liaison for the Health + Sciences Committee. She is also on the planning committee of AIA California Council’s Healthcare Facilities Forum. She is the design program manager for a nonpro�t healthcare provider.
Interview:Thought Leader
Dodge Data & Analytics 53 www.construction.com SmartMarket Report
What changes are you seeing in healthcare that are positively addressing how those buildings impact patients?CORR: Because of the Affordable Care Act, we are seeing more patients who haven’t been to the doctor for a regular visit before. Because they don’t know if they should be getting online or calling and making an appointment, they will go right to the emergency room. ... We are going to start to see smaller healthcare buildings, neighborhood-based clinics. We are already seeing companies open small urgent care centers with easier access. It is not going to be the standard medical of�ce building with 200,000 square feet. It could be a corner clinic, a clinic in a mall or a Wal-Mart. You are going to see greater variation of healthcare services.
What healthier building practices do you see in healthcare that could be applicable to other sectors, like affordable housing, of�ces or schools?CORR: Safer building products, safer furniture. That will have a big impact, not just on better products that last longer, but also for the safety of patients and staff, so that we have better productivity, healthier people. Asthma rates are high because of the products that people are exposed to, for instance, and if we can eliminate the chemicals that are part of the problem, it can be better, not just for healthcare
buildings, but for all buildings .... Healthcare doesn’t have the biggest market share, [so] we can’t always affect eliminating products. But larger groups like USGBC, working with a varied group of clients [in multiple sectors] can work together to start pushing the market so that we are moving toward safer products.
On the �ip side, do you see any changes in other sectors that would bene�t the healthcare sector?CORR: I look at high-tech, the way millennials are working in spaces, the �exibility. Instead of sitting at your same desk every day, you are moving around, you are collaborating with different people, depending on what your needs are. I could see how that could improve how the healthcare industry works, how doctors could work together. I just don’t know how we are going to get there yet.
What should architects and designers consider that they currently don’t now, when it comes to designing spaces with a positive impact on occupant health?CORR: When you look at something like the WELL Building Standard, they look at things like nutrition, things that an architect wouldn’t necessarily think about. How does bringing good food into the facility make it better? We need to think about how that affects the people in the building. We
need to look beyond what we as architects are responsible for, at what else happens in the building. Even if we don’t think we can affect it, we should look at how we could affect it.
Do you see a connection between the health impacts of the built environment and social equity?CORR: If you don’t have good schools in your community, if you don’t have stores in your community, you probably don’t have good healthcare providers in your community. You may not be able to afford a car, and if you are in an area [that lacks public transportation] you can’t get out the community to get to that clinic that’s not near you, which means you probably are not going to the doctor as much. You don’t have good food, you are not able to access good schools and better jobs because you can’t get to them. You end up disadvantaged.
What would you recommend to an architect or a designer who wants to design healthier buildings but isn’t sure where to begin?CORR: Seek out architecture companies doing healthcare: Talk to them to understand what they are doing and why they are doing it. Talk to people on the owner side, see what they are doing. And go work directly [as a volunteer] with small, nonpro�t clinics. n
Carol D. Corr, Member of the Board of Directors, American Institute of Architects, San Francisco
TH
E D
RIV
E T
OW
AR
D H
EA
LTH
IER
BU
ILD
ING
S 2
016:
TA
CT
ICA
L IN
TE
LLIG
EN
CE
TO
TR
AN
SF
OR
M B
UIL
DIN
G D
ES
IGN
AN
D C
ON
ST
RU
CT
ION
Much like with the emergence of the sustainability movement,
associations are taking a lead role in providing resources, educating members and facilitating discussions around design and health.
AIAThe American Institute of Architects (AIA) has a two-part vision for its design and health initiative, says Suzanna Wight Kelley, AIA’s managing director of Strategic Alliances + Initiatives. The first is to prepare members for practicing new ways to consider public health outcomes as a primary objective for their design. The second is to raise public awareness about the role design plays in occupant health.
“Healthcare is front page news, but a lot of people don’t think about how their built environment impacts them—the choices they make every day,” she says. “A lot is driven by the built environment. We want to raise awareness around that.”
AIA has offered a design and health track at its annual convention since 2014, when it partnered with the Robert Wood Johnson Foundation to launch the effort. “The first year we did it, the session sold out,” Kelley says. “From my observations, this [trend] is moving rapidly. It’s being driven by clients, who are focused on their people and their buildings, and recognize that human capital is their biggest expense.”
Kelley says AIA is working on a
Associations Advance the Industry’s Engagement With Building Health Impacts
Associations are playing a critical role in the adoption of health and wellness standards in design and construction.
SmartMarket Report Dodge Data & Analytics 54 www.construction.com
Sidebar: Associations
professional continuing education curriculum for architects to learn more about design and health issues, and how to integrate those concepts into their projects. Subjects could run the gamut from environmental quality to active design.
Two years ago, the AIA Design & Health Research Consortium was launched, which now includes 17 university teams each comprised of one co-lead in health and one co-lead in design. “We bring them together, not just to advance the body of knowledge on design and health, but also to translate their work into practice tools and pieces we can communicate with the public and policymakers about the importance of design and the solutions for health,” Kelley says.
In May, HOK was the first architecture firm to partner with research consortium schools. Kelley says research gleaned from a series of focus groups will be published and shared. “We’re seeing a strong level of interest from architecture firms of all sizes in engaging in design and health,” she adds. “Over the coming months, you’ll see more firms show an interest in being ahead of the game.”
Kelley also sees an opportunity for AIA to influence public policy. “If there are limitations in the codes—especially zoning codes—that prevent us from designing healthy places, we won’t get very far,” she says. “We will work in the areas where we have strength—which is codes and standards—to enact policy changes that will create better environments
for healthy communities.”The efforts are starting to filter
down to the local chapters. AIA DC established a Health + Well-being Committee, the first such initiative at a local AIA chapter.
ASIDThe American Society of Interior Designers (ASID) formalized its commitment to the design and health movement in its 2014 strategic plan. Randy Fiser, CEO of ASID, says health, wellness and well-being are central tenants of the organization’s mission, along with sustainability and resiliency.
“Interior design has always been for the health, safety and welfare of the occupants,” he says. “For interior designers, that health component has always been an innate part of the work they do.”
Fiser says research is critical for validating its efforts. The organization has invested more than $500,000 in demonstrating the impact of design on productivity, engagement and retention—with dimensions of those investments correlating into health, wellness and well-being.
“Research translates into education,” he says. “When the research is done, we look for platforms and mechanisms—whether it’s online, written or live engagement points—where we can talk about the subject and push this out to our members.”
ASID is also studying itself. In 2016, the association opened a new headquarters in Washington, D.C.,
TH
E D
RIV
E T
OW
AR
D H
EA
LTH
IER
BU
ILD
ING
S 2
016:
TA
CT
ICA
L IN
TE
LLIG
EN
CE
TO
TR
AN
SF
OR
M B
UIL
DIN
G D
ES
IGN
AN
D C
ON
ST
RU
CT
ION
Dodge Data & Analytics 55 www.construction.com SmartMarket Report
Sidebar: Associations CONTINUED
which aims to achieve both LEED and WELL Platinum certi�cation. Fiser says ASID will use the new space as a proving ground for health and wellness concepts, and report the results to members.
“The wellness conversation is huge in corporate America right now,” he adds. “My goal with the organization is to really reposition the interior designer in the conversation, making sure they have a seat at the table and potentially lead that conversation on behalf of the client.”
WGBCThe World Green Building Council (WGBC) has also launched research around design and health. In 2014, WGBC released its Health, Wellbeing and Productivity in Of�ces report to raise awareness and outline evidence linking of�ce design with occupants’ health and productivity. Building on that effort, in 2015 WGBC launched Better Places for People, a global campaign that “aims to create a world in which buildings support healthier and happier lives for those who occupy them.” In 2016, WGBC expanded into retail with the release of Health, Wellbeing and Productivity in Retail: The Impact of Green Buildings on People and Pro�t.
“We’re using the website as a gathering place,” says Jonathan Laski, director of global projects and partnerships at World Green Building Council. “The reports, case studies and the guidance documents accessible from the website are helping companies raise these topics internally.”
Green building councils around the world are also engaged. In 2016, Malaysia GBC and India GBC selected health and wellness as the theme
of their annual conventions. “We’re providing tools for green building councils around health and well-being,” Laski says. “We’re hearing that this is a high-priority topic for councils and their members.”
AGCAlthough the design community is at the forefront of the design and wellness movement, the contractor community is getting involved as well. Melinda Tomaino, director of environmental services at Associated General Contractors of America, says she sees initiatives like the WELL Building Standard following a similar path to adoption as LEED.
“With LEED, we started with case studies and introductory articles about it and developed a training course for our chapters,” she recalls. “Then chapters and members carried it forward at that point. That’s what we’re starting to do on the WELL Building Standard, getting our chapters and our members to the point where they will move forward with it at the local level.”
For the last year, Tomaino says AGC has been spreading news about WELL in its newsletters and on social media. This year, AGC will feature a webinar on the topic. A case study of a project designed to achieve WELL certi�cation will be presented at an AGC conference this fall. n
TH
E D
RIV
E T
OW
AR
D H
EA
LTH
IER
BU
ILD
ING
S 2
016:
TA
CT
ICA
L IN
TE
LLIG
EN
CE
TO
TR
AN
SF
OR
M B
UIL
DIN
G D
ES
IGN
AN
D C
ON
ST
RU
CT
ION
What prompted you to engage with how buildings and the built environment impact health and well-being?EYTAN: That’s a good question. My doctorate is in health IT, and I was working to make sure that everyone had electronic mobile records, and the next step was mobile health and devices. I saw quickly, if you look at the data, all of those things have a limit of effectiveness. Not everyone has a device, not everyone is motivated by the numbers. And I started to look around and realized that everyone is in a building, everyone has to get somewhere, 100% of the population needs to live in an environment, and gradually, I started to look at things that affect everyone, not a select few.
How can the way we approach buildings play a role in reducing health disparities among vulnerable populations?EYTAN: What I’ve learned is that buildings [are created] by people far away from people like me ... who may not know the people who they are designing for. The more they know who they are designing for, the more likely they are to have the right impact. More and more, I am meeting with architects who are thinking about people who experience disparities and how they can design health systems for them, which is awesome.
Ted Eytan, MD MS MPH, Director at Kaiser Permanente, The Permanente Federation, LLC, and Medical Director of the Kaiser Permanente Center for Total Health
Ted is a family physician, whose clinical interests are preventive care and reducing disparities in health status among vulnerable populations.
Interview:Thought Leader
SmartMarket Report Dodge Data & Analytics 56 www.construction.com
From your perspective as a doctor, what is important to consider in building design to impact health and well-being?EYTAN: Physical activity, I think that is the number one thing. Any bit of physical activity that will come in throughout your day makes a huge difference. And it is less about going to the gym 30 minutes a day; it is more about how do I incorporate 30 minutes in my day? I realize that both the way the building is constructed and the way people operate the building can—without people thinking about it—really destroy someone’s health.
What are the positive trends you see in the design of healthcare buildings?EYTAN: I visited [the Antelope Valley Kaiser Permanente building] in Lancaster, California .... It connects the building to the community. Before, a healthcare building was a place that you went into and got lost. And this building is open to everything around it, and it [contains] local art and an homage to the aerospace industry. The other building I got to see is Kaiser Permanente Santa Monica, which connects physicians, patients and nurses together in ways that have never been done before. Everything from the ability of the patient to see what the doctor is doing on screens, to co-locating doctors and nurses. It is really different from the old model, where the doctor was in an of�ce far
away, the nurse was over here, the patient was someplace else. You talk with the physicians and nurses, and they say I can practice medicine better [even though] the electronic medical records are the same, their knowledge is the same. The only thing that is different is the design of the building, and that alone makes them better able to practice medicine.
What do you recommend that architects and contractors think about when they make design and construction decisions about healthcare projects?EYTAN: You have to think about the life of the people who will be in there for many years, and how you are part of the healthcare system, and will help doctors and nurses in that person’s life be more effective with almost no extra work. n
TH
E D
RIV
E T
OW
AR
D H
EA
LTH
IER
BU
ILD
ING
S 2
016:
TA
CT
ICA
L IN
TE
LLIG
EN
CE
TO
TR
AN
SF
OR
M B
UIL
DIN
G D
ES
IGN
AN
D C
ON
ST
RU
CT
ION
DA
TA
Global Regional Differences
Global Regional Differences in Healthier Building Trends
A comparison of the responses from North America, Europe and Asia reveals which practices and drivers are more universal and which are in�uenced by regional differences and the level of development of the construction market.
Data:
Dodge Data & Analytics 57 www.construction.com SmartMarket Report
Throughout this report, comparisons are drawn between the U.S. and Canada
survey respondents. While these comparisons reveal important differences, they also demonstrate that the similarities between the two markets far outnumber the differences. This is not surprising, given the similar levels of engagement with green building in the U.S. and Canada, along with the fact that both design and construction markets are highly developed.
However, the survey of owners, architects, interior designers and contractors on the drive toward healthier buildings was not limited to just Canada and the U.S. Although the global response was not high enough to support individual country comparisons, suf�cient responses were received to compare the �ndings from North America, Europe and Asia.
As with the comparison between the U.S. and Canada, what is most striking overall is that there are far more similarities than differences in the responses between North America, Europe and Asia. However, some key differences are telling, especially when it comes to healthier building features in use now and the drivers for wider consideration of health in design and construction decisions in the future.
Use of Healthier Building FeaturesOut of 12 features included in the study, only �ve are used by a notably different percentage of respondents in the three regions. Those are represented in the chart at right.
■ European respondents report less frequent use of spaces that enhance tenant mood, spaces that enhance social interaction or spaces that create opportunities for physical activity than their North American or Asian counterparts. This suggests that some of the mental and social aspects of health are not prioritized in Europe as much as they are in North America and Asia. However, interest in spaces that enhance social interaction is growing in Europe, with nearly two thirds (63%) of those who are not using them frequently now who state that they think it will be important to include them more frequently into their projects in the next �ve years.
■ A much higher percentage of Asian respondents use features that enhance air quality than those in North America or Europe. This is consistent with the �ndings of the World Green Building Trends 2016 SmartMarket Report, which showed a high degree of concern about air quality from respondents in India and especially those in China.
■ Products that enhance thermal comfort are more frequently used in Asia and Europe than they are in North America. This represents an opportunity for building product
Frequent Use of Healthier Building Features (By Region)
9_01_HealthSMR_Batch9_Global_FeaturesUsed_#01
Dodge Data & Analytics, 2016
EuropeAsia
North America
84%
85%
70%
Products That EnhanceThermal Comfort
53%
43%
61%
Spaces That EnhanceSocial Interaction
84%
68%
63%
Enhanced Air Quality
53%
34%
52%
Spaces That EnhanceTenant Mood
47%
28%
45%
Opportunities forPhysical Activity
manufacturers who specialize in products that enhance thermal comfort to in�uence the North American market and provide more information on how their products impact health and well-being.
SmartMarket Report Dodge Data & Analytics 58 www.construction.com
Data Sidebar: Global Regional Differences CONTINUED
Dodge Data & Analytics, 2016
Top Drivers for Greater Consideration ofHealth During Design and Construction
9_02_HealthSMR_Batch9_Global _DriversTable_#02
North America Europe Asia
#1
#2
#3
#1
#2
#3
#1
#2
#3
45%
36%
33%
29%
43%
32%
32%
23%
53%
41%
28%
38%
RankingCompared withOther Drivers
Ranked inthe Top Three
Ranked inthe Top Three
Ranked inthe Top Three
More Research on Productivity Impacts
More Research on Design andConstruction Approaches
Government Incentives
Greater Public Awareness
RankingCompared withOther Drivers
RankingCompared withOther Drivers
Top Drivers for Greater Consideration of Health During Design and Construction (By Region)
America or Europe. ■ More research on design and
construction approaches is considered a top driver in North America and Europe. Even though research on design and construction approaches is also ranked fourth in Asia, the gap between this driver and research on productivity impacts is 10 percentage points, a sizable drop that suggests that productivity is far more in�uential than concerns about how to achieve better health impacts through speci�c design and construction approaches. In green building, many developing markets have been able to draw upon external expertise to create ambitious projects, and it is possible that respondents in Asia have the same expectation about expertise on health. In North America and Europe, on the other hand, there may be greater concern that such expertise is very limited, and that more data is needed. n
demand. Greater public awareness also puts pressure on public institutions to create incentives and regulations to help drive the creation of healthier buildings.
■ Government Incentives: Making the business case for increased investments in healthier buildings has proven thus far to be a consistent challenge. Government incentives can provide the added �nancial push needed, which can be combined with anticipation of softer bene�ts like improved employee satisfaction and engagement, or dif�cult to quantify bene�ts like improved productivity or greater competitiveness.
VARIATION IN IMPORTANCE OF DRIVERS BY REGIONOther critical drivers vary by region.■ More research on productivity
impacts is ranked as a top driver in Asia more than in North America and Europe. The greater prevalence of manufacturing labor in Asia may be well-suited to quantifying productivity impacts, a challenge in the white-collar environments that are more common in North
Drivers for Wider Consideration of Health The table at bottom shows the most in�uential drivers for increasing consideration of health impacts during building design and construction in North America, Europe and Asia. The percentage who ranked each of these drivers �rst, second or third in in�uence is shown in the left column for each region. A comparison of those percentages reveals three highly in�uential factors in each region, and the numbers in the right hand column show what the top three most in�uential drivers are for each.
WIDESPREAD DRIVERSThe table makes clear that two drivers are in�uential across all three regions, and it is likely that they are in�uential in most developed and developing countries:■ Greater Public Awareness: Greater
public awareness of building impacts on health is essential to encourage other in�uential drivers. Public awareness can increase occupant and tenant demand, which in turn can drive owner
IntroductionData:
Dodge Data & Analytics 59 www.construction.com SmartMarket Report
TH
E D
RIV
E T
OW
AR
D H
EA
LTH
IER
BU
ILD
ING
S 2
016:
TA
CT
ICA
L IN
TE
LLIG
EN
CE
TO
TR
AN
SF
OR
M B
UIL
DIN
G D
ES
IGN
AN
D C
ON
ST
RU
CT
ION
DA
TA
Public Health Survey
The 2014 Drive Toward Healthier Buildings SmartMarket Report, published by Dodge Data & Analytics, included more than just construction industry professionals in order to provide a
baseline on the factors driving engagement with healthier buildings in the construction industry. It recognized the importance of other, potentially in�uential groups on this movement, including physicians and human resource executives. The �ndings demonstrated that human resource executives were strong potential allies in increasing investments in healthier buildings, but that most physicians did not make a direct link between health and the built environment.
The current study continues that approach of recognizing the importance of other groups on the potential for driving demand for healthier buildings by including a survey of public health professionals, including social workers. Public health professionals are strong potential allies with the design and construction industry in helping to drive the creation of healthier buildings.
• They are acutely aware of the impacts of speci�c building features on the health and well-being of occupants, with perhaps even greater sensitivity to the mental and emotional impacts of the built environment than is evident among design and construction professionals.
• They directly in�uence policies created around the built environment, and the rise of the green building movement has demonstrated the important role that regulations and incentives can have on encouraging the adoption of specific building products and practices.
• In addition, many are engaged in research directly or af�liated with organizations conducting research, so their ability to encourage more research on building impacts on health and productivity can help meet the demand for more data that is so strongly demonstrated in the construction industry professionals study. However, the findings also suggest the need for broader and more effective dissemination of those findings among those in the construction industry.
Notes About the DataThe data and analysis of public health professionals is drawn from an online study conducted in March 2016 among public health professionals and social workers in the U.S., and public health professionals only in Canada. 122 professionals responded to the study, including:
■ 62 U.S. public health professionals■ 30 U.S. social workers■ 30 Canadian public health professionals
Throughout the analysis, comparisons are made between U.S. and Canadian public health professionals, and between public health professionals and social workers in the U.S. only.
More information on the survey responses can be found in the methodology on page 72.
SmartMarket Report Dodge Data & Analytics 60 www.construction.com
TH
E D
RIV
E T
OW
AR
D H
EA
LTH
IER
BU
ILD
ING
S 2
016:
TA
CT
ICA
L IN
TE
LLIG
EN
CE
TO
TR
AN
SF
OR
M B
UIL
DIN
G D
ES
IGN
AN
D C
ON
ST
RU
CT
ION
DA
TA Public health professionals and social workers were asked to rate the impact of 13 building features on the health and well-being of building occupants, using a scale of one to �ve, from no impact to very high impact. The table at right shows the percentage who believe that building features have a high or very high impact on health and well-being.
The most striking aspect of the �ndings is the level of strong agreement about the high impact of most of these features on the health of building occupants. Over 80% rate the impact of six separate features as high, and over 70% rate another �ve features at that level. It is clear that there is wide recognition among these professionals about building impacts on health, which makes design team members and public health professionals/social workers natural allies with the design and construction industry to address issues regarding healthy buildings.
A few trends emerge from the data: ■ Clean, fresh air and water are among the top strategies recognized by public heath of�cials and social workers.
■ Those in the second tier of recognition include less common strategies, such as occupant controls and spaces encouraging physical activity.
■ Public health professionals and socials workers are less likely to consider features outside the building, such as green roofs and walking spaces, to have a high impact than features of the building itself.
Variation by CountryThe only signi�cant differences between public health professionals in the U.S. and those in Canada is wider recognition in the U.S. of the use of natural ventilation, rated highly by 90% compared with just 67% of those in Canada. This may seem to contradict the previous �nding that natural ventilation is more widely utilized in Canada than in the U.S. (see page 16), but it is possible that natural ventilation may be a more common building practice in Canada, and therefore not considered as a measure to address health impacts.
Impact of Building Features on Health
Public Health Professionals’Insights on Building Impacts and Research
Data:
Building Features Believed to Have a High Impact on Health (According to U.S. Public Health Professionals and Social Workers)Dodge Data & Analytics, 2016
4_05_HealthSMR_Batch4_PHB2_Features_#01
80% or More
Availability of Clean or Filtered Water
Use of Natural Ventilation
Removal of Harmful Chemicals FromBuilding Materials and Furnishings
Accessibility Features
Mechanical Ventilation Strategies
Access to Suf�cient Daylight
Availability of Fresh Food
Spaces Encouraging Physical ActivityInside the Building
Occupant Controls for FactorsLike Lighting and Temperature
TA Information NeededDespite their wide familiarity with the impact of building features on occupant health and well-being (see page 60), a high percentage of U.S. public health professionals and social workers would like to have more information about several topics to better understand those impacts.
In general, a higher percentage of public health professionals want information on the topics included in this study than social workers, although the only statistically signi�cant differences are among those seeking information on building strategies promoting occupant physical activity and on transparency about building materials.
■ The highest percentage of public health professionals (63%) and the second highest percentage of social workers (53%) want more information on ways to measure health impacts. This is also the most popular among Canadian public health workers (53%). The high level of interest suggests that those setting policies need more data on building health impacts just as much as design and construction professionals do.
■ The topic of health bene�ts is the only other one that more than half of the U.S. public health professionals and social workers seek more information on. The percentage in Canada is also roughly equivalent, revealing widespread interest in this topic. This degree of interest in such a broad topic suggests the relatively recent focus on separate consideration of health impacts, rather than as one aspect of green building.
■ U.S. public health professionals are particularly interested in more information on building strategies that promote occupant physical activity (56%), a much higher percentage than social workers (33%) or than the public health of�cials in Canada (27%). This suggests an opportunity for the U.S. to take the lead on addressing this issue through public policy.
■ U.S. public health professionals are also more interested in transparency about building materials (52%) than are U.S. social workers (23%) or their Canadian counterparts (27%). U.S. public health of�cials may be more directly involved with policy and research on building materials than social workers, but more data is needed to understand the difference in responses between the U.S. and Canada.
■ Most of the respondents are not very interested in information on acoustical comfort. It is unclear if that is because they feel they already understand this issue well enough or if they underestimate its importance.
Public Health Professionals’ Insights on Building Impacts and Research CONTINUED
Dodge Data & Analytics 61 www.construction.com SmartMarket Report
Gaining a Better Understanding of Building Impacts on Occupant Health and Well-Being
Information Needed to Better Understand the Impact of Designing, Building and Operating Healthier Buildings (According to U.S. Public Health Professionals and Social Workers)Dodge Data & Analytics, 2016
U.S. Public Health ProfessionalsU.S. Social Workers
63%
53%
Ways to Measure Health Impact
Building Strategies Promoting OccupantPhysical Activity
56%
33%
Health Bene�ts
55%
57%
Transparency About Building Materials
52%
23%
Building Strategies Promoting Safetyand Health of Construction Workers
42%
33%
Chemicals of Concern
40%
40%
Creating Spaces That EncourageSocial Interaction
4_06_HealthSMR_Batch4_PHE2_InfoNeeded_#01
37%
30%
Acoustical Comfort
23%
13%
TH
E D
RIV
E T
OW
AR
D H
EA
LTH
IER
BU
ILD
ING
S 2
016:
TA
CT
ICA
L IN
TE
LLIG
EN
CE
TO
TR
AN
SF
OR
M B
UIL
DIN
G D
ES
IGN
AN
D C
ON
ST
RU
CT
ION
DA
TA Sources of Information on Healthy Design and Construction ActivitiesPublic health professionals and social workers were asked to select the sources of information they use to get information on healthy design and construction activities from an extensive list of potential sources. They were then asked to select the top two most valuable sources of information from among those that they use.
The chart at right represents the most frequently used sources of information for U.S. public health professionals and social workers. Clearly, there is no single dominant source of information on healthy design and construction activities for U.S. public health professionals or social workers, with even the most popular means of gaining information used by less than half of the respondents.
The top sources of information include: ■ Government: The federal government is the most widely used source of information on healthy design and construction activities by public health professionals and social workers, and it is closely followed by state/local government. Federal/state and local governments are also among the most valuable resources, with a high percentage of those using federal government resources (71%) and nearly as high a percentage of those using state government resources (68%) ranking them among the top two most valuable sources of information.
■ Training/Workshops: Like the government sources, these are not only widely used, but also considered highly valuable. 38% of respondents get information from training/workshops, which makes these sources of information third in terms of overall use. However, the highest percentage of those using training/workshops rank them among the top two most valuable sources of information (74%). This indicates that setting up training and workshops may be a very effective way to communicate healthy design and construction concepts to this audience.
■ Building product manufacturers are a source of information for one third (33%) of public health professionals and social workers. However, a relatively low percentage (40%) rank them among their top two most valuable sources of information. Building product manufacturers may need to investigate how to increase their value to these important potential partners.
Public Health Professionals’ Insights on Building Impacts and ResearchGaining a Better Understanding of Building Health Impacts CONTINUED
Academic journals were selected by less than 5% of U.S. respondents. However, these same respondents express a strong interest in partnering with physicians and public health researchers (see page 67), which suggests that academic journals should play a much larger role in their pursuit of information than they do currently. One challenge to their wider use is the dif�culty of accessing them without direct af�liation with an academic institution.
NOTABLE VARIATIONSThere are only a few statistically signi�cant differences of note in terms of the use of various sources of information.■ 31% of U.S. public health professionals get information
from consumer magazines, compared with 13% of social workers and 13% of public health professionals in Canada.
■ Third-party certi�cation systems for buildings are also much more widely used by U.S. public health professionals (23%) than among those in Canada (10%).
SmartMarket Report Dodge Data & Analytics 62 www.construction.com
Top Sources of Information on Healthy Design and Construction Activities (According to U.S. Public Health Professionals and Social Workers)Dodge Data & Analytics, 2016
45%
Federal Government
43%
State/Local Government
38%
Training/Workshops
Building Product Manufacturers
33%
Third-Party Certi�cation Systemsfor Building Products
4_07_HealthSMR_Batch4_PHE2_TopInfoSource_#01
26%
25%
Television
25%
Consumer Magazines
24%
Third-Party Certi�cationSystems for Buildings
TH
E D
RIV
E T
OW
AR
D H
EA
LTH
IER
BU
ILD
ING
S 2
016:
TA
CT
ICA
L IN
TE
LLIG
EN
CE
TO
TR
AN
SF
OR
M B
UIL
DIN
G D
ES
IGN
AN
D C
ON
ST
RU
CT
ION
DA
TA Public health professionals and social workers were asked to rank the top outcomes they expect from greater consideration of occupant health and well-being during building design and construction. The chart at right shows all the outcomes ranked �rst, second or third by more than one quarter of U.S. public health professionals and social workers.
Improved emotional and social well-being is by far the top outcome. This demonstrates that U.S. public health professionals take a broader view of health than just physical well-being and the absence of illness.
• Nearly three quarters (73%) of social workers rank this among their top three, 30 percentage points above any other possible outcome and significantly more than the percentage of public health professionals. Their high expectations may suggest that social workers see stronger potential for building interventions to positively impact emotional and social well-being rather than physical well-being. Their interest in emotional and social well-being is directly aligned with their professional focus.
• Despite scoring lower than social workers, many public health professionals still rank this outcome highly, with the highest percentage (49%) ranking it among the top three outcomes expected.
• Only 27% of Canadian public health professionals consider this to be one of the top three outcomes, making this the only outcome with a significant difference between U.S. and Canadian public health professionals.
U.S. public health professionals and social workers also agree on the remaining outcomes, with no signi�cant differences. Only 12 percentage points separate the next six, suggesting that no single outcome is widely expected by these respondents. Instead, there are relatively strong expectations that most will occur.
• One third or more expect lower healthcare costs, reductions in respiratory illness and improved occupant satisfaction/engagement. For public health professionals, both lower healthcare costs and reductions in respiratory illness are only eight percentage points behind emotional and social well-being, suggesting that they see a more balanced impact from building interventions than do social workers.
• Over one quarter expect improved productivity, improved mental acuity and lower levels of obesity.
Public Health Professionals’ Insights on Building Impacts and Research CONTINUED
Dodge Data & Analytics 63 www.construction.com SmartMarket Report
Top Outcomes Expected From Consideration of Occupant Health and Well-Being
Top Outcomes Expected From Consideration of Occupant Health and Well-Being (Ranked First, Second or Third by U.S. Public Health Professionals and Social Workers)Dodge Data & Analytics, 2016
55%
Improved Emotional and Social Well-Being
39%
Lower Healthcare Costs
35%
Reduction in Respiratory Illness
Improved OccupantSatisfaction/Engagement
33%
Increased OccupantProductivity
6_01_HealthSMR_Batch6_PHD1_Outcomes_#01
32%
28%
Improved Mental Acuity
Lower Levels of Obesity
27%
TH
E D
RIV
E T
OW
AR
D H
EA
LTH
IER
BU
ILD
ING
S 2
016:
TA
CT
ICA
L IN
TE
LLIG
EN
CE
TO
TR
AN
SF
OR
M B
UIL
DIN
G D
ES
IGN
AN
D C
ON
ST
RU
CT
ION
DA
TA The public health sector can provide support to the building industry’s efforts to create healthier buildings by conducting research that demonstrates the impacts of the built environment on health and by supporting policies that drive the use of healthier building products and practices.
Research Being Conducted Nearly all (92%) of U.S. public health professionals report that their institution conducts at least a medium of level of research on building impacts on occupant health and well-being. Almost three quarters (74%) of social workers in the U.S. report the same. This demonstrates the commitment in these sectors to providing the data to support the creation of healthier buildings.
The most common types of research conducted by both types of institutions focus on both general impacts and the impacts of speci�c strategies:
• Medical/health and well-being research, space/office/building design effects, the effects of buildings materials on health, and green/renewable energy, sustainability research are most common among institutions employing public health professionals.
• Air quality/ventilation and medical/health and well-being research are the most common among institutions employing social workers.
Government Policies in Place and Being ConsideredThe most widely adopted government policies in the U.S. to encourage occupant health, well-being and safety are requirements for avoiding hazardous materials, including VOCs and red list chemicals. As noted in the chart at right, nearly two thirds (65%) of public health professionals and social workers in the U.S. report that these policies currently exist, a much higher percentage than the public health workers who report seeing these policies in Canada (40%).
Five additional policies are reported by around half of U.S. respondents.■ Incentives Encouraging Design for Increased Physical
Activity: A much higher percentage of U.S. public health professionals (60%) than social workers (37%) report seeing these policies. This type of policy also has the highest percentage (47%) who say it is being considered, and here, social workers outnumber public health professionals (although the difference is not statistically signi�cant). Clearly, incentives in this area
Public Health Professionals’ Insights on Building Impacts and Research CONTINUED
SmartMarket Report Dodge Data & Analytics 64 www.construction.com
Research and Policy Supporting the Development of Healthier Buildings
Policies In Place and Being Considered That Encourage Occupant Health, Well-Being and Safety (According to U.S. Public Health Professionals and Social Workers)
6_04_HealthSMR_Batch6_PHC6C7_GovPolicies_#01
Dodge Data & Analytics, 2016
Government Policies ExistGovernment Policies Are Being Considered
47%
Incentives Encouraging Design for Increased Physical Activity
33%
Requirements for Avoiding Use of Hazardous Materials in Buildings
45%
Codes Regulating Indoor Air Quality
Incentives for Increased Ventilation/Fresh Air Intake
43%
46%
Requirements for Ongoing Building Air Quality Measurement
40%
Codes Requiring Natural Ventilation in Certain Sectors
Codes Regulating Degree of Fresh Air Intake
42%
41%
Requirements for Site Design FeaturesEncouraging Physical Activity
32%
52%
65%
50%
50%
46%
47%
40%
36%
34%
Incentives for Healthy Foods
TH
E D
RIV
E T
OW
AR
D H
EA
LTH
IER
BU
ILD
ING
S 2
016:
TA
CT
ICA
L IN
TE
LLIG
EN
CE
TO
TR
AN
SF
OR
M B
UIL
DIN
G D
ES
IGN
AN
D C
ON
ST
RU
CT
ION
DA
TA are already considered important and are expected to be even more so in the U.S.
■ Air Quality Improvement Codes, Incentives and Requirements: All the remaining policies reported by around half of the respondents are attempts to improve indoor air quality, including codes regulating indoor air quality, incentives for increased ventilation/fresh air intake, requirements for regular air quality measurement and codes requiring natural ventilation. All of these are selected by an equivalent percentage of public health professionals and social workers in the U.S., and by public health professionals in the U.S. and Canada. 40% or more of U.S. respondents also report that future policies in these areas are being considered.
Requirements for site design that allows for physical activity may be an area to watch. Although only about one third (36%) report that these policies are in place now, 41% say that they are being considered.
Policies at Private InstitutionsRespondents who do not work for government agencies were asked about the policies at their own organizations.
• Like the government policies, their organizations were most likely to have policies that avoid the use of hazardous materials.
• Also similar to the responses on government policies, many other policies were reported by between 44% and 49% of qualified respondents.
• Site design that allows for physical activity and access to healthy food options are much more common in the policies of private organizations than they are in government policies.
• While indoor air quality policies generally are widely adopted, a lower percentage of respondents from private organizations report that they have policies about specific strategies, such as ongoing measurements of air quality and managing the degree of fresh air intake.
Drivers for Policies and ResearchPublic health professionals and social workers were asked to rank the top three most important drivers to increase attention to building health impacts in government policies or government-sponsored research. They were also asked to perform a similar ranking of the drivers for academic research.
Public Health Professionals’ Insights on Building Impacts and ResearchResearch and Policy Supporting the Development of Healthier Buildings CONTINUED
Dodge Data & Analytics 65 www.construction.com SmartMarket Report
Policies in Place at Private Institutions That Encourage Occupant Health, Well-Being and Safety (According to U.S. Public Health Professionals and Social Workers)Dodge Data & Analytics, 2016
Requirements for Avoiding Use of HazardousMaterials in Buildings
6_05_HealthSMR_Batch6_PHC8_NonGovPolicies_#01
56%
49%
Site Design That Allows for Physical Activity
48%
Access to Healthy Food Options
Building Design for IncreasedPhysical Activity
46%
45%
Indoor Air Quality
44%
Use of Natural Ventilation inCertain Sectors
38%
Ongoing Measurement of BuildingAir Quality Measurement
37%
Degree of Fresh Air Intake
TH
E D
RIV
E T
OW
AR
D H
EA
LTH
IER
BU
ILD
ING
S 2
016:
TA
CT
ICA
L IN
TE
LLIG
EN
CE
TO
TR
AN
SF
OR
M B
UIL
DIN
G D
ES
IGN
AN
D C
ON
ST
RU
CT
ION
DA
TA TOP DRIVERS FOR GOVERNMENT RESEARCH AND POLICIESThe top drivers vary between public health professionals and social workers.
• The only statistically signi�cant difference is in the importance of greater public awareness as a driver. Nearly three quarters (73%) of social workers rank this among their top three drivers, but less than half (48%) of public health professionals agree.
• This signi�cant difference is part of a general trend for public health professionals to be more interested in the commercial side of healthier buildings, and for social workers to be more interested in aspects more apparent to the general public. For example, social workers are more interested in research on the health impacts of building products than public health professionals, and building products are bought by professionals and consumers alike. On the other hand, a higher percentage of public health professionals are interested in research on productivity impacts, and design and construction approaches, which are much more applicable to a commercial audience than a consumer one.
DRIVERS FOR ACADEMIC RESEARCHUnlike the drivers for government policies and research, there are no signi�cant or notable differences between the rankings of U.S. public health professionals and social workers in the factors driving greater attention to building impacts on health in academic research. Since they were asked to rank only four factors, the percentages below indicate how many respondents ranked each item �rst, rather than how many ranked them in the top three.
Public awareness/pressure and government funding are nearly equal, ranked �rst by 35% and 34%, respectively.It is no surprise that government funding is a critical driver of academic research. What is more surprising is that public awareness and pressure is ranked �rst by an equivalent number of respondents. This demonstrates the importance of engaging the public on the impact that the built environment has on their health in order to drive more research on the speci�c impacts and how to improve them.
Increased collaboration with nonpro�ts and/or design �rms, and private funding are also nearly equal, ranked �rst by 15% and 14%, respectively. The relatively low ranking for private funding demonstrates the degree to which government funding is driving academic research in this area.
Public Health Professionals’ Insights on Building Impacts and ResearchResearch and Policy Supporting the Development of Healthier Buildings CONTINUED
SmartMarket Report Dodge Data & Analytics 66 www.construction.com
However, it is notable that collaboration with nonpro�ts and/or design �rms scored so highly, given the importance of funding and public pressure in academia. This �nding dovetails well with data from the other study conducted for this report, where the highest percentage of architects (45%) are interested in partnering with academic institutions on this topic. It suggests the potential for more collaboration between those practitioners and researchers in academia to help improve the health impacts of the built environment.
Top Drivers for Government Research and Policies (According to U.S. Public Health Professionals and Social Workers)Dodge Data & Analytics, 2016
U.S. Public Health ProfessionalsU.S. Social Workers
48%
73%
Greater Public Awareness ofImpact of Buildings on Health, Well-Being and Safety
More Research on Impact of Design/Construction Approaches on Health,Well-Being and Safety
45%
37%
More Research on Health,Well-Being and Safety Impactof Building Products
44%
53%
More Research on ProductivityImpacts of Healthier Buildings
42%
27%
Federal Standards on BuildingSafety Impacts
40%
30%
Federal Standards on BuildingHealth and Well-Being Impacts
37%
37%
6_06_HealthSMR_Batch6_PHC4_DriversPolicies_#01
TH
E D
RIV
E T
OW
AR
D H
EA
LTH
IER
BU
ILD
ING
S 2
016:
TA
CT
ICA
L IN
TE
LLIG
EN
CE
TO
TR
AN
SF
OR
M B
UIL
DIN
G D
ES
IGN
AN
D C
ON
ST
RU
CT
ION
DA
TA Public health professionals and social workers were asked to rate their interest in partnering with other types of organizations to encourage more healthy building practices. They could indicate that they were not interested, interested or very interested. The table at right lists the groups that public health professionals and social workers are most interested in partnering with.
There are no statistically signi�cant differences between the percentages of public health professionals and social workers interested in partnering with any of the organizations listed in the table, but there are some interesting trends that emerge from their responses.
■ Both public health professionals and social workers are very interested in partnering with those in public health and in the medical professions. This suggests that the biggest concern for these professionals is �nding out speci�c health impacts of healthier building practices. This aligns with their interest in learning more about health bene�ts (see page 61), but is in contrast with their lack of interest in journals as a source of information (see page 62).
■ Both are also moderately interested in partnering with government. Public health professionals see state and federal governments as good potential partners, whereas social workers are more interested in community-level government, as well as in partnering with community planners.
■ Public health professionals have at least a moderate level of interest in partnering with design/engineering professionals, but social workers are less interested.However, both are less interested in partnering with design professionals than with others in the public health or medical professions. This appears to be at odds with their selection of features inside the building as those with the highest health impacts, compared with features outside the building (see page 60), which demonstrates the importance they assign to building design and construction on occupant health. The partnership preference may simply be the result of being more familiar with government and medical professionals than those in the design and construction industry. On the other hand, the �ndings also show that some interest exists, so perhaps the opportunity is there if each side could understand what is to be gained from partnering with the other.
Public Health Professionals’ Insights on Building Impacts and Research CONTINUED
Dodge Data & Analytics 67 www.construction.com SmartMarket Report
Potential Partners to Encourage HealthierBuilding Practices
Interest In Partnering With Organizations to Encourage Healthy Building Practices (Percentage of U.S. Public Health Professionals and Social Workers Very Interested)Dodge Data & Analytics, 2016
U.S. Public HealthProfessionals
U.S. Social Workers
U.S. Public HealthProfessionals
U.S. Social Workers
Over 50% Are Very Interested in Partnering
• Physicians, Nurses or Other Healthcare Practitioners (60%)
• Public Health Researchers (53%)
• Public Health Agencies (56%)
6_07_HealthSMR_Batch6_PHE1_Partners_#01
• Physicians, Nurses or Other Healthcare Practitioners (48%)
• State or Federal Agencies (47%)• Educational Institutions (40%)
• Public Health Agencies (40%)
40% to 49% Are Very Interested in Partnering
• Public Health Researchers (39%)• Design/Engineering Professionals (37%)• Building Developers/Owners (37%)• Builder Operator/Facility Manager
Organizations (32%)
• Educational Institutions (37%)• Local Government (33%)• City/Urban/Community Planners (33%)• State or Federal Agencies (30%)
U.S. Public HealthProfessionals
U.S. Social Workers
30% to 39% Are Very Interested in Partnering
There are no signi�cant differences in the responses of public health of�cials in the U.S., compared with those in Canada, which demonstrates a general, industrywide attitude about potential partners.
TH
E D
RIV
E T
OW
AR
D H
EA
LTH
IER
BU
ILD
ING
S 2
016:
TA
CT
ICA
L IN
TE
LLIG
EN
CE
TO
TR
AN
SF
OR
M B
UIL
DIN
G D
ES
IGN
AN
D C
ON
ST
RU
CT
ION
DA
TA Buildings form the fabric of larger communities that can themselves be designed to have a positive impact on the health and well-being of the surrounding residents, whether through measures that reduce air pollution or that encourage more physical activity.
Public health professionals and socials workers were asked to select the most effective community planning and urban development investments to improve community health and well-being.
Most Effective Investments to Improve Community Health and Well-BeingIn the U.S., both of these groups highly regard strategies that improve air quality and that encourage physical exercise, but not to the same extent.
■ The highest percentage of social workers (67%) consider the creation of neighborhood renewable energy zones to reduce air pollution important. Social workers may work with disadvantaged communities struggling with asthma and other environmental respiratory ailments, so they may be particularly sensitive to these impacts. However, it is surprising that a relatively low percentage (37%) consider encouraging multiple modes of transit to be important to reduce air pollution caused by motor vehicles.
■ Social workers also place a high emphasis on encouraging physical activity. 60% believe zoning requirements for sidewalks/trails/bike paths in large developments would be an effective way to improve the health and well-being of neighborhood residents, and 57% �nd creating walkable streets effective.
■ There is less variability in the responses of public health professionals than in those of social workers. About half consider zoning requirements for sidewalks/trails/bike paths in large developments (56%), encouraging multiple modes of transit (50%), renewable energy zones (48%) and creating walkable streets (48%) effective means of improving health and well-being. Safer streets through various means also are selected by about half (53%). This suggests broad, general recognition of most of these strategies by U.S. public health professionals.
■ Neither public health professionals nor social workers consider stricter noise control regulations to be particularly effective. It would be interesting to determine if they consider noise pollution less detrimental to health than air pollution and sedentary behaviors or if concerns about enforcement or other issues are the key drivers behind this �nding.
Public Health Professionals’ Insights on Building Impacts and Research CONTINUED
SmartMarket Report Dodge Data & Analytics 68 www.construction.com
Community Health Impacts and Engaging Communities in Creating Healthier Neighborhoods
Most Effective Investments to Improve Community Health and Well-Being (According to U.S. Public Health Professionals and Social Workers)
Best Project Stage for Seeking Community Input (According to U.S. Public Health Professionals and Social Workers)
Dodge Data & Analytics, 2016
U.S. Public Health ProfessionalsU.S. Social Workers
56%
60%
Zoning Requiring Large Developments toInclude Sidewalks/Trails/Bike Paths
Investing in Safer Streets(e.g., more lighting/security cameras)
53%
43%
Encouraging Multiple Modes of Transit
50%
37%
Creating Walkable Streets
48%
57%
Creating Renewable NeighborhoodEnergy Zones
48%
67%
Stricter Noise Control Regulation
26%
17%
6_08_HealthSMR_Batch6_PHF3_CommunityInvestments_#01Dodge Data & Analytics, 2016
Conceptual Stages and ForwardEarly Planning Stages and ForwardWhen Design is Nearly CompleteNo Community Role
TA Engaging Communities in Building Design/Construction to Achieve Healthier BuildingsOver three quarters of public health professionals and social workers (78%) believe that the local community should have input into building projects in the early planning stages or earlier. In fact, one third of that total group believe that input should be sought even during the conceptual stage of a project.
They also feel that there are many potential outlets for engaging the local community. Since there are no signi�cant differences between the responses of public health professionals and social workers on these means, the chart at right shows the total combined responses.
■ Topping the list are the use of survey participation (49%) and community meetings (47%). Just under half of respondents select each of these methods. Community meetings are a common means of obtaining input, but they may not take place until after the conceptual design is developed. Surveys are an additional expense, but since many people cannot attend community meetings or don’t learn about them, they can be a way to prevent the opinions of a small but vocal minority from appearing to represent all community concerns.
■ Social media is preferred over more traditional means of notifying communities, such as local newspapers and cable channel programs. One of the biggest challenges with obtaining community input is making sure that enough members of the community are aware of what is happening. People busy with their families and jobs may not always access local news sources or sign up for community notices. Getting traction on existing social media feeds is one way to address this challenge.
■ Existing social media channels are preferred to creating new, project-speci�c ones. This is logical because it can be dif�cult to create and drive traf�c to an entirely new social media channel.
■ Getting correct information out can also be critical. Understanding the full implications of a project and considering all the options available can be a learning process for the community, and for the design and construction team as well. The most effective kinds of education sessions are those with two-way communication that allow both groups to learn more and dispel any false impressions. Interestingly, while 43% think educational sessions are good, speci�c types
Public Health Professionals’ Insights on Building Impacts and ResearchCommunity Health Impacts and Engaging Communities
in Creating Healthier Neighborhoods CONTINUED
of education, such as webinars or creation of new social media sites for that purpose, are not selected by as many respondents, suggesting that they envision other means of educating the public.
■ The relatively strong weight given to word of mouth (selected by 39%) is surprising. On one hand, information from peers and neighbors may be more trusted. On the other hand, this can also be a means for misinformation, causing apprehension about what a project can or should achieve.
Dodge Data & Analytics 69 www.construction.com SmartMarket Report
Best Means of Encouraging Community Engagement (According to U.S. Public Health Professionals and Social Workers)Dodge Data & Analytics, 2016
49%
Survey Participation
47%
Community Meetings
45%
Content Sharing on Local SocialMedia Outlets
Educational Sessions Open toLocal Residents
6_10_HealthSMR_Batch6_PHF2_EngageCommunity_#01
43%
39%
Word-of-Mouth
37%
Create New Local Social Mediato Educate Residents
37%
Local TV Advertisements
36%
Local Newspaper Articles/Advertisements
Create Webinars Available toLocal Residents
35%
23%
Local Cable ChannelPrograms
TH
E D
RIV
E T
OW
AR
D H
EA
LTH
IER
BU
ILD
ING
S 2
016:
TA
CT
ICA
L IN
TE
LLIG
EN
CE
TO
TR
AN
SF
OR
M B
UIL
DIN
G D
ES
IGN
AN
D C
ON
ST
RU
CT
ION Childhood obesity has
more than tripled in the last 30 years, affecting one in �ve American
children. The food industry spends $1.6 billion a year marketing unhealthy food and drinks to kids. Less than 25% of adolescents eat recommended amounts of fruits and vegetables, less than 20% of children walk to school and a mere 4% of elementary schools provide daily physical education.
In 2010, an interdisciplinary design team, comprised of public health scientists from the Universities of Nebraska and Virginia, and design practitioners from VMDO Architects, began a unique, multiyear collaboration to counter these trends. The team’s goal, as described by Matthew Trowbridge, MD, associate professor with the University of Virginia School of Medicine, in a short �lm about the project, was “to use the design of the school building itself to help promote healthy behaviors and long-term attitudes
about healthy eating and a culture of physical activity.”
The resulting Carter G. Woodson Education Complex, a primary and elementary school campus in Buckingham County, Virginia, stands as a national model of a school designed for health. Integral to the design of the campus, the team also produced two sets of design guidelines for school architecture, each identifying speci�c, evidence-based strategies for fostering health across 10 design domains.
Domains addressed in the Healthy Eating Design Guidelines range from commercial kitchen design to the aesthetics of healthy food environments and the need for an integrated healthy food community; domains in the Physical Activity Design Guidelines range from school siting and community connectivity to active classrooms and furniture speci�cations. The Woodson campus, completed in 2012, embodies almost all of them.
Strategies for Health Examples of speci�c strategies through which the campus supports students in developing healthy relationships with food include the layout of the cafeteria kitchen, and serving and dining areas to allow the children to see how food is prepared, served and handled in the seed-to-table cycle. The school gardens, garden lab, kitchen lab and outdoor eating terrace enable children to plant and harvest their own food, prepare and serve it, and enjoy it with a view to the landscape it came from. A grab-’n-go garden adjacent to the play areas encourages healthy snacking straight from the plant. Fresh water is prominently available in the dining commons, classrooms, corridors and outdoor play areas, and the elimination of sugary drink machines makes water an easy choice as well as a healthy one. The dining commons and adjacent learning spaces also serve the local community, extending and compounding the bene�ts of school-based health initiatives.
Examples of strategies to encourage movement throughout the day include a monumental stair in the lobby, with colored handrails at accessible heights, which makes an inviting way for children to travel between the building’s major spaces. Flexible, customizable learning spaces foster activity as well as engagement and concentration. Well-ventilated and daylit classrooms, cushioned gym �oors and furniture designed to promote micro-movement and active postures all contribute to an environment that’s ready for action.
Views and connections linking indoors to out encourage kids to take
case st
udy
A School Building That Teaches HealthBuckingham County Primary and Elementary Schools
BUCKINGHAM COUNTY, VIRGINIA
SmartMarket Report Dodge Data & Analytics 70 www.construction.com
CONTINUED
The project included a monumental stair
with colored handrails at accesshible heights, to encourage children
to use stairs rather than the elevator.
Pho
togr
aphs
Cou
rtes
y of
V
DM
O A
rchi
tes
/ Tom
Dal
y
case st
udyT
HE
DR
IVE
TO
WA
RD
HE
ALT
HIE
R B
UIL
DIN
GS
201
6: T
AC
TIC
AL
INT
ELL
IGE
NC
E T
O T
RA
NS
FO
RM
BU
ILD
ING
DE
SIG
N A
ND
CO
NS
TR
UC
TIO
N
Dodge Data & Analytics 71 www.construction.com SmartMarket Report
advantage of the school’s 15 acres of recreational space, which include gardens, playscapes, outdoor classrooms, covered areas, places for quiet re�ection and an extensive network of walking paths. Like the common areas inside the school, these outdoor facilities also serve the larger community.
Throughout the campus, well-designed signage makes the school more comprehensible to the students and nudges them toward healthier choices: informing them about the nutrients in fruits and vegetables growing in the kitchen garden, explaining why they need water, or presenting the USDA’s MyPlate guideline in ways that young children can understand.
Building as TeacherSince the school was built, the interdisciplinary team has conducted a two-year longitudinal study to measure the design’s impact. The team’s expectation was that changes in the built environment would alter default behaviors and attitudes around food and activity; behaviors and attitudes would in turn shift choices, and a feedback loop would build on itself over time, leading to a sustainable change in culture. What the researchers found was a surprise: “We recognized that something even more important is going on,” says Dina Sorensen, an associate at VMDO. “The design of the building is spawning organizational change.”
The campus design—especially the outdoor features, dining commons, active stair and signage—has boosted staff members’ cognizance of healthy behaviors around both food and activity. In response, they’re changing their
practices and programs, developing what Sorensen calls “spontaneous software pieces,” such as healthy eating contests, walking programs, policies to promote stair use and morning announcements about healthy lunch choices. These programmatic responses are precipitating cultural change much earlier than the researchers expected. A longer-term study is needed to con�rm whether the incipient cultural change will endure, says Sorenson, but these results raise the possibility that “maybe design can have a more powerful impact from the beginning.”
The campus’ carefully designed graphic layer is also proving effective. The kids gravitate toward the graphics, �nd them memorable and pick up on the educational nuggets they contain. This result implies great potential, says Sorensen, for a well-designed visual environment to act “as an antidote to what [the children] are bombarded with when they leave school.”
The physical activity component of the study, now in the peer-review process prior to publication, is
equally revealing. By contrast with prevailing emphases on moderate to vigorous physical activity for an hour a day—essentially sports, to which not every child has access, notes Sorensen—the Buckingham study examined the impact of the built environment on daily physical activity at low to moderate levels: whether and how design can encourage less sedentary behavior, and increase movement over the course of the day. “We had great results,” says Sorensen. “They tell a new story about the value of movement: that an increase even in the low to moderate range is highly valuable, especially for kids.” n
Buckingham County Primary and Elementary Schools BUCKINGHAM COUNTY, VIRGINIA
Project Facts and Figures
ProjectBuckingham County Primary and Elementary Schools at the Carter G. Woodson Education Complex
LocationDillwyn, Virginia
Building TypePublic School
Area134,015 Sq Ft
Cost$18,370,000
CompletedAugust 2012
Project ArchitectsVMDO Architects, P.C.
Research PartnersVMDO Architects, P.C., University of Nebraska Medical Center, University of Virginia School of Medicine
LEED Certi�cationGold
stats
CONTINUED
Signage designed to appeal to children encourages healthier behaviors, like drinking water, throughout the school.
TH
E D
RIV
E T
OW
AR
D H
EA
LTH
IER
BU
ILD
ING
S 2
016:
TA
CT
ICA
L IN
TE
LLIG
EN
CE
TO
TR
AN
SF
OR
M B
UIL
DIN
G D
ES
IGN
AN
D C
ON
ST
RU
CT
ION
SmartMarket Report Dodge Data & Analytics 72 www.construction.com
Two online surveys were conducted by Dodge Data & Analytics (DD&A) to investigate the attitude of industry players and public health professionals toward the impact of buildings and building design on occupant health.
Respondents to both surveys were asked at the beginning of each to consider health and well-being as de�ned as a complete state of physical, mental and social health and well-being, and not merely the absence of disease or in�rmity. Additional clari�cations were provided for physical, mental and social health as mouseovers that respondents could choose to view.
Construction Industry Survey975 construction professionals responded to an online survey between February 4 and March 24, 2016. Respondents fall into the following four categories in the analysis:■ Owner: Includes 150 respondents
working for building owners, building managers, building agents, developers, real estate investment trusts or pension fund advisors. All respondents had to be directly involved in or responsible for either design and construction or operations/facilities management at their company.
■ Architect: Primarily consists of respondents working for architecture �rms, but also includes some from architecture/engineering and engineering �rms, for a total of 561 respondents.
■ Interior Designer: Includes 56 respondents working as interior designers.
■ Contractor: Includes 208
Building Impact on Health Study Research
Methodology:
respondents working for general contractors, construction managers, design/build �rms and specialty trade contractors.
Survey sample was drawn from the DD&A Architect and Contractor Panels, the Dodge construction database and association memberships. Partnering organizations included: American Institute of Architects, American Society of Interior Designers, CAE, Canada Green Building Council, Delos, IDC Canada, National Association of Real Estate Investment Managers, Royal Architectural Institute, U.S. Green Building Council and World Green Building Council.
SURVEY RESPONDENTS BY COUNTRYSurvey responses came from 45 countries: Argentina, Australia, Austria, Bolivia, Brazil, Canada, China, Colombia, Czech Republic, Finland, France, Germany, Greece, Hong Kong, India, Indonesia, Israel, Italy, Japan, Kuwait, Lebanon, Malaysia, Mexico, Netherlands, Oman, Pakistan, Panama, Peru, Philippines, Poland, Qatar, Saudi Arabia, Serbia, South Africa, Spain, Sweden, Switzerland, Taiwan, Turkey, Ukraine, United Arab Emirates, United Kingdom, Uruguay, and the U.S. However, only the U.S. and Canada had suf�cient respondents to be examined separately. ■ U.S.: 671 Respondents
The margin of error based on a 95% con�dence interval is +/- 3.7% for the U.S. and +/- 7.1% for Canada. The margin of error for all respondents is +/- 3.1%.
U.S. respondents are also analyzed by the degree of green involvement of their companies. Responses are contrasted between those with a high level of green involvement (green projects account for more than 60% of their companies’ overall work by value) and those with a low level of green involvement (green projects account for 15% or less of their overall work by value).■ High Green Involvement:
189 U.S. Respondents■ Low Green Involvement:
203 U.S. Respondents
Public Health Survey122 public health workers responded to an online survey between March 7 and March 22, 2016. ■ 62 U.S. Public Health Professionals■ 30 U.S. Social Workers■ 30 Canadian Public
Health Professionals
120 respondents were recruited from a panel of public health workers, with two recruited from design and engineering �rms. Respondents self-classi�ed as having public health or social worker professional training/background.
The margin of error, based on a 95% con�dence interval for all respondents is +/- 8.9%, with a margin of error of +/-10.2% for the U.S. respondents and +/- 18% for respondents from Canada. n
SmartMarket Report
Produced with support from
ResourcesOrganizations, websites and publications to help you get smarter about creating healthier buildings.
ACKNOWLEDGEMENTS:
The authors wish to thank all of our partners in this effort. We thank our premier partners for providing the support that launched this project: Delos and the Canada Green Building Council (CaGBC).
In addition, we thank all our contributing partners for their support of this effort, including CBRE, Dewberry and the U.S. Green Building Council (USGBC). We also thank Armstrong Ceiling Solutions and the Regenerative Network for their support as well.
We also thank our research partners, upon whom we relied for their expertise on the topic of building impacts on health and for the insights of their members. CaGBC, Delos and USGBC partnered in the research effort, in addition to their financial contribution to the study, and we thank them again for those efforts. We also thank the American Institute of Architects, the American Society of Interior Designers, the National Association of Real Estate Investment Managers and the World Green Building Council for their participation in the study. We also thank the organizations that partnered with CaGBC on survey distribution, including CAE, IDC Canada and the Royal Architectural Institute.
Finally, we would like to thank the firms that provided information about their projects and supporting images.
Contributing PartnersCBRE: www.cbre.comDewberry: www.dewberry.comU.S. Green Building Council: www.usgbc.org
Research Partners:American Institute of Architects: www.aia.orgAmercian Society of Interior Designers: www.asid.orgNational Association of Real Estate Investment
Managers: www.nareim.orgWorld Green Building Council: www.worldgbc.org
Government and Other Resources:Building Green, Inc: www.buildinggreen.comCenters for Disease Control and Prevention
Healthy Places: www.cdc.gov/healthyplacesCenters for Disease Control and Prevention Healthy
Eating Design Guidelines for School Architecture: www.cdc.gov/pcd/issues/2013/12_0084.htmDeclare at the International Living Future
Institute: living-future.org/declareGreen Seal: www.greenseal.orgGreenguard Certification: greenguard.org/en/index.aspxHarvard School of Public Health, The
Impact of Green Buildings on Cognitive
Function: www.chgeharvard.org/resource/impact-green-buildings-cognitive-functionThe Health Impact Project: www.pewtrusts.org/en/projects/health-impact-projectLiving Building Challenge: living-future.org/lbcRobert Wood Johnson Foundation: www.rwjf.org/en.htmlU.S. Environmental Protection Agency Sustainable
and Healthy Communities Research Program: www.epa.gov/aboutepa/about-sustainable-and-healthy-communities-research-programWorld Health Organization: who.int/en
Canada Green Building Council
www.cagbc.org
Delos
delos.com International Well Building Institute:
www.wellcertified.com
Dodge Data & Analytics
Main Website: construction.comDodge: construction.com/dodgeResearch & Analytics: construction.com/dodge/dodge-market-research.aspSweets: sweets.comSmartMarket Reports: analyticsstore.construction.com