49
The Dynamics of Information Bernardo A. Huberman Information Dynamics Laboratory HP Labs
| Date post: | 27-Dec-2015 |
| Category: |
Documents |
| Upload: | jody-mitchell |
| View: | 213 times |
| Download: | 0 times |

The Dynamics of Information
Bernardo A. Huberman
Information Dynamics LaboratoryHP Labs

tapping tacit knowledge within social networks
• discover informal communities
• determine how information flows through
these communities
• use that knowledge to discover what
people are about and harvest their
preferences and knowledge

discovering communities
Bruegel, Peter the Younger. Village Feast
traditional methods accurate but laborious

informal communities
communities that form around tasks or topics– scientific and technical communities (ziman, crane)– bureaucracies (crozier)
– how they grow and evolve to solve problems (huberman & hogg)
– how information flows within organizations (allen)
the measurement problem: interviews and surveys are accurate but time consuming. worse, they don’t scale

uncovering communities with e-mail tyler,huberman and wilkinson, in Communities and
Technologies, Kluwer Academic (2003)
• e-mail is a rich source of communication data– virtually everyone in the “knowledge economy” uses it– It provides data in a convenient format for research

hp labs email network
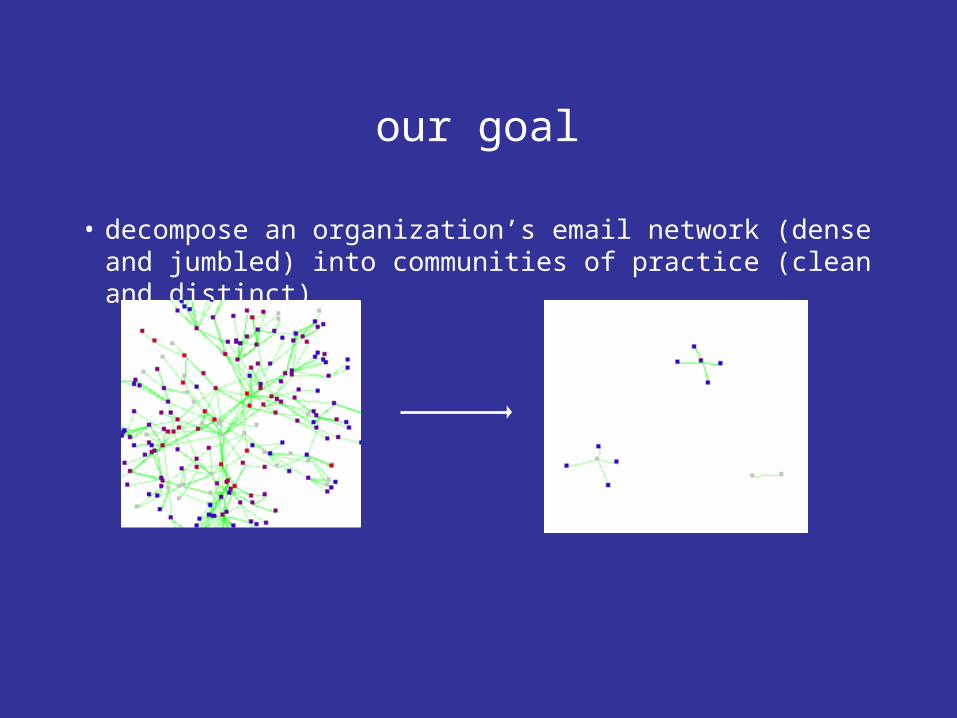
our goal
• decompose an organization’s email network (dense and jumbled) into communities of practice (clean and distinct)

a graph has community structure if it consists of groups of nodes with many more links within each group than between different groups
find communities using betweenness centrality
betweeness of an edge: number of shortest paths that traverse it
a problem
betweeness centrality is slow (scales as the cube of the number of nodes (Brandes, Girvan and Newman, Wilkinson and Huberman)
we have designed an algorithm that runs much faster (linearly in the number of nodes (Wu and Huberman, Eur. Phys. Journal B38, 331-338 (2004).

a different methodwu and huberman Eur. Phys. Journal, B38, 331 (2004)

rragan HPL Advanced Studiesolmos HPL Advanced Studiessamuels HPL Advanced Studiessaifi HPL Advanced Studieszhiyong HPL Advanced Studiesgunyoung HPL Advanced Studieslarade HPL Advanced Studies
penrose Mobile & Media Systems Labmistyr HPL Advanced Studiesvinayd HPL Advanced Studiesseroussi HPL Advanced Studiestsachyw HPL Advanced Studies
reedrob University Relationscarterpa University Relationssbrodeur University Relationspruyne Internet Systems & Storage Labbouzon University Relationslmorell University Relationsmarcek University Relations
venky Mobile & Media Systems Labdohlberg HPL Advanced Studieskvincent Hardcopy Tech Lab pmcc University Relationstrangvu HPL Communications markstei HPL Advanced Studieshollerb HPL Research Operationskrishnav Handheld HQ babcock REWS Americas gita Solutions & Services Tech Cntrbgee HPL - Research Operationsmeisi HPL - Research Operationshenze Information Access Lab
kuekes HPL Advanced Studiesthogg Systems Research Labkychen Intelligent Enterprise Tech Lblfine Systems Research Labakarp Intelligent Enterprise Tech Lb
examples
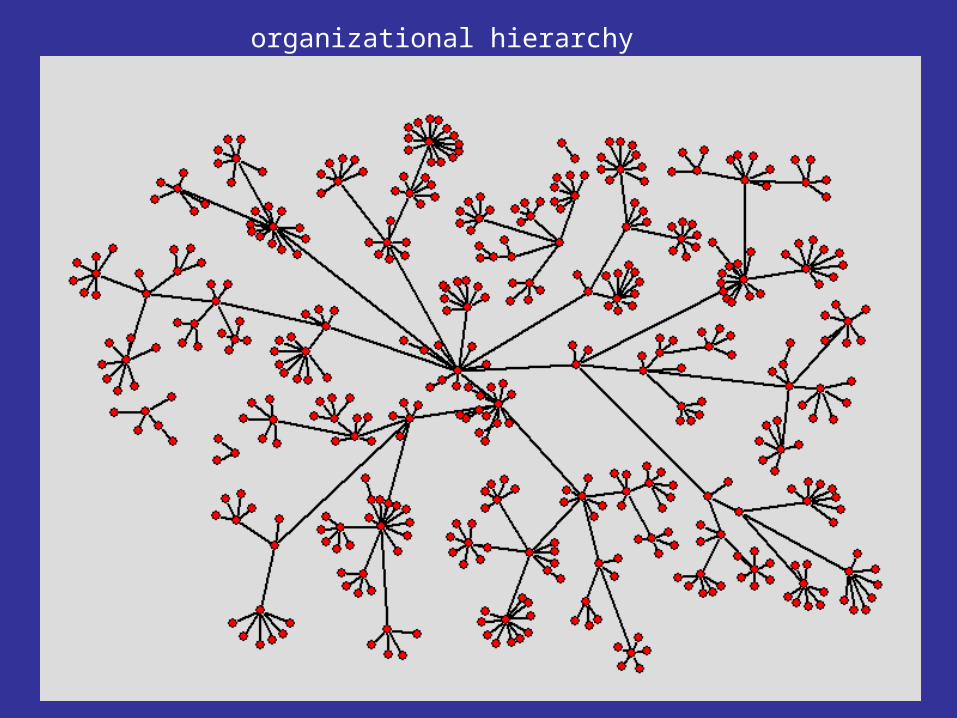
organizational hierarchy
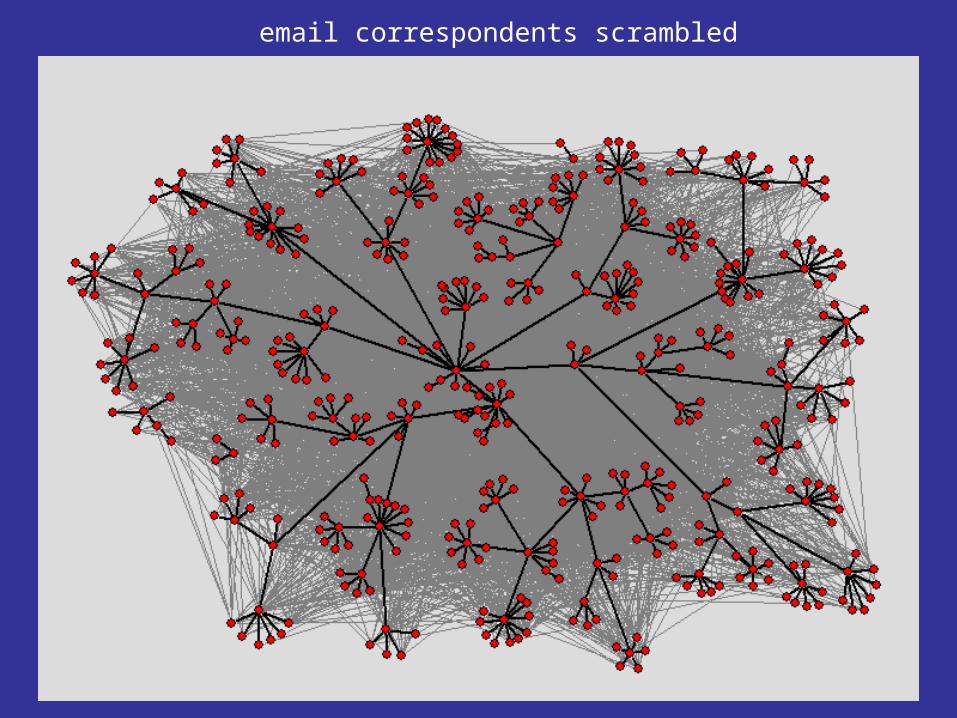
email correspondents scrambled

actual email correspondence

earlier documents are blue, later ones are red.size of node reflects the number of users accessing the document.
document similarity by usagesimilarity: overlap in users accessing documents
l. adamic

HPS-mining knowledge briefs
Paul Johansen SAM AMCI Tech Consulting Systems Integration 32 docs viewed
Paul Johansen is a consultant with the .NET Solutions group within the Central EMS Practice in Minneapolis, Minnesota. Paul specializes in e-commerce UI and middle tier development and their related Microsoft technologies. In his spare time he enjoys the freezing Minnesota weather, cheering for the Vikings, Twins, Wolves and Wild and traveling the world.
users similar to Paul Johansen
score sim name unit group function family #docs
0.35 John R Bugarin SAM AMCI Solution Architech Systems Integration 30
0.35
John Bugarin is a member of the .NET Results North American Team. He has extensive experience developing customized solutions in Domino, Microsoft, and WebSphere. He is certified MCSD for .NET, MCAD for .NET, MCSD for Visual Studio 6.0, MCSE for Windows 2000, and MCDBA for MSSQL 2000.
0.29 Tom Kern SAM AMCI Tech Consulting Systems Integration 236
0.29
Tom Kern is a consultant for the Enterprise Microsoft Services .Net Solutions practice. Tom has worked on a variety of custom software projects based on Microsoft technologies.
0.26 Martyn Dowsett SEM EMCI Tech Consulting Systems Integration 46
0.26
Martyn Dowsett is a member of EMEA C&I currently working with Microsoft .NET. He has been designing, developing, and testing various kinds of software since 1979 and has experienced many examples of "how not to do things". He has worked on many projects and is experienced in the full project lifecycle. His current interests are round all things .Net.

a new people finder
there is a trove of information in power point presentations,
public repositories within the organization, and the internal
website of the enterprise
peoplefinder2 allows you to find out what people are about, as
opposed to where in the organization they belong
it also discovers who is working on what
http://shock.hpl.hp.com/peoplefinder/
e. adar and l. adamic


information flow
how does information flow in a community or organization?
does the structure of the social network affect it?
how far does it spread?
Wu, Adamic and Huberman

recommendation networks
15 million recommendations and 4 million customers
j. leskovec, l.adamic and b.a. huberman

does receiving more recommendationsincrease the likelihood of buying?
BOOKS DVDs
2 4 6 8 100
0.01
0.02
0.03
0.04
0.05
0.06
Incoming Recommendations
Pro
ba
bili
ty o
f B
uyi
ng
10 20 30 40 50 600
0.02
0.04
0.06
0.08
Incoming Recommendations
Pro
ba
bili
ty o
f B
uyi
ng

so, how effective is viral marketing?
• recommendations do not propagate very far (on average)
• but there are rare instances where the information chain is long
• they are not very effective at eliciting purchases

the future
we all care about it.
and invest resources in finding out about it.
Caravaggio ,The Fortune Teller, 1596-97

“it is hard to predict anything, especially the future”
Niels Bohr

how do organizations predict?
• they ask the experts (and consultants)
• have meetings (lots of them)
• designate someone as forecaster
• take a vote (not very good)

an alternative: markets
• markets aggregate and reveal information
(hayek, lucas, etc.)
• to predict outcomes, use markets where the
asset is information (rather than a physical good)
• example:
– iowa electronic markets
markets within organizations-problematic-
• low participation
• illiquidity
• information traps
• hard to motivate
• easily manipulated

a new mechanism(with kay-yut chen and leslie fine)
• it identifies participants that have good predictive talents, and extracts their risk attitudes
• it induces them to be truthful
• while avoiding the pitfalls of small groups
• it aggregates information in nonlinear fashion
Information Systems Frontiers, Vol. 5, 47-61 (2003)
Management Science, Vol. 50, 983-994 (2004)
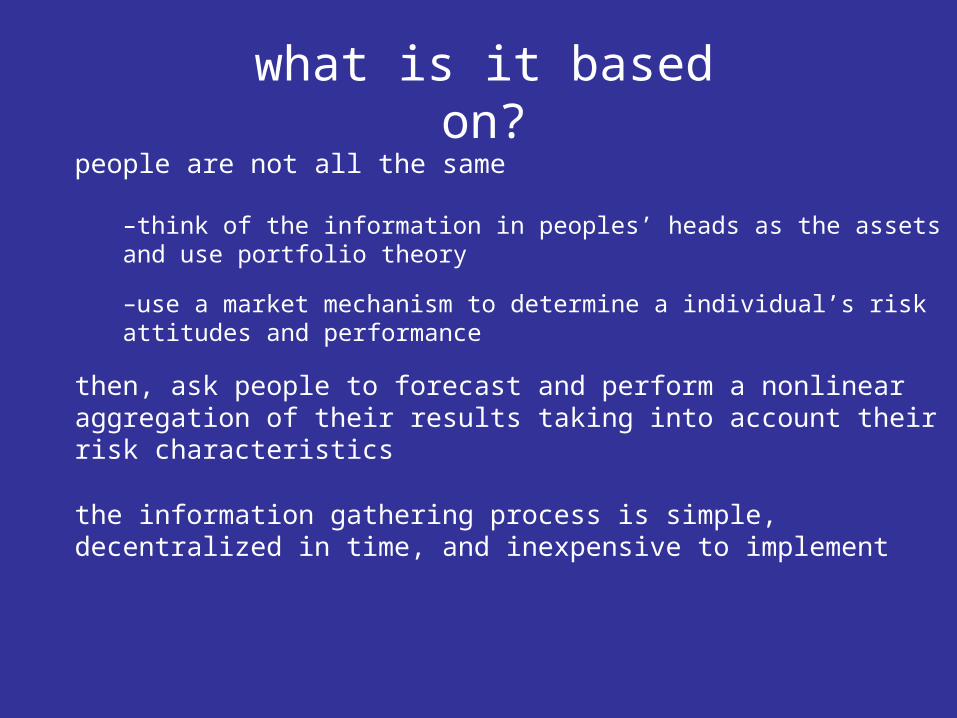
people are not all the same
–think of the information in peoples’ heads as the assets and use portfolio theory
–use a market mechanism to determine a individual’s risk attitudes and performance
then, ask people to forecast and perform a nonlinear aggregation of their results taking into account their risk characteristics
the information gathering process is simple, decentralized in time, and inexpensive to implement
what is it based on?

two stages
stage 1: a market for contingent securities.
it provides behavioral information, such as risk
attitudes –synchronous-
stage 2: participants generate predictions on
outcomes, which are then aggregated.
incorporates behavioral information
-asynchronous-

stage 2- forecasting
• participants are given 100 tickets
• to be allocated among 10 securities
• this determines probabilities
• true state pays according to the number of tickets allocated to it

aggregating predictions
the probability of event S occurring, conditioned on I, is given by
with β an exponent that denotes behavioral attitudes>1 risk averse<1 risk seeking=1 risk neutral
ssss
sss
N
N
N
N
ppp
pppIsP
...
...|
2
2
1
1
2
2
1
1

what determines the exponent?
i=r(V i / i)c
holding value/risk- measures relative risk of individuals
normalization constant
~sum of prices/winning payoffIt measures market risk
ssss
sss
N
N
N
N
ppp
pppIsP
...
...|
2
2
1
1
2
2
1
1

experiments
• human subjects in the laboratory (hp labs)
• each group receives diverse information
• run the two-stage mechanism
• and measure its performance
0.000
0.100
0.200
0.300
0.400
0.500
0.600
0.700
0.800
0.900
1 2 3 4 5 6 7 8 9 10
Series1
Series2
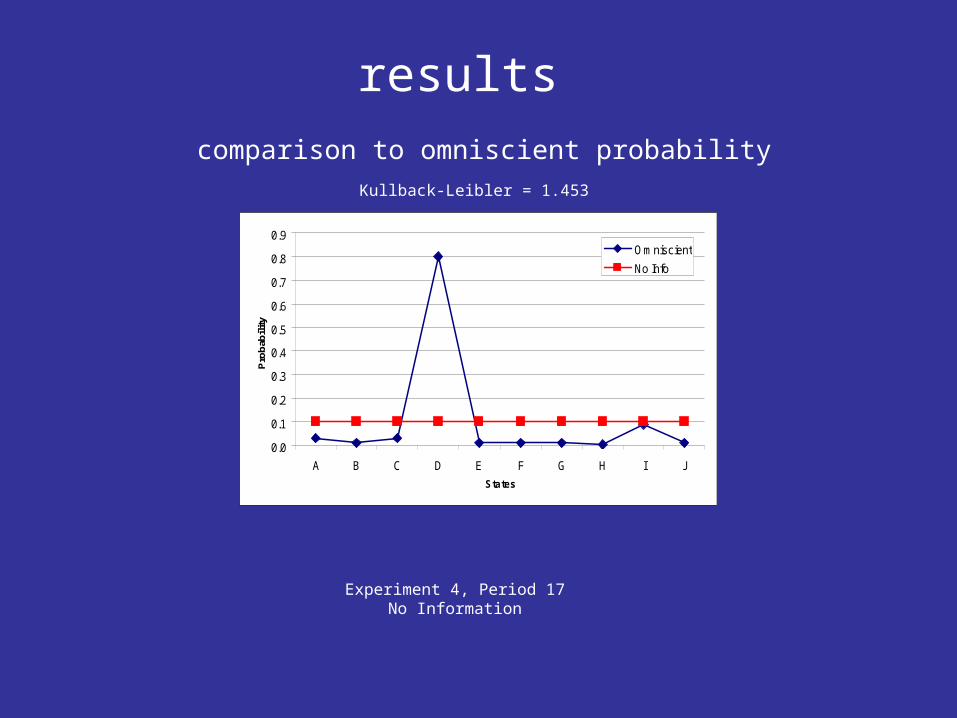
Kullback-Leibler = 1.453
comparison to omniscient probability
Experiment 4, Period 17No Information
0.0
0.1
0.2
0.3
0.4
0.5
0.6
0.7
0.8
0.9
A B C D E F G H I J
States
Pro
bab
ilit
yOmniscient
No Info
results

0.000
0.100
0.200
0.300
0.400
0.500
0.600
0.700
0.800
0.900
1 2 3 4 5 6 7 8 9 10
Series1
Series2
0.000
0.100
0.200
0.300
0.400
0.500
0.600
0.700
0.800
0.900
1 2 3 4 5 6 7 8 9 10
Kullback-Leibler = 1.337
comparison to omniscient probability
Experiment 4, Period 171 Player
0.0
0.1
0.2
0.3
0.4
0.5
0.6
0.7
0.8
0.9
A B C D E F G H I JStates
Pro
bab
ilit
yOmniscient
IA Mechanism
results

0.000
0.100
0.200
0.300
0.400
0.500
0.600
0.700
0.800
0.900
1 2 3 4 5 6 7 8 9 10
Series1
Series2
0.000
0.100
0.200
0.300
0.400
0.500
0.600
0.700
0.800
0.900
1 2 3 4 5 6 7 8 9 10
Series1
Series2
0.000
0.100
0.200
0.300
0.400
0.500
0.600
0.700
0.800
0.900
1 2 3 4 5 6 7 8 9 10
Series1
Series2
Kullback-Leibler = 1.448
comparison to omniscient probability
Experiment 4, Period 172 Players Aggregated
0.0
0.1
0.2
0.3
0.4
0.5
0.6
0.7
0.8
0.9
A B C D E F G H I JStates
Pro
bab
ilit
yOmniscient
IA Mechanism
results

0.000
0.100
0.200
0.300
0.400
0.500
0.600
0.700
0.800
0.900
1 2 3 4 5 6 7 8 9 10
Series1
Series2
0.000
0.100
0.200
0.300
0.400
0.500
0.600
0.700
0.800
0.900
1 2 3 4 5 6 7 8 9 10
Series1
Series2
0.000
0.100
0.200
0.300
0.400
0.500
0.600
0.700
0.800
0.900
1 2 3 4 5 6 7 8 9 10
Series1
Series2
Kullback-Leibler = 1.606
comparison to omniscient probability
Experiment 4, Period 173 Players Aggregated
0.0
0.1
0.2
0.3
0.4
0.5
0.6
0.7
0.8
0.9
A B C D E F G H I JStates
Pro
bab
ilit
yOmniscient
IA Mechanism
results

0.000
0.100
0.200
0.300
0.400
0.500
0.600
0.700
0.800
0.900
1 2 3 4 5 6 7 8 9 10
Series1
Series2
0.000
0.100
0.200
0.300
0.400
0.500
0.600
0.700
0.800
0.900
1 2 3 4 5 6 7 8 9 10
Series1
Series2
0.000
0.100
0.200
0.300
0.400
0.500
0.600
0.700
0.800
0.900
1 2 3 4 5 6 7 8 9 10
Series1
Series2
Kullback-Leibler = 1.362
comparison to omniscient probability
Experiment 4, Period 174 Players Aggregated
0.0
0.1
0.2
0.3
0.4
0.5
0.6
0.7
0.8
0.9
A B C D E F G H I JStates
Pro
bab
ilit
yOmniscient
IA Mechanism
results

0.000
0.100
0.200
0.300
0.400
0.500
0.600
0.700
0.800
0.900
1 2 3 4 5 6 7 8 9 10
Series1
Series2
0.000
0.100
0.200
0.300
0.400
0.500
0.600
0.700
0.800
0.900
1 2 3 4 5 6 7 8 9 10
Series1
Series2
0.000
0.100
0.200
0.300
0.400
0.500
0.600
0.700
0.800
0.900
1 2 3 4 5 6 7 8 9 10
Series1
Series2
Kullback-Leibler = 0.905
comparison to omniscient probability
Experiment 4, Period 175 Players Aggregated
0.0
0.1
0.2
0.3
0.4
0.5
0.6
0.7
0.8
0.9
A B C D E F G H I JStates
Pro
bab
ilit
yOmniscient
IA Mechanism
results

0.000
0.100
0.200
0.300
0.400
0.500
0.600
0.700
0.800
0.900
1 2 3 4 5 6 7 8 9 10
Series1
Series2
0.000
0.100
0.200
0.300
0.400
0.500
0.600
0.700
0.800
0.900
1 2 3 4 5 6 7 8 9 10
Series1
Series2
0.000
0.100
0.200
0.300
0.400
0.500
0.600
0.700
0.800
0.900
1 2 3 4 5 6 7 8 9 10
Series1
Series2
Kullback-Leibler = 1.042
comparison to omniscient probability
Experiment 4, Period 176 Players Aggregated
0.0
0.1
0.2
0.3
0.4
0.5
0.6
0.7
0.8
0.9
A B C D E F G H I JStates
Pro
bab
ilit
yOmniscient
IA Mechanism
results
0.000
0.100
0.200
0.300
0.400
0.500
0.600
0.700
0.800
0.900
1 2 3 4 5 6 7 8 9 10
Series1
Series2
0.000
0.100
0.200
0.300
0.400
0.500
0.600
0.700
0.800
0.900
1 2 3 4 5 6 7 8 9 10
Series1
Series2
0.000
0.100
0.200
0.300
0.400
0.500
0.600
0.700
0.800
0.900
1 2 3 4 5 6 7 8 9 10
Series1
Series2
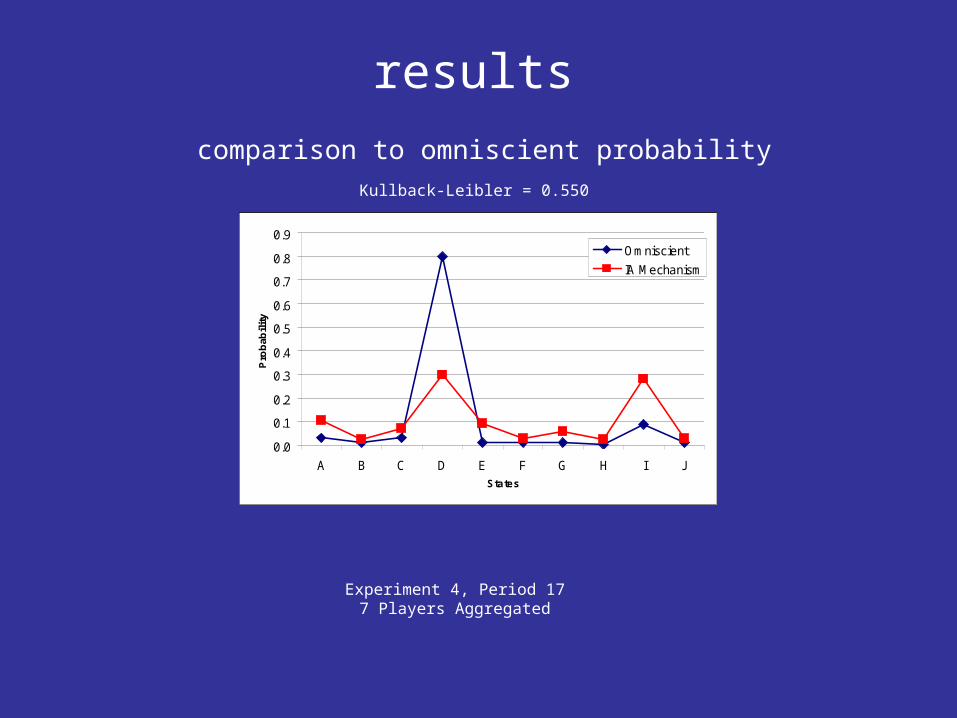
Kullback-Leibler = 0.550
comparison to omniscient probability
Experiment 4, Period 177 Players Aggregated
0.0
0.1
0.2
0.3
0.4
0.5
0.6
0.7
0.8
0.9
A B C D E F G H I JStates
Pro
bab
ilit
yOmniscient
IA Mechanism
results

0.000
0.100
0.200
0.300
0.400
0.500
0.600
0.700
0.800
0.900
1 2 3 4 5 6 7 8 9 10
Series1
Series2
0.000
0.100
0.200
0.300
0.400
0.500
0.600
0.700
0.800
0.900
1 2 3 4 5 6 7 8 9 10
Series1
Series2
0.000
0.100
0.200
0.300
0.400
0.500
0.600
0.700
0.800
0.900
1 2 3 4 5 6 7 8 9 10
Series1
Series2
Kullback-Leibler = 0.120
comparison to omniscient probability
Experiment 4, Period 178 Players Aggregated
0.0
0.1
0.2
0.3
0.4
0.5
0.6
0.7
0.8
0.9
A B C D E F G H I JStates
Pro
bab
ilit
yOmniscient
IA Mechanism
results
0.000
0.100
0.200
0.300
0.400
0.500
0.600
0.700
0.800
0.900
1 2 3 4 5 6 7 8 9 10
Series1
Series2
0.000
0.100
0.200
0.300
0.400
0.500
0.600
0.700
0.800
0.900
1 2 3 4 5 6 7 8 9 10
Series1
Series2
0.000
0.100
0.200
0.300
0.400
0.500
0.600
0.700
0.800
0.900
1 2 3 4 5 6 7 8 9 10
Series1
Series2
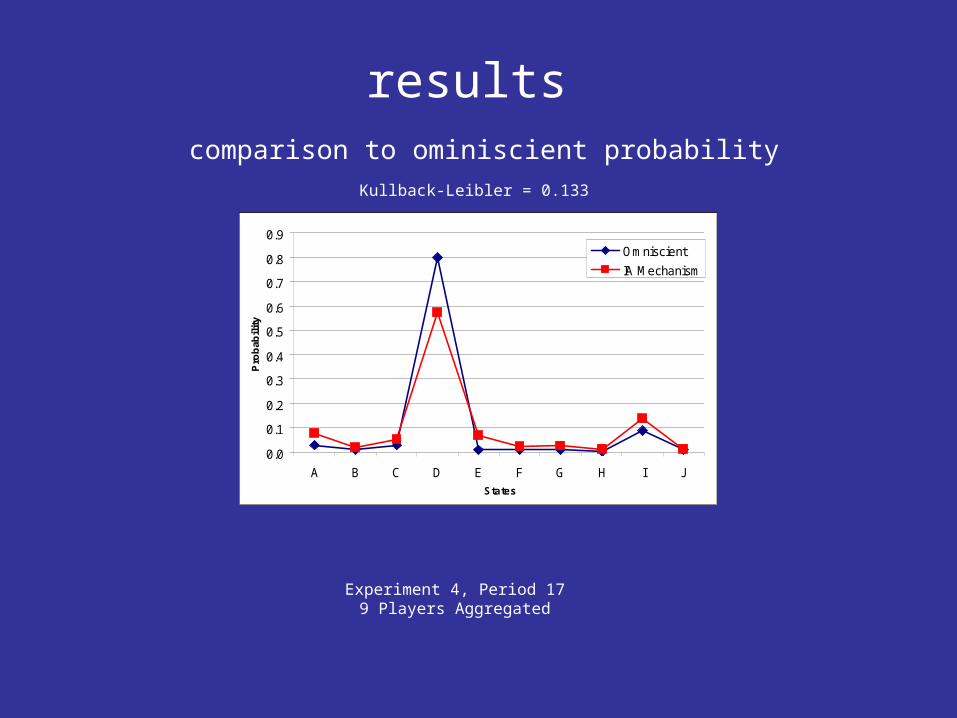
Kullback-Leibler = 0.133
comparison to ominiscient probability
Experiment 4, Period 179 Players Aggregated
0.0
0.1
0.2
0.3
0.4
0.5
0.6
0.7
0.8
0.9
A B C D E F G H I JStates
Pro
bab
ilit
yOmniscient
IA Mechanism
results

overall performance
0.0
0.1
0.2
0.3
0.4
0.5
0.6
0.7
0.8
0.9
A B C D E F G H I J
States
omniscience
ia mechanism
market
best individual
better than the best!

predicting in the real world
(as opposed to the laboratory)
we ran a pilot test with one of hp divisions
15 managers distributed worldwide
goal: to predict monthly revenues and profits

Implied Probabilities of Revenue Bins, September 2003
0%
10%
20%
30%
40%
50%
60%
70%
80%
90%
100%
Official Projection
Implied Probabilities of Revenue Bins, September 2003
0%
5%
10%
15%
20%
25%
30%
35%
Official Projection
Implied Probabilities of Revenue Bins, September 2003
0%
5%
10%
15%
20%
25%
30%
35%
Actual Value$1053m
Official Projection
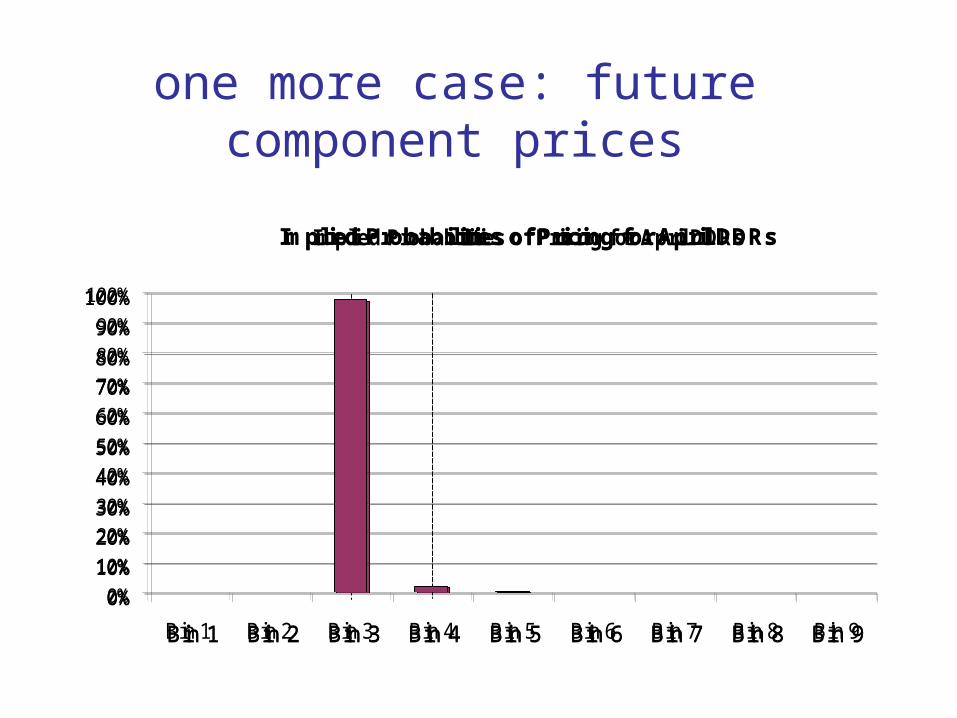
one more case: future component prices
Implied Probabilities of Pricing for April DDRs
0%
10%
20%
30%
40%
50%
60%
70%
80%
90%
100%
Bin 1 Bin 2 Bin 3 Bin 4 Bin 5 Bin 6 Bin 7 Bin 8 Bin 9
Official Projection ($19)
Actual ($18.40)
Implied Probabilities of Pricing for April DDRs
0%
10%
20%
30%
40%
50%
60%
70%
80%
90%
100%
Bin 1 Bin 2 Bin 3 Bin 4 Bin 5 Bin 6 Bin 7 Bin 8 Bin 9
Official Projection ($19)
Implied Probabilities of Pricing for April DDRs
0%
10%
20%
30%
40%
50%
60%
70%
80%
90%
100%
Bin 1 Bin 2 Bin 3 Bin 4 Bin 5 Bin 6 Bin 7 Bin 8 Bin 9
http://www.hpl.hp.com/research/idl
it is all about the power of the implicit
for more information go to:


![DIDI-HUBERMAN G. Image Matiere Immanence [Entr]](https://static.documents.pub/doc/80x56/577cc3b31a28aba71196e790/didi-huberman-g-image-matiere-immanence-entr.jpg)


