Page 1
The Dynamics of Mergers among (Ex)Co-Conspirators
in the Shadow of Cartel Enforcement∗
Leslie M. Marx and Jun Zhou†
March 12, 2015
We investigate cartelists’ merger behavior using European Commission (EC) cartel decisions over a
28-year span and information on cartelists’ merger activities over the last 30 years. We find that
mergers occur frequently but that they cluster in a few particular industries and usually include
only a minority of the cartel participants. The EC’s leniency program appears to expedite mergers,
while the EC’s cartel settlement procedure appears to delay mergers. After cartel dissolution, co-
conspirators merge at a substantially greater pace. The results shed light on the design of merger
policies and enforcement programs against cartels.
Journal of Economic Literature Classification Numbers: D43, K21, K42, L13.
Keywords: antitrust, leniency, recurrent events discrete-time survival analysis
1. Introduction
Changes in ownership and control are frequent among cartel co-conspirators: in over one-
third of the cartels discovered by the European Commission (hereafter “EC”) between 1985
and 2012, conspirators sold majority shares or relocated major production and sales capacities
to their co-conspirators. What motivated the conspirators to merge? The EC introduced a
leniency program in July 1996, with the intent of destabilizing and deterring cartels. The
program gave the first-in cartel confessor the opportunity to avoid sanctions (subject to certain
∗We acknowledge comments from Jan Boone, Eric van Damme, Giuseppe Dari-Mattiacci, Stephen Davies,
Carmine Guerriero, Kostas Karantininis, Mario Mariniello, Sander Onderstal, Peter Ormosi, Daniel Rubinfeld,
Maarten Pieter Schinkel, Catherine Schaumans, Jeroen van de Ven, Bert Willems and seminar participants at
Tilburg Law and Economics Center and the Amsterdam Center of Law and Economics.
†Marx is at Duke University. Zhou is affiliated with Tilburg Law and Economics Center. Send correspondence
to [email protected]
1
Page 2
2
conditions). In February 2002, the program was revised to guarantee automatic immunity for
first-in confessors. While before July 1996 there was, on average, one merger or joint venture in
every 40 cartels per year, the rate more than doubled during the period July 1996 to June 2008.
In June 2008, the EC introduced a settlement procedure through which late confessors may
obtain fine reductions outside the leniency program. Following the settlement introduction,
merger and joint venture rates fell below the pre-leniency levels.
This paper is one of the first to provide a systematic empirical analysis of the dynamic
nature of horizontal mergers among co-conspirators, from the date that a firm joins a cartel, to
the time that it mergers with a co-conspirator, and up to the firm’s liquidation, bankruptcy, or
cessation of production. The main objectives are to describe the distribution of mergers over
time and examine the determinants of mergers. Particular emphasis is placed on the effect on
merger timing of the EC’s leniency program and settlement procedure and the effect of cartel
termination.
Despite extensive research on mergers and cartels, the link between the two forms of in-
dustrial organization has received little attention.1 Two notable exceptions are Bittlingmayer
(1985) and Kumar et al. (2013). Using a time series of historical US antitrust cases and merger
activities, Bittlingmayer examines the impact on mergers of the Department of Justice’s (here-
after “DOJ”) early cartel enforcement. He finds that the DOJ’s enforcement, measured as
the number of case filings, is significantly correlated with the number of mergers. Kumar et
al. present descriptive evidence of merger activities following cartel dissolution in eight of ten
largest US manufacturing industries around the introduction of the 1980 Sherman Act. Us-
ing information on 55 European Commission cartel decisions between 2001 and 2010, they
find mergers, acquisitions, or joint ventures after cartel dissolution in nearly half of the sam-
pled cases. Other related earlier work includes Mueller (1996) who reviews the history of US
antimerger policy, Boone (2006) who shows that firms may use inefficient merger to relax com-
petition constraints, and Vasconcelos (2005) who studies the effect of merger on cartel stability
in the presence of cost asymmetry.
Little systematic analysis has been performed regarding the importance of cartel dissolution
for the variations in merger patterns over time and across firms and antitrust policies: A glance
at the sample of mergers by the EC’s convicted cartelists in period December 1983 to July 1996
1Kumar et al. (2013) make a similar remark on the inadequate attention that this issue receives in the
literature.
Page 3
3
reveals that nearly two-thirds of the mergers occurred before the conspirators ceased collusion;
however, the pattern is reversed after July 1996, when the great majority of mergers took place
after a conspirator left the cartel. Probing further into the data reveals that mergers usually
included only a minority of the cartel members and clustered in a few particular industries.
The empirical analysis of merger by cartelists so far has largely overlooked these variations.
Our research is motivated by the relatively meager understanding of the dynamics of merger
activity among cartel members. We use reduced-form Poisson regression to test whether merger
rates increase following leniency introduction and whether the rates fall following the introduc-
tion of a settlement procedure. We use multiple-spell discrete-time hazard regression to test
whether the leniency programs expedite merger and whether the settlement procedure delays
merger. The hazard models also enable us to test the effect of cartel breakdown on merger that
is suggested by the recent theory (Kumar et al., 2013). We are able to control for economic
conditions (Jovanovic and Rousseau, 2002; Alvarez and Stenbacka, 2006; Thijssen, 2005; Smit
et al., 2005; Mason and Weeds, 2005; Rhodes-Kropf and Viswanathan, 2004; and Toxvaerd,
2008), market structure (Hackbarth and Miao, 2011), the EC’s merger prohibition, remedies
and withdrawal ratios (Duso, Gugler and Szucs, 2013) and other factors that are suggested by
the literature to affect merger decisions.
Our data consist of the complete set of cartel decisions issued by the European Commission
(hereafter “EC”) and the European Court of Justice between December 18, 1985, and October
19, 2013. We merge the cartel data with a data set of conspirators’ merger, acquisition and
joint venture activities (hereafter they are collectively referred to as “merger” unless mentioned
otherwise) between April 1983 and December 2012. The EC’s leniency introduction on July 18,
1996, and the introduction of cartel settlement procedure on June 30, 2008, provide exogenous
shocks that identify the effect of cartel enforcement innovations on merger.
Our first principal finding is that the EC’s leniency programs increase the frequency and
pace of mergers. The impacts are statistically significant, large in magnitude, and robust to
various sample choices and specifications. The result is intuitive: firms prefer collusion until
the policy environment makes it harder for cartels to survive, suggesting that the incremental
profit of collusion over merger may have decreased following the 1996 leniency introduction.
Our second principal finding is that the EC’s cartel settlement procedure decreased merger
frequency and pace. As discussed above, the procedure grants second-in or subsequent leniency
applicants fine reductions outside of the leniency program. This finding is consistent with our
Page 4
4
first finding because it suggests that a punishment differential between the first and subsequent
cartel confessors is an important component in conspirators’ merger decisions.
Together, these findings suggest that it is worthwhile to explore explanations that posit
monopoly gain as the reason for collusion and for merger induced by changes in the mode of
market competition (e.g., Hackbarth and Miao, 2011; Kumar et al., 2013).
Finally, we find that cartel breakdown expedites merger. The result is consistent with the
view that ex-conspirators often try to restore the status quo by merging to lessen competitive
pressures (Evenett et al., 2001; Boone 2006; Levenstein, 2013). Our results suggests that
vigilance against collusion should continue after cartel breakdown.
Our analysis is subject to the limitation that almost one-third of the sampled cartels af-
fected the US markets and were investigated by the DOJ. Anecdotal evidence suggests that
the DOJ’s investigation often predates the EC’s.2 Due to data availability,3 however, we have
used the event of EC inspection to identify the impact of antitrust enforcement. In this way,
our identification strategy might give rise to spurious estimates of the enforcement effect. To
remedy this, at least in part, in robustness checks we exclude cartels with US market coverage.
Our approach closely follows that of Davies, Ormosi, and Graffenberger (2014), who study
the dynamics of merger in a sample of EC detected cartels. We focus on the same set of cartels,
but extend the time coverage of the sample. We differ in the treatment of the sample: when
an EC decision covers multiple products, we treat these as separate cartels, whereas Davies,
Ormosi, and Graffenberger (2014) view that as one cartel, which addresses an issue that affects
our treatment of the same merger occurring in more than one cartel. By viewing these as
separate cartels, we are able to capture the difference in the dissolution dates.4 The separation
also makes the definition of the rivals in our sample more accurate.5 “[T]hese are the real
2See also Marx, Mezzetti, and Marshall (2014), especially footnote 11.
3The DOJ maintains strict confidentiality regarding the schedule of its cartel investigation. Although it is
possible to find data or make inferences in some cases, more commonly the starting date of an investigation is
unknowable from publicly available data.
4For example, there can be differences by customer (for Honda, the automotive wire harnesses cartel ended
in 2009 and for Nissan in 2006), by product (the Vitamin C cartel ended in 1995, while the Vitamin D3 cartel
ended in 1998), or by geography (the Thread cartel ended in the UK in 1996 and in Benelux and Nordic countries
in 2001).
5For example, the Vitamin C cartel involved Roche, Solvay Pharm, BASF and Merck. The beta-carotene
and carotinoids cartels involved only Roche and BASF. But because “[t]he only producers of these products
Page 5
5
competitors in the defined product market as they are identified by the EC in its in-depth
investigations” (Duso et al., 2013).6 Davies, Ormosi, and Graffenberger (2014) focus on post-
collusion periods, which focuses the analysis on activity that occurs after cartel dissolution.7
We also consider mergers that take place before the dissolution of the cartel.8 By doing so we
increase the power of the inference because we can rule out a declining trend in merger activity
that extends back into the cartel period.
Similar to Davies, Ormosi, and Graffenberger (2014), we discuss the impact of leniency on
mergers. However, we use a different identification strategy. We use the date of the introduction
of leniency to identify the impact of leniency, whereas Davies, Ormosi, and Graffenberger
(2014) use the cause of the investigation. We chose to focus on the date of the introduction of
leniency in order to avoid concerns about causality and measurement problems. For example,
conspirators may apply for leniency long after a cartel dissolves (Gartner and Zhou 2013).9
These delayed applications may be affected by post-breakdown mergers. Moreover, “[f]ormer
price-fixers often try to effectively restore the status quo ante by merging...” (Evenett et al.,
2001). In such cases, a leniency program may affect a contemplated merger (by affecting
the expected stability of the follow-up conspiracy) irrespective of the cause of investigation in
previous infringements.
We follow Davies, Ormosi, and Graffenberger (2014) in using a duration analysis framework
and modeling mergers as recurrent events. They use continuous-time methods to estimate the
worldwide are Roche and BASF” (see Case COMP/E-1/37.512 Vitamins), Roche and BASF could not be rivals
of Solvay and Merk on these markets.
6In a study of EU mergers, Duso, Gugler and Szucs (2013) similarly emphasize the importance of defining
rivals by using the markets identified by the EC in its antitrust investigation.
7As described in Davies, Ormosi, and Graffenberger (2014), this choice has advantages in terms of avoiding
confounding effects associated with using cartel-period data and mitigating issues of censoring as fewer firms
are available to merge over time.
8Our calculation based on EC decisions on 151 cartels issued over the period 1985–2013 and information on
135 mergers and joint ventures shows that over one-third of the sampled mergers and joint ventures took place
before the cartel dissolved.
9Using information on 105 EC detected cartels, Gartner and Zhou (2013) find that more than three quarters
of the leniency applications by first-in applicants took place after a cartel breakdown; about 40 percent of the
applications by first-in applicants postdated the cartel breakdown by at least a year. More than half of the
applications by first-in applicants arrived after the “dawn raids”, by which time the EC was already aware of
the cartels’ existence.
Page 6
6
merger hazard,10 whereas we instead use discrete-time methods.11 This allows us to address
the issue of “ties.” A large number of conspirators in the EC decisions participated in multiple
cartels whose product markets differ.12 When a merger involves such multi-cartel conspirators,
survival times may be “tied,” i.e., the merger spells have the same duration across the different
cartels. The discrete-time specification gives consistent estimates in the presence of ties, whereas
in a continuous-time specification, the presence of ties causes biased coefficient estimates and
standard errors (Cox and Oakes, 1984, p.99; Kalbfleisch and Prentice, 1980, p.75). As another
difference in methodologies, Davies, Ormosi, and Graffenberger (2014) fit models with a Weibull
baseline hazard, despite lack of theoretical support for any particular shape. We fit a model
involving flexible step-function approximations to the baseline hazard function where the shape
of the function is not imposed a priori but determined by the data. By doing so, we hope to
avoid the problem of inconsistent estimates that parametric specifications generate when the
assumed baseline hazard is incorrect (Meyer, 1990, p.769).13
In our regression model,14 we augment the set of variables in Davies, Ormosi, and Graf-
fenberger (2014) to include variables for macroeconomic conditions. The existing literature on
merger and cartel suggests that economic fluctuations can be important determinants of merger
decisions (Jovanovic and Rousseau, 2002; Alvarez and Stenbacka, 2006; Thijssen, 2005; Smit
et al., 2005; Mason and Weeds, 2005; Rhodes-Kropf and Viswanathan, 2004; and Toxvaerd,
10Other application of the continuous-time methods in the industrial organization literature include, among
others, Zimmerman and Connor (2005), Levenstein and Suslow (2006, 2011), Brenner (2009) and Zhou (2012),
who study the dynamics of cartel dissolution and Gartner and Zhou (2013), who study the timing of leniency
applications by cartel confessors.
11See Willett and Singer (1995), which illustrates the technique within a logistic regression framework. There
are several competing methods for discrete-time duration modelling including mixed Poisson models (Nagin
and Land 1993), log-linear models (Vermunt, 1997), multilevel ordered multinomial regression (Hedeker et al.,
2000), and discrete-time Markov chain models (Masyn, 2008; and Langeheine and van de Pol 1990).
12Our calculation based on the EC cartel decisions issued over the period 1985-2013 shows that 129 firms—
about 18 percent of the total firms— participated in cartels on different product markets.
13The advantages of adopting a flexible functional form for the baseline hazard in analyzing time to event
data have been widely recognized. See, e.g., Kalbfleisch and Prentice (1980), Meyer (1990), and Perperoglou
(2005).
14The regression model presented here belongs to the large class of duration models (e.g., Allison, 1982;
Blossfeld et al. 1989; Cox, 1972; Heckman and Singer, 1984; Kalbfleish and Prentice, 1980; Laird and Oliver
1981; Miller, 1981; Prentice and Gloeckler 1978; Singer and Willett 1993, 2003; Willett and Singer 1993, 1995).
Page 7
7
2008) and firms’ choice between competition and collusion (e.g., Rotemberg and Saloner 1986;
Haltiwanger and Harrington, 1991; Harrington and Chang, 2009; Zimmerman and Connor,
2005; Levenstein and Suslow, 2006, 2011; Zhou, 2012). By including controls for the eco-
nomic conditions, we hope to avoid an omitted variable bias in our analysis of merger timing
by (ex)conspirators. Comparisons of our regression results with and without controls for the
macroeconomic variables suggests value in including the additional variables.
Hueschelrath and Smuda (2013) test the effect of cartel breakdown on merger rates in
the post-leniency period (1997–2013). Their empirical strategy differs from ours because their
sampled mergers relate not to the (ex)conspirators alone but to all the firms in a NACE-3 or -4
digit industry to which a cartel-affected market belong. Inference in their framework may be
frustrated by measurement problems because the majority of their sampled NACE markets lack
cartel discoveries. For these markets, Hueschelrath and Smuda (2013) distinguish the treatment
and control groups by using the dates of cartel breakdown in markets with cartel discoveries.
It is not clear why merger decisions in a market might react to the cartel breakdown in a
different market. Our approach may have advantages to the extent that the counterfactual is
more cleanly observed. Moreover, Hueschelrath and Smuda’s (2013) sample excludes mergers
before the 1996 leniency introduction and precludes an analysis of the leniency’s impact. The
impact is studied in detail here. Finally, Hueschelrath and Smuda (2013) do not isolate the
effect of cartel breakdown on merger from the confounding influences of cartel enforcement and
economic fluctuations. These influences are isolated in the present paper by using multivariate
regression.
Other related empirical work includes that of DiCenso (2005), Kastrinaki and Stoneman
(2012), Jopp (2011) and Erdogan (2012), who analyze in continuous-time hazard frameworks
the relationship between merger timing and various firm characteristics and financial factors.
It should be emphasized that our explanations do not provide a general theory of merger.
Certainly, there are factors other than cartel policies, market competition and the other vari-
ables discussed here that influence merger decisions. Our primary goal is to show that a
plausible foundation can be constructed for the view that changes in antitrust policy can cause
large time, firm, and industry variations in merger activity. Our paper is not an attempt to
explain horizontal mergers in general, and we do not rule out the possibility that some mergers
would have been formed eventually even if the EC’s leniency programs had never been in place.
The paper is organized as follows. Section 2 describes the data. Section 3 characterise the
Page 8
8
distribution of mergers and JVs over time and examine the factors that influence conspirators’
decision to merge. In particular, Section 3.1 examines the evolution over time of the frequency
of merger and the elimination of competitors via merger, and Section 3.2 studies the pace
of merger at cartel-level. Our sample of mergers and JVs by members of discovered cartels
provides evidence that the merger dynamics are significantly and strongly affected by anti-
cartel enforcement. Concluding remarks and possible extensions follow.
2. Data
2.1. Data Source
The primary data for our analysis are the EC cartel decisions and judgments on cartels by
the Court of First Instance and the European Court of Justice from December 1985 to July
2013. The data contain a rich variety of firm-specific and cartel-specific information, including,
among others, whether a conspirator underwent a merger or JV, the identity of the acquirer
and the target, the date of the transaction and the percentage of ownership change, the degree
of firms’ involvement in a JV, the dates that a firm joins and leaves a cartel, and the date that
the EC launches a surprise inspection at the firm’s premise. In some cases, the EC reports
firms’ market shares or ranges of market shares near the end of an infringement. These are the
key variables of interest in this paper.
Moreover, we search for transaction records in the time series of EC merger decisions (1990-
2012) for transactions that are omitted or undisclosed from the cartel decisions. The EC merger
decision data set includes all mergers and JVs where an Article 6(1)a, 6(1)b or 6(1)c decision was
taken, provided that the documentation has become publicly available by December 31, 2012.15
The merger data contain, among other things, the dates of merger notification and approval,
the percentage of ownership change during a merger, and the degree of a firm’s involvement
in a JV. Furthermore, we search for transaction records from the following sources: (i) the
national competition authorities; (ii) the conspirators’ annual reports, press releases, investor
information, and company histories, etc.; and (iii) business and financial intelligence such as
Bloomberg and Mergerstat Review.
15The Article 6(1)a decisions pertain to concentrations that do not fall within the scope of the Merger
Regulation; the Article 6(1)b decisions pertain to concentrations that do not “raise serious doubts as to their
compatibility with the common market”; the Article 6(1)c decisions pertain to concentrations that raise serious
doubts (and therefore proceed to Phase II).
Page 9
9
2.2. The Sample
Rules of Selection The EC cartel data set currently includes 151 cartels. We select cartels
for which we could verify whether a merger or JV occurred. We excluded 11 cartels due to this
restriction.16 To examine the effects of cartel investigations, we restrict the sample to cartels
for which the date of the initiation of the EC’s investigation is known. We drop one cartel due
to this restriction. From the remaining cartels, we find 129 mergers and 18 JVs.
To estimate the probability of merger and JV over time, we consider mergers and JVs that
are successful, result in a completed transaction, and for which the date of transaction and the
degree of ownership and control changes are known. Moreover, because our analysis concerns
the transfer of corporate decision rights, we consider only mergers and JVs that meet one of
the following criteria: (i) the acquiring conspirator ends up with more than 50% of the shares
of the acquired co-conspirator (or subsidiary), and the acquiring conspirator controlled less
than 50% of the shares of the target before the announcement; (ii) two (or more) conspirators
jointly acquired control of a non-conspirator that did not participate in the cartel prior to the
announcement; (iii) a non-conspirator acquired more than 50% of the shares from two (or more)
conspirators; (iv) a JV was set up to carry out more than 50% of the sales or production of at
least one of the conspirators, and the JV carried out less than 50% of the conspirator’s activity
before the announcement.
Our requirements yield a sample of 135 successful transactions (118 mergers and 17 JVs).
They were undertaken by 187 firms from 55 cartels. We refer to these cartels as our cartel-level
merger sample. The first transaction took place in December 1983 and the last in October
2012.
There were 84 cartels that did not go through a merger or set up a JV, or went through
a transaction but failed criteria (i)-(iv). The estimation of merger timing must consider the
censoring of the time-to-merger for cartels with no observed merger events. In these cases, we
can only infer that the time-to-merger would have exceeded the observed time elapsed from
the start of an infringement, but is censored at the time of data collection or the date of the
firm’s exit (because of liquidation, bankruptcy, or cessation of production). We refer to the
cartel-level merger and non-merger samples together as the cartel-level full sample.
16These cartels are operated by trade associations or shipping conferences who are the addressees of the cartel
decisions. The identity of the involved firms is usually undisclosed.
Page 10
10
Variable Definition and Summary Statistics The main variables and model parameters
are defined in Table 1, and the corresponding descriptive statistics are presented in Table 2.
Column 1 of Table 2 gives descriptive statistics for the full sample. The remaining columns
give descriptive statistics for the merger sample.
[Table 1 about here]
[Table 2 about here]
3. Empirical Analysis
The analysis starts by looking at changes in the number of mergers over time. At this step,
our analysis runs at an aggregate level where mergers in different cartels and by different firms
are grouped together and the only sample variation comes from changes through time. In the
sections to follow, the analysis will consider cartel-level variation.
3.1. The Number of Mergers
3.1.1. Graphical Analysis
We start by graphing the distribution of merger activities over time. We create a series of
six-month periods to track mergers. The periods before June 30, 2008, alternately begin on
July 18 and January 18, so that they match the introduction of the EC’s leniency program on
July 18, 1996. The periods after June 30, 2008, alternately begin on June 30 and December
30, so that they match the introduction of the settlement procedure.
Figure 1 plots the total number of mergers and JVs per period. We have information for 87
periods. The vertical bars represent the introduction of the leniency program on July 18, 1996,
and the introduction of the settlement procedure on June 30, 2008, respectively. The number
of mergers or JVs does not evolve monotonically through time, but rather increases sharply
after July 1996 when the EC leniency program was introduced, and falls in recent years. In
our tests, we often use time-varying predictors (e.g., cartel policies, macroeconomic conditions,
etc.) to take into account these changes.
[Figure 1 about here]
A potential caveat to the analysis above is that the time-varying pattern of merger rates in
Figure 1 may be driven by the arrival of new cartels over time, with the latter periods including
Page 11
11
more sampled cartels than the earlier periods. To see if this is the case, Panel A of Figure 2
plots the ratio of the total number of mergers and JVs in a period over the total number of
sampled cartels in each period. The pattern is similar to that in Figure 1 and shows that
the probability of a merger between July 1996 and June 2008 is significantly larger than the
probabilities in the pre-leniency and post-settlement periods. Moreover, the high merger rates
around the periods 1983 and 1989 should be regarded as outliers rather than the norm. In 24
out of the 28 pre-leniency periods, merger probabilities are below 0.06. Panel B plots the ratio
of mergers and JVs over the number of sampled firms in each period. The pattern is similar to
that in Panel B.
[Figure 2 about here]
3.1.2. Regression Analysis
A. Poisson Model
We use a reduced-form Poisson regression to test the effects of policy changes on merger num-
bers. In the model, the probability of observing that random variable Yt, the number of mergers
and JVs in period t, has the realization yt is given by
Prob(Yt = yt | xt) =exp(−λt)λ
ytt
yt!, yt = 0, 1, 2, ...,
where the conditional mean λt is specified as λt = exp(x′tβ), where xt is a vector of regressors and
β is a vector of parameters, measuring the regressors’ impact. Our main regressor, POLICY, is a
categorical variable that indicates the policy environment where mergers occur. The categories
are PRE-LENIENCY for the periods before July 18, 1996, LENIENCY for the periods between
July 18, 1996, and June 30, 2008, and SETTLEMENT for the periods after June 30, 2008.17
We run two statistical tests. First, we examine whether the number of mergers and JVs
increases following the introduction of leniency. The hypothesis seems plausible provided that
the leniency programs have the intended effect of destabilizing cartels. When tension is created
between the conspirators following an effective antitrust innovation (such as leniency), they
face an increased need to facilitate coordination through eliminating competitors (in both an
17Valid inference from a Poisson model requires equidispersion, that is, equality of conditional variance and
mean. For robustness, we run a negative binominal model and find that the results regarding the effects
of leniency and settlement are similar to those obtained from the Poisson regression and that the dispersion
parameter is close to zero.
Page 12
12
ongoing infringement and a follow-up infringement after a cartel breakdown). The hypothesis is
also plausible provided that leniency has the intended effect of deterring cartels. The increased
competition intensity following the leniency introduction provides the ex-conspirators with an
incentive to enlarge capacity through a merger so that they can compete more effectively
against the rivals. Taking LENIENCY as the omitted category, the regression model generates
an increase in mergers and JVs if the PRE-LENIENCY coefficient is negative. We therefore
test the hypothesis:
H0 : βPRE ≥ 0 versus H1 : βPRE < 0,
where βPRE denotes the PRE-LENIENCY coefficient. In the second test, we examine whether
the number of mergers and JVs falls following the introduction of the settlement procedure.
Because settlement gives late cartel confessors fine reductions outside of the leniency program,
it may have the effect of weakening the effectiveness of the leniency program. Therefore, we
hypothesize that the need for eliminating competitors through merger decreases following the
settlement introduction. Taking LENIENCY as the omitted category, the regression model
generates a decrease in mergers and JVs if the SETTLEMENT coefficient is negative. We
therefore test the hypothesis:
H0 : βSETTLEMENT ≥ 0 versus H1 : βSETTLEMENT < 0,
where βSETTLEMENT denotes the settlement coefficient.
B. Regression Results
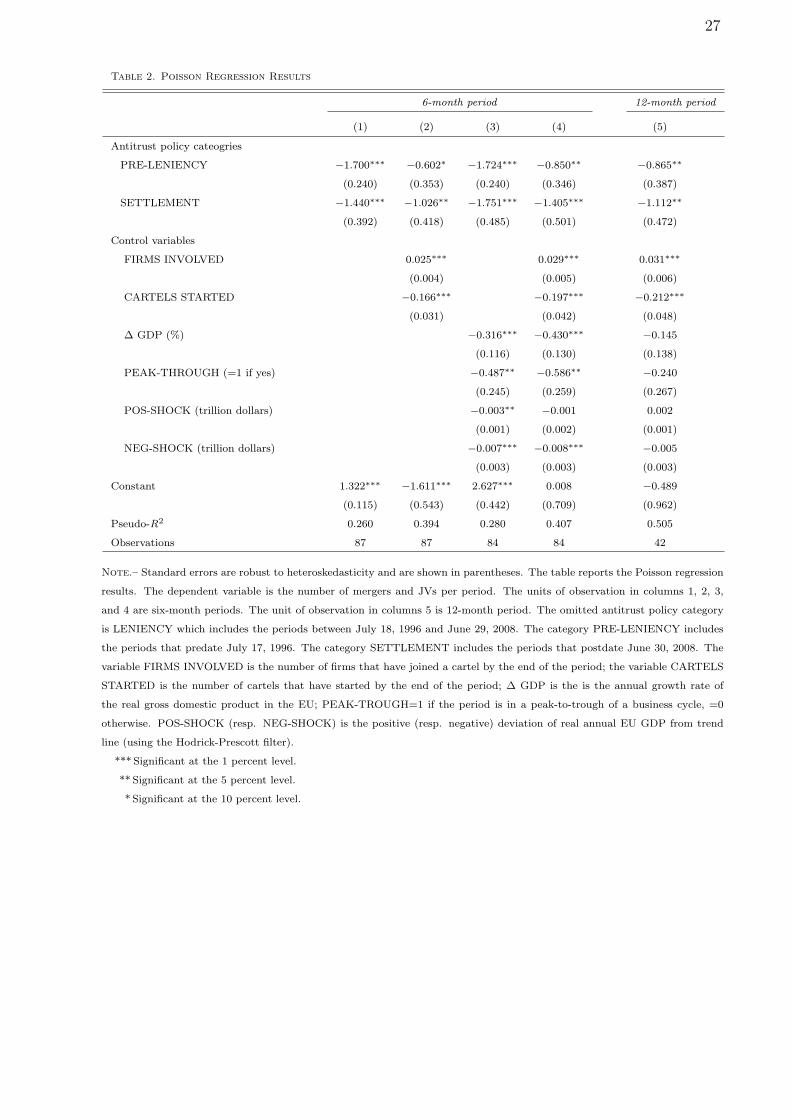
Table 2 reports the main regression results of the effect on the number of mergers and JVs of the
antitrust policies we consider. In each regression from columns 1 to 4, the unit of observation
is a six-month period and the dependent variable is the number of mergers and JVs. Column
1 includes only the policy indicator. Columns 2 adds the total number of sampled firms and
cartels by the end of each period. Column 3 adds the macroeconomic variables. We have
information on the macroeconomic fluctuations for only 84 periods. Column 4 includes all the
control variables.
Starting with the effect of leniency introduction, the estimated PRE-LENIENCY coeffi-
cients are negative and statistically significant, suggesting that the introduction of the leniency
program resulted in increased merger activity. The coefficients in the first row of columns 1 to
Page 13
13
4 correspond to 4.47 times, 82.6 percent, 4.61 times, and 1.34 times increases in the number of
mergers, respectively, when evaluated at the mean of the control variables.
Turning to the effect of settlement procedure introduction, the estimated SETTLEMENT
coefficients are negative and statistically significant, suggesting that the introduction of the
settlement program resulted in a decreased merger rate. The coefficients in the second row
of columns 1 to 4 correspond to 3.22, 1.79, 4.76, and 3.08 times decreases in the number of
mergers, respectively, when evaluated at the mean of the control variables.
In addition, the results lend some support for the theoretical findings that merger activity
is linked to macroeconomic fluctuations.
Column 5 uses a 12-month period. The estimated policy coefficients remain statistically
significant and have the same signs as those in the six-month period cases.
3.1.3. Robustness Checks
Our empirical strategy is implemented using a before-and-after comparison across groups where
the date of leniency introduction, July 18, 1996, is viewed as an exogenous shock to identify
the impact of leniency. The date of settlement introduction, June 30, 2008, is used to identify
the impact of settlement procedures. One concern is that if alternative shocks, i.e., placebo
policies, yield a better fit to the data, then the link between the antitrust policies and the time
series of mergers might not be causal. To investigate, we re-run the regression in column 4 of
Table 2 using alternative time breakpoints and compare the maximized log-likelihoods across
the different specifications.18
Each point in the graphs of Figure 3 corresponds to the maximized log-likelihood of one
Poisson regression. The point 0 on the horizontal axes marks the maximized log-likelihood when
we impose the shocks at the dates of the leniency introduction. The points to the left (resp.
right) of 0 represent the log-likelihoods when we impose the shocks before (resp. after) July 18,
1996. Panel A uses six-month periods. The maximized log-likelihood generated by leniency
(−99.286) is greater than those generated by all but two placebo policies that postdate July
18, 1996. The offending placebo policy shocks are caused by a sharp increase in the number
of mergers in the third and fourth periods after July 18, 1996. Panels B uses twelve-month
periods. The results are largely similar to those in the six-month case. In the twelve-month
18Miller (2009) runs a similar test on the effects of US leniency programs against placebo policy shocks.
Page 14
14
case, the model fit generated by leniency is greater than those generated by all but one placebo
policy that postdates July 18, 1996.
Figure 4 plots the log-likelihoods produced by imposing shocks before and after the intro-
duction of the EC’s settlement procedure. When six-months periods are used (Panel A), the
maximized log-likelihood produced by the prior leniency policy is greater than those produced
by all but one placebo policy that predates the prior leniency policy by two years. The results
are similar when three-month periods are used—there are only two offending placebo policies.
Overall, these robustness checks provide some support for the empirical specification.
3.2. Cartel-Level Analysis of The Pace of Merger
3.2.1. Descriptive Statistics
Most of the sampled cartels do not experience a merger (61.2%), although it is not rare to
observe cartels with more than one mergers (23.7%). In particular, among those with mergers,
nearly 40% had at least three mergers, 16% have at least four mergers. At this stage of the
cartel-level analysis, we organize our data in such a way that each of the n cartels in our sample
contributes to a Cartel-Event data set in which there are N (with N > n) lines of data—one
line for every transaction or censoring event for which each cartel was observed. For example,
if cartel j has mj merger events, then it has mj + 1 records (lines) of data, where each of the
mj records corresponds to a merger or JV, and the last record corresponds to the censoring
event (i.e., data collection).
3.2.2. Graphical Analysis
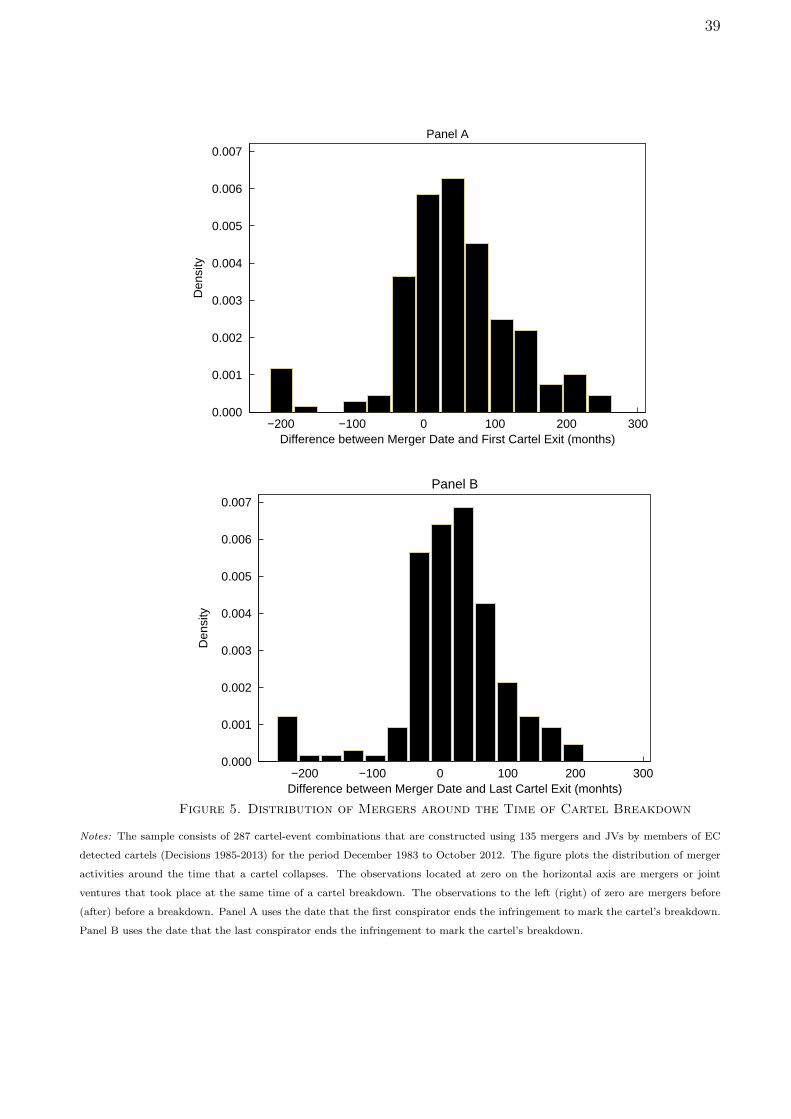
Figure 5 plots the distribution of mergers around the time of cartel breakdown. As shown,
mergers are infrequent long before and after cartel breakdown. The likelihood of mergers peaks
around the time of the cartel breakdown. One-third of the sampled mergers occurred in the
three years before the cartel breakdown. Over one-third of the sampled mergers occurred in
the three years following the cartel breakdown.
[Figure 5 about here]
Figure 6 explores the effect of the 1996 leniency program on the link between mergers
and cartel dissolution. Panel A includes only mergers that occurred before July 18, 1996,
the introduction of the EC’s leniency program. As shown, the great majority (85.4%) of
Page 15
15
mergers in this period occurred before a firm ended its cartel involvement. The pattern changed
substantially after leniency was introduced, with over two-thirds of the mergers occurring after
the firms’ exit (Panel B). Together, these graphical analyses suggest that the link between
mergers and collusion varies across policy regimes.
[Figure 6 about here]
Next, we graph the non-parametric Kaplan-Meier hazard functions. The empirical hazard
is the ratio of the number of observations that merge in a month relative to the number that
had not yet experienced a merger at the start of the month.19 These functions plot rates of
merger against the analysis time, described below.
Let the spell start for the first merger in a cartel be the cartel’s birth date. For the second
and subsequent mergers, the spell start is the time of the preceding merger. Let the spell end
be the earlier of the time of censoring (i.e., data collection on December 31, 2012) and the
time of the present merger. The hazards do not evolve monotonically over time (Figure 7).
The hazard is higher between 0 and 35 months and then again between 90 and 120 months.
The first jump is probably caused by the start of the cartel or a recent merger. The second
jump is probably caused by the cartel dissolution: the sampled mergers lasted on average 81
months; the majority of cartels experienced less than two mergers, if merger ever occurred.
These points are discussed in more detail later. Furthermore, temporarily putting aside the
issue of confounding influence from the time-varying factors, the shape of the hazard function
suggests that a flexible baseline hazard specification will probably fit the data better than a
monotonic baseline hazard (e.g., Weibull).
In Figure 8, the analysis time of the pre-leniency hazard profile begins at the spell start and
ends at the earlier of the spell end and July 18, 1996. The analysis time of the leniency hazard
profile begins at the latter of July 18, 1996, and the spell start. It ends at the earlier of the
spell end and June 30, 2008. The analysis time of the settlement hazard profile begins at the
latter of June 30, 2008, and the spell start, and it ends at the spell end.
[Figure 7 about here]
19Formally, defining the risk set in month m, Rm, as the number of spells not experiencing a merger by the
start of month m, and the number of mergers in month m as Sm, the Kaplan-Meier empirical hazard is defined
as Sm/Rm.
Page 16
16
Panel A of Figure 8 depicts the merger hazards before the 1996 leniency introduction,
after the leniency introduction but before the settlement procedure introduction, and after
the settlement introduction. As shown, the introduction of the leniency program immediately
results in a hazard profile with higher probabilities of merger. The introduction of the settlement
procedure immediately result in a hazard profile with lower probabilities of merger.
A potential caveat to the analysis above is that, by design, analysis time of the leniency
treatment group (i.e., spells that started after July 18, 1996) is at most 145.5 months (i.e, the
time span from July 18, 1996, to June 30, 2008); but a similar selection of short analysis times
does not occur to the control group (i.e., spell durations before July 18, 1996). If the immediate
increase in the hazard rates following the leniency introduction were due to such a statistical
artefact, one could argue that our result on the relationship between leniency and the observed
hazards is driven by misspecification.
To examine whether this is the case, we censor all the spells in the pre-leniency group at
month 145.5. Panel B of Figure 7 plots the Kaplan-Meier hazard estimates after the exclusion
of long spells. The predicated hazards after the leniency introduction again immediately exceed
the pre-leniency levels. Long after the start of the spell, the post-leniency hazards readjust and
fall below the pre-leniency levels. The overall effect of leniency introduction, judging from the
entire sampling range, is that it expedites merger.
3.2.3. Regression Analysis
A. Empirical Framework
The timing of a merger decision is analyzed naturally in a hazard model framework. A spell in
this context refers to a period of time elapsed until a merger or the censoring event (i.e., data
collection on December 31, 2012) occurs. Twenty-three of the sampled cartels went through
multiple mergers and/or JVs. In these cases, spells may be correlated with the cluster, violating
the assumption of independent spells that is required in conventional hazard regression (e.g.,
Weibull). To address the issue, we consider a multiple-spell hazard specification and model the
repeated mergers as “recurrent events,” with the spell of the first event starting at the cartel’s
birth and the spells of the subsequent events starting at the time of the preceding event.
In addition, 129 sampled conspirators participated in multiple cartels whose product markets
differ. Failure times may be tied across cartels when a multi-cartel conspirator merge. Ties
are present if the different cartels share in common two (or more) adjacent events of interest.
Page 17
17
In particular, a non-trivial proportion, 17.4%, of the sampled observations in the Cartel-Event
data set are tied. Such a data structure makes discrete-time hazard models a natural candidate
for our analysis because the discrete-time methods give consistent estimates of the coefficients
and their associated variance in the presence of ties.20
The additional advantages of the discrete-time hazard models include the following: (i) they
can easily be extended to account for unobserved individual heterogeneity, even if the sample
size is large; (ii) by applying discrete-time hazard models, we can easily circumvent the rather
restrictive proportional hazards assumption that sometimes plagues continuous time models
(e,g., the Weibull model); and (iii) they can easily handle multiple time-varying covariates,
which are of particular interest for the present research.
Let Ts be the continuous, non-negative random variable that measures the length of a
particular spell s. In a discrete-time framework, the core of duration analysis is formed by the
probability that a particular cartel undergoes a merger within a given period [tk; tk+1), where
k = 1, ..., K and t1 = 0, conditional on not having undergone a merger at the beginning of the
interval and given the explanatory variables included in the regression model. This conditional
probability is termed the discrete-time hazard rate, and its function is given by
hsk := Prob{Ts < tk+1 | Ts ≥ tk,xsk} = F (x′skβ + γk),
where xsk is a vector of potentially time-varying covariates and γk is a function of time that
allows the hazard rate to vary across different periods within a spell. F (·) is a cumulative
distribution function ensuring that 0 ≤ hsk ≤ 1. Here, the subscript s denotes separate spells.
The parameter vector β is the vector of coefficients, measuring the influence of observed char-
acteristics. The term x′skβ shifts the hazard function F (·), and a positive coefficient indicates
that the observed characteristics increase the merger hazard and reduce the time to merger
after a firm joins the cartel.
For each merger spell, the last month in which a merger was observed is recorded. For
censored spells, we record the last month for which the data is collected. In the following, this
terminal month is denoted ks. The subscript s indicates that it may differ across spells. We
introduce a binary variable ysk = 1 if spell s is observed to cease during the kth month, and
20Alternative approaches to deal with tied failure times in continuous-time hazard models have been developed
in the literature, e.g., Breslow (1974). While computationally undemanding, Breslow’s method will be inaccurate
if there are many ties in the data set, which happens to be our case.
Page 18
18
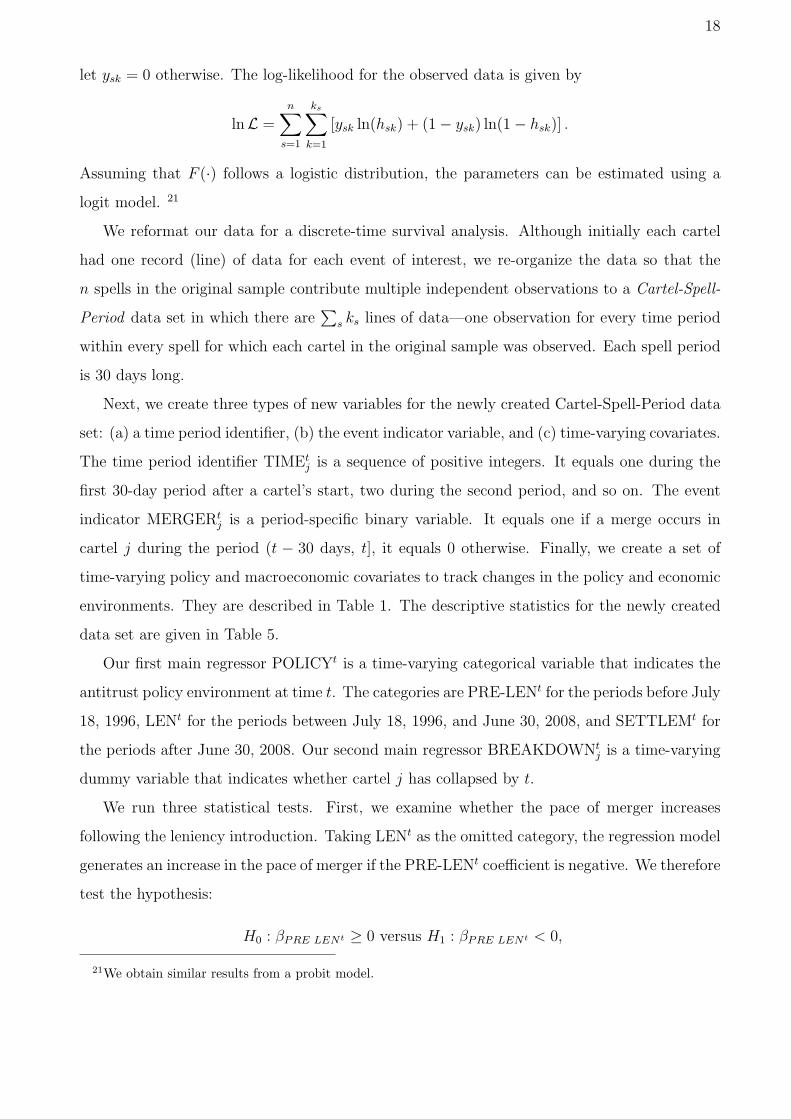
let ysk = 0 otherwise. The log-likelihood for the observed data is given by
lnL =n∑
s=1
ks∑k=1
[ysk ln(hsk) + (1− ysk) ln(1− hsk)] .
Assuming that F (·) follows a logistic distribution, the parameters can be estimated using a
logit model. 21
We reformat our data for a discrete-time survival analysis. Although initially each cartel
had one record (line) of data for each event of interest, we re-organize the data so that the
n spells in the original sample contribute multiple independent observations to a Cartel-Spell-
Period data set in which there are∑
s ks lines of data—one observation for every time period
within every spell for which each cartel in the original sample was observed. Each spell period
is 30 days long.
Next, we create three types of new variables for the newly created Cartel-Spell-Period data
set: (a) a time period identifier, (b) the event indicator variable, and (c) time-varying covariates.
The time period identifier TIMEtj is a sequence of positive integers. It equals one during the
first 30-day period after a cartel’s start, two during the second period, and so on. The event
indicator MERGERtj is a period-specific binary variable. It equals one if a merge occurs in
cartel j during the period (t − 30 days, t], it equals 0 otherwise. Finally, we create a set of
time-varying policy and macroeconomic covariates to track changes in the policy and economic
environments. They are described in Table 1. The descriptive statistics for the newly created
data set are given in Table 5.
Our first main regressor POLICYt is a time-varying categorical variable that indicates the
antitrust policy environment at time t. The categories are PRE-LENt for the periods before July
18, 1996, LENt for the periods between July 18, 1996, and June 30, 2008, and SETTLEMt for
the periods after June 30, 2008. Our second main regressor BREAKDOWNtj is a time-varying
dummy variable that indicates whether cartel j has collapsed by t.
We run three statistical tests. First, we examine whether the pace of merger increases
following the leniency introduction. Taking LENt as the omitted category, the regression model
generates an increase in the pace of merger if the PRE-LENt coefficient is negative. We therefore
test the hypothesis:
H0 : βPRE LENt ≥ 0 versus H1 : βPRE LENt < 0,
21We obtain similar results from a probit model.
Page 19
19
where βPRE LENt denotes the PRE-LENt coefficient.
In the second test, we examine whether the pace of merger decreases following the intro-
duction of the settlement procedure. Taking LENt as the omitted category, the regression
model generates an increase in the pace of merger if the SETTLEMt coefficient is negative. We
therefore test the hypothesis:
H0 : βSETTLEMt ≥ 0 versus H1 : βSETTLEMt < 0,
where βSETTLEMt denotes the settlement coefficient.
In the third test, we examine whether the pace of merger increases following a cartel break-
down. The regression model generates an increase in the merger pace if the BREAKDOWNtj
coefficient is positive. We therefore test the hypothesis:
H0 : βBREAKDOWNtj≤ 0 versus H1 : βBREAKDOWNt
j> 0,
where βBREAKDOWNtjdenotes the breakdown coefficient.
For robustness, we estimate the multiple spell discrete-time hazard model controlling for
potentially confounding influences. Duso, Gugler and Szucs (2013) suggest that the EC’s
2004 merger reform may affect anticompetitive mergers, and we create a variable that proxy
this factor. ECMR04 is a dummy that indicates the merger policy regime of a spell-period.
The other included variables capture, in turn, the impact of EC investigation, changes in
macroeconomic conditions, and cartel and market characteristics.
B. Regression Results
Table 5 reports the cartel-level regression results of the effect of antitrust enforcement on the
pace of merger. Column 1 includes the POLICYt and BREAKDOWNtj. Columns 2, 3, 4 ad 5
alternately include ECMR04t, INSPECTIONtj, the cartel and market characteristics variables,
and the macroeconomic variables. We only have 32,558 observations for the macroeconomic
variables. Column 6 includes all the control variables. In all the specifications, we include 11
duration-interval specific dummies to describe the overall temporal profile of risk. Together,
the interval dummies represent the effect of TIMEtj on the merger hazards. Moreover, we
include, in each specification, two predictors that are associated with the previous merger
episode: NUM-EX-MERGERSsj and DUR-EX-MERGERs
j . They represent the dependency
of the hazard rate on the cartel’s previous history and are included to relax the conditional
Page 20
20
independence assumption inherent in the multiple discrete-time hazard model (Allison 1982,
p.93).
[Table 5 about here]
Starting with the effect of leniency introduction, the estimated PRE-LEN coefficients are
small and statistically insignificant in the specifications in columns 1, 2 and 3. After controlling
for cartel and market characteristics and/or macroeconomic fluctuations (columns 4, 5 to 6),
the PRE-LEN coefficients become statistically significant and larger in absolute value than the
corresponding estimates in columns 1, 2 and 3. This results suggest that the introduction of
leniency expedites merger and the effect of leniency is affected by both cartel characteristics
and market and economic conditions.
Turning to the effect of settlement procedure introduction, the estimated SETTLEM co-
efficients are negative and statistically significant, suggesting that the settlement introduction
delays merger.
Looking at the effect of cartel breakdown, the estimated BREAKDOWN coefficients in
columns 1, 2, 3 and 5 are not significant at conventional levels. The coefficients become positive
and statistically significant after controlling for the size of cartel membership and the market
characteristics (columns 4 and 6), suggesting that mergers occur at a significantly greater pace
after the cartel dissolution and the impact of dissolution is associated with and/or affected by
the cartel and market characteristics.
To summarize briefly the effects of the other covariates (column (6)), we find little effect of
an EC investigation, the expected demand changes (∆ GDPtj and PEAK-TROUGHt
j), the un-
expected shocks (POS-SHOCKtj and NEG-SHOCKt
j), interest rates, the type of industries, the
market scope (after controlling for macroeconomic fluctuations) and a cartel’s merger history,
but a significant decreased chance of merger for cartels with a small membership and after the
2004 EU merger policy reform.
Finally, the duration-interval-specific dummies describe the logit-hazard profile for the
merger spell. The estimates suggest that chances of merger decline steadly over time. But
the chances are higher relative to the trend in months 101-125 and then again in months 171-
190. Notice that the corresponding standard error in the last interval dramatically increases,
reflecting the decreasing precision that derives from the diminished risk set.
To this point, our discussion of the hazard model is fairly simple. We have made the baseline
hazard rate a function of the explanatory variables and estimated a single duration elasticity.
Page 21
21
A potential shortfall of the specification is that attribute variation, to the extent that it has
any impact, is constrained to generate parallel shifts in the logit-hazard function.
However, it is important to consider the validity of the proportionality assumption. For
example, the results of Davies, Ormosi, and Graffenberger (2014) suggest that the effect of
cartel dissolution on the merger hazard may not be constant over time. The generalized model
reported in the last column of Table 5 allows cartel dissolution and the EC’s inspection to change
both the intercept and the slope of the logit-hazard function. This is achieved by re-running
the regression in column (6) of Table 5 but include an interaction between BREAKDOWN and
the number of months elapsed from the cartel dissolution (TIME-AFTER-BREAKDOWNtj),
and an interaction between INSPECTION and the months elapsed from the EC’s investigation
(TIME-AFTER-INSPECTIONtj). The coefficients of the interactions gauge the effect of cartel
dissolution and inspection on the slope, or duration elasticity, of the hazard function.
As in the proportional hazard specification (column (6), Table 5), the baseline coefficient of
BREAKDOWN is positive, statistically significant and greater than the corresponding estimate
from the simpler model. The coefficient of the interaction term is significantly negative, but
small relative to its baseline coefficient. Consequently, BREAKDOWN shifts the hazard profile
upwards over the relevant range of the data.22
There is a similar pattern associated with INSPECTION where the baseline and time-
dependent effects work in opposition. The baseline coefficient of INSPECTION is positive and
greater in absolute value than the corresponding estimate from the simpler models. The time-
dependent coefficient of INSPECTION is negative and statistically significant. Taking together,
a surprise investigation immediately results in a logit-hazard profile with a significantly larger
intercept; but the time-dependent effect of inspection overcomes the baseline effect quickly.
Inspection results in a hazard profile with lower probabilities of merger after approximately
48 (exp{0.636/0.164} ≈ 48.3) months, encompassing over 70 percent of the post-inspection
observations.
3.2.4. Additional Robustness Checks
I. Leniency vs. Placebo Policy Shocks
22The time-dependent effect of BREAKDOWN does not overcome the baseline effect until TIME-AFTER-
BREAKDOWN exceeds approximately 4,453 (exp{1.151/0.137} ≈ 4, 453) months, encompassing all of the
sampled observations.
Page 22
22
Like in our analysis of merger frequency, our empirical strategy here is implemented using a
before-and-after comparison across groups where we use the dates of policy introductions to
identify the policies’ impacts. Like before, our concern is that if alternative shocks, i.e., placebo
policies, generate a better fit to the data, then the link between the antitrust policies and the
pace of mergers might not be causal. To investigate, we re-run the regression in column 6
of Table 5 using alternative time breakpoints in the data and compare the maximized log-
likelihoods across the different specifications.23
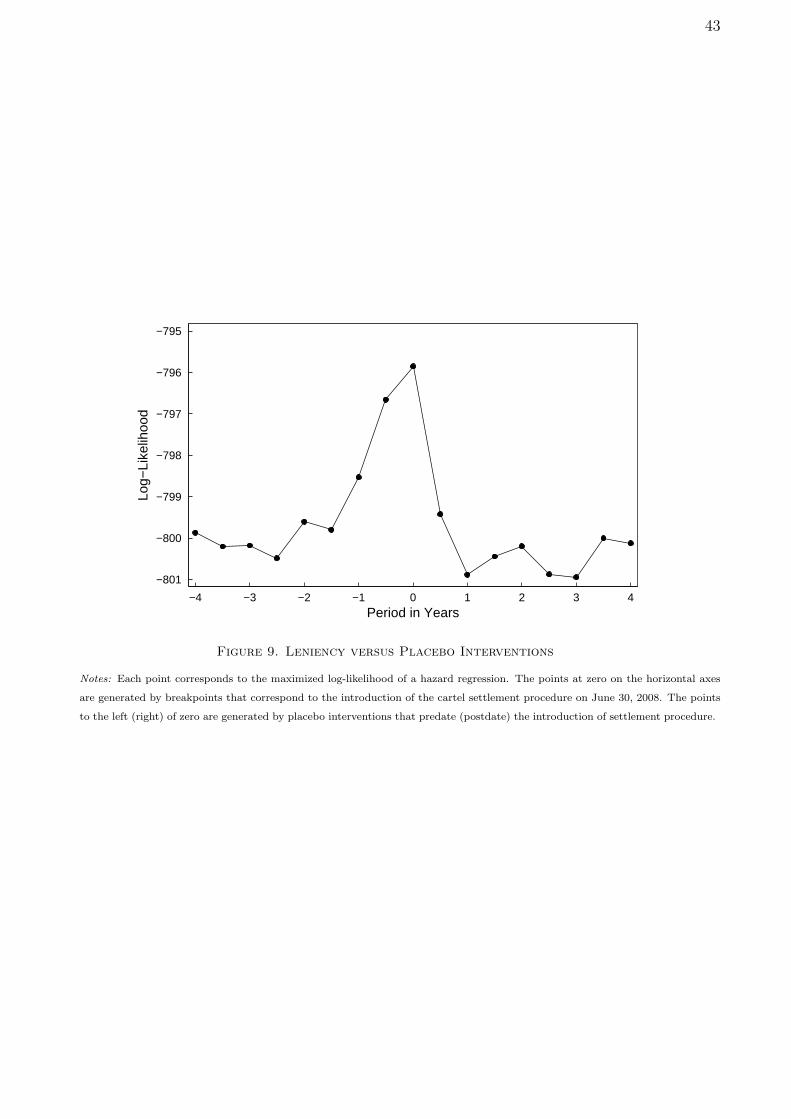
Each point on the graphs of Figure 9 corresponds to the maximized log-likelihood of one
discrete-time hazard regression. The point 0 on the horizontal axes corresponds to the maxi-
mized log-likelihood when we impose the shocks at the dates of the leniency introduction. The
points to the left (resp. right) of 0 represent the log-likelihoods when we impose the shocks be-
fore (resp. after) July 18, 1996. The maximized log-likelihood generated by leniency (−795.854)
is greater than those generated by all the placebo policies.
II. Longer Pre-Leniency Observation Window
A potential caveat to the analysis in Table 5 is that the analysis time of the leniency treatment
group is at most 145.5 months (i.e, the spell-periods from July 18, 1996, to June 30, 2008);
but a similar restriction to short analysis times does not occur to the control group (i.e., the
spell periods before July 18, 1996). If the immediate increase in the hazard rates following the
leniency introduction were due to such a statistical artefact, one could argue that our result on
the relationship between leniency and the observed hazards is driven by misspecification. To
examine whether this is the case, we censor all the spells in the control group at month 145 and
re-run the regression in column 6 of Table 5. Column 1 of Table 6 reports that the predicated
hazards after the leniency introduction again immediately exceed the pre-leniency levels.
III. Potential Confounding Influences of DOJ Investigation
Over 30 percent of the sampled cartels affected the US markets. Anecdotal evidence suggests
that the US cartel investigations often predate the EC investigations. In Table 5 we did not
find a significant impact of cartel investigation on merger timing. To see whether this has
been driven by the inclusion of US market cartels, in column (2) of Table 6 we exclude cartels
23Miller (2009) runs a similar test on the effects of US leniency programs against placebo policy shocks.
Page 23
23
that affect the US markets. The INSPECTIONtj coefficient remains small and statistically
insignificant.24
IV. Market Structure and Types of Infringement
Column (3) of Table 6 includes DISPERSIONj, the standard deviation of the cartel members’
estimated market shares near the end of an infringement, as an additional control variable.
The variable is constructed by using the EC’s decision reports on cartelists’ market shares
near the end of an infringement.25 We have data for 100 cartels on this variable. Column
(4) of Table 6 includes the types of infringement (i.e, whether the cartel involves price-fixing
(PRICE-FIXINGj=1 if yes;=0 otherwise), market allocation (MARKET ALLOCj=1 if yes;=0
otherwise), and big rigging (BID RIGGINGj=1 if yes; =0 otherwise)) as additional control
variables. The main point to extract from our analysis here is that the effects of leniency and
settlement are robust to the inclusion of these additional control variables.
V. Random Effects Model
Column (5) of Table 6 reports the estimates from a random effects model. In this case, the
odds of merger for a cartel whose unobserved (time-invariant) characteristics place it at one
standard deviation beyond the mean are (exp(0.004) − 1) × 100 ≈ 0.4% higher than for an
average cartel with the same observed characteristics. However, the effect is not significant at
conventional levels.
4. Conclusion
Mergers occur frequently among cartel members. This paper examines the nature and deter-
minants of mergers among cartel members using a novel data set. Unlike previous empirical
analysis of merger, our analysis explicitly recognizes the role of anti-cartel enforcement on car-
tels’ incentive to merge. We find that the EC’s leniency program expedites mergers. We find
that the EC’s settlement procedure discourages and delays merger. Moreover, we find that the
forces behind the time series of merger change over time and across antitrust policies. The
24To our best effort, we are not able to find information of the dates of the DOJ’s investigation initiation for
the majority of cartels that affected the American markets.
25Sometimes, the EC reports a range of possible values of the market share. In this case, we use the mid-point
of the range as a proxy of the market share.
Page 24
24
increased efforts to increase concentration and reduce the coordination problems inherent in
collusive relationships following the introduction of a more stringent antitrust policy suggest
that the conspirators may have been trying to undo, at least partly, the leniency programs’s
adverse effect on collusive gains.
Our results may have important policy implications. Merger policies in the EU, the US, and
many other jurisdictions may not adequately take into account the collusive history of merging
firms. Because ex-conspirators often try to restore the status quo by merging or by taking other
steps that lessen competitive pressures and raise prices, vigilance should not end with a cartel’s
punishment (Evenett et al., 2001). Our results imply that the authority may need a different
set of policy tools to analyze the unilateral and coordinated effects of a merger in cartelized
industries, including industries with low concentration.
There are many important policy issues that remain to be addressed, including the effects
of different national antitrust policy changes, the effects of merger on market competition, and
whether the new market structure post merger facilitates continued collusion. Given the long
duration of some cartels, it would be interesting to see if some of the cartels use merger to
create a new “balance” in the market to facilitate continued collusion after detection.
Page 25
25
Table 1. Terms and Definitions
Definition
Cartel An agreement or a series of agreements between competing firms or associations of firms
that constitutes a single infringement, according to the EC, of Art. 101 (formerly
Art. 81 and Art. 85) of the EC treaty.
Merger To be considered as a merger or a JV, the degree and nature of ownership changes should
meet one of the following criteria: (i) the acquiring conspirator ends up with more
than 50% the shares of the acquired co-conspirator (or subsidiary), and the acquiring
conspirator control less than 50% of the shares of the target before the announcement;
(ii) two (or more) co-conspirators jointly acquired control of a third firm who was not
a co-conspirator until the announcement; (iii) a non-conspirator acquired more than
50% of the shares from two (or more) co-conspirators; (iv) A JV was set up to carry
out more than 50% of sales or production of at least one of the conspirators, and the
JV carried out less than 50% of the conspirator’s activity before the announcement.
Merger date = the date of merger approval by the EC (or other competition authorities); = the
date of merger becoming effective (as reported in corporate or industry press or other
sources) if the approval date is not reported in the authorities’ official publications.
Censoring date = December 31, 2012 (the date of data collection).
Variables
TIME-TO-MERGERsj = Number of months elapsed from cartel j’s start until it experiences event s (i.e., a
merger or censoring).
MERGERtj = A dichotomous indicator of whether during the period (t-30 days, t] cartel j experi-
ences a merge or a join venture. This is the dependent variable for our cartel level
regression analysis.
TIMEtj Number of months since cartel j’s start.
TIMEtj-DUMMY Duration-interval-specific dummies indicating the length of TIMEt
j , one for each spell
interval at risk. The dummies are 1-15 months, 16-35 months, 36-55 months, 56-75
months, 81-110 months, 101-125 months, 126-150 months, 151-170 moths, 171-190
months, 191-220 months, ≥ 221 months.
POLICYt time-varying categorical variable that indicates the antitrust policy environment at time
t. The categories are “PRE-LENt” (for the periods before July 18, 1996), “LENt”
(for the periods between July 18, 1996 and June 30, 2008), and “SETTLEMt” (for
the periods after June 30, 2008).
BREAKDOWNtj A dichotomous indicator = 1 if cartel j has ended by time t, = 0 otherwise.
INSPECTIONtj A dichotomous indicator = 1 if the EC has inspected cartel j by time t, = 0 otherwise.
ECMR04t time-varying dummy that indicates the merger policy regime at time t. = 1 for the
periods that postdate May 1, 2004, = 0 otherwise.
(continued overleaf )
Page 26
26
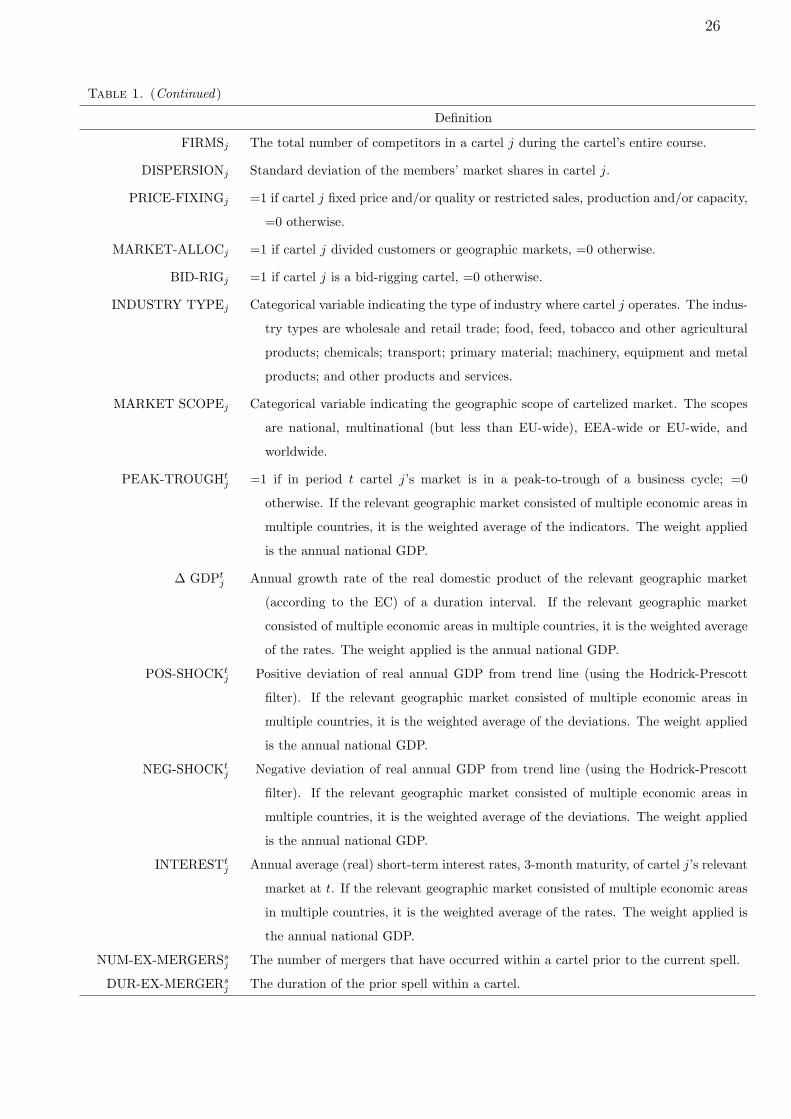
Table 1. (Continued)
Definition
FIRMSj The total number of competitors in a cartel j during the cartel’s entire course.
DISPERSIONj Standard deviation of the members’ market shares in cartel j.
PRICE-FIXINGj =1 if cartel j fixed price and/or quality or restricted sales, production and/or capacity,
=0 otherwise.
MARKET-ALLOCj =1 if cartel j divided customers or geographic markets, =0 otherwise.
BID-RIGj =1 if cartel j is a bid-rigging cartel, =0 otherwise.
INDUSTRY TYPEj Categorical variable indicating the type of industry where cartel j operates. The indus-
try types are wholesale and retail trade; food, feed, tobacco and other agricultural
products; chemicals; transport; primary material; machinery, equipment and metal
products; and other products and services.
MARKET SCOPEj Categorical variable indicating the geographic scope of cartelized market. The scopes
are national, multinational (but less than EU-wide), EEA-wide or EU-wide, and
worldwide.
PEAK-TROUGHtj =1 if in period t cartel j’s market is in a peak-to-trough of a business cycle; =0
otherwise. If the relevant geographic market consisted of multiple economic areas in
multiple countries, it is the weighted average of the indicators. The weight applied
is the annual national GDP.
∆ GDPtj Annual growth rate of the real domestic product of the relevant geographic market
(according to the EC) of a duration interval. If the relevant geographic market
consisted of multiple economic areas in multiple countries, it is the weighted average
of the rates. The weight applied is the annual national GDP.
POS-SHOCKtj Positive deviation of real annual GDP from trend line (using the Hodrick-Prescott
filter). If the relevant geographic market consisted of multiple economic areas in
multiple countries, it is the weighted average of the deviations. The weight applied
is the annual national GDP.
NEG-SHOCKtj Negative deviation of real annual GDP from trend line (using the Hodrick-Prescott
filter). If the relevant geographic market consisted of multiple economic areas in
multiple countries, it is the weighted average of the deviations. The weight applied
is the annual national GDP.
INTERESTtj Annual average (real) short-term interest rates, 3-month maturity, of cartel j’s relevant
market at t. If the relevant geographic market consisted of multiple economic areas
in multiple countries, it is the weighted average of the rates. The weight applied is
the annual national GDP.
NUM-EX-MERGERSsj The number of mergers that have occurred within a cartel prior to the current spell.
DUR-EX-MERGERsj The duration of the prior spell within a cartel.
Page 27
27
Table 2. Poisson Regression Results
6-month period 12-month period
(1) (2) (3) (4) (5)
Antitrust policy cateogries
PRE-LENIENCY −1.700∗∗∗ −0.602∗ −1.724∗∗∗ −0.850∗∗ −0.865∗∗
(0.240) (0.353) (0.240) (0.346) (0.387)
SETTLEMENT −1.440∗∗∗ −1.026∗∗ −1.751∗∗∗ −1.405∗∗∗ −1.112∗∗
(0.392) (0.418) (0.485) (0.501) (0.472)
Control variables
FIRMS INVOLVED 0.025∗∗∗ 0.029∗∗∗ 0.031∗∗∗
(0.004) (0.005) (0.006)
CARTELS STARTED −0.166∗∗∗ −0.197∗∗∗ −0.212∗∗∗
(0.031) (0.042) (0.048)
∆ GDP (%) −0.316∗∗∗ −0.430∗∗∗ −0.145
(0.116) (0.130) (0.138)
PEAK-THROUGH (=1 if yes) −0.487∗∗ −0.586∗∗ −0.240
(0.245) (0.259) (0.267)
POS-SHOCK (trillion dollars) −0.003∗∗ −0.001 0.002
(0.001) (0.002) (0.001)
NEG-SHOCK (trillion dollars) −0.007∗∗∗ −0.008∗∗∗ −0.005
(0.003) (0.003) (0.003)
Constant 1.322∗∗∗ −1.611∗∗∗ 2.627∗∗∗ 0.008 −0.489
(0.115) (0.543) (0.442) (0.709) (0.962)
Pseudo-R2 0.260 0.394 0.280 0.407 0.505
Observations 87 87 84 84 42
Note.– Standard errors are robust to heteroskedasticity and are shown in parentheses. The table reports the Poisson regression
results. The dependent variable is the number of mergers and JVs per period. The units of observation in columns 1, 2, 3,
and 4 are six-month periods. The unit of observation in columns 5 is 12-month period. The omitted antitrust policy category
is LENIENCY which includes the periods between July 18, 1996 and June 29, 2008. The category PRE-LENIENCY includes
the periods that predate July 17, 1996. The category SETTLEMENT includes the periods that postdate June 30, 2008. The
variable FIRMS INVOLVED is the number of firms that have joined a cartel by the end of the period; the variable CARTELS
STARTED is the number of cartels that have started by the end of the period; ∆ GDP is the is the annual growth rate of
the real gross domestic product in the EU; PEAK-TROUGH=1 if the period is in a peak-to-trough of a business cycle, =0
otherwise. POS-SHOCK (resp. NEG-SHOCK) is the positive (resp. negative) deviation of real annual EU GDP from trend
line (using the Hodrick-Prescott filter).
*** Significant at the 1 percent level.
** Significant at the 5 percent level.
* Significant at the 10 percent level.
Page 28
28
Table 3. Descriptive Statistics of The Cartel-Event Data Set
Full Sample Merger Sample
Mean (Std. Dev.) Median Mean (Std. Dev.) Median
TIME-TO-MERGER (mon.) 181.79 (108.43) 171.98 161.29 (102.12) 148.29
SPELL-LENGTH (mon.) 120.01 (106.15) 94.13 72.62 (58.90) 62.24
FIRMS 11.20 (8.79) 8 13.76 (8.88) 11
NUM-EX-MERGERS 1.69 (2.83) 1 2.40 (3.11) 1
DUR-EX-MERGER (mon.) 29.19 (46.48) 2.24 40.86 (50.36) 17.79
PRICE FIXING (1=yes) 0.94 (0.24) 1 0.95 (0.23) 1
MARKET ALLOC (1=yes) 0.77 (0.42) 1 0.77 (0.42) 1
BID RIGGING (1=yes) 0.11 (0.31) 0 0.10 (0.30) 0
N % N %
INDUSTRY TYPE
Wholesale & retail trade 5 1.74 2 0.99
Food, feed, tobacco & other agr. products 11 0.04 4 0.02
Primary material 49 0.17 40 0.20
Chemicals 74 0.26 47 0.23
Machinery, equipment& metal products 60 0.21 51 0.25
Transport 37 0.13 28 0.14
Textiles & paper products 25 0.09 25 0.12
Other products & services 26 0.09 5 0.02
MARKET SCOPE
National 49 17.07 31 15.35
Multinational 43 14.98 33 16.34
EU-wide or EEA-wide 127 44.25 102 50.50
Worldwide 68 23.69 36 17.82
Number of Observations 287 202
Number of Cartels 114 39
Number of Firms 506 119
Source.– Authors’ calculations based on decisions on 139 cartels and information by the European Commission and judgments
of the Court of First Instance and the European Court of Justice for the period 1996-2012 and information on 135 mergers
and joint ventures concluded by the cartel members between 1983 and 2010.
Note.– An “observation” corresponds to a Cartel-Spell combination. For the first merger, a spell starts at the time of cartel
birth and ends at the time of the merger. For second and subsequent mergers, a spell starts at the time of the preceding
merger and ends at the time of the present merger. Censored spells start at the time of cartel birth (for cartels with no
merger) or the last merger (for cartels with mergers) and end at the time of data collection (December 31, 2012).
Page 29
29
Table4.Desc
riptiveStatisticsofTheCartel-Spell-P
eriod
DataSet
Panel
A:Mea
nsandStandard
Dev
iations
Pre-L
eniency
Len
iency
Settlem
ent
All
Mea
n(S
td.Dev
.)Obs.
Mea
n(S
td.Dev
.)Obs.
Mea
n(S
td.Dev
.)Obs.
Mea
n(S
td.Dev
.)Obs.
MERGER
t j(1=yes)
0.00
(0.06)
9,876
0.01
(0.08)
17,361
0.00
(0.03)
7,202
0.00
(0.07)
34,439
ECMR04t(1=yes)
0.00
(0.00)
9,876
0.39
(0.49)
17,361
1.00
(0.00)
7,202
0.40
(0.49)
34,439
BREAKDOW
Nt j(1=yes)
0.29
(0.45)
9,876
0.78
(0.41)
17,361
1.00
(0.05)
7,202
0.69
(0.46)
34,439
INSPECTIO
Nt j(1=yes)
0.28
(0.45)
9,876
0.68
(0.47)
17,361
0.98
(0.12)
7,202
0.63
(0.48)
34,439
FIR
MS
9.52
(8.53)
9,876
7.19
(5.87)
17,361
7.10
(5.85)
7,202
7.84
(6.82)
34,439
∆GDP
(%)
2.39
(1.41)
9,834
2.49
(1.14)
17,361
0.06
(2.46)
7,201
1.95
(1.86)
34,396
PEAK-T
ROUGH
(1=yes)
0.53
(0.46)
9,858
0.38
(0.46)
17,361
0.54
(0.48)
7,201
0.46
(0.47)
34,420
POS-SHOCK
($tn
)20,261.71
(45,9
51.47)
9,858
69,747.30
(152,3
33.70)
17,361
44,519.84
(98,9
19.05)
7,201
50,296.63
(121,7
04.70)
34,420
NEG-SHOCK
($tn
)29,646.70
(51,3
75.78)
9,858
33,525.79
(71,2
79.15)
17,361
120,191.50
(250,9
03.20)
7,201
50,546.13
(133,3
16.60)
34,420
INTEREST
(%)
7.77
(2.84)
8,014
3.35
(1.10)
17,349
1.21
(1.10)
7,195
3.97
(2.89)
32,558
NUM-E
X-M
ERGERS
0.32
(1.33)
9,876
0.74
(1.75)
17,361
1.11
(2.25)
7,202
0.70
(1.79)
34,439
DUR-E
X-M
ERGER
(mon.)
8.20
(27.13)
9,876
21.56
(43.64)
17,361
32.13
(53.10)
7,202
19.94
(42.81)
34,439
(Continued
overleaf)
Page 30
30
Table4.(C
ontinued
)
Panel
B:Med
ians
Pre-L
eniency
Len
iency
Settlem
ent
All
Med
ian
Obs.
Med
ian
Obs.
Med
ian
Obs.
Med
ian
Obs.
MERGER
t j(1=yes)
0.00
9,876
0.00
17,361
0.00
7,202
0.00
34,439
ECMR04t(1=yes)
0.00
9,876
1.00
17,361
1.00
7,202
0.00
34,439
BREAKDOW
Nt j
0.00
9,876
1.00
17,361
1.00
7,202
1.00
34,439
INSPECTIO
Nt j
0.00
9,876
1.00
17,361
1.00
7,202
1.00
34,439
FIR
MS
6.00
9,876
5.00
17,361
5.00
7,202
5.00
34,439
∆GDP
(%)
2.49
9,834
2.71
17,361
0.99
7,201
2.21
34,396
PEAK-T
ROUGH
0.82
9,858
0.00
17,361
0.90
7,201
0.17
34,420
POS-SHOCK
0.00
9,858
0.00
17,361
0.00
7,201
0.00
34,420
NEG-SHOCK
1,953.52
9,858
937.97
17,361
7,258.18
7,201
1,641.57
34,420
INTEREST
(%)
7.39
8,014
3.32
17,349
0.82
7,195
3.39
32,558
NUM-E
X-M
ERGERS
0.00
9,876
0.00
17,361
0.00
7,202
0.00
34,439
DUR-E
X-M
ERGER
(mon.)
0.00
9,876
0.00
17,361
0.00
7,202
0.00
34,439
Source.–
Auth
ors’ca
lculationsbasedondecisionson139ca
rtelsandinform
ationbyth
eEuropea
nCommissionandjudgmen
tsofth
eCourt
ofFirst
Instance
andth
eEuropea
n
Court
ofJusticeforth
eperiod1996-2012andinform
ationon135mergersandjointven
turesco
ncluded
byth
eca
rtel
mem
bersbetween1983and2010.
Note.–
An“observation”co
rrespondsto
aCartel-Spell-Periodco
mbination.A
periodis
30days.
Forth
efirstmerger,asp
ellstartsatth
etimeofca
rtel
birth
anden
dsatth
e
timeofth
emerger.Forseco
ndandsu
bsequen
tmergers,
asp
ellstartsatth
etimeofth
eprecedingmerger
anden
dsatth
etimeofth
epresentmerger.Cen
soredsp
ells
start
at
thetimeofca
rtel
birth
(forca
rtelswithnomerger)orth
elast
merger
(forca
rtelswithmergers)
anden
datth
etimeofdata
collection(D
ecem
ber
31,2012).
Page 31
31
Table5.Cartel-L
evelDiscrete-T
imeHazard
RegressionResu
lts
MERGER
t j
(1)
(2)
(3)
(4)
(5)
(6)
(7)
POLIC
Yt(ref
issp
ellperiodsbetweenJuly
18,1996to
June30,2008) †
PRE-L
EN
t(spellperiodsbefore
July
17,1996)
−0.052
−0.254
−0.058
−0.780∗∗
−0.817∗
−1.160∗∗
∗−1.209∗∗
∗
(0.349)
(0.338)
(0.348)
(0.351)
(0.424)
(0.406)
(0.409)
SETTLEM
t(spellperiodsafter
July
1,2008)
−1.806∗∗
∗−1.284∗∗
∗−1.791∗∗
∗−1.615∗∗
∗−1.092∗∗
−0.909∗
−0.752
(0.392)
(0.424)
(0.400)
(0.410)
(0.477)
(0.540)
(0.550)
BREAKDOW
Nt j†
0.368
0.443
0.589
0.683∗∗
0.446
0.713∗∗
1.151∗∗
∗
(0.349)
(0.332)
(0.369)
(0.329)
(0.338)
(0.320)
(0.384)
BREAKDOW
Nt j×
TIM
E-A
FTER-B
REAKDOW
Nt j†
−0.138∗
(0.073)
ControlVariables
ECMR04t†
−0.884∗∗
∗−0.674∗∗
−0.605∗∗
(0.226)
(0.303)
(0.295)
INSPECTIO
Nt j†
−0.325
0.069
0.636∗
(0.291)
(0.305)
(0.351)
INSPECTIO
Nt j×
TIM
E-A
FTER-INSPECTIO
Nt j†
−0.164∗
(0.099)
Log(F
IRMSj)
1.533∗∗
∗1.431∗∗
∗1.377∗∗
∗
(0.229)
(0.244)
(0.238)
INDUSTRY
TYPEj(ref
isagricu
lturalproducts)
No
No
No
MARKET
SCOPEj(ref
isnationalca
rtels)
Yes
Yes
No
Log(∆
GDPt j+6.56) †
0.474
0.004
0.083
(0.541)
(0.566)
(0.588)
Log(P
EAK-T
ROUGH
t j+1) †
0.100
−0.198
−0.185
(0.283)
(0.281)
(0.280)
Log(P
OS-SHOCK
t j+1) †
−0.005
−0.059
−0.056
(0.048)
(0.078)
(0.077)
Log(N
EG-SHOCK
t j+1) †
0.039
−0.050
−0.044
(0.051)
(0.075)
(0.075)
(Continued
overleaf)
Page 32
32
Table5.(C
ontinued
)
MERGER
t j
(1)
(2)
(3)
(4)
(5)
(6)
(7)
Log(INTEREST
t j+4.9) †
1.938∗∗
∗0.909
0.939
(0.623)
(0.749)
(0.714)
Duration-Interval-Specific-Dummy†
[0,15]month
s−5.566∗∗
∗−5.526∗∗
∗−5.570∗∗
∗−7.937∗∗
∗−10.990∗∗
∗−9.101∗∗
∗−9.451∗∗
∗
(0.392)
(0.394)
(0.393)
(0.948)
(2.158)
(2.266)
(2.320)
[16,35]
−5.760∗∗
∗−5.685∗∗
∗−5.759∗∗
∗−8.064∗∗
∗−11.122∗∗
∗−9.119∗∗
∗−9.396∗∗
∗
(0.333)
(0.337)
(0.337)
(0.849)
(2.180)
(2.277)
(2.315)
[36,55]
−6.083∗∗
∗−5.958∗∗
∗−6.088∗∗
∗−8.441∗∗
∗−11.533∗∗
∗−9.532∗∗
∗−9.778∗∗
∗
(0.353)
(0.340)
(0.358)
(0.918)
(2.172)
(2.287)
(2.313)
[56,75]
−6.063∗∗
∗−5.853∗∗
∗−6.060∗∗
∗−8.488∗∗
∗−11.426∗∗
∗−9.467∗∗
∗−9.742∗∗
∗
(0.387)
(0.361)
(0.384)
(0.981)
(2.151)
(2.297)
(2.336)
[76,100]
−5.773∗∗
∗−5.512∗∗
∗−5.751∗∗
∗−8.184∗∗
∗−11.175∗∗
∗−9.185∗∗
∗−9.385∗∗
∗
(0.397)
(0.375)
(0.399)
(0.907)
(2.145)
(2.247)
(2.277)
[101,125]
−5.275∗∗
∗−5.068∗∗
∗−5.227∗∗
∗−7.676∗∗
∗−10.636∗∗
∗−8.667∗∗
∗−8.828∗∗
∗
(0.370)
(0.347)
(0.369)
(0.914)
(2.168)
(2.290)
(2.308)
[126,150]
−6.455∗∗
∗−6.288∗∗
∗−6.394∗∗
∗−8.858∗∗
∗−11.802∗∗
∗−9.881∗∗
∗−10.018∗∗
∗
(0.615)
(0.602)
(0.616)
(1.028)
(2.314)
(2.412)
(2.417)
[151,170]
−6.716∗∗
∗−6.511∗∗
∗−6.641∗∗
∗−9.191∗∗
∗−12.081∗∗
∗−10.182∗∗
∗−10.282∗∗
∗
(0.734)
(0.708)
(0.744)
(1.091)
(2.111)
(2.180)
(2.191)
[171,190]
−5.858∗∗
∗−5.589∗∗
∗−5.777∗∗
∗−8.284∗∗
∗−11.910∗∗
∗−9.961∗∗
∗−9.958∗∗
∗
(0.746)
(0.717)
(0.740)
(1.232)
(2.233)
(2.299)
(2.291)
[191,220]
−6.665∗∗
∗−6.452∗∗
∗−6.582∗∗
∗−9.208∗∗
∗−12.039∗∗
∗−10.300∗∗
∗−10.253∗∗
∗
(0.778)
(0.760)
(0.781)
(1.205)
(2.189)
(2.206)
(2.211)
≥221month
s−8.347∗∗
∗−8.100∗∗
∗−8.270∗∗
∗−11.194∗∗
∗−13.713∗∗
∗−12.137∗∗
∗−11.977∗∗
∗
(1.050)
(1.041)
(1.049)
(1.437)
(2.347)
(2.428)
(2.423)
(Continued
overleaf)
Page 33
33
Table5.(C
ontinued
)
MERGER
t j
(1)
(2)
(3)
(4)
(5)
(6)
(7)
Log(N
UM-E
X-M
ERGERSt j+1) ‡
0.966∗∗
∗0.980∗∗
∗1.004∗∗
∗−0.228
0.921∗∗
∗−0.144
0.046
(0.101)
(0.095)
(0.105)
(0.191)
(0.096)
(0.209)
(0.199)
Log(D
U-E
X-M
ERGER
t j+1) ‡
−0.034
−0.003
−0.031
−0.010
−0.030
0.007
0.019
(0.054)
(0.052)
(0.053)
(0.059)
(0.055)
(0.059)
(0.058)
Number
ofObservations
34,439
34,439
34,439
34,439
32,558
32,558
32,558
Number
ofSpells
287
287
287
287
287
287
287
Number
ofCartels
139
139
139
139
139
139
139
Log-pseudolikelihood
-877.058
-869.677
-876.337
-833.817
-835.026
-795.854
-792.125
Note.–
Standard
errors
are
robust
toheterosked
asticity,
clustered
byca
rtel
andare
shownin
parenth
eses.Thetable
reportsth
eca
rtel-lev
eldiscrete-timehaza
rdregression
resu
lts.
Thedep
enden
tvariable
MERGER
t jis
adichotomousindicatorofwhether
duringth
eperiod(t-30days,
t]amergeorJV
occurs
inca
rtel
j.Theomittedantitrust
policy
category
isLEN
twhichincludes
cartel
j’ssp
ell-periodsbetweenJuly
18,1996andJune29,2008.Theca
tegory
PRE-L
EN
tincludes
thesp
ell-periodsth
atpredate
July
17,1996.Theca
tegory
SETTLEM
tincludes
thesp
ell-periodsth
atpostdate
June30,2008.BREAKDOW
Nt j=1ifth
efirstex
itin
cartel
jtookplace
bytimet,
=0
oth
erwise.
†indicatesatime-varyingvariable;‡indicatesavariable
thatrelatesto
thepreviousmerger
episode.
***Significa
ntatth
e1percentlevel.
**Significa
ntatth
e5percentlevel.
*Significa
ntatth
e10percentlevel.
Page 34
34
Table 6. Cartel-Level Discrete-Time Hazard Regression Results (Robustness Checks)
MERGERtj
(1) (2) (3) (4) (5)
POLICYt (ref is spell periods between July 18, 1996 to June 30, 2008)†
PRE-LENt (spell periods before July 17, 1996) −1.099∗∗ −1.133∗∗∗ −1.587∗∗∗ −1.233∗∗∗ −1.160∗∗∗
(0.430) (0.439) (0.599) (0.420) (0.369)
SETTLEMt (spell periods after July 1, 2008) −0.939∗ −0.909 −0.852 −0.869∗ −0.909∗
(0.571) (0.655) (0.604) (0.553) (0.495)
BREAKDOWNtj† 0.694∗∗ 0.400 0.632 0.644∗∗ 0.713∗∗
(0.326) (0.355) (0.476) (0.327) (0.295)
Control Variables
ECMR04t† −0.649∗∗ −0.855∗∗∗ −1.056∗∗ −0.699∗∗ −0.674∗∗
(0.319) (0.303) (0.420) (0.299) (0.283)
INSPECTIONtj† 0.143 0.504 −0.005 0.103 0.069
(0.317) (0.352) (0.463) (0.331) (0.271)
Log(FIRMSj) 1.476∗∗∗ 1.326∗∗∗ 1.565∗∗∗ 1.458∗∗∗ 1.431∗∗∗
(0.265) (0.267) (0.374) (0.247) (0.221)
INDUSTRY TYPEj (ref is agricultural products) No No No No No
MARKET SCOPEj (ref is national cartel) No No No No Yes
Log(∆ GDPtj+6.56)† −0.099 −0.100 −0.326 0.009 0.004
(0.569) (0.581) (0.606) (0.579) (0.561)
Log(PEAK-TROUGHtj+1)† −0.249 −0.522∗ −0.315 −0.241 −0.198
(0.288) (0.277) (0.301) (0.281) (0.312)
Log(POS-SHOCKtj+1)† −0.078 −0.058 0.068 −0.060 −0.059
(0.079) (0.080) (0.091) (0.080) (0.075)
Log(NEG-SHOCKtj+1)† −0.073 −0.049 0.075 −0.052 −0.050
(0.075) (0.077) (0.084) (0.078) (0.077)
Log(INTERESTtj+4.9)† 0.719 0.808 1.557∗ 1.063∗∗ 0.909
(0.800) (0.820) (0.945) (0.762) (0.703)
Duration-Interval-Specific-Dummy†
[0, 15] months −8.379∗∗∗ −8.382∗∗∗ −10.065∗∗∗ −8.721∗∗∗ −9.101∗∗∗
(2.341) (2.500) (2.600) (2.519) (2.280)
[16, 35] −8.404∗∗∗ −8.506∗∗∗ −10.495∗∗∗ −8.738∗∗∗ −9.119∗∗∗
(2.348) (2.503) (2.638) (2.506) (2.274)
[36, 55] −8.818∗∗∗ −8.832∗∗∗ −10.468∗∗∗ −9.142∗∗∗ −9.532∗∗∗
(2.366) (2.533) (2.665) (2.537) (2.293)
[56, 75] −8.770∗∗∗ −8.705∗∗∗ −10.615∗∗∗ −9.050∗∗∗ −9.467∗∗∗
(2.394) (2.523) (2.695) (2.561) (2.296)
[76, 100] −8.475∗∗∗ −8.495∗∗∗ −10.072∗∗∗ −8.744∗∗∗ −9.185∗∗∗
(2.339) (2.469) (2.614) (2.537) (2.295)
[101, 125] −7.955∗∗∗ −8.165∗∗∗ −9.429∗∗∗ −8.327∗∗∗ −8.667∗∗∗
(2.390) (2.576) (2.603) (2.585) (2.303)
[126, 150] −8.960∗∗∗ −9.289∗∗∗ −10.604∗∗∗ −9.439∗∗∗ −9.881∗∗∗
(2.510) (2.683) (2.857) (2.699) (2.337)
[151, 170] − −9.383∗∗∗ −11.279∗∗∗ −9.748∗∗∗ −10.182∗∗∗
− (2.360) (2.816) (2.403) (2.399)
(continued overleaf )
Page 35
35
Table 5. (Continued)
MERGERtj
(1) (2) (3) (4) (5)
[171, 190] − −9.139∗∗∗ −10.206∗∗∗ −9.541∗∗∗ −9.961∗∗∗
− (2.493) (2.714) (2.610) (2.396)
[191, 220] − −9.556∗∗∗ −11.167∗∗∗ −9.876∗∗∗ −10.300∗∗∗
− (2.400) (2.726) (2.502) (2.409)
≥ 221 months − − −12.642∗∗∗ −11.688∗∗∗ −12.137∗∗∗
− − (2.886) (2.689) (2.498)
Log(NUM-EX-MERGERStj+1)‡ −0.227 −0.200 −0.447 −0.125 −0.144
(0.224) (0.233) (0.355) (0.212) (0.208)
Log(DUR-EX-MERGERtj+1)‡ 0.026 0.025 0.137 0.010 0.007
(0.060) (0.063) (0.092) (0.064) (0.057)
(2.293) (2.346) (2.751) (2.461) (2.456)
DISPERSIONj −1.950
(2.710)
Price-Fixj −0.699∗∗
(0.356)
Market-Allocj −0.225
(0.305)
Big Riggingj 0.158
(0.403)
Cartel-level random effect SD 0.004
(0.043)
Number of Observations 21,968 19,955 23,559 32,413 32,558
Number of Spells 286 223 192 284 287
Number of Cartels 129 95 100 138 139
Log-pseudo likelihood -741.603 -662.412 -512.053 -785.184 -795.854
Note.– Standard errors are robust to heteroskedasticity, clustered by cartel and are shown in parentheses. The table reports the
cartel-level discrete-time hazard regression results. The dependent variable MERGERtj is a dichotomous indicator of whether
during the period (t-30 days, t] a merge or JV occurs in cartel j. BREAKDOWNtj=1 if the first exit in cartel j took place by
time t, =0 otherwise. Specification (1) censors the spells at 145.5 months for spell periods before July 18, 1996. Specification
(2) excludes cartels with US market coverage. Specification (3) includes DISPERSION as a control variable. Specification (4)
includes infringement types as control variables. Specification (5) reports the estimates from a random effects model.
† indicates a time-varying variable; ‡ indicates a variable that relates to the previous merger episode.
*** Significant at the 1 percent level.
** Significant at the 5 percent level.
* Significant at the 10 percent level.
Page 36
36
0
1
2
3
4
5
6
7
8
9
10
Mer
gers
and
JV
s
1969 20131973 1977 1981 1985 1989 1993 1997 2001 2005 2009
Figure 1. Semi-Annual Number of Mergers and JVs
Notes: The sample runs from March 1969 to December 2013. The figure plots the total number of mergers and JVs in each six-
month period and over time. The vertical bars mark the introduction of the leniency program on July 18, 1996 and the introduction
of the settlement procedure on June 30, 2008, respectively.
Page 37
37
0.00
0.01
0.02
0.03
0.04
0.05
0.06
0.07
0.08
0.09
0.10
0.11
Mer
gers
per
Car
tel
1969 20131973 1977 1981 1985 1989 1993 1997 2001 2005 2009
Panel A
0.000
0.001
0.002
0.003
0.004
0.005
0.006
0.007
0.008
0.009
0.010
0.011
0.012
Mer
gers
per
Firm
1969 1973 1977 1981 1985 1989 1993 1997 2001 2005 2009 2013
Panel B
Figure 2. Semi-Annual Merger Rates
Notes: The sample runs from March 1969 to December 2013. Panel A plots the number of mergers and JVs per sampled cartel
in each six-month period and over time. Panel B plots the number of mergers and JVs per sampled firm. The vertical bars mark
the introduction of the leniency program on July 18, 1996 and the introduction of the settlement procedure on June 30, 2008,
respectively.
Page 38
38
−102
−101
−100
−99
−98
−97
Log−
likel
ihoo
d
−4 −3 −2 −1 0 1 2 3 4−5 5
Panel A: Six−month periods
−102
−101
−100
−99
−98
−97
Log−
likel
ihoo
d
−4 −3 −2 −1 0 1 2 3 4 5−5
Period in years
Panel B: Twelve−month periods
Figure 3. Leniency Programs versus Placebo Interventions
Notes: Each point corresponds to the maximized log-likelihood of a Poisson regression. The points at zero on the horizontal axes
are generated by breakpoints that correspond to the introduction of the leniency program on July 18, 1996. The points to the left
(right) of zero are generated by placebo interventions that predate (postdate) leniency introduction. Panel A features six-month
periods; panel B features twelve-month periods.
−104
−102
−100
−98
−96
−94
Log−
likel
ihoo
d
−4 −3 −2 −1 0 1 2 3 4 5−5
Periods in years
Figure 4. Settlement Procedure versus Placebo Interventions
Notes: Each point corresponds to the maximized log-likelihood of a Poisson regression. The points at zero on the horizontal axes
are generated by breakpoints that correspond to the introduction of the cartel settlement procedure on June 30, 2008. The points
to the left (right) of zero are generated by placebo interventions that predate (postdate) the introduction of settlement procedure.
Page 39
39
0.000
0.001
0.002
0.003
0.004
0.005
0.006
0.007
Den
sity
−200 −100 0 100 200 300Difference between Merger Date and First Cartel Exit (months)
Panel A
0.000
0.001
0.002
0.003
0.004
0.005
0.006
0.007
Den
sity
−200 −100 0 100 200 300Difference between Merger Date and Last Cartel Exit (monhts)
Panel B
Figure 5. Distribution of Mergers around the Time of Cartel Breakdown
Notes: The sample consists of 287 cartel-event combinations that are constructed using 135 mergers and JVs by members of EC
detected cartels (Decisions 1985-2013) for the period December 1983 to October 2012. The figure plots the distribution of merger
activities around the time that a cartel collapses. The observations located at zero on the horizontal axis are mergers or joint
ventures that took place at the same time of a cartel breakdown. The observations to the left (right) of zero are mergers before
(after) before a breakdown. Panel A uses the date that the first conspirator ends the infringement to mark the cartel’s breakdown.
Panel B uses the date that the last conspirator ends the infringement to mark the cartel’s breakdown.
Page 40
40
Panel A: Merger Distribution before July 18, 1996
0
.002
.004
.006
.008
.01
.012
Den
sity
−250 −200 −150 −100 −50 0 50 100 150 200 250
Panel B: Merger Distribution after July 18, 1996
0
.001
.002
.003
.004
.005
.006
.007
.008
.009
Den
sity
−100 0 100 200 250−250 −200 −150 −50 50 150Difference between Merger and Exit Dates (months)
Figure 6. Distribution of Mergers around Exiting Time by Cartel Policies
Notes: The sample consists of 287 cartel-event combinations that are constructed using 135 mergers and JVs by members of EC
detected cartels (Decisions 1985-2013) for the period December 1983 to October 2012. The figure plots the distribution of merger
activities around the time that a cartel collapses. The observations located at zero on the horizontal axis are mergers or joint
ventures that took place at the same time of a cartel breakdown. The observations to the left (right) of zero are mergers before
(after) before a breakdown. Panel A include all the sampled mergers. Panel B includes only mergers that completed before July
18, 1996. Panel C plots only mergers that completed after July 18, 1996.
Page 41
41
0.000
0.002
0.004
0.006
0.008
0.010
0.012
0.014
0 50 100 150 200 250 300
months elapsed from spell start
95% confidence bandhazard
Kaplan−Meier Empirical Hazard
Figure 7. Kaplan-Meier Empirical Hazard
Notes: The sample consists of 287 cartel-event combinations that the authors constructed using decisions on 139 cartels and
information by the European Commission and judgments of the Court of First Instance and the European Court of Justice for the
period 1996-2012 and information on 135 mergers and joint ventures concluded by the cartel members between 1983 and 2010.
Page 42
42
0.000
0.001
0.002
0.003
0.004
0.005
0.006
0.007
0.008
0.009M
erge
r H
azar
d
0 50 100 150 200
pre−leniency
leniency
settlement
Panel A: Kaplan−Meier Empirical Hazard (uncensored sample)
0.000
0.001
0.002
0.003
0.004
0.005
0.006
0.007
0.008
0.009
Mer
ger
Haz
ard
0 50 100 150 200months elapsed from spell start
pre−leniency
leniency
settlement
Panel B: Kaplan−Meier Empirical Hazard (censored sample)
Figure 8. Merger Dynamics before and Antitrust Policies
Notes: The sample consists of 287 cartel-event combinations that the authors constructed using decisions on 139 cartels and
information by the European Commission and judgments of the Court of First Instance and the European Court of Justice for the
period 1996-2012 and information on 135 mergers and joint ventures concluded by the cartel members between 1983 and 2010. The
circles correspond to merger hazards before July 18, 1996. The solid lines correspond to hazards between July 18, 1996 and June
30m , 2008. The dashed lines correspond to merger hazards after June 30, 2008. The duration spells in Panel A are not censored.
Panel B censors the observations at 145.5 months for spell durations before July 18, 1996.
Page 43
43
−801
−800
−799
−798
−797
−796
−795
Log−
Like
lihoo
d
−4 −3 −2 −1 0 1 2 3 4Period in Years
Figure 9. Leniency versus Placebo Interventions
Notes: Each point corresponds to the maximized log-likelihood of a hazard regression. The points at zero on the horizontal axes
are generated by breakpoints that correspond to the introduction of the cartel settlement procedure on June 30, 2008. The points
to the left (right) of zero are generated by placebo interventions that predate (postdate) the introduction of settlement procedure.
Page 44
44
References
[1] Aalen, Odd. O. (1988): “Heterogeneity in Survival Analysis”, Statistics in Medicine, 7, pp. 1121-37.
[2] Alvarez, Luis H.R. and Rune Stenbacka (2006): “Takeover Timing, Implementation Uncertainty, and
Embedded Divestment Options”, Review of Finance, 10, pp. 417-41.
[3] Allison, Paul D. (1982): “Discrete-Time Methods for the Analysis of Event Histories”, pp. 61-98 in
Sociological Methodology 1982, edited by Samuel Leinhardt. Jossey-Bass.
[4] Bittlingmayer, George (1985): “Did Antitrust Policy Cause the Great Merger Wave?”, Journal of Law
and Economics, 28, pp. 77-118.
[5] Boone, Jan (2006): “Firms Merge in Response to Constraints”, Discussion Paper 2006-60, Tilburg Uni-
versity, Center for Economic Research.
[6] Brenner, Steffan (2009): “An Empirical Study of The European Corporate Leniency Program”, Interna-
tional Journal of Industrial Organization, 27(6), pp. 639-45.
[7] Breslow, N. (1974), “Covariance Analysis of Censored Survival Data”, Biometrics, 30, pp. 89-99.
[8] Blossfeld, Hans-Peter, Alfred Hamerle, and Karl Ulrich Mayer (1989): Event History Analysis: Statistical
Theory and Applications in the Social Sciences. Hilldale, N.J.: Lawrence Erlbaum Associate
[9] Carlton, D., J. Perloff (2004): Modern Industrial Organization, Reading: Addison Wesley.
[10] Cosnita-Langlais, A., J.-P. Tropeano (2013): “Fight Cartels or Control Mergers? On the Optimal Alloca-
tion of Enforcement Efforts within Competition Policy”, International Review of Law and Economics, 34,
pp. 34-40.
[11] Cox, D. R. (1972): “Regression Models and Life-Tables”, Journal of the Royal Statistical Society, 34, pp.
187-220.
[12] Cox, D. R. and D. Oakes. (1984): Analysis of Survival Data. London: Chapman and Hall.
[13] Crampton, P. (2003): “Cartels as an International Competition Issue”, Working Paper, PECC General
Meeting 2003, Brunei.
[14] Davies, Stephen, Peter L. Ormosi, and Martin Graffenberger (2014): “Mergers after car-
tels: How markets react to cartel breakdown”, CCP Working Paper 14-1, available at:
http://competitionpolicy.ac.uk/documents/107435/107587/14-1+complete+v4.pdf/1a3bd047-1fa7-
44e8-bb84-7d93cdeaa7f4.
[15] De Pamphilis, D. (2003): “Mergers, Acquisitions, and Other Restructuring Activities: An Integrated
Approach to Process, Tools, Cases, and Solutions”, Amsterdam.
[16] DiCenso, Dina (2005): “Predicting a Merger with Financial Characteristics”, unpublished manuscript.
[17] Duso, Tomaso, Klaus Gugler and Florian Szucs (2013): “An Empirical Assessment of the 2004 EU Merger
Policy Reform”, The Economic Journal, 123, pp. 596-619.
[18] Erdogan, Aysa I. (2012): “The Determinants of Mergers and Acquisitions: Evidence from Turkey”, Inter-
national Journal of Economics and Finance, 4, pp. 72-7.
[19] Evenett, S. J., Levenstein, M. C., Suslow, V. Y., (2001): “International cartel enforce- ment: Lessons from
the 1990s”, The World Economy, 24, pp. 1221-45.
Page 45
45
[20] Gartner, Dennis and Jun Zhou (2013): “Delays in Leniency Application: Is There Really a Race to the
Enforcer’s Door?”, Unpublished working paper, Tilburg Law and Economics Center.
[21] Haltiwanger, John, and Harrington, Joseph E., Jr. (1991): “The Impact of Cyclical Demand Movements
on Collusive Behavior,” RAND Journal of Economics, 22, pp. 89-106.
[22] Harrington, Joseph E., Jr. and Myong-Hun Chang (2009): “Modeling the Birth And Death of Cartelswith
An Application to Evaluating Competition Policy,” Journal of European Economic Association, 7, pp.
1400-35.
[23] Heckman, James and Burton Singer (1984): “Economic Duration Analysis”, Journal of Econometrics, 24,
pp. 63-132.
[24] Hueschelrath, K., Smuda, F., (2012): “Do Cartel Breakdowns Induce Mergers? Evidence from EC Cartel
Cases”, European Competition Journal, 9, pp. 407-29.
[25] ICN (2006): “Merger Guidelines Workbook”, ICN Merger Working Group: Investigation and Analysis
Subgroup, Prepared for the Fifth Annual ICN Conference, Cape Town.
[26] Ivaldi, M., B. Jullien, P. Rey, P. Seabright, J. Tirole (2003): The Economics of Tacit Collusion, Final
Report for DG Competition, Toulouse.
[27] Jopp, Tobias Alexander (2011): “The Hazard of Merger By Absorption : Why Some Knappschaften
Merged and Others Did Not, 1861 to 1920”, Zeitschrift fr Unternehmensgeschichte, 56, pp. 75-101.
[28] Jovanovic, B. and P.L. Rousseau (2002): “The Q-theory of Mergers”, AEA Papers and Proceedings, pp.
198-204.
[29] Jovanovic, B. and P.L. Rousseau, (2004): “Mergers as Reallocation”, NBER Working Paper No. 9279.
[30] Kastrinaki, Zafeira and Stoneman, Paul. (2012): “The Drivers of Merger Waves”, Economics Letters, 117
(2), pp. 493-95.
[31] Kumar, V., R. Marshall, L. Marx, L. Samkharadze (2013): “Buyer Resistance for Cartel versus Merger”,
Unpublished Working Paper, Duke University.
[32] Kalbfleisch, J. D. and Ross L. Prentice (1980): The Statistical Analysis of Failure Time Data, New York:
John Wiley & Sons, Inc.
[33] Laird, Nan and Donald Oliver (1981): “Covariance Analysis of Censored Survival Data Using Log-Linear
Analysis Techniques”, Journal of the American Statistical Association, 76, pp. 231-40.
[34] Levenstein, Margaret C. (2013): “Cartel Prosecution: Stopping Price Fixers and Protecting Consumers”,
Testimony to Senate Committee on the Judiciary Subcommittee on Antitrust, Competition Policy and
Consumer Rights
[35] Levenstein, Margaret C., and Valerie Y. Suslow (2006): “What Determines Cartel Success?”, Journal of
Economic Literature, XLIV, pp. 43-95.
[36] Levenstein, Margaret C., and Valerie Y. Suslow (2010): “Constant Vigilance: Maintaining Cartel Deter-
rence During the Great Recession”, Competition Policy International, 6, pp. 145-62.
[37] Levenstein, Margaret C., and Valerie Y. Suslow (2011): “Breaking Up Is Hard to Do: Determinants of
Cartel Duration,” Journal of Law and Economics, 54, pp. 455-92.
Page 46
46
[38] Marx, L., C. Mezzetti, R. Marshall (2014): “Antitrust Leniency with Multi-Product Colluders”, Unpub-
lished Working Paper, Duke University.
[39] Kumar, V., R. Marshall, L. Marx, L. Samkharadze (2013): “Buyer Resistance for Cartel versus Merger”,
Unpublished Working Paper, Duke University.
[40] Langeheine, Rolf and Frank van de Pol (1990): “A Unifying Framework for Markov Modeling in Discrete
Space and Discrete Time”, Sociological Methods and Research, 18, pp. 416-41.
[41] Lin, Y. (1991): “Goodness-of-Fit Analysis for the Cox Regression Model Based on a Class of Parameter
Estimators,” Journal of the American Statistical Association, 86, pp. 725-28.
[42] Mason, Robin and Helen Weeds 92005): “The Timing of Takeovers”, mimeo.
[43] Lunn, Mary and Don R. McNeil (1995): “Applying Cox Regression to Competing Risks”, Biometrics, 51,
pp. 524-32.
[44] Mehra, P. (2007): “Choice between Cartels and Mergers”, Unpublished Working Paper, University of
Hamburg.
[45] Miller, Nathan H. (2009): “Strategic Leniency and Cartel Enforcement,” American Economic Review, 99,
pp. 750-68.
[46] Meyer, Bruce D. (1990): “Unemployment Insurance and Unemployment Spells,” Econometrica, 58, pp.
757-82.
[47] Motta, M. (2004): Competition Policy, Cambridge.
[48] Mueller, D. (1996): “Lessons from the United States’s Antitrust History”, International Journal of Indus-
trial Organization, 14, pp. 415-45.
[49] Mueller, D. (2004): “Efficiency Versus Market Power Through Mergers”, in: Neumann, M. and J. Weigand
(Eds.), The International Handbook of Competition, Cheltenham, 65-87.
[50] Nagin, Daniel S. and Andkenneth C. Land (1993): “Age, Criminal Careers, and Population Heterogeneity:
Specification and Estimation of A Nonparametric, Mixed Poisson Model”, Criminology, 31, pp. 327-62.
[51] Nocke, V., L. White (2007): “Do Vertical Mergers Facilitate Upstream Collusion?”, American Economic
Review, 97, pp. 1321-39.
[52] Perperoglou, Aris, Saskia le Cessie, and Hans C. van Houwelingen (2005): “Reduced-Rank Hazard Re-
gression for Modelling Non-Proportional Hazards”, Statistics in Medicine, 25, pp. 2831-45.
[53] R. L. Prentice and L. A. Gloeckler (1978): “Regression Analysis of Grouped Survival Data with Application
to Breast Cancer Data”, Biometrics, 34, pp. 57-67
[54] Posner, Richard A. (1970): “A Statistical Study of Antitrust Enforcement”, Journal of Law and Economics,
365, pp. 365-419.
[55] Rey, Patrick (2006): “On the Use of Economic Analysis in Cartel Detection”, EUI-RSCAS/EU Working
Paper, Florence.
[56] Rhodes-Kropf, M. and S. Viswanathan (2004): “Market Valuation and Merger Waves”, Journal of Finance,
59, pp. 2685-2718.
[57] Rosenbaum, Paul R. ; Rubin, Donald B. (1983): “The Central Role of the Propensity Score in Observa-
tional Studies for Causal Effects”, Biometrika, 70, pp. 41-55.
Page 47
47
[58] Rotemberg, Julio J. and Garth Saloner (1986): “A Supergame-Theoretic Model of Price Wars during
Booms”, The American Economic Review, 76, pp. 390-407.
[59] Stigler, G. (1950): “Monopoly and Oligopoly by Merger”, American Economic Review, 40, pp. 23-34.
[60] Singer, Judith D. and John B. Willett (2003): Applied Longitudinal Data Analysis: Modeling Change
and Event Occurrence. New York: Oxford University Press.
[61] Taylor, Jason E. (2007): “Cartel Code Attributes and Cartel Performance: An Industry-Level Analysis of
the National Industrial Recovery Act,” The Journal of Law and Economics, 50, pp. 597-624.
[62] Thijssen, J. (2005): “Risk, Strategy, and Optimal Timing of M&A Activity”, mimeo.
[63] Tichy, G. (2001): “What Do We Know About Success and Failure of Mergers?”, Journal of Industry,
Competition and Trade, 1, pp. 347-94.
[64] Toxvaerd, Flaxvio (2007): “Strategic Merger Waves: A Theory of Musical Chairs”, Journal of Economic
Theory, 140, pp. 1-26
[65] Toxvaerd, Flaxvio (2005): “Mergers, Diversiication and nancial Intermediation”, mimeo.
[66] Vasconcelos, H., (2005): “Tacit Collusion, Cost Asymmetries, and Mergers”, RAND Journal of Economics,
36, pp. 39-62.
[67] Vermunt, J. K. (1997): Log-linear models for event histories. Thousand Oaks, CA: Sage.
[68] Viscusi, W., J. Vernon, J. Harrington (1997), Economics of Regulation and Antitrust, Cambridge.
[69] Weston, J. (2001): “Merger and Acquisitions as Adjustment Processes”, Journal of Industry, Competition
and Trade, 1, pp. 395-410.
[70] Whinston, M. (2006): Lectures on Antitrust Economics, Cambridge.
[71] Willett, John B. and Judith D. Singer (1993): “Investigating Onset, Cessation, Relapse, and Recovery:
Why You Should, and How You Can, Use Discrete-Time Survival Analysis To Examine Event Occurrence”,
Journal of Consulting and Clinical Psychology, 61, pp. 952-65.
[72] Willett, John B. and Judith D. Singer (1995): “It’s Deja Vu All over Again: Using Multiple-Spell Discrete-
Time Survival Analysis”, Journal of Educational and Behavioral Statistics, 20, pp. 41-67.
[73] Zimmerman, Jeffrey E. and John M. Connor (2005): “Determinants of Cartel Duration: A Cross-Sectional
Study of Modern Private International Cartels”, available at SSRN: http://ssrn.com/abstract=1158577
[74] Zhou, Jun (2012): “Evaluating Leniency with Missing Information on Undetected Cartels: Exploring
Time-Varying Policy Impacts on Cartel Duration”, Unpublished working paper, Tilburg Law and Eco-
nomics Center.