The Dynamics of Vehicular Networks in Large-Scale Urban Environments (Invited Paper) Nicholas Loulloudes, George Pallis, Marios D. Dikaiakos Department of Computer Science, University of Cyprus Nicosia, CY1678, Cyprus {loulloudes.n, gpallis, mdd}@cs.ucy.ac.cy Abstract—Vehicular Ad hoc NETworks (VANETs) have emerged as a platform to support Intelligent Transportation Applications. A key to the development of protocols and services for IVC lies in the knowledge of the topological characteristics of the VANET communication graph. This article aims provide a “higher order” knowledge in the time-evolving dynamics of vehicular networks in large-scale urban environments through complex network analysis. In addition, we examine VANET dynamics from a spatial viewpoint in order to identify where/why in the underlying road network, particular network phenomena occur. We make reference and correlate our findings with the main communication paradigms employed in VANETs, and discuss whether the emerging network phenomena can indeed support (and to what extend) these paradigms. I. I NTRODUCTION Inter-vehicle communication (IVC) has emerged as a promising field of research and development, where advances in wireless and mobile ad-hoc networks, global positioning systems and sensor technologies can be collectively applied to automobiles and result to great market potential. The concept of employing wireless communications in vehicles dates back to the ’80s, however with the recent proliferation of wireless hardware that support communication standards designed ex- clusively for the vehicular environment (IEEE 802.11p), wide deployment of Vehicular Ad Hoc NETworks (VANETs) is one step closer to realization. The development of IVC and its utilization in the deploy- ment of numerous Intelligent Transportation System (ITS) applications has been the target of research investigations in the recent literature, as well as of industrial projects run by large government-sponsored consortia (Car-2-Car Communi- cation - USA and CVIS - EU [1, 2]), along with field trials such as the Connected Vehicle Safety Pilot Program [3]. Due to the nature of vehicular mobility, VANETs are char- acterized by highly dynamic topologies, which are frequently prone to disconnection and severe fragmentation. Inevitably, these inherent characteristics put at stake the availability and quality of services of those intelligent applications for which VANETs were envisioned. Therefore, the establishment of robust VANETs that could effectively support communications and applications on a large geographical scale, remains an open challenge. A. Motivation The motivation for this work stems from the fact that the study of the structural properties of large, real-world, dynamic systems (i.e. Internet topology, biological and on- line social networks) has led to crucial observations having significant influence in information and social sciences. For instance, the discovery of power-laws in the Internet topology by Faloutsos et al.[4], revolutionized the computer science field by enabling the design of efficient information routing protocols that capture the Internet topology characteristics. Consequently, the study of VANET communications from the complex network science aspect can provide crucial insights to their extremely dynamic nature. A vehicular network is a very challenging domain given that it combines opportunistic ad hoc communications among vehicles and, oftentimes, fixed road-side units. Despite the fact that it presents similarities with traditional MANETs, mobile nodes (i.e. vehicles) have ample energy and are highly mobile in spite of spatial con- strains imposed by the underlying road network topology. Grasping the dynamics of the underlying VANET and its inherent capacity to support message dissemination using different communication paradigms, is fundamental during the design and deployment of any innovative ITS application. For instance, the Virtual Traffic Lights (VTL) application [5], which recently spun out into a startup by a team of researchers, aims to provide optimized traffic light signaling by leveraging IVC capabilities that will soon be available in modern vehicles. Synchronization phases will be decided in a distributed and self-organized manner through the exchange of periodic 1-hop broadcasts of traffic signal message. To this end, VTL and other ITS application stakeholders would like answers to questions such as: “Does the topology support message spread with minimal re-broadcasts reducing latency and network overhead?”. In case that multi-hop com- munication is preferred, “How far in the topology can data packets travel?”, and “Which are the ’best’ nodes that can be en-charged with the data forwarding process, and where are they located?”. On the other hand, if relying on geocasting for pushing alert messages to remote geographic areas, “What is the spatial coverage of the VANET and its components”, and “What are the characteristics of bridge nodes that can be assigned with the task of message ferrying?”. Finally, in
Transcript
The Dynamics of Vehicular Networks inLarge-Scale Urban Environments
(Invited Paper)
Nicholas Loulloudes, George Pallis, Marios D. DikaiakosDepartment of Computer Science, University of Cyprus
Abstract—Vehicular Ad hoc NETworks (VANETs) haveemerged as a platform to support Intelligent TransportationApplications. A key to the development of protocols and servicesfor IVC lies in the knowledge of the topological characteristicsof the VANET communication graph. This article aims providea “higher order” knowledge in the time-evolving dynamics ofvehicular networks in large-scale urban environments throughcomplex network analysis. In addition, we examine VANETdynamics from a spatial viewpoint in order to identify where/whyin the underlying road network, particular network phenomenaoccur. We make reference and correlate our findings with themain communication paradigms employed in VANETs, anddiscuss whether the emerging network phenomena can indeedsupport (and to what extend) these paradigms.
I. INTRODUCTION
Inter-vehicle communication (IVC) has emerged as apromising field of research and development, where advancesin wireless and mobile ad-hoc networks, global positioningsystems and sensor technologies can be collectively applied toautomobiles and result to great market potential. The conceptof employing wireless communications in vehicles dates backto the ’80s, however with the recent proliferation of wirelesshardware that support communication standards designed ex-clusively for the vehicular environment (IEEE 802.11p), widedeployment of Vehicular Ad Hoc NETworks (VANETs) is onestep closer to realization.
The development of IVC and its utilization in the deploy-ment of numerous Intelligent Transportation System (ITS)applications has been the target of research investigations inthe recent literature, as well as of industrial projects run bylarge government-sponsored consortia (Car-2-Car Communi-cation - USA and CVIS - EU [1, 2]), along with field trialssuch as the Connected Vehicle Safety Pilot Program [3].Due to the nature of vehicular mobility, VANETs are char-acterized by highly dynamic topologies, which are frequentlyprone to disconnection and severe fragmentation. Inevitably,these inherent characteristics put at stake the availability andquality of services of those intelligent applications for whichVANETs were envisioned. Therefore, the establishment ofrobust VANETs that could effectively support communicationsand applications on a large geographical scale, remains anopen challenge.
A. Motivation
The motivation for this work stems from the fact thatthe study of the structural properties of large, real-world,dynamic systems (i.e. Internet topology, biological and on-line social networks) has led to crucial observations havingsignificant influence in information and social sciences. Forinstance, the discovery of power-laws in the Internet topologyby Faloutsos et al.[4], revolutionized the computer sciencefield by enabling the design of efficient information routingprotocols that capture the Internet topology characteristics.Consequently, the study of VANET communications from thecomplex network science aspect can provide crucial insightsto their extremely dynamic nature. A vehicular network is avery challenging domain given that it combines opportunisticad hoc communications among vehicles and, oftentimes, fixedroad-side units. Despite the fact that it presents similaritieswith traditional MANETs, mobile nodes (i.e. vehicles) haveample energy and are highly mobile in spite of spatial con-strains imposed by the underlying road network topology.
Grasping the dynamics of the underlying VANET and itsinherent capacity to support message dissemination usingdifferent communication paradigms, is fundamental during thedesign and deployment of any innovative ITS application.For instance, the Virtual Traffic Lights (VTL) application [5],which recently spun out into a startup by a team of researchers,aims to provide optimized traffic light signaling by leveragingIVC capabilities that will soon be available in modern vehicles.Synchronization phases will be decided in a distributed andself-organized manner through the exchange of periodic 1-hopbroadcasts of traffic signal message.
To this end, VTL and other ITS application stakeholderswould like answers to questions such as: “Does the topologysupport message spread with minimal re-broadcasts reducinglatency and network overhead?”. In case that multi-hop com-munication is preferred, “How far in the topology can datapackets travel?”, and “Which are the ’best’ nodes that can been-charged with the data forwarding process, and where arethey located?”. On the other hand, if relying on geocastingfor pushing alert messages to remote geographic areas, “Whatis the spatial coverage of the VANET and its components”,and “What are the characteristics of bridge nodes that canbe assigned with the task of message ferrying?”. Finally, in
information hovering, “does the VANET incorporate structuresthat facilitate temporal information maintenance?”
All these questions and many more require knowledgeof the characteristics of the VANET communication graph,wherein vehicles correspond to vertices and wireless ad hoccommunication links correspond to edges. In [6], we set outto gain and provide “first-order” knowledge about the topo-logical features of small urban-based VANET graphs. Later in[7, 8] we extended our initial study and aimed to providea “higher-order” knowledge by studying the time-evolvingtopological characteristics of the VANET, along with how suchknowledge could eventually be utilized towards improvingthe performance of VANET routing protocols. More recently,[9] reported new and interesting insights by examining thestructure of large-scale, urban VANETs. This work focusedon the topological characteristics of the network and made keyobservations regarding the overall level and quality of inter-vehicle connectivity.
However, given that a VANET graph is realized from themovement and opportunistic interactions of vehicles whilebeing driven on the underlying road network, it can be “seen”from the viewpoint of real-world networks that are well-embedded in low-dimension geometric structures(e.g powergrid on surface of the earth). Consequently, besides its tempo-ral evolution, the VANET has a spatial dimension and shouldthus be studied accordingly. With a concurrent understandingof the spatio-temporal characteristics of V2V communication,researchers will ultimately gain the necessary knowledge thatwill enable the design and implementation of data dissem-ination protocols that exploit effectively and efficiently thedifferent VANET communication paradigms.
B. Paper’s Contributions
The objective of this work is twofold: a) to examine andsupplement the knowledge in time-evolving topological char-acteristics of the VANET communication graph. In contrast tothe previous studies reported in [6, 10–12] we improve ouranalysis testbed by considering large-scale realistic vehicularmobility traces based in real-world urban environments anddedicated communication technologies models for generatingthe VANET graphs; and b) to extend the findings of [9] byexamining the VANET dynamics from a more specific spatialviewpoint in order to identify where and/or why particularnetwork phenomena occur on the underlying road network.The present work continues and improves upon our prelimi-nary efforts in [7, 8] towards deriving insightful implicationsfor the vehicular networking community. Furthermore, wecorrelate our findings with the main communication paradigmsemployed in VANETs, and discuss whether the emergingnetwork phenomena can indeed support (and in what extend)these paradigms.
The rest of the article is organized as follows: Section II sur-veys the Related works; Section III presents the System Modeland the measures used to characterize the spatio-temporalevolution of the VANET communication graph; Section IVprovides information concerning the source of the data studied
and the analysis testbed. Section V records the findings of thestudy. Finally, Section VI concludes the article.
II. RELATED WORKS
There is a rich body of work currently on the literaturethat deals with scientific frameworks for studying the temporalevolution of a number of real-world systems [13]. Thesegraphs span a broad range of domains (autonomous systems,e-mail networks, citations, etc.) and their study has lead tosignificant implications since most of real-world dynamicnetworks (online social networks, Internet, etc.) have beenproved to follow some topological statistical features (i.e.scale-free, small-world, power-laws).
The value of the connectivity analysis of ad hoc networksis so fundamental that a competition-experiment was initiated[11] to study MANET network connectivity, degree distri-bution, clustering, topology change frequency, route lengthdistribution, route change frequency, etc. The obtained resultsshow a high degree of topology and route changes, evenwhen mobility is low, and a prevalence of asymmetric routes,both of which contradict assumptions commonly made insimulations. Also, well-known concepts from social networkanalysis, such as the betweenness centrality index have beenused as primitives to design advanced protocols for routingand caching in ad hoc sensor networks.
In the context of vehicular networking, Fiore et. al [10]study the node degree distribution, link duration, clustering1
coefficient and number of clusters for VANET graphs undervarious mobility models. The objective was to study the topo-logical properties of different mobility models and explainingwhy each leads to dissimilar network protocol performance.
Viriyasitavat et. al [12], presented a comprehensive ana-lytical and simulation framework for network connectivityof urban VANETs, utilizing system parameters such as linkduration, re-connection frequency, and re-healing time. Theauthors use data from a cellular automata-based traffic mobilitymodel based on a grid-like road topology. Monteiro et. al [14]also make use of the above traffic model to analyze simpleproperties such as degree distribution, average shortest pathlength and clustering co-efficient. Similar to our previousefforts [7], the authors extend a known VANET-dedicatedprotocol, with preliminary results showing benefits (networkoverhead reduction) when using topological information dur-ing information broadcast.
Despite the thorough evaluation, the above research worksbase their observations in the study and analysis of a small-scale VANET deployed on a rectangular road topology. Giventhat the majority of real-world urban environments do notpertain to the simplistic layout and characteristics of suchtopologies, the findings on network connectivity could bebiased [15]. To the best of our knowledge, our preliminarywork in [6] was the first effort to study the structural evolutionof a large-scale VANET topology over a real-world road net-work. Using realistic mobility traces available at the time, we
1The terms “cluster” and “component” are used interchangeably in thismanuscript.
analyzed the communication graph emerging from thousandsof vehicles driven in Zurich. Despite the valuable findings ofthat study, the employed synthetic traces were characterizedby highly variable vehicle density and a rather non-uniformtraffic distribution, which hindered the precise capture ofthe topological features. Recently, [16] employed the samedataset in a quest to find social properties in VANETs.Macroscopic (distance, diameter, density) and microscopic(degree, cluster coefficient and closeness centrality) measureswere examined to identify social behavior emergence fromopportunistic vehicle interactions. Similarly to our findings in[6], they characterize VANETs as scale free, since they identify(during peak-traffic hours) the presence of a degree distributionthat follows a Power Law. Grzybek et. al [17] use syntheticmobility traces for the city of Luxembourg to evaluate thepresence and characteristics of large-scale communities inurban environments.
More recently [9] provided a more complete analysis of theinstantaneous VANET communication graph by examining theopportunistic encounters of vehicles driven in Cologne, Ger-many. The authors employ the TAPAS-Cologne [18] datasetthat describes the mobility of several thousand vehicles mov-ing in the urban and sub-urban regions of Cologne. Theiranalysis unveiled that the VANET is composed of a large num-ber of disconnected components that hinder delay-sensitive,multi-hop communication among vehicular peers. Further-more, it revealed that large components are unreliable in termsof their internal dynamics (frequent re-wiring of multi-hoppaths), ascribed to their significant temporal variability. TheVANET also lacks navigability since it does not exhibit theproperties of scale-free networks. Although [9] provided newand interesting findings regarding the VANET topology, thesewere summarized over a 24-hour time-frame analysis, whichincluded both peak and off-peak traffic periods. However,all the interesting phenomena appear during morning andafternoon peak-hours, at which time, the prevailing trafficconditions shape the vehicular network in a way that inter-vehicular communication can effectively take place.
In this work, we focus on the VANET communication graphrealized during the morning peak-period and we commit toa fine-grained analysis of the respective topology featuresand dynamics by employing additional measurements fromcomplex network science. Furthermore, the VANET can be“seen” from the viewpoint of real-world networks that are em-bedded in low-dimension geometric structures. Consequently,besides its obvious temporal evolution, it also exhibits aspatial dimension and should thus be studied accordingly. As aconsequence, in contrast to the above research works, we aimto identify where in the underlying road network particularnetwork phenomena occur and which are the driving factors.
III. SYSTEM MODEL AND NETWORK MEASURES
We consider a VANET in a large-scale urban environment,comprised of vehicles equipped with an IEEE 801.11p ca-pable transceiver. All vehicles share identical nominal line-of-sight and non-line-of-sight transmission range (RLOS and,
RNLOS). Each vehicle has its own mobility profile definedas an ordered-sequence of spatio-temporal points MP =〈P1 . . . Pn〉, where Pc = (x, y, t) and x, y are defined asgeospatial coordinates (transformed to the Euclidean space)and t is a distinct time instance. S = t(P1) and D = t(Pn)are regarded as the start and destination location/times, respec-tively. Vehicles indicate their intention to participate in theVANET by frequently broadcasting beacon messages Bmsg .We assume, vehicles are aware of the road travelling onthrough on-board maps and the Global Positioning System(GPS).
Each vehicle can be driven on a road obeying to thefollowing taxonomy:
• Urban Roads: Low capacity roadways, providing accessto residential areas with houses or amenities on eitherside. One-way or two-way with 1 lane per travel direction.The maximum speed υ(max) is 30 Km/h.
• Collector Roads: Low-to-moderate capacity roadways,collecting traffic from urban roads to arterial roads orvice-versa. Traffic flow is managed via signalized in-tersections and stop-signs. Two lanes per direction withυ(max): 30–50 Km/h, depending on the area.
• Arterial Roads: High-capacity, bi-directional urban road-ways, delivering traffic between collector roads and free-ways and also carrying long-distance traffic flows be-tween activity areas. Considered as the back-bone of theroad network and traditionally are arranged in concentriccircles. Two lanes per direction and usually separated intotwo classes: (i) Low-speed, with υ(max): 50 Km/h and (ii)high-speed, where υ(max): 80 Km/h.
• Freeways: Multi-lane, bi-directional, high volume road-ways dedicated to high speed vehicular traffic. Trafficflow is not obstructed by stop signs and traffic signals.Separation and connection with other roadways of lowergrade (i.e arterial and collector roads) carried out viaoverpasses across the highway span. Entrance or exitto freeway are provided at overpasses by ramps thatenable speed transitions. Freeways have 2 lanes per drivedirection with υ(max): 120 Km/h.
We model the VANET as an undirected graph G(t), wherevehicles correspond to the set of vertices V (t) = {ui} andcommunication links to the set of edges E(t) = {eij}. Anedge eij(t) exists, if ui can communicate directly with ujat time t (exchange Bmsg) , with i 6= j. In turn, thefollowing measures are utilized to characterize the spatio-temporal evolution of the VANET communication graph.
A. Link-level metrics
• Number of connected periods. The number of estab-lished links between a pair of vehicles within a giventime period. A connected period is the continuous timeinterval during which a link is established between twovehicles.
• Link duration. The time duration of a connected period.Formally, the duration lij(t) of the link from ui to uj at
time t is defined as lij(t) = tc − to, if ∃eij(t), wheret ∈ [to, tc] and 6 ∃eij(t′), where t′ < to or t′ > tc.
• Re-healing time. The time span between two successiveconnected periods of a pair of vehicles.
B. Network-oriented metrics
• Node degree. The number of vehicles within the trans-mission range of a node. Formally, the degree of ui attime t is defined as: Di(t) = ‖{uj | ∃eij(t)}‖.
• Effective Diameter. The minimum distance in which the90th percentile of all connected pairs of vehicles cancommunicate with each other. It is a smoothed form ofnetwork diameter which we use for our studies.
• Network Density. The ratio between the number of edgesin the G(t) and the maximum number of edges possiblefor G(t).
• Geographic Diameter. The length of the effective graphdiameter considering the real underlying geographictopology. It conveys the geographic span of the shortestpath between the most distant nodes in the graph and ismeasured in meters instead of hops.
• Network Connectivity [12]. The maximum fraction ofvehicles that are directly or indirectly connected in G(t).Formally, network connectivity is defined as: NC d
=max
i{ 1|V (t)|
∑j
A(ui, uj)}, where A(ui, uj) is a connec-
tivity indicator which takes the value of 1 if a path isavailable from vehicle ui to vehicle uj at time t, and 0otherwise.
C. Component-oriented metrics
• Number of Components. The number of co-existing,non-connected clusters of nodes at a given instant. Acluster is a sub-graph of the network such that there is apath between any pair of nodes. In addition we examinethe spatial distribution of components and their coverage(Km2) in terms of geography of the underlying urbanarea.
• Number of Communities. The number of existingcommunities at a given instant. A community is as adense sub-graph where the number of intra-communityedges is larger than the number of inter-communityedges. To identify communities, we transform G(t) todirected graph so as Din
i (t) = Douti (t) = Di(t), where
Dini (t), Dout
i (t) is the in-degree and out-degree of node iat time t. Formally, a sub-graph U(t) of a VANET graphG(t) at time t constitutes a community, if it satisfies:∑
i∈U (Dini (t))(U(t)) >
∑i∈U (D
outi (t))(U(t)) i.e., the
sum of all connections within the community U(t) islarger than the sum of all connection toward the rest ofgraph the G(t).
D. Centrality metrics
• Betweenness Centrality. The fraction of the shortestpaths between any pair of nodes that pass through a node.The betweenness centrality of a vehicle ui at time t is:
BCi(t) =∑
j 6=kspjk(ui,t)spjk(t)
, where spjk is the numberof shortest paths linking vertices j and k at time t andspjk(ui, t) is the number of shortest paths linking verticesj and k that pass through ui at time t. BC is a measure ofthe extent to which a vehicle has control over informationflowing between others.
IV. ANALYSIS TESTBED
We consider a corrected and enhanced version of the initialTAPAS-Cologne dataset [18], following the results of [19].The dataset covers approximately an area of 33×35Km with42148 intersections and 134645 roads. For the purpose of ourstudy, we focus on the morning traffic rush-period between6:00am and 8:00am, taking snapshots of the network every 1second. During this 7200 second time window, approximately75600 unique vehicles enter and travel within the aforemen-tioned area.
We assume the model of line-of-sight(LOS) and non-lineof sight (NLOS) wireless communication, wherein vehiclesestablish a wireless link if they are within 250 and 140 metersof each other, respectively. For more information on when twovehicles might have LOS or NLOS communication, the readeris referred to [12].
We provide the necessary input files (road map, routedefinitions, etc) obtained from [19] to the SUMO simulationframework and instruct it to run 10 times, each one with adifferent random seed generator. We allow a 1000 secondwarm-up period at the beginning before obtaining any mea-surements in order to achieve some level of stability in thenetwork. Consequently, we study snapshots of the VANETcommunication graph taken every 1 second. Overall, approxi-mately 436000 snapshots of the VANET communication graphwere recorded.
V. OBSERVATIONS
This section presents the findings of our study related tothe laws governing the dynamics of vehicular connectivityby considering the realistic testbed presented previously. Wenote that, although important, our work does not examinethe dynamics of the VANET communication graph under thepresence of medium access problems such as contention andinterference.
A. Link-level Analysis
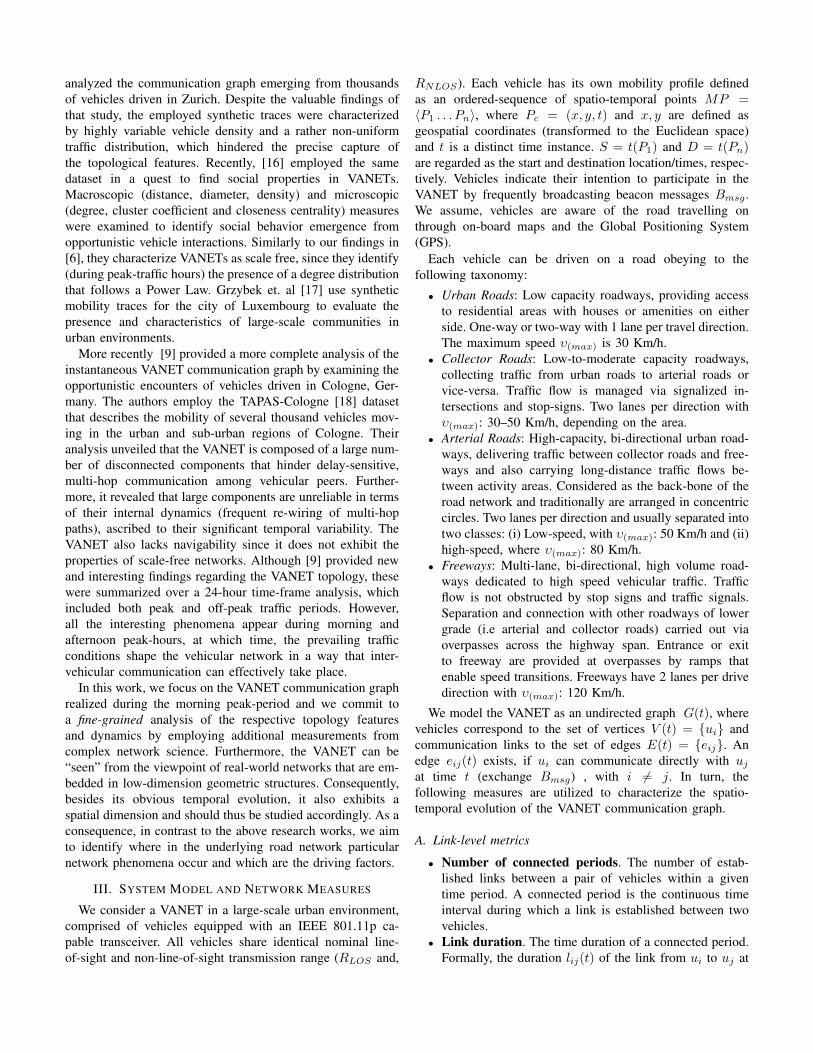
Our observations begin with the link-level analysis ofthe VANET communication graph, which contributes to aclose estimation of the network-link lifetime. The numberand duration of connected periods between two vehicles, aswell as the duration between successive connected periods isinfluenced by microscopic mobility characteristics as well asthe underlying road network. Table I presents an overviewof the link-level statistics of the IVC members in the city ofCologne.
Links are categorized by recording their respective start-endroad types. Links that start and finish in freeways or arterials,are tagged as outskirt links. Respectively, links that start and
Min Max Mean MedianConnected Periods 1 (1) 3 (8) 2.2 (6.4) 2 (6)Link Duration (sec.) 1 (1) 560 (224) 322.7 (47) 301 (42)Re-Healing Period (sec.) 1 (1) 980 (450) 121.16 (48) 117 (46)
TABLE I: Link statistics for vehicles in the city outskirts(freeways/arterials). In parenthesis for vehicles driven in the
inner city (urban/collector roads).
finish in urban or collector roads, are tagged as inner city links.Higher traffic densities result to smaller inter-vehicle distancesand thereby increase the time period in which two vehiclesare in range of each other. This allows established links tohave a longer duration and smaller number of connectingperiods. Increased durations are therefore encountered partic-ularly in arterial and freeways, where the characteristics ofthese roadways do not cause links to break often. We observethe number of connected periods for vehicles driven on urbanand collector roadways to be almost 3x as their outskirtcounterparts, however with smaller re-healing durations.
B. Network-level Analysis
We refer to the size of the VANET as the number of edgesthat are present in the communication graph at any given timeinstance. The VANET size is not sensitive to changes in thearrival and departure rates of vehicles. Specifically, althoughin several time instances we monitor an increase in the numberof departing vehicles can cause a decrease of the VANETsize, this effect is quickly mitigated by the set of vehiclesstill in the network, whom their collective mobility profile(MP ) can cause the sustainability of current links and eventhe establishment of new ones. Interestingly, the VANET core2
geography, is very well embedded (overlaps) to the underlyinggeography of the city center. Averaging across time, the coreincludes 18% of the total edges and 7% of the nodes availablein the network, respectively.
Initial insights on the global connectivity conditions thatprevail in the VANET, report that this is indeed a verysparse network. Even in the case of our study, where weconsider 100% V2V technology penetration ratio and highvehicle density (due to rush-period), the corresponding net-work density never exceeds 40%. Fig. 1(b) plots the globalnetwork connectivity for the 6200s we analyze. NC is upperbounded roughly at 35% of the total number of nodes thatcoexist in the area. In other words, even under optimal globalconnectivity settings, only 35% of all vehicles in the topologycan exchange information either using a direct or a multi-hopcommunication paradigm. The nature of NC provides a birds-eye view of the VANET capacity to facilitate direct or multi-path inter-connectivity for its member vehicles, in the presenceof various constrains induced by a large-scale urban environ-ment (morphology of road topology, inter-vehicle distances,mobility patterns etc). These findings serve as a precursor
2Core is defined as the largest biconnected component existing in thenetwork.
of the VANET fragmentation level and indicate the necessityof utilizing supporting mechanisms for city-wide, multi-hopand geocasting communication paradigms. For instance, theinstallation of fixed roadside infrastructure can improve linkstability and also serve as gateway to long range V2V in-formation exchange. In addition, caching solutions can be anoption given that the application requirements permit it.
Next, to comprehend how far in the topology data packetscan potentially travel, we examine the effective diameter ofthe network. Since a network hop in the VANET graph isdependant on the geographic distance between the two con-nected vehicles, inevitably the largest geodesic pertains alsoa geographic dimension. Fig 1 plots both diameter measures,network (c) and geographic (d), against time. Evidently, thenetwork diameter of the communication graph, as well as itsgeographic counterpart, exhibit significant variability in thearrow of time. Interestingly, we have identified several timeinstances where the diameter can oscillate in excess of 50hops (∼ 15Km) within just a few seconds, denoting a severeor complete rewiring in the structure of the largest shortestpath in the VANET.
Our spatial analysis has shown that in contrast to realworld temporal networks - where graph diameter is knownto be a function of network size [13] - the changes in theVANET diameter are attributed down to one microscopicvehicle feature, that of geographic position. Specifically, bystudying closely the MP of vehicles comprising the geodesic,we conclude that the observed fluctuations in both diame-ter measures are the effect of individual vehicles’ mobility.Several nodes unawarely function as bridges among weakly-connected components and even slightest changes in theirgeographic position is enough to fragment those componentsand trigger a strong “butterfly effect” over global networkconnectivity. It is important to note that this variability ofthe shortest path is not an isolated phenomenon, rather itcan be observed also in the top-5 shortest paths. Although,there seem to exist long paths that could potentially transferinformation among distant city parts, the emerging volatilityin their structure, can hinder even short-range multi-hop datadissemination.
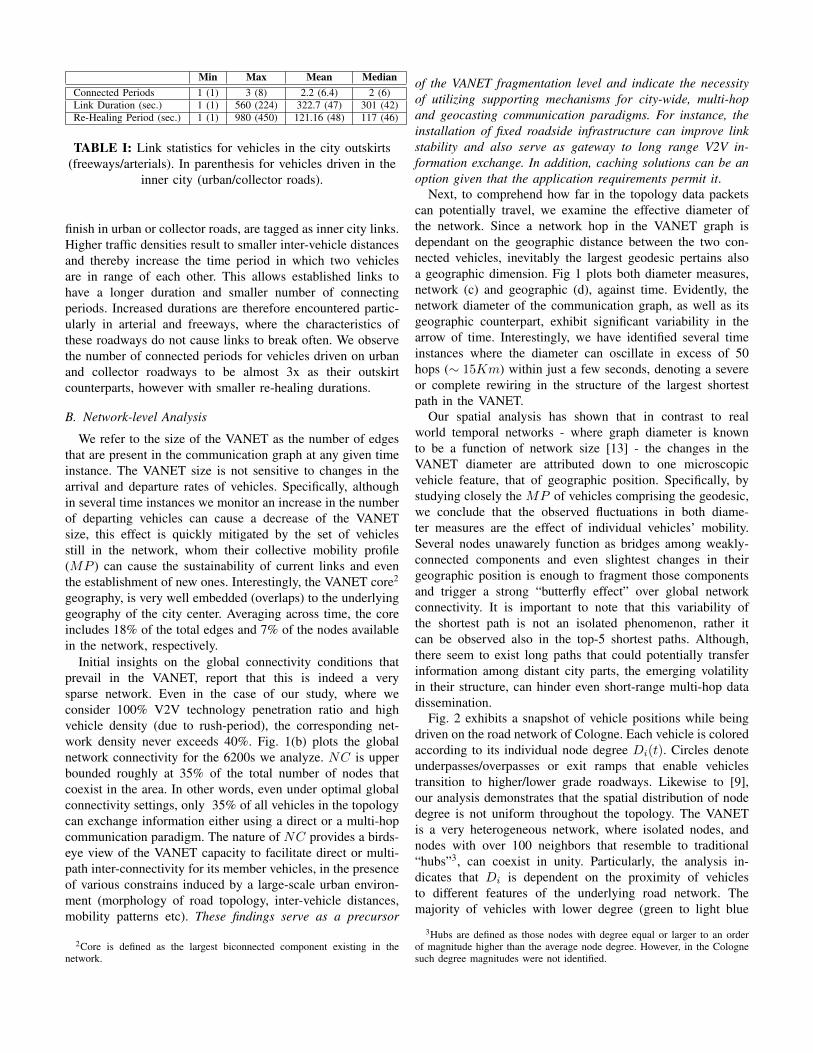
Fig. 2 exhibits a snapshot of vehicle positions while beingdriven on the road network of Cologne. Each vehicle is coloredaccording to its individual node degree Di(t). Circles denoteunderpasses/overpasses or exit ramps that enable vehiclestransition to higher/lower grade roadways. Likewise to [9],our analysis demonstrates that the spatial distribution of nodedegree is not uniform throughout the topology. The VANETis a very heterogeneous network, where isolated nodes, andnodes with over 100 neighbors that resemble to traditional“hubs”3, can coexist in unity. Particularly, the analysis in-dicates that Di is dependent on the proximity of vehiclesto different features of the underlying road network. Themajority of vehicles with lower degree (green to light blue
3Hubs are defined as those nodes with degree equal or larger to an orderof magnitude higher than the average node degree. However, in the Colognesuch degree magnitudes were not identified.
(a) (b) (c) (d)
Fig. 1: (a) VANET Size and Core, (b) Network Connectivity, (d) Effective Diameter. (d) Geographic Diameter - vs Time.(Best viewed in color)
color) are encountered on freeways and collector roads. Multi-lane, high capacity freeways, enable neighbouring vehicleswith the same direction and relative velocities to travel inplatoons for a prolonged period of time. This mobility patternfosters the establishment of a number of connections (onaverage between 13–17) among vehicles driving in the same oradjacent lanes towards the direction of travel, resulting to thedegree distribution visible in the outer parts of the city. Onthe other hand, the reduced 1-hop connectivity on collectorroads comes as a result of the low-to-moderate capacity ofthe roadway itself and also the presence of intersections andstop-signs which interrupt the continuous traffic flow.
Fig. 2: Spatial representation of vehicle location coloredaccording to node degree.
(Best viewed in color)
Nevertheless, the degree of vehicles travelling on highcapacity roadways is more stable over time, due to the fact thatsuch connections are long-lived; vehicles tend to use freewaysand arterial roads to cover large distances. An exception to theabove occurs whenever vehicles approach various overpassesor exit ramps. Such high density road features cause spikesin the temporal distribution of degree and in certain occasionssome vehicles are able to establish a short connection with upto 122 neighbors. The above pattern is recorded repeatedly toseveral such ramps, nearby which we also identify the presenceof vehicle communities with dense inter-connection amongtheir members. These geography bounded dense structuresallows them to act as “data-islands”, facilitating thus spatio-temporal information replication and maintenance during
(a) (b)
Fig. 3: (a) Number of Components, (b) ComponentGeographic Coverage Distribution.
(Best viewed in color)
broadcast of geographic hovering communications.Moving towards to the city center and particularly on urban
roads, the node degree tends to increase substantially (darkergreen - blue) primarily due to the increased traffic density andlower speed limits. These factors allow vehicles to connectwith an increased number of other vehicles being driven in thesame or opposite directions, or even on various intersectingroads. However, the dense road topology with rapid tran-sition in-between LOS/NLOS communication, makes theseconnections short-lived. Table II presents a summary of vehicledegree statistics for each of the road features. Statistics areaggregated for the whole 6200s of our analysis.
In contrast to [9], our work does not consider isolatedvehicles (i.e singletons) in component analysis, since commu-nication of a vehicle with itself is meaningless. As depicted byFig. 3(a), the network exhibits noteworthy fragmentation, since
no less than 480 components are present in the network at anygiven instance. The VANET consists of both small and largecomponents, with 40% of those being components establishedamong just two vehicles, while 90% of them are comprised by15 vehicles or less. By studying the CCDF of the componentsize distribution, and specifically its long tail, we identify thesimultaneous presence of certain large components that hostbetween 1000 and a giant component that surprisingly canfacilitate up to 2500 vehicles.
Overall, we observe 3 temporal phases in component pop-ulation evolution. The 1st phase (left green shaded area,Fig. 3(a)) exhibits a growth trend, wherein the arrival ofnew vehicles (∼ 7500 vehicles) in the topology sparks thecreation of additional small components. During this periodthe majority of components are comprised of 3–4 vehiclesonly and cover, on average, a geography of less than 15m2.
In the 2nd phase we observe a relative stability in populationgrowth, where newly arrived vehicles (∼ 7500−8500 vehicles)do not create additional components, but rather join existingones. As day progresses and existing components become evenlarger, they are fused with other smaller components in thevicinity, extending their corresponding coverage. Finally, ashift point in vehicle population (τ = 5800s) triggers the3rd and decaying phase in the number of components. Asthe rush-period moves towards the end, vehicle density is notsufficient to accommodate strong connectivity across existingcomponents, therefore further increasing fragmentation.
Nevertheless, these heterogeneous components scale differ-ently in terms of the geographic area they cover. Fig. 3(b)shows the CDF of the coverage region, calculated using theconvex hull of each component. 37% of the componentspresent in the VANET cover an almost negligible geographicarea less than 15m2. Approximately 70% of such small clus-ters are primarily encountered in urban roads near the outskirtsof the city, where the specifics of the road-network topologyencourage tight inter-vehicle distances. The remaining 30%of small clusters comprise vehicle platoons travelling on highspeed freeways, with inter-platoon distances larger than 250meters, which is the maximum transmission range in LOS.Consequently, vehicles travelling in such areas, should notexpect to establish and maintain communication sessions witha large number of other vehicles, either utilizing broadcast ormulti-hop communication paradigms.
Conversely, as the geographic coverage of componentsincreases, we observe a different spatial distribution acrossthe area of Cologne. While 90% of these larger componentscover an area less than 56000m2, now they are found withhigher probability on roads close to down-town. This tran-sition period is in line with the commute habits of peopleduring the morning rush hour, where the majority of vehiculartraffic traverses initially arterial and collector roads prior toexiting and spreading to urban roads so as to reach variousactivity areas (workplaces, stores, etc) within the city core.The increased vehicle density encountered in these moderate-to-high capacity road structures, in conjunction with minimaltravel flow interruptions, results to unhindered inter-vehicle
(a) (b)
Fig. 4: Temporal Evolution of Giant Component in terms of:(a) Geographic Area Coverage and (b) Coordinate Centroid.
(Best viewed in color)
communication that in turn facilitates the establishment oflarger moving components.
Focusing on giant component, we would like to know wheresuch structures can be found in the underlying topology andhow their location shifts with time. Having such knowledgeat hand is beneficial to communication protocols, mainly insituations where complete or partial VANET topology infor-mation is unavailable. Such details ultimately enable variousprotocols to approximate the geographic boundaries of thegiant component, by employing only historical traffic statistics.Since the giant component is strongly connected internally,these approximations allow protocols to decide whether ornot they are located within a region that favors multi-hopdata dissemination. Figure 4(b) provides a visualization of theunderlying road topology, overlayed by different points thatcorrespond to the geographic centroid of the giant component.Here, the centroid metric serves as an anchor point from whichthe giant component materializes. During the early morninghour, the giant component evolves adjacent to arterial andcollector roads that transfer commuters from the outer partsof the city and the suburbs towards the center.
In these early times, the giant component centroids arespatially dispersed, and circulate both the eastern and westernparts of the city where such road features are found. Thealterations between the different parts of the city, come asa result of the border effects in terms of component size,where at one particular instance a component at the easternpart of Cologne is larger by a small margin than anothercomponent at the western part, or vice-versa. When vehicledensity is increased and subsequently stabilized in the down-town area, the giant component centroids move in and remainconcentrated in the center of the road network.
Figure 4(a) illustrates the geographic area coverage of thegiant component across time. The coverage area is reportedin m2 and the y-axis is plotted in log-scale. Given thatthe whole road topology size is 33Km × 35Km, the giantcomponent can cover between 1% and 4% of the city ofCologne. The spatial coverage grows in the early phase ofthe morning rush-hour when vehicle density is increased. Asin the case of the component membership, after the mark of∼ 7500 vehicles (τ = 1900s) in the network is achieved,
the geographic area coverage starts to stabilize with very finevariations. In contrast to smaller components in its vicinity thatcontinue after this instance to change both size and coverage,the giant component remains relatively constant and alwaysencapsulates instances of the four road features.
D. Centrality Analysis
Considering the prominent presence and geographic cover-age of this giant component, we then examine the centralityof its member vehicles in the communication graph. Figure 5depicts (y-axis in log-scale) the centralization of the giantcomponent in terms of the betweenness BCi(t) index of itsmembers.
Fig. 5: Betweeness Centrality correlation with vehicledistance from city center.
Giant component members, are heterogeneous in terms oftheir BCi. During this early phase of the morning rush hour,we identify a number of vehicles who control up to 52% of thegeodesics present in the giant component. As it can be seenfrom the above plot, interestingly all of these high centralityvehicles are located on urban and collector roads in a distanceof ≤ 6Km from the city center. Nevertheless, even duringthis period, mobility dynamics cause the giant componentto alternate between states of centrality homogeneity andheterogeneity in a few seconds. As a result, vehicles that werepreviously identified as “central” to information communica-tion can often get demoted to ordinary nodes within 10-20seconds, or vice-versa.
VI. CONCLUSIONS
We perform an extensive analysis of the spatio-temporalcharacteristics of the VSN communication graph using Com-plex Network measures. We explore the dynamics of VSNin urban environments and investigate their impact in theuse of dedicated communication paradigms. Specifically, thefree flow nature of freeways, causes vehicles tend to formlong-lived links with more neighbors in city-outskirts, withfewer disconnections. On the contrary, the inner-city roadtopology induces highly intermittent links among fewer ve-hicles. City-wide, multi-hop communication is hindered bythe high variability of geodesics and network fragmentation,which in turn make the use of caching mechanisms and road-side infrastructure indispensable. We identify key road features(overpasses and exit ramps) in particular locations that induce
high and dense IVC in their vicinity and can thus serveas data-islands in information hovering. A giant component,covering a large geography, is present most of the time, and itsspatial evolution follows the commute habits of people duringthe morning rush hour. Central nodes exist within the giantcomponent, however they are confined within an distance fromthe city-center.
REFERENCES[1] “Car-2-Car Communication Consortium,” http://www.car-to-car.org/.[2] “Cooperative Vehicle-Infrastructure Systems,”
http://www.cvisproject.org/.[3] “U.S. Department of Transport (DoT) - Connected Vehicle Safety Pilot
Program, Ann Arbor, Michigan,” http://www.its.dot.gov/safety pilot/.[4] M. Faloutsos, P. Faloutsos, and C. Faloutsos, “On power-law rela-
tionships of the Internet topology,” in SIGCOMM ’99. Cambridge,Massachusetts, United States: ACM, 1999, pp. 251–262.
[5] “Virtual Traffic Lights (VTL),” http://www.virtualtrafficlights.com/.[6] G. Pallis, D. Katsaros, M. Dikaiakos, N. Loulloudes, and L. Tassiulas,
“On the Structure and Evolution of Vehicular Networks,” in Modeling,Analysis Simulation of Computer and Telecommunication Systems, 2009.MASCOTS ’09. IEEE International Symposium on, Sept. 2009, pp. 1–10.
[7] N. Loulloudes, G. Pallis, and M. Dikaiakos, “The Dynamics of VehicularNetworks in Urban Environments,” CoRR, vol. abs/1007.4106, 2010.
[8] N. Loulloudes, G. Pallis and M. Dikaiakos, “Understanding V2X Com-munication Dynamics Through Complex Network Science,” ERCIMNews, vol. 2013, no. 94, 2013.
[9] D. Naboulsi and M. Fiore, “On the Instantaneous Topology of a Large-scale Urban Vehicular Network: the Cologne Case,” in The 14th ACMInternational Symposium on Mobile Ad Hoc Networking and Computing,MobiHoc ’13, Bangalore, India. New York, NY, USA: ACM, July 2013,pp. 167–176.
[10] M. Fiore and J. Harri, “The Networking Shape of Vehicular Mobility,”in Proceedings of the 9th ACM International Symposium on Mobile AdHoc Networking and Computing. New York, NY, USA: ACM, 2008,pp. 261–272.
[11] V. Srivastava, A. B. Hilal, M. S. Thompson, J. N. Chattha, A. B.MacKenzie, and L. A. DaSilva, “Characterizing mobile ad hoc networks:The MANIAC challenge experiment,” in Proceedings ACM WiNTECH,2008, pp. 65–72.
[12] W. Viriyasitavat, F. Bai, and O. Tonguz, “Dynamics of Network Connec-tivity in Urban Vehicular Networks,” Selected Areas in Communications,IEEE Journal on, vol. 29, no. 3, pp. 515 –533, March 2011.
[13] J. Leskovec, J. Kleinberg, and C. Faloutsos, “Graph Evolution: Densi-fication and Shrinking Diameters,” ACM Trans. Knowl. Discov. Data,vol. 1, no. 1, Mar. 2007.
[14] R. Monteiro, S. Sargento, W. Viriyasitavat, and O. K. Tonguz, “Improv-ing VANET Protocols via Network Science,” in 2012 IEEE VehicularNetworking Conference, VNC 2012, Seoul, Korea (South), November14-16, 2012. IEEE, 2012, pp. 17–24.
[15] N. Loulloudes, G. Pallis, and M. D. Dikaiakos, “On the PerformanceEvaluation of VANET Routing Protocols in Large-Scale Urban Envi-ronments (Poster),” in Proceedings of the IEEE Vehicular NetworkingConference, VNC 2012. IEEE Computer Society, November 2012, pp.129–136.
[16] F. Domingos Da Cunha, A. Carneiro Viana, R. A. F. Mini, andA. A. F. Loureiro, “Is it Possible to Find Social Properties in VehicularNetworks?” in The 9th IEEE Symposium on Computers and Communi-cations (ISCC), Ilha Madeira, Portugal, June 2014.
[17] A. Grzybek, G. Danoy, M. Seredynski, and P. Bouvry, “Evaluation ofDynamic Communities in Large-scale Vehicular Networks,” in Proceed-ings of the 3rd ACM International Symposium on Design and Analysisof Intelligent Vehicular Networks and Applications. New York, NY,USA: ACM, 2013, pp. 93–100.
[18] “The TAPAS-Cologne Project,” ”http://sumo.dlr.de/wiki/Data/Scenarios/TAPASCologne”.
[19] S. Uppoor and M. Fiore, “Large-Scale Urban Vehicular Mobility forNetworking Research,” in Vehicular Networking Conference (VNC),2011 IEEE, November 2011, p. 62.