viruses Article The E. coli Global Regulator DksA Reduces Transcription during T4 Infection Jennifer Patterson-West 1 , Tamara D. James 1,2 , Llorenç Fernández-Coll 2 , James R. Iben 3 , Kyung Moon 1 , Leslie Knipling 1 , Michael Cashel 2 and Deborah M. Hinton 1, * 1 Gene Expression and Regulation Section, Laboratory of Cell and Molecular Biology, National Institute of Diabetes and Digestive and Kidney Diseases, National Institutes of Health, Bethesda, MD 20814, USA; [email protected] (J.P.-W.); [email protected] (T.D.J.); [email protected] (K.M.); [email protected] (L.K.) 2 Section on Microbial Regulation, Eunice Kennedy Shriver National Institute of Child Health and Human Development, National Institutes of Health, Bethesda, MD 20814, USA; [email protected] (L.F.-C.); [email protected] (M.C.) 3 Molecular Genomics Core, Eunice Kennedy Shriver National Institute of Child Health and Human Development, National Institutes of Health, Bethesda, MD 20814, USA; [email protected]* Correspondence: [email protected]; Tel.: +1-301-496-9885 Received: 28 March 2018; Accepted: 24 May 2018; Published: 6 June 2018 Abstract: Bacteriophage T4 relies on host RNA polymerase to transcribe three promoter classes: early (Pe, requires no viral factors), middle (Pm, requires early proteins MotA and AsiA), and late (Pl, requires middle proteins gp55, gp33, and gp45). Using primer extension, RNA-seq, RT-qPCR, single bursts, and a semi-automated method to document plaque size, we investigated how deletion of DksA or ppGpp, two E. coli global transcription regulators, affects T4 infection. Both ppGpp 0 and ΔdksA increase T4 wild type (wt) plaque size. However, ppGpp 0 does not significantly alter burst size or latent period, and only modestly affects T4 transcript abundance, while ΔdksA increases burst size (2-fold) without affecting latent period and increases the levels of several Pe transcripts at 5 min post-infection. In a T4motA am infection, ΔdksA increases plaque size and shortens latent period, and the levels of specific middle RNAs increase due to more transcription from Pe’s that extend into these middle genes. We conclude that DksA lowers T4 early gene expression. Consequently, ΔdksA results in a more productive wt infection and ameliorates the poor expression of middle genes in a T4motA am infection. As DksA does not inhibit Pe transcription in vitro, regulation may be indirect or perhaps requires additional factors. Keywords: bacteriophage T4; DksA; MotA; RNA-seq; transcriptome analysis 1. Introduction The integrity and regulation of gene expression is essential for proper cellular function and adaptation. Bacteria have evolved myriad mechanisms to tightly regulate gene expression to ensure that genes are expressed under the correct environmental conditions [1]. Bacteriophages have simultaneously evolved mechanisms for altering gene expression in their host to optimize the expression of genes required for viral proliferation [2–4]. Bacterial transcription is performed by an RNA polymerase (RNAP), which consists of five core factors (αI, αII, β, β 0 , and ω), along with a σ subunit that specifies the transcription start site (reviewed in [5,6]). In Escherichia coli (E. coli), the primary σ factor, σ 70 , recognizes specific -10 and -35 elements within the promoter sequence and is essential for the transcription of genes needed for exponential growth under nutrient-rich conditions. Efficient transcription requires the interaction of RNAP with promoter DNA to create an “open complex” with a single-stranded region at the transcription start Viruses 2018, 10, 308; doi:10.3390/v10060308 www.mdpi.com/journal/viruses
Transcript
viruses
Article
The E. coli Global Regulator DksA ReducesTranscription during T4 Infection
Jennifer Patterson-West 1, Tamara D. James 1,2, Llorenç Fernández-Coll 2, James R. Iben 3,Kyung Moon 1, Leslie Knipling 1, Michael Cashel 2 and Deborah M. Hinton 1,*
1 Gene Expression and Regulation Section, Laboratory of Cell and Molecular Biology,National Institute of Diabetes and Digestive and Kidney Diseases, National Institutes of Health, Bethesda,MD 20814, USA; [email protected] (J.P.-W.); [email protected] (T.D.J.);[email protected] (K.M.); [email protected] (L.K.)
2 Section on Microbial Regulation, Eunice Kennedy Shriver National Institute of Child Health and HumanDevelopment, National Institutes of Health, Bethesda, MD 20814, USA;[email protected] (L.F.-C.); [email protected] (M.C.)
3 Molecular Genomics Core, Eunice Kennedy Shriver National Institute of Child Health and HumanDevelopment, National Institutes of Health, Bethesda, MD 20814, USA; [email protected]
Received: 28 March 2018; Accepted: 24 May 2018; Published: 6 June 2018�����������������
Abstract: Bacteriophage T4 relies on host RNA polymerase to transcribe three promoter classes:early (Pe, requires no viral factors), middle (Pm, requires early proteins MotA and AsiA), and late(Pl, requires middle proteins gp55, gp33, and gp45). Using primer extension, RNA-seq, RT-qPCR,single bursts, and a semi-automated method to document plaque size, we investigated how deletionof DksA or ppGpp, two E. coli global transcription regulators, affects T4 infection. Both ppGpp0
and ∆dksA increase T4 wild type (wt) plaque size. However, ppGpp0 does not significantly alterburst size or latent period, and only modestly affects T4 transcript abundance, while ∆dksA increasesburst size (2-fold) without affecting latent period and increases the levels of several Pe transcripts at5 min post-infection. In a T4motAam infection, ∆dksA increases plaque size and shortens latent period,and the levels of specific middle RNAs increase due to more transcription from Pe’s that extend intothese middle genes. We conclude that DksA lowers T4 early gene expression. Consequently, ∆dksAresults in a more productive wt infection and ameliorates the poor expression of middle genes in aT4motAam infection. As DksA does not inhibit Pe transcription in vitro, regulation may be indirect orperhaps requires additional factors.
The integrity and regulation of gene expression is essential for proper cellular function andadaptation. Bacteria have evolved myriad mechanisms to tightly regulate gene expression toensure that genes are expressed under the correct environmental conditions [1]. Bacteriophageshave simultaneously evolved mechanisms for altering gene expression in their host to optimize theexpression of genes required for viral proliferation [2–4].
Bacterial transcription is performed by an RNA polymerase (RNAP), which consists of five corefactors (αI, αII, β, β′, andω), along with a σ subunit that specifies the transcription start site (reviewedin [5,6]). In Escherichia coli (E. coli), the primary σ factor, σ70, recognizes specific −10 and −35 elementswithin the promoter sequence and is essential for the transcription of genes needed for exponentialgrowth under nutrient-rich conditions. Efficient transcription requires the interaction of RNAP withpromoter DNA to create an “open complex” with a single-stranded region at the transcription start
site, initiation of RNA synthesis, promoter clearance, processive transcription elongation, and accuratetermination (reviewed in [7]).
E. coli promoters use specific activators, repressors, and/or other transcriptional regulators tocontrol initiation, elongation, and termination. While activators and repressors typically interactwith specific DNA sequence motifs, DksA is a member of a growing class of global transcriptionregulators, called secondary (2◦) channel proteins, that interact with just RNAP. These proteins,which also include GreA and GreB, all share two superimposable structural domains: a coiled-coildomain that penetrates the 2◦ channel of RNAP and a globular domain that binds the rim helices ofRNAP atop the 2◦ channel [8]. The acidic residues at the tip of the coiled-coil have protein-specified,DNA context-determined effects on catalysis during transcription initiation as well as elongation andfidelity [9]. These features culminate in activation/inhibition of RNA synthesis (diester formation) aswell as diesterase cleavage of backtracked mRNA to rescue transcription arrest [10].
The interaction of DksA with RNAP generates one of two binding sites for the small moleculeppGpp on polymerase [11,12], and in most cases, DksA activity is dependent on ppGpp. While the levelof DksA is relatively constant in exponentially growing cells, the concentration of ppGpp increasesdramatically under nutrient-poor conditions or other stresses [13,14]. The physiological roles of DksAand ppGpp in E. coli gene expression are complicated. DksA/ppGpp inhibition of RNAP initiationfrom the ribosomal promoter PrrnB1 is the most widely studied example, where DksA and ppGppact synergistically to further destabilize already unstable open complexes [12,14–16]. In contrast,ppGpp without the help of DksA can inhibit the strong phage lambda pR promoter that forms stableopen complexes, not by destabilizing the open complex but rather by inhibiting promoter escape [17].In other instances, identical, independent, or even opposing regulatory roles have been reported forthe two regulators in E. coli cells [18]. In addition, ppGpp can bind a variety of proteins with regulatoryeffects independent of transcription [19]. Furthermore, DksA has a cysteine zinc-finger motif thatacts independently of ppGpp to sense oxidative stress [20]. It is noteworthy that GreA and GreB arecompetitive with DksA in binding to RNAP in order to rescue backtracked, arrested, or paused RNAP,primarily during transcription elongation [21,22].
In a bacteriophage T4 infection, there are three types of T4 promoters (early (Pe), middle (Pm),and late (Pl)) based on the stage of development in which they are active (reviewed in [23]). Pe’s, whichcontain a strong match for the σ70-dependent consensus −10 and −35 elements, do not require anyviral factors for activity and are active immediately after infection. Thus, Pe’s successfully competewith host DNA for the same pool of RNAP. Pm’s, which become active ~1 min after infection at 37 ◦C,require two T4-encoded proteins, MotA and AsiA, to direct RNAP to recognize a specific element,a MotA Box, centered at −30. Importantly, middle genes are also expressed through the extension ofearly transcription from Pe’s into downstream middle genes. Finally, Pl’s become active ~5–7 min afterinfection at 37 ◦C. Pl’s harbor a novel −10 sequence known as the late TATA box and require the T4proteins gp55 (late sigma factor) and gp33 (co-activator) for activity. In addition, late transcriptionrequires active T4 DNA replication through T4 protein gp45, which is the replication sliding clampthat also serves as an enhancer for Pl’s [24]. As a further complication, phage T4 DNA is modifiedby glucosylated, hydroxymethyl 5-cytosine, a moiety that can alter RNAP activity as well as theinteractions of factors that normally function with unmodified DNA templates.
In this study, we report the first global transcriptome analyses of T4 wild type (wt) and a T4motA knockdown (T4motAam) infections of a wild-type laboratory strain and a dksA mutant hoststrain, and we investigate the effects of a DksA or ppGpp deletion on T4 growth and transcription.We demonstrate that a deletion of either DksA or ppGpp results in significantly larger plaques foreither T4 wt or T4motAam. Infections in a ppGpp0 host have a marginal effect on burst size, latentperiod, or phage transcript abundance. However, a deletion of DksA results in a 2-fold increase in T4wt burst size and increased levels of several Pe RNAs. As the T4 activator MotA is required for Pmactivation, a T4 motA knockdown results in poor phage growth. Our transcriptome analyses revealthat middle genes are affected differentially, ranging from slight to severe inhibition of gene expression.
Viruses 2018, 10, 308 3 of 22
We show that the absence of DksA in the T4 motA knockdown background also increases transcriptionfrom specific Pe’s. This increase ameliorates the poor growth of T4motAam by increasing expression ofdownstream middle genes needed for replication, recombination, and late transcription. As we do notobserve an effect of DksA on Pe transcription in a purified in vitro transcription system, we speculatethat DksA decreases T4 early transcription through other changes present in the infected ∆dksA hostor by using additional host/phage factors.
2. Materials and Methods
2.1. Phage and Strains
T4D+ wt and T4amG1 (T4motAam) [25] were used for infections. BL21(DE3) (F– ompT gal dcmlon hsdSB(rB
REL606), an ancestral B strain of R. Lenski (strr, r–m−, T6r, ara–) [27] were the parental strains usedin this study. Here, strains that bear the functional alleles at the dksA, relA, and spoT loci are referredto as wild type. B606 ∆dksA::kan (B606 ∆dksA) was constructed by P1 transduction using a K-12lysate containing the ∆dksA::kan insertion [28]. B606 ppGpp0, an isogenic mutant strain that is unableto generate ppGpp, was constructed by introducing a ∆relA::kan insertion followed by a ∆spoT::catinsertion as previously described [29]. Briefly, the dksA, relA and spoT mutants were constructed by P1transduction with E. coli K-12 donor strains and the recipient B606 strain. The ∆dksA::kan insertionrecombinant in B606 grows on LB but not on M9 glucose minimal, like the MG1655 K-12 sister strain.Transduction of the ∆relA::kan recombinant allele into B606 was phenotypically verified by loss ofresistance to 3-aminotriazole as well as the absence of ppGpp accumulation after adding 1 mg/mLserine hydroxamate. The B606 ∆relA::kan ∆spoT::cat double deletion construct was made by introducingthe ∆relA mutant first, then transduction of the ∆spoT mutant since the ∆spoT relA+ combination is notviable owing to excessive ppGpp levels. Features of the double mutant again mimic those of the K-12sister strain and are unable to grow on minimal medium without amino acid supplementation.
2.2. Quantification of Plaque Size
BL21(DE3), B606, B606 ∆dksA, and B606 ppGpp0 were freshly streaked out on Lennox L Broth(LB; Quality Biological (Gaithersburg, MD, USA): 5 g/L sodium chloride, 10 g/L tryptone, and 5 g/Lyeast extract) plates and grown at 37 ◦C overnight. For B606 ∆dksA, a final concentration of 3 µg/mLadenine was added to plates to improve growth for single colony selection. From a single colony,cultures were grown overnight in LB at 32 ◦C. For plating, cultures were diluted in fresh LB to anOD600 ~0.1 and grown to early-log phase (OD600 ~0.3) at 32 ◦C. Cells were then transferred to ice untilready to titer. For each titer, ~50 to 100 phages in 200 µL LB were incubated with an equal volume ofculture for 5 min, followed by 3 mL of 0.65% (w/v) Drake Top agar at 48 ◦C [30], and then plated on1.5% (w/v) LB agar. Plates were incubated at 37 ◦C overnight.
Digital images of each plate were documented using a Protein Simple Molecular Imager Gel Doc(San Jose, CA, USA). TIFF image files were converted to JPEG files with 256 gray levels (0–255) and650 × 515 pixels resolution in ImageJ [31]. Plaque size was then measured by particle analysis in pixelssquared [32]. Individual plaque area measurements were uploaded into R studio [33] and density plotsfor each replicate were generated using ggplot2 [34]. Density plots provided a visual representation ofthe distribution of plaque area measurements for each sample.
2.3. Burst Size Analysis
Burst size experiments were performed as previously described [35] for single-step growthexperiments with the following modifications. B606, B606 ∆dksA, and B606 ppGpp0 were grownovernight at 32 ◦C from a single colony, diluted to an OD600 ~0.1 in LB, and then cultured to mid-logphase (OD600 ~0.5) at 37 ◦C. For all conditions, B606 wt was kept on ice and used as the plating strain.For each condition, 900 µL of culture was transferred to a 1.5 mL microcentrifuge tube (pre-warmed to
Viruses 2018, 10, 308 4 of 22
37 ◦C) containing either T4 wt or T4motAam at a multiplicity of infection (MOI) of <0.04. After 10 min,the phage infected sample was diluted 10,000-fold for T4 wt or 1000-fold for T4motAam. Dilutions weregently vortexed to mix and immediately returned to 37 ◦C. For pre-burst (≤30 min) and post-burst(35 to 80 min) time points, 100 µL or 10 µL of the diluted phage culture, respectively, was added to100 µL of B606 wt. This was immediately followed by the addition of 3 mL of 0.65% (w/v) Drake Topagar (at 50 ◦C) and plating on 1.5% (w/v) LB agar. Plates were incubated overnight at 37 ◦C. Burst sizewas calculated by dividing the average number of plaques for the post-burst time points (50 to 70 minfor T4 wt infection) by the average number of plaques for pre-burst time points (15 to 30 min for T4 wtinfections). The latent period is defined as the last time point post-infection for which the relative titerremains less than or equal to 2.
2.4. Purification of RNA
B606, B606 ∆dksA, and B606 ppGpp0 were grown at 37 ◦C to early/mid log phase (OD600 ~0.4),then infected at an MOI of 10 with either T4 wt or T4motAam. RNA was isolated at 1, 5, or 12 minpost-infection using method II [36]. Briefly, T4 infections were rapidly stopped by mixing sampleswith a frozen solution containing 100 µg/mL chloramphenicol, cells were lysed by treatment with hotphenol, nucleic acid was precipitated with ethanol, the isolated nucleic acid was treated with DNase,and RNA was isolated by phenol extraction followed by ethanol precipitation.
Total RNA used for RNA-seq was assessed on a Bioanalyzer using the Agilent RNA 6000 NanoKit (Santa Clara, CA, USA) to evaluate the quality of samples; all samples used for library preparationhad an RNA integrity number (RIN) of 9.3 or better [37]. The quality of total RNA used for real-timequantitative polymerase chain reaction (RT-qPCR) and primer extensions was evaluated using a 0.8%(w/v) agarose gel stained with ethidium bromide.
2.5. RNA-seq
Total RNA (2.5 µg) from each sample was treated with a Ribo-Zero rRNA Removal Kit(Gram-Negative Bacteria; Illumina, San Diego, CA, USA) to deplete ribosomal RNAs. A TruSeq StrandedmRNA Library Prep Kit (Illumina, San Diego, CA, USA) was then used for the cDNA library preparation,and the library was sequenced using Illumina MiSeq in order to obtain 100 bp paired end reads.
After trimming, FASTQ files were aligned to E. coli B str. DE3 (NC_012971.2) as a reference genomeusing STAR v2.5.2 retaining unmapped reads [38]. Unmapped reads, presumably stemming fromthe T4 phage genome, were then mapped to the T4 reference genome (NC_000866.4). In both cases,default alignment behavior was altered with the following arguments: --outFilterScoreMinOverLread 0--outFilterMatchNmin 30 --outFilterMatchNminOverLread 0 --clip3pAdapterSeq AGATCGGAAGAGCGTCGTGTA --alignIntronMax 1. RNA gene counts in both reference genomes were then quantifiedusing the same NCBI gene definitions utilized in mapping index construction using the subreadfeatureCounts v1.4.6-p3 package [39]. Differential expression between samples and control wasrepresented as a fold change, and genes with both a fold change≥2 and p value≤ 0.05 were consideredsignificant. RNA-seq data is available in the National Center for Biotechnology Information (NCBI)database (GEO number GSE111808) and in Table S1.
2.6. Primer Extension Analyses
Primer extension was performed using Avian Myeoloblastosis Virus (AMV) reverse transcriptase(Life Sciences, Inc., St. Petersburg, FL, USA) as previously described [40–42], using the RNA sample(2 µg for the 1 min time points, 4 µg for other time points) and 1 pmol of 5′-32P-labeled primer. Unlessotherwise indicated, oligonucleotides annealed ~100 nucleotides (nt) downstream of the predictedstart site of the promoter. Primer sequences are available upon request. Primer extension productswere separated on 5% (w/v) denaturing polyacrylamide (19:1, acrylamide:bis) gels and visualized byautoradiography. Product levels were quantified using a GS-800 calibrated densitometer (Bio-Rad,Inc., Hercules, CA, USA) and Quantity One Software (Bio-Rad, Inc.)
Viruses 2018, 10, 308 5 of 22
2.7. RT-qPCR
RT-qPCR was used to validate RNA-seq data. Briefly, RNA samples were collected underthe same conditions used for RNA-seq, and complementary DNA (cDNA) was generated usinga High Capacity cDNA Reverse Transcription Kit (Applied Biosystems, Foster City, CA, USA). Targetgenes were amplified with SYBR Green PCR Master Mix (Applied Biosystems) in a LightCycler 480instrument (Roche Molecular Diagnostics, Pleasanton, CA, USA). Relative levels of gene expressionwere determined with the comparative CT method, also known as 2-∆∆Ct [43]. Genes nrdA (B606∆dksA vs. B606 wt) and 61.4 (T4motAam vs. T4 wt) that appeared unaffected in the RNA-seq data wereused as internal controls. Primers used in this study were designed using Primer3web [44,45]; primersequences are available upon request.
2.8. Proteins
Core RNAP was purchased from New England Biolabs, and σ70 [46], MotA [47], and AsiA [48]were purified as previously described. DksA containing a C-terminal His6 tag was isolated andpurified from CF9413:MG1655 (λDE3)/pHM1501 [49] grown in 500 mL of LB (Quality Biological)containing 50 µg/mL carbenicillin at 37 ◦C with shaking until mid-log phase. At an OD600 of ~0.35,protein synthesis was induced by the addition of 0.2 mM IPTG (final concentration) for 2 h withshaking. Cells were harvested by centrifugation at 13,000× g for 10 min. The following procedureswere performed on ice or at 4 ◦C. Pellets were resuspended in 12 mL of lysis buffer (40 mM Tris-HCl(pH 8.0), 300 mM NaCl, 5 mM imidazole, 2 mM 2-mercaptoethanol, 0.1 mM benzamidine; 2–5 mL pergram wet weight) and lysed by sonication. Clarified supernatant was obtained by centrifugation at15,000× g for 30 min and added to 2 mL of a 50% slurry of equilibrated Ni-NTA agarose (QIAGEN,Hilden, Germany) in lysis buffer and rocked gently overnight. The lysate/Ni-NTA mixture was loadedonto a Bio-Rad 10 mL disposable column, washed twice with five bed volumes of wash buffer (40 mMTris-HCl (pH 8.0), 300 mM NaCl, 10 mM imidazole, 2 mM 2-mercaptoethanol), and then with 4 mLeach of wash buffer containing increasing imidazole concentrations: 60 mM, 150 mM, and 250 mM.Although all imidazole fractions contained DksA, the 250 mM fraction was highly purified (Figure S1).This fraction was pooled and dialyzed in DksA Storage Buffer (25 mM Tris-HCl (pH 8.0), 100 mMNaCl, 0.5 mM ethylenediaminetetraacetic acid (EDTA), 50% glycerol, 2 mM 2-mercaptoethanol) andstored at −20 ◦C.
2.9. In Vitro Transcription
In order to check the activity of purified DksA, in vitro transcription assays were performedusing a supercoiled template DNA that contains the ribosomal promoter, PrrnBP1 (rrnB sequence−180 to +109) [49] as a positive control or a DNA template, PS17 (gift of J. Nguyen) that contains aσ70-dependent promoter that is not affected by DksA as a negative control. Transcription reactions(10 µL) were assembled with 5 nM DNA, 30 nM RNAP (final concentration; sigma:core ratio of2.5:1) that had been reconstituted with or without 250 µM ppGpp (final concentration), the indicatedconcentration of DksA, and transcription buffer (50 mM Tris-acetate (pH 8.0), 10 mM magnesiumacetate, 10 mM 2-mercaptoethanol, 90 mM potassium glutamate, 10 µg/mL bovine serum albumin).Solutions were incubated at 37 ◦C for 10 min before single round transcription was initiated by theaddition of heparin (final concentration of 100 µg/mL) and ribonucleoside triphosphates (rNTPs;final concentration of 200 µM each ATP, GTP, CTP and 20 µM (α-32P) UTP at 1.7 × 10⁴ dpm/pmol).After incubation for 10 min at 37 ◦C, reactions were collected on dry ice. A solution (10 µL) containing10 mM EDTA (pH 7.0), 0.1% bromophenol blue, and 0.1% xylene cyanol in deionized formamide wasadded. Samples were then heated for 2 min at 95 ◦C and 10 µL aliquots were electrophoresed on 4%polyacrylamide, 7 M urea denaturing gels run in 1× TBE (Tris-borate-EDTA). Gels were imaged byautoradiography as described above.
Viruses 2018, 10, 308 6 of 22
For in vitro transcriptions with T4 DNA, T4 genomic DNA was purified from concentrated T4 wtby extraction with phenol, phenol:chloroform:isoamyl alcohol (25:25:1), and then chloroform:isoamylalcohol (24:1); each extraction step was repeated twice. The purified DNA was subsequently dialyzedagainst TE buffer, and then treated with T4 DNA ligase (New England Biolabs, Ipswich, MA, USA) inthe presence of ATP to seal any intramolecular nicks. Transcription reactions (100 µL) were assembledwith 0.06 pmol of T4 DNA, 7.5 pmol pre-reconstituted RNAP (sigma:core ratio of 2.5:1), transcriptionbuffer, and as indicated, 112.5 pmol AsiA, 1.88 pmol MotA and/or 60 pmol DksA. After incubation at37 ◦C for 10 min, a single round of transcription was initiated by adding heparin (final concentrationof 100 µg/mL) and rNTPs (final concentration of 200 µM each ATP, GTP, CTP, UTP). Samples wereincubated for 10 min at 37 ◦C before collection on dry ice. An independent in vitro transcriptionreaction was performed as described [40] using pGEX-5X-3 DNA (0.05 pmol, Pharmacia Biotech,Piscataway, NJ, USA), which contains the Ptac promoter. Before RNA isolation, a 10 µL aliquot ofthe Ptac reaction was added as an internal control into each sample, and then the RNA was extractedand purified by phenol extraction/ethanol precipitation as described above. 5′-ends of the RNA weredetected by primer extension analyses as described above.
3. Results
3.1. T4 Infections in the Absence of ppGpp or DksA Produce Larger Plaques
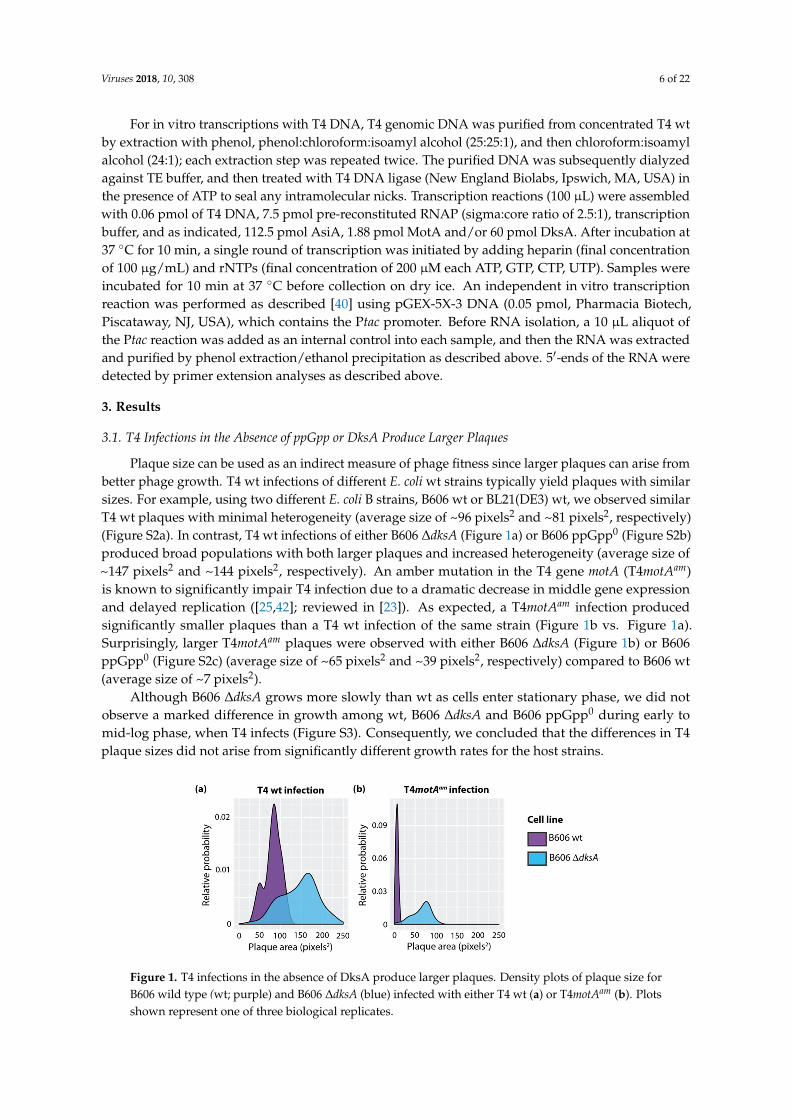
Plaque size can be used as an indirect measure of phage fitness since larger plaques can arise frombetter phage growth. T4 wt infections of different E. coli wt strains typically yield plaques with similarsizes. For example, using two different E. coli B strains, B606 wt or BL21(DE3) wt, we observed similarT4 wt plaques with minimal heterogeneity (average size of ~96 pixels2 and ~81 pixels2, respectively)(Figure S2a). In contrast, T4 wt infections of either B606 ∆dksA (Figure 1a) or B606 ppGpp0 (Figure S2b)produced broad populations with both larger plaques and increased heterogeneity (average size of~147 pixels2 and ~144 pixels2, respectively). An amber mutation in the T4 gene motA (T4motAam)is known to significantly impair T4 infection due to a dramatic decrease in middle gene expressionand delayed replication ([25,42]; reviewed in [23]). As expected, a T4motAam infection producedsignificantly smaller plaques than a T4 wt infection of the same strain (Figure 1b vs. Figure 1a).Surprisingly, larger T4motAam plaques were observed with either B606 ∆dksA (Figure 1b) or B606ppGpp0 (Figure S2c) (average size of ~65 pixels2 and ~39 pixels2, respectively) compared to B606 wt(average size of ~7 pixels2).
Although B606 ∆dksA grows more slowly than wt as cells enter stationary phase, we did notobserve a marked difference in growth among wt, B606 ∆dksA and B606 ppGpp0 during early tomid-log phase, when T4 infects (Figure S3). Consequently, we concluded that the differences in T4plaque sizes did not arise from significantly different growth rates for the host strains.
Viruses 2018, 10, x FOR PEER REVIEW 6 of 22
subsequently dialyzed against TE buffer, and then treated with T4 DNA ligase (New England Biolabs, Ipswich, MA, USA) in the presence of ATP to seal any intramolecular nicks. Transcription reactions (100 μL) were assembled with 0.06 pmol of T4 DNA, 7.5 pmol pre-reconstituted RNAP (sigma:core ratio of 2.5:1), transcription buffer, and as indicated, 112.5 pmol AsiA, 1.88 pmol MotA and/or 60 pmol DksA. After incubation at 37 °C for 10 min, a single round of transcription was initiated by adding heparin (final concentration of 100 μg/mL) and rNTPs (final concentration of 200 μM each ATP, GTP, CTP, UTP). Samples were incubated for 10 min at 37 °C before collection on dry ice. An independent in vitro transcription reaction was performed as described [40] using pGEX-5X-3 DNA (0.05 pmol, Pharmacia Biotech, Piscataway, NJ, USA), which contains the Ptac promoter. Before RNA isolation, a 10 μL aliquot of the Ptac reaction was added as an internal control into each sample, and then the RNA was extracted and purified by phenol extraction/ethanol precipitation as described above. 5′-ends of the RNA were detected by primer extension analyses as described above.
3. Results
3.1. T4 Infections in the Absence of ppGpp or DksA Produce Larger Plaques
Plaque size can be used as an indirect measure of phage fitness since larger plaques can arise from better phage growth. T4 wt infections of different E. coli wt strains typically yield plaques with similar sizes. For example, using two different E. coli B strains, B606 wt or BL21(DE3) wt, we observed similar T4 wt plaques with minimal heterogeneity (average size of ~96 pixels2 and ~81 pixels2, respectively) (Figure S2a). In contrast, T4 wt infections of either B606 ∆dksA (Figure 1a) or B606 ppGpp0 (Figure S2b) produced broad populations with both larger plaques and increased heterogeneity (average size of ~147 pixels2 and ~144 pixels2, respectively). An amber mutation in the T4 gene motA (T4motAam) is known to significantly impair T4 infection due to a dramatic decrease in middle gene expression and delayed replication ([25,42]; reviewed in [23]). As expected, a T4motAam infection produced significantly smaller plaques than a T4 wt infection of the same strain (Figure 1b vs. Figure 1a). Surprisingly, larger T4motAam plaques were observed with either B606 ∆dksA (Figure 1b) or B606 ppGpp0 (Figure S2c) (average size of ~65 pixels2 and ~39 pixels2, respectively) compared to B606 wt (average size of ~7 pixels2).
Although B606 ∆dksA grows more slowly than wt as cells enter stationary phase, we did not observe a marked difference in growth among wt, B606 ∆dksA and B606 ppGpp0 during early to mid-log phase, when T4 infects (Figure S3). Consequently, we concluded that the differences in T4 plaque sizes did not arise from significantly different growth rates for the host strains.
Figure 1. T4 infections in the absence of DksA produce larger plaques. Density plots of plaque size for B606 wild type (wt; purple) and B606 ∆dksA (blue) infected with either T4 wt (a) or T4motAam (b). Plots shown represent one of three biological replicates.
3.2. Deletion of dksA Results in an Increase in Phage Progeny per Infection
Plaque size is affected by several factors, including the number of phage progeny (i.e., burst size), diffusivity, absorption rate, and length of the latent period [50,51]. To assess whether the larger
Figure 1. T4 infections in the absence of DksA produce larger plaques. Density plots of plaque size forB606 wild type (wt; purple) and B606 ∆dksA (blue) infected with either T4 wt (a) or T4motAam (b). Plotsshown represent one of three biological replicates.
Viruses 2018, 10, 308 7 of 22
3.2. Deletion of dksA Results in an Increase in Phage Progeny per Infection
Plaque size is affected by several factors, including the number of phage progeny (i.e., burst size),diffusivity, absorption rate, and length of the latent period [50,51]. To assess whether the larger plaquesize observed in the absence of DksA or ppGpp arose from an increase in the number of phage progeny,we performed burst size experiments for T4 wt infections of B606 wt, B606 ∆dksA, and B606 ppGpp0.We found that the absence of DksA increased the burst size ~2-fold (Figure 2a,b), while the absence ofppGpp had no statistically significant effect (Figure S4). In addition, we observed no drastic change inlatent period for any of the infected strains (Figure 2a,c and Figure S4a). We conclude that the increasein plaque size for T4 wt in the absence of DksA can be attributed to an increase in phage progeny perinfection. Conversely, the increase in plaque size in the absence of ppGpp is not related to burst size orlatent period.
Viruses 2018, 10, x FOR PEER REVIEW 7 of 22
plaque size observed in the absence of DksA or ppGpp arose from an increase in the number of phage progeny, we performed burst size experiments for T4 wt infections of B606 wt, B606 ∆dksA, and B606 ppGpp0. We found that the absence of DksA increased the burst size ~2-fold (Figures 2a,b), while the absence of ppGpp had no statistically significant effect (Figure S4). In addition, we observed no drastic change in latent period for any of the infected strains (Figures 2a,c and S4a). We conclude that the increase in plaque size for T4 wt in the absence of DksA can be attributed to an increase in phage progeny per infection. Conversely, the increase in plaque size in the absence of ppGpp is not related to burst size or latent period.
Figure 2. Absence of DksA increases the burst size of a T4 wt infection and decreases the latent period of a T4motAam infection. (a) Representative graph of burst size vs. time after infection; (b) burst size, and (c) latent period for infections of T4 wt/B606 wt (purple), T4 wt/B606 ∆dksA (blue), T4motAam/B606 wt (orange), and T4motAam/B606 ∆dksA (red). Averages with indicated standard deviations were determined as described in Materials and Methods from three independent replicates. (The error bar on motAam/∆dksA is too small to be visible.) Asterisks (*) indicate significance as determined by an unpaired t test with a p value ≤ 0.05. The apparent 5 min difference in latent period of the wt/wt and wt/∆dksA infection shown in (a) is not statistically significant (see panel (c)).
3.3. Deletion of dksA Results in a Shorter Latent Period in a T4motAam Infection
Similar burst size experiments were also performed with T4motAam. In this case, we did not observe a significant difference in burst size for T4motAam in host wt vs. ∆dksA strain (Figure 2a,c). However, in the absence of DksA, there was a 10 min decrease in the latent period, indicating a significantly faster infection (Figure 2a,c).
3.4. Global Transcriptome of the T4motAam Infection Reveals that Pm’s are Differentially Affected
To investigate the effect of DksA on gene expression in a T4 wt or T4motAam infection, we first collected detailed information on gene expression alterations in a T4motAam infection of B606 wt. Although extensive work has established that motA is required for activation of T4 middle promoters, a global transcriptome analysis of the motA regulon has not been reported. It should be noted that while a motA deletion is lethal [52], the T4motAam mutation is not. Nevertheless, there is a dramatic inhibition of transcription from MotA-dependent promoters and a DNA delay phenotype [40,42,52].
We therefore carried out RNA-seq to define the MotA regulon by comparing gene expression in B606 wt cells infected for 5 min at 37 °C with either T4 wt or T4motAam. At the 5 min infection point, middle genes were highly expressed, early transcription was ending, and late gene expression had
Figure 2. Absence of DksA increases the burst size of a T4 wt infection and decreases the latent periodof a T4motAam infection. (a) Representative graph of burst size vs. time after infection; (b) burst size,and (c) latent period for infections of T4 wt/B606 wt (purple), T4 wt/B606 ∆dksA (blue), T4motAam/B606wt (orange), and T4motAam/B606 ∆dksA (red). Averages with indicated standard deviations weredetermined as described in Materials and Methods from three independent replicates. (The error baron motAam/∆dksA is too small to be visible.) Asterisks (*) indicate significance as determined by anunpaired t test with a p value ≤ 0.05. The apparent 5 min difference in latent period of the wt/wt andwt/∆dksA infection shown in (a) is not statistically significant (see panel (c)).
3.3. Deletion of dksA Results in a Shorter Latent Period in a T4motAam Infection
Similar burst size experiments were also performed with T4motAam. In this case, we did notobserve a significant difference in burst size for T4motAam in host wt vs. ∆dksA strain (Figure 2a,c).However, in the absence of DksA, there was a 10 min decrease in the latent period, indicating asignificantly faster infection (Figure 2a,c).
3.4. Global Transcriptome of the T4motAam Infection Reveals that Pm’s Are Differentially Affected
To investigate the effect of DksA on gene expression in a T4 wt or T4motAam infection, we firstcollected detailed information on gene expression alterations in a T4motAam infection of B606 wt.Although extensive work has established that motA is required for activation of T4 middle promoters,a global transcriptome analysis of the motA regulon has not been reported. It should be noted that
Viruses 2018, 10, 308 8 of 22
while a motA deletion is lethal [52], the T4motAam mutation is not. Nevertheless, there is a dramaticinhibition of transcription from MotA-dependent promoters and a DNA delay phenotype [40,42,52].
We therefore carried out RNA-seq to define the MotA regulon by comparing gene expressionin B606 wt cells infected for 5 min at 37 ◦C with either T4 wt or T4motAam. At the 5 min infectionpoint, middle genes were highly expressed, early transcription was ending, and late gene expressionhad initiated (reviewed in [53,54]). Genes, whose expression changed ≥2-fold with a p value ≤ 0.05,were considered significant.
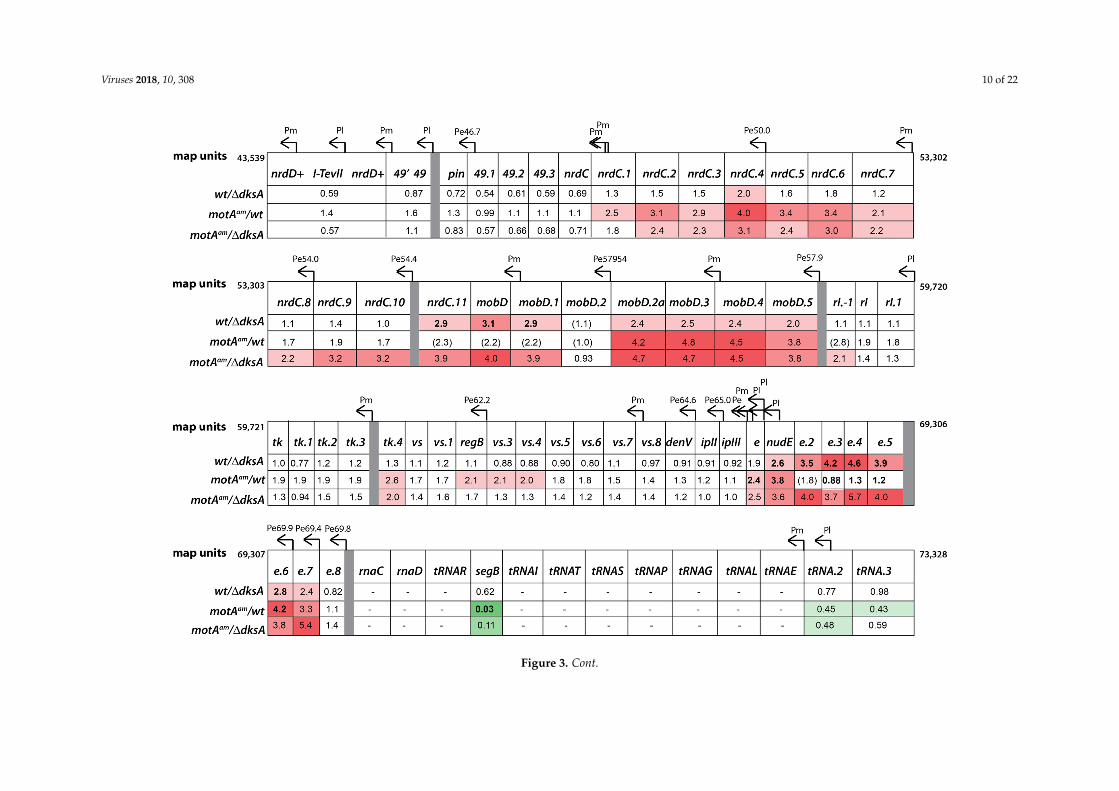
As shown schematically in Figure 3, the T4 genome is generally organized as regions ofpre-replicative genes (early and middle) that are transcribed right-to-left and interrupted by regions oflate genes that are transcribed left-to-right (reviewed in [53]). In general, early genes encode productsneeded for middle gene expression and to usurp host processes. However, the functions of many earlygenes are still unknown. Middle genes encode products needed for the crucial functions of replication,recombination, late gene transcription, and the continuation of host takeover. Late genes mainlyencode morphological proteins. Since the majority of the T4 Pe’s, Pm’s, and Pl’s have been identified(reviewed in [23,53]), we generated a detailed diagram of early, middle, and late transcription alongthe entire T4 genome (Figure 3). Convention within the field has provided designations for Pe’s basedon genomic coordinates (e.g., Pe15.0), whereas Pm’s and Pl’s are indicated by the first gene within theresulting transcript (e.g., PmdsbA and Pl15).
Previous global analyses of T4 gene expression using hybridization studies or levels of variousphage proteins during a T4motAam infection have indicated that when MotA-dependent promotersare not activated, expression of some early genes remains high, while late transcription, which isdependent on the middle products gp55, gp33, and gp45, is significantly diminished (reviewed in [54]).However, the expression of middle genes varies. This phenomenon arises in part because the effectof the motA knockdown on Pm activation is promoter specific [40,42,55]. In addition, most middlegenes are transcribed by both Pm’s and upstream Pe’s (Figure 3). Therefore, the effect of T4motAam ona particular middle gene also depends on how much transcription from a Pe extends into this gene.While the mechanism for this elongation has not been fully elucidated, it appears to be dependent onprocesses that stabilize RNA rather than by anti-termination [56,57]. Even though the 3′ ends of manyof these transcripts have been identified (indicated as grey bars in Figure 3), these ends are thought torepresent the ends of the stable RNA rather than transcription termination sites.
Differential expressions determined by RNA-seq analysis were compared to RT-qPCR assaysof 68 genes using RNA isolated 5 min after infection and by primer extension analyses using RNAisolated at 1 and 5 min after infection. One min after infection, early promoters are active, but middletranscription has just initiated [53,54]. A comprehensive summary of our RNA-seq and RT-qPCRanalyses is shown in Figure 3. Overall, we observed a strong correlation between the results of theRNA-seq and RT-qPCR analyses (Figure S5a).
Not surprisingly, our RNA-seq/RT-qPCR analyses were consistent with the results from previousstudies of T4motAam infections. Expression of 44% of early genes increased ≥2-fold, while expressionof 79% of late genes decreased ≥2-fold (Figure 3). (Genes are classified according to the expressionpatterns observed in a previous global microarray analysis of a T4 wt infection [58].) Expression ofmiddle genes was mixed, and middle genes that show significant MotA dependence varied in themagnitude of their dependence.
To confirm that changes in gene expression arose from defects in Pm transcription, primerextensions were performed for several middle genes (Figure S6a). As expected, this analysis confirmedprevious results indicating that the motAam mutation results in a significant decrease in Pm activation.In addition, we also observed lower transcription in the T4motAam infection that maps to one earlypromoter, Pe148.6 (Figure S6b). This result is surprising because the classification of this promoter asa Pe is confirmed by its activity 1 min after infection (Figure 4b, lanes 5–8) and because there is norecognizable Pm sequence at this site. However, reduced transcription from Pe148.6 has also beenobserved in a T4motAam infection of another cell line [40].
Viruses 2018, 10, 308 9 of 22Viruses 2018, 10, x FOR PEER REVIEW 9 of 22
Figure 3. Cont.
Viruses 2018, 10, 308 10 of 22Viruses 2018, 10, x FOR PEER REVIEW 10 of 22
Figure 3. Cont.
Viruses 2018, 10, 308 11 of 22Viruses 2018, 10, x FOR PEER REVIEW 11 of 22
Figure 3. Cont.
Viruses 2018, 10, 308 12 of 22Viruses 2018, 10, x FOR PEER REVIEW 12 of 22
Figure 3. Genomic map of bacteriophage T4 correlated with gene expression data from RNA-seq. Graphical representation of the T4 genome showing the location of annotated genes and promoters as given in [53]. The fold changes from the RNA-seq analyses determined for infections of T4 wt/B606 dksA (wt/dksA), T4motAam/B606 wt (motAam/wt), and T4motAam/B606 ∆dksA (motAam/dksA) compared to T4 wt/B606 wt are indicated. Gene expression changes are color coded as: increasing expression ≥2.0 with increasing red intensity; no significant change, white; decreasing expression ≤0.5 with increasing green intensity. Values of genes whose expression was checked by real-time quantitative polymerase chain reaction (RT-qPCR) are given in bold; any value that was tested in RT-qPCR analyses but was not consistent is given in parenthesis. Genes without an indicated value had less than 50 mapped reads in all the RNA-seq data samples. The genomic coordinates (map units) for each region are listed at the start and end of that row of genes.
Figure 3. Genomic map of bacteriophage T4 correlated with gene expression data from RNA-seq. Graphical representation of the T4 genome showing the location ofannotated genes and promoters as given in [53]. The fold changes from the RNA-seq analyses determined for infections of T4 wt/B606 dksA (wt/dksA), T4motAam/B606wt (motAam/wt), and T4motAam/B606 ∆dksA (motAam/dksA) compared to T4 wt/B606 wt are indicated. Gene expression changes are color coded as: increasingexpression ≥2.0 with increasing red intensity; no significant change, white; decreasing expression ≤0.5 with increasing green intensity. Values of genes whoseexpression was checked by real-time quantitative polymerase chain reaction (RT-qPCR) are given in bold; any value that was tested in RT-qPCR analyses but was notconsistent is given in parenthesis. Genes without an indicated value had less than 50 mapped reads in all the RNA-seq data samples. The genomic coordinates (mapunits) for each region are listed at the start and end of that row of genes.
Viruses 2018, 10, 308 13 of 22Viruses 2018, 10, x FOR PEER REVIEW 13 of 22
Figure 4. RNA from Pe148.6, which is significantly reduced in a T4motAam infection of B606 wt at 5 min post-infection, is rescued by a deletion of DksA. (a) Schematic showing T4 map units from 150,727 to 149,509 containing genes rnh and dsbA with the relative positions of the early promoter Pe148.6 and the middle promoter PmdsbA and the primers used for primer extension analyses. Sizes of the expected primer extension products are indicated in nts; (b) Representative gel showing the primer extension products from primers indicated in panel (a). RNA was isolated from T4 wt (+) or T4motAam (am) infections of strain B606 wt (+) or B606 ΔdksA (−) at 5 or 1 min post-infection.
Overall, these analyses provided a “proof of principle” that our RNA-seq analyses correctly reflected the state of T4 transcription 5 min post-infection. However, this study also significantly extended previous work because one can now investigate the effect of the motA knockdown on each gene throughout the T4 genome. Interestingly, our results indicate that there did not appear to be any general correlation between the function of a middle gene and its dependence on MotA. As seen in Figure 3, within regions that contain both Pe’s and Pm’s, we observed two sections of T4 genes that are crucial for replication and late transcription and are highly dependent on MotA: (1) the region downstream of Pe35.3 (map units 35,662 to 27,197) that includes gene 43 (DNA polymerase), gene 45 (DNA polymerase clamp and late transcription enhancer), and genes 44/62 (clamp loader) and (2) the region downstream of Pe148.6 (map units 150,727 to 146,948) that includes gene 33 (co-activator required for late transcription), rnh (RNase H), gene 59 (DNA helicase loader for replication), and gene 32 (single-stranded DNA binding protein). However, other sections with Pe’s and Pm’s, whose genes also encode important replication and late transcription factors, were not significantly MotA-
Figure 4. RNA from Pe148.6, which is significantly reduced in a T4motAam infection of B606 wt at 5 minpost-infection, is rescued by a deletion of DksA. (a) Schematic showing T4 map units from 150,727to 149,509 containing genes rnh and dsbA with the relative positions of the early promoter Pe148.6and the middle promoter PmdsbA and the primers used for primer extension analyses. Sizes of theexpected primer extension products are indicated in nts; (b) Representative gel showing the primerextension products from primers indicated in panel (a). RNA was isolated from T4 wt (+) or T4motAam
(am) infections of strain B606 wt (+) or B606 ∆dksA (−) at 5 or 1 min post-infection.
Overall, these analyses provided a “proof of principle” that our RNA-seq analyses correctlyreflected the state of T4 transcription 5 min post-infection. However, this study also significantlyextended previous work because one can now investigate the effect of the motA knockdown oneach gene throughout the T4 genome. Interestingly, our results indicate that there did not appearto be any general correlation between the function of a middle gene and its dependence on MotA.As seen in Figure 3, within regions that contain both Pe’s and Pm’s, we observed two sectionsof T4 genes that are crucial for replication and late transcription and are highly dependent onMotA: (1) the region downstream of Pe35.3 (map units 35,662 to 27,197) that includes gene 43 (DNApolymerase), gene 45 (DNA polymerase clamp and late transcription enhancer), and genes 44/62(clamp loader) and (2) the region downstream of Pe148.6 (map units 150,727 to 146,948) that includesgene 33 (co-activator required for late transcription), rnh (RNase H), gene 59 (DNA helicase loaderfor replication), and gene 32 (single-stranded DNA binding protein). However, other sections withPe’s and Pm’s, whose genes also encode important replication and late transcription factors, were notsignificantly MotA-dependent. These included: (1) the region downstream of Pe26.4, Pe20.3, and Pe19.8
Viruses 2018, 10, 308 14 of 22
(map units 27,044 to 17,935) containing genes 41/61 (DNA helicase/primase) and uvsX (recA analog),and (2) the region downstream of Pe40.4 (map units 41,225 to 39,600) containing gene 55 (sigmafactor for late transcription). Because the Pm’s for both these regions (Pm55 and PmuvsX) are highlydependent on MotA (Figure S6a), we conclude that it is the extension of Pe’s into these regions thatcompensates for the lack of MotA.
Thus, our analyses indicate that at 5 min post-infection in the motA knockdown, the expressionof only a subset of middle genes encoding replication/recombination proteins was near wt levels.These include the genes for helicase (gp41), the recombination protein UvsX, EndoVII (gp49) thatresolves recombination structures, nucleases gp46 and gp47, and DNA ligase (gp30). Such acombination of proteins suggests a minimal system for recombination in which nucleases 46/47might generate ssDNA substrates suitable for homologous recombination by UvsX/gp41. The nickedDNA would then be sealed by DNA ligase. However, whether such a system is used is not known.
Unexpectedly, RNA-seq indicated that the expression of two late genes, t (holin, map units 160,221to 160,877) and 38 (catalyzes assembly of distal tail fibers, map units 159,649 to 160,200), increased inthe T4motAam infection (Figure 3). We confirmed increased levels for both by RT-qPCR (Figure S5a).Given the significantly reduced levels of expression of T4 genes 45 and 33, whose products are requiredfor late transcription, this result suggests an unusual expression mechanism for these late genes.
3.5. Reduction of Early Promoter Activity during T4 wt Infection in the Presence of DksA
Having established that the RNA analyses of T4 wt vs. T4motAam infections yielded expectedresults, we investigated gene expression in T4 infections of B606 wt or B606 ∆dksA to ask whetherDksA reduction of T4 progeny is related to T4 gene expression.
In a T4 wt infection at 5 min, the absence of DksA resulted in a 2-fold or greater increase inexpression of genes downstream of several Pe’s: Pe11.5, Pe12.8, Pe15.0, Pe40.4, Pe57954, Pe57.9, Pe69.9,and Pe69.4 (Figure 3). Only a small subset of the genes in these regions have been functionallycharacterized. The genes that have been characterized to date have been implicated in host takeoverthrough modification of transcriptional machinery (modA, modB, srh, mrh) or degradation of hostnucleic acid (mobD, nudE) [53]. RNA-seq was performed for the 5 min samples and RT-qPCR was usedto independently assess the differential expression of 49 selected genes. The fold changes determinedby RT-qPCR demonstrated a strong correlation with those determined by RNA-seq, thus confirmingresults of the RNA-seq analysis (Figure S5b). In addition, primer extension analyses were performedfor RNA isolated at 1, 5, and 12 min post-infection. Primer extension analyses also revealed a significantincrease in transcription from Pe35.3, Pe40.4, and Pe41 (Figure S6b). In contrast, transcription from Pm’swas unaffected or only very modestly affected (Pm45, Pm45.2) by the absence of DksA (Figure S6a).The increase in Pe transcription was not general. For example, no significant increase was observed forPe148.6 (Figure S6b) and Pe144.6 (Figure S7), two Pe’s whose downstream gene expression levels alsodid not increase in the RNA-seq analysis (Figure 3).
Somewhat surprisingly, the expression level of several late genes (Figure 3) and the level oftranscription from the corresponding Pl’s (Figure S7a) was significantly less at 5 min post-infectionin the absence of DksA. Since this result is not compatible with an increase in burst size, we askedwhether this decrease in late transcription was reversed at 12 min post-infection, when the level of latetranscription in a wt infection is high. Primer extension analyses revealed that the level of RNA fromthese and other selected late promoters recovered well by this time point (Figure S7b).
Taken together, our results are consistent with a role of DksA in lowering the burst of T4 wtphage in a wt infection by decreasing the level of transcription from many Pe’s. As mentioned above,the function of many early genes remains unknown. However, these early genes are predicted to beinvolved in host takeover and transition to middle gene expression [53]. It is plausible that a fitnessgain early in infection will cascade to increased progeny production as the infection progresses.
Viruses 2018, 10, 308 15 of 22
3.6. Middle Gene Expression is Partially Restored in a T4motAam Infection of B606 ∆dksA
The absence of DksA alleviated the poor growth of T4motAam by significantly decreasing the latentperiod (Figure 2). To determine if DksA affects gene expression in the T4motAam infection, RNA-seq,RT-qPCR, and primer extension analyses were performed after isolating RNA from T4motAam infectionsin the presence (B606 wt) or absence (B606 ∆dksA) of DksA.
The overall result of these analyses is that the DksA deletion partially ameliorates the poorexpression of many T4 middle genes through the increase in transcription from certain Pe’s. This resultis most easily seen in Figure 3, in which expression levels of T4 genes are color coded to designatethe extent of increase (shades of red) or decrease (shades of green). For example, in regionswhose pre-replicative RNA levels were severely depressed in the T4motAam/wt infection (the regioncontaining genes 43, 44, 62, and 45 (map units 32,662 to 27,197) and the region containing genes 33,rnh, 59, and 32 (map units 150,727 to 146,948)), the level of RNA from the T4motAam infection in theabsence of DksA increases from 1.5 to 7-fold over that seen in the T4motAam infection in the presenceof DksA. These are the middle genes that are most severely affected by the motA knock-down.
Because the absence of DksA also increases the level of motA transcription in the motAam
background by ~2-fold (Figure 3) and the motAam mutation is leaky, some of this increase could arisefrom an increase in MotA protein, which could then lead to more Pm activation. However, it mightalso arise from the increase in transcription from Pe’s, which then extends into downstream middlegenes. To observe early and middle transcription separately, we used primer extension analyses.
We found that for the region containing map units 35,014 to 30,342 increased transcriptionfrom Pe35.3 in the absence of DksA was particularly helpful in counter-acting the effect of the motAknock-down since we observed no significant increase in middle transcription from Pm46 or Pm45(Figures S6 and S8). Likewise, in the rnh-32 region (map units 150,727 to 146,948), we observed thatthe overall increase in transcription resulted from a significant increase in transcription from Pe148.6rather than an increase in PmdsbA (Figure 4 and Figure S6b). In this case, a low level of Pe148.6 RNAwas observed in the T4motAam infection of B606 wt at 5 min (Figure 4). However, the level of Pe148.6RNA returned to that seen in the T4 wt/B606 wt infection when the motA knockdown was combinedwith the absence of DksA (Figure 4 and Figure S6b).
Unlike the middle genes detailed above, the transcript level of gene 55 (late sigma factor; mapunits 40,157 to 39,600) was not significantly reduced by the motA knockdown, yet gene 55 expressionincreased even more in a T4motAam infection in the absence of DksA (Figure 3). Primer extensionsindicate that increased transcription of 55 is coming from Pe40.4 rather than from Pm55 (Figures S6,S8c and S8d). In addition, primer extensions revealed that Pe40.4 RNA is processed at map unit 40,902.This position contains the consensus sequence recognized by RegB, a T4-encoded sequence-specificendonuclease that inactivates T4 early transcripts shortly after infection [59,60]. The transcript levelsnear (Figure S6b) and downstream (Figure S8d) from Pe40.4 were similar, indicative of regulation at ornear the promoter either directly or indirectly by DksA.
No novel primer extension products were observed in any of the tested regions in the absence ofDksA (Figure 4 and Figure S8), indicating that the deletion of DksA does not generate new transcriptionstarts. As genes in regions transcribed by Pe35.3 (map units 35,662 to 27,197), Pe40.4 (map units 41,225to 39,600), and Pe148.6 (map units 150,727 to 146,948) are required for replication and late transcription,it is not surprising that an increase in transcription from these promoters in the absence of DksA wouldimprove the growth of the T4motAam phage in B606 ∆dksA relative to B606 wt.
3.7. DksA Does Not Inhibit T4 Pe Transcription In Vitro
Our results suggested that host protein DksA might directly down-regulate the activity of T4 Pe’s.Although DksA regulated promoters often have AT- or GC-rich sequences within the −4 to −6 region(called the discriminator) that are needed for DksA action [61,62], a comparison of the sequences ofdown-regulated and unchanged Pe’s revealed no obvious sequence motif that typically correlates withDksA modulation of transcription (Patterson-West and Hinton. NIDDK, Bethesda, MD. Comparison of
Viruses 2018, 10, 308 16 of 22
promoter sequences, 2017.). To ask whether DksA inhibited Pe transcription directly, we first purifiedDksA and tested its previously characterized activity to inhibit the ribosomal promoter PrrnB1. As seenin Figure S9, addition of DksA specifically inhibited PrrnB1 but did not affect transcription from acontrol σ70-dependent promoter (PS17). As expected, the presence of ppGpp improved this inhibition.Next, we performed in vitro transcription reactions using T4 DNA under the same buffer conditions.We assayed for transcription from specific Pe’s using primer extension (Figure 5). DksA did not inhibittranscription from any of the tested Pe’s that we previously showed were affected by the presenceof DksA in vivo: Pe40.4 or Pe41 (Figure 5a), Pe35.3 (Figure 5b), or Pe148.6 (Figure 5c). The presenceof DksA also did not affect transcription from the middle promoters PmdsbA (Figure 5c) or Pm46(Figure 5b). It is important to note that the overall level of MotA/AsiA-activated transcription in thisin vitro system was low because of the use of buffer conditions suited for DksA. We speculate thatDksA reduction of specific Pe activity is either indirect or requires additional factors/conditions thatwere not present in our in vitro transcription system.
Viruses 2018, 10, x FOR PEER REVIEW 16 of 22
directly, we first purified DksA and tested its previously characterized activity to inhibit the ribosomal promoter PrrnB1. As seen in Figure S9, addition of DksA specifically inhibited PrrnB1 but did not affect transcription from a control σ70-dependent promoter (PS17). As expected, the presence of ppGpp improved this inhibition. Next, we performed in vitro transcription reactions using T4 DNA under the same buffer conditions. We assayed for transcription from specific Pe’s using primer extension (Figure 5). DksA did not inhibit transcription from any of the tested Pe’s that we previously showed were affected by the presence of DksA in vivo: Pe40.4 or Pe41 (Figure 5a), Pe35.3 (Figure 5b), or Pe148.6 (Figure 5c). The presence of DksA also did not affect transcription from the middle promoters PmdsbA (Figure 5c) or Pm46 (Figure 5b). It is important to note that the overall level of MotA/AsiA-activated transcription in this in vitro system was low because of the use of buffer conditions suited for DksA. We speculate that DksA reduction of specific Pe activity is either indirect or requires additional factors/conditions that were not present in our in vitro transcription system.
3.8. Deletion of ppGpp Has Only Modest Effects on T4 Transcription
Although the absence of either DksA or ppGpp results in larger T4 plaques (Figures 1a and S2b), the lack of DksA increases burst size by 2-fold (Figure 2b) while the absence of ppGpp has no significant effect on burst size or latent period (Figure S4). Our RNA-seq analyses of a T4 wt infection of a B606 ppGpp0 strain revealed only eight T4 genes whose expression changed significantly, while in the T4/∆dksA infection, the expression of >50 genes were altered (Tables S1 and S2).
Figure 5. Presence of DksA has no effect on transcription from various T4 Pe’s in vitro. Representative gels show primer extension products for Pe40.4 (a), Pm46 (b), and PmdsbA (b) arising from in vitro transcription of T4 wt DNA in the presence of DksA, MotA, and/or AsiA, as indicated. Each primer extension reaction also contained Ptac RNA and its primer as an internal control. In vivo RNA isolated from a T4 wt infection of B606 wt at 5 min post-infection was used as a positive control for each primer (labeled as lane C). The lengths of primer extension products are indicated in nt.
4. Discussion
DksA, a transcriptional regulator that modulates gene expression in E. coli at the levels of transcription initiation [63] and elongation [15,64], belongs to a family of proteins that can insert themselves into the 2° channel of RNAP, the channel from which rNTPs enter the active site. The best characterized system of DksA regulation is stress response: the repression of ribosomal promoters and the activation of promoters for amino acid biosynthesis genes during amino acid starvation [65]. Both inhibition and activation typically involve the small molecule ppGpp [21], whose level rises
Figure 5. Presence of DksA has no effect on transcription from various T4 Pe’s in vitro. Representativegels show primer extension products for Pe40.4 (a), Pm46 (b), and PmdsbA (c) arising from in vitrotranscription of T4 wt DNA in the presence of DksA, MotA, and/or AsiA, as indicated. Each primerextension reaction also contained Ptac RNA and its primer as an internal control. In vivo RNA isolatedfrom a T4 wt infection of B606 wt at 5 min post-infection was used as a positive control for each primer(labeled as lane C). The lengths of primer extension products are indicated in nt.
3.8. Deletion of ppGpp Has Only Modest Effects on T4 Transcription
Although the absence of either DksA or ppGpp results in larger T4 plaques (Figure 1a andFigure S2b), the lack of DksA increases burst size by 2-fold (Figure 2b) while the absence of ppGpphas no significant effect on burst size or latent period (Figure S4). Our RNA-seq analyses of a T4 wtinfection of a B606 ppGpp0 strain revealed only eight T4 genes whose expression changed significantly,while in the T4/∆dksA infection, the expression of >50 genes were altered (Tables S1 and S2).
4. Discussion
DksA, a transcriptional regulator that modulates gene expression in E. coli at the levels oftranscription initiation [63] and elongation [15,64], belongs to a family of proteins that can insertthemselves into the 2◦ channel of RNAP, the channel from which rNTPs enter the active site. The bestcharacterized system of DksA regulation is stress response: the repression of ribosomal promoters
Viruses 2018, 10, 308 17 of 22
and the activation of promoters for amino acid biosynthesis genes during amino acid starvation [65].Both inhibition and activation typically involve the small molecule ppGpp [21], whose level risesdramatically during stress response, even as the level of DksA remains relatively constant [13,14].For instance, the presence of ppGpp significantly improves the ability of DksA to inhibit initiationfrom ribosomal promoters [13].
DksA is a key player in bacterial survival under various environmental changes. For instance,∆dksA Salmonella enterica is hyper-susceptible to the bacteriostatic effects of nitric oxide free radicalsand is attenuated in macrophage and murine models of infection [66,67]; ∆dksA Shigella flexneri hasdecreased Hfq transcription, causing the loss of virulence [68]; and in E. coli, DksA has been shown tobe important for survival of dehydration [69]. More recently, various studies have shown that DksAprovokes global changes in transcriptional expression in host cells under various stresses, such asnitrosative, oxidative and nutrient stresses [70,71].
To our knowledge, no study has reported whether DksA contributes defense systems bymodulating gene expression of phages during infection. Bacteriophage T4 is a good model system forinvestigating this since it primarily regulates gene expression at the level of transcription. Temporalgene expression by T4 is controlled by the recognition of three distinct promoter architectures(early, middle, and late). Pe’s contain very strong σ70 consensus sequences (−10 and −35 elements)that are immediately recognized by the host transcriptional machinery [23,72]. Pm’s and Pl’s requireviral-encoded factors to modify the sequence specificity of host RNAP. Middle genes are expressedapproximately 1 to 2 min post-infection at 37 ◦C by the activation of Pm’s and/or extension oftranscripts from Pe’s (reviewed in [23]). Activation of Pm’s requires two T4 early proteins, MotA andAsiA, which together modify the specificity of host RNAP/σ70 holoenzyme, allowing it to recognize aspecific −30 sequence (the MotA box) rather than the host −35 element. Late transcription is initiatedapproximately 5–7 min after infection by the activation of Pl’s. These promoters do not contain eitherthe bacterial−35 element or the MotA box sequence, but instead contain a novel−10 sequence, knownas the late TATA box, that requires a new sigma factor encoded by T4 gene 55, as well as the activatorencoded by gene 33 [24]. In addition, late transcription requires active T4 DNA replication through theactivity of the T4 protein gp45, which is the replication sliding clamp that also serves as an enhancer oflate transcription [24].
The major finding of this study is that host protein DksA down-regulates the activity of Pe’s,thereby limiting the number of progeny produced during a single infection. Consequently, DksAserves to suppress T4 infection. Increased transcription from specific Pe’s in the ∆dksA strain alsoexplains the increased growth of T4motAam (Figure 1b). It has been well established that T4motAam
severely impairs phage infection by depressing middle transcription. We observe that the improvedfitness of T4motAam in the ∆dksA strain correlates with a greater abundance of middle RNA. However,this increase in middle transcripts does not arise from Pm’s, but rather from increased transcriptionfrom Pe’s upstream of middle genes required for replication, recombination, and late transcription(Figure 3). Thus, the increase in Pe transcription compensates for the lack of Pm activation.
Presently, it is unclear how DksA exerts an effect on specific Pe’s. The results of our in vitrotranscription analyses argue that this effect is probably indirect. A comparison of the discriminatorregion [61,62] of Pe’s whose transcripts were down-regulated vs. those whose transcripts wereunchanged does not reveal an obvious sequence motif that typically correlates with DksA reductionof promoter activity. We speculate global host changes that arise from deletion of DksA are likely tobe responsible for the enhancement of T4 Pe transcription. In fact, global changes in gene expressionduring exponential growth have been previously reported for ∆dksA [21]. It is important to note,however, that we do not observe a major growth defect in B606 ∆dksA during early-exponential phaseat the time of T4 infection. Instead the growth defect is seen during stationary phase (Figure S3). This islikely due to decreased rpoS expression in the ∆dksA mutant [73], which regulates expression of genesimportant for the transition into stationary phase.
Viruses 2018, 10, 308 18 of 22
Although the absence of either DksA or ppGpp results in larger T4 plaques (Figure 1a andFigure S2b), the lack of DksA increases burst size by 2-fold (Figure 2b) and has dramatic effects on T4gene expression, while ppGpp0 has no significant effect on burst size or latent period (Figure S4) andhas only modest effects on gene expression (Table S2). In the host, ppGpp functions predominately atthe level of transcription to adjust gene expression as necessary to overcome stress and to minimizeprocesses that have become superfluous by growth inhibition. Cells that are ppGpp deficient for lackof spoT and relA genes become vulnerable to a variety of physiological stress conditions. As a result,ppGpp0 cells devote all resources to a full complement of biosynthetic capacity including ribosomecontent regardless of nutritional adequacy [74]. Since T4 phage infection almost instantly piratescellular biosynthetic functions and components to devote them exclusively to phage production,perhaps it can be expected that phage development would improve in the absence of ppGpp. Deficiencyof ppGpp could alter plaque size without altering burst size, latent period, and/or transcription becauseplaque size is also governed by properties of inner membranes, peptidoglycan and outer membranes,and the activities of pinholins and spanin complexes (reviewed by [75]). In fact, there is evidence ofinvolvement of ppGpp in altered membranes and phospholipid synthesis that can result in membranefragility [76,77].
The enigmatic absence of regulatory effects associated with ppGpp might indicate the need fordifferent conditions to detect effects of ppGpp on T4 burst size and latent period. For example, slowgrowth in minimal medium with a poor carbon source, which elevates the level of ppGpp, might givedifferent results than a rich nutrient broth where the cellular ribosomal content is high and the ppGppconcentration is very low at the onset of infection. It also might be revealing to measure ppGpp levelsduring phage T4 lytic development to evaluate if ppGpp levels change. Alternatively, ppGpp levelscould be artificially elevated to high levels at the onset of T4 infection to ask if development is altered.
Host factors that regulate viral transcription during phage infections have been reported formultiple systems. In several cases, phage-encoded proteins that modulate the functions of thesebacterial regulators have also been observed. These include the E. coli transcription terminator Rhoand lambdoid phage antiterminators, N and Q (reviewed in [78]). In addition, bacterial histone-likeproteins, such as H-NS in E. coli, can repress viral transcription (reviewed in [79]). Interestingly, the T7protein gp5.5 [80], the T4 protein Arn [81], and the phage LUZ24 protein MvaT [82] have each beenshown to inhibit H-NS repression through distinct mechanisms. Future work investigating the effectsof bacterial transcriptional regulators will likely reveal additional host proteins that regulate viral geneexpression. Understanding the role of ppGpp, DksA, and other E. coli factors that regulate transcriptionand transcription/translation coupling, such as GreA and NusG, may reveal new mechanisms requiredfor host takeover and identify new functions of additional viral proteins.
Supplementary Materials: The following are available online at http://www.mdpi.com/1999-4915/10/6/308/s1,Figure S1: DksA-His6 is highly purified, Figure S2: T4 infections of B606 ppGpp0 produce larger plaques, Figure S3:Minor growth differences between wt and mutant strains during early exponential phase, Figure S4: Absenceof ppGpp does not affect burst size or latent period of a T4 wt infection, Figure S5: There is a strong correlationbetween the relative level of RNA determined by RNA-seq and RT-qPCR, Figure S6: The absence of DksAincreases the level of transcription from T4 Pe’s in a T4 wt and a T4motAam infection at 5 min post-infection,Figure S7: Transcription from late promoters is lower in the absence of DksA (∆dksA) compared to B606 wt at5 min post-infection but returns to values near B606 wt levels by 12 min post-infection, Figure S8: Increased levelsof middle genes 46 and 55 in T4motAam infections of cells lacking DksA (∆dksA) are due to increased levels oftranscripts from an upstream early promoter at 5 min post-infection, Figure S9: Purified DksA inhibits PrrnB1transcription in vitro, Table S1: Summary of all RNA-seq and RT-qPCR data, Table S2: Summary of genes that aredifferentially expressed in T4 wt infections of ∆dksA and ppGpp0 compared to wt E. coli.
Author Contributions: J.P.-W., T.D.J., L.F.-C., K.M., M.C., and D.M.H. conceived and designed the experiments;J.P.-W., T.D.J., J. R. I., L.F.-C., K.M., and L.K. performed the experiments; J.P.-W., T.D.J., L.F. -C., K.M., L.K., M.C.,and D.M.H. analyzed the data and wrote the paper.
Acknowledgments: We thank M. Hsieh, M. Arroyo-Mendoza, D. Lewis, and D.D. Kim for helpful discussion;D. Schneider for B606; D.D. Nogare for assistance and technical expertise for ImageJ workflow development;and the NICHD genomics core for library construction, sequencing, and bioinformatics analysis. We are gratefulto S. Morrical and S. Nelson for helpful discussions about T4 recombination. This Research was supported bythe Intramural Research Program of the NIH, National Institute of Diabetes and Digestive and Kidney Diseases(J.P.W., K.M., L.K., and D.M.H), by the NIH, Eunice Kennedy Shriver National Institute of Child Health andHuman Development (L.F.C., T.D.J., J.R.I. and M.C.), and by the National Institute of General Medical Sciences ofthe National Institutes of Health under award number R43GM113546 (T.D.J.).
Conflicts of Interest: The authors declare no conflict of interest.
References
1. Lopez-Maury, L.; Marguerat, S.; Bahler, J. Tuning gene expression to changing environments: From rapidresponses to evolutionary adaptation. Nat. Rev. Genet. 2009, 10, 68. [CrossRef]
2. Clokie, M.R.; Millard, A.D.; Letarov, A.V.; Heaphy, S. Phages in nature. Bacteriophage 2011, 1, 31–45. [CrossRef][PubMed]
3. Keen, E.C. A century of phage research: Bacteriophages and the shaping of modern biology. Bioessays 2015,37, 6–9. [CrossRef] [PubMed]
4. Brussow, H.; Canchaya, C.; Hardt, W.D. Phages and the evolution of bacterial pathogens: From genomicrearrangements to lysogenic conversion. Microbiol. Mol. Biol. Rev. 2004, 68, 560–602. [CrossRef] [PubMed]
5. Decker, K.B.; Hinton, D.M. Transcription regulation at the core: Similarities among bacterial, archaeal, andeukaryotic RNA polymerases. Annu. Rev. Microbiol. 2013, 67, 113–139. [CrossRef] [PubMed]
6. Murakami, K.S. X-ray crystal structure of Escherichia coli RNA polymerase sigma70 holoenzyme. J. Biol. Chem.2013, 288, 9126–9134. [CrossRef] [PubMed]
7. Saecker, R.M.; Record, M.T., Jr.; Dehaseth, P.L. Mechanism of bacterial transcription initiation: RNApolymerase—Promoter binding, isomerization to initiation-competent open complexes, and initiation ofRNA synthesis. J. Mol. Biol. 2011, 412, 754–771. [CrossRef] [PubMed]
8. Parshin, A.; Shiver, A.L.; Lee, J.; Ozerova, M.; Schneidman-Duhovny, D.; Gross, C.A.; Borukhov, S. DksAregulates RNA polymerase in Escherichia coli through a network of interactions in the secondary channel thatincludes Sequence Insertion 1. Proc. Natl. Acad. Sci. USA 2015, 112, E6862–E6871. [CrossRef] [PubMed]
9. Zenkin, N.; Yuzenkova, Y. New Insights into the Functions of Transcription Factors that Bind the RNAPolymerase Secondary Channel. Biomolecules 2015, 5, 1195–1209. [CrossRef] [PubMed]
10. Perederina, A.; Svetlov, V.; Vassylyeva, M.N.; Tahirov, T.H.; Yokoyama, S.; Artsimovitch, I.; Vassylyev, D.G.Regulation through the secondary channel—Structural framework for ppGpp-DksA synergism duringtranscription. Cell 2004, 118, 297–309. [CrossRef] [PubMed]
11. Mechold, U.; Potrykus, K.; Murphy, H.; Murakami, K.S.; Cashel, M. Differential regulation by ppGpp versuspppGpp in Escherichia coli. Nucleic Acids Res. 2013, 41, 6175–6189. [CrossRef] [PubMed]
12. Ross, W.; Sanchez-Vazquez, P.; Chen, A.Y.; Lee, J.H.; Burgos, H.L.; Gourse, R.L. ppGpp Binding to a Site atthe RNAP-DksA Interface Accounts for Its Dramatic Effects on Transcription Initiation during the StringentResponse. Mol. Cell 2016, 62, 811–823. [CrossRef] [PubMed]
13. Paul, B.J.; Barker, M.M.; Ross, W.; Schneider, D.A.; Webb, C.; Foster, J.W.; Gourse, R.L. DksA: A criticalcomponent of the transcription initiation machinery that potentiates the regulation of rRNA promoters byppGpp and the initiating NTP. Cell 2004, 118, 311–322. [CrossRef] [PubMed]
14. Rutherford, S.T.; Lemke, J.J.; Vrentas, C.E.; Gaal, T.; Ross, W.; Gourse, R.L. Effects of DksA, GreA, and GreBon transcription initiation: Insights into the mechanisms of factors that bind in the secondary channel ofRNA polymerase. J. Mol. Biol. 2007, 366, 1243–1257. [CrossRef] [PubMed]
15. Roghanian, M.; Zenkin, N.; Yuzenkova, Y. Bacterial global regulators DksA/ppGpp increase fidelity oftranscription. Nucleic Acids Res. 2015, 43, 1529–1536. [CrossRef] [PubMed]
16. Molodtsov, V.; Sineva, E.; Zhang, L.; Huang, X.; Cashel, M.; Ades, S.E.; Murakami, K. Allosteric effectorppGpp potentiates the inhibition of transcript initiation by DksA. Mol. Cell 2018, 69, 828–839.e5. [CrossRef][PubMed]
17. Potrykus, K.; Wegrzyn, G.; Hernandez, V.J. Multiple mechanisms of transcription inhibition by ppGpp at thelambdap(R) promoter. J. Biol. Chem. 2002, 277, 43785–43791. [CrossRef] [PubMed]
18. Magnusson, L.U.; Gummesson, B.; Joksimovic, P.; Farewell, A.; Nystrom, T. Identical, independent, andopposing roles of ppGpp and DksA in Escherichia coli. J. Bacteriol. 2007, 189, 5193–5202. [CrossRef] [PubMed]
19. Kanjee, U.; Ogata, K.; Houry, W.A. Direct binding targets of the stringent response alarmone (p)ppGpp.Mol. Microbiol. 2012, 85, 1029–1043. [CrossRef] [PubMed]
20. Henard, C.A.; Tapscott, T.; Crawford, M.A.; Husain, M.; Doulias, P.T.; Porwollik, S.; Liu, L.; McClelland, M.;Ischiropoulos, H.; Vazquez-Torres, A. The 4-cysteine zinc-finger motif of the RNA polymerase regulatorDksA serves as a thiol switch for sensing oxidative and nitrosative stress. Mol. Microbiol. 2014, 91, 790–804.[CrossRef] [PubMed]
21. Vinella, D.; Potrykus, K.; Murphy, H.; Cashel, M. Effects on Growth by Changes of the Balance between GreA,GreB, and DksA Suggest Mutual Competition and Functional Redundancy in Escherichia coli. J. Bacteriol.2012, 194, 261–273. [CrossRef] [PubMed]
22. Laptenko, O.; Lee, J.; Lomakin, I.; Borukhov, S. Transcript cleavage factors GreA and GreB act as transientcatalytic components of RNA polymerase. EMBO J. 2003, 22, 6322–6334. [CrossRef] [PubMed]
23. Hinton, D.M. Transcriptional control in the prereplicative phase of T4 development. Virol. J. 2010, 7, 289.[CrossRef] [PubMed]
24. Geiduschek, E.P.; Kassavetis, G.A. Transcription of the T4 late genes. Virol. J. 2010, 7, 288. [CrossRef] [PubMed]25. Mattson, T.; Vanhouwe, G.; Epstein, R.H. Isolation and Characterization of Conditional Lethal Mutations in
the Mot Gene of Bacteriophage-T4. J. Mol. Biol. 1978, 126, 551–570. [CrossRef]26. Studier, F.W.; Rosenberg, A.H.; Dunn, J.J.; Dubendorff, J.W. Use of T7 RNA polymerase to direct expression
Cattolico, L.; et al. Genome sequences of Escherichia coli B strains REL606 and BL21(DE3). J. Mol. Biol. 2009,394, 644–652. [CrossRef] [PubMed]
28. Kang, P.J.; Craig, E.A. Identification and characterization of a new Escherichia coli gene that is a dosage-dependent suppressor of a dnaK deletion mutation. J. Bacteriol. 1990, 172, 2055–2064. [CrossRef] [PubMed]
29. Xiao, H.; Kalman, M.; Ikehara, K.; Zemel, S.; Glaser, G.; Cashel, M. Residual guanosine 3′,5′-bispyrophosphatesynthetic activity of relA null mutants can be eliminated by spoT null mutations. J. Biol. Chem. 1991, 266, 5980–5990.[PubMed]
30. Dressman, H.K.; Drake, J.W. Lysis and lysis inhibition in bacteriophage T4: RV mutations reside in the holint gene. J. Bacteriol. 1999, 181, 4391–4396. [PubMed]
31. Schneider, C.A.; Rasband, W.S.; Eliceiri, K.W. NIH Image to ImageJ: 25 years of image analysis. Nat. Methods2012, 9, 671–675. [CrossRef] [PubMed]
32. Lee, Y.; Yin, J. Imaging the propagation of viruses. Biotechnol. Bioeng. 1996, 52, 438–442. [CrossRef]33. Racine, J.S. RStudio: A Platform-Independent IDE for R and Sweave. J. Appl. Econ. 2012, 27, 167–172.
[CrossRef]34. Wickham, H. ggplot2: Elegant Graphics for Data Analysis. In Use R; Springer: Berlin, Germany, 2009.35. Carson, K. Single-Step Growth. In Molecular Biology of Bacteriophage T4; Karam, J.D., Kreuzer, K.N., Mosig, G.,
Hall, D.H., Eiserling, F.A., Black, L.W., Spicer, E.K., Kutter, E., Carlson, K., Miller, E.S., Eds.; American Societyof Microbiology: Washington, DC, USA, 1994; pp. 434–437.
36. Hinton, D.M. Transcript analyses of the uvsX-40-41 region of bacteriophage T4. Changes in the RNA asinfection proceeds. J. Biol. Chem. 1989, 264, 14432–14439. [PubMed]
37. Schroeder, A.; Mueller, O.; Stocker, S.; Salowsky, R.; Leiber, M.; Gassmann, M.; Lightfoot, S.; Menzel, W.;Granzow, M.; Ragg, T. The RIN: An RNA integrity number for assigning integrity values to RNAmeasurements. BMC Mol. Biol. 2006, 7, 3. [CrossRef] [PubMed]
39. Liao, Y.; Smyth, G.K.; Shi, W. featureCounts: An efficient general purpose program for assigning sequencereads to genomic features. Bioinformatics 2014, 30, 923–930. [CrossRef] [PubMed]
40. James, T.D.; Cashel, M.; Hinton, D.M. A Mutation within the beta Subunit of Escherichia coli RNA PolymeraseImpairs Transcription from Bacteriophage T4 Middle Promoters. J. Bacteriol. 2010, 192, 5580–5587. [CrossRef][PubMed]
41. Hinton, D.M. Transcription from a bacteriophage T4 middle promoter using T4 motA protein andphage-modified RNA polymerase. J. Biol. Chem. 1991, 266, 18034–18044. [PubMed]
42. Guild, N.; Gayle, M.; Sweeney, R.; Hollingsworth, T.; Modeer, T.; Gold, L. Transcriptional activation ofbacteriophage T4 middle promoters by the motA protein. J. Mol. Biol. 1988, 199, 241–258. [CrossRef]
43. Schmittgen, T.D.; Livak, K.J. Analyzing real-time PCR data by the comparative C-T method. Nat. Protoc.2008, 3, 1101–1108. [CrossRef] [PubMed]
44. Untergasser, A.; Cutcutache, I.; Koressaar, T.; Ye, J.; Faircloth, B.C.; Remm, M.; Rozen, S.G. Primer3—Newcapabilities and interfaces. Nucleic Acids Res. 2012, 40, e115. [CrossRef] [PubMed]
45. Koressaar, T.; Remm, M. Enhancements and modifications of primer design program Primer3. Bioinformatics2007, 23, 1289–1291. [CrossRef] [PubMed]
46. Gerber, J.S.; Hinton, D.M. An N-terminal mutation in the bacteriophage T4 motA gene yields a protein thatbinds DNA but is defective for activation of transcription. J. Bacteriol. 1996, 178, 6133–6139. [CrossRef][PubMed]
47. Hsieh, M.L.; James, T.D.; Knipling, L.; Waddell, M.B.; White, S.; Hinton, D.M. Architecture of theBacteriophage T4 Activator MotA/Promoter DNA Interaction during Sigma Appropriation. J. Biol. Chem.2013, 288, 27607–27618. [CrossRef] [PubMed]
54. Stitt, B.; Hinton, D.M. Regulation of Middle-Mode Transcription. In Molecular Biology of Bacteriophage T4;Karam, J.D., Ed.; American Society for Microbiology: Washington, DC, USA, 1994; pp. 142–160.
56. Sozhamannan, S.; Stitt, B.L. Effects on mRNA degradation by Escherichia coli transcription termination factorRho and pBR322 copy number control protein Rop. J. Mol. Biol. 1997, 268, 689–703. [CrossRef] [PubMed]
58. Luke, K.; Radek, A.; Liu, X.; Campbell, J.; Uzan, M.; Haselkorn, R.; Kogan, Y. Microarray analysis of geneexpression during bacteriophage T4 infection. Virology 2002, 299, 182–191. [CrossRef] [PubMed]
59. Sanson, B.; Uzan, M. Post-transcriptional controls in bacteriophage T4: Roles of the sequence-specificendoribonuclease RegB. FEMS Microbiol. Rev. 1995, 17, 141–150. [CrossRef] [PubMed]
60. Uzan, M. Bacteriophage T4 RegB endoribonuclease. Methods Enzymol. 2001, 342, 467–480. [PubMed]61. Barker, M.M.; Gaal, T.; Josaitis, C.A.; Gourse, R.L. Mechanism of regulation of transcription initiation by
ppGpp. I. Effects of ppGpp on transcription initiation in vivo and in vitro. J. Mol. Biol. 2001, 305, 673–688.[CrossRef] [PubMed]
62. Travers, A.A. Promoter sequence for stringent control of bacterial ribonucleic acid synthesis. J. Bacteriol.1980, 141, 973–976. [PubMed]
63. Haugen, S.P.; Ross, W.; Gourse, R.L. Advances in bacterial promoter recognition and its control by factorsthat do not bind DNA. Nat. Rev. Microbiol. 2008, 6, 507–519. [CrossRef] [PubMed]
65. Kolmsee, T.; Delic, D.; Agyenim, T.; Calles, C.; Wagner, R. Differential stringent control of Escherichia colirRNA promoters: Effects of ppGpp, DksA and the initiating nucleotides. Microbiology 2011, 157, 2871–2879.[CrossRef] [PubMed]
66. Henard, C.A.; Bourret, T.J.; Song, M.; Vazquez-Torres, A. Control of redox balance by the stringent responseregulatory protein promotes antioxidant defenses of Salmonella. J. Biol. Chem. 2010, 285, 36785–36793.[CrossRef] [PubMed]
67. Henard, C.A.; Vazquez-Torres, A. DksA-dependent resistance of Salmonella enterica serovar Typhimuriumagainst the antimicrobial activity of inducible nitric oxide synthase. Infect. Immun. 2012, 80, 1373–1380.[CrossRef] [PubMed]
68. Sharma, A.K.; Payne, S.M. Induction of expression of hfq by DksA is essential for Shigella flexneri virulence.Mol. Microbiol. 2006, 62, 469–479. [CrossRef] [PubMed]
69. Chen, A.I.; Goulian, M. A network of regulators promotes dehydration tolerance in Escherichia coli. Environ.Microbiol. 2018, 20, 1283–1295. [CrossRef] [PubMed]
71. Holley, C.L.; Zhang, X.J.; Fortney, K.R.; Ellinger, S.; Johnson, P.; Baker, B.; Liu, Y.L.; Janowicz, D.M.; Katz, B.P.;Munson, R.S.; et al. DksA and (p)ppGpp Have Unique and Overlapping Contributions to Haemophilusducreyi Pathogenesis in Humans. Infect. Immun. 2015, 83, 3281–3292. [CrossRef] [PubMed]
72. Wilkens, K.R.W. Transcription from early promoters. In Molecular Biology of Bacteriophage T4; Karam, J.D.,Kreuzer, K.N., Mosig, G., Hall, D.H., Eiserling, F.A., Black, L.W., Spicer, E.K., Kutter, E., Carlson, K.,Miller, E.S., Eds.; American Society for Microbiology: Washington, DC, USA, 1994; pp. 132–141.
73. Webb, C.; Moreno, M.; Wilmes-Riesenberg, M.; Curtiss, R., 3rd; Foster, J.W. Effects of DksA and ClpPprotease on sigma S production and virulence in Salmonella typhimurium. Mol. Microbiol. 1999, 34, 112–123.[CrossRef] [PubMed]
74. Potrykus, K.; Murphy, H.; Philippe, N.; Cashel, M. ppGpp is the major source of growth rate control in E. coli.Environ. Microbiol. 2011, 13, 563–575. [CrossRef] [PubMed]
77. Shokri, A.; Veide, A.; Larsson, G. RelA1 gene control of Escherichia coli lipid structure and cell performanceduring glucose limited fed-batch conditions. Appl. Microbiol. Biotechnol. 2006, 73, 464–473. [CrossRef][PubMed]
78. Santangelo, T.J.; Artsimovitch, I. Termination and antitermination: RNA polymerase runs a stop sign.Nat. Rev. Microbiol. 2011, 9, 319–329. [CrossRef] [PubMed]
79. Grainger, D.C. Structure and function of bacterial H-NS protein. Biochem. Soc. Trans. 2016, 44, 1561–1569.[CrossRef] [PubMed]
80. Ali, S.S.; Beckett, E.; Bae, S.J.; Navarre, W.W. The 5.5 Protein of Phage T7 Inhibits H-NS through Interactionswith the Central Oligomerization Domain. J. Bacteriol. 2011, 193, 4881–4892. [CrossRef] [PubMed]
81. Ho, C.H.; Wang, H.C.; Ko, T.P.; Chang, Y.C.; Wang, A.H.J. The T4 Phage DNA Mimic Protein Arn Inhibitsthe DNA Binding Activity of the Bacterial Histone-like Protein H-NS. J. Biol. Chem. 2014, 289, 27046–27054.[CrossRef] [PubMed]