124
CSP ALLIANCE REPORT The Economic and Reliability Benefits of CSP with Thermal Energy Storage: Literature Review and Research Needs csp-alliance.org SEPTEMBER 2014 TECHNICAL REPORT
CSP AL L IANCE REPORT
The Economic and Reliability Benefits of CSP with Thermal Energy Storage: Literature Review and Research Needs
csp-alliance.org
SEPTEMBER 2014 TECHNICAL REPORT

B E N E F I T S O F C S P W I T H T H E R M A L S T O R A G E
i
The CSP AllianceThe CSP Alliance is a public policy advocacy organization dedicated to bringing
increased awareness and visibility to this sustainable, dispatchable technology.
Our membership includes many of the world’s largest CSP corporations and their
supply-chain partners. Our objectives include advancing the industry’s value
proposition, addressing issues of job creation and environmental sustainability,
and setting the foundation for future uses of the technology.
The first version of this report was released in December 2012. This next version
includes expanded discussion of methodology and new study results available over
the course of 2013-14.
AcknowledgmentsThis project was initiated for the CSP Alliance by Joseph Desmond, BrightSource
Energy, Fred Morse, Abengoa Solar, and Tex Wilkins, CSP Alliance. The report was
prepared by Udi Helman and David Jacobowitz.
Many other people contributed data and provided comments. In particular, we would
like to thank the following for their comments and support on the original and revised
report: Brendan Acord, Paul Denholm, Paul Didsayabutra, Jon Forrester, Warren
Katzenstein, Or Kroyzer, Tandy McMannes, Mark Mehos, Andrew Mills, Hank Price,
Tom Riley, Ramteen Sioshansi, Chifong Thomas and Mitch Zafer. Brendan Acord,
Yehuda Halevy, Vered Karty, Saheed Okuboyejo, Elizabeth Santos, David Schlosberg,
Daniel Schwab, Zhanna Sigwart, Mitch Zafer, and Omer Zehavi provided support for
Tables 5-1 to 5-3. Tom Mancini provided a full review of the document.
However, reviewers of the report are not responsible for any subsequent errors or
interpretations of results.
B E N E F I T S O F C S P W I T H T H E R M A L S T O R A G E
ii
ContentsThe CSP Alliance and Acknowledgments ........................................................................i
Acronyms ............................................................................................................................v
1. Introduction ................................................................................................................ 1
1.1 The Design of Clean Power Systems ........................................................................... 2
1.2 Economic and Reliability Benefits of CSP with Thermal Storage ...................................... 2
1.3 Report Objectives and Overview ................................................................................. 4
2. Design and Operational Attributes of CSP with Thermal Energy Storage ......... 6
2.1 Background on CSP Plant Design and Operations ....................................................... 6
Thermal Energy Storage Systems ................................................................................ 8
2.2 Key Components of CSP Plant Design and Production Modeling.................................... 9
Solar resource modeling ........................................................................................... 9
Solar Multiple ......................................................................................................... 10
Thermal Storage Capacity ....................................................................................... 10
Operational Attributes of Different Configurations...................................................... 11
3. Utility or Market Services Offered by CSP with Thermal Energy Storage – and Comparison with PV ........................................................................................ 13
3.1 Capacity ................................................................................................................ 14
3.2 Energy and Ramping ............................................................................................... 15
3.3 Ancillary Services – Operating Reserves ..................................................................... 16
Regulation ............................................................................................................. 16
Contingency Reserves ............................................................................................. 16
Supplemental Reserves ............................................................................................ 17
3.4 Other Ancillary Services and Operational Requirements .............................................. 17
Frequency Response ................................................................................................ 17
Inertia Response ..................................................................................................... 18
Reactive Power and Voltage Support ......................................................................... 18
3.5 Visibility and Control ............................................................................................... 19
4. Valuation of Renewable Resources – Definition of Net System Cost and Quantitative Methods .................................. 21
4.1 Utility Valuation and Net System Cost ....................................................................... 22
4.2 Quantitative Methods for Economic Valuation............................................................ 23
Power system sub-hourly operational models ............................................................. 23
Power system dispatch models ................................................................................. 23
Plant-level simulation with exogenous prices .............................................................. 24
B E N E F I T S O F C S P W I T H T H E R M A L S T O R A G E
iii
Other pricing models .............................................................................................. 24
Statistical and operational models for measuring capacity credits ................................ 24
Portfolio planning/capacity expansion models ........................................................... 25
4.3 Applications in long-term planning and procurement methods..................................... 25
4.4 Scenario Development and Baseline Measurements ................................................... 26
4.5 Low versus High Penetration Scenarios ...................................................................... 29
5. Valuation of Renewable Resources – Implication of Regulatory and Market Regimes .................................................. 31
5.1 Institutional structures for the power sector ................................................................. 31
5.2 Valuation in U.S. Markets ......................................................................................... 32
5.3 Valuation outside the U. S. ....................................................................................... 34
6. Looking to the Future: Simulating Power Systems under High Renewable Scenarios ........................... 47
6.1 High Penetration Renewable Resource Scenarios ........................................................ 47
6.2 Resource Adequacy ................................................................................................. 49
6.3 System Operations .................................................................................................. 50
6.4 Summary ................................................................................................................ 52
7. Energy and Ancillary Services ................................................................................ 53
7.1 Energy ................................................................................................................... 53
Low Renewable Energy Cases or Scenarios ............................................................... 54
High Renewable Energy Scenarios ............................................................................ 56
Start-up Costs ........................................................................................................ 59
Subhourly Energy Dispatch and Ramping Reserves ..................................................... 59
7.2 Ancillary Services .................................................................................................... 59
Ancillary service benefits modeled in recent studies .................................................... 61
Other Ancillary Services .......................................................................................... 63
7.3 Summary and Additional Research Needs .................................................................. 64
8. Resource Adequacy and Long-term Reliability .................................................... 65
8.1 Methodology for Capacity Valuation ......................................................................... 65
8.2 Capacity Value in Low Solar Penetration Scenarios ..................................................... 66
8.3 Capacity Value at Higher Solar Penetrations .............................................................. 67
8.4 Capacity Resources with Flexible Operational Attributes .............................................. 70
8.5 Summary and Additional Research Needs .................................................................. 71
9. Integration and Curtailment Costs ........................................................................ 72
9.1 Renewable integration requirements .......................................................................... 72
B E N E F I T S O F C S P W I T H T H E R M A L S T O R A G E
iv
9.2 Avoided integration costs ......................................................................................... 73
9.3 Mitigation of System Ramps...................................................................................... 75
Example 1 – Reducing the Late Afternoon Net Load Ramp .......................................... 78
Example 2 – Intermittent Cloudy Day, Large Variation in Solar Generation ................... 79
Example 3 – Rapid Changes in Net Load Ramp Direction ........................................... 80
9.4 Curtailment of Solar Energy ..................................................................................... 81
9.5 Summary and Additional Research Needs .................................................................. 82
10. The Total Economic Benefits of CSP with Thermal Storage ................................. 83
10.1 Advances in integrated system modeling for comprehensive analysis of CSP economic benefits ....................................................................................... 83
10.2 Total economic and reliability benefits in recent studies ............................................. 84
10.3 Summary and Additional Research Needs ................................................................ 87
11. Incorporating Market and Reliability Valuation into CSP Plant Design ........... 88
12. Conclusions and Next Steps ................................................................................... 90
Consideration of net system costs in utility procurement .............................................. 90
Summary of Specific Recommendations .................................................................... 91
Next Steps .............................................................................................................. 91
References ....................................................................................................................... 93
Appendix A: Methodologies for Calculating Capacity Value of CSP with Thermal Energy Storage ..................................................................................... 103
Basic definitions .......................................................................................................... 104
LOLE/ELCC Methods ................................................................................................... 104
Approximation-Based Methods ..................................................................................... 105
Estimating capacity value of CSP with thermal storage using dispatch models ................... 106
Plant-level dispatch models .......................................................................................... 107
System-level dispatch models ....................................................................................... 108
Other Determinants of Capacity Value .......................................................................... 108
Locational Value ................................................................................................... 108
Flexible Capacity .................................................................................................. 109
Avoided Cost of New Generation ................................................................................. 109
Conclusions ............................................................................................................... 109
Additional References .................................................................................................. 111
Appendix B: Simplified Calculation of Integration Costs in California under 33% RPS ............................................................................................................. 112
Methodology .............................................................................................................. 112
B E N E F I T S O F C S P W I T H T H E R M A L S T O R A G E
v
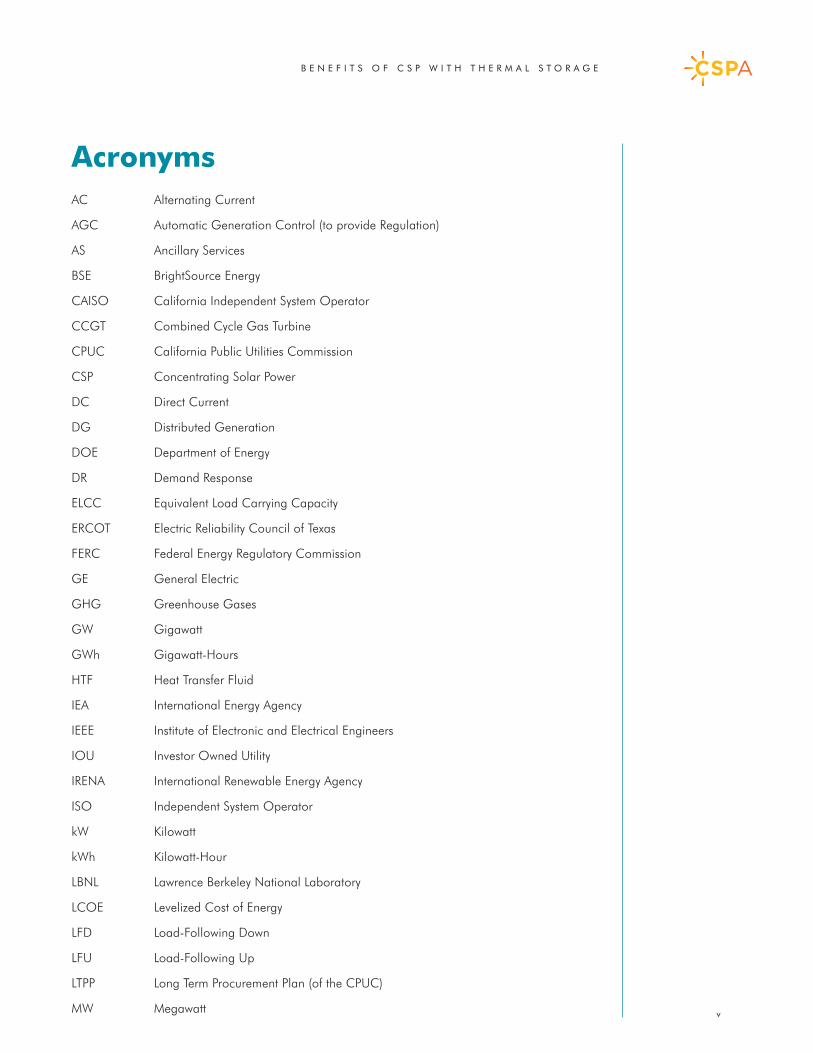
AcronymsAC Alternating Current
AGC Automatic Generation Control (to provide Regulation)
AS Ancillary Services
BSE BrightSource Energy
CAISO California Independent System Operator
CCGT Combined Cycle Gas Turbine
CPUC California Public Utilities Commission
CSP Concentrating Solar Power
DC Direct Current
DG Distributed Generation
DOE Department of Energy
DR Demand Response
ELCC Equivalent Load Carrying Capacity
ERCOT Electric Reliability Council of Texas
FERC Federal Energy Regulatory Commission
GE General Electric
GHG Greenhouse Gases
GW Gigawatt
GWh Gigawatt-Hours
HTF Heat Transfer Fluid
IEA International Energy Agency
IEEE Institute of Electronic and Electrical Engineers
IOU Investor Owned Utility
IRENA International Renewable Energy Agency
ISO Independent System Operator
kW Kilowatt
kWh Kilowatt-Hour
LBNL Lawrence Berkeley National Laboratory
LCOE Levelized Cost of Energy
LFD Load-Following Down
LFU Load-Following Up
LTPP Long Term Procurement Plan (of the CPUC)
MW Megawatt
B E N E F I T S O F C S P W I T H T H E R M A L S T O R A G E
vi
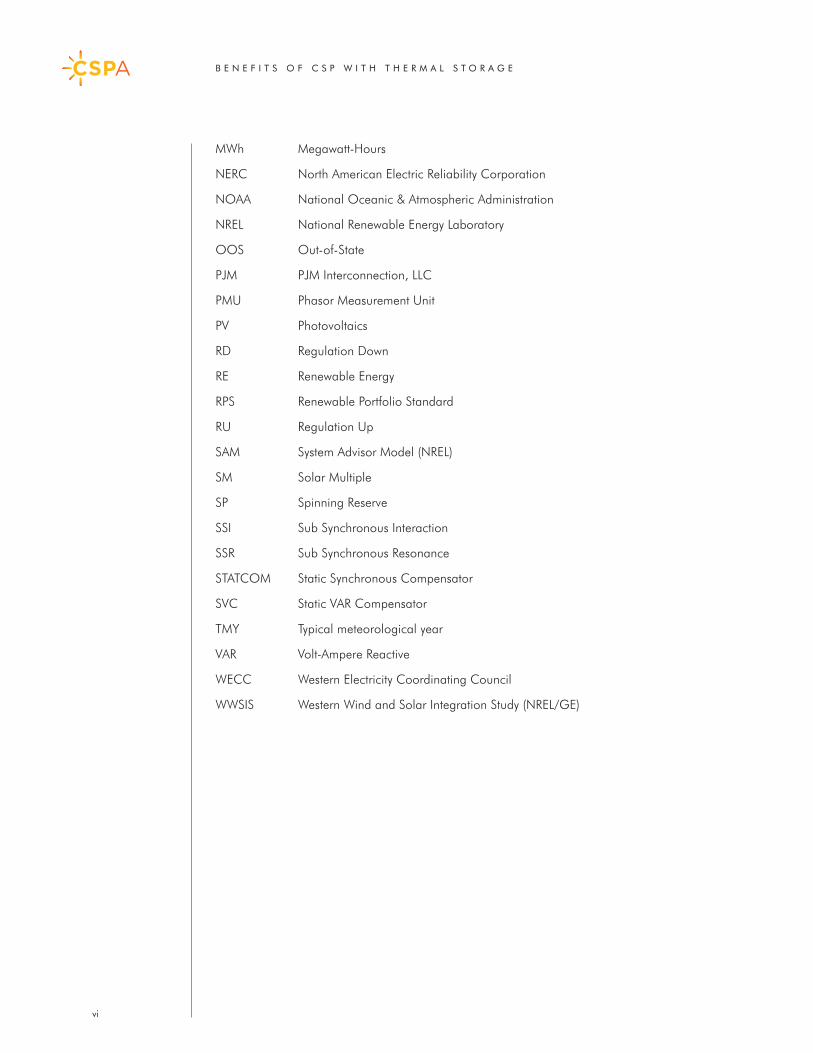
MWh Megawatt-Hours
NERC North American Electric Reliability Corporation
NOAA National Oceanic & Atmospheric Administration
NREL National Renewable Energy Laboratory
OOS Out-of-State
PJM PJM Interconnection, LLC
PMU Phasor Measurement Unit
PV Photovoltaics
RD Regulation Down
RE Renewable Energy
RPS Renewable Portfolio Standard
RU Regulation Up
SAM System Advisor Model (NREL)
SM Solar Multiple
SP Spinning Reserve
SSI Sub Synchronous Interaction
SSR Sub Synchronous Resonance
STATCOM Static Synchronous Compensator
SVC Static VAR Compensator
TMY Typical meteorological year
VAR Volt-Ampere Reactive
WECC Western Electricity Coordinating Council
WWSIS Western Wind and Solar Integration Study (NREL/GE)
B E N E F I T S O F C S P W I T H T H E R M A L S T O R A G E
1
1. IntroductionConcentrating Solar Power (CSP) plants with thermal energy storage are renewable resources that provide not only clean electric power, but also a range of operational capabilities that support the continued operational flexibility and reliability of electric power systems. Thermal energy storage allows CSP to store some of the solar energy captured during the daylight hours and shift energy production overnight or to the next day, as desired. CSP, with or without storage, utilizes a conventional synchronous generator, which in addition to energy, provides voltage support and inertial response capability. When equipped with a thermal storage system, CSP plants can follow economic dispatch and provide a range of other ancillary services, including frequency responsive reserves, frequency regulating reserves, spinning reserves, and ramping reserves. CSP with thermal storage combines this operational flexibility with high capacity value, and hence is well-suited to provide the “flexible capacity” requirements being established in many power systems.
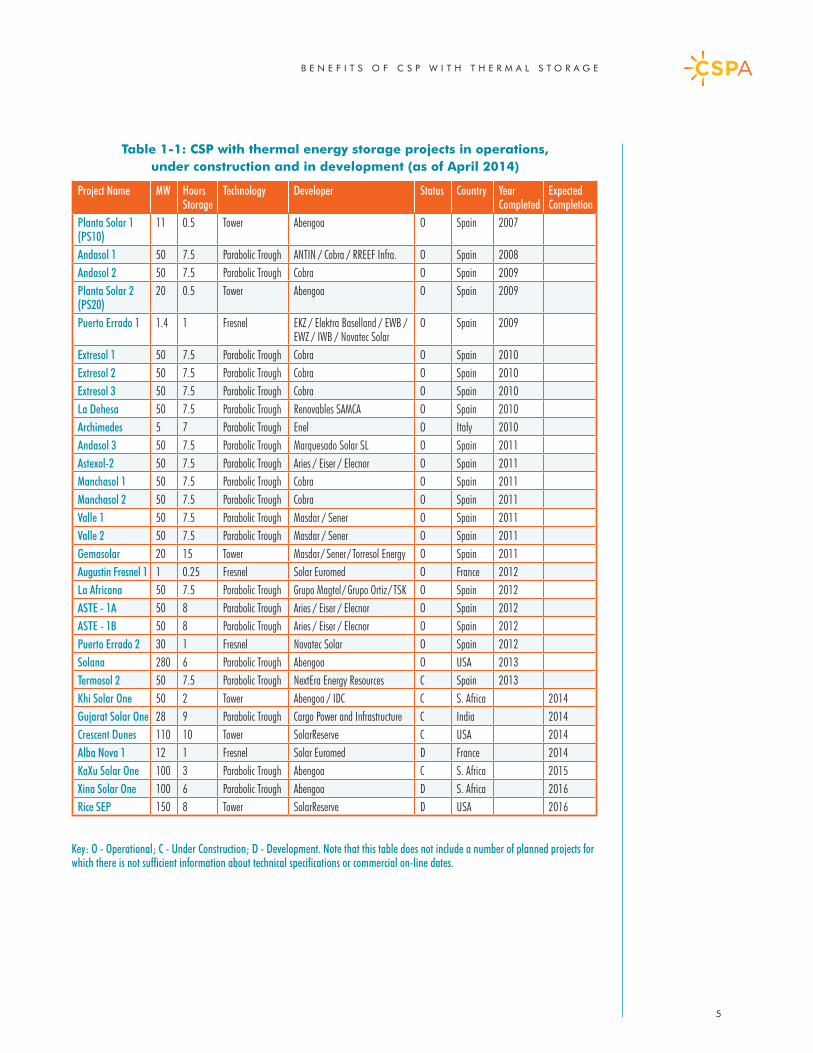
CSP technology is now relatively mature. The first commercial CSP plants incorporating significant thermal energy storage capacity, both parabolic troughs and power towers, began operations in Spain in 2008. As listed in Table 1-1, almost 20 such plants are now operating (along with many other CSP plants that do not include storage), and new designs will enter service in 2014. The CSP industry continues to seek cost reductions in the next generation plants and to work with researchers, regulators and utilities to identify and quantify the economic and reliability benefits of different configurations of thermal storage systems.
This report provides a survey of research into the economic and reliability benefits of CSP with thermal energy storage and other solar technologies, as well as results from other studies of renewable integration. The economic benefits are defined as the avoided fixed and variable costs of electric power from conventional fossil-fueled generation resulting from the operations of CSP with thermal storage, and other solar technologies. Some operational attributes identified as needed for future power system operations have, to date, been less amenable to economic analysis. For example, few studies estimate the value of inertial and frequency response services with increased reliance on variable wind and solar resources, although the need for replacement of such services currently provided by conventional thermal generation is likely to occur in the next few years in the United States (FERC 2014). Hence, the report describes these capabilities as additional operational and reliability benefits whose economic value will require further analysis.
Although this report is intended to support improved cost-benefit analysis of CSP with thermal energy storage, it does not examine the trends in the levelized cost of energy1 of alternative solar technologies. The report does discuss alternative operational solutions to renewable integration, but it does not attempt to quantify their value. Surveys of estimated CSP costs are available2 and potential utility buyers know competing bid costs for their particular projects. The economic case for continued investment in CSP with thermal storage rests not only on calculations of comparative economic benefits, but also on plant costs being reduced sufficiently to remain competitive with the net costs of other renewable energy and integration solutions. These include other types of storage now being promoted through policies in some regions, such as Germany and California.3
1 The levelized cost of energy (LCOE) is a detailed calculation of the capital and operating costs of a project divided by its forecast energy production.2 For recent surveys of CSP (and PV) costs, see Bollinger and Weaver (2013), IRENA (2012), and IEA (2010). However, CSP companies generally do not publicly release cost estimates, and so these studies may not correspond to bid costs.3 To date, CSP with thermal energy storage is eligible to count against the storage procurement targets recently established in California.
B E N E F I T S O F C S P W I T H T H E R M A L S T O R A G E
2
1.1 The Design of Clean Power Systems
Until recently, renewable resources represented a small percentage of total power system generating capacity and production, and the effect of renewable energy on power system reliability and operations was considered secondary to the objective of meeting policy goals with the least-cost, lowest-risk, renewable technologies. However, wind and solar resources are no longer marginal contributors to electric power production in some regions.4 As this penetration increases, other considerations are becoming prominent, such as the impact on the power system of growing supply variability, production forecast errors, and minimal controllability and responsiveness to economic dispatch.
Currently, the power system relies on the control of generator output to provide system balancing in the upwards and downwards directions on various time-scales – seconds, minutes, hours – as well as to provide frequency control in the event of system contingencies. However, power system operators may not have economic dispatch control over large-scale wind and solar plants, and even if they do, it is primarily in the downward direction (curtailment) in the event of system emergencies or otherwise to preserve short-term reliability. The increasing number of small-scale, distributed power plants, are typically not controllable by the system operator and may require further investments to achieve such controls (e.g., CAISO/KEMA 2012). Until such capabilities are wide-spread, other resources must be utilized to balance the increasing quantity of variable generation and ensure long-term resource adequacy.
The operational and reliability solutions for power systems with high penetration of renewable energy are varied, including adjusting incremental procurement of renewable resources to create less variable aggregate production profiles, more flexible utilization of hydro, coal and natural gas generation, more flexible demand response, and various types of energy storage (see, e.g., NREL 2012). As one of these potential solutions, CSP with thermal energy storage meets renewable policy goals, reduces the variability of the aggregate renewable portfolio, and provides the wide range of operational and reliability attributes reviewed in this report. All stored thermal energy is gathered from the solar field and is, therefore, certified as renewable energy. The addition of bulk energy storage allows higher utilization of the CSP plant’s power block and other components. Although not the focus of this report, CSP technology can be hybridized with other fuels – either “brown” or “green”5 – to further improve plant performance and reduce emissions. The quantification of the resulting economic benefits requires detailed analysis of individual plant design and particular power systems, as described next.
1.2 Economic and Reliability Benefits of CSP with Thermal Storage
Competition among alternative renewable technologies has increased substantially over the past few years, due to downward cost trends within each technology that have resulted from policy support
4 In 2013, Germany had installed almost 35 GW of distributed solar energy capacity, along with 31 GW of wind capacity, providing over 15% of energy generated. In California and Spain, renewable energy already accounts for 15-20% or more of annual retail electricity sales and California policy aims to increase that share to 33% by 2020, with higher targets are being considered for later years. Other countries and regions have deployed wind generation on a large-scale, including Denmark and Ireland. Many of these systems have recorded operating hours, typically during light load conditions, with even higher renewable production, in the range of 40-50%, while some Spanish states record even higher penetrations. Many other U.S. states, some countries and international institutions have ambitious annual national renewable energy targets, some ranging from 20-25% within the next decade or so. Some of these targets are on-track to be achieved despite the current low cost of fossil fuels, in part because of continued reductions in the cost of wind and PV.5 The hybridization of thermal power plants with solar and brown fuels, gas or coal, is well researched. In addition, the plants can be hybridized with green fuels, such as biomass. There are a number of hybrid CSP-biomass projects under development in Spain and North Africa.
B E N E F I T S O F C S P W I T H T H E R M A L S T O R A G E
3
and financial incentives. For CSP with thermal energy storage, these developments have made appropriate valuation all the more critical, because on a levelized cost of energy basis, CSP, with or without storage, has fallen behind wind and PV. However, comparisons of CSP with thermal storage with competing renewable technologies that focus only on differences in the levelized cost of energy are incomplete. This is because they do not capture the potentially significant differences in economic benefits when comparing renewable resources that have substantially different production characteristics (for a review of this point, see Joskow 2010). CSP with thermal energy storage is shown to be much more competitive when the comprehensive net costs6 of the CSP plant are compared to wind or PV. These net costs include the long-term energy, ancillary service and capacity benefits, and can be reasonably shown to provide an additional $30-60/MWh, or even higher, of benefits when compared to a PV plant with equal annual energy production in high renewable penetration scenarios.
The comparison between the economic benefits of CSP with thermal storage and PV is intended to provide a useful metric for utility planners and procurement analysts when considering alternative solar projects. It is not intended as a criticism of PV. Rather, as explained further in the report, there are synergies between the two solar technologies that could result in higher aggregate solar capacity value and less solar curtailment as PV penetration increases. There are also opportunities for CSP with thermal storage in remote locations to provide operational needs that cannot be cost-effectively provided by other renewable solutions.
The net cost of CSP plants with thermal storage was not considered comprehensively during the initial phases of renewable procurements in Spain and the United States. Historically, CSP plants have been recognized for their capability for both hybridization with other fuels and addition of thermal storage. Many existing parabolic trough plants have included auxiliary gas capability, which has improved their capacity value.7 The utility-scale CSP plants with thermal energy storage operating in Spain and the United States have demonstrated the capability to scale up to very high storage capacities (Table 1-1). However, until recently, the Spanish plants were operated under feed-in-tariff contracts that did not provide economic incentives to participate in power markets or system operations. Instead they provided a steady production of power across the hours of operations (e.g., Usaola 2012). While recently there have been some examples of these plants operating to follow energy market prices due to changes in the Spanish tariff structures (Dinter 2013), as yet there is no commercial example of a dispatchable CSP plant consistently operating to maximize energy and ancillary service benefits.
However, the perception of the economic benefits of CSP with thermal storage is changing due both to the detailed technical studies reviewed here, and because additional data is anticipated over the next few years on the operations of new projects. In the United States, where the first new utility-scale CSP plants have come on-line in 2013-14, policymakers and utilities have shown increasing interest in technologies that can provide operational flexibility and ensure long-term reliability without increasing emissions. Utility solar valuation methods are also evolving in corresponding ways, although there is some lag in fully capturing the value of solar thermal storage (and other types of storage) due to the lack of data, modeling requirements and other factors (Mills and Wiser, 2012a).
6 Net cost is essentially the cost minus the benefits of a renewable project, where the benefits include any market products and operational attributes that can be quantitatively or qualitatively evaluated. Section 4 provides further definition.7 The first commercial parabolic trough plants in Southern California – the Solar Energy Generating System (SEGS) plants – had significant auxiliary gas capability (one included thermal storage), which has allowed them to consistently demonstrate a very high capacity value over their 21-26 years of operation. More recently, many of the plants in Spain have also utilized auxiliary gas capability.
Comparisons of CSP with thermal storage with competing renewable technologies that focus only on differences in the levelized cost of energy are incomplete because they do not capture differences in economic benefits with different production characteristics.
B E N E F I T S O F C S P W I T H T H E R M A L S T O R A G E
4
1.3 Report Objectives and Overview
This report summarizes the key findings of studies that evaluate the economic and reliability benefits of CSP with thermal storage. The report is structured to provide readers with backgrounds in CSP engineering and project development with enough information to understand how the economic benefits are determined, while also giving readers with backgrounds in electric power market and system operations sufficient information on how CSP plants with storage might be operated. The structure of the report is also intended to allow for updates and further content development. Basic concepts of electric power systems and markets, along with the new operational and reliability requirements created by variable energy resources are introduced first, followed by a detailed discussion of the technical analyses and their results.
Most of the studies cited were conducted by the U.S. national laboratories, particularly the National Renewable Energy Laboratory (NREL) and the Lawrence Berkeley National Lab (LBNL). These labs not only did the foundational work of building publicly available models of CSP plants, but have recently conducted some of the first detailed regional simulation studies to characterize both the operational needs of power systems with high renewable penetration and the potential economic benefits of CSP with thermal storage.8 In addition, selected other studies of California, other U.S. states, and other countries are reviewed that provide further insight into potential benefits of CSP with thermal energy storage under different renewable penetration scenarios. Since most of these studies are technical and do not provide basic definitions or literature review, this report also attempts to serve those functions. Lastly, the report suggests regulatory and policy reforms that could better reflect the benefits of CSP with storage in utility procurement, and recommends additional research required to support comprehensive economic valuation of these technologies.
Report Organization
The report is organized as follows. In Part I, Sections 2-6 provide background on CSP technology, valuation methods, institutional structures in the electric power sector, and some of the challenges in simulating high penetration renewable scenarios. In Part II, Sections 7-11 summarize the results of recent studies on valuation of economic and reliability benefits. Section 12 concludes the report with recommendations. Appendix A surveys capacity valuation methodologies relevant to CSP with thermal storage. Appendix B summarizes some methods for calculating integration costs. The report and appendices include lists of references.
For ease of reading, the report minimizes the use of acronyms, and does not include the common acronym of “TES” to represent thermal energy storage. All acronyms used are included in the Acronym section, above.
Note to Readers
Many of the study results discussed in the report compare CSP with thermal storage to both PV and CSP without storage. For convenience, we refer to the latter two technologies as “variable solar technologies,” or as “solar technologies without storage,” although both technologies can include operational capabilities that reduce variability and CSP in particular has capabilities delivered by a synchronous generator. The more general term “variable energy resources” refers to wind, PV and CSP without storage.
8 See, e.g., Madaeni, Sioshansi, and Denholm (2012a,b), Denholm and Mehos (2011), Denholm and Hummon (2012), Mills and Wiser (2012a,b), Denholm et al., (2012), Denholm et al., (2013), Jorgenson et al., (2013, 2014), and NREL (2012).
Policymakers and utilities have shown increasing interest in technologies that can provide operational flexibility and ensure long-term reliability without increasing emissions.
B E N E F I T S O F C S P W I T H T H E R M A L S T O R A G E
5
Project Name MW Hours Storage
Technology Developer Status Country Year Completed
Expected Completion
Planta Solar 1 (PS10)
11 0.5 Tower Abengoa O Spain 2007
Andasol 1 50 7.5 Parabolic Trough ANTIN / Cobra / RREEF Infra. O Spain 2008Andasol 2 50 7.5 Parabolic Trough Cobra O Spain 2009Planta Solar 2 (PS20)
20 0.5 Tower Abengoa O Spain 2009
Puerto Errado 1 1.4 1 Fresnel EKZ / Elektra Baselland / EWB / EWZ / IWB / Novatec Solar
O Spain 2009
Extresol 1 50 7.5 Parabolic Trough Cobra O Spain 2010Extresol 2 50 7.5 Parabolic Trough Cobra O Spain 2010Extresol 3 50 7.5 Parabolic Trough Cobra O Spain 2010La Dehesa 50 7.5 Parabolic Trough Renovables SAMCA O Spain 2010Archimedes 5 7 Parabolic Trough Enel O Italy 2010Andasol 3 50 7.5 Parabolic Trough Marquesado Solar SL O Spain 2011Astexol-2 50 7.5 Parabolic Trough Aries / Eiser / Elecnor O Spain 2011Manchasol 1 50 7.5 Parabolic Trough Cobra O Spain 2011Manchasol 2 50 7.5 Parabolic Trough Cobra O Spain 2011Valle 1 50 7.5 Parabolic Trough Masdar / Sener O Spain 2011Valle 2 50 7.5 Parabolic Trough Masdar / Sener O Spain 2011Gemasolar 20 15 Tower Masdar / Sener / Torresol Energy O Spain 2011Augustin Fresnel 1 1 0.25 Fresnel Solar Euromed O France 2012La Africana 50 7.5 Parabolic Trough Grupo Magtel / Grupo Ortiz / TSK O Spain 2012ASTE - 1A 50 8 Parabolic Trough Aries / Eiser / Elecnor O Spain 2012ASTE - 1B 50 8 Parabolic Trough Aries / Eiser / Elecnor O Spain 2012Puerto Errado 2 30 1 Fresnel Novatec Solar O Spain 2012 Solana 280 6 Parabolic Trough Abengoa O USA 2013Termosol 2 50 7.5 Parabolic Trough NextEra Energy Resources C Spain 2013Khi Solar One 50 2 Tower Abengoa / IDC C S. Africa 2014Gujarat Solar One 28 9 Parabolic Trough Cargo Power and Infrastructure C India 2014Crescent Dunes 110 10 Tower SolarReserve C USA 2014Alba Nova 1 12 1 Fresnel Solar Euromed D France 2014KaXu Solar One 100 3 Parabolic Trough Abengoa C S. Africa 2015Xina Solar One 100 6 Parabolic Trough Abengoa D S. Africa 2016Rice SEP 150 8 Tower SolarReserve D USA 2016
Table 1-1: CSP with thermal energy storage projects in operations, under construction and in development (as of April 2014)
Key: O - Operational; C - Under Construction; D - Development. Note that this table does not include a number of planned projects for which there is not sufficient information about technical specifications or commercial on-line dates.
B E N E F I T S O F C S P W I T H T H E R M A L S T O R A G E
6
2. Design and Operational Attributes of CSP with Thermal Energy StorageCSP technology uses reflectors to focus sunlight onto solar receivers to heat a working fluid. The heat thus captured can then be converted to mechanical work in a turbine (or other heat engine) that drives a generator to produce electricity. Because heat can be stored more cost-efficiently than electricity, CSP technology also provides the foundation for a thermal energy storage system that can support plant operations according to market and power system needs, rather than depending on the immediate availability of sunlight.
The commercialization of CSP with thermal energy storage is currently focused on three configurations, all using molten salts as the heat storage medium (although research continues into alternative designs and heat transfer media). The parabolic trough design is the most established CSP design, and the first augmented with significant thermal storage. As listed in Table 1-1, several 50 MW plants are in operations in Spain with 7.5 hours of storage, and a plant with 250 MW net capacity and 6 hours of storage is now operational in Arizona. Power towers, initially demonstrated at smaller scales of up to 20 MW, are now in operation at up to 130 MW individual towers and larger units are in development. Power towers come in two varieties. Power towers with molten salt receivers directly heat the salt and are under construction and development at 110-150 MW capacity and up to 17 hours of storage capacity. Power towers with steam boilers with turbine capacity of approximately 130 MW are now operational, and extensions of this approach to include indirect heating of the molten salts are in development. The direct steam design also allows for non-storage operation without any use of a heat exchanger and associated losses.
This section reviews the key design and operational details typically analyzed in economic valuation studies, primarily of these commercialized designs, but also extendable to other CSP plant designs. The section does not review the extensive technical literature on CSP design. The section is organized as follows:
• Section 2.1 provides background on the design and operations of CSP plants with thermal energy storage.
• Section 2.2 discusses key components of CSP plant design and production modeling, including solar resource modeling, determination of the solar multiple and storage capacity, operational attributes of the plant, and the basic production modeling framework.
2.1 Background on CSP Plant Design and Operations
All CSP plants focus sunlight to heat a working fluid, which captures the heat of sunlight and ultimately transfers solar-generated energy to a heat engine that can convert the heat into mechanical energy. In most operating commercial designs, the working fluid is heated by pumping it through a solar receiver, located at the focus of the solar collectors.
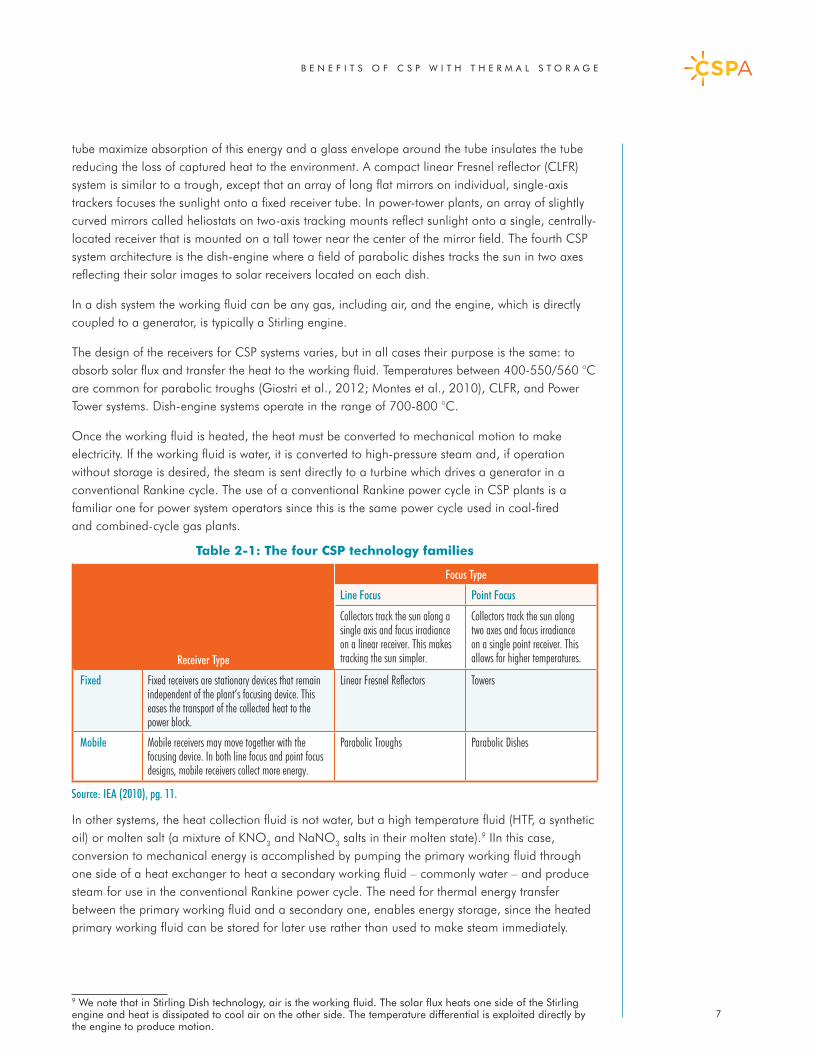
Table 2-1 summarizes the four major types of CSP technology (IEA, 2010). In parabolic trough plants, the receiver is a tube that runs along the focus of a parabolic trough of mirrors. Sunlight that hits the trough is focused onto the receiver tube. The trough collector is usually oriented along a north-south axis and tracks the sun from east to west across the sky. Coatings on the receiver
CSP with thermal energy storage can provide the same operational attributes as a fossil-fueled thermal power plant. When operated from thermal storage, CSP plants are actually more flexible than many existing coal and gas plants, i.e., have greater capability to utilize the full operating range of the turbine coupled with fast ramp rates.
B E N E F I T S O F C S P W I T H T H E R M A L S T O R A G E
7
tube maximize absorption of this energy and a glass envelope around the tube insulates the tube reducing the loss of captured heat to the environment. A compact linear Fresnel reflector (CLFR) system is similar to a trough, except that an array of long flat mirrors on individual, single-axis trackers focuses the sunlight onto a fixed receiver tube. In power-tower plants, an array of slightly curved mirrors called heliostats on two-axis tracking mounts reflect sunlight onto a single, centrally-located receiver that is mounted on a tall tower near the center of the mirror field. The fourth CSP system architecture is the dish-engine where a field of parabolic dishes tracks the sun in two axes reflecting their solar images to solar receivers located on each dish.
In a dish system the working fluid can be any gas, including air, and the engine, which is directly coupled to a generator, is typically a Stirling engine.
The design of the receivers for CSP systems varies, but in all cases their purpose is the same: to absorb solar flux and transfer the heat to the working fluid. Temperatures between 400-550/560 °C are common for parabolic troughs (Giostri et al., 2012; Montes et al., 2010), CLFR, and Power Tower systems. Dish-engine systems operate in the range of 700-800 °C.
Once the working fluid is heated, the heat must be converted to mechanical motion to make electricity. If the working fluid is water, it is converted to high-pressure steam and, if operation without storage is desired, the steam is sent directly to a turbine which drives a generator in a conventional Rankine cycle. The use of a conventional Rankine power cycle in CSP plants is a familiar one for power system operators since this is the same power cycle used in coal-fired and combined-cycle gas plants.
In other systems, the heat collection fluid is not water, but a high temperature fluid (HTF, a synthetic oil) or molten salt (a mixture of KNO3 and NaNO3 salts in their molten state).9 IIn this case, conversion to mechanical energy is accomplished by pumping the primary working fluid through one side of a heat exchanger to heat a secondary working fluid – commonly water – and produce steam for use in the conventional Rankine power cycle. The need for thermal energy transfer between the primary working fluid and a secondary one, enables energy storage, since the heated primary working fluid can be stored for later use rather than used to make steam immediately.
9 We note that in Stirling Dish technology, air is the working fluid. The solar flux heats one side of the Stirling engine and heat is dissipated to cool air on the other side. The temperature differential is exploited directly by the engine to produce motion.
Focus Type
Line Focus Point Focus
Collectors track the sun along a single axis and focus irradiance on a linear receiver. This makes tracking the sun simpler.
Collectors track the sun alongtwo axes and focus irradianceon a single point receiver. Thisallows for higher temperatures.
Fixed Fixed receivers are stationary devices that remain independent of the plant’s focusing device. This eases the transport of the collected heat to the power block.
Linear Fresnel Reflectors Towers
Mobile Mobile receivers may move together with the focusing device. In both line focus and point focus designs, mobile receivers collect more energy.
Parabolic Troughs Parabolic Dishes
Table 2-1: The four CSP technology families
Source: IEA (2010), pg. 11.
Receiver Type
B E N E F I T S O F C S P W I T H T H E R M A L S T O R A G E
8
CSP plants that use water/steam as their primary working fluid can also store energy for later production. They do so by making use of a heat exchanger twice. First, they pass heat from the directly-generated steam to a storage medium, which is then stored. Later, the process is reversed, using the heat exchanger to pass heat from the storage medium back to water, which generates steam to produce power. In this case, energy produced through the storage goes through two heat exchanges rather than one: first, from steam to storage medium, later from storage medium to steam again. Thus, this type of system experiences a heat conversion loss twice when operating from storage. However, when operating in non-storage direct mode, there are no heat exchanges, and thus no associated losses.
CSP plants that use molten salt as their primary working fluid can store heat directly in molten salt. To produce electric power, such plants transfer the heat from the molten salt to water/steam to drive the conventional Rankine cycle power block. Therefore, this design only requires a single heat exchange, but it must use it at all times.
Thermal Energy Storage Systems
The different types of CSP with thermal energy storage systems are each in different phases of technology development and demonstration and each has its own set of costs and benefits with implications for the plant’s operational attributes, as described later in this section. It is beyond the scope of this report to examine all the technical and economic tradeoffs associated with these options and the design decisions necessary to assemble an entire working system. However, a brief discussion of storage media options is worthwhile.
In general, a thermal energy storage system includes a collection method, a reservoir, and a storage medium. Depending on CSP plant configuration and design, the storage medium may also be the working fluid of the CSP cycle or it can be a separate loop that communicates with the working fluid through a heat exchanger. This medium is heated (directly or indirectly) by sunlight and held in reserve until a later time when it is used to generate steam to drive a turbine for electricity production.10 The choice of the medium is important since the mechanical and thermal properties of the medium determine its operational characteristics and the overall cycle efficiencies. The ideal medium is inexpensive, extremely stable through a large temperature range, non-reactive with piping and other materials with which it will come in contact, environmentally benign, has a high specific heat (ability to store heat per unit of mass), has a high heat density (heat per unit of volume), and is easy and safe to handle and pump. Additionally, it is convenient if the material does not experience a phase change over a large temperature range which could complicate handling, although in some advanced storage concepts under examination phase change can be exploited to allow more energy to be stored within a given temperature range and in a much smaller volume.
Steam was an early storage medium and is still used in some plants. For example, the PS10 plant in Seville, Spain has a steam accumulator. While it is difficult to store large quantities of energy with steam cost-efficiently an advantage of steam storage is that it can drive a turbine directly avoiding losses associated with heat exchangers.
10 The amount of energy that can be transferred by a storage medium that does not change phase can be approximated by these formulas: Q=m∙Cp∙∆t; ∆t=th-tl, where Q is energy, m is mass, Cp is specific heat of the storage medium, and ∆t is the temperature differential that the storage material goes through between its “cold” state (tl) and its “hot” state (th). Cp is a quality of the material itself. Thus, if one wants to store more heat, the amount of storage medium can be increased (m), a storage material with a higher specific heat can be selected, or the temperature delta for storage can be increased. However, there are tradeoffs. For example, it may not be possible to increase th because the storage material degrades or begins to become reactive with the plant. Similarly, it may not be possible to reduce tl because the storage material would turn to solid.
B E N E F I T S O F C S P W I T H T H E R M A L S T O R A G E
9
Later designs used special oils or other heat transfer fluids (HTF) as a heat storage and transfer medium. For example, the original SEGS parabolic trough plants built in Southern California and many other trough facilities use Therminol VP or Dowtherm A11, special oils formulated for this purpose. An advantage of HTF over steam is that, although it does exhibit relatively high vapor pressures at high temperatures, it does not require the high pressures and volumes associated with steam accumulators. However, oil also has temperature limits before it begins to coke and otherwise chemically decompose. This limits the operating temperature range and upper storage temperature that the oil can provide, thus limiting the amount of energy that can be stored per unit of HTF.
Several existing and planned CSP plants use molten salt as both the heat transfer and storage medium. The salts are typically a mixture of nitrate salts designed to be close to eutectic point (lowest melting point). The salts are stable at high temperatures (up to 600 °C), and therefore can support conventional Rankine steam power cycles. A requirement of molten salt is that the temperature must be maintained above about 220 °C to prevent solidification. This requires sufficient insulation on the piping and tanks, and potentially supplemental heating at night.
Experimentation continues with new heat storage media. For example, a material under consideration recently is molten glass, which can operate at even higher temperatures than salts. Other research includes particle receivers, granular solid mixtures of materials (Ho et al., 2009) such as granular carbon and ceramics, and molten salts exhibiting a low solidification temperature (~100 °C).
2.2 Key Components of CSP Plant Design and Production Modeling
This section describes some of the key variables related to CSP plants modeled in studies of CSP with thermal energy storage. Much of the analytical framework and modeling details have been developed by researchers at NREL, and individual companies have proprietary versions of these types of models. Preliminary analyses are often performed using simple thermodynamic models or publicly available tools such as NREL’s System Advisor Model (SAM), which was used to generate inputs to the economic models in the NREL studies reviewed here.12 At more advanced stages of plant design, engineers will typically use detailed engineering models that reflects their specific CSP design and/or project parameters. Depending on the model, it may be able to predict not only energy output, but also dynamic plant variables such as start-up times, ramp rates, and other state-dependent characteristics. Studies of CSP operations in power systems will typically utilize SAM or related models as a basis for developing simplified models of CSP plants with thermal storage that are then optimally dispatched within a production cost model. These models are discussed further in Section 4.2 and subsequently in the report.
Solar resource modeling
CSP production, even with storage, is limited by the availability of direct normal insolation, and this availability affects economic valuation, depending on plant configurations. The production of electric power with CSP plants is sensitive not only to direct normal insolation but also ambient temperature, wind speed, humidity, and other weather phenomena (Stoffel, et al., 2010). NREL and NOAA provide “typical meteorological year” or TMY data for many sites around the US
11 A eutectic mixture of biphenyl-diphenyl oxide still used in some plants as a storage medium.12 The SAM model is available at https://sam.nrel.gov/. In SAM, detailed models of the physical characteristics of CSP power plants and their sub-components along with detailed weather data are used to produce electricity output profiles for the plant. The performance and cost models in SAM have been reviewed publicly and many have been econometrically fit to the performance of existing CSP plants.
Experimentation continues with new heat storage media that will allow increased efficiency, storage capacity, and flexibility at lower cost.
B E N E F I T S O F C S P W I T H T H E R M A L S T O R A G E
10
and world.13 This data does not represent any particular year’s observations but is instead synthesized from many years’ observations to represent a “typical” year. TMY data is a good starting point, but for robust economic analysis of a specific project, highly local data – ideally obtained over several years from a weather station installed at the site of interest – is desired. Such data is generally not available and by definition requires years to collect. As such, engineers and project developers resort to other methods, such as extrapolating from nearby weather stations, using satellite data, or some combination thereof.
Solar Multiple
The solar multiple is the ratio of the actual size of a CSP plant’s solar field compared to the field size needed to feed the turbine at design capacity when solar irradiance is at its maximum for that location (typically about 1 kW/m2). A plant with a solar multiple of 1.0 would only be able to produce its nominal rated output during peak sunlight hours. Higher multiples allow the plant to maintain full output even when solar input is less than 100%, thus earning a better capacity value and realizing better overall utilization of the power block. Plants without storage have an optimal solar multiple of roughly 1.1 to about 1.5 (up to 2.0 for CLFR), depending primarily on the amount of sunlight the plant receives and its variation through the day. Plants with large storage capacities may have solar multiples of up to 3 to 5 so that they have sufficient energy gathering capability to operate the plant at full output while also fully charging the storage system in a typical solar day. As discussed below, studies of market and operational benefits that use explicit models of CSP plant design, can examine the benefits of alternative solar multiples (e.g., Jorgenson et al., 2013, 2014).
Thermal Storage Capacity
The thermal storage capacity of a plant represents the total amount of energy that can be stored. It is technically expressed in terms of MWh-thermal (MWh-th), or MWh-energy (MWh-e)14 if adjusted to reflect the efficiency of conversion from thermal to electric energy. Thermal capacity is often presented in terms of time – the amount of time that the plant could operate from storage at its nominal capacity. For example, a 200 MW plant with “two hours” of storage has 400 MWh of storage capability. CSP projects in operation or under construction include storage capacity that is sized from a few hours of storage, intended primarily to serve early evening loads, to the Spanish Gemasolar plant that is essentially “base-loaded” in the summer months, meaning that it operates at rated output up to 24 hours per day.15
Several of the studies presented below – including Sioshansi and Denholm, 2010; Mills and Wiser, 2012b; Denholm and Hummon, 2012; and Denholm et al., 2013 – model a parabolic trough plant with 6 hours of thermal storage capacity. The use of 6 hours in these studies is primarily a convention and not necessarily the result of optimal design. In other studies, notably Madaeni et al., (2012b) and Jorgenson et al., (2013, 2014), a range of storage capacity, solar multiple, and other design parameters is modeled. These studies suggest both optimal solar multiples associated with particular storage capacities on types of CSP plants (e.g., troughs vs. towers), but, as discussed further below, also the rate of change in economic benefits as these design parameters are changed.
13 See http://rredc.nrel.gov/solar/old_data/nsrdb/1991-2005/tmy3/.14 This report uses MW and MWh without any subscript to refer to electric power and energy, respectively. When referring to thermal energy, the report will explicitly include the –th designator.15 A 110 MW CSP power tower with 17.5 hours of thermal storage has also been announced in Chile.
The solar multiple is the ratio of the actual size of a CSP plant’s solar field compared to the field size needed to feed the turbine at design capacity when solar irradiance is at its maximum for that location (typically about 1 kW/m2).
B E N E F I T S O F C S P W I T H T H E R M A L S T O R A G E
11
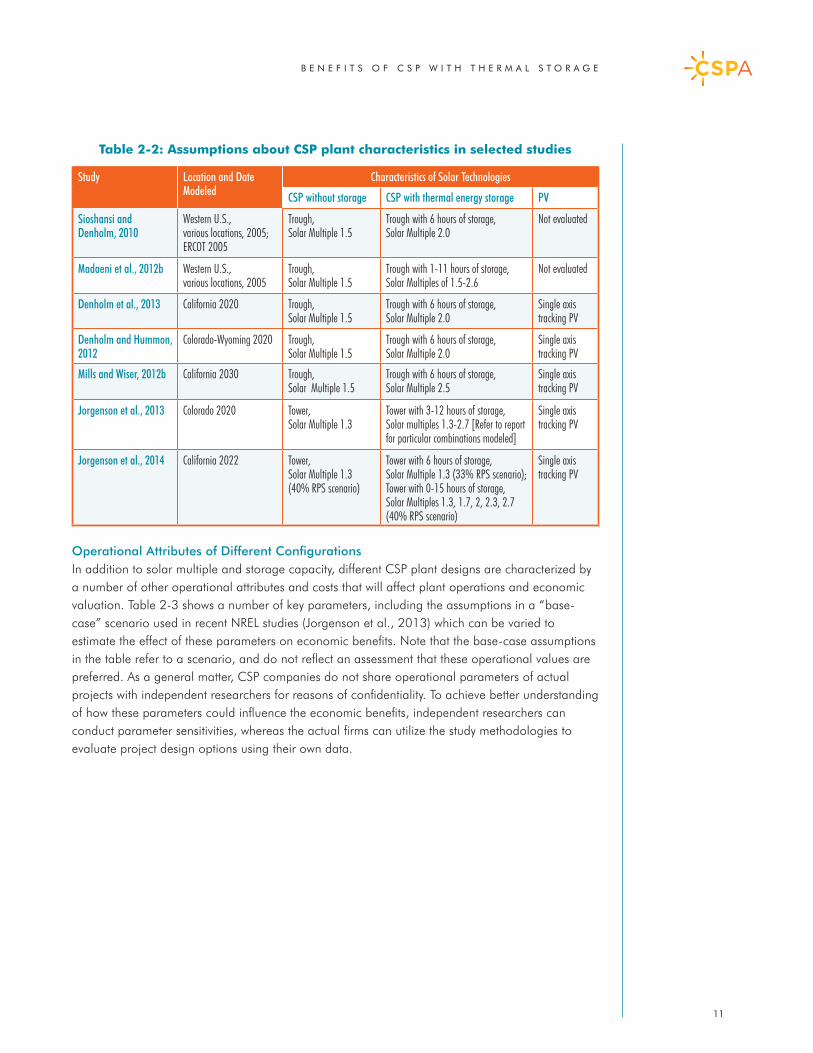
Table 2-2: Assumptions about CSP plant characteristics in selected studies
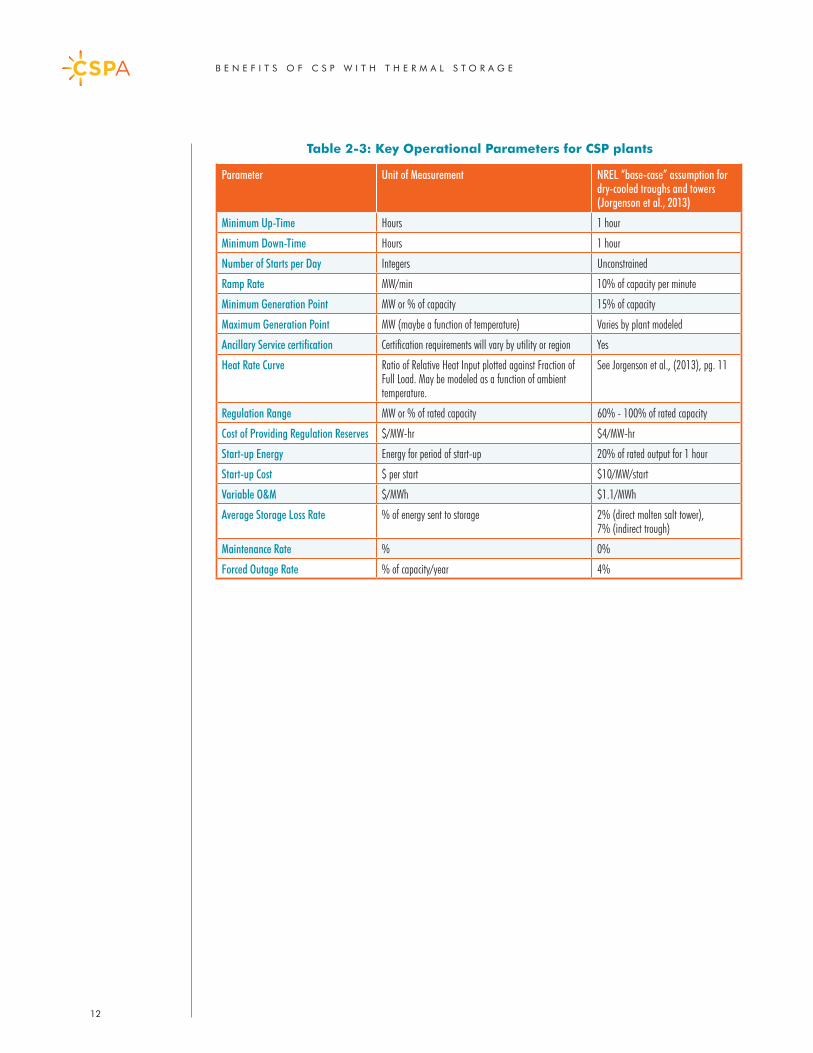
Operational Attributes of Different ConfigurationsIn addition to solar multiple and storage capacity, different CSP plant designs are characterized by a number of other operational attributes and costs that will affect plant operations and economic valuation. Table 2-3 shows a number of key parameters, including the assumptions in a “base-case” scenario used in recent NREL studies (Jorgenson et al., 2013) which can be varied to estimate the effect of these parameters on economic benefits. Note that the base-case assumptions in the table refer to a scenario, and do not reflect an assessment that these operational values are preferred. As a general matter, CSP companies do not share operational parameters of actual projects with independent researchers for reasons of confidentiality. To achieve better understanding of how these parameters could influence the economic benefits, independent researchers can conduct parameter sensitivities, whereas the actual firms can utilize the study methodologies to evaluate project design options using their own data.
Study Location and Date Modeled
Characteristics of Solar Technologies
CSP without storage CSP with thermal energy storage PV
Sioshansi andDenholm, 2010
Western U.S., various locations, 2005; ERCOT 2005
Trough, Solar Multiple 1.5
Trough with 6 hours of storage, Solar Multiple 2.0
Not evaluated
Madaeni et al., 2012b Western U.S., various locations, 2005
Trough, Solar Multiple 1.5
Trough with 1-11 hours of storage, Solar Multiples of 1.5-2.6
Not evaluated
Denholm et al., 2013 California 2020 Trough, Solar Multiple 1.5
Trough with 6 hours of storage, Solar Multiple 2.0
Single axis tracking PV
Denholm and Hummon, 2012
Colorado-Wyoming 2020 Trough, Solar Multiple 1.5
Trough with 6 hours of storage, Solar Multiple 2.0
Single axis tracking PV
Mills and Wiser, 2012b California 2030 Trough, Solar Multiple 1.5
Trough with 6 hours of storage, Solar Multiple 2.5
Single axis tracking PV
Jorgenson et al., 2013 Colorado 2020 Tower, Solar Multiple 1.3
Tower with 3-12 hours of storage, Solar multiples 1.3-2.7 [Refer to report for particular combinations modeled]
Single axis tracking PV
Jorgenson et al., 2014 California 2022 Tower, Solar Multiple 1.3 (40% RPS scenario)
Tower with 6 hours of storage, Solar Multiple 1.3 (33% RPS scenario); Tower with 0-15 hours of storage, Solar Multiples 1.3, 1.7, 2, 2.3, 2.7 (40% RPS scenario)
Single axis tracking PV
B E N E F I T S O F C S P W I T H T H E R M A L S T O R A G E
12
Parameter Unit of Measurement NREL “base-case” assumption for dry-cooled troughs and towers (Jorgenson et al., 2013)
Minimum Up-Time Hours 1 hour
Minimum Down-Time Hours 1 hour
Number of Starts per Day Integers Unconstrained
Ramp Rate MW/min 10% of capacity per minute
Minimum Generation Point MW or % of capacity 15% of capacity
Maximum Generation Point MW (maybe a function of temperature) Varies by plant modeled
Ancillary Service certification Certification requirements will vary by utility or region Yes
Heat Rate Curve Ratio of Relative Heat Input plotted against Fraction of Full Load. May be modeled as a function of ambient temperature.
See Jorgenson et al., (2013), pg. 11
Regulation Range MW or % of rated capacity 60% - 100% of rated capacity
Cost of Providing Regulation Reserves $/MW-hr $4/MW-hr
Start-up Energy Energy for period of start-up 20% of rated output for 1 hour
Start-up Cost $ per start $10/MW/start
Variable O&M $/MWh $1.1/MWh
Average Storage Loss Rate % of energy sent to storage 2% (direct molten salt tower), 7% (indirect trough)
Maintenance Rate % 0%
Forced Outage Rate % of capacity/year 4%
Table 2-3: Key Operational Parameters for CSP plants
B E N E F I T S O F C S P W I T H T H E R M A L S T O R A G E
13
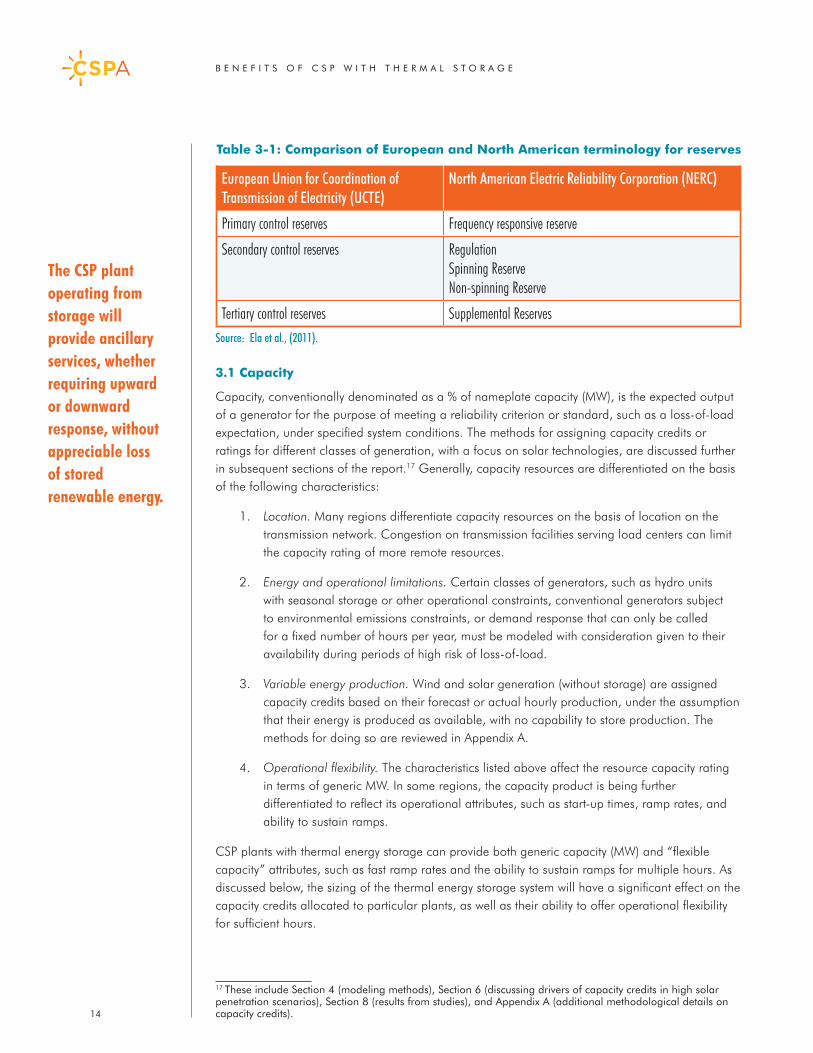
3. Utility or Market Services Offered by CSP with Thermal Energy Storage – and Comparison with PVWith the operational attributes listed in Section 2, CSP plants with thermal energy storage can, in principle, offer essentially all the electric power products and services provided by conventional, flexible thermal power plants. This section provides additional detail on how these operational attributes map into particular electric power products and services on different operational, scheduling and planning time-frames. This section, and the remainder of the report, primarily uses the U.S. terminology for these products, but there are relatively direct analogues with products in different countries. Table 3-1 provides a comparison of different terminology in the European and North American reliability organizations.16 Table 3-2 provides brief definitions and summary descriptions of the key products and services.
The section is organized as follows:
• Section 3.1 reviews definitions and characteristics of capacity resources.• Section 3.2 reviews definitions and characteristics of energy and ramping services.• Section 3.3 reviews ancillary services categorized as operating reserves.• Section 3.4 reviews other ancillary services, including those used for primary frequency
control and voltage support.• Section 3.5 discusses the potential advantages of larger solar plants for operator visibility
and control.
For each of these utility or market services, this section provides a basic comparison between CSP with thermal storage and PV. Improvements in inverter technology will allow PV systems to provide static and dynamic voltage support, synthetic inertial response, regulation, and active power management. CSP will provide these capabilities from a synchronous generator, which can in some cases provide qualitative differences in contribution to system reliability.
An important difference between CSP and PV is that the CSP plant operating from storage will provide ancillary services, whether requiring upward or downward response, without appreciable loss of stored renewable energy. In contrast, provision of ancillary services will require a solar plant without storage – CSP or PV – to curtail some energy production. Hence, especially for operating reserves, these plants are not likely to be major suppliers until either costs are reduced significantly or the cost of alternative supply increases (or both).
16 See Ela et al., (2011) for further terminology comparisons.
CSP with thermal energy storage can provide the full range of utility and/or market services in energy, ancillary services and capacity. Each of these capabilities needs to be defined and appropriately valued in solar procurement processes.
B E N E F I T S O F C S P W I T H T H E R M A L S T O R A G E
14
3.1 Capacity
Capacity, conventionally denominated as a % of nameplate capacity (MW), is the expected output of a generator for the purpose of meeting a reliability criterion or standard, such as a loss-of-load expectation, under specified system conditions. The methods for assigning capacity credits or ratings for different classes of generation, with a focus on solar technologies, are discussed further in subsequent sections of the report.17 Generally, capacity resources are differentiated on the basis of the following characteristics:
1. Location. Many regions differentiate capacity resources on the basis of location on the transmission network. Congestion on transmission facilities serving load centers can limit the capacity rating of more remote resources.
2. Energy and operational limitations. Certain classes of generators, such as hydro units with seasonal storage or other operational constraints, conventional generators subject to environmental emissions constraints, or demand response that can only be called for a fixed number of hours per year, must be modeled with consideration given to their availability during periods of high risk of loss-of-load.
3. Variable energy production. Wind and solar generation (without storage) are assigned capacity credits based on their forecast or actual hourly production, under the assumption that their energy is produced as available, with no capability to store production. The methods for doing so are reviewed in Appendix A.
4. Operational flexibility. The characteristics listed above affect the resource capacity rating in terms of generic MW. In some regions, the capacity product is being further differentiated to reflect its operational attributes, such as start-up times, ramp rates, and ability to sustain ramps.
CSP plants with thermal energy storage can provide both generic capacity (MW) and “flexible capacity” attributes, such as fast ramp rates and the ability to sustain ramps for multiple hours. As discussed below, the sizing of the thermal energy storage system will have a significant effect on the capacity credits allocated to particular plants, as well as their ability to offer operational flexibility for sufficient hours.
17 These include Section 4 (modeling methods), Section 6 (discussing drivers of capacity credits in high solar penetration scenarios), Section 8 (results from studies), and Appendix A (additional methodological details on capacity credits).
Table 3-1: Comparison of European and North American terminology for reserves
European Union for Coordination of Transmission of Electricity (UCTE)
North American Electric Reliability Corporation (NERC)
Primary control reserves Frequency responsive reserve
Secondary control reserves RegulationSpinning ReserveNon-spinning Reserve
Tertiary control reserves Supplemental ReservesSource: Ela et al., (2011).
The CSP plant operating from storage will provide ancillary services, whether requiring upward or downward response, without appreciable loss of stored renewable energy.
B E N E F I T S O F C S P W I T H T H E R M A L S T O R A G E
15
In contrast, both CSP and PV without storage are typically modeled as variable energy resources and assigned capacity credits on the basis of expected (forecast) production (both plant-level and aggregate variable solar generation) during hours of highest risk (see Section 8). On the other hand, in terms of locational attributes, PV can be located closer to load and hence be eligible as local capacity, whereas CSP plants are typically, but not necessarily, remote from load.
3.2 Energy and Ramping
For system operational purposes, energy delivery is defined as the injection of real energy (MWh) into the grid at a time and location, matched by the utility or system operator with a corresponding withdrawal at another location, with consideration of transmission congestion and losses. The energy product, at least in organized wholesale markets, is further defined by additional bid or cost components for start-up and minimum load on the generating units. More recently, there is additional emphasis on the operational characteristics of the units, such as ramp rates (MW/min), and new market products such as ramping reserves.
A further differentiating characteristic is whether resources are able to follow economic dispatch instructions, whether from a utility or through a bid-based wholesale auction market. The scheduling procedures to establish a “least-cost” unit commitment economic dispatch are typically conducted on day-ahead and real-time time-frames. In these time-frames, energy is either (a) scheduled inflexibly (self-scheduled) by the plant operator or utility owner, based on a known production schedule or a forecast, or (b) offered as dispatchable, which allows the plant’s production to be optimized to minimize system costs. In the day-ahead markets, accepted energy schedules or offers obtain an hourly schedule for the next operating day and are financially settled at day-ahead prices. In the real-time markets, the supplier may either operate according to the day-ahead schedule or buy-back some or all of the day-ahead position. Dispatchable energy offered into the real-time market generally has more explicit performance requirements and can be optimized on a five-minute basis by the market or system operator. The deviations from prior schedules being followed in real-time is sometimes called load-following, or “net” load following, when it also reflects deviations from variable energy resources.
Solar resources without storage are generally scheduled on a day-ahead and hour-ahead basis using production forecasts in those time-frames, and do not currently submit bids to alter their production. Due to its operational flexibility, CSP with thermal energy storage has the capability both to schedule energy in forward time-frames with significantly lower forecast error than other solar plants, as well as participate in real-time economic dispatch on a 5- to 15-minute basis. As surveyed below, most of the studies to date have modeled CSP with thermal storage on an hourly basis, although some have modeled capacity reserved on the plant to follow 5-minute dispatch.
Some system operators are preparing for increasing supply variability and forecast errors in real-time operations by procuring additional ramping reserves to augment load-following capabilities.18 There are also initiatives to procure “flexible capacity” in forward time-frames from resources that are capable of meeting inter-hourly ramping requirements, as discussed below. In real-time operations, a ramping reserve requires procuring additional capacity that can support real-time energy ramps. CSP with thermal energy storage could be operated to serve this function without significant loss of production. For solar resources without storage, bids to decrement production could also provide system ramping support, but would require loss of production.
18 See, for example, the discussions about the California ISO’s “flexi-ramp” product, available here: http://www.caiso.com/informed/Pages/StakeholderProcesses/FlexibleRampingProduct.aspx.
Due to its operational flexibility, CSP with thermal energy storage has the capability both to schedule energy in forward time-frames with significantly lower forecast error than other solar plants, as well as participate in real-time economic dispatch on a 5- to 15-minute basis.
B E N E F I T S O F C S P W I T H T H E R M A L S T O R A G E
16
3.3 Ancillary Services – Operating Reserves
One major category of ancillary services is the operating reserves, also grouped as secondary and tertiary reserves. These reserves have generally been fairly straightforward to organize wholesale markets around, because they can be provided by a wide range of supply and demand resources and are procured on a system or zonal basis. In practice, conventional thermal generators have provided the majority of these reserves to date, with other types of resources increasingly penetrating the markets.
Regulation
Frequency regulating reserves are carried by the system operator to balance the system on intervals of seconds in between the system operator’s or utility’s dispatch instructions. Frequency regulation – often simply called Regulation – requires generation or non-generation resources to be synchronized to the grid and responsive to automatic control signals (e.g., automatic generation control, or AGC) within a pre-determined regulating range that depends on the unit’s regulating ramp rate. The quantity procured is usually a function of measured or forecast deviations in particular time intervals by demand and supply, as well as by the need to meet applicable reliability standards for frequency control. In some U.S. markets, regulation is procured as a regulating range; in others, Regulation Up is procured separately from Regulation Down.
CSP with thermal storage can be certified to provide Regulation using the governor controls on the turbine, although there is no publicly available engineering analysis of the regulating ranges and durations that particular thermal energy storage designs could support. In most of the studies surveyed here that model CSP with storage providing Regulation (e.g., Denholm et al., 2013; Mills and Wiser, 2012b), there are simplifying assumptions about the operations of the plant, the capacity reserved for regulation, and the energy used in the process of providing Regulation. In particular, the studies to date assume that in each hour that the plants provide Regulation, the upward Regulation is provided in equal quantities to the downward Regulation, meaning that the plant would not draw additional energy from thermal storage for Regulation.19 Table 2-3 shows the regulating ranges tested in recent studies (Jorgenson et al., 2013).
For solar resources without storage, provision of Regulation would require some loss of energy production. CSP without storage can still provide Regulation using governor controls on the turbine, although with loss of production. PV can also provide Regulation through the design of DC-AC inverter controls with AGC-like functions, but similarly with curtailment of some energy production.
Contingency Reserves
Spinning and non-spinning reserves are ancillary services provided by generation or non-generation resources to meet system contingencies. System operators typically carry sufficient spinning reserves (i.e., from units synchronized to the grid) to cover the loss of the single largest generator or transmission facility on the grid, and sometimes an additional margin. In the United States, a unit’s eligible spinning reserve capacity is generally defined as the resource’s ramp rate
19 For example, if a 100 MW plant is operated at a dispatch set point of 80 MW, and provides a regulating range of 20 MW up and 20 MW down for a particular hour, then the net energy neutral assumption is that for half of the hour the plant is providing upwards Regulation and operating up to 100 MW, while the other half of the hour the plant is providing downwards Regulation and is operating down to 60 MW. The upwards and downwards control signals are assumed to cancel out over the time period. Hence, on average, the plant is producing at 80 MW. In actual operations, such symmetry may not be the case, although most system operators will operate regulating resources around a set point (as determined in each hour).
B E N E F I T S O F C S P W I T H T H E R M A L S T O R A G E
17
(MW/min) × 10 minutes, with the capability to provide energy for 1 hour in the event of a call on energy from spinning reserves. Non-spinning reserves have similar requirements, but are provided from units not synchronized to the grid. A unit’s eligible non-spinning reserve capacity is generally defined as the resource’s maximum energy production within 10 minutes of start-up and with the capability to sustain energy production for 1-2 hours in the event of a contingency. In current markets, non-spinning reserves are typically provided by quick-start generators, such as combustion turbines, but can also be provided by grid-synchronized generators that have surplus reserve capacity after the spinning reserve requirements been met.
CSP generators can provide spinning reserves from thermal energy storage by operating the plant below its maximum operating level with the potential to ramp the turbine to full output in response to the system operator’s instruction. The duration of the supply of spinning reserves is a function of the state of charge on the thermal energy storage system, since the stored thermal energy is being drawn down and, at least overnight, not being replenished. With respect to non-spinning reserves, most CSP generators cannot achieve a cold-start in 10 minutes from thermal energy storage but they could remain available for warm starts or possibly remain synchronized to cover a system’s non-spinning reserve requirement.
For solar technologies without storage, provision of contingency reserves will require holding back production, and hence losing energy.
Supplemental Reserves
Power system operators may carry additional, supplemental reserves on time-frames greater than 10 minutes, typically requiring full operations between 20-60 minutes. CSP with thermal energy storage would be eligible to provide such supplemental reserves.
3.4 Other Ancillary Services and Operational Requirements
In addition to the operating reserves, there are a number of other ancillary services and operating requirements for which CSP generators may provide valued capabilities, especially as penetration of variable energy resources increases. Some of these ancillary services are procured on a bilateral basis (rather than through centralized markets), or required under interconnection rules. These include frequency response, inertial response, and voltage support.
Frequency Response
Utility system frequency, the frequency of oscillations of alternating current (AC), is controlled second-by-second and is determined by the balance between system demand and total generation available on the grid. When the amount of electric power produced by the generators exceeds demand, the frequency of the electricity rises. Conversely, when electricity demand exceeds available generation output, the frequency drops, which can lead to grid instability and outages.
Generally speaking, grid operators are required to maintain frequency within specified limits for which they use controls available on primary, secondary and tertiary time-frames (see, e.g., Table 3-1). Primary frequency control, or frequency response, is provided by generators with inertia and responsive governors as well as by quick response storage and potentially demand response. Several European countries, including Spain, already carry frequency responsive reserve requirements. In the United States, FERC has recently approved the NERC BAL-003 standard (FERC 2014), which requires each Balancing Authority to meet a minimum Frequency Response Obligation (for a study of the California ISO system, see GE/CAISO 2011).
Due to fast ramp rates, CSP generators can provide a wide range of spinning reserves, similarly to a flexible fossil fuel plant but without causing emissions due to keeping the plant on-line.
B E N E F I T S O F C S P W I T H T H E R M A L S T O R A G E
18
Through inertia and the use of responsive governors, CSP with thermal energy storage has inherent capabilities to support frequency response and can be operated to provide frequency response reserves. For solar plants without storage, provision of frequency responsive reserves through governors (CSP) or inverter controls (PV) will require holding back some production, and hence losing some energy production.
Inertia Response
Inertia on the grid is created by the energy stored in the rotating mass of conventional power plants, or by synthetic inertia in inverter-based systems. It acts as a buffer for the initial seconds of a disturbance that helps suppress frequency deviations due to unplanned changes in the power system. Currently, inertia response is provided by synchronous generators because they and their attached turbines provide rotating mass. CSP plants without storage provide some inertia due to the characteristics of the power block, with the capability depending on their design. When thermal storage systems are added, they extend the number of hours that this capability is offered across the operating day.
Inverter based systems, whether wind or PV, have no rotating parts, hence do not have intrinsic inertia. These systems instead require changes to the software and electronics controlling the inverter to provide a synthetic inertia response, which has been demonstrated in wind plants, but is not yet commonly deployed.
Reactive Power and Voltage Support
In addition to real power (MW), power grids require reactive power (MVAR) from generators, synchronous condensers or capacitors. Reactive power is necessary to support and maintain operating voltage levels under normal and emergency conditions. Reactive voltage support is required to maintain power quality and to prevent voltage collapse, which can result in wide spread blackouts. Reactive power must be supplied locally, i.e., cannot be transmitted over long distances. In general, injecting reactive power into a transmission system will increase the voltage level near the point of injection and withdrawing it will decrease the voltage level. Because system operating conditions are constantly changing, the need for reactive power is also be constantly changing, requiring automatic adjustments to the reactive power supply at specific locations. Under some emergency conditions, i.e, when the system voltage begins to collapse, automatic increases in reactive power output are required to raise the voltage and prevent it from collapsing to the point of causing a blackout.20 Although market pricing of reactive power has been considered for several years in the U.S. (e.g., FERC 2005), this service remains an administrative requirement in U.S. regions. However, power generators are compensated when they are dispatched to particular operating points to provide reactive power. CSP plants with or without thermal storage will provide automatically adjustable reactive power to the system. Most PV systems are currently not designed to provide reactive power but could be configured to do so.
Static Voltage Control
Static voltage control is the ability to adjust reactive power to maintain a specified voltage profile, possibly in response to operator instructions, which can be dynamic depending on the loading conditions on transmission facilities in the grid. The term “static” represents a relatively slow time frame in power system operations which could span up to several minutes.
20 For example, one of the important lessons learned in the blackouts in the U.S. Western Electricity Coordinating Council (WECC) in July and August of 1996 was that operation of generation in a constant reactive power mode increased the risk of voltage collapse and, therefore, should be limited.
Most PV systems have not been designed to provide reactive power.
B E N E F I T S O F C S P W I T H T H E R M A L S T O R A G E
19
Synchronous generators on CSP plants provide static voltage control through the exciter/automatic voltage regulator control. When coupled with thermal storage systems, these plants can provide voltage control for longer periods of the operating day. For inverter-based systems, either the DC-AC inverter control of the PV generator must be designed to provide static voltage control or reactive devices such as capacitors/reactors can be installed on the grid to increase reactive power capability in the area. The costs of these investments for PV in $/MWh of solar energy are likely to be small relative to the total cost of renewable energy but worth considering in portfolio development.
Dynamic Voltage Control
During and after sudden changes in grid conditions, such as during a fault or following the outage of transmission facilities, fast and automatic reactive power support is crucial to reliable operation of the power system. Typically, this type of response (seconds or less) is provided by the exciter controls of synchronous generators.
For PV generators, this type of response can also be provided through the design and implementation of DC-AC inverter controls. Unlike static voltage control, less costly and simple additional reactive devices such as capacitors/reactors cannot be used to satisfy this need. Instead, more expensive and complicated devices for voltage control such as static VAR compensators (SVC) or static synchronous compensators (STATCOMs) are required. Moreover, even with such devices, control is still not as robust as that offered by a synchronous generator. For example, if a low-voltage situation is already established, such devices cannot output their rated reactive power, while a synchronous generator can meet the need (NERC 2009; FERC 2005). This low-voltage scenario is precisely when reactive power is most needed and this represents a shortcoming when adding voltage control devices to PV plants.
3.5 Visibility and Control
Visibility and control over system resources are operational needs that can affect ancillary service procurement and system operations. The trend in power systems towards large numbers of small, distributed renewable resources will eventually require additional investments in control systems and capabilities to visualize the effect of these resources on system operations (CAISO/KEMA, 2012). Large-scale CSP plants with thermal storage are fully visible to the system operator and can be engineered to provide a high degree of operational flexibility. Hence, such plants could provide the operators with a substitute for displaced large conventional power plants.
The trend in power systems towards many small distributed renewable resources will eventually necessitate investment in monitoring and control systems to reliably track and manage these resources.
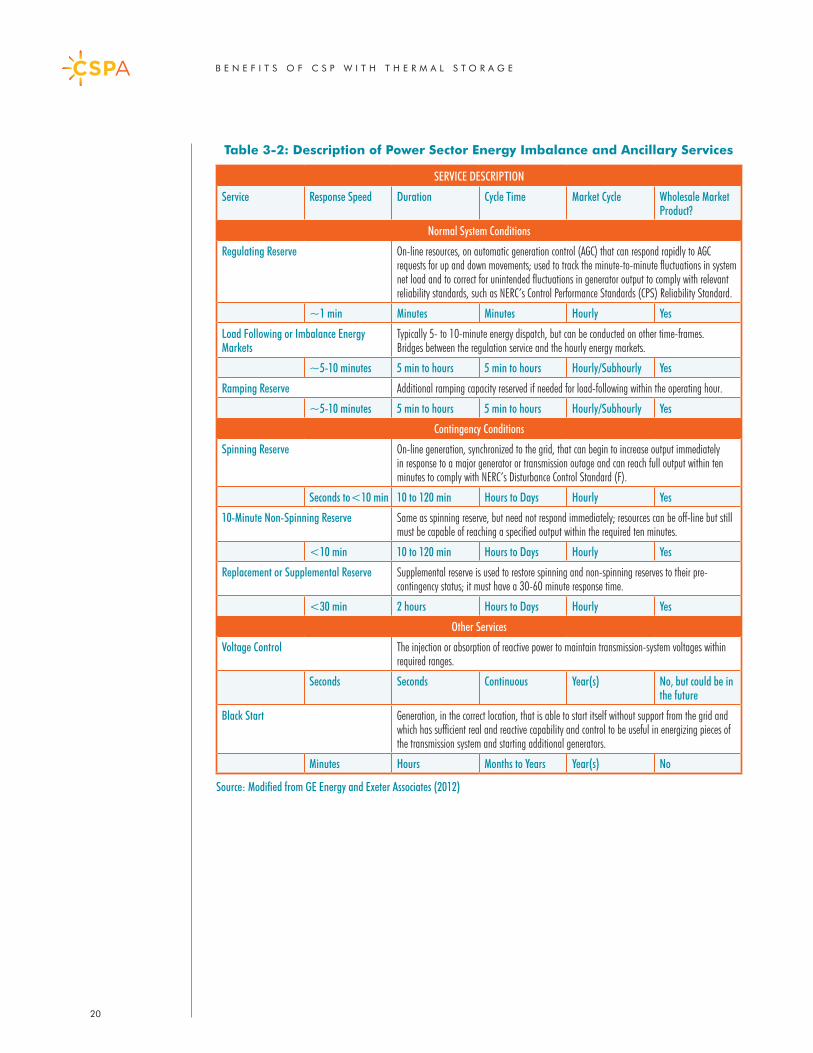
B E N E F I T S O F C S P W I T H T H E R M A L S T O R A G E
20
Table 3-2: Description of Power Sector Energy Imbalance and Ancillary Services
SERVICE DESCRIPTION
Service Response Speed Duration Cycle Time Market Cycle Wholesale Market Product?
Normal System Conditions
Regulating Reserve On-line resources, on automatic generation control (AGC) that can respond rapidly to AGC requests for up and down movements; used to track the minute-to-minute fluctuations in system net load and to correct for unintended fluctuations in generator output to comply with relevant reliability standards, such as NERC’s Control Performance Standards (CPS) Reliability Standard.
~1 min Minutes Minutes Hourly Yes
Load Following or Imbalance Energy Markets
Typically 5- to 10-minute energy dispatch, but can be conducted on other time-frames. Bridges between the regulation service and the hourly energy markets.
~5-10 minutes 5 min to hours 5 min to hours Hourly/Subhourly Yes
Ramping Reserve Additional ramping capacity reserved if needed for load-following within the operating hour.
~5-10 minutes 5 min to hours 5 min to hours Hourly/Subhourly Yes
Contingency Conditions
Spinning Reserve On-line generation, synchronized to the grid, that can begin to increase output immediately in response to a major generator or transmission outage and can reach full output within ten minutes to comply with NERC’s Disturbance Control Standard (F).
Seconds to <10 min 10 to 120 min Hours to Days Hourly Yes
10-Minute Non-Spinning Reserve Same as spinning reserve, but need not respond immediately; resources can be off-line but still must be capable of reaching a specified output within the required ten minutes.
<10 min 10 to 120 min Hours to Days Hourly Yes
Replacement or Supplemental Reserve Supplemental reserve is used to restore spinning and non-spinning reserves to their pre-contingency status; it must have a 30-60 minute response time.
<30 min 2 hours Hours to Days Hourly Yes
Other Services
Voltage Control The injection or absorption of reactive power to maintain transmission-system voltages within required ranges.
Seconds Seconds Continuous Year(s) No, but could be in the future
Black Start Generation, in the correct location, that is able to start itself without support from the grid and which has sufficient real and reactive capability and control to be useful in energizing pieces of the transmission system and starting additional generators.
Minutes Hours Months to Years Year(s) No
Source: Modified from GE Energy and Exeter Associates (2012)
B E N E F I T S O F C S P W I T H T H E R M A L S T O R A G E
21
4. Valuation of Renewable Resources – Definition of Net System Cost and Quantitative Methods To date, CSP with thermal energy storage has not been valued accurately in renewable energy procurement. This is due to several factors. First, the operational attributes of CSP with thermal storage are not yet sufficiently well-defined and; even in locations where such plants currently operating, there is little experience with dispatching them. The CSP industry anticipates that this will change with the commercial operations of new CSP plants with thermal storage in the western United States that are designed for increased operational flexibility. In tandem, there should be an effort by the U.S. Department of Energy (DOE) and its national laboratories working with industry to collect and analyze data from operating plants to address this issue.
Second, there hasn’t been sufficient experience with the integration of solar power on a large-scale in power systems, and as such, utility procurement has not yet fully incorporated the findings of the solar valuation studies and other integration analyses discussed in this report. The issues are complex and decision-makers often need guidance when interpreting the methodologies and results of valuation studies. The U.S. DOE and its national laboratories have provided much of the preliminary research on the benefits of different configurations of CSP, and their sustained engagement is needed as power system conditions continue to change.
Finally, as the power system continues to evolve, many utilities and regional power systems have not yet determined the mix of infrastructure that the future grid will require. Most notably, this includes the quantity and characteristics of flexible, dispatchable generation, storage or demand response to support integration of variable energy resources at higher penetration. The attributes of CSP with thermal energy storage can meet many of the operating requirements forecast to be needed, providing support for even higher levels of integration of variable wind and solar resources (e.g., Denholm and Mehos, 2011; NREL 2012). Recent studies have attempted to demonstrate these capabilities with models similar to those used in utility procurement decisions (e.g., Denholm et al., 2013), and these types of modeling applications are also needed in portfolio planning methods (Mills and Wiser, 2012b).
To assist this comparison of valuation methodologies, this section of the report provides definitions and background on renewable energy valuation with the focus on issues arising in the valuation of CSP with thermal energy storage. The section is organized as follows:
• Section 4.1 reviews utility valuation and the components of “net system cost”.• Section 4.2 summarizes the modeling tools and methods typically used to calculate
components of net system cost, with reference to the studies surveyed in this report. • Section 4.3 explains further how utilities and regulators will use the information from
cost-benefit analysis in procurement and planning. • Section 4.4 reviews some methods for constructing portfolios and measuring the model
results, again with reference to the studies surveyed.
To fully capture the long-term benefits of CSP with thermal storage, stakeholders should adapt and extend existing quantitative methods to comprehensively analyze each renewable resource’s “net system cost”.
B E N E F I T S O F C S P W I T H T H E R M A L S T O R A G E
22
This report does not attempt to describe in detail the different types of policy, planning and procurement processes and valuation methods used in the CSP markets around the world. For interested readers, Mills and Wiser (2012a) provide a useful survey of solar valuation methods used in utility procurement in the western U.S. markets. Readers familiar with these topics can move to the next sections.
4.1 Utility Valuation and Net System Cost
As part of the planning and procurement processes arising from renewable policies, utilities or other decision-makers use variants on cost-benefit analyses, along with other assessments, to evaluate the types and locations of renewable resources. The calculation of “net cost” or “net system cost” is a central element in such analysis for purposes of ranking alternative projects. The basic equation is as follows:
Net Cost = Levelized Cost of Energy (or bid cost) + Transmission Cost + Integration Cost – Energy Benefits – Ancillary Service Benefits – Capacity Benefits
For renewable technology projects, the levelized cost of energy (LCOE) or a project bid cost is used on the cost side of the equation, along with any other infrastructure and integration costs.21 For variable wind and solar resources, the major elements on the benefits side of the equation are the energy and capacity costs avoided by the project. As CSP with thermal storage enters the renewable markets, the calculation has to be expanded to capture the additional operational attributes offered by the plant, such as the capability to optimize provision of energy and ancillary services, as well as the costs created by other renewable resources that may not be incurred with a CSP plant, such as integration and curtailment costs.
As the studies reviewed in this report have shown, for any particular power system, these costs and benefits are functions of renewable penetration levels and the composition of renewable resource portfolios. The net system costs of incremental project additions to existing resource portfolios, or to future portfolios, are significantly more complicated calculations. These require the detailed simulations of power systems surveyed in this report.
While the report does not evaluate trends in the LCOE of alternative solar technologies, curtailment of production from variable solar resources under high solar penetration scenarios will obviously affect project costs as well as benefits, by reducing the denominator (MWh) in the equation. Hence, it could further affect comparative net system costs of alternative solar projects.
CSP with storage is one solution to the operational and reliability requirements of future power systems. There are a range of other operational solutions to the supply variability introduced by rapidly expanding wind and solar production (e.g., NREL 2012). These include the following:
• More flexible existing (through retrofits) and planned conventional generation, including quick start-up times, lower minimum operating levels, and fast ramp capabilities.
• Institutional and regulatory changes to expand markets for energy balancing and operating reserves (e.g., through the development of a regional market for imbalance energy in the western U.S.).
21 As a generic measurement, the LCOE does not consider when during the operating day the energy is delivered, the capacity value of the plant, nor whether the renewable plant can offer any other operational attributes such as ramping reserves or ancillary services. Hence, the LCOE is widely recognized to be of limited value for long-term renewable planning and procurement purposes, particularly at higher penetrations of renewable energy (Mills and Wiser, 2012b; Joskow 2010).
CSP with thermal storage is one of a range of operational solutions to address the supply variability introduced by rapidly expanding wind and PV production.
B E N E F I T S O F C S P W I T H T H E R M A L S T O R A G E
23
• Modifications of future renewable resource additions to minimize the net load variability and other system impacts, such as surplus generation that could lead to curtailment.
• Increased participation by renewable generation in providing ancillary services and ramping reserves.
• Additional non-generation resources, including distributed and utility-scale storage capacity and demand response.
While this report does not review all of these alternatives, thermal energy storage additions to CSP plants are potentially among the lowest-cost energy storage solutions (Turchi et al., 2010). They have the further advantage that they are charged with solar energy and hence all production is fully eligible for renewable energy credits.
4.2 Quantitative Methods for Economic Valuation
Modeling the economic and reliability benefits of CSP with thermal energy storage has required the development of new analytical methods linking together inputs from models on operational, market, capacity and planning time-frames. This section briefly reviews the types of models and particular extensions needed for modeling CSP with storage. Power system models represent the supply, demand, storage and the transmission network at different levels of spatial and temporal aggregation. They are reviewed below roughly in order of the time-steps modeled, ranging from seconds (primary frequency control), to minutes and hours (system and market operations), to months and years (capacity), to multiple years (planning). Table 4-1 then surveys which methods are used in the studies referenced in this survey.
Power system sub-hourly operational models
Variable wind and solar production affects system operations on time-steps of seconds and minutes, requiring new statistical models that measure the interaction of production variability and forecast errors on system requirements for primary and secondary frequency control (e.g., CAISO 2010; Ibanez et al., 2012). These requirements can be aggregated into hourly reserve capacities as inputs to the power system dispatch models described next, which allow economic analysis over periods of months, years or multiple years (e.g., Denholm et al., 2013). Alternatively, models have been implemented that can simulate resource operations on time-frames of seconds and minutes to maintain system frequency, but which are usually used to evaluate particular hours or days (e.g., KEMA 2010). Both types of models have been extended to include CSP with thermal energy storage.
Power system dispatch models
Power system unit commitment and dispatch models simulate the commitment (start or stop) and dispatch of generation and non-generation resources on time-frames of minutes to hours, although hourly models currently predominate. There are many variants on such models, including those utilizing commercial software (such as Plexos and Gridview) that has been used in several of the studies reviewed here, as well as models developed for research (e.g., the models in Mills and Wiser, 2012b). In addition, there are the actual, highly detailed models used by utilities and system operators for market and system operations, which incorporate significant additional detail on resource and transmission constraints.
Dispatch models are used to evaluate operational changes on the power system due to renewable penetration, and calculate the resulting changes in production costs or simulated market prices. For studies that model production costs, the typical measurement in the studies reviewed here (e.g., Denholm et al., 2013) is to calculate the change in production costs between different scenarios with either different portfolios or different technologies added incrementally to the same
Thermal energy storage additions to CSP plants are potentially among the lowest-cost energy storage solutions.
Power system models represent the supply, demand, storage and the transmission network at different levels of spatial and temporal aggregation.
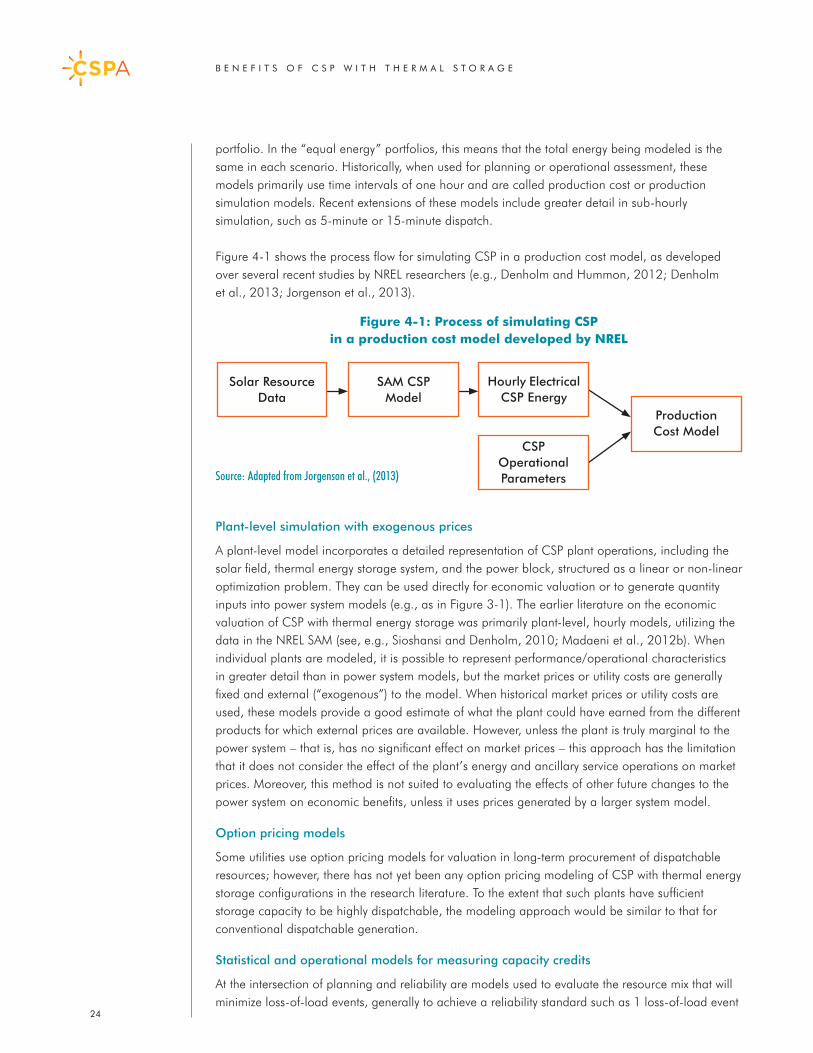
B E N E F I T S O F C S P W I T H T H E R M A L S T O R A G E
24
portfolio. In the “equal energy” portfolios, this means that the total energy being modeled is the same in each scenario. Historically, when used for planning or operational assessment, these models primarily use time intervals of one hour and are called production cost or production simulation models. Recent extensions of these models include greater detail in sub-hourly simulation, such as 5-minute or 15-minute dispatch.
Figure 4-1 shows the process flow for simulating CSP in a production cost model, as developed over several recent studies by NREL researchers (e.g., Denholm and Hummon, 2012; Denholm et al., 2013; Jorgenson et al., 2013).
Figure 4-1: Process of simulating CSP in a production cost model developed by NREL
Source: Adapted from Jorgenson et al., (2013)
Plant-level simulation with exogenous prices
A plant-level model incorporates a detailed representation of CSP plant operations, including the solar field, thermal energy storage system, and the power block, structured as a linear or non-linear optimization problem. They can be used directly for economic valuation or to generate quantity inputs into power system models (e.g., as in Figure 3-1). The earlier literature on the economic valuation of CSP with thermal energy storage was primarily plant-level, hourly models, utilizing the data in the NREL SAM (see, e.g., Sioshansi and Denholm, 2010; Madaeni et al., 2012b). When individual plants are modeled, it is possible to represent performance/operational characteristics in greater detail than in power system models, but the market prices or utility costs are generally fixed and external (“exogenous”) to the model. When historical market prices or utility costs are used, these models provide a good estimate of what the plant could have earned from the different products for which external prices are available. However, unless the plant is truly marginal to the power system – that is, has no significant effect on market prices – this approach has the limitation that it does not consider the effect of the plant’s energy and ancillary service operations on market prices. Moreover, this method is not suited to evaluating the effects of other future changes to the power system on economic benefits, unless it uses prices generated by a larger system model.
Option pricing models
Some utilities use option pricing models for valuation in long-term procurement of dispatchable resources; however, there has not yet been any option pricing modeling of CSP with thermal energy storage configurations in the research literature. To the extent that such plants have sufficient storage capacity to be highly dispatchable, the modeling approach would be similar to that for conventional dispatchable generation.
Statistical and operational models for measuring capacity credits
At the intersection of planning and reliability are models used to evaluate the resource mix that will minimize loss-of-load events, generally to achieve a reliability standard such as 1 loss-of-load event
ProductionCost Model
CSP OperationalParameters
Solar ResourceData
SAM CSPModel
Hourly ElectricalCSP Energy
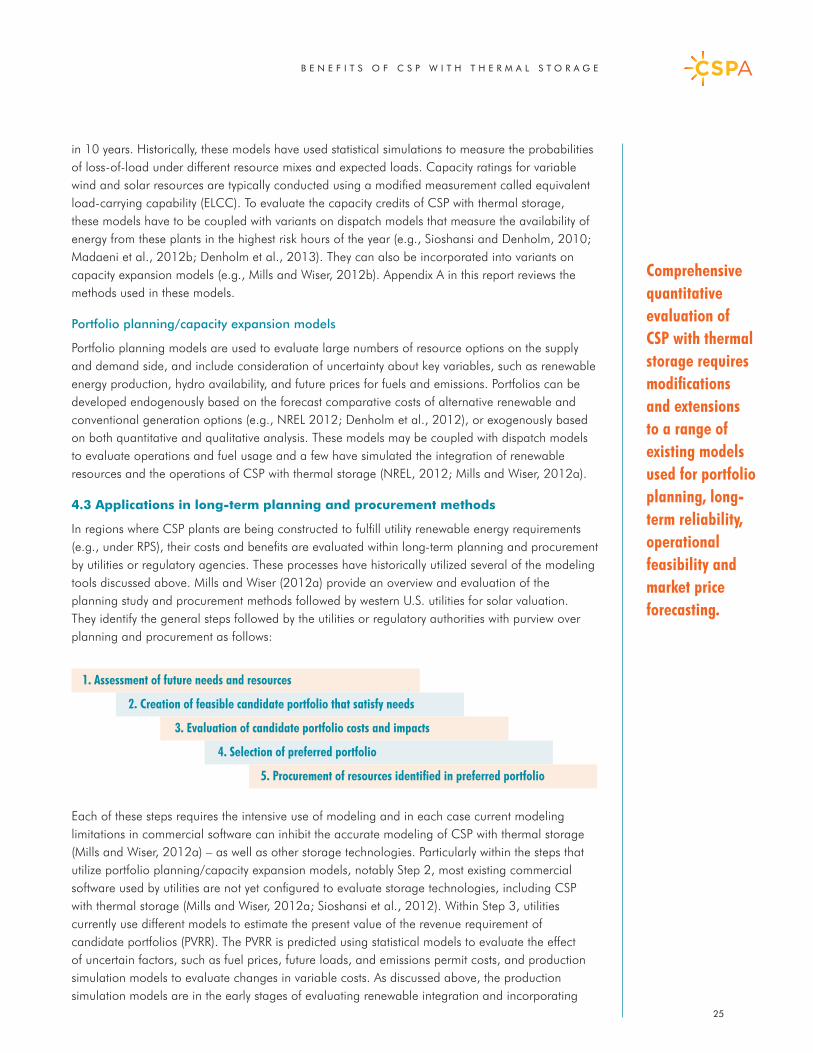
B E N E F I T S O F C S P W I T H T H E R M A L S T O R A G E
25
in 10 years. Historically, these models have used statistical simulations to measure the probabilities of loss-of-load under different resource mixes and expected loads. Capacity ratings for variable wind and solar resources are typically conducted using a modified measurement called equivalent load-carrying capability (ELCC). To evaluate the capacity credits of CSP with thermal storage, these models have to be coupled with variants on dispatch models that measure the availability of energy from these plants in the highest risk hours of the year (e.g., Sioshansi and Denholm, 2010; Madaeni et al., 2012b; Denholm et al., 2013). They can also be incorporated into variants on capacity expansion models (e.g., Mills and Wiser, 2012b). Appendix A in this report reviews the methods used in these models.
Portfolio planning/capacity expansion models
Portfolio planning models are used to evaluate large numbers of resource options on the supply and demand side, and include consideration of uncertainty about key variables, such as renewable energy production, hydro availability, and future prices for fuels and emissions. Portfolios can be developed endogenously based on the forecast comparative costs of alternative renewable and conventional generation options (e.g., NREL 2012; Denholm et al., 2012), or exogenously based on both quantitative and qualitative analysis. These models may be coupled with dispatch models to evaluate operations and fuel usage and a few have simulated the integration of renewable resources and the operations of CSP with thermal storage (NREL, 2012; Mills and Wiser, 2012a).
4.3 Applications in long-term planning and procurement methods
In regions where CSP plants are being constructed to fulfill utility renewable energy requirements (e.g., under RPS), their costs and benefits are evaluated within long-term planning and procurement by utilities or regulatory agencies. These processes have historically utilized several of the modeling tools discussed above. Mills and Wiser (2012a) provide an overview and evaluation of the planning study and procurement methods followed by western U.S. utilities for solar valuation. They identify the general steps followed by the utilities or regulatory authorities with purview over planning and procurement as follows:
Each of these steps requires the intensive use of modeling and in each case current modeling limitations in commercial software can inhibit the accurate modeling of CSP with thermal storage (Mills and Wiser, 2012a) – as well as other storage technologies. Particularly within the steps that utilize portfolio planning/capacity expansion models, notably Step 2, most existing commercial software used by utilities are not yet configured to evaluate storage technologies, including CSP with thermal storage (Mills and Wiser, 2012a; Sioshansi et al., 2012). Within Step 3, utilities currently use different models to estimate the present value of the revenue requirement of candidate portfolios (PVRR). The PVRR is predicted using statistical models to evaluate the effect of uncertain factors, such as fuel prices, future loads, and emissions permit costs, and production simulation models to evaluate changes in variable costs. As discussed above, the production simulation models are in the early stages of evaluating renewable integration and incorporating
1. Assessment of future needs and resources
2. Creation of feasible candidate portfolio that satisfy needs
3. Evaluation of candidate portfolio costs and impacts
4. Selection of preferred portfolio
5. Procurement of resources identified in preferred portfolio
Comprehensive quantitative evaluation of CSP with thermal storage requires modifications and extensions to a range of existing models used for portfolio planning, long-term reliability, operational feasibility and market price forecasting.
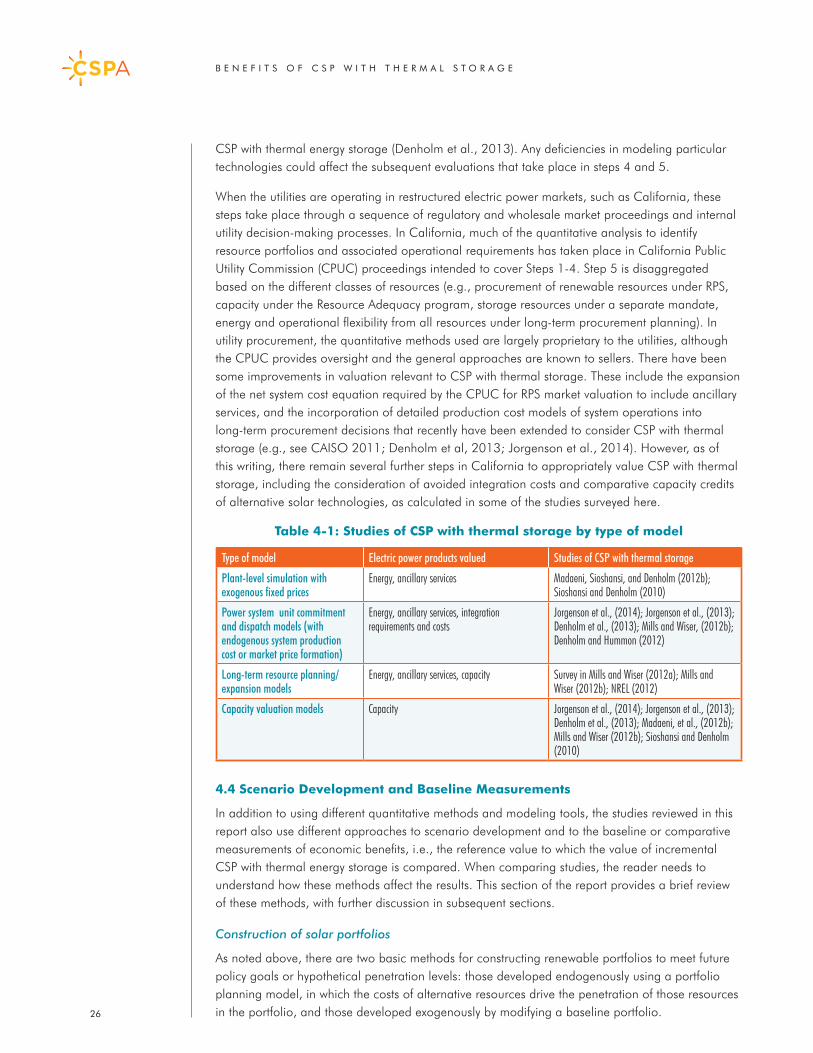
B E N E F I T S O F C S P W I T H T H E R M A L S T O R A G E
26
CSP with thermal energy storage (Denholm et al., 2013). Any deficiencies in modeling particular technologies could affect the subsequent evaluations that take place in steps 4 and 5.
When the utilities are operating in restructured electric power markets, such as California, these steps take place through a sequence of regulatory and wholesale market proceedings and internal utility decision-making processes. In California, much of the quantitative analysis to identify resource portfolios and associated operational requirements has taken place in California Public Utility Commission (CPUC) proceedings intended to cover Steps 1-4. Step 5 is disaggregated based on the different classes of resources (e.g., procurement of renewable resources under RPS, capacity under the Resource Adequacy program, storage resources under a separate mandate, energy and operational flexibility from all resources under long-term procurement planning). In utility procurement, the quantitative methods used are largely proprietary to the utilities, although the CPUC provides oversight and the general approaches are known to sellers. There have been some improvements in valuation relevant to CSP with thermal storage. These include the expansion of the net system cost equation required by the CPUC for RPS market valuation to include ancillary services, and the incorporation of detailed production cost models of system operations into long-term procurement decisions that recently have been extended to consider CSP with thermal storage (e.g., see CAISO 2011; Denholm et al, 2013; Jorgenson et al., 2014). However, as of this writing, there remain several further steps in California to appropriately value CSP with thermal storage, including the consideration of avoided integration costs and comparative capacity credits of alternative solar technologies, as calculated in some of the studies surveyed here.
Table 4-1: Studies of CSP with thermal storage by type of model
4.4 Scenario Development and Baseline Measurements
In addition to using different quantitative methods and modeling tools, the studies reviewed in this report also use different approaches to scenario development and to the baseline or comparative measurements of economic benefits, i.e., the reference value to which the value of incremental CSP with thermal energy storage is compared. When comparing studies, the reader needs to understand how these methods affect the results. This section of the report provides a brief review of these methods, with further discussion in subsequent sections.
Construction of solar portfolios
As noted above, there are two basic methods for constructing renewable portfolios to meet future policy goals or hypothetical penetration levels: those developed endogenously using a portfolio planning model, in which the costs of alternative resources drive the penetration of those resources in the portfolio, and those developed exogenously by modifying a baseline portfolio.
Type of model Electric power products valued Studies of CSP with thermal storage
Plant-level simulation with exogenous fixed prices
Energy, ancillary services Madaeni, Sioshansi, and Denholm (2012b); Sioshansi and Denholm (2010)
Power system unit commitment and dispatch models (with endogenous system production cost or market price formation)
Energy, ancillary services, integration requirements and costs
Jorgenson et al., (2014); Jorgenson et al., (2013); Denholm et al., (2013); Mills and Wiser, (2012b); Denholm and Hummon (2012)
Long-term resource planning/expansion models
Energy, ancillary services, capacity Survey in Mills and Wiser (2012a); Mills and Wiser (2012b); NREL (2012)
Capacity valuation models Capacity Jorgenson et al., (2014); Jorgenson et al., (2013); Denholm et al., (2013); Madaeni, et al., (2012b); Mills and Wiser (2012b); Sioshansi and Denholm (2010)
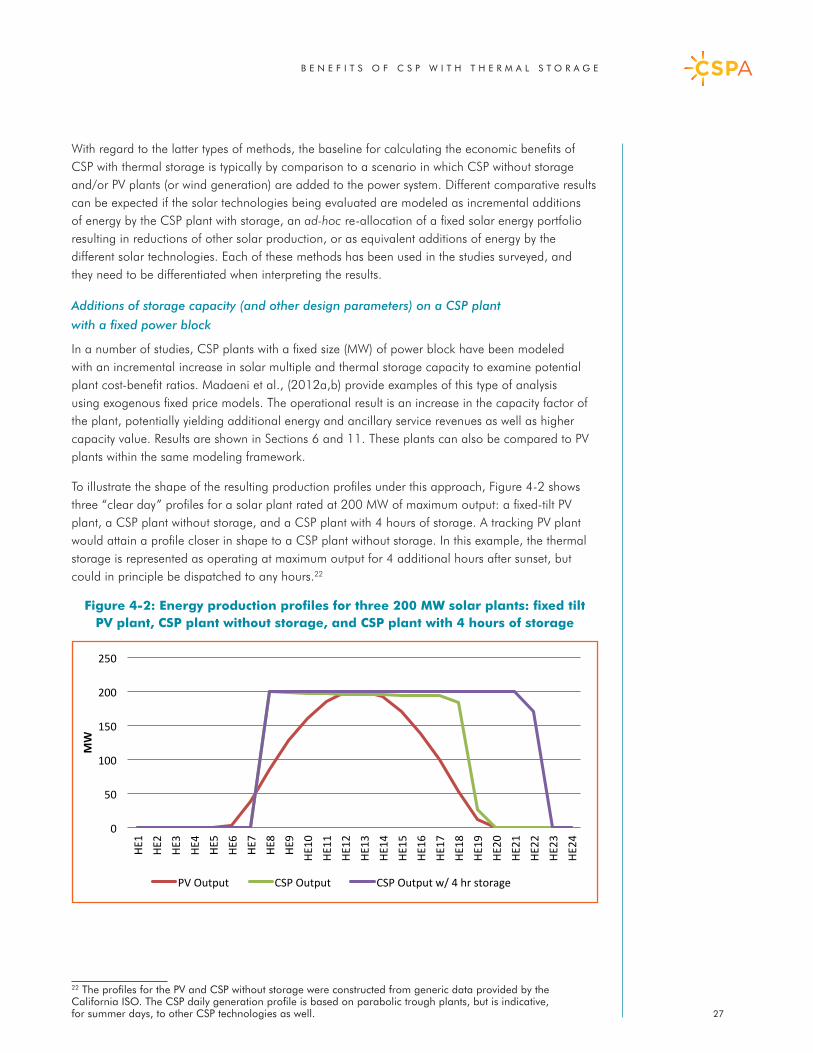
B E N E F I T S O F C S P W I T H T H E R M A L S T O R A G E
27
With regard to the latter types of methods, the baseline for calculating the economic benefits of CSP with thermal storage is typically by comparison to a scenario in which CSP without storage and/or PV plants (or wind generation) are added to the power system. Different comparative results can be expected if the solar technologies being evaluated are modeled as incremental additions of energy by the CSP plant with storage, an ad-hoc re-allocation of a fixed solar energy portfolio resulting in reductions of other solar production, or as equivalent additions of energy by the different solar technologies. Each of these methods has been used in the studies surveyed, and they need to be differentiated when interpreting the results.
Additions of storage capacity (and other design parameters) on a CSP plant
with a fixed power block
In a number of studies, CSP plants with a fixed size (MW) of power block have been modeled with an incremental increase in solar multiple and thermal storage capacity to examine potential plant cost-benefit ratios. Madaeni et al., (2012a,b) provide examples of this type of analysis using exogenous fixed price models. The operational result is an increase in the capacity factor of the plant, potentially yielding additional energy and ancillary service revenues as well as higher capacity value. Results are shown in Sections 6 and 11. These plants can also be compared to PV plants within the same modeling framework.
To illustrate the shape of the resulting production profiles under this approach, Figure 4-2 shows three “clear day” profiles for a solar plant rated at 200 MW of maximum output: a fixed-tilt PV plant, a CSP plant without storage, and a CSP plant with 4 hours of storage. A tracking PV plant would attain a profile closer in shape to a CSP plant without storage. In this example, the thermal storage is represented as operating at maximum output for 4 additional hours after sunset, but could in principle be dispatched to any hours.22
Figure 4-2: Energy production profiles for three 200 MW solar plants: fixed tilt PV plant, CSP plant without storage, and CSP plant with 4 hours of storage
22 The profiles for the PV and CSP without storage were constructed from generic data provided by the California ISO. The CSP daily generation profile is based on parabolic trough plants, but is indicative, for summer days, to other CSP technologies as well.
0
50
100
150
200
250
HE1
HE2
HE3
HE4
HE5
HE6
HE7
HE8
HE9
HE10
HE11
HE12
HE13
HE14
HE15
HE16
HE17
HE18
HE19
HE20
HE21
HE22
HE23
HE24
MW
PV Output CSP Output CSP Output w/ 4 hr storage
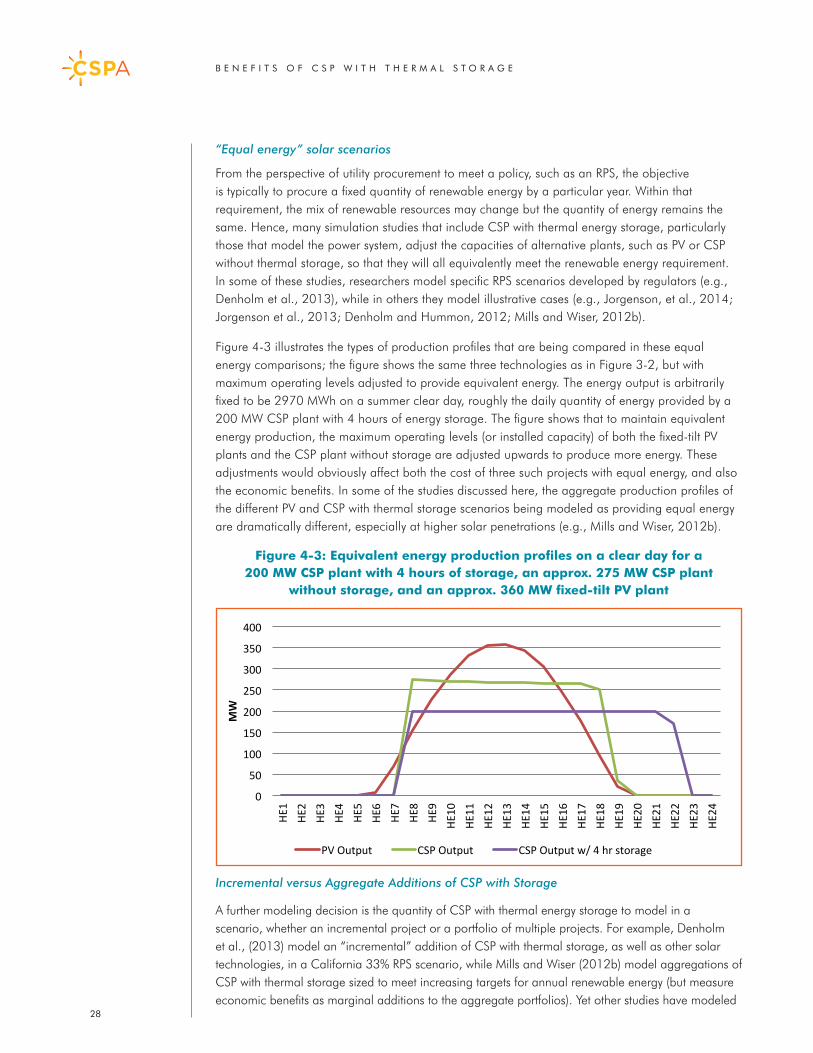
B E N E F I T S O F C S P W I T H T H E R M A L S T O R A G E
28
0
50
100
150
200
250
300
350
400
HE1
HE2
HE3
HE4
HE5
HE6
HE7
HE8
HE9
HE10
HE11
HE12
HE13
HE14
HE15
HE16
HE17
HE18
HE19
HE20
HE21
HE22
HE23
HE24
MW
PV Output CSP Output CSP Output w/ 4 hr storage
“Equal energy” solar scenarios
From the perspective of utility procurement to meet a policy, such as an RPS, the objective is typically to procure a fixed quantity of renewable energy by a particular year. Within that requirement, the mix of renewable resources may change but the quantity of energy remains the same. Hence, many simulation studies that include CSP with thermal energy storage, particularly those that model the power system, adjust the capacities of alternative plants, such as PV or CSP without thermal storage, so that they will all equivalently meet the renewable energy requirement. In some of these studies, researchers model specific RPS scenarios developed by regulators (e.g., Denholm et al., 2013), while in others they model illustrative cases (e.g., Jorgenson, et al., 2014; Jorgenson et al., 2013; Denholm and Hummon, 2012; Mills and Wiser, 2012b).
Figure 4-3 illustrates the types of production profiles that are being compared in these equal energy comparisons; the figure shows the same three technologies as in Figure 3-2, but with maximum operating levels adjusted to provide equivalent energy. The energy output is arbitrarily fixed to be 2970 MWh on a summer clear day, roughly the daily quantity of energy provided by a 200 MW CSP plant with 4 hours of energy storage. The figure shows that to maintain equivalent energy production, the maximum operating levels (or installed capacity) of both the fixed-tilt PV plants and the CSP plant without storage are adjusted upwards to produce more energy. These adjustments would obviously affect both the cost of three such projects with equal energy, and also the economic benefits. In some of the studies discussed here, the aggregate production profiles of the different PV and CSP with thermal storage scenarios being modeled as providing equal energy are dramatically different, especially at higher solar penetrations (e.g., Mills and Wiser, 2012b).
Figure 4-3: Equivalent energy production profiles on a clear day for a 200 MW CSP plant with 4 hours of storage, an approx. 275 MW CSP plant
without storage, and an approx. 360 MW fixed-tilt PV plant
Incremental versus Aggregate Additions of CSP with Storage
A further modeling decision is the quantity of CSP with thermal energy storage to model in a scenario, whether an incremental project or a portfolio of multiple projects. For example, Denholm et al., (2013) model an “incremental” addition of CSP with thermal storage, as well as other solar technologies, in a California 33% RPS scenario, while Mills and Wiser (2012b) model aggregations of CSP with thermal storage sized to meet increasing targets for annual renewable energy (but measure economic benefits as marginal additions to the aggregate portfolios). Yet other studies have modeled
B E N E F I T S O F C S P W I T H T H E R M A L S T O R A G E
29
somewhat arbitrary portfolios intended to demonstrate operational effects at higher penetrations. For example, Denholm and Mehos (2011) construct two high-penetration solar scenarios for California designed to show the potential for dispatchable CSP to support integration of an aggregate solar portfolio (in which PV is being increasingly curtailed due to over-generation conditions).
Other Benchmarks
Flat block. A further comparative measurement conducted in several studies is the use of a “flat block” of (hypothetical) non-dispatchable, zero-cost “renewable” energy, as an alternative to the incremental wind and/or solar project. The flat block is intended as a proxy for a baseload energy resource with no fuel costs – such as a nuclear plant, a geothermal plant or a CSP plant with sufficient storage capacity such that it could operate 24 hours – and which would not create integration requirements associated with variable energy production (Milligan et al., 2011).23 Mills and Wiser (2012b), Denholm and Hummon (2012) and Denholm et al., (2013) all include the modeling of a substitute flat block when valuing CSP with thermal energy storage, as well as the other solar and wind technologies which they evaluate. Although the results are not reviewed in this report, the valuation of the flat block could be of interest when considering CSP with high levels of storage capacity (i.e., operated as baseload).
“No renewables” scenario. Because the flat block does not provide any operational capabilities itself and reduces production costs due to its zero fuel costs, another baseline measurement is a scenario in which future load is served by the lowest cost, dispatchable, non-renewable resources. For example, CAISO (2011) includes a scenario for an “all gas” case in 2020 that includes only existing renewable resources on the California grid in 2011 and fills all future requirements with additional gas plants (a mix of combined cycle and combustion turbines). This scenario provides a more accurate baseline for measuring total changes in production costs and operational requirements than does a flat block. Similarly, Mills and Wiser (2012b) model a 2030 California scenario with no penetration of the renewable resources for the California grid with the exception of an incremental wind and solar plant of each type. The Mills and Wiser approach is somewhat artificial given the presence of existing renewables on the California grid. However, it is useful for showing how changes in the penetration of renewables on the grid progressively affect each component of economic benefits.
4.5 Low versus High Penetration Scenarios
For purposes of this survey, there are certain inflection points in the economic benefits and integration costs that take place as a function of renewable penetration, and some specific to solar penetration. For that purpose, the discussion of results is organized in some sections by the penetration level being modeled. “Low renewables” scenarios are defined as cases where renewables account for less than 15% of annual energy production. “High renewables” scenarios are cases where renewables account for greater than 15% of annual energy production. This is a somewhat arbitrary dividing line for discussion purposes, and is not intended to imply that key changes in benefits necessarily take place around that point. Section 6 provides more details on the composition and characteristics of high penetration scenarios.
23 However, as Milligan et al., (2011) note, and as shown in the studies reviewed here, the flat block also has significantly different hourly energy (and capacity) value than wind and non-dispatchable solar, and hence will distort the valuation of the integration component when total net system costs are being compared. They observe that there are some partial corrective measures that could be taken, such as “shaping” the flat block on a daily basis, including to reflect peak and off-peak periods with ramps, but consider these “not entirely satisfactory.” If the primary objective of the flat block is to isolate the incremental integration cost component for the variable energy resources, there are other methods discussed in Section 8 below that are more accurate.
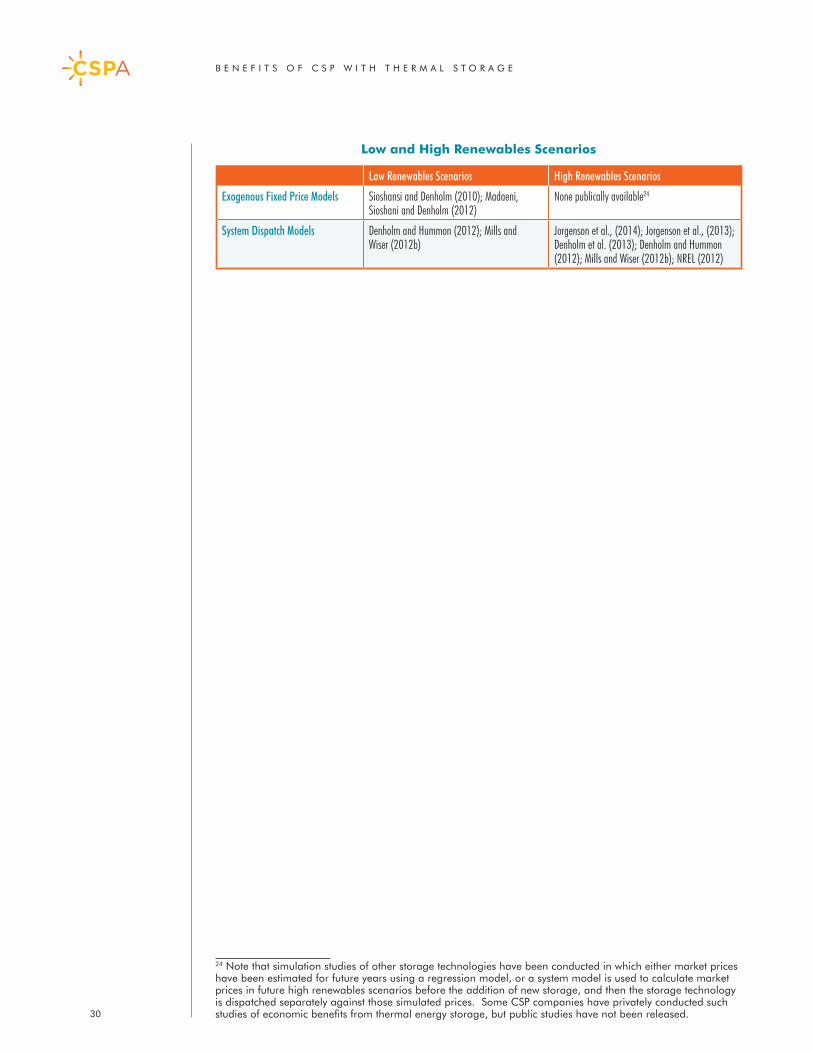
B E N E F I T S O F C S P W I T H T H E R M A L S T O R A G E
30
Low and High Renewables Scenarios
Low Renewables Scenarios High Renewables Scenarios
Exogenous Fixed Price Models Sioshansi and Denholm (2010); Madaeni, Sioshani and Denholm (2012)
None publically available24
System Dispatch Models Denholm and Hummon (2012); Mills and Wiser (2012b)
Jorgenson et al., (2014); Jorgenson et al., (2013); Denholm et al. (2013); Denholm and Hummon (2012); Mills and Wiser (2012b); NREL (2012)
24 Note that simulation studies of other storage technologies have been conducted in which either market prices have been estimated for future years using a regression model, or a system model is used to calculate market prices in future high renewables scenarios before the addition of new storage, and then the storage technology is dispatched separately against those simulated prices. Some CSP companies have privately conducted such studies of economic benefits from thermal energy storage, but public studies have not been released.
B E N E F I T S O F C S P W I T H T H E R M A L S T O R A G E
31
5. Valuation of Renewable Resources – Implication of Regulatory and Market Regimes CSP with thermal energy storage has potential applications in many countries and regions of the world that have different market structures and regulatory regimes. Along with conventional project development assessments, these institutional differences must be considered when valuing CSP with thermal energy storage in particular regions. This section is organized as follows:
• Section 5.1 discusses the alternative institutional structures for the power sector which may affect valuation methods.
• Section 5.2 reviews valuation in U.S. markets.• Section 5.3 reviews valuation outside the United States.
Tables 5-1 to 5-3 at the end of this section briefly summarize institutional structures for the power sector, trends in electric power demand and supply, renewable energy policies, and other CSP-specific market drivers (measurements of direct normal insolation, availability of transmission to those locations) for the primary CSP markets around the world. There is also a list of references for the tables in the References section at the end of the report.
5.1 Institutional structures for the power sector
There are two basic institutional structures for the power sector globally: competitive wholesale power markets and vertically-integrated, state- or privately-owned utilities. In countries or regions with competitive power markets,25 the incumbent electric utilities have typically divested most or all of their generation capacity. There may also be competition for retail load. The generation investments are privately owned and the transmission network is operated to provide “open access” by an independent system operator or a regulated transmission company that owns no generation assets.26 The wholesale markets usually include day-ahead and real-time auctions for energy and ancillary services with transparent market clearing prices, including the products described in Section 2. They may also include capacity markets that settle financially on different time-frames (months, annual, or multi-year). Generation, storage and demand-side resources bid into these markets competitively and set the market clearing prices. Historical market prices along with forecasts of fuel prices and new market products that may be needed (such as a ramping reserve) form the basis for expectations about market value in the future. These forecasts are used in part to estimate the long-term economic benefits of alternative renewable energy plants ad other resources.
In contrast, in a vertically integrated utility, whether privately or government-owned, the utility owns the generation and the transmission assets and serves the retail load. These utilities operate their own power systems to self-provide power and ancillary services or buy these services from a neighboring utility or wholesale seller. In some cases, independent power producers are allowed
25 Countries and regions with competitive power markets include about 75% of the United States, England and Wales, Scandinavia, Spain, Australia, New Zealand, Chile, and Brazil, while many others have introduced elements of market competition. 26 An independent system operator owns no assets other than its control room, operating systems and human resources. It is intended to be a true “third party” operator of the power system. A regulated transmission company, sometimes called a “Transco”, does own transmission assets but operates the system impartially among generators.
Regulatory and market regimes affect the valuation of resources. In countries with transparent wholesale markets, it is easier to value a plant’s attributes, but historical prices do not necessarily help in forecasting future system conditions. In regions without such markets, resource planning methods used by utilities can similarly use simulations to estimate the net system cost of alternative renewable resources.
B E N E F I T S O F C S P W I T H T H E R M A L S T O R A G E
into the market, but have to contract bilaterally with the utility (or sell into a competitive market elsewhere on the grid). Vertically integrated utilities typically serve as their own planning entities with responsibility for meeting future load growth. A vertically integrated utility’s capacity investment decisions are generally subject to oversight by a subnational27 or national regulator or other authority. For such utilities, the decision on how to maximize the benefits of CSP with thermal storage will be based on avoided fuel costs or energy market costs, and estimates of avoided future capacity needs.
5.2 Valuation in U.S. Markets
In the United States, both of these market/utility structures – and “hybrids” of them which allow regulated utilities and IPPs to compete for new investment – exist due to a high degree of regional autonomy in implementing aspects of wholesale market competition.
Figure 5-1 shows the locations of the existing CSP plants and much of the CSP development potential in the western U.S., as well as the state boundaries, high voltage transmission, intensity of direct normal insolation, and boundaries of the California Independent System Operator (CAISO) and other balancing areas in California. This region is where most further U.S. CSP development is likely to take place, although there is project development in Colorado and Texas.
Table 5-1 briefly summarizes the regulatory and market structures in the western U.S, as well as certain policies and conditions relevant to CSP development. California has been the largest market for CSP in the United States to date, with over 1 GW of such plants in commercial operation or close to such operations. With regard to electric power market structure in California, the large investor-owned utilities28 have divested most of their generation assets, but own most of the transmission in their territories, and are all located within the CAISO footprint. The CAISO operates day-ahead and real-time wholesale auction markets for energy and ancillary services (see also Section 3 for further discussion) limited to its footprint, but plants in neighboring regions can sell services into the CAISO markets depending on whether there is transmission transfer capacity and if they are qualified to follow CAISO dispatch instructions. The other utilities in the western U.S. are either owned by municipalities, the federal government, or private utilities that remain vertically integrated; these utilities are required to offer non-discriminatory transmission access under the federal transmission open access rules. These utilities also buy/sell power with other regional entities – utilities or independent power producers – based on bilateral contracts.
To date, the different states and utilities with sufficient direct normal insolation have a mixed record with respect to valuation of CSP with thermal energy storage, and generally have only recently begun to develop and implement the types of long-term simulation models described in this report (Mills and Wiser, 2012a). In California, the California Public Utilities Commission (CPUC) determines the rules and provides oversight of investor-owned utility procurement to meet policy goals, including greenhouse gas emissions reductions, the RPS and the storage mandate, by the investor-owned utilities. Some of the current CPUC-defined methods for the valuation of CSP with thermal energy storage were described briefly in Section 3.3, and there are several proceedings in process to develop new analytical methods which could improve the comparative net cost valuation of more flexible solar plants.29 With respect to wholesale market valuations of the services provided by CSP with thermal storage, the CAISO markets provide hourly and subhourly locational marginal
27 That is, states, provinces, municipalities or other subnational bodies.28 Pacific Gas & Electric, Southern California Edison, and San Diego Gas & Electric. 29 These include refinements to capacity valuation to calculate the changes in solar capacity credits using an ELCC model due to increased solar penetration, as discussed in Section 8, and consideration of renewable integration costs, as discussed in Section 9.32
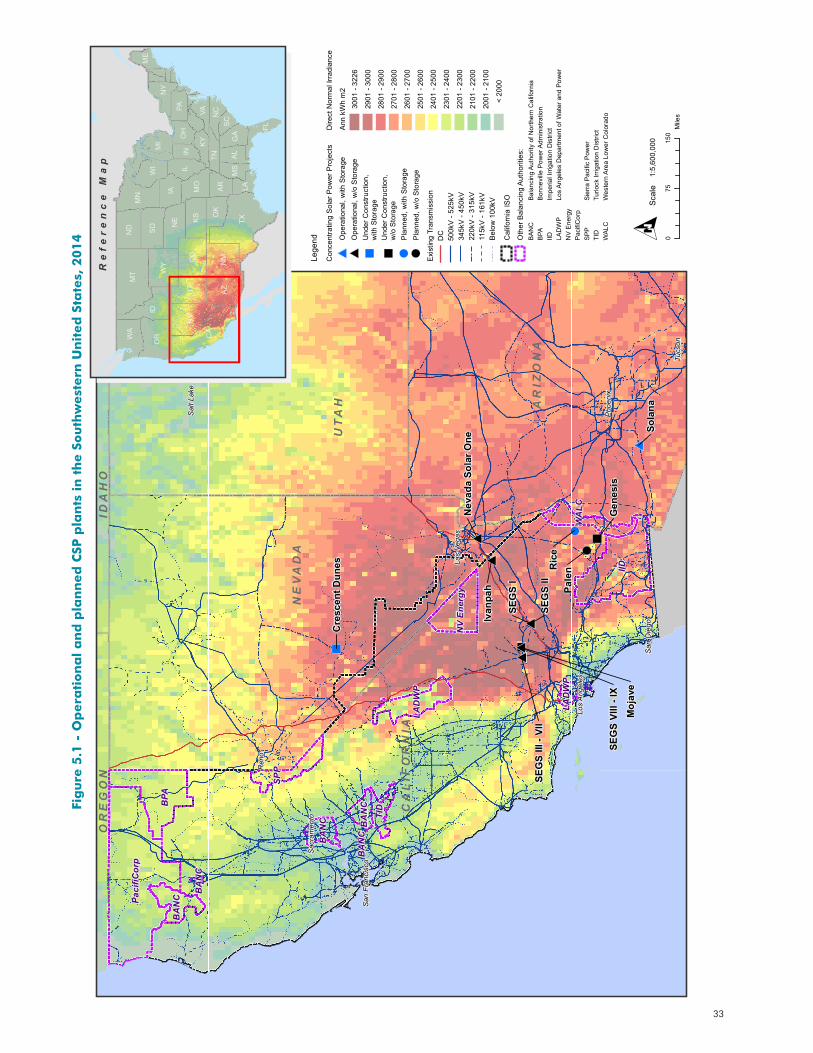
33
! (! (
" )" )
" )
# *
# *# *# *# *# *# *# *# *# *
# *
# *
Ric
ePa
len
Sola
na
SEG
S I
Gen
esis
SEG
S II
Ivan
pah
Cre
scen
t Dun
es
Nev
ada
Sola
r One
Moj
ave
SEG
S III
- VI
I
SEG
S VI
II - I
X
UT
AH
NE
VA
DA
CA
LIF
OR
NIA
AR
IZO
NAW
YO
MIN
G
IDA
HO
OR
EG
ON
IID
Paci
fiCor
p
BPA
SPP
LAD
WP
WA
LC
NV
Ener
gy
BA
NC
TID
BA
NC BA
NC
LAD
WP
BA
NC
BA
NC
Los
Ang
eles
Pho
enix
San
Die
go
Sac
ram
ento
Tucs
on
Sal
t Lak
e C
ity
Las
Vega
s
Ren
o
San
Fra
ncis
co
TX
MT
CA
ID
NV
AZ
OR
IL
NMCO
MN
WY
SD
IA
ND
UT
KS
NE
WA
WI
OK
MO
MI
NY
PA
FL
IN AL
GA
AR LA
NCVA
KY
TN
OH
MS
ME
SC
Re
fe
re
nc
e M
ap
Lege
nd
Exi
stin
g Tr
ansm
issi
onD
C50
0kV
- 52
5kV
345k
V -
450k
V22
0kV
- 31
5kV
115k
V -
161k
VB
elow
100
kV
Con
cent
ratin
g S
olar
Pow
er P
roje
cts
# *O
pera
tiona
l, w
ith S
tora
ge
# *O
pera
tiona
l, w
/o S
tora
ge
! (P
lann
ed, w
ith S
tora
ge
! (P
lann
ed, w
/o S
tora
ge
" )U
nder
Con
stru
ctio
n,
w/o
Sto
rage
" )U
nder
Con
stru
ctio
n,w
ith S
tora
ge
Dire
ct N
orm
al Ir
radi
ance
Ann
kW
h m
2
3001
- 32
26
2901
- 30
00
2801
- 29
00
2701
- 28
00
2601
- 27
00
2501
- 26
00
2401
- 25
00
2301
- 24
00
2201
- 23
00
2101
- 22
00
2001
- 21
00
<
2000
Cal
iforn
ia IS
O
NV
Ene
rgy
Pac
ifiC
orp
Bal
anci
ng A
utho
rity
of N
orth
ern
Cal
iforn
iaB
AN
CB
onne
ville
Pow
er A
dmin
istra
tion
BPA
Impe
rial I
rrig
atio
n D
istri
ctIID
Los
Ang
eles
Dep
artm
ent o
f Wat
er a
nd P
ower
LAD
WP
Sie
rra
Pac
ific
Pow
erS
PP
Turlo
ck Ir
rigat
ion
Dis
trict
TID
Wes
tern
Are
a Lo
wer
Col
orad
oW
ALC
Oth
er B
alan
cing
Aut
horit
ies:
075
150
Mile
s
O1:
5,60
0,00
0Sc
ale
Fig
ure
5.1
- O
pera
tio
na
l a
nd
pla
nn
ed
CSP
pla
nts
in
th
e S
ou
thw
est
ern
Un
ited
Sta
tes,
20
14
B E N E F I T S O F C S P W I T H T H E R M A L S T O R A G E
34
prices for day-ahead and real-time energy, and zonal prices for frequency regulation, spinning and non-spinning reserves. In addition, over the next 1-2 years, the CAISO will add services to value additional operational flexibility needed for renewable resource integration, such as payments for ramping reserves, and frequency response services. In sum, these regulatory and market changes could improve the comparative valuation of economic benefits from CSP with thermal storage when compared to other solar technologies.
Elsewhere in the region, valuation of solar projects by vertically integrated utilities is conducted using conventional long-term planning and procurement methods (Mills and Wiser, 2012a). In California, the municipal utilities outside the CAISO market have evaluated CSP projects in their procurement processes, but have not yet advanced a project. In Arizona and Nevada, two CSP plants with thermal storage have been procured, primarily to help meet utility evening peak loads.
While solar valuation methods vary among these utilities, there are similarities in the analytical approaches used for long-term valuation of CSP with thermal storage, since in all cases – whether in a restructured market or a vertically integrated utility – the basic method requires a long-term forecast of fuel prices along with an economic dispatch solution under scenarios with increasing renewable penetration (Mills and Wiser, 2012a; Jorgenson et al., 2013, 2014).
Figure 5.2 - Global markets for CSP in high DNI regions
5.3 Valuation outside the U. S.
Outside of the United States, there are many variations along the spectrum between wholesale deregulated markets, regulated privately owned utilities, and nationally- or regionally-owned utilities. Figure 5-2 shows the general locations of regions with high potential for CSP development around the world. The brief summaries of policies, regulatory and market structures in Tables 5-1 to 5-3 provide context for how those factors might affect CSP development and valuation, but obviously each country and region requires in-depth evaluation. The CSP Alliance may provide additional review of solar valuation in these international markets in subsequent reports.
Despite the differences in market and regulatory structures between countries, most of the valuation methods for CSP with thermal energy storage discussed in this report should be applicable with some modification. First, these methods are usually generic, and several of the power system modeling methods and tools discussed herein are used across the world. Modeling methods developed in one location can be utilized to study the systems in others (e.g., Brand et al., 2012). However, in developing countries, while CSP with thermal energy storage has been evaluated in several integrated resource planning processes, the consideration of “value-based” criteria has
While solar valuation methods vary, to properly value CSP with thermal storage over the long-term, utilities must develop a long-term forecast of fuel prices along with an economic dispatch solution for the CSP plant under various scenarios of increasing renewable penetration.
B E N E F I T S O F C S P W I T H T H E R M A L S T O R A G E
35
apparently been limited in procurement processes and PPA negotiations (Kulichenko and Wirth, 2011).
Second, power systems of similar size, resource mix, and electric power market design, such as in California and Spain, can learn from each other’s experiences in system and market operations as renewable resource penetration increases.
Third, while not all regions have transparent competitive wholesale markets, the results of studies from regions with markets provide benchmarks for the benefits of different services provided by the CSP plants with thermal energy storage, especially over time. These can be of interest to non-market regions as well (see, e.g., Madaeni et al., 2012b). In addition, the market regions may provide additional market-based incentives for technology innovation, such as providing greater operating ranges on CSP plants with storage, that are also relevant to operations in non-market regions.
Ultimately, specific regional studies are needed for accurate valuation of the benefits of CSP with thermal storage. The literature survey that follows includes only a few publicly available analyses of the economic and reliability benefits of CSP outside the United States with some exceptions. Brand et al., (2012) model parabolic trough plants with and without storage on the power systems in Morocco and Algeria, with results discussed in Section 7. In regions with competitive power markets, which include Australia, Spain and Chile, there are also few public studies. Although they do not calculate operational benefits, Rutovitz et al. (2013) calculate the value of CSP with thermal storage in providing capacity and avoiding transmission investments in Australia at a number of different locations on the grid. Usaolo (2012) examines the potential market benefits of CSP with thermal storage in Spain, although most plants in that region were at the time under fixed tariff-based payments.
To improve understanding of economic benefits in these countries, government agencies, utilities and the CSP industry should undertake additional studies of CSP with thermal energy storage in different power systems and provide the results publicly to expand understanding of the resource. International associations that support analysis of CSP technology and policy, such as SolarPACES,30 should expand their research scope to include implementation and comparison of valuation studies in different countries.
30 Details on SolarPACES can be found at http://www.solarpaces.org/.
To improve understanding of economic benefits in countries without transparent markets, government agencies, utilities and the CSP industry should perform and and publish additional simulation studies of CSP with thermal energy storage in different power systems and under different conditions.
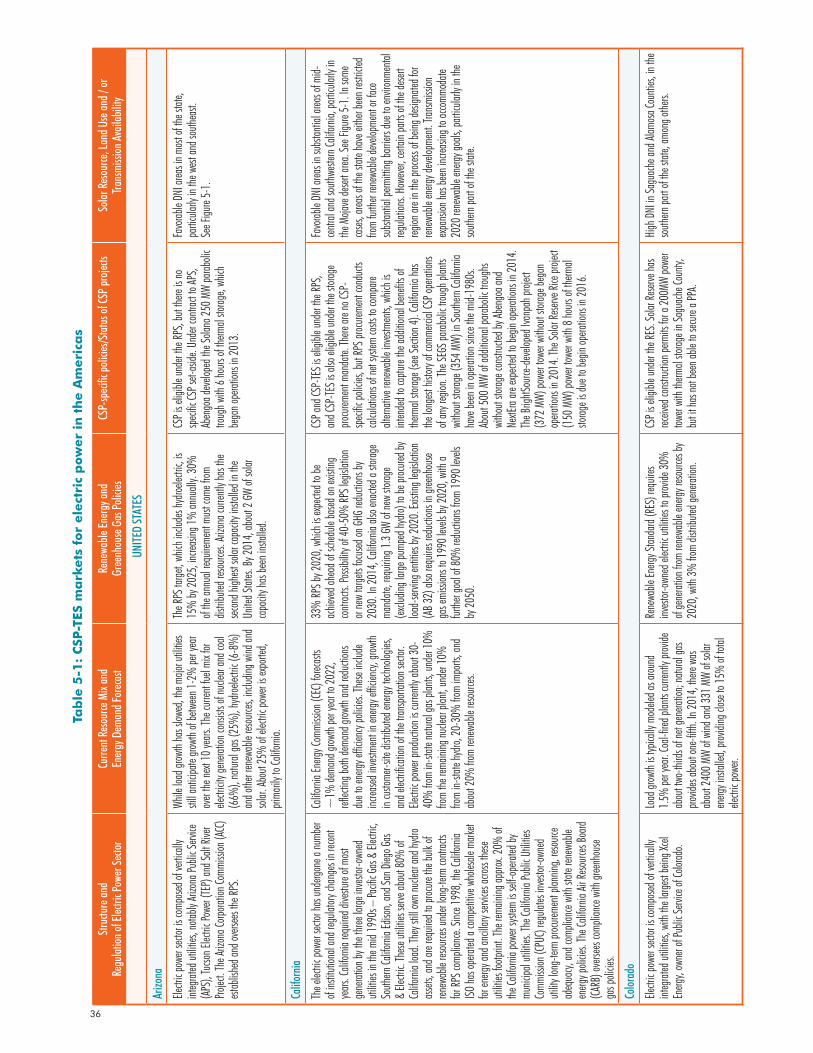
36
Tab
le 5
-1:
CSP
-TES
ma
rkets
fo
r ele
ctri
c p
ow
er
in t
he A
meri
cas
Stru
cture
and
Regu
lation
of El
ectri
c Pow
er Se
ctor
Curre
nt R
esou
rce M
ix an
d En
ergy
Dem
and F
orec
ast
Rene
wable
Ener
gy an
d Gr
eenh
ouse
Gas
Polic
iesCS
P-sp
ecifi
c poli
cies/S
tatu
s of C
SP pr
ojects
Solar
Res
ource
, Lan
d Use
and /
or
Trans
miss
ion A
vaila
bility
UNIT
ED ST
ATES
Arizo
na
Electr
ic po
wer s
ector
is co
mpos
ed of
vertic
ally
integ
rated
utilit
ies, n
otably
Arizo
na Pu
blic S
ervice
(A
PS),
Tucso
n Elec
tric Po
wer (
TEP)
and S
alt Ri
ver
Projec
t. The
Arizo
na Co
rporat
ion Co
mmiss
ion (A
CC)
estab
lishe
d and
overs
ees t
he RP
S.
While
load
grow
th ha
s slow
ed, th
e majo
r utili
ties
still a
nticip
ate gr
owth
of be
twee
n 1-2
% pe
r yea
r ov
er the
next
10 ye
ars. T
he cu
rrent
fuel m
ix for
ele
ctrici
ty ge
nerat
ion co
nsist
s of n
uclea
r and
coal
(66%
), na
tural
gas (
25%
), hy
droele
ctric
(6-8
%)
and o
ther r
enew
able
resou
rces,
includ
ing w
ind an
d so
lar. A
bout
25%
of el
ectric
powe
r is ex
porte
d, pri
marily
to Ca
liforni
a.
The R
PS ta
rget, w
hich i
nclud
es hy
droele
ctric,
is
15%
by 20
25, in
creas
ing 1%
annu
ally.
30%
of
the an
nual
requir
emen
t mus
t com
e from
dis
tribute
d reso
urces.
Arizo
na cu
rrentl
y has
the
secon
d high
est so
lar ca
pacit
y ins
talled
in th
e Un
ited S
tates.
By 20
14, a
bout
2 GW
of so
lar
capa
city h
as be
en in
stalle
d.
CSP i
s elig
ible u
nder
the RP
S, bu
t there
is no
sp
ecific
CSP s
et-as
ide. U
nder
contr
act to
APS,
Aben
goa d
evelo
ped t
he So
lana 2
50 M
W pa
raboli
c tro
ugh w
ith 6
hours
of th
ermal
storag
e, wh
ich
bega
n ope
ration
s in 2
013.
Favo
rable
DNI a
reas i
n mos
t of th
e stat
e, pa
rticula
rly in
the w
est an
d sou
theas
t. Se
e Figu
re 5-
1.
Calif
ornia
The e
lectric
powe
r sect
or ha
s und
ergon
e a nu
mber
of ins
titutio
nal a
nd re
gulat
ory ch
ange
s in r
ecent
years
. Cali
fornia
requ
ired d
ivestu
re of
most
gene
ration
by th
e thre
e larg
e inv
estor-
owne
d uti
lities
in the
mid
1990
s – Pa
cific G
as &
Elect
ric,
South
ern Ca
liforni
a Edis
on, a
nd Sa
n Dieg
o Gas
&
Electr
ic. Th
ese ut
ilities
serve
abou
t 80%
of
Califo
rnia l
oad.
They
still
own n
uclea
r and
hydro
as
sets,
and a
re req
uired
to pr
ocure
the b
ulk of
ren
ewab
le res
ource
s und
er lon
g-ter
m co
ntrac
ts for
RPS c
ompli
ance.
Sinc
e 199
8, the
Califo
rnia
ISO ha
s ope
rated
a co
mpeti
tive w
holes
ale m
arket
for en
ergy a
nd an
cillar
y serv
ices a
cross
these
utiliti
es foo
tprint
. The
rema
ining
appro
x. 20
% of
the
Califo
rnia p
ower
system
is se
lf-op
erated
by
munic
ipal u
tilitie
s. Th
e Cali
fornia
Publi
c Utili
ties
Comm
ission
(CPU
C) reg
ulates
inve
stor-o
wned
uti
lity lo
ng-te
rm pr
ocure
ment
plann
ing, re
sourc
e ad
equa
cy, an
d com
plian
ce wi
th sta
te ren
ewab
le en
ergy p
olicie
s. Th
e Cali
fornia
Air R
esourc
es Bo
ard
(CARB
) ove
rsees
comp
lianc
e with
gree
nhou
se
gas p
olicie
s.
Califo
rnia E
nergy
Comm
ission
(CEC
) fore
casts
~
1% de
mand
grow
th pe
r yea
r to 2
022,
reflect
ing bo
th de
mand
grow
th an
d red
uctio
ns
due t
o ene
rgy ef
ficien
cy po
licies
. The
se inc
lude
increa
sed in
vestm
ent in
energ
y effic
iency,
grow
th in
custo
mer-s
ite di
stribu
ted en
ergy t
echno
logies
, an
d elec
trifica
tion o
f the t
ransp
ortati
on se
ctor.
Electr
ic po
wer p
roduc
tion i
s curr
ently
abou
t 30-
40%
from
in-sta
te na
tural
gas p
lants,
unde
r 10%
fro
m the
rema
ining
nucle
ar pla
nt, un
der 1
0%
from
in-sta
te hy
dro, 2
0-30
% fro
m im
ports
, and
ab
out 2
0% fro
m ren
ewab
le res
ource
s.
33%
RPS b
y 202
0, wh
ich is
expe
cted t
o be
achie
ved a
head
of sc
hedu
le ba
sed on
exist
ing
contr
acts.
Possi
bility
of 40
-50%
RPS l
egisl
ation
or
new
targe
ts foc
used
on GH
G red
uctio
ns by
20
30. In
2014
, Cali
fornia
also
enac
ted a
storag
e ma
ndate
, requ
iring 1
.3 GW
of ne
w sto
rage
(exclu
ding l
arge p
umpe
d hyd
ro) to
be pr
ocure
d by
load-
servin
g enti
ties b
y 202
0. Ex
isting
legis
lation
(A
B 32)
also
requ
ires r
educ
tions
in gr
eenh
ouse
gas e
missi
ons t
o 199
0 lev
els by
2020
, with
a fur
ther g
oal o
f 80%
redu
ction
s from
1990
leve
ls by
2050
.
CSP a
nd CS
P-TE
S is e
ligibl
e und
er the
RPS,
and C
SP-TE
S is a
lso el
igible
unde
r the
stora
ge
procu
remen
t man
date.
There
are n
o CSP
-sp
ecific
polic
ies, b
ut RP
S proc
ureme
nt co
nduc
ts ca
lculat
ions o
f net
system
costs
to co
mpare
alt
ernati
ve re
newa
ble in
vestm
ents,
whic
h is
inten
ded t
o cap
ture t
he ad
dition
al be
nefits
of
therm
al sto
rage (
see Se
ction
4). C
alifor
nia ha
s the
long
est hi
story
of co
mmerc
ial CS
P ope
ration
s of
any r
egion
. The
SEGS
parab
olic t
rough
plan
ts wi
thout
storag
e (35
4 MW)
in So
uthern
Califo
rnia
have
been
in op
eratio
n sinc
e the
mid-
1980
s. Ab
out 5
00 M
W of
addit
ional
parab
olic t
rough
s wi
thout
storag
e con
struc
ted by
Aben
goa a
nd
NextE
ra are
expe
cted t
o beg
in op
eratio
ns in
2014
. Th
e Brig
htSou
rce-d
evelo
ped I
vanp
ah pr
oject
(372
MW)
powe
r tow
er wi
thout
storag
e beg
an
opera
tions
in 20
14. T
he So
lar Re
serve
Rice
projec
t (1
50 M
W) po
wer t
ower
with
8 hou
rs of
therm
al sto
rage i
s due
to be
gin op
eratio
ns in
2016
.
Favo
rable
DNI a
reas i
n sub
stanti
al are
as of
mid-
centra
l and
south
weste
rn Ca
liforni
a, pa
rticula
rly in
the
Moja
ve de
sert a
rea. S
ee Fi
gure
5-1.
In so
me
cases
, area
s of th
e stat
e hav
e eith
er be
en re
strict
ed
from
furthe
r ren
ewab
le de
velop
ment
or fac
e su
bstan
tial p
ermitti
ng ba
rriers
due t
o env
ironm
ental
reg
ulatio
ns. H
owev
er, ce
rtain
parts
of th
e dese
rt reg
ion ar
e in t
he pr
ocess
of be
ing de
signa
ted fo
r ren
ewab
le en
ergy d
evelo
pmen
t. Tran
smiss
ion
expan
sion h
as be
en in
creas
ing to
acco
mmod
ate
2020
rene
wable
energ
y goa
ls, pa
rticula
rly in
the
south
ern pa
rt of
the st
ate.
Color
ado
Electr
ic po
wer s
ector
is co
mpos
ed of
vertic
ally
integ
rated
utilit
ies, w
ith th
e larg
est be
ing Xc
el En
ergy,
owne
r of P
ublic
Servi
ce of
Color
ado.
Load
grow
th is
typica
lly m
odele
d as a
round
1.5
% pe
r yea
r. Coa
l-fired
plan
ts cu
rrentl
y prov
ide
abou
t two-
thirds
of ne
t gen
eratio
n; na
tural
gas
provid
es ab
out o
ne-fi
fth. In
2014
, there
was
ab
out 2
400 M
W of
wind
and 3
31 M
W of
solar
en
ergy i
nstal
led, p
rovidi
ng cl
ose t
o 15%
of to
tal
electr
ic po
wer.
Rene
wable
Energ
y Stan
dard
(RES
) req
uires
invest
or-ow
ned e
lectric
utilit
ies to
prov
ide 30
%
of ge
nerat
ion fro
m ren
ewab
le en
ergy r
esourc
es by
20
20, w
ith 3%
from
distrib
uted g
enera
tion.
CSP i
s elig
ible u
nder
the RE
S. So
lar Re
serve
has
receiv
ed co
nstru
ction
perm
its fo
r a 20
0MW
powe
r tow
er wi
th the
rmal
storag
e in S
agua
che C
ounty
, bu
t it ha
s not
been
able
to sec
ure a
PPA.
High
DNI
in Sa
guac
he an
d Alam
osa C
ounti
es, in
the
south
ern pa
rt of
the st
ate, a
mong
othe
rs.
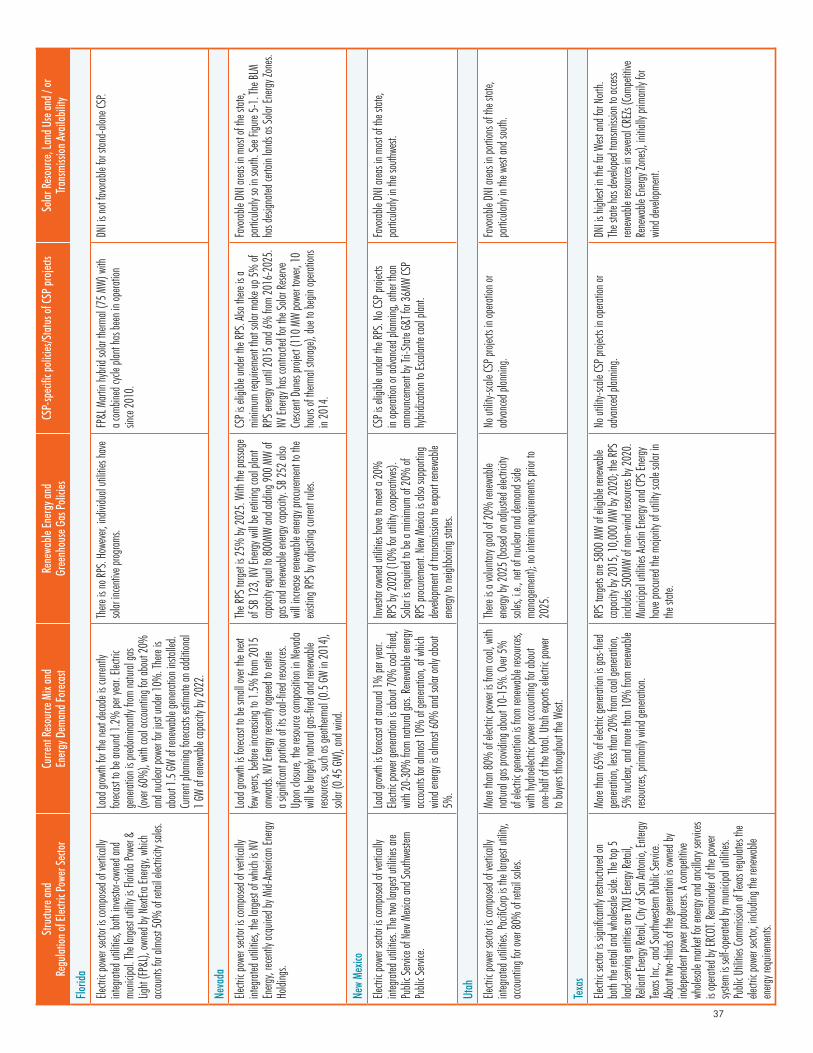
37
Stru
cture
and
Regu
lation
of El
ectri
c Pow
er Se
ctor
Curre
nt R
esou
rce M
ix an
d En
ergy
Dem
and F
orec
ast
Rene
wable
Ener
gy an
d Gr
eenh
ouse
Gas
Polic
iesCS
P-sp
ecifi
c poli
cies/S
tatu
s of C
SP pr
ojects
Solar
Res
ource
, Lan
d Use
and /
or
Trans
miss
ion A
vaila
bility
Florid
a
Electr
ic po
wer s
ector
is co
mpos
ed of
vertic
ally
integ
rated
utilit
ies, b
oth in
vesto
r-own
ed an
d mu
nicipa
l. The
large
st uti
lity is
Flori
da Po
wer &
Lig
ht (FP
&L),
owne
d by N
extEra
Energ
y, wh
ich
acco
unts
for al
most
50%
of re
tail e
lectric
ity sa
les.
Load
grow
th for
the n
ext de
cade
is cu
rrentl
y for
ecast
to be
arou
nd 1.
2% pe
r yea
r. Elec
tric
gene
ration
is pr
edom
inantl
y from
natur
al ga
s (ov
er 60
%),
with
coal
acco
untin
g for
abou
t 20%
an
d nuc
lear p
ower
for ju
st un
der 1
0%. T
here
is ab
out 1
.5 GW
of re
newa
ble ge
nerat
ion in
stalle
d. Cu
rrent
plann
ing fo
recas
ts est
imate
an ad
dition
al 1 G
W of
renew
able
capa
city b
y 202
2.
There
is no
RPS.
Howe
ver, i
ndivi
dual
utiliti
es ha
ve
solar
incen
tive p
rogram
s.FP
&L M
artin
hybri
d sola
r the
rmal
(75 M
W) w
ith
a com
bined
cycle
plan
t has
been
in op
eratio
n sin
ce 20
10.
DNI is
not fa
vorab
le for
stan
d-alo
ne CS
P.
Neva
da
Electr
ic po
wer s
ector
is co
mpos
ed of
vertic
ally
integ
rated
utilit
ies, th
e larg
est of
whic
h is N
V En
ergy,
recen
tly ac
quire
d by M
id-Am
erica
n Ene
rgy
Holdi
ngs.
Load
grow
th is
foreca
st to
be sm
all ov
er the
next
few ye
ars, b
efore
increa
sing t
o 1.5%
from
2015
on
wards
. NV E
nergy
recen
tly ag
reed t
o reti
re a s
ignific
ant p
ortion
of its
coal-
fired r
esourc
es.
Upon
clos
ure, th
e reso
urce c
ompo
sition
in N
evad
a wi
ll be l
argely
natur
al ga
s-fired
and r
enew
able
resou
rces,
such
as ge
otherm
al (0
.5 GW
in 20
14),
solar
(0.45
GW),
and w
ind.
The R
PS ta
rget is
25%
by 20
25. W
ith th
e pas
sage
of
SB 12
3, NV
Energ
y will
be re
tiring
coal
plant
capa
city e
qual
to 80
0MW
and a
dding
900 M
W of
gas a
nd re
newa
ble en
ergy c
apac
ity. S
B 252
also
wi
ll inc
rease
renew
able
energ
y proc
ureme
nt to
the
existi
ng RP
S by a
djusti
ng cu
rrent
rules.
CSP i
s elig
ible u
nder
the RP
S. Als
o the
re is
a mi
nimum
requ
ireme
nt tha
t sola
r mak
e up 5
% of
RP
S ene
rgy un
til 20
15 an
d 6%
from
2016
-202
5.
NV En
ergy h
as co
ntrac
ted fo
r the
Solar
Reser
ve
Cresce
nt Du
nes p
roject
(110
MW
powe
r tow
er, 10
ho
urs of
therm
al sto
rage),
due t
o beg
in op
eratio
ns
in 20
14.
Favo
rable
DNI a
reas i
n mos
t of th
e stat
e, pa
rticula
rly so
in so
uth. S
ee Fi
gure
5-1.
The B
LM
has d
esign
ated c
ertain
land
s as S
olar E
nergy
Zone
s.
New
Mexic
o
Electr
ic po
wer s
ector
is co
mpos
ed of
vertic
ally
integ
rated
utilit
ies. T
he tw
o larg
est ut
ilities
are
Publi
c Serv
ice of
New
Mexi
co an
d Sou
thwest
ern
Publi
c Serv
ice.
Load
grow
th is
foreca
st at
aroun
d 1%
per y
ear.
Electr
ic po
wer g
enera
tion i
s abo
ut 70
% co
al-fire
d, wi
th 20
-30%
from
natur
al ga
s. Re
newa
ble en
ergy
acco
unts
for al
most
10%
of ge
nerat
ion, o
f whic
h wi
nd en
ergy i
s alm
ost 6
0% an
d sola
r only
abou
t 5%
.
Invest
or ow
ned u
tilitie
s hav
e to m
eet a
20%
RP
S by 2
020 (
10%
for u
tility
coop
erativ
es).
Solar
is re
quire
d to b
e a m
inimu
m of
20%
of
RPS p
rocure
ment.
New
Mexi
co is
also
supp
orting
de
velop
ment
of tra
nsmi
ssion
to ex
port
renew
able
energ
y to n
eighb
oring
state
s.
CSP i
s elig
ible u
nder
the RP
S. No
CSP p
roject
s in
opera
tion o
r adv
anced
plan
ning,
other
than
anno
uncem
ent b
y Tri-
State
G&T f
or 36
MW CS
P hy
bridiz
ation
to Es
calan
te co
al pla
nt.
Favo
rable
DNI a
reas i
n mos
t of th
e stat
e, pa
rticula
rly in
the s
outhw
est.
Utah
Electr
ic po
wer s
ector
is co
mpos
ed of
vertic
ally
integ
rated
utilit
ies. P
acifiC
orp is
the l
argest
utilit
y, ac
coun
ting f
or ov
er 80
% of
retai
l sale
s.
More
than 8
0% of
elect
ric po
wer is
from
coal,
with
na
tural
gas p
rovidi
ng ab
out 1
0-15
%. O
ver 5
%
of ele
ctric
gene
ration
is fro
m ren
ewab
le res
ource
s, wi
th hy
droele
ctric
powe
r acco
untin
g for
abou
t on
e-half
of th
e tota
l. Utah
expo
rts el
ectric
powe
r to
buye
rs thr
ough
out th
e West
.
There
is a
volun
tary g
oal o
f 20%
rene
wable
en
ergy b
y 202
5 (ba
sed on
adjus
ted el
ectric
ity
sales
, i.e.,
net o
f nuc
lear a
nd de
mand
side
ma
nage
ment)
; no i
nterim
requ
ireme
nts pr
ior to
20
25.
No ut
ility-s
cale
CSP p
roject
s in o
perat
ion or
ad
vanc
ed pl
annin
g.Fa
vorab
le DN
I area
s in p
ortion
s of th
e stat
e, pa
rticula
rly in
the w
est an
d sou
th.
Texa
s
Electr
ic sec
tor is
sign
ifican
tly re
struc
tured
on
both
the re
tail a
nd w
holes
ale si
de. T
he to
p 5
load-
servin
g enti
ties a
re TX
U En
ergy R
etail,
Relia
nt En
ergy R
etail,
City o
f San
Anton
io, En
tergy
Tex
as In
c., an
d Sou
thwest
ern Pu
blic S
ervice
. Ab
out tw
o-thi
rds of
the g
enera
tion i
s own
ed by
ind
epen
dent
powe
r prod
ucers
. A co
mpeti
tive
whole
sale
marke
t for e
nergy
and a
ncilla
ry ser
vices
is op
erated
by ER
COT.
Rema
inder
of the
powe
r sys
tem is
self-
opera
ted by
mun
icipa
l utili
ties.
Publi
c Utili
ties C
ommi
ssion
of Te
xas r
egula
tes th
e ele
ctric
powe
r sect
or, in
cludin
g the
rene
wable
en
ergy r
equir
emen
ts.
More
than 6
5% of
elect
ric ge
nerat
ion is
gas-fi
red
gene
ration
, less
than 2
0% fro
m co
al ge
nerat
ion,
5% nu
clear,
and m
ore th
an 10
% fro
m ren
ewab
le res
ource
s, pri
marily
wind
gene
ration
.
RPS t
argets
are 5
800 M
W of
eligib
le ren
ewab
le ca
pacit
y by 2
015,
10,00
0 MW
by 20
20; th
e RPS
inc
ludes
500M
W of
non-
wind
reso
urces
by 20
20.
Munic
ipal u
tilitie
s Aus
tin En
ergy a
nd CP
S Ene
rgy
have
proc
ured t
he m
ajority
of ut
ility s
cale
solar
in
the st
ate.
No ut
ility-s
cale
CSP p
roject
s in o
perat
ion or
ad
vanc
ed pl
annin
g.DN
I is hi
ghest
in th
e far
West
and f
ar No
rth.
The s
tate h
as de
velop
ed tr
ansm
ission
to ac
cess
renew
able
resou
rces i
n sev
eral C
REZs
(Comp
etitiv
e Re
newa
ble En
ergy Z
ones)
, initia
lly pr
imari
ly for
wi
nd de
velop
ment.
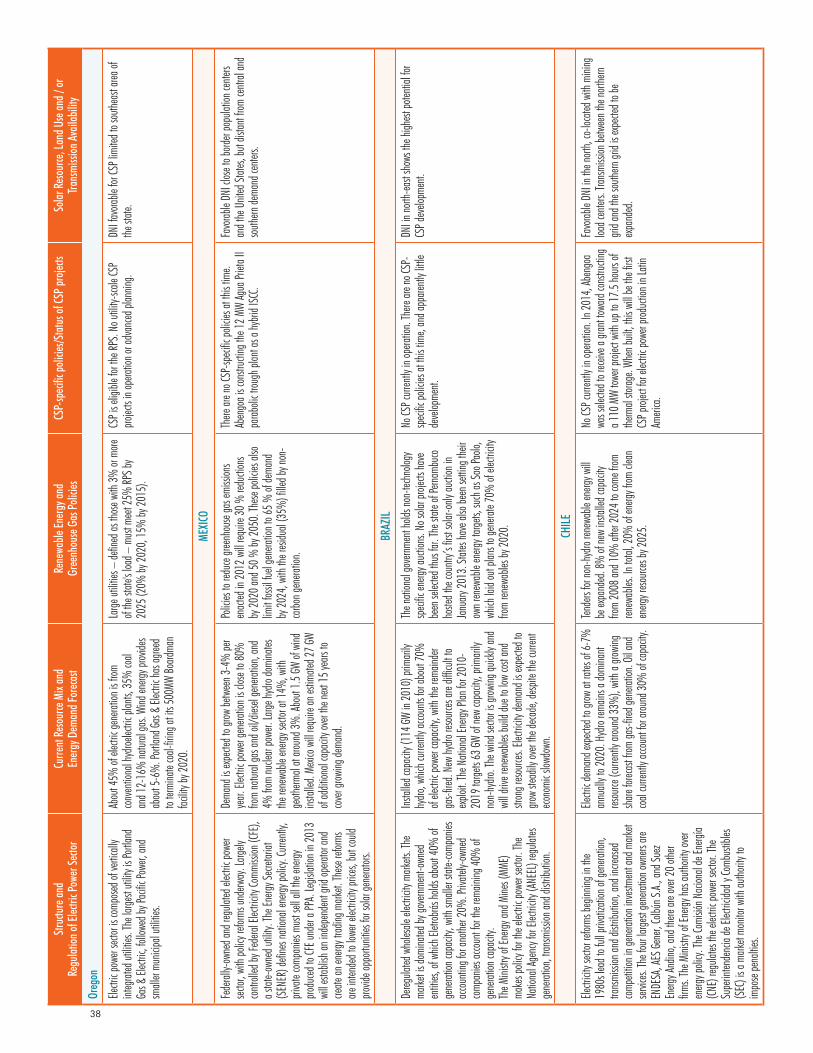
38
Stru
cture
and
Regu
lation
of El
ectri
c Pow
er Se
ctor
Curre
nt R
esou
rce M
ix an
d En
ergy
Dem
and F
orec
ast
Rene
wable
Ener
gy an
d Gr
eenh
ouse
Gas
Polic
iesCS
P-sp
ecifi
c poli
cies/S
tatu
s of C
SP pr
ojects
Solar
Res
ource
, Lan
d Use
and /
or
Trans
miss
ion A
vaila
bility
Oreg
on
Electr
ic po
wer s
ector
is co
mpos
ed of
vertic
ally
integ
rated
utilit
ies. T
he la
rgest
utility
is Po
rtland
Ga
s & El
ectric
, follo
wed b
y Pac
ific Po
wer, a
nd
small
er mu
nicipa
l utili
ties.
Abou
t 45%
of el
ectric
gene
ration
is fro
m co
nven
tiona
l hyd
roelec
tric pl
ants,
35%
coal
and 1
2-16
% na
tural
gas.
Wind
energ
y prov
ides
abou
t 5-6
%. P
ortlan
d Gas
& El
ectric
has a
greed
to
termi
nate
coal-
firing
at its
500M
W Bo
ardma
n fac
ility b
y 202
0.
Large
utilit
ies –
defin
ed as
thos
e with
3% or
more
of
the st
ate's l
oad –
mus
t mee
t 25%
RPS b
y 20
25 (2
0% by
2020
, 15%
by 20
15).
CSP i
s elig
ible f
or the
RPS.
No ut
ility-s
cale
CSP
projec
ts in
opera
tion o
r adv
anced
plan
ning.
DNI fa
vorab
le for
CSP l
imite
d to s
outhe
ast a
rea of
the
state
.
MEXI
CO
Fede
rally-
owne
d and
regu
lated
elect
ric po
wer
sector
, with
polic
y refo
rms u
nderw
ay. L
argely
co
ntroll
ed by
Fede
ral El
ectric
ity Co
mmiss
ion (C
FE),
a stat
e-own
ed ut
ility.
The E
nergy
Secre
tariat
(S
ENER
) defi
nes n
ation
al en
ergy p
olicy.
Curre
ntly,
priva
te co
mpan
ies m
ust s
ell al
l the e
nergy
pro
duced
to CF
E und
er a P
PA. L
egisl
ation
in 20
13
will e
stabli
sh an
inde
pend
ent g
rid op
erator
and
create
an en
ergy t
rading
mark
et. Th
ese re
forms
are
inten
ded t
o low
er ele
ctrici
ty pri
ces, b
ut co
uld
provid
e opp
ortun
ities f
or so
lar ge
nerat
ors.
Dema
nd is
expe
cted t
o grow
betw
een 3
-4%
per
year.
Elect
ric po
wer g
enera
tion i
s clos
e to 8
0%
from
natur
al ga
s and
oil/d
iesel
gene
ration
, and
4%
from
nucle
ar po
wer. L
arge h
ydro
domi
nates
the
rene
wable
energ
y sect
or at
14%
, with
ge
otherm
al at
aroun
d 3%
. Abo
ut 1.5
GW of
wind
ins
talled
. Mexi
co w
ill req
uire a
n esti
mated
27 GW
of
addit
ional
capa
city o
ver t
he ne
xt 15
years
to
cove
r grow
ing de
mand
.
Polic
ies to
redu
ce gre
enho
use g
as em
ission
s en
acted
in 20
12 w
ill req
uire 3
0 % re
ducti
ons
by 20
20 an
d 50 %
by 20
50. T
hese
polic
ies al
so
limit f
ossil
fuel
gene
ration
to 65
% of
dema
nd
by 20
24, w
ith th
e resi
dual
(35%
) fille
d by n
on-
carbo
n gen
eratio
n.
There
are n
o CSP
-speci
fic po
licies
at th
is tim
e. Ab
engo
a is c
onstr
uctin
g the
12 M
W Ag
ua Pr
ieta I
I pa
raboli
c trou
gh pl
ant a
s a hy
brid I
SCC.
Favo
rable
DNI c
lose t
o bord
er po
pulat
ion ce
nters
and t
he U
nited
State
s, bu
t dist
ant fr
om ce
ntral
and
south
ern de
mand
cente
rs.
BRAZ
IL
Dereg
ulated
who
lesale
elect
ricity
mark
ets. T
he
marke
t is do
mina
ted by
gove
rnmen
t-own
ed
entiti
es, of
whic
h Elet
robrás
holds
abou
t 40%
of
gene
ration
capa
city,
with
small
er sta
te-co
mpan
ies
acco
untin
g for
anoth
er 20
%. P
rivate
ly-ow
ned
comp
anies
acco
unt fo
r the
rema
ining
40%
of
gene
ration
capa
city.
The M
inistr
y of E
nergy
and M
ines (
MME)
make
s poli
cy for
the e
lectric
powe
r sect
or. Th
e Na
tiona
l Age
ncy f
or Ele
ctrici
ty (A
NEEL
) reg
ulates
ge
nerat
ion, tr
ansm
ission
and d
istrib
ution
.
Instal
led ca
pacit
y (11
4 GW
in 20
10) p
rimari
ly hy
dro, w
hich c
urren
tly ac
coun
ts for
abou
t 70%
of
electr
ic po
wer c
apac
ity, w
ith th
e rem
ainde
r ga
s-fired
. New
hydro
reso
urces
are di
fficult
to
exploi
t. The
Nati
onal
Energ
y Plan
for 2
010-
2019
targe
ts 63
GW of
new
capa
city,
prima
rily
non-
hydro
. The
wind
secto
r is gr
owing
quick
ly an
d wi
ll driv
e ren
ewab
les bu
ild du
e to l
ow co
st an
d str
ong r
esourc
es. El
ectric
ity de
mand
is ex
pecte
d to
grow
stead
ily ov
er the
deca
de, d
espite
the c
urren
t eco
nomi
c slow
down
.
The n
ation
al go
vernm
ent h
olds n
on-te
chno
logy
speci
fic en
ergy a
uctio
ns. N
o sola
r proj
ects h
ave
been
selec
ted th
us fa
r. The
state
of Pe
rnamb
uco
hoste
d the
coun
try’s
first s
olar-o
nly au
ction
in
Janu
ary 20
13. S
tates
have
also
been
settin
g the
ir ow
n ren
ewab
le en
ergy t
argets
, suc
h as S
ao Pa
olo,
which
laid
out p
lans t
o gen
erate
70%
of el
ectric
ity
from
renew
ables
by 20
20.
No CS
P curr
ently
in op
eratio
n. Th
ere ar
e no C
SP-
speci
fic po
licies
at th
is tim
e, an
d app
arentl
y littl
e de
velop
ment.
DNI in
north
-east
show
s the
high
est po
tentia
l for
CSP d
evelo
pmen
t.
CHIL
E
Electr
icity
sector
refor
ms be
ginnin
g in t
he
1980
s lea
d to f
ull pr
ivatiz
ation
of ge
nerat
ion,
trans
missi
on an
d dist
ributi
on, a
nd in
creas
ed
comp
etitio
n in g
enera
tion i
nvest
ment
and m
arket
servic
es. Th
e fou
r large
st ge
nerat
ion ow
ners
are
ENDE
SA, A
ES Ge
ner, C
olbún
S.A.,
and S
uez
Energ
y And
ino, a
nd th
ere ar
e ove
r 20 o
ther
firms.
The M
inistr
y of E
nergy
has a
uthori
ty ov
er en
ergy p
olicy.
The C
omisi
ón N
acion
al de
Energ
ía (CN
E) reg
ulates
the e
lectric
powe
r sect
or. Th
e Su
perin
tende
ncia
de El
ectric
idad y
Comb
ustib
les
(SEC
) is a
mark
et mo
nitor
with
autho
rity to
im
pose
pena
lties.
Electr
ic de
mand
expe
cted t
o grow
at ra
tes of
6-7%
an
nuall
y to 2
020.
Hydro
rema
ins a
domi
nant
resou
rce (c
urren
tly ar
ound
33%
), wi
th a g
rowing
sh
are fo
recas
t from
gas-fi
red ge
nerat
ion. O
il and
co
al cu
rrentl
y acco
unt fo
r arou
nd 30
% of
capa
city.
Tende
rs for
non-
hydro
rene
wable
energ
y will
be ex
pand
ed. 8
% of
new
instal
led ca
pacit
y fro
m 20
08 an
d 10%
after
2024
to co
me fro
m ren
ewab
les. In
total
, 20%
of en
ergy f
rom cl
ean
energ
y reso
urces
by 20
25.
No CS
P curr
ently
in op
eratio
n. In
2014
, Abe
ngoa
wa
s sele
cted t
o rece
ive a
grant
toward
cons
tructi
ng
a 110
MW
tower
projec
t with
up to
17.5
hours
of
therm
al sto
rage.
When
built,
this
will b
e the
first
CSP p
roject
for e
lectric
powe
r prod
uctio
n in L
atin
Ameri
ca.
Favo
rable
DNI in
the n
orth,
co-lo
cated
with
mini
ng
load c
enter
s. Tra
nsmi
ssion
betw
een t
he no
rthern
gri
d and
the s
outhe
rn gri
d is e
xpect
ed to
be
expan
ded.
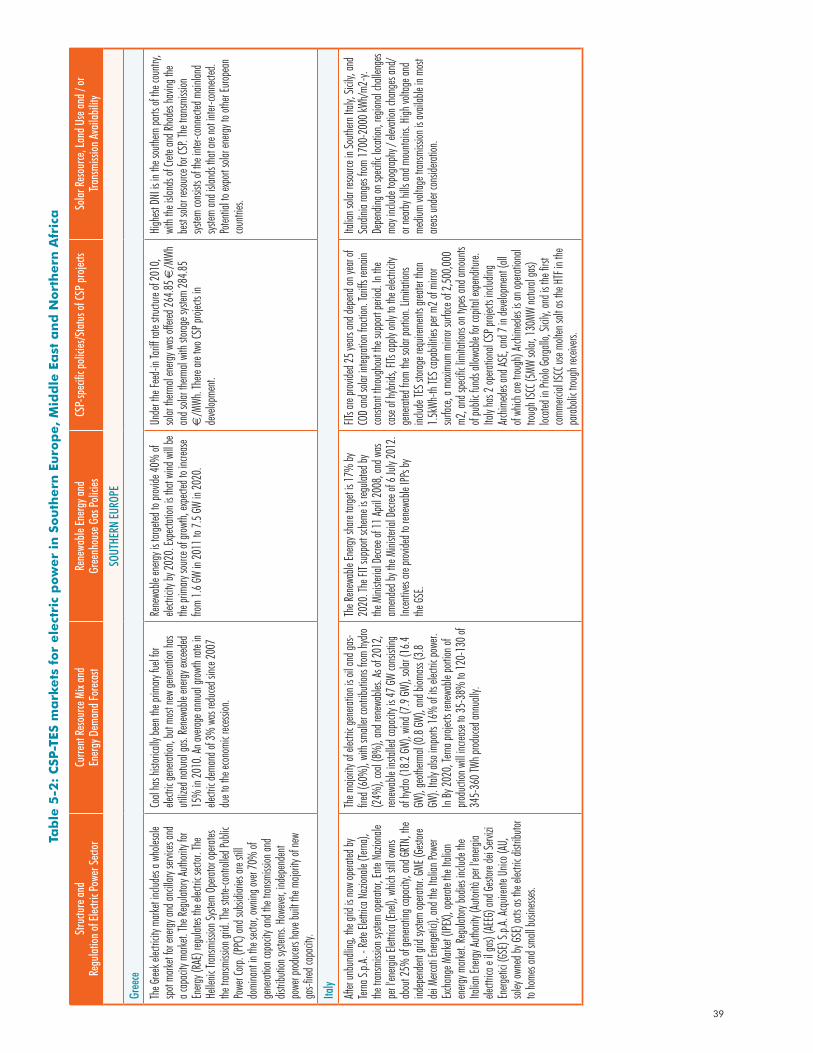
39
Stru
cture
and
Regu
lation
of El
ectri
c Pow
er Se
ctor
Curre
nt R
esou
rce M
ix an
d En
ergy
Dem
and F
orec
ast
Rene
wable
Ener
gy an
d Gr
eenh
ouse
Gas
Polic
iesCS
P-sp
ecifi
c poli
cies/S
tatu
s of C
SP pr
ojects
Solar
Res
ource
, Lan
d Use
and /
or
Trans
miss
ion A
vaila
bility
Oreg
on
Electr
ic po
wer s
ector
is co
mpos
ed of
vertic
ally
integ
rated
utilit
ies. T
he la
rgest
utility
is Po
rtland
Ga
s & El
ectric
, follo
wed b
y Pac
ific Po
wer, a
nd
small
er mu
nicipa
l utili
ties.
Abou
t 45%
of el
ectric
gene
ration
is fro
m co
nven
tiona
l hyd
roelec
tric pl
ants,
35%
coal
and 1
2-16
% na
tural
gas.
Wind
energ
y prov
ides
abou
t 5-6
%. P
ortlan
d Gas
& El
ectric
has a
greed
to
termi
nate
coal-
firing
at its
500M
W Bo
ardma
n fac
ility b
y 202
0.
Large
utilit
ies –
defin
ed as
thos
e with
3% or
more
of
the st
ate's l
oad –
mus
t mee
t 25%
RPS b
y 20
25 (2
0% by
2020
, 15%
by 20
15).
CSP i
s elig
ible f
or the
RPS.
No ut
ility-s
cale
CSP
projec
ts in
opera
tion o
r adv
anced
plan
ning.
DNI fa
vorab
le for
CSP l
imite
d to s
outhe
ast a
rea of
the
state
.
MEXI
CO
Fede
rally-
owne
d and
regu
lated
elect
ric po
wer
sector
, with
polic
y refo
rms u
nderw
ay. L
argely
co
ntroll
ed by
Fede
ral El
ectric
ity Co
mmiss
ion (C
FE),
a stat
e-own
ed ut
ility.
The E
nergy
Secre
tariat
(S
ENER
) defi
nes n
ation
al en
ergy p
olicy.
Curre
ntly,
priva
te co
mpan
ies m
ust s
ell al
l the e
nergy
pro
duced
to CF
E und
er a P
PA. L
egisl
ation
in 20
13
will e
stabli
sh an
inde
pend
ent g
rid op
erator
and
create
an en
ergy t
rading
mark
et. Th
ese re
forms
are
inten
ded t
o low
er ele
ctrici
ty pri
ces, b
ut co
uld
provid
e opp
ortun
ities f
or so
lar ge
nerat
ors.
Dema
nd is
expe
cted t
o grow
betw
een 3
-4%
per
year.
Elect
ric po
wer g
enera
tion i
s clos
e to 8
0%
from
natur
al ga
s and
oil/d
iesel
gene
ration
, and
4%
from
nucle
ar po
wer. L
arge h
ydro
domi
nates
the
rene
wable
energ
y sect
or at
14%
, with
ge
otherm
al at
aroun
d 3%
. Abo
ut 1.5
GW of
wind
ins
talled
. Mexi
co w
ill req
uire a
n esti
mated
27 GW
of
addit
ional
capa
city o
ver t
he ne
xt 15
years
to
cove
r grow
ing de
mand
.
Polic
ies to
redu
ce gre
enho
use g
as em
ission
s en
acted
in 20
12 w
ill req
uire 3
0 % re
ducti
ons
by 20
20 an
d 50 %
by 20
50. T
hese
polic
ies al
so
limit f
ossil
fuel
gene
ration
to 65
% of
dema
nd
by 20
24, w
ith th
e resi
dual
(35%
) fille
d by n
on-
carbo
n gen
eratio
n.
There
are n
o CSP
-speci
fic po
licies
at th
is tim
e. Ab
engo
a is c
onstr
uctin
g the
12 M
W Ag
ua Pr
ieta I
I pa
raboli
c trou
gh pl
ant a
s a hy
brid I
SCC.
Favo
rable
DNI c
lose t
o bord
er po
pulat
ion ce
nters
and t
he U
nited
State
s, bu
t dist
ant fr
om ce
ntral
and
south
ern de
mand
cente
rs.
BRAZ
IL
Dereg
ulated
who
lesale
elect
ricity
mark
ets. T
he
marke
t is do
mina
ted by
gove
rnmen
t-own
ed
entiti
es, of
whic
h Elet
robrás
holds
abou
t 40%
of
gene
ration
capa
city,
with
small
er sta
te-co
mpan
ies
acco
untin
g for
anoth
er 20
%. P
rivate
ly-ow
ned
comp
anies
acco
unt fo
r the
rema
ining
40%
of
gene
ration
capa
city.
The M
inistr
y of E
nergy
and M
ines (
MME)
make
s poli
cy for
the e
lectric
powe
r sect
or. Th
e Na
tiona
l Age
ncy f
or Ele
ctrici
ty (A
NEEL
) reg
ulates
ge
nerat
ion, tr
ansm
ission
and d
istrib
ution
.
Instal
led ca
pacit
y (11
4 GW
in 20
10) p
rimari
ly hy
dro, w
hich c
urren
tly ac
coun
ts for
abou
t 70%
of
electr
ic po
wer c
apac
ity, w
ith th
e rem
ainde
r ga
s-fired
. New
hydro
reso
urces
are di
fficult
to
exploi
t. The
Nati
onal
Energ
y Plan
for 2
010-
2019
targe
ts 63
GW of
new
capa
city,
prima
rily
non-
hydro
. The
wind
secto
r is gr
owing
quick
ly an
d wi
ll driv
e ren
ewab
les bu
ild du
e to l
ow co
st an
d str
ong r
esourc
es. El
ectric
ity de
mand
is ex
pecte
d to
grow
stead
ily ov
er the
deca
de, d
espite
the c
urren
t eco
nomi
c slow
down
.
The n
ation
al go
vernm
ent h
olds n
on-te
chno
logy
speci
fic en
ergy a
uctio
ns. N
o sola
r proj
ects h
ave
been
selec
ted th
us fa
r. The
state
of Pe
rnamb
uco
hoste
d the
coun
try’s
first s
olar-o
nly au
ction
in
Janu
ary 20
13. S
tates
have
also
been
settin
g the
ir ow
n ren
ewab
le en
ergy t
argets
, suc
h as S
ao Pa
olo,
which
laid
out p
lans t
o gen
erate
70%
of el
ectric
ity
from
renew
ables
by 20
20.
No CS
P curr
ently
in op
eratio
n. Th
ere ar
e no C
SP-
speci
fic po
licies
at th
is tim
e, an
d app
arentl
y littl
e de
velop
ment.
DNI in
north
-east
show
s the
high
est po
tentia
l for
CSP d
evelo
pmen
t.
CHIL
E
Electr
icity
sector
refor
ms be
ginnin
g in t
he
1980
s lea
d to f
ull pr
ivatiz
ation
of ge
nerat
ion,
trans
missi
on an
d dist
ributi
on, a
nd in
creas
ed
comp
etitio
n in g
enera
tion i
nvest
ment
and m
arket
servic
es. Th
e fou
r large
st ge
nerat
ion ow
ners
are
ENDE
SA, A
ES Ge
ner, C
olbún
S.A.,
and S
uez
Energ
y And
ino, a
nd th
ere ar
e ove
r 20 o
ther
firms.
The M
inistr
y of E
nergy
has a
uthori
ty ov
er en
ergy p
olicy.
The C
omisi
ón N
acion
al de
Energ
ía (CN
E) reg
ulates
the e
lectric
powe
r sect
or. Th
e Su
perin
tende
ncia
de El
ectric
idad y
Comb
ustib
les
(SEC
) is a
mark
et mo
nitor
with
autho
rity to
im
pose
pena
lties.
Electr
ic de
mand
expe
cted t
o grow
at ra
tes of
6-7%
an
nuall
y to 2
020.
Hydro
rema
ins a
domi
nant
resou
rce (c
urren
tly ar
ound
33%
), wi
th a g
rowing
sh
are fo
recas
t from
gas-fi
red ge
nerat
ion. O
il and
co
al cu
rrentl
y acco
unt fo
r arou
nd 30
% of
capa
city.
Tende
rs for
non-
hydro
rene
wable
energ
y will
be ex
pand
ed. 8
% of
new
instal
led ca
pacit
y fro
m 20
08 an
d 10%
after
2024
to co
me fro
m ren
ewab
les. In
total
, 20%
of en
ergy f
rom cl
ean
energ
y reso
urces
by 20
25.
No CS
P curr
ently
in op
eratio
n. In
2014
, Abe
ngoa
wa
s sele
cted t
o rece
ive a
grant
toward
cons
tructi
ng
a 110
MW
tower
projec
t with
up to
17.5
hours
of
therm
al sto
rage.
When
built,
this
will b
e the
first
CSP p
roject
for e
lectric
powe
r prod
uctio
n in L
atin
Ameri
ca.
Favo
rable
DNI in
the n
orth,
co-lo
cated
with
mini
ng
load c
enter
s. Tra
nsmi
ssion
betw
een t
he no
rthern
gri
d and
the s
outhe
rn gri
d is e
xpect
ed to
be
expan
ded.
Stru
cture
and
Regu
lation
of El
ectri
c Pow
er Se
ctor
Curre
nt R
esou
rce M
ix an
d En
ergy
Dem
and F
orec
ast
Rene
wable
Ener
gy an
d Gr
eenh
ouse
Gas
Polic
iesCS
P-sp
ecifi
c poli
cies/S
tatu
s of C
SP pr
ojects
Solar
Res
ource
, Lan
d Use
and /
or
Trans
miss
ion A
vaila
bility
SOUT
HERN
EURO
PE
Gree
ce
The G
reek e
lectric
ity m
arket
includ
es a w
holes
ale
spot
marke
t for e
nergy
and a
ncilla
ry ser
vices
and
a cap
acity
mark
et. Th
e Reg
ulator
y Auth
ority
for
Energ
y (RA
E) reg
ulates
the e
lectric
secto
r. The
He
llenic
Tran
smiss
ion Sy
stem
Opera
tor op
erates
the
tran
smiss
ion gr
id. Th
e stat
e-con
trolle
d Pub
lic
Powe
r Corp
. (PP
C) an
d sub
sidiar
ies ar
e still
do
mina
nt in
the se
ctor, o
wning
over
70%
of
gene
ration
capa
city a
nd th
e tran
smiss
ion an
d dis
tributi
on sy
stems
. How
ever,
inde
pend
ent
powe
r prod
ucers
have
built
the m
ajority
of ne
w ga
s-fired
capa
city.
Coal
has h
istori
cally
been
the p
rimary
fuel
for
electr
ic ge
nerat
ion, b
ut mo
st ne
w ge
nerat
ion ha
s uti
lized
natur
al ga
s. Re
newa
ble en
ergy e
xceed
ed
15%
in 20
10. A
n ave
rage a
nnua
l grow
th rat
e in
electr
ic de
mand
of 3%
was
redu
ced si
nce 2
007
due t
o the
econ
omic
recess
ion.
Rene
wable
energ
y is t
argete
d to p
rovide
40%
of
electr
icity
by 20
20. E
xpect
ation
is th
at wi
nd w
ill be
the
prim
ary so
urce o
f grow
th, ex
pecte
d to i
ncrea
se fro
m 1.6
GW in
2011
to 7.
5 GW
in 20
20.
Unde
r the
Feed
-in Ta
riff ra
te str
uctur
e of 2
010,
solar
therm
al en
ergy w
as of
fered
264.8
5 €/M
Wh
and s
olar t
herm
al wi
th sto
rage s
ystem
284.8
5 €
/MWh
. The
re are
two C
SP pr
ojects
in
deve
lopme
nt.
High
est D
NI is
in th
e sou
thern
parts
of th
e cou
ntry,
with
the is
lands
of Cr
ete an
d Rho
des h
aving
the
best
solar
reso
urce f
or CS
P. Th
e tran
smiss
ion
system
cons
ists o
f the i
nter-c
onne
cted m
ainlan
d sys
tem an
d isla
nds t
hat a
re no
t inter
-conn
ected
. Po
tentia
l to ex
port
solar
energ
y to o
ther E
urope
an
coun
tries.
Italy
After
unbu
ndlin
g, the
grid
is no
w op
erated
by
Terna
S.p.A
. - Re
te Ele
ttrica
Naz
ionale
(Tern
a),
the tr
ansm
ission
syste
m op
erator
, Ente
Naz
ionale
pe
r l'en
ergia
Elettr
ica (E
nel),
whic
h still
owns
ab
out 2
5% of
gene
rating
capa
city,
and G
RTN,
the
indep
ende
nt gri
d syst
em op
erator
. GME
(Gest
ore
dei M
ercati
Energ
etici)
, and
the I
talian
Powe
r Ex
chan
ge M
arket
(IPEX
), op
erate
the It
alian
en
ergy m
arket.
Regu
latory
bodie
s inc
lude t
he
Italia
n Ene
rgy Au
thority
(Auto
rità pe
r l'en
ergia
electt
rica e
il ga
s) (A
EEG)
and G
estore
dei S
ervizi
En
ergeti
ci (G
SE) S
.p.A.
Acqu
irente
Unic
o (AU
, so
ley ow
ned b
y GSE
) acts
as th
e elec
tric di
stribu
tor
to ho
mes a
nd sm
all bu
siness
es.
The m
ajority
of el
ectric
gene
ration
is oi
l and
gas-
fired (
60%
), wi
th sm
aller
contr
ibutio
ns fro
m hy
dro
(24%
), co
al (8
%),
and r
enew
ables
. As o
f 201
2, ren
ewab
le ins
talled
capa
city i
s 47 G
W co
nsist
ing
of hy
dro (1
8.2 GW
), wi
nd (7
.9 GW
), so
lar (1
6.4
GW),
geoth
ermal
(0.8
GW),
and b
iomas
s (3.8
GW
). Ita
ly als
o imp
orts 1
6% of
its el
ectric
powe
r. In
By 20
20, T
erna p
roject
s ren
ewab
le po
rtion o
f pro
ducti
on w
ill inc
rease
to 35
-38%
to 12
0-13
0 of
345-
360 T
Wh pr
oduc
ed an
nuall
y.
The R
enew
able
Energ
y sha
re tar
get is
17%
by
2020
. The
FIT s
uppo
rt sch
eme i
s reg
ulated
by
the M
iniste
rial D
ecree
of 11
April
2008
, and
was
am
ende
d by t
he M
iniste
rial D
ecree
of 6
July
2012
. Inc
entiv
es are
prov
ided t
o ren
ewab
le IPP
s by
the GS
E.
FITs a
re pro
vided
25 ye
ars an
d dep
end o
n yea
r of
COD
and s
olar in
tegrat
ion fra
ction
. Tari
ffs re
main
cons
tant th
rough
out th
e sup
port
perio
d. In
the
case
of hy
brids
, FITs
apply
only
to the
elect
ricity
ge
nerat
ed fro
m the
solar
portio
n. Lim
itatio
ns
includ
e TES
stora
ge re
quire
ments
grea
ter th
an
1.5kW
h-th
TES c
apab
ilities
per m
2 of m
irror
surfa
ce, a
maxim
um m
irror s
urfac
e of 2
,500,0
00
m2, a
nd sp
ecific
limita
tions
on ty
pes a
nd am
ounts
of
publi
c fun
ds al
lowab
le for
capit
al exp
endit
ure.
Italy
has 2
opera
tiona
l CSP
proje
cts in
cludin
g Arc
himed
es an
d ASE
, and
7 in
deve
lopme
nt (al
l of
which
are t
rough
) Arch
imed
es is
an op
eratio
nal
troug
h ISC
C (5M
W so
lar, 1
30MW
natur
al ga
s) loc
ated i
n Prio
lo Ga
rgallo
, Sici
ly, an
d is t
he fir
st co
mmerc
ial IS
CC us
e molt
en sa
lt as t
he H
TF in
the
parab
olic t
rough
recei
vers.
Italia
n sola
r reso
urce i
n Sou
thern
Italy,
Sicil
y, an
d Sa
rdinia
rang
es fro
m 17
00-2
000 k
Wh/m
2-y.
Depe
nding
on sp
ecific
loca
tion,
region
al ch
allen
ges
may i
nclud
e top
ograp
hy /
eleva
tion c
hang
es an
d/or
nearb
y hills
and m
ounta
ins. H
igh vo
ltage
and
mediu
m vo
ltage
tran
smiss
ion is
avail
able
in mo
st are
as un
der c
onsid
eratio
n.
Tab
le 5
-2:
CSP
-TES
ma
rkets
fo
r ele
ctri
c p
ow
er
in S
ou
thern
Eu
rop
e,
Mid
dle
Ea
st a
nd
No
rth
ern
Afr
ica
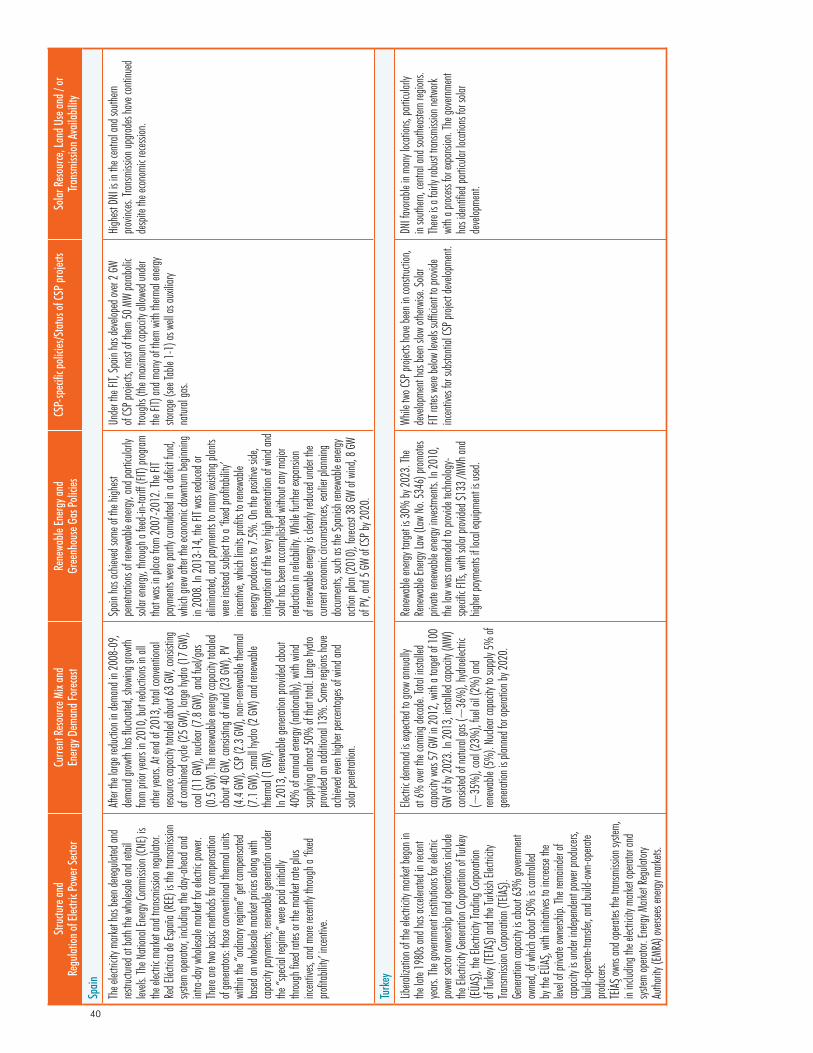
40
Stru
cture
and
Regu
lation
of El
ectri
c Pow
er Se
ctor
Curre
nt R
esou
rce M
ix an
d En
ergy
Dem
and F
orec
ast
Rene
wable
Ener
gy an
d Gr
eenh
ouse
Gas
Polic
iesCS
P-sp
ecifi
c poli
cies/S
tatu
s of C
SP pr
ojects
Solar
Res
ource
, Lan
d Use
and /
or
Trans
miss
ion A
vaila
bility
Spain
The e
lectric
ity m
arket
has b
een d
eregu
lated
and
restru
ctured
at bo
th the
who
lesale
and r
etail
levels
. The
Nati
onal
Energ
y Com
missi
on (C
NE) i
s the
elect
ric m
arket
and t
ransm
ission
regu
lator.
Re
d Eléc
trica d
e Esp
aña (
REE)
is the
tran
smiss
ion
system
opera
tor, in
cludin
g the
day-a
head
and
intra-
day w
holes
ale m
arket
for el
ectric
powe
r. Th
ere ar
e two
basic
meth
ods f
or co
mpen
satio
n of
gene
rators
: thos
e con
venti
onal
therm
al un
its
withi
n the
“ordi
nary
regim
e” ge
t com
pens
ated
based
on w
holes
ale m
arket
prices
alon
g with
ca
pacit
y pay
ments
; rene
wable
gene
ration
unde
r the
“spe
cial re
gime”
were
paid
initia
lly
throu
gh fix
ed ra
tes or
the m
arket
rate p
lus
incen
tives,
and m
ore re
cently
throu
gh a
‘fixed
pro
fitabil
ity’ in
centiv
e.
After
the la
rge re
ducti
on in
dema
nd in
2008
-09,
dema
nd gr
owth
has fl
uctua
ted, s
howi
ng gr
owth
from
prior
years
in 20
10, b
ut red
uctio
ns in
all
other
years
. At e
nd of
2013
, total
conv
entio
nal
resou
rce ca
pacit
y tota
led ab
out 6
3 GW,
cons
isting
of
comb
ined c
ycle (
25 GW
), lar
ge hy
dro (1
7 GW)
, co
al (1
1 GW)
, nuc
lear (
7.8 GW
), an
d fue
l/gas
(0
.5 GW
). Th
e ren
ewab
le en
ergy c
apac
ity to
taled
ab
out 4
0 GW,
cons
isting
of w
ind (2
3 GW)
, PV
(4.4
GW),
CSP (
2.3 GW
), no
n-ren
ewab
le the
rmal
(7.1
GW),
small
hydro
(2 GW
) and
rene
wable
the
rmal
(1 GW
).In
2013
, rene
wable
gene
ration
prov
ided a
bout
40%
of an
nual
energ
y (na
tiona
lly),
with
wind
su
pplyi
ng al
most
50%
of th
at tot
al. La
rge hy
dro
provid
ed an
addit
ional
13%
. Som
e reg
ions h
ave
achie
ved e
ven h
igher
perce
ntage
s of w
ind an
d so
lar pe
netra
tion.
Spain
has a
chiev
ed so
me of
the h
ighest
pe
netra
tions
of re
newa
ble en
ergy,
and p
articu
larly
solar
energ
y, thr
ough
a fee
d-in-
tariff
(FIT)
progra
m tha
t was
in pl
ace f
rom 20
07-2
012.
The F
IT pa
ymen
ts we
re pa
rtly cu
mulat
ed in
a de
ficit f
und,
which
grew
after
the e
cono
mic d
owntu
rn be
ginnin
g in
2008
. In 20
13-1
4, the
FIT w
as re
duced
or
elimi
nated
, and
paym
ents
to ma
ny ex
isting
plan
ts we
re ins
tead s
ubjec
t to a
‘fixed
profi
tabilit
y’ inc
entiv
e, wh
ich lim
its pr
ofits
to ren
ewab
le en
ergy p
roduc
ers to
7.5%
. On t
he po
sitive
side
, int
egrat
ion of
the v
ery hi
gh pe
netra
tion o
f wind
and
solar
has b
een a
ccomp
lishe
d with
out a
ny m
ajor
reduc
tion i
n reli
abilit
y. Wh
ile fu
rther
expan
sion
of ren
ewab
le en
ergy i
s clea
rly re
duced
unde
r the
cu
rrent
econo
mic c
ircum
stanc
es, ea
rlier p
lannin
g do
cume
nts, s
uch a
s the
Span
ish re
newa
ble en
ergy
actio
n plan
(201
0), fo
recas
t 38 G
W of
wind
, 8 GW
of
PV, a
nd 5
GW of
CSP b
y 202
0.
Unde
r the
FIT,
Spain
has d
evelo
ped o
ver 2
GW
of CS
P proj
ects,
most
of the
m 50
MW
parab
olic
troug
hs (t
he m
axim
um ca
pacit
y allo
wed u
nder
the FI
T) an
d man
y of th
em w
ith th
ermal
energ
y sto
rage (
see Ta
ble 1-
1) as
well
as au
xiliar
y na
tural
gas.
High
est D
NI is
in th
e cen
tral a
nd so
uthern
pro
vinces
. Tran
smiss
ion up
grade
s hav
e con
tinue
d de
spite
the e
cono
mic r
ecessi
on.
Turk
ey
Libera
lizati
on of
the e
lectric
ity m
arket
bega
n in
the la
te 19
80s a
nd ha
s acce
lerate
d in r
ecent
years
. The
gove
rnmen
t insti
tution
s for
electr
ic po
wer s
ector
owne
rship
and o
perat
ions i
nclud
e the
Elect
ricity
Gene
ration
Corpo
ration
of Tu
rkey
(EÜAS
), the
Elect
ricity
Trad
ing Co
rporat
ion
of Tu
rkey (
TETA
S) an
d the
Turki
sh El
ectric
ity
Trans
missi
on Co
rporat
ion (T
E. IAS).
Gene
ration
capa
city i
s abo
ut 63
% go
vernm
ent
owne
d, of
which
abou
t 50%
is co
ntroll
ed
by th
e EÜA
S, wi
th ini
tiativ
es to
increa
se the
lev
el of
priva
te ow
nersh
ip. Th
e rem
ainde
r of
capa
city i
s und
er ind
epen
dent
powe
r prod
ucers
, bu
ild-o
perat
e-tran
sfer, a
nd bu
ild-o
wn-o
perat
e pro
ducer
s.TE
. IAS ow
ns an
d ope
rates
the tr
ansm
ission
syste
m,
in inc
luding
the e
lectric
ity m
arket
opera
tor an
d sys
tem op
erator
. Ene
rgy M
arket
Regu
latory
Au
thority
(EMR
A) ov
ersee
s ene
rgy m
arkets
.
Electr
ic de
mand
is ex
pecte
d to g
row an
nuall
y at
6% ov
er the
comi
ng de
cade
. Tota
l insta
lled
capa
city w
as 57
GW in
2012
, with
a tar
get o
f 100
GW
of by
2023
. In 20
13, in
stalle
d cap
acity
(MW)
co
nsist
ed of
natur
al ga
s (~
36%
), hy
droele
ctric
(~35
%),
coal
(23%
), fue
l oil (
2%) a
nd
renew
able
(5%
). Nu
clear
capa
city t
o sup
ply 5%
of
gene
ration
is pl
anne
d for
opera
tion b
y 202
0.
Rene
wable
energ
y targ
et is
30%
by 20
23. T
he
Rene
wable
Energ
y Law
(Law
No.
5346
) prom
otes
priva
te ren
ewab
le en
ergy i
nvest
ments
. In 20
10,
the la
w wa
s ame
nded
to pr
ovide
tech
nolog
y-sp
ecific
FITs,
with
solar
prov
ided $
133 /
MWh a
nd
highe
r pay
ments
if loc
al eq
uipme
nt is
used
.
While
two C
SP pr
ojects
have
been
in co
nstru
ction
, de
velop
ment
has b
een s
low ot
herw
ise. S
olar
FIT ra
tes w
ere be
low le
vels
suffic
ient to
prov
ide
incen
tives
for su
bstan
tial C
SP pr
oject
deve
lopme
nt.
DNI fa
vorab
le in
many
loca
tions
, part
icular
ly in
south
ern, c
entra
l and
south
easte
rn reg
ions.
There
is a
fairly
robu
st tra
nsmi
ssion
netw
ork
with
a proc
ess fo
r exp
ansio
n. Th
e gov
ernme
nt ha
s ide
ntifie
d part
icular
loca
tions
for s
olar
deve
lopme
nt.
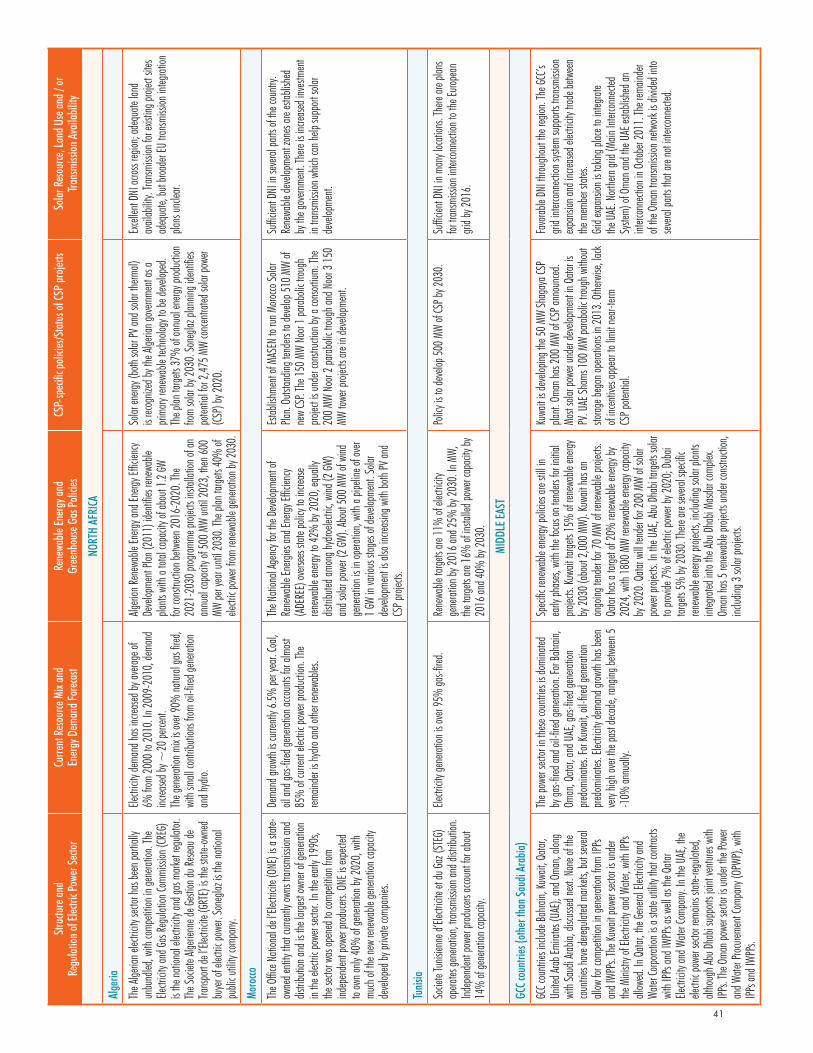
41
Stru
cture
and
Regu
lation
of El
ectri
c Pow
er Se
ctor
Curre
nt R
esou
rce M
ix an
d En
ergy
Dem
and F
orec
ast
Rene
wable
Ener
gy an
d Gr
eenh
ouse
Gas
Polic
iesCS
P-sp
ecifi
c poli
cies/S
tatu
s of C
SP pr
ojects
Solar
Res
ource
, Lan
d Use
and /
or
Trans
miss
ion A
vaila
bility
NORT
H AF
RICA
Alge
ria
The A
lgeria
n elec
tricity
secto
r has
been
partia
lly
unbu
ndled
, with
comp
etitio
n in g
enera
tion.
The
Electr
icity
and G
as Re
gulat
ion Co
mmiss
ion (C
REG)
is
the na
tiona
l elec
tricity
and g
as m
arket
regula
tor.
The S
ociet
e Alge
rienn
e de G
estion
du Re
seau d
e Tra
nspo
rt de
l’Elec
tricite
(GRT
E) is
the st
ate-o
wned
bu
yer o
f elec
tric po
wer. S
oneg
laz is
the n
ation
al pu
blic u
tility
comp
any.
Electr
icity
dema
nd ha
s inc
reased
by av
erage
of
6% fro
m 20
00 to
2010
. In 20
09-2
010,
dema
nd
increa
sed by
~20
perce
nt.Th
e gen
eratio
n mix
is ov
er 90
% na
tural
gas fi
red,
with
small
contr
ibutio
ns fro
m oil
-fired
gene
ration
an
d hyd
ro.
Algeri
an Re
newa
ble En
ergy a
nd En
ergy E
fficien
cy De
velop
ment
Plan (
2011
) ide
ntifie
s ren
ewab
le pla
nts w
ith a
total
capa
city o
f abo
ut 1.2
GW
for co
nstru
ction
betw
een 2
016-
2020
. The
20
21-2
030 p
rogram
me pr
ojects
insta
llatio
n of a
n an
nual
capa
city o
f 500
MW
until
2023
, then
600
MW pe
r yea
r unti
l 203
0. Th
e plan
targe
ts 40
% of
ele
ctric
powe
r from
rene
wable
gene
ration
by 20
30.
Solar
energ
y (bo
th so
lar PV
and s
olar t
herm
al)
is rec
ogniz
ed by
the A
lgeria
n gov
ernme
nt as
a pri
mary
renew
able
techn
ology
to be
deve
loped
. Th
e plan
targe
ts 37
% of
annu
al en
ergy p
roduc
tion
from
solar
by 20
30. S
oneg
laz pl
annin
g ide
ntifie
s po
tentia
l for 2
,475 M
W co
ncen
trated
solar
powe
r (CS
P) by
2020
.
Excel
lent D
NI ac
ross r
egion
; ade
quate
land
av
ailab
ility.
Trans
missi
on fo
r exis
ting p
roject
sites
ad
equa
te, bu
t broa
der E
U tra
nsmi
ssion
integ
ration
pla
ns un
clear.
Moro
cco
The O
ffice N
ation
al de
l’Elec
tricite
(ONE
) is a
state
-ow
ned e
ntity
that c
urren
tly ow
ns tr
ansm
ission
and
distrib
ution
and i
s the
large
st ow
ner o
f gen
eratio
n in
the el
ectric
powe
r sect
or. In
the e
arly 1
990s
, the
secto
r was
open
ed to
comp
etitio
n from
ind
epen
dent
powe
r prod
ucers
. ONE
is ex
pecte
d to
own o
nly 40
% of
gene
ration
by 20
20, w
ith
much
of th
e new
rene
wable
gene
ration
capa
city
deve
loped
by pr
ivate
comp
anies
.
Dema
nd gr
owth
is cu
rrentl
y 6.5%
per y
ear. C
oal,
oil an
d gas
-fired
gene
ration
acco
unts
for al
most
85%
of cu
rrent
electr
ic po
wer p
roduc
tion.
The
remain
der is
hydro
and o
ther r
enew
ables
.
The N
ation
al Ag
ency
for th
e Dev
elopm
ent o
f Re
newa
ble En
ergies
and E
nergy
Effic
iency
(ADE
REE)
overs
ees s
tate p
olicy
to inc
rease
renew
able
energ
y to 4
2% by
2020
, equ
ally
distrib
uted a
mong
hydro
electr
ic, w
ind (2
GW)
and s
olar p
ower
(2 GW
). Ab
out 5
00 M
W of
wind
ge
nerat
ion is
in op
eratio
n, wi
th a p
ipelin
e of o
ver
1 GW
in va
rious
stag
es of
deve
lopme
nt. So
lar
deve
lopme
nt is
also i
ncrea
sing w
ith bo
th PV
and
CSP p
roject
s.
Estab
lishm
ent o
f MAS
EN to
run M
orocco
Solar
Pla
n. Ou
tstan
ding t
ende
rs to
deve
lop 51
0 MW
of ne
w CS
P. Th
e 150
MW
Noor
1 para
bolic
trou
gh
projec
t is un
der c
onstr
uctio
n by a
cons
ortium
. The
20
0 MW
Noor
2 para
bolic
trou
gh an
d Noo
r 3 15
0 MW
towe
r proj
ects a
re in
deve
lopme
nt.
Suffic
ient D
NI in
seve
ral pa
rts of
the c
ountr
y. Re
newa
ble de
velop
ment
zone
s are
estab
lishe
d by
the g
overn
ment.
There
is in
creas
ed in
vestm
ent
in tra
nsmi
ssion
whic
h can
help
supp
ort so
lar
deve
lopme
nt.
Tunis
ia
Socie
te Tu
nisien
ne d’
Electr
icite
et du
Gaz (
STEG
) op
erates
gene
ration
, tran
smiss
ion an
d dist
ributi
on.
Indep
ende
nt po
wer p
roduc
ers ac
coun
t for a
bout
14%
of ge
nerat
ion ca
pacit
y.
Electr
icity
gene
ration
is ov
er 95
% ga
s-fired
.Re
newa
ble ta
rgets
are 11
% of
elect
ricity
ge
nerat
ion by
2016
and 2
5% by
2030
. In M
W,
the ta
rgets
are 16
% of
insta
lled p
ower
capa
city b
y 20
16 an
d 40%
by 20
30.
Polic
y is t
o dev
elop 5
00 M
W of
CSP b
y 203
0. Su
fficien
t DNI
in m
any l
ocati
ons.
There
are p
lans
for tr
ansm
ission
inter
conn
ection
to th
e Euro
pean
gri
d by 2
016.
MIDD
LE EA
ST
GCC c
ount
ries (
othe
r tha
n Sau
di Ar
abia)
GCC c
ountr
ies in
clude
Bahra
in, Ku
wait,
Qatar
, Un
ited A
rab Em
irates
(UAE
), an
d Oma
n, alo
ng
with
Saud
i Arab
ia, di
scusse
d next
. Non
e of th
e co
untrie
s hav
e dere
gulat
ed m
arkets
, but
severa
l all
ow fo
r com
petiti
on in
gene
ration
from
IPPs
and I
WPPs
. The
Kuwa
it pow
er sec
tor is
unde
r the
Mini
stry o
f Elec
tricity
and W
ater, w
ith IP
Ps
allow
ed. In
Qata
r, the
Gene
ral El
ectric
ity an
d Wa
ter Co
rporat
ion is
a sta
te uti
lity th
at co
ntrac
ts wi
th IPP
s and
IWPP
s as w
ell as
the Q
atar
Electr
icity
and W
ater C
ompa
ny. In
the U
AE, th
e ele
ctric
powe
r sect
or rem
ains s
tate-r
egula
ted,
altho
ugh A
bu D
habi
supp
orts j
oint v
entur
es wi
th IPP
s. Th
e Oma
n pow
er sec
tor is
unde
r the
Powe
r an
d Wate
r Proc
ureme
nt Co
mpan
y (OP
WP),
with
IPPs a
nd IW
PPs.
The p
ower
sector
in th
ese co
untrie
s is d
omina
ted
by ga
s-fired
and o
il-fire
d gen
eratio
n. Fo
r Bah
rain,
Oman
, Qata
r, and
UAE
, gas
-fired
gene
ration
pre
domi
nates
. For
Kuwa
it, oil
-fired
gene
ration
pre
domi
nates
. Elec
tricity
dema
nd gr
owth
has b
een
very
high o
ver t
he pa
st de
cade
, rang
ing be
twee
n 5
-10%
annu
ally.
Speci
fic re
newa
ble en
ergy p
olicie
s are
still i
n ea
rly ph
ases,
with
the f
ocus
on te
nders
for in
itial
projec
ts. Ku
wait t
argets
15%
of re
newa
ble en
ergy
by 20
30 (a
bout
2,000
MW)
. Kuw
ait ha
s an
ongo
ing te
nder
for 70
MW
of ren
ewab
le pro
jects.
Qa
tar ha
s a ta
rget o
f 20%
rene
wable
energ
y by
2024
, with
1800
MW
renew
able
energ
y cap
acity
by
2020
. Qata
r will
tende
r for 2
00 M
W of
solar
po
wer p
roject
s. In
the U
AE, A
bu D
habi
targe
ts so
lar
to pro
vide 7
% of
elect
ric po
wer b
y 202
0; Du
bai
targe
ts 5%
by 20
30. T
here
are se
veral
speci
fic
renew
able
energ
y proj
ects,
includ
ing so
lar pl
ants
integ
rated
into
the Ab
u Dha
bi Ma
sdar
comp
lex.
Oman
has 5
rene
wable
proje
cts un
der c
onstr
uctio
n, inc
luding
3 so
lar pr
ojects
.
Kuwa
it is d
evelo
ping t
he 50
MW
Shag
aya C
SP
plant.
Oma
n has
200 M
W of
CSP a
nnou
nced
. Mo
st so
lar po
wer u
nder
deve
lopme
nt in
Qatar
is
PV. U
AE Sh
ams 1
00 M
W pa
raboli
c trou
gh w
ithou
t sto
rage b
egan
opera
tions
in 20
13. O
therw
ise, la
ck of
incen
tives
appe
ar to
limit n
ear-t
erm
CSP p
otenti
al.
Favo
rable
DNI t
hroug
hout
the re
gion.
The G
CC’s
grid i
nterco
nnect
ion sy
stem
supp
orts t
ransm
ission
exp
ansio
n and
incre
ased
elect
ricity
trad
e betw
een
the m
embe
r stat
es.Gri
d exp
ansio
n is t
aking
plac
e to i
ntegra
te the
UAE
. Nort
hern
grid (
Main
Interc
onne
cted
Syste
m) of
Oma
n and
the U
AE es
tablis
hed a
n int
ercon
necti
on in
Octo
ber 2
011.
The r
emain
der
of the
Oma
n tran
smiss
ion ne
twork
is di
vided
into
severa
l part
s tha
t are
not in
terco
nnect
ed.
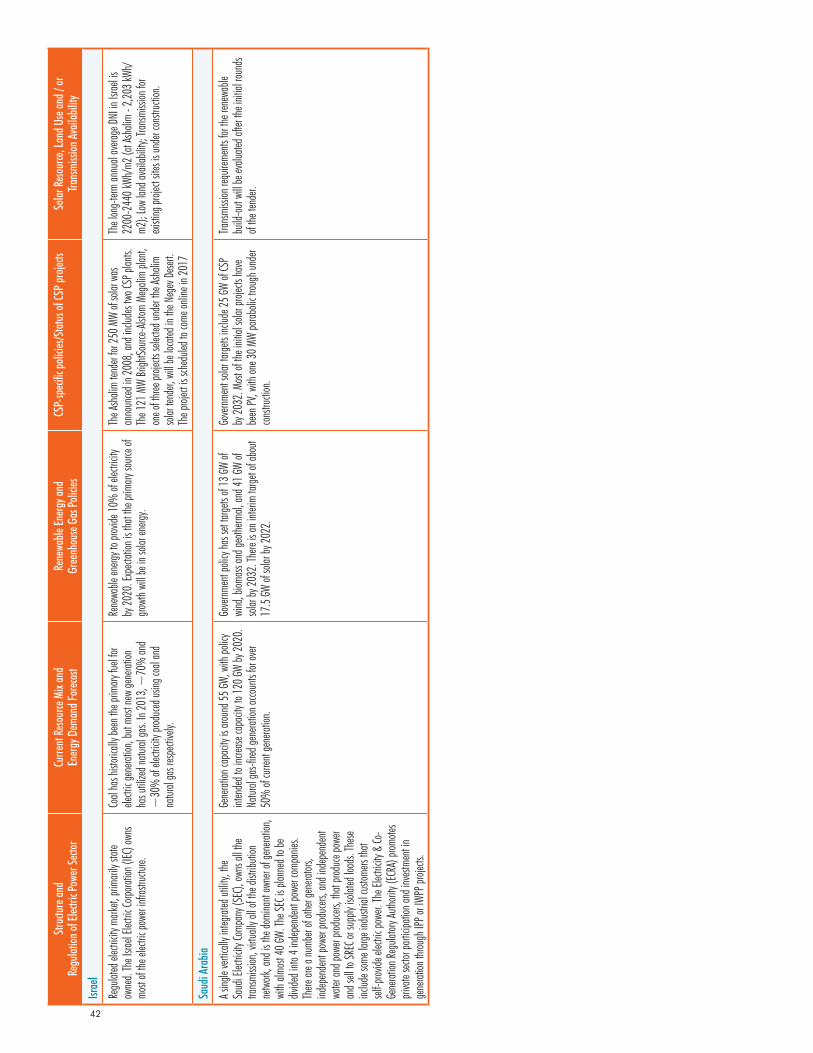
42
Stru
cture
and
Regu
lation
of El
ectri
c Pow
er Se
ctor
Curre
nt R
esou
rce M
ix an
d En
ergy
Dem
and F
orec
ast
Rene
wable
Ener
gy an
d Gr
eenh
ouse
Gas
Polic
iesCS
P-sp
ecifi
c poli
cies/S
tatu
s of C
SP pr
ojects
Solar
Res
ource
, Lan
d Use
and /
or
Trans
miss
ion A
vaila
bility
Israe
l
Regu
lated
elect
ricity
mark
et, pr
imari
ly sta
te ow
ned.
The I
srael
Electr
ic Co
rporat
ion (I
EC) o
wns
most
of the
elect
ric po
wer in
frastr
uctur
e.
Coal
has h
istori
cally
been
the p
rimary
fuel
for
electr
ic ge
nerat
ion, b
ut mo
st ne
w ge
nerat
ion
has u
tilize
d natu
ral ga
s. In
2013
, ~70
% an
d ~
30%
of el
ectric
ity pr
oduc
ed us
ing co
al an
d na
tural
gas r
espect
ively.
Rene
wable
energ
y to p
rovide
10%
of el
ectric
ity
by 20
20. E
xpect
ation
is th
at the
prim
ary so
urce o
f gro
wth w
ill be
in so
lar en
ergy.
The A
shali
m ten
der fo
r 250
MW
of so
lar w
as
anno
unced
in 20
08, a
nd in
clude
s two
CSP p
lants.
Th
e 121
MW
Brigh
tSourc
e-Alst
om M
egali
m pla
nt,
one o
f three
proje
cts se
lected
unde
r the
Asha
lim
solar
tend
er, w
ill be
loca
ted in
the N
egev
Dese
rt.
The p
roject
is sc
hedu
led to
come
onlin
e in 2
017
The l
ong-
term
annu
al av
erage
DNI
in Is
rael is
22
00-2
440 k
Wh/m
2 (at
Asha
lim -
2,203
kWh/
m2);
Low
land a
vaila
bility
; Tran
smiss
ion fo
r exi
sting
proje
ct sit
es is
unde
r con
struc
tion.
Saud
i Ara
bia
A sing
le ve
rticall
y inte
grated
utilit
y, the
Sa
udi E
lectric
ity Co
mpan
y (SE
C), ow
ns al
l the
trans
missi
on, v
irtuall
y all o
f the d
istrib
ution
ne
twork
, and
is th
e dom
inant
owne
r of g
enera
tion,
with
almos
t 40 G
W. Th
e SEC
is pl
anne
d to b
e div
ided i
nto 4
indep
ende
nt po
wer c
ompa
nies.
There
are a
numb
er of
other
gene
rators
, ind
epen
dent
powe
r prod
ucers
, and
inde
pend
ent
water
and p
ower
produ
cers,
that p
roduc
e pow
er an
d sell
to SR
EC or
supp
ly iso
lated
load
s. Th
ese
includ
e som
e larg
e ind
ustria
l cus
tomers
that
self-p
rovide
elect
ric po
wer. T
he El
ectric
ity &
Co-
Gene
ration
Regu
latory
Autho
rity (E
CRA)
prom
otes
priva
te sec
tor pa
rticipa
tion a
nd in
vestm
ent in
ge
nerat
ion th
rough
IPP o
r IWP
P proj
ects.
Gene
ration
capa
city i
s arou
nd 55
GW, w
ith po
licy
inten
ded t
o inc
rease
capa
city t
o 120
GW by
2020
. Na
tural
gas-fi
red ge
nerat
ion ac
coun
ts for
over
50%
of cu
rrent
gene
ration
.
Gove
rnmen
t poli
cy ha
s set
targe
ts of
13 GW
of
wind
, biom
ass a
nd ge
otherm
al, an
d 41 G
W of
solar
by 20
32. T
here
is an
inter
im ta
rget o
f abo
ut 17
.5 GW
of so
lar by
2022
.
Gove
rnmen
t sola
r targ
ets in
clude
25 GW
of CS
P by
2032
. Mos
t of th
e init
ial so
lar pr
ojects
have
be
en PV
, with
one 3
0 MW
parab
olic t
rough
unde
r co
nstru
ction
.
Trans
missi
on re
quire
ments
for t
he re
newa
ble
build
-out
will b
e eva
luated
after
the i
nitial
roun
ds
of the
tend
er.
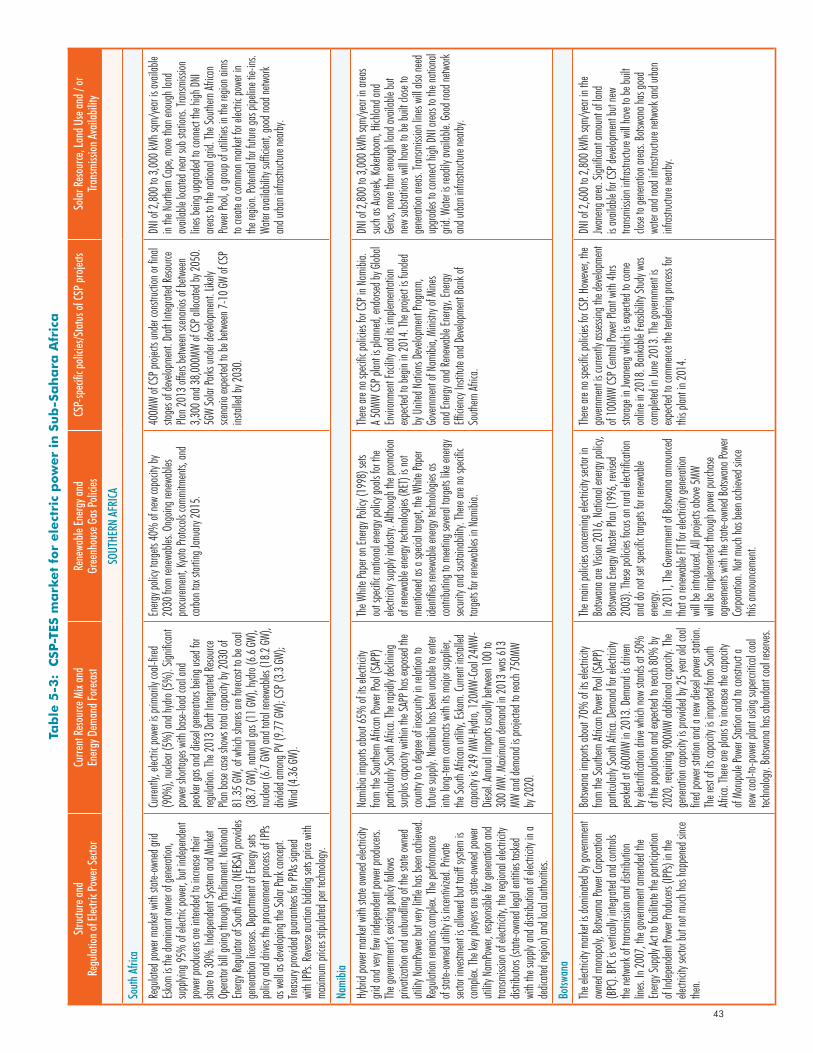
43
Tab
le 5
-3:
CSP
-TES
ma
rket
for
ele
ctri
c p
ow
er
in S
ub
-Sa
ha
ra A
fric
a
Stru
cture
and
Regu
lation
of El
ectri
c Pow
er Se
ctor
Curre
nt R
esou
rce M
ix an
d En
ergy
Dem
and F
orec
ast
Rene
wable
Ener
gy an
d Gr
eenh
ouse
Gas
Polic
iesCS
P-sp
ecifi
c poli
cies/S
tatu
s of C
SP pr
ojects
Solar
Res
ource
, Lan
d Use
and /
or
Trans
miss
ion A
vaila
bility
SOUT
HERN
AFR
ICA
Sout
h Afri
ca
Regu
lated
powe
r mark
et wi
th sta
te-ow
ned g
rid
Esko
m is
the do
mina
nt ow
ner o
f gen
eratio
n, su
pplyi
ng 95
% of
elect
ric po
wer, b
ut ind
epen
dent
powe
r prod
ucers
are i
ntend
ed to
incre
ase t
heir
share
to 30
%. In
depe
nden
t Syst
em an
d Mark
et Op
erator
bill g
oing t
hroug
h Parl
iamen
t. Nati
onal
Energ
y Reg
ulator
of So
uth Af
rica (
NERS
A) pr
ovide
s ge
nerat
ion lic
enses
. Dep
artme
nt of
Energ
y sets
po
licy a
nd dr
ives t
he pr
ocure
ment
proces
s of IP
Ps
as w
ell as
deve
loping
the S
olar P
ark co
ncep
t. Tre
asury
prov
ided g
uaran
tees f
or PP
As si
gned
wi
th IPP
s. Re
verse
aucti
on bi
dding
sets
price
with
maxim
um pr
ices s
tipula
ted pe
r tech
nolog
y.
Curre
ntly,
electr
ic po
wer is
prim
arily
coal-
fired
(90%
), nu
clear
(5%
) and
hydro
(5%
). Sig
nifica
nt po
wer s
horta
ges w
ith ba
se-loa
d coa
l and
pe
aker
gas a
nd di
esel g
enera
tors b
eing u
sed fo
r reg
ulatio
n. Th
e 201
3 Draf
t Inte
grated
Reso
urce
Plan b
ase c
ase s
hows
total
capa
city b
y 203
0 of
81.35
GW, o
f whic
h sha
res ar
e fore
cast
to be
coal
(38.7
GW),
natur
al ga
s (11
GW),
hydro
(6.6
GW),
nucle
ar (6
.7 GW
) and
total
rene
wable
s (18
.2 GW
), div
ided a
mong
PV (9
.77 GW
); CS
P (3.3
GW);
Wind
(4.36
GW).
Energ
y poli
cy tar
gets
40%
of ne
w ca
pacit
y by
2030
from
renew
ables
. Ong
oing r
enew
ables
pro
curem
ent, K
yoto
Protoc
ols co
mmitm
ents,
and
carbo
n tax
start
ing Ja
nuary
2015
.
400M
W of
CSP p
roject
s und
er co
nstru
ction
or fin
al sta
ges o
f dev
elopm
ent. D
raft I
ntegra
ted Re
sourc
e Pla
n 201
3 offe
rs be
twee
n scen
arios
of be
twee
n 3,3
00 an
d 38,0
00MW
of CS
P allo
cated
by 20
50.
5GW
Solar
Parks
unde
r dev
elopm
ent. L
ikely
scena
rio ex
pecte
d to b
e betw
een 7
-10 G
W of
CSP
instal
led by
2030
.
DNI o
f 2,80
0 to 3
,000 k
Wh sq
m/ye
ar is
avail
able
in the
Nort
hern
Cape
, more
than
enou
gh la
nd
avail
able
locate
d nea
r sub
stati
ons.
Trans
missi
on
lines
being
upgra
ded t
o con
nect
the hi
gh D
NI
areas
to th
e nati
onal
grid.
The S
outhe
rn Afr
ican
Powe
r Poo
l, a gr
oup o
f utili
ties i
n the
regio
n aim
s to
create
a co
mmon
mark
et for
elect
ric po
wer in
the
regio
n. Po
tentia
l for fu
ture g
as pi
pelin
e tie-
ins.
Water
avail
abilit
y suffi
cient,
good
road
netw
ork
and u
rban i
nfras
tructu
re ne
arby.
Nam
ibia
Hybri
d pow
er ma
rket w
ith st
ate ow
ned e
lectric
ity
grid a
nd ve
ry few
inde
pend
ent p
ower
produ
cers.
The g
overn
ment’
s exis
ting p
olicy
follow
s pri
vatiz
ation
and u
nbun
dling
of th
e stat
e own
ed
utility
Nam
Powe
r but
very
little
has b
een a
chiev
ed.
Regu
lation
rema
ins co
mplex
. The
perfo
rman
ce of
state-
owne
d utili
ty is
incen
tivize
d. Pri
vate
sector
inve
stmen
t is al
lowed
but ta
riff sy
stem
is co
mplex
. The
key p
layers
are s
tate-o
wned
powe
r uti
lity N
amPo
wer, r
espon
sible
for ge
nerat
ion an
d tra
nsmi
ssion
of el
ectric
ity, th
e reg
ional
electr
icity
distrib
utors
(state
-own
ed le
gal e
ntitie
s tas
ked
with
the su
pply
and d
istrib
ution
of el
ectric
ity in
a de
dicate
d reg
ion) a
nd lo
cal a
uthori
ties.
Nami
bia im
ports
abou
t 65%
of its
elect
ricity
fro
m the
South
ern Af
rican
Powe
r Poo
l (SA
PP)
partic
ularly
South
Afric
a. Th
e rap
idly d
eclini
ng
surpl
us ca
pacit
y with
in the
SAPP
has e
xpos
ed th
e co
untry
to a
degre
e of in
securi
ty in
relati
on to
fut
ure su
pply.
Nam
ibia h
as be
en un
able
to en
ter
into l
ong-
term
contr
acts
with
its m
ajor s
uppli
er,
the So
uth Af
rican
utilit
y, Es
kom.
Curre
nt ins
talled
ca
pacit
y is 2
49 M
W-Hy
dro, 1
20MW
-Coal
24MW
-Die
sel. A
nnua
l Impo
rts us
ually
betw
een 1
00 to
30
0 MW.
Max
imum
dema
nd in
2013
was
613
MW an
d dem
and i
s proj
ected
to re
ach 7
50MW
by
2020
.
The W
hite P
aper
on En
ergy P
olicy
(199
8) se
ts ou
t spe
cific n
ation
al en
ergy p
olicy
goals
for t
he
electr
icity
supp
ly ind
ustry
. Alth
ough
the p
romoti
on
of ren
ewab
le en
ergy t
echno
logies
(RET
) is n
ot me
ntion
ed as
a sp
ecial
targe
t, the
Whit
e Pap
er ide
ntifie
s ren
ewab
le en
ergy t
echno
logies
as
contr
ibutin
g to m
eetin
g sev
eral ta
rgets
like e
nergy
sec
urity
and s
ustai
nabil
ity. T
here
are no
speci
fic
targe
ts for
rene
wable
s in N
amibi
a.
There
are n
o spe
cific p
olicie
s for
CSP i
n Nam
ibia.
A 50M
W CS
P plan
t is pl
anne
d, en
dorse
d by G
lobal
Envir
onme
nt Fa
cility
and i
ts im
pleme
ntatio
n exp
ected
to be
gin in
2014
. The
proje
ct is
funde
d by
Unit
ed N
ation
s Dev
elopm
ent P
rogram
, Go
vernm
ent o
f Nam
ibia,
Minis
try of
Mine
s an
d Ene
rgy an
d Ren
ewab
le En
ergy,
Energ
y Effi
cienc
y Ins
titute
and D
evelo
pmen
t Ban
k of
South
ern Af
rica.
DNI o
f 2,80
0 to 3
,000 k
Wh sq
m/ye
ar in
areas
su
ch as
Ausn
ek, K
okerb
oom,
Hich
land a
nd
Gerus
, more
than
enou
gh la
nd av
ailab
le bu
t ne
w su
bstat
ions w
ill ha
ve to
be bu
ilt clo
se to
gene
ration
area
s. Tra
nsmi
ssion
lines
will a
lso ne
ed
upgra
des t
o con
nect
high D
NI ar
eas t
o the
natio
nal
grid.
Water
is re
adily
avail
able.
Good
road
netw
ork
and u
rban i
nfras
tructu
re ne
arby.
Botsw
ana
The e
lectric
ity m
arket
is do
mina
ted by
gove
rnmen
t ow
ned m
onop
oly, B
otswa
na Po
wer C
orpora
tion
(BPC
). BP
C is v
ertica
lly in
tegrat
ed an
d con
trols
the ne
twork
of tr
ansm
ission
and d
istrib
ution
lin
es. In
2007
, the g
overn
ment
amen
ded t
he
Energ
y Sup
ply Ac
t to fa
cilita
te the
partic
ipatio
n of
Indep
ende
nt Po
wer P
roduc
ers (I
PPs)
in the
ele
ctrici
ty sec
tor bu
t not
much
has h
appe
ned s
ince
then.
Botsw
ana i
mport
s abo
ut 70
% of
its el
ectric
ity
from
the So
uthern
Afric
an Po
wer P
ool (
SAPP
) pa
rticula
rly So
uth Af
rica.
Dema
nd fo
r elec
tricity
pe
aked
at 60
0MW
in 20
13. D
eman
d is d
riven
by
elect
rifica
tion d
rive w
hich n
ow st
ands
at 50
%
of the
popu
lation
and e
xpect
ed to
reac
h 80%
by
2020
, requ
iring 9
00MW
addit
ional
capa
city.
The
gene
ration
capa
city i
s prov
ided b
y 25 y
ear o
ld co
al fire
d pow
er sta
tion a
nd a
new
diesel
powe
r stat
ion.
The r
est of
its ca
pacit
y is i
mport
ed fro
m So
uth
Africa
. The
re are
plan
s to i
ncrea
se the
capa
city
of Mo
rupule
Powe
r Stat
ion an
d to c
onstr
uct a
ne
w co
al-to-
powe
r plan
t usin
g sup
ercriti
cal c
oal
techn
ology
. Bots
wana
has a
bund
ant c
oal re
serve
s.
The m
ain po
licies
conc
erning
elect
ricity
secto
r in
Botsw
ana a
re Vis
ion 20
16, N
ation
al en
ergy p
olicy,
Bo
tswan
a Ene
rgy M
aster
Plan
(199
6, rev
ised
2003
). Th
ese po
licies
focu
s on r
ural e
lectrifi
catio
n an
d do n
ot set
speci
fic ta
rgets
for re
newa
ble
energ
y. In
2011
, The
Gove
rnmen
t of B
otswa
na an
noun
ced
that a
rene
wable
FIT f
or ele
ctrici
ty ge
nerat
ion
will b
e intr
oduc
ed. A
ll proj
ects a
bove
5MW
will b
e imp
lemen
ted th
rough
powe
r purc
hase
agree
ments
with
the s
tate-o
wned
Botsw
ana P
ower
Corpo
ration
. Not
much
has b
een a
chiev
ed si
nce
this a
nnou
ncem
ent.
There
are n
o spe
cific p
olicie
s for
CSP.
Howe
ver, t
he
gove
rnmen
t is cu
rrentl
y asse
ssing
the d
evelo
pmen
t of
100M
W CS
P Cen
tral P
ower
Plant
with
4hrs
storag
e in J
wane
ng w
hich i
s exp
ected
to co
me
onlin
e in 2
018.
Bank
able
Feas
ibility
Stud
y was
co
mplet
ed in
June
2013
. The
gove
rnmen
t is
expect
ed to
comm
ence
the te
nderi
ng pr
ocess
for
this p
lant in
2014
.
DNI o
f 2,60
0 to 2
,800 k
Wh sq
m/ye
ar in
the
Jwan
eng a
rea. S
ignific
ant a
moun
t of la
nd
is av
ailab
le for
CSP d
evelo
pmen
t but
new
trans
missi
on in
frastr
uctur
e will
have
to be
built
close
to ge
nerat
ion ar
eas.
Botsw
ana h
as go
od
water
and r
oad i
nfras
tructu
re ne
twork
and u
rban
infras
tructu
re ne
arby.
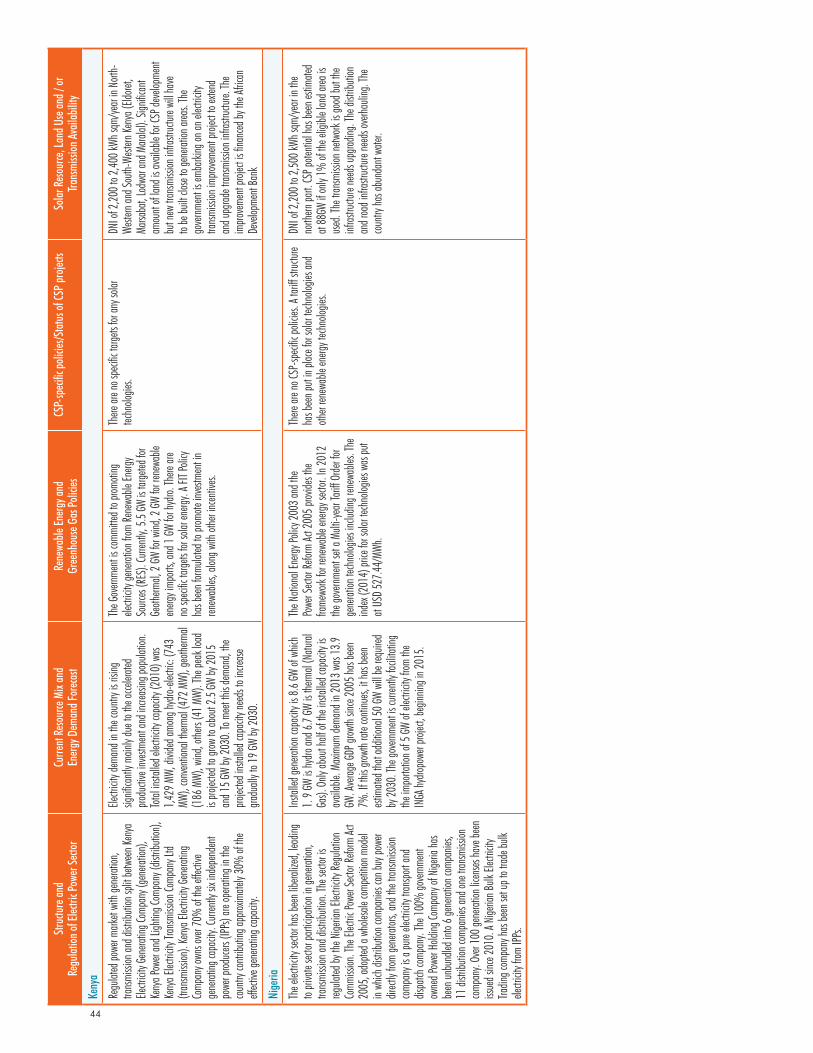
44
Stru
cture
and
Regu
lation
of El
ectri
c Pow
er Se
ctor
Curre
nt R
esou
rce M
ix an
d En
ergy
Dem
and F
orec
ast
Rene
wable
Ener
gy an
d Gr
eenh
ouse
Gas
Polic
iesCS
P-sp
ecifi
c poli
cies/S
tatu
s of C
SP pr
ojects
Solar
Res
ource
, Lan
d Use
and /
or
Trans
miss
ion A
vaila
bility
Keny
a
Regu
lated
powe
r mark
et wi
th ge
nerat
ion,
trans
missi
on an
d dist
ributi
on sp
lit be
twee
n Ken
ya
Electr
icity
Gene
rating
Comp
any (
gene
ration
), Ke
nya P
ower
and L
ightin
g Com
pany
(dist
ributi
on),
Keny
a Elec
tricity
Tran
smiss
ion Co
mpan
y Ltd
(tran
smiss
ion).
Keny
a Elec
tricity
Gene
rating
Co
mpan
y own
s ove
r 70%
of th
e effe
ctive
ge
nerat
ing ca
pacit
y. Cu
rrentl
y six
indep
ende
nt po
wer p
roduc
ers (I
PPs)
are op
eratin
g in t
he
coun
try co
ntribu
ting a
pprox
imate
ly 30
% of
the
effect
ive ge
nerat
ing ca
pacit
y.
Electr
icity
dema
nd in
the c
ountr
y is r
ising
sig
nifica
ntly m
ainly
due t
o the
accel
erated
pro
ducti
ve in
vestm
ent a
nd in
creas
ing po
pulat
ion.
Total
insta
lled e
lectric
ity ca
pacit
y (20
10) w
as
1,429
MW,
divid
ed am
ong h
ydro-
electr
ic: (7
43
MW),
conv
entio
nal th
ermal
(472
MW)
, geo
therm
al (1
86 M
W), w
ind, o
thers
(41 M
W). T
he pe
ak lo
ad
is pro
jected
to gr
ow to
abou
t 2.5
GW by
2015
an
d 15 G
W by
2030
. To m
eet th
is de
mand
, the
projec
ted in
stalle
d cap
acity
need
s to i
ncrea
se gra
duall
y to 1
9 GW
by 20
30.
The G
overn
ment
is co
mmitte
d to p
romoti
ng
electr
icity
gene
ration
from
Rene
wable
Energ
y So
urces
(RES
). Cu
rrentl
y, 5.5
GW is
targe
ted fo
r Ge
otherm
al, 2
GW fo
r wind
, 2 GW
for r
enew
able
energ
y imp
orts,
and 1
GW fo
r hyd
ro. Th
ere ar
e no
speci
fic ta
rgets
for so
lar en
ergy.
A FIT
Polic
y ha
s bee
n form
ulated
to pr
omote
inve
stmen
t in
renew
ables
, alon
g with
othe
r incen
tives.
There
are n
o spe
cific t
argets
for a
ny so
lar
techn
ologie
s. DN
I of 2
,200 t
o 2,40
0 kWh
sqm/
year
in No
rth-
Weste
rn an
d Sou
th-We
stern
Keny
a (Eld
oret,
Marsa
bat, L
odwa
r and
Mara
lal).
Signifi
cant
amou
nt of
land i
s ava
ilable
for C
SP de
velop
ment
but n
ew tr
ansm
ission
infra
struc
ture w
ill ha
ve
to be
built
close
to ge
nerat
ion ar
eas.
The
gove
rnmen
t is em
barki
ng on
an el
ectric
ity
trans
missi
on im
prove
ment
projec
t to ex
tend
and u
pgrad
e tran
smiss
ion in
frastr
uctur
e. Th
e im
prove
ment
projec
t is fin
anced
by th
e Afric
an
Deve
lopme
nt Ba
nk
Nige
ria
The e
lectric
ity se
ctor h
as be
en lib
eraliz
ed, le
ading
to
priva
te sec
tor pa
rticipa
tion i
n gen
eratio
n, tra
nsmi
ssion
and d
istrib
ution
. The
secto
r is
regula
ted by
the N
igeria
n Elec
tricity
Regu
lation
Co
mmiss
ion. T
he El
ectric
Powe
r Sect
or Re
form
Act
2005
, ado
pted a
who
lesale
comp
etitio
n mod
el in
which
distr
ibutio
n com
panie
s can
buy p
ower
direct
ly fro
m ge
nerat
ors, a
nd th
e tran
smiss
ion
comp
any i
s a pu
re ele
ctrici
ty tra
nspo
rt an
d dis
patch
comp
any.
The 1
00%
gove
rnmen
t ow
ned P
ower
Holdi
ng Co
mpan
y of N
igeria
has
been
unbu
ndled
into
6 gen
eratio
n com
panie
s, 11
distr
ibutio
n com
panie
s and
one t
ransm
ission
co
mpan
y. Ov
er 10
0 gen
eratio
n lice
nses
have
been
iss
ued s
ince 2
010.
A Nige
rian B
ulk El
ectric
ity
Tradin
g com
pany
has b
een s
et up
to tr
ade b
ulk
electr
icity
from
IPPs.
Instal
led ge
nerat
ion ca
pacit
y is 8
.6 GW
of w
hich
1. 9 G
W is
hydro
and 6
.7 GW
is th
ermal
(Natu
ral
Gas).
Only
abou
t half
of th
e ins
talled
capa
city i
s av
ailab
le. M
axim
um de
mand
in 20
13 w
as 13
.9 GW
. Ave
rage G
DP gr
owth
since
2005
has b
een
7%. If
this
growt
h rate
conti
nues,
it ha
s bee
n est
imate
d tha
t add
itiona
l 50 G
W wi
ll be r
equir
ed
by 20
30. T
he go
vernm
ent is
curre
ntly f
acilit
ating
the
impo
rtatio
n of 5
GW of
elect
ricity
from
the
INGA
hydro
powe
r proj
ect, b
eginn
ing in
2015
.
The N
ation
al En
ergy P
olicy
2003
and t
he
Powe
r Sect
or Re
form
Act 2
005 p
rovide
s the
fra
mewo
rk for
rene
wable
energ
y sect
or. In
2012
the
gove
rnmen
t set
a Mult
i-yea
r Tari
ff Orde
r for
gene
ration
tech
nolog
ies in
cludin
g ren
ewab
les. T
he
index
(201
4) pr
ice fo
r sola
r tech
nolog
ies w
as pu
t at
USD
527.4
4/MW
h.
There
are n
o CSP
-speci
fic po
licies
. A ta
riff st
ructur
e ha
s bee
n put
in pla
ce for
solar
tech
nolog
ies an
d oth
er ren
ewab
le en
ergy t
echno
logies
.
DNI o
f 2,20
0 to 2
,500 k
Wh sq
m/ye
ar in
the
north
ern pa
rt. CS
P pote
ntial
has b
een e
stima
ted
at 88
GW if
only
1% of
the e
ligibl
e lan
d area
is
used
. The
tran
smiss
ion ne
twork
is go
od bu
t the
infras
tructu
re ne
eds u
pgrad
ing. T
he di
stribu
tion
and r
oad i
nfras
tructu
re ne
eds o
verha
uling
. The
co
untry
has a
bund
ant w
ater.
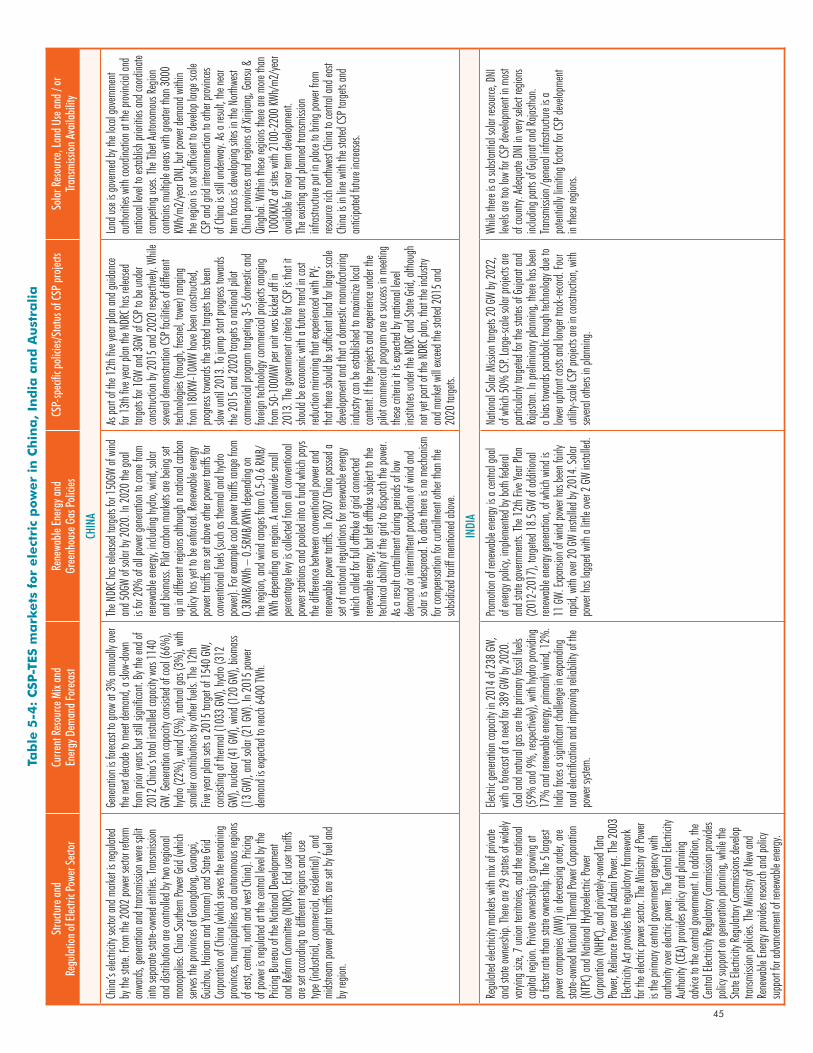
45
Tab
le 5
-4:
CSP
-TES
ma
rkets
fo
r ele
ctri
c p
ow
er
in C
hin
a,
Ind
ia a
nd
Au
stra
lia
Stru
cture
and
Regu
lation
of El
ectri
c Pow
er Se
ctor
Curre
nt R
esou
rce M
ix an
d En
ergy
Dem
and F
orec
ast
Rene
wable
Ener
gy an
d Gr
eenh
ouse
Gas
Polic
iesCS
P-sp
ecifi
c poli
cies/S
tatu
s of C
SP pr
ojects
Solar
Res
ource
, Lan
d Use
and /
or
Trans
miss
ion A
vaila
bility
CHIN
A
China
’s ele
ctrici
ty sec
tor an
d mark
et is
regula
ted
by th
e stat
e. Fro
m the
2002
powe
r sect
or ref
orm
onwa
rds, g
enera
tion a
nd tr
ansm
ission
were
split
into s
epara
te sta
te-ow
ned e
ntitie
s. Tra
nsmi
ssion
an
d dist
ributi
on ar
e con
trolle
d by t
wo re
giona
l mo
nopo
lies:
China
South
ern Po
wer G
rid (w
hich
serve
s the
prov
inces
of Gu
angd
ong,
Guan
gxi,
Guizh
ou, H
ainan
and Y
unna
n) an
d Stat
e Grid
Co
rporat
ion of
China
(whic
h serv
es the
rema
ining
pro
vinces
, mun
icipa
lities
and a
utono
mous
regio
ns
of ea
st, ce
ntral,
north
and w
est Ch
ina).
Pricin
g of
powe
r is re
gulat
ed at
the c
entra
l leve
l by t
he
Pricin
g Bure
au of
the N
ation
al De
velop
ment
and R
eform
Comm
ittee (
NDRC
). En
d user
tariff
s are
set a
ccordi
ng to
diffe
rent r
egion
s and
use
type (
indus
trial, c
omme
rcial,
resid
entia
l) , a
nd
mids
tream
powe
r plan
t tariff
s are
set by
fuel
and
by re
gion.
Gene
ration
is fo
recas
t to gr
ow at
3% an
nuall
y ove
r the
next
deca
de to
mee
t dem
and,
a slow
-dow
n fro
m pri
or ye
ars bu
t still
sign
ifican
t. By t
he en
d of
2012
China
’s tot
al ins
talled
capa
city w
as 11
40
GW. G
enera
tion c
apac
ity co
nsist
ed of
coal
(66%
), hy
dro (2
2%),
wind
(5%
), na
tural
gas (
3%),
with
small
er co
ntribu
tions
by ot
her fu
els. T
he 12
th Fiv
e yea
r plan
sets
a 201
5 targ
et of
1540
GW,
cons
isting
of th
ermal
(103
3 GW)
, hyd
ro (3
12
GW),
nucle
ar (4
1 GW)
, wind
(120
GW),
bioma
ss (1
3 GW)
, and
solar
(21 G
W). In
2015
powe
r de
mand
is ex
pecte
d to r
each
6400
TWh.
The N
DRC h
as re
leased
targe
ts for
150G
W of
wind
an
d 50G
W of
solar
by 20
20. In
2020
the g
oal
is for
20%
of al
l pow
er ge
nerat
ion to
come
from
renew
able
energ
y, inc
luding
hydro
, wind
, sola
r an
d biom
ass.
Pilot
carbo
n mark
ets ar
e bein
g set
up in
diffe
rent r
egion
s alth
ough
a na
tiona
l carb
on
polic
y has
yet to
be en
forced
. Ren
ewab
le en
ergy
powe
r tari
ffs ar
e set
abov
e othe
r pow
er tar
iffs fo
r co
nven
tiona
l fuels
(suc
h as t
herm
al an
d hyd
ro po
wer).
For e
xamp
le co
al po
wer t
ariffs
rang
e from
0.3
RMB/
KWh –
0.5R
MB/K
Wh de
pend
ing on
the
regio
n, an
d wind
rang
es fro
m 0.5
-0.6
RMB/
KWh d
epen
ding o
n reg
ion. A
natio
nwide
small
pe
rcenta
ge le
vy is
colle
cted f
rom al
l con
venti
onal
powe
r stat
ions a
nd po
oled i
nto a
fund w
hich p
ays
the di
fferen
ce be
twee
n con
venti
onal
powe
r and
ren
ewab
le po
wer t
ariffs
. In 20
07 Ch
ina pa
ssed a
set
of na
tiona
l regu
lation
s for
renew
able
energ
y wh
ich ca
lled f
or ful
l offta
ke of
grid
conn
ected
ren
ewab
le en
ergy,
but le
ft offta
ke su
bject
to the
tec
hnica
l abil
ity of
the g
rid to
disp
atch t
he po
wer.
As a
result
curta
ilmen
t duri
ng pe
riods
of lo
w de
mand
or in
termi
ttent
produ
ction
of w
ind an
d so
lar is
wide
sprea
d. To
date
there
is no
mech
anism
for
comp
ensa
tion f
or cu
rtailm
ent o
ther t
han t
he
subs
idize
d tari
ff men
tione
d abo
ve.
As pa
rt of
the 12
th fiv
e yea
r plan
and g
uidan
ce for
13th
five y
ear p
lan th
e NDR
C has
relea
sed
targe
ts for
1GW
and 3
GW of
CSP t
o be u
nder
cons
tructi
on by
2015
and 2
020 r
espect
ively.
Whil
e sev
eral d
emon
strati
on CS
P fac
ilities
of di
fferen
t tec
hnolo
gies (
troug
h, fre
snel,
towe
r) ran
ging
from
180K
W-10
MW ha
ve be
en co
nstru
cted,
progre
ss tow
ards t
he st
ated t
argets
has b
een
slow
until
2013
. To j
ump s
tart p
rogres
s tow
ards
the 20
15 an
d 202
0 targ
ets a
natio
nal p
ilot
comm
ercial
prog
ram ta
rgetin
g 3-5
dome
stic a
nd
foreig
n tech
nolog
y com
merci
al pro
jects
rangin
g fro
m 50
-100
MW pe
r unit
was
kicke
d off i
n 20
13. T
he go
vernm
ent c
riteria
for C
SP is
that
it sh
ould
be ec
onom
ic wi
th a f
uture
trend
in co
st red
uctio
n mirro
ring t
hat e
xperi
enced
with
PV;
that th
ere sh
ould
be su
fficien
t land
for la
rge sc
ale
deve
lopme
nt an
d tha
t a do
mesti
c man
ufactu
ring
indus
try ca
n be e
stabli
shed
to m
axim
ize lo
cal
conte
nt. If
the pr
ojects
and e
xperi
ence
unde
r the
pil
ot co
mmerc
ial pr
ogram
are a
succe
ss in
meeti
ng
these
criter
ia it i
s exp
ected
by na
tiona
l leve
l ins
titutes
unde
r the
NDR
C and
State
Grid,
altho
ugh
not y
et pa
rt of
the N
DRC p
lan, th
at the
indu
stry
and m
arket
will e
xceed
the s
tated
2015
and
2020
targe
ts.
Land
use i
s gov
erned
by th
e loc
al go
vernm
ent
autho
rities
with
coord
inatio
n at th
e prov
incial
and
natio
nal le
vel to
estab
lish p
rioriti
es an
d coo
rdina
te co
mpeti
ng us
es. Th
e Tibe
t Auto
nomo
us Re
gion
conta
ins m
ultipl
e area
s with
grea
ter th
an 30
00
KWh/
m2/ye
ar DN
I, but
powe
r dem
and w
ithin
the re
gion i
s not
suffic
ient to
deve
lop la
rge sc
ale
CSP a
nd gr
id int
ercon
necti
on to
othe
r prov
inces
of Ch
ina is
still
unde
rway
. As a
resu
lt, the
near
term
focus
is de
velop
ing si
tes in
the N
orthw
est
China
prov
inces
and r
egion
s of X
injian
g, Ga
nsu &
Qi
ngha
i. With
in the
se reg
ions t
here
are m
ore th
an
1000
KM2 o
f site
s with
2100
-220
0 KWh
/m2/
year
avail
able
for ne
ar ter
m de
velop
ment.
Th
e exis
ting a
nd pl
anne
d tran
smiss
ion
infras
tructu
re pu
t in pl
ace t
o brin
g pow
er fro
m res
ource
rich n
orthw
est Ch
ina to
centr
al an
d eas
t Ch
ina is
in lin
e with
the s
tated
CSP t
argets
and
antic
ipated
futur
e inc
reases
.
INDI
A
Regu
lated
elect
ricity
mark
ets w
ith m
ix of
priva
te an
d stat
e own
ership
. The
re are
29 st
ates o
f wide
ly va
rying
size
, 7 un
ion te
rritori
es, an
d the
natio
nal
capit
al reg
ion. P
rivate
owne
rship
is gro
wing
at
a fas
ter ra
te tha
n stat
e own
ership
. The
5 lar
gest
powe
r com
panie
s (MW
) in d
ecrea
sing o
rder, a
re sta
te-ow
ned N
ation
al Th
ermal
Powe
r Corp
oratio
n (N
TPC)
and N
ation
al Hy
droele
ctric
Powe
r Co
rporat
ion (N
HPC),
and p
rivate
ly-ow
ned T
ata
Powe
r, Reli
ance
Powe
r and
Adan
i Pow
er. Th
e 200
3 Ele
ctrici
ty Ac
t prov
ides t
he re
gulat
ory fra
mewo
rk for
the e
lectric
powe
r sect
or. Th
e Mini
stry o
f Pow
er is
the pr
imary
centr
al go
vernm
ent a
genc
y with
au
thority
over
electr
ic po
wer. T
he Ce
ntral
Electr
icity
Autho
rity (C
EA) p
rovide
s poli
cy an
d plan
ning
advic
e to t
he ce
ntral
gove
rnmen
t. In a
dditio
n, the
Ce
ntral
Electr
icity
Regu
latory
Comm
ission
prov
ides
polic
y sup
port
on ge
nerat
ion pl
annin
g, wh
ile th
e Sta
te Ele
ctrici
ty Re
gulat
ory Co
mmiss
ions d
evelo
p tra
nsmi
ssion
polic
ies. T
he M
inistr
y of N
ew an
d Re
newa
ble En
ergy p
rovide
s rese
arch a
nd po
licy
supp
ort fo
r adv
ancem
ent o
f rene
wable
energ
y.
Electr
ic ge
nerat
ion ca
pacit
y in 2
014 o
f 238
GW,
with
a fore
cast
of a n
eed f
or 38
9 GW
by 20
20.
Coal
and n
atural
gas a
re the
prim
ary fo
ssil fu
els
(59%
and 9
%, re
spect
ively)
, with
hydro
prov
iding
17
% an
d ren
ewab
le en
ergy,
prima
rily w
ind, 1
2%.
India
faces
a sign
ifican
t cha
lleng
e in e
xpan
ding
rural
electr
ificati
on an
d imp
roving
relia
bility
of th
e po
wer s
ystem
.
Promo
tion o
f rene
wable
energ
y is a
centr
al go
al of
energ
y poli
cy, im
pleme
nted b
y both
fede
ral
and s
tate g
overn
ments
. The
12th
Five Y
ear P
lan
(201
2-20
17),
targe
ted 18
.5 GW
of ad
dition
al ren
ewab
le en
ergy g
enera
tion,
of wh
ich w
ind is
11
GW. E
xpan
sion o
f wind
powe
r has
been
fairly
rap
id, w
ith ov
er 20
GW in
stalle
d by 2
014.
Solar
po
wer h
as la
gged
with
a litt
le ov
er 2 G
W ins
talled
.
Natio
nal S
olar M
ission
targe
ts 20
GW by
2022
, of
which
50%
CSP.
Large
-scale
solar
proje
cts ar
e pa
rticula
rly ta
rgeted
for t
he st
ates o
f Guja
rat an
d Ra
jastan
. In pr
elimi
nary
plann
ing, th
ere ha
s bee
n a b
ias to
wards
parab
olic t
rough
tech
nolog
y due
to
lower
upfro
nt co
sts an
d lon
ger t
rack-r
ecord.
Four
utility
-scale
CSP p
roject
s are
in co
nstru
ction
, with
sev
eral o
thers
in pla
nning
.
While
there
is a
subs
tantia
l sola
r reso
urce,
DNI
levels
are t
oo lo
w for
CSP d
evelo
pmen
t in m
ost
of co
untry
. Ade
quate
DNI
in ve
ry sel
ect re
gions
inc
luding
parts
of Gu
jarat
and R
ajasth
an.
Trans
missi
on /g
enera
l infra
struc
ture i
s a
poten
tially
limitin
g fac
tor fo
r CSP
deve
lopme
nt
in the
se reg
ions.
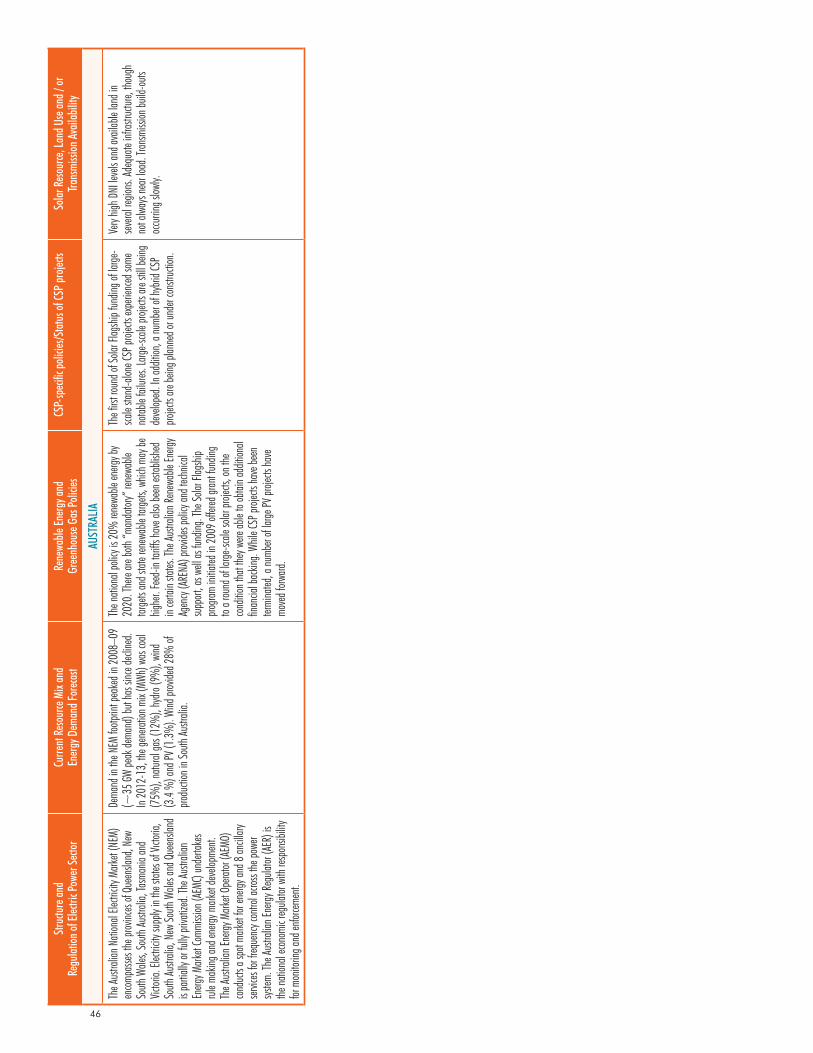
46
Stru
cture
and
Regu
lation
of El
ectri
c Pow
er Se
ctor
Curre
nt R
esou
rce M
ix an
d En
ergy
Dem
and F
orec
ast
Rene
wable
Ener
gy an
d Gr
eenh
ouse
Gas
Polic
iesCS
P-sp
ecifi
c poli
cies/S
tatu
s of C
SP pr
ojects
Solar
Res
ource
, Lan
d Use
and /
or
Trans
miss
ion A
vaila
bility
AUST
RALI
A
The A
ustra
lian N
ation
al Ele
ctrici
ty Ma
rket (
NEM)
en
comp
asses
the p
rovinc
es of
Quee
nslan
d, Ne
w So
uth W
ales,
South
Austr
alia,
Tasm
ania
and
Victor
ia. El
ectric
ity su
pply
in the
state
s of V
ıctori
a, So
uth Au
strali
a, Ne
w So
uth W
ales a
nd Q
ueen
sland
is
partia
lly or
fully
priva
tized
. The
Austr
alian
En
ergy M
arket
Comm
ission
(AEM
C) un
derta
kes
rule m
aking
and e
nergy
mark
et de
velop
ment.
Th
e Aus
tralia
n Ene
rgy M
arket
Opera
tor (A
EMO)
co
nduc
ts a s
pot m
arket
for en
ergy a
nd 8
ancil
lary
servic
es for
frequ
ency
contr
ol ac
ross t
he po
wer
system
. The
Austr
alian
Energ
y Reg
ulator
(AER
) is
the na
tiona
l eco
nomi
c reg
ulator
with
resp
onsib
ility
for m
onito
ring a
nd en
forcem
ent.
Dema
nd in
the N
EM fo
otprin
t pea
ked i
n 200
8–09
(~
35 GW
peak
dema
nd) b
ut ha
s sinc
e decl
ined.
In 20
12-1
3, the
gene
ration
mix
(MWh
) was
coal
(75%
), na
tural
gas (
12%
), hy
dro (9
%),
wind
(3
.4 %
) and
PV (1
.3%).
Wind
prov
ided 2
8% of
pro
ducti
on in
South
Austr
alia.
The n
ation
al po
licy i
s 20%
rene
wable
energ
y by
2020
. The
re are
both
“man
dator
y” re
newa
ble
targe
ts an
d stat
e ren
ewab
le tar
gets,
whic
h may
be
highe
r. Fee
d-in
tariffs
have
also
been
estab
lishe
d in
certai
n stat
es. Th
e Aus
tralia
n Ren
ewab
le En
ergy
Agen
cy (A
RENA
) prov
ides p
olicy
and t
echnic
al su
pport
, as w
ell as
fund
ing. T
he So
lar Fl
agsh
ip pro
gram
initia
ted in
2009
offer
ed gr
ant fu
nding
to
a rou
nd of
large
-scale
solar
proje
cts, o
n the
co
nditio
n tha
t they
were
able
to ob
tain a
dditio
nal
finan
cial b
ackin
g. Wh
ile CS
P proj
ects h
ave b
een
termi
nated
, a nu
mber
of lar
ge PV
proje
cts ha
ve
move
d forw
ard.
The fi
rst ro
und o
f Sola
r Flag
ship
fundin
g of la
rge-
scale
stand
-alon
e CSP
proje
cts ex
perie
nced
some
no
table
failur
es. La
rge-sc
ale pr
ojects
are s
till be
ing
deve
loped
. In ad
dition
, a nu
mber
of hy
brid C
SP
projec
ts are
being
plan
ned o
r und
er co
nstru
ction
.
Very
high D
NI le
vels
and a
vaila
ble la
nd in
sev
eral re
gions
. Ade
quate
infra
struc
ture,
thoug
h no
t alw
ays n
ear lo
ad. T
ransm
ission
build
-outs
oc
currin
g slow
ly.
B E N E F I T S O F C S P W I T H T H E R M A L S T O R A G E
47
6. Looking to the Future: Simulating Power Systems under High Renewable ScenariosA consistent finding in recent studies is that the comparative economic benefits of CSP with thermal energy storage, relative to variable solar resources, increase significantly as variable solar and wind energy production expands. Power systems around the world are already undergoing significant operational changes due to the introduction of large-scale wind and solar generation. With the help of more detailed power system models, a clearer picture is now emerging about the system conditions that could be addressed by CSP with thermal energy storage.
This section examines three primary dimensions to the changes to power system planning and operations created by high-penetration renewable scenarios:
• Section 6.1 examines the composition of alternative high penetration portfolios of renewable energy, with a focus on how different resources are added to the portfolio.
• Section 6.2 shows how long-term supply adequacy, often called resource adequacy or capacity requirements, may change in high-penetration solar scenarios.
• Section 6.3 reviews key system operational features of future high-penetration renewable scenarios.
6.1 High Penetration Renewable Resource Scenarios
High penetration of renewable resources on the power grid is occurring in many markets across the world, with some major power systems having already achieved 20-30% renewable energy on an annual basis. The high penetration solar studies reviewed in this report examine scenarios that were constructed in several ways. Some scenarios reflect existing renewable policy goals, such as the California 33% RPS (e.g., CAISO 2011; Denholm et al., 2013) while others are hypothetical scenarios that examine penetration exceeding existing policies, such as 40% or greater renewable energy (e.g., Jorgenson et al., 2014; NREL 2012). Scenario development is typically based on multiple criteria, including:
• Renewable policy goals, including long-term de-carbonization targets, e.g., as embodied in California’s greenhouse gas reduction goals for 2050
• Cost projections in target years for alternative renewable technologies as well as technologies potentially needed for integration, such as storage and demand response
• Environmental constraints on renewable resource development • Transmission constraints on renewable resource development• Operational constraints affecting renewable integration
The high-penetration studies to date which model CSP with thermal energy storage are summarized in Table 6-1. In California, the work of CAISO (2011) and Denholm et al., (2013) utilize the same 33% RPS scenarios, which are used to guide utility procurement and system planning. The next phase of California planning currently underway includes 40% RPS scenarios, as well as possibly 50% cases. Jorgenson et al., (2014) model a hypothetical 40% RPS scenario, using a CPUC 33% RPS scenario as a starting point. Also in the western U.S., transmission planning studies by the Western Electricity Coordinating Council (WECC 2011) examine alternative scenarios for high penetration of renewables and adjust the proportion of CSP in the portfolio on a cost-benefit basis.
As several studies show, CSP with thermal energy storage increases in value as the penetration of renewables increases in a power system. High-renewable power systems experience increased variability in the hourly supply of energy, less certainty about long-term supply adequacy, and the need for more operational flexibility. CSP with thermal storage can mitigate all these long-term operational and reliability challenges.
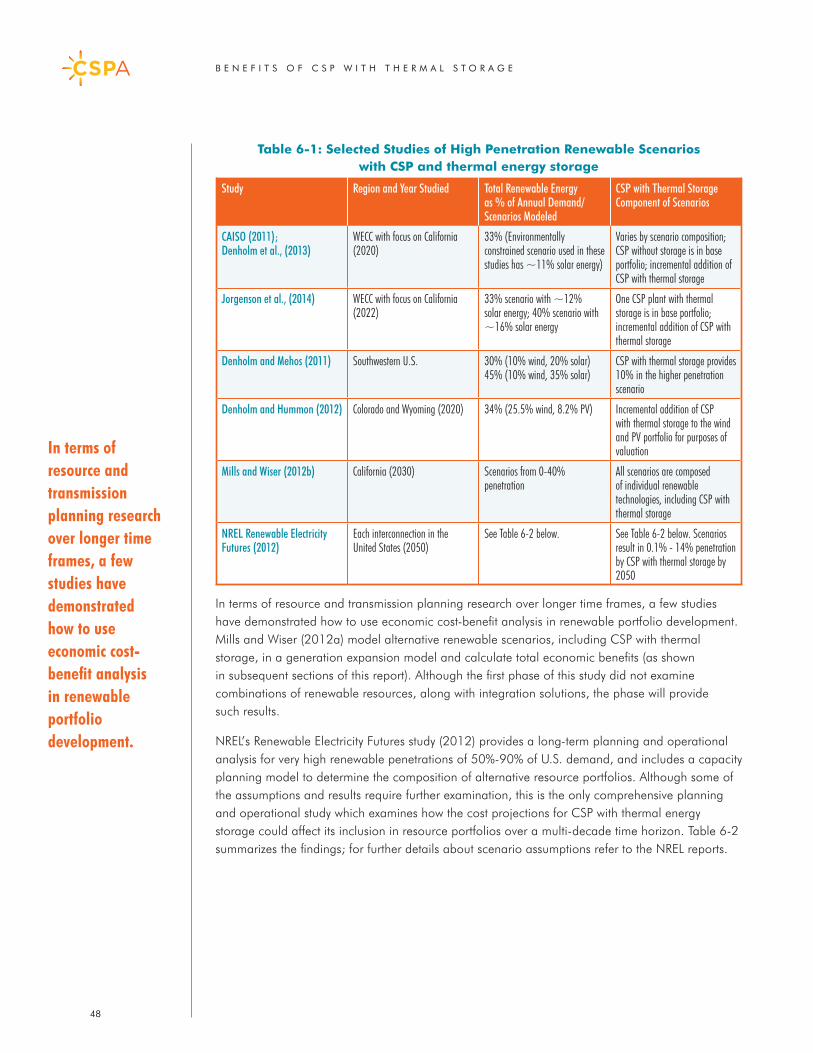
B E N E F I T S O F C S P W I T H T H E R M A L S T O R A G E
48
Table 6-1: Selected Studies of High Penetration Renewable Scenarios with CSP and thermal energy storage
In terms of resource and transmission planning research over longer time frames, a few studies have demonstrated how to use economic cost-benefit analysis in renewable portfolio development. Mills and Wiser (2012a) model alternative renewable scenarios, including CSP with thermal storage, in a generation expansion model and calculate total economic benefits (as shown in subsequent sections of this report). Although the first phase of this study did not examine combinations of renewable resources, along with integration solutions, the phase will provide such results.
NREL’s Renewable Electricity Futures study (2012) provides a long-term planning and operational analysis for very high renewable penetrations of 50%-90% of U.S. demand, and includes a capacity planning model to determine the composition of alternative resource portfolios. Although some of the assumptions and results require further examination, this is the only comprehensive planning and operational study which examines how the cost projections for CSP with thermal energy storage could affect its inclusion in resource portfolios over a multi-decade time horizon. Table 6-2 summarizes the findings; for further details about scenario assumptions refer to the NREL reports.
Study Region and Year Studied Total Renewable Energy as % of Annual Demand/Scenarios Modeled
CSP with Thermal Storage Component of Scenarios
CAISO (2011); Denholm et al., (2013)
WECC with focus on California (2020)
33% (Environmentally constrained scenario used in these studies has ~11% solar energy)
Varies by scenario composition; CSP without storage is in base portfolio; incremental addition of CSP with thermal storage
Jorgenson et al., (2014) WECC with focus on California (2022)
33% scenario with ~12% solar energy; 40% scenario with ~16% solar energy
One CSP plant with thermal storage is in base portfolio; incremental addition of CSP with thermal storage
Denholm and Mehos (2011) Southwestern U.S. 30% (10% wind, 20% solar) 45% (10% wind, 35% solar)
CSP with thermal storage provides 10% in the higher penetration scenario
Denholm and Hummon (2012) Colorado and Wyoming (2020) 34% (25.5% wind, 8.2% PV) Incremental addition of CSP with thermal storage to the wind and PV portfolio for purposes of valuation
Mills and Wiser (2012b) California (2030) Scenarios from 0-40% penetration
All scenarios are composed of individual renewable technologies, including CSP with thermal storage
NREL Renewable Electricity Futures (2012)
Each interconnection in the United States (2050)
See Table 6-2 below. See Table 6-2 below. Scenarios result in 0.1% - 14% penetration by CSP with thermal storage by 2050
In terms of resource and transmission planning research over longer time frames, a few studies have demonstrated how to use economic cost-benefit analysis in renewable portfolio development.
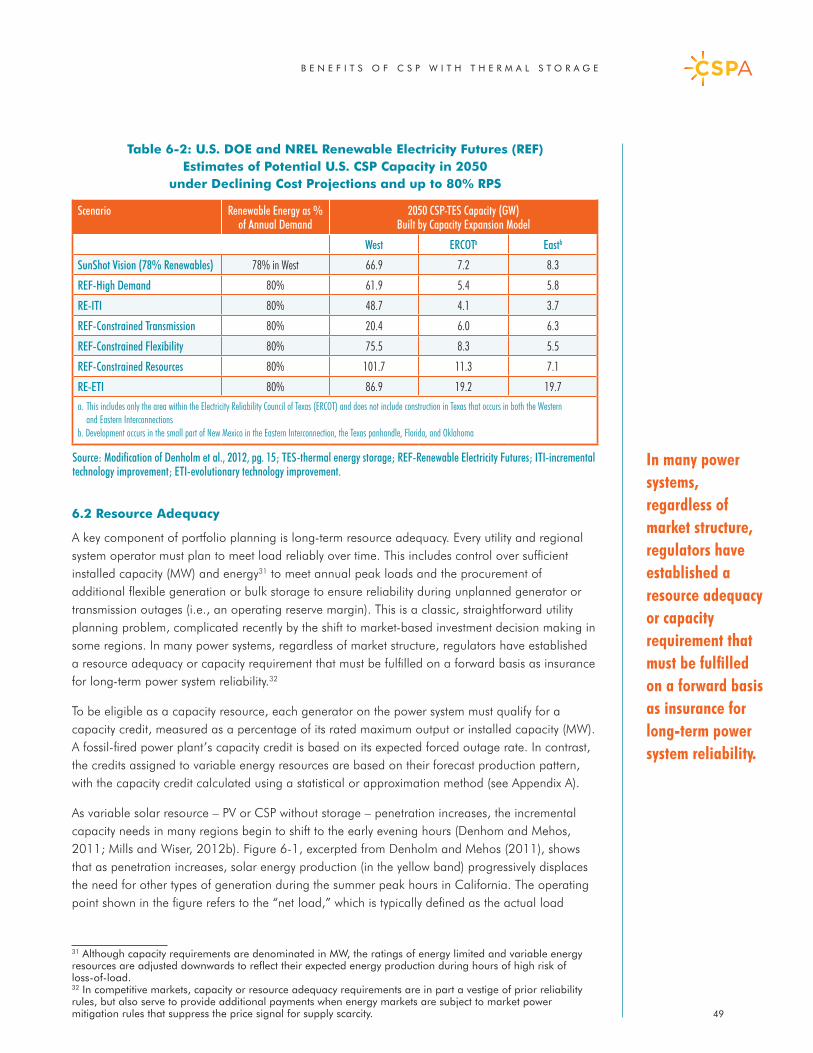
B E N E F I T S O F C S P W I T H T H E R M A L S T O R A G E
49
Table 6-2: U.S. DOE and NREL Renewable Electricity Futures (REF) Estimates of Potential U.S. CSP Capacity in 2050
under Declining Cost Projections and up to 80% RPS
6.2 Resource Adequacy
A key component of portfolio planning is long-term resource adequacy. Every utility and regional system operator must plan to meet load reliably over time. This includes control over sufficient installed capacity (MW) and energy31 to meet annual peak loads and the procurement of additional flexible generation or bulk storage to ensure reliability during unplanned generator or transmission outages (i.e., an operating reserve margin). This is a classic, straightforward utility planning problem, complicated recently by the shift to market-based investment decision making in some regions. In many power systems, regardless of market structure, regulators have established a resource adequacy or capacity requirement that must be fulfilled on a forward basis as insurance for long-term power system reliability.32
To be eligible as a capacity resource, each generator on the power system must qualify for a capacity credit, measured as a percentage of its rated maximum output or installed capacity (MW). A fossil-fired power plant’s capacity credit is based on its expected forced outage rate. In contrast, the credits assigned to variable energy resources are based on their forecast production pattern, with the capacity credit calculated using a statistical or approximation method (see Appendix A).
As variable solar resource – PV or CSP without storage – penetration increases, the incremental capacity needs in many regions begin to shift to the early evening hours (Denhom and Mehos, 2011; Mills and Wiser, 2012b). Figure 6-1, excerpted from Denholm and Mehos (2011), shows that as penetration increases, solar energy production (in the yellow band) progressively displaces the need for other types of generation during the summer peak hours in California. The operating point shown in the figure refers to the “net load,” which is typically defined as the actual load
31 Although capacity requirements are denominated in MW, the ratings of energy limited and variable energy resources are adjusted downwards to reflect their expected energy production during hours of high risk of loss-of-load.32 In competitive markets, capacity or resource adequacy requirements are in part a vestige of prior reliability rules, but also serve to provide additional payments when energy markets are subject to market power mitigation rules that suppress the price signal for supply scarcity.
Scenario Renewable Energy as % of Annual Demand
2050 CSP-TES Capacity (GW) Built by Capacity Expansion Model
West ERCOTa Eastb
SunShot Vision (78% Renewables) 78% in West 66.9 7.2 8.3
REF-High Demand 80% 61.9 5.4 5.8
RE-ITI 80% 48.7 4.1 3.7
REF-Constrained Transmission 80% 20.4 6.0 6.3
REF-Constrained Flexibility 80% 75.5 8.3 5.5
REF-Constrained Resources 80% 101.7 11.3 7.1
RE-ETI 80% 86.9 19.2 19.7a. This includes only the area within the Electricity Reliability Council of Texas (ERCOT) and does not include construction in Texas that occurs in both the Western and Eastern Interconnectionsb. Development occurs in the small part of New Mexico in the Eastern Interconnection, the Texas panhandle, Florida, and Oklahoma
Source: Modification of Denholm et al., 2012, pg. 15; TES-thermal energy storage; REF-Renewable Electricity Futures; ITI-incremental technology improvement; ETI-evolutionary technology improvement.
In many power systems, regardless of market structure, regulators have established a resource adequacy or capacity requirement that must be fulfilled on a forward basis as insurance for long-term power system reliability.
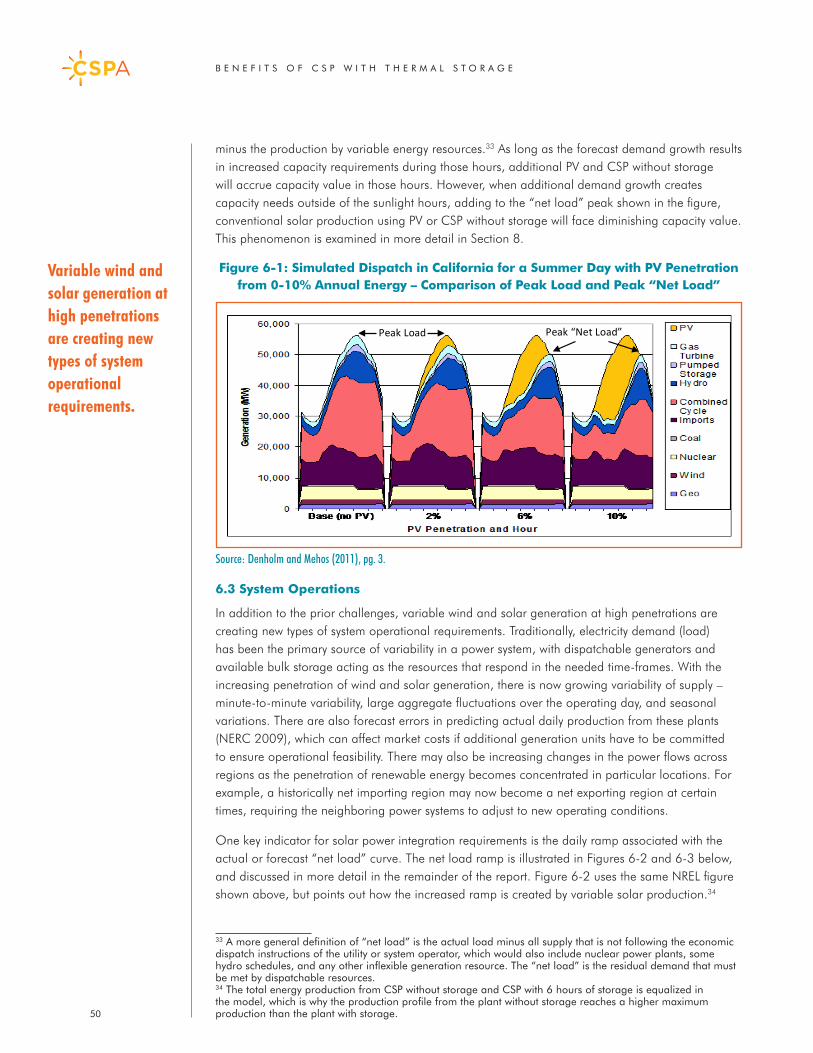
B E N E F I T S O F C S P W I T H T H E R M A L S T O R A G E
50
minus the production by variable energy resources.33 As long as the forecast demand growth results in increased capacity requirements during those hours, additional PV and CSP without storage will accrue capacity value in those hours. However, when additional demand growth creates capacity needs outside of the sunlight hours, adding to the “net load” peak shown in the figure, conventional solar production using PV or CSP without storage will face diminishing capacity value. This phenomenon is examined in more detail in Section 8.
Figure 6-1: Simulated Dispatch in California for a Summer Day with PV Penetration from 0-10% Annual Energy – Comparison of Peak Load and Peak “Net Load”
6.3 System Operations
In addition to the prior challenges, variable wind and solar generation at high penetrations are creating new types of system operational requirements. Traditionally, electricity demand (load) has been the primary source of variability in a power system, with dispatchable generators and available bulk storage acting as the resources that respond in the needed time-frames. With the increasing penetration of wind and solar generation, there is now growing variability of supply – minute-to-minute variability, large aggregate fluctuations over the operating day, and seasonal variations. There are also forecast errors in predicting actual daily production from these plants (NERC 2009), which can affect market costs if additional generation units have to be committed to ensure operational feasibility. There may also be increasing changes in the power flows across regions as the penetration of renewable energy becomes concentrated in particular locations. For example, a historically net importing region may now become a net exporting region at certain times, requiring the neighboring power systems to adjust to new operating conditions.
One key indicator for solar power integration requirements is the daily ramp associated with the actual or forecast “net load” curve. The net load ramp is illustrated in Figures 6-2 and 6-3 below, and discussed in more detail in the remainder of the report. Figure 6-2 uses the same NREL figure shown above, but points out how the increased ramp is created by variable solar production.34
33 A more general definition of “net load” is the actual load minus all supply that is not following the economic dispatch instructions of the utility or system operator, which would also include nuclear power plants, some hydro schedules, and any other inflexible generation resource. The “net load” is the residual demand that must be met by dispatchable resources.34 The total energy production from CSP without storage and CSP with 6 hours of storage is equalized in the model, which is why the production profile from the plant without storage reaches a higher maximum production than the plant with storage.
Peak “Net Load” Peak Load
Source: Denholm and Mehos (2011), pg. 3.
Variable wind and solar generation at high penetrations are creating new types of system operational requirements.
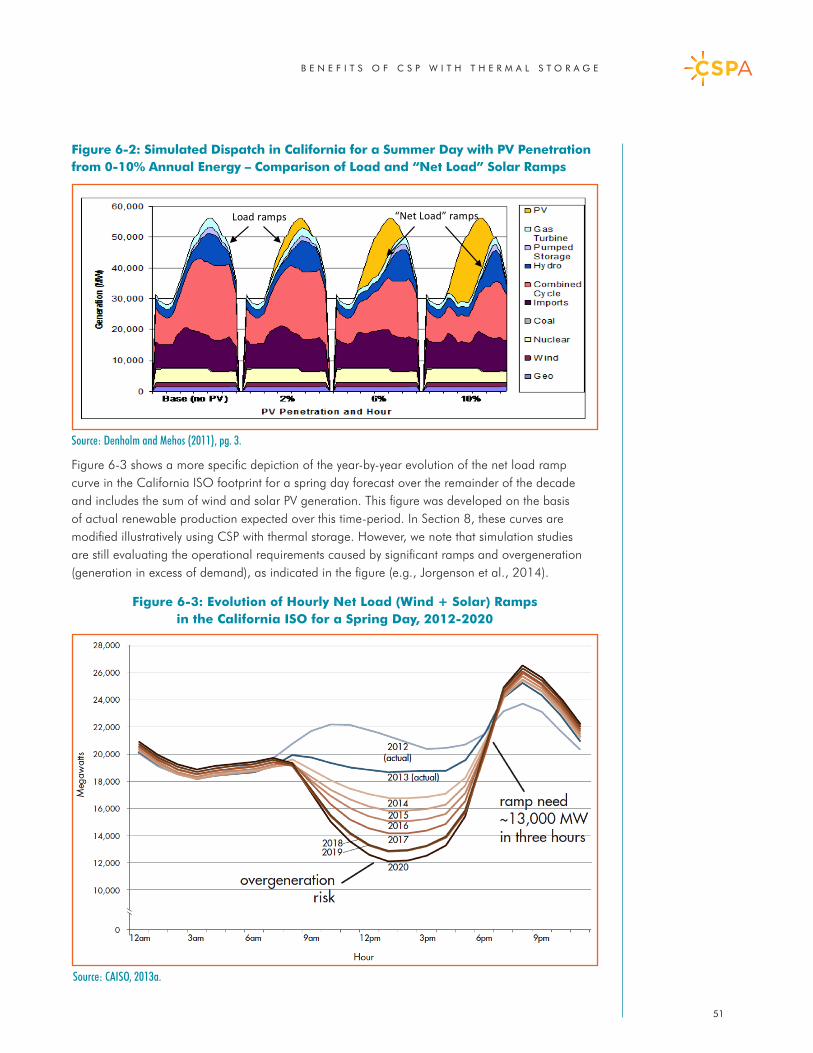
B E N E F I T S O F C S P W I T H T H E R M A L S T O R A G E
51
Figure 6-2: Simulated Dispatch in California for a Summer Day with PV Penetration from 0-10% Annual Energy – Comparison of Load and “Net Load” Solar Ramps
Figure 6-3 shows a more specific depiction of the year-by-year evolution of the net load ramp curve in the California ISO footprint for a spring day forecast over the remainder of the decade and includes the sum of wind and solar PV generation. This figure was developed on the basis of actual renewable production expected over this time-period. In Section 8, these curves are modified illustratively using CSP with thermal storage. However, we note that simulation studies are still evaluating the operational requirements caused by significant ramps and overgeneration (generation in excess of demand), as indicated in the figure (e.g., Jorgenson et al., 2014).
Figure 6-3: Evolution of Hourly Net Load (Wind + Solar) Ramps in the California ISO for a Spring Day, 2012-2020
Source: CAISO, 2013a.
“Net Load” ramps Load ramps
Source: Denholm and Mehos (2011), pg. 3.
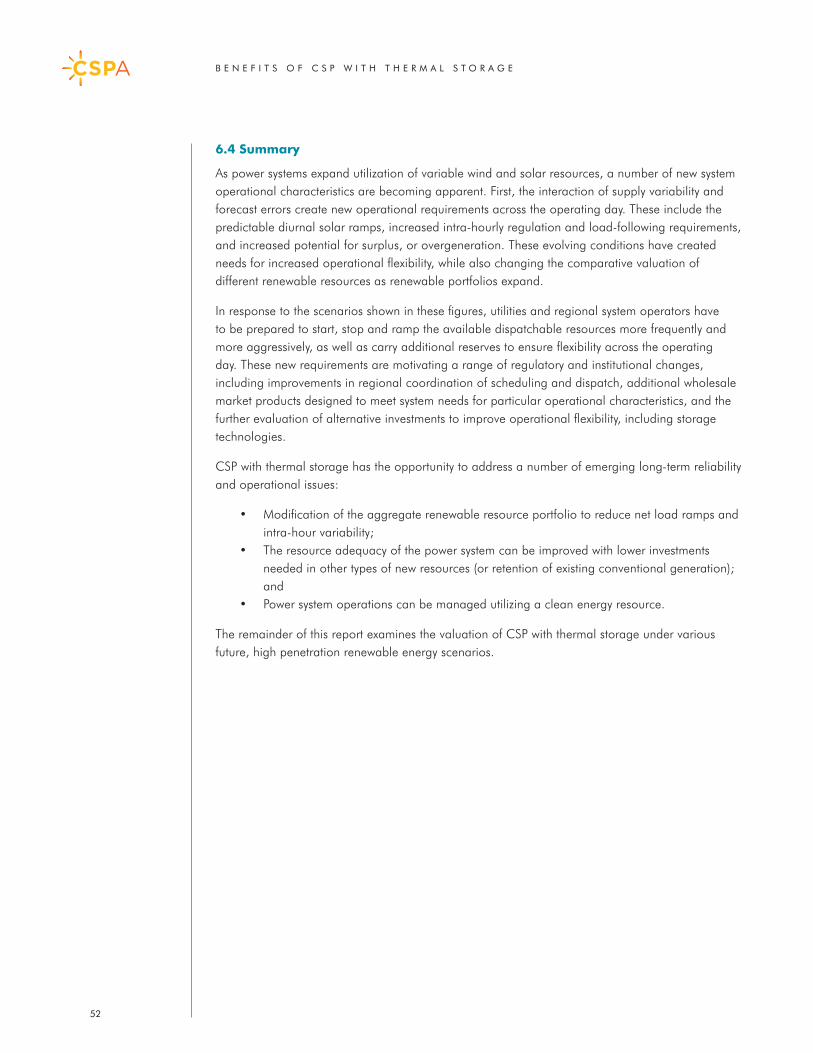
B E N E F I T S O F C S P W I T H T H E R M A L S T O R A G E
52
6.4 Summary
As power systems expand utilization of variable wind and solar resources, a number of new system operational characteristics are becoming apparent. First, the interaction of supply variability and forecast errors create new operational requirements across the operating day. These include the predictable diurnal solar ramps, increased intra-hourly regulation and load-following requirements, and increased potential for surplus, or overgeneration. These evolving conditions have created needs for increased operational flexibility, while also changing the comparative valuation of different renewable resources as renewable portfolios expand.
In response to the scenarios shown in these figures, utilities and regional system operators have to be prepared to start, stop and ramp the available dispatchable resources more frequently and more aggressively, as well as carry additional reserves to ensure flexibility across the operating day. These new requirements are motivating a range of regulatory and institutional changes, including improvements in regional coordination of scheduling and dispatch, additional wholesale market products designed to meet system needs for particular operational characteristics, and the further evaluation of alternative investments to improve operational flexibility, including storage technologies.
CSP with thermal storage has the opportunity to address a number of emerging long-term reliability and operational issues:
• Modification of the aggregate renewable resource portfolio to reduce net load ramps and intra-hour variability;
• The resource adequacy of the power system can be improved with lower investments needed in other types of new resources (or retention of existing conventional generation); and
• Power system operations can be managed utilizing a clean energy resource.
The remainder of this report examines the valuation of CSP with thermal storage under various future, high penetration renewable energy scenarios.
B E N E F I T S O F C S P W I T H T H E R M A L S T O R A G E
53
7. Energy and Ancillary ServicesCSP plants with thermal energy storage are able to utilize their available stored energy over the operating day to optimally supply energy and ancillary services. These capabilities can provide additional economic benefits credited to the plant, and hence also improve the plant’s relative benefits when compared to other solar resources.
This section reviews results from several studies of energy and ancillary service benefits for different solar technologies. A few studies also quantify the additional ancillary service costs estimated for integration of variable solar resources, which are also reviewed in Section 9. The section is organized as follows:
• Section 7.1 surveys results for energy benefits, and energy-only optimization of CSP with thermal storage.
• Section 7.2 discusses value of ancillary services, and reviews results for co-optimized energy and ancillary services are surveyed.
• Section 7.3 summarizes and identifies analytical needs for further research.
7.1 Energy
As a practical matter, due to low losses on the thermal energy storage system, CSP with thermal storage is currently the only solar resource that can achieve a high degree of operational flexibility with minimal reduction in overall energy output. The dispatch simulations of CSP with thermal storage discussed in this section have used an hourly time-frame optimized over 24-48 hours, which correlates with utility and organized market day-ahead scheduling practices. In some of the simulations, an additional load-following reserve is also included, to reflect energy dispatch within the operating hour.
Historically, in the competitive power markets, most of the value of energy is determined in the day-ahead market, while real-time energy imbalances, which are currently largely a function of load forecast errors, constitute only a few percent of total energy market financial settlements (e.g., CAISO 2012a). The addition of variable wind and solar production to these markets may increase the quantity of balancing energy transacted in real-time, and possibly the volatility of prices, providing more value to operational flexibility. Some solar integration modeling studies have begun to model sub-hourly intervals, such as 5-minute dispatch (e.g., CAISO 2010); studies that examine sub-hourly dispatch of CSP with thermal storage are underway, with results forthcoming.
Figure 7-1 on the next page (excerpted from Denholm and Hummon, 2012) illustrates the process by which dispatch of energy from thermal storage enhances the average benefits of CSP plants. The figure compares optimized production from CSP plants with and without thermal storage for a 3-day period with cloudy, winter days (note that tracking PV production at the same location would follow a similar pattern to CSP without storage, although the CSP plant’s thermal inertia would further smooth out some of its production ramps). The capacity of both CSP resources is adjusted to ensure equal annual energy production (see discussion in Section 3).35
35 The total energy production from CSP without storage and CSP with 6 hours of storage is equalized in the model, which is why the production profile from the plant without storage reaches a higher maximum production than the plant with storage.
CSP plants with thermal energy storage can dispatch energy and ancillary services to the hours of highest economic value. In U.S. power systems with few renewables, this added value is typically calculated as $5-10/MWh. As renewable penetration increases, all energy revenues decrease due to the reduced utilization of fossil generation, but CSP with storage’s value increases relative to PV, generally to about $10-20/MWh.
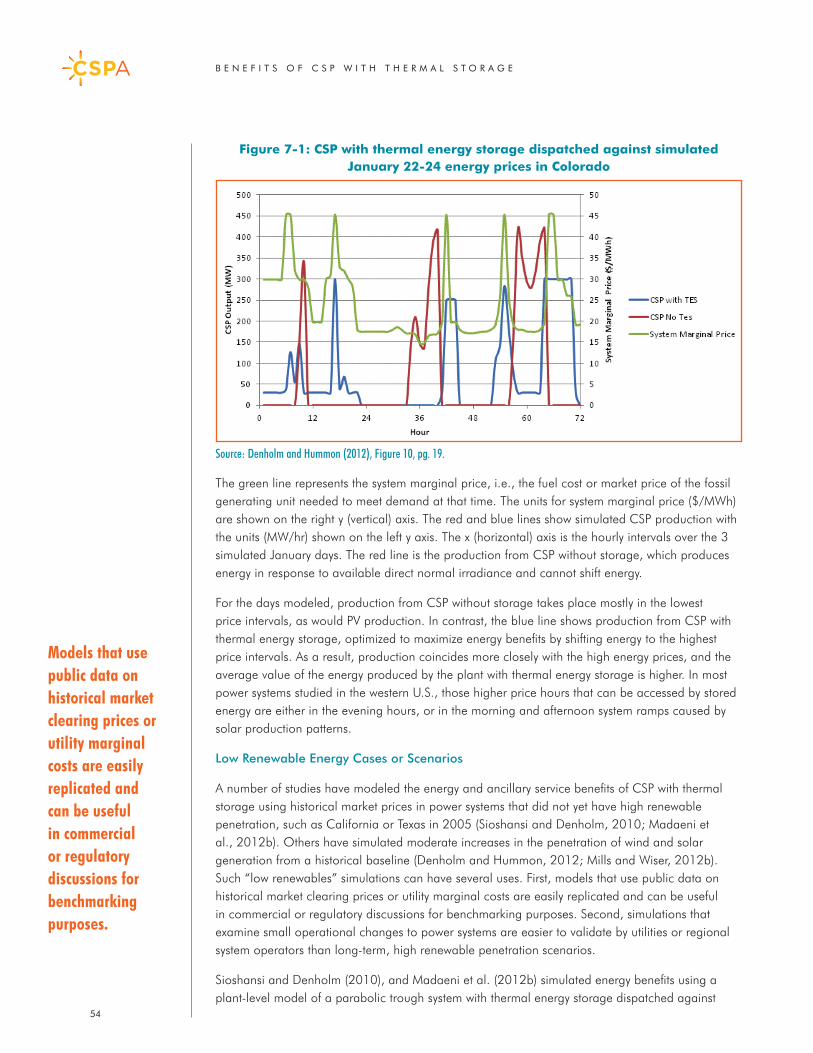
B E N E F I T S O F C S P W I T H T H E R M A L S T O R A G E
54
Figure 7-1: CSP with thermal energy storage dispatched against simulated January 22-24 energy prices in Colorado
The green line represents the system marginal price, i.e., the fuel cost or market price of the fossil generating unit needed to meet demand at that time. The units for system marginal price ($/MWh) are shown on the right y (vertical) axis. The red and blue lines show simulated CSP production with the units (MW/hr) shown on the left y axis. The x (horizontal) axis is the hourly intervals over the 3 simulated January days. The red line is the production from CSP without storage, which produces energy in response to available direct normal irradiance and cannot shift energy.
For the days modeled, production from CSP without storage takes place mostly in the lowest price intervals, as would PV production. In contrast, the blue line shows production from CSP with thermal energy storage, optimized to maximize energy benefits by shifting energy to the highest price intervals. As a result, production coincides more closely with the high energy prices, and the average value of the energy produced by the plant with thermal energy storage is higher. In most power systems studied in the western U.S., those higher price hours that can be accessed by stored energy are either in the evening hours, or in the morning and afternoon system ramps caused by solar production patterns.
Low Renewable Energy Cases or Scenarios
A number of studies have modeled the energy and ancillary service benefits of CSP with thermal storage using historical market prices in power systems that did not yet have high renewable penetration, such as California or Texas in 2005 (Sioshansi and Denholm, 2010; Madaeni et al., 2012b). Others have simulated moderate increases in the penetration of wind and solar generation from a historical baseline (Denholm and Hummon, 2012; Mills and Wiser, 2012b). Such “low renewables” simulations can have several uses. First, models that use public data on historical market clearing prices or utility marginal costs are easily replicated and can be useful in commercial or regulatory discussions for benchmarking purposes. Second, simulations that examine small operational changes to power systems are easier to validate by utilities or regional system operators than long-term, high renewable penetration scenarios.
Sioshansi and Denholm (2010), and Madaeni et al. (2012b) simulated energy benefits using a plant-level model of a parabolic trough system with thermal energy storage dispatched against
Source: Denholm and Hummon (2012), Figure 10, pg. 19.
Models that use public data on historical market clearing prices or utility marginal costs are easily replicated and can be useful in commercial or regulatory discussions for benchmarking purposes.
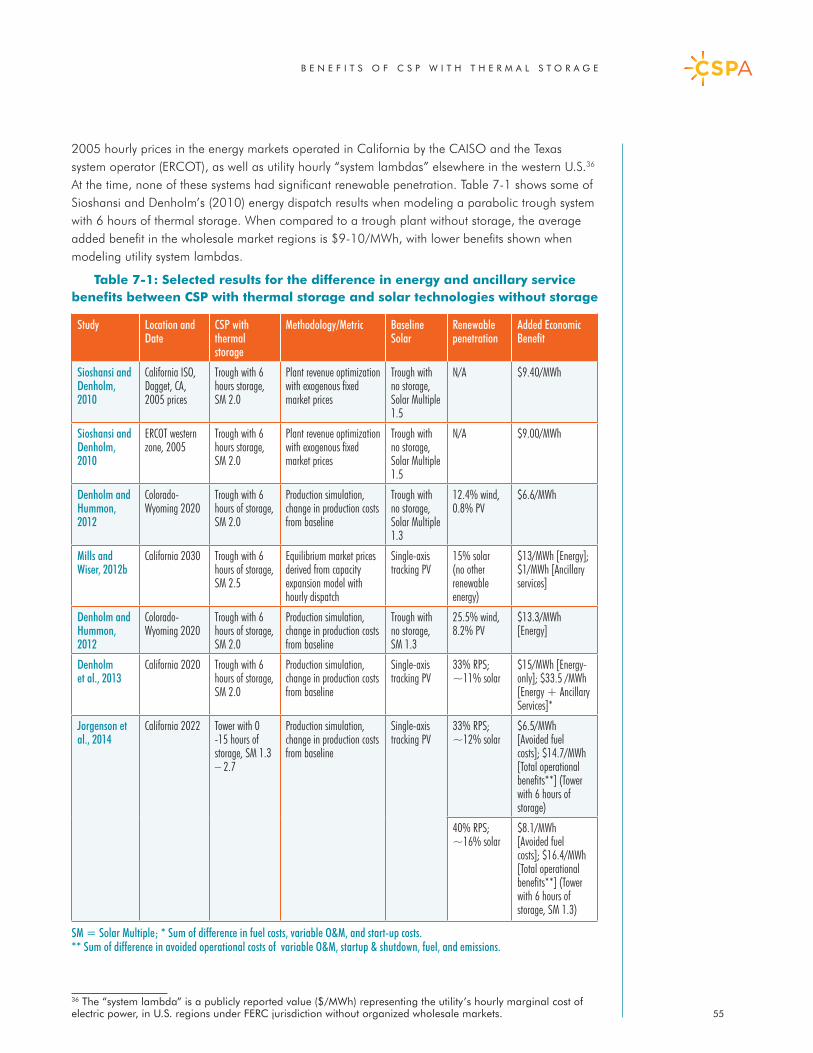
B E N E F I T S O F C S P W I T H T H E R M A L S T O R A G E
55
2005 hourly prices in the energy markets operated in California by the CAISO and the Texas system operator (ERCOT), as well as utility hourly “system lambdas” elsewhere in the western U.S.36 At the time, none of these systems had significant renewable penetration. Table 7-1 shows some of Sioshansi and Denholm’s (2010) energy dispatch results when modeling a parabolic trough system with 6 hours of thermal storage. When compared to a trough plant without storage, the average added benefit in the wholesale market regions is $9-10/MWh, with lower benefits shown when modeling utility system lambdas.
Table 7-1: Selected results for the difference in energy and ancillary service benefits between CSP with thermal storage and solar technologies without storage
36 The “system lambda” is a publicly reported value ($/MWh) representing the utility’s hourly marginal cost of electric power, in U.S. regions under FERC jurisdiction without organized wholesale markets.
Study Location and Date
CSP with thermal storage
Methodology/Metric Baseline Solar
Renewable penetration
Added Economic Benefit
Sioshansi and Denholm, 2010
California ISO, Dagget, CA, 2005 prices
Trough with 6 hours storage, SM 2.0
Plant revenue optimization with exogenous fixed market prices
Trough with no storage, Solar Multiple 1.5
N/A $9.40/MWh
Sioshansi and Denholm, 2010
ERCOT western zone, 2005
Trough with 6 hours storage, SM 2.0
Plant revenue optimization with exogenous fixed market prices
Trough with no storage, Solar Multiple 1.5
N/A $9.00/MWh
Denholm and Hummon, 2012
Colorado-Wyoming 2020
Trough with 6 hours of storage, SM 2.0
Production simulation, change in production costs from baseline
Trough with no storage, Solar Multiple 1.3
12.4% wind, 0.8% PV
$6.6/MWh
Mills and Wiser, 2012b
California 2030 Trough with 6 hours of storage, SM 2.5
Equilibrium market prices derived from capacity expansion model with hourly dispatch
Single-axis tracking PV
15% solar (no other renewable energy)
$13/MWh [Energy]; $1/MWh [Ancillary services]
Denholm and Hummon, 2012
Colorado-Wyoming 2020
Trough with 6 hours of storage, SM 2.0
Production simulation, change in production costs from baseline
Trough with no storage, SM 1.3
25.5% wind, 8.2% PV
$13.3/MWh [Energy]
Denholm et al., 2013
California 2020 Trough with 6 hours of storage, SM 2.0
Production simulation, change in production costs from baseline
Single-axis tracking PV
33% RPS; ~11% solar
$15/MWh [Energy-only]; $33.5 /MWh [Energy + Ancillary Services]*
Jorgenson et al., 2014
California 2022 Tower with 0 -15 hours of storage, SM 1.3 – 2.7
Production simulation, change in production costs from baseline
Single-axis tracking PV
33% RPS; ~12% solar
$6.5/MWh [Avoided fuel costs]; $14.7/MWh [Total operational benefits**] (Tower with 6 hours of storage)
40% RPS; ~16% solar
$8.1/MWh [Avoided fuel costs]; $16.4/MWh [Total operational benefits**] (Tower with 6 hours of storage, SM 1.3)
SM = Solar Multiple; * Sum of difference in fuel costs, variable O&M, and start-up costs. ** Sum of difference in avoided operational costs of variable O&M, startup & shutdown, fuel, and emissions.
B E N E F I T S O F C S P W I T H T H E R M A L S T O R A G E
56
In the later extension of this analysis by Madaeni et al., (2012b), a range of solar multiples and thermal storage capacities were modeled, allowing for calculation of market benefits as a function of plant design. Figures 11-1 and 11-2 (in Section 11 of this report) show the total energy revenues plotted against these design parameters; however the paper does not provide the total energy produced for each design option, making it difficult to convert the results to $/MWh. Helman and Sioshansi (2012, unpublished) later used the same model to evaluate benefits using 2010-11 CAISO market prices; the results are shown in Figures 7-4 and 11-2, and discussed in more detail below. As expected, when modeled against the lower CAISO market prices in those years than in 2005, the plant obtained lower energy benefits from storage dispatch.
As noted above, calculating benefits with models that optimize against historical prices has the limitation that they do not account for how new resources affect economic dispatch. A few studies have examined the dispatch of CSP with thermal storage in “low renewable” scenarios using detailed power system models. These analyses can consider the effect of shifting energy dispatch on system production costs. Denholm and Hummon (2012) utilize a production simulation model to examine the dispatch of CSP in a “low renewables” scenario with 13.2% annual energy, composed of 12.4% wind and 0.8% PV production, in the Colorado-Wyoming power system. As shown in Table 7-1, a 300 MW parabolic trough plant with 6 hours of thermal storage accrues almost $7/MWh in additional energy benefits, measured as reduced production costs, when compared to the addition of a PV plant with equal energy production.
Mills and Wiser (2012b) construct a dispatch model of the California power system in 2030 in which they examine the penetration of different renewable technologies from a zero % penetration baseline. As shown in Figure 7-2 on page 59, the difference in energy benefits between PV and CSP with 6 hours of thermal storage ranges from $3-13/MWh as the penetration of each technology reaches 15% of annual energy production. The relatively small difference in energy value at low penetration results in part because the portfolios evaluated in this study are adjusted on equal energy basis, which results in profile shapes in which the maximum output in any hour of the CSP portfolio is less than the PV portfolio (as illustrated in Figure 4-3 on page 29), and increasingly so as the portfolio increases in size.
High Renewable Energy Scenarios
While thermal storage can provide additional energy benefits to CSP plants in low renewable penetration cases, the benefits when compared to solar without storage increase as penetration of those plants increases. As additional renewable generation is connected to a power system, it progressively displaces existing generation in order of higher to lower marginal fuel costs (gas and coal). Solar production reduces marginal energy costs during the sunlight hours, and as penetration increases will also create price spikes during the morning and afternoon solar ramps. Wind energy typically results in more uniform reductions in average energy prices but with a diurnal effect in some regions that results in greater energy price reductions in the overnight hours. When renewable energy production is on the margin – that is, when it has displaced all other dispatchable generation – it sets market prices that are zero or possibly negative.37 This phenomenon is observed in many power markets where wind production has suppressed market prices in the off-peak hours and during other system operating conditions. While currently negative pricing is associated primarily with wind production, solar production could eventually contribute to this effect during the morning and afternoon hours, as the penetration of solar PV increases (Mills and Wiser, 2012b; Denholm and Mehos, 2011).
37 Negative prices are set by several factors, including negative market bids by generators that prefer to remain on-line in periods of surplus energy or generators that receive production incentives. They thus reflect the “willingness to pay” to remain operating.
When renewable energy production is on the margin – that is, when it has displaced all other dispatchable generation – it sets market prices that are zero or possibly negative.
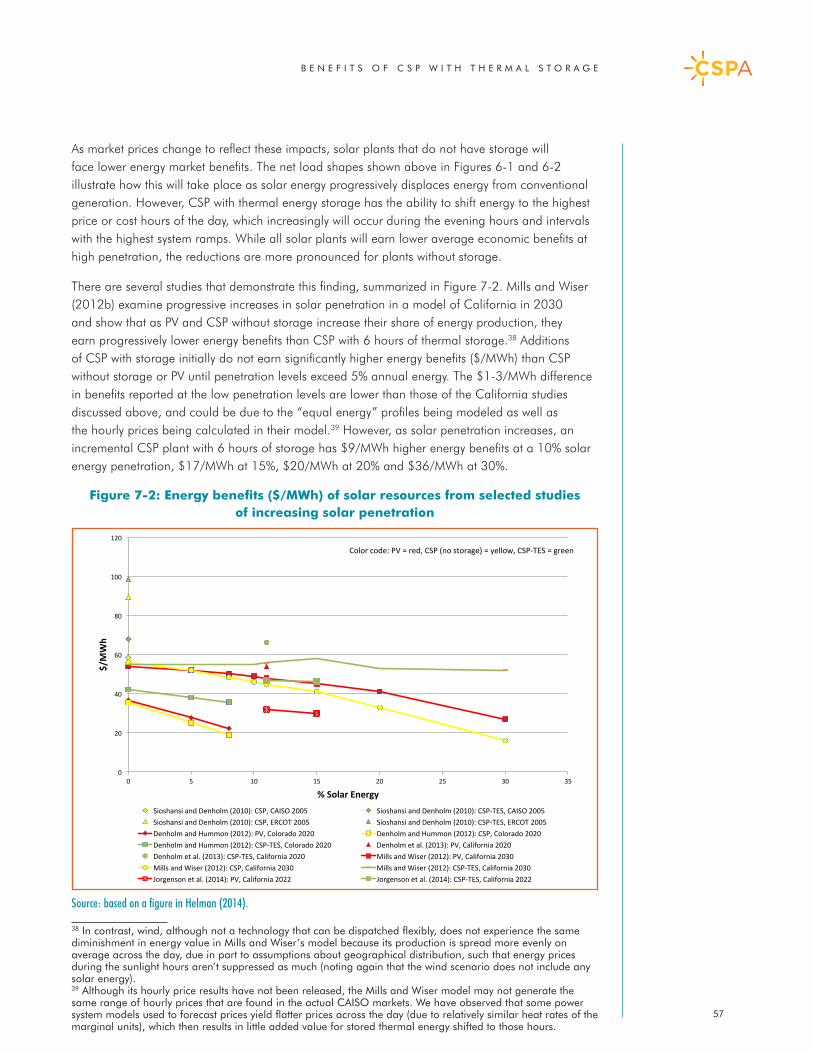
B E N E F I T S O F C S P W I T H T H E R M A L S T O R A G E
57
As market prices change to reflect these impacts, solar plants that do not have storage will face lower energy market benefits. The net load shapes shown above in Figures 6-1 and 6-2 illustrate how this will take place as solar energy progressively displaces energy from conventional generation. However, CSP with thermal energy storage has the ability to shift energy to the highest price or cost hours of the day, which increasingly will occur during the evening hours and intervals with the highest system ramps. While all solar plants will earn lower average economic benefits at high penetration, the reductions are more pronounced for plants without storage.
There are several studies that demonstrate this finding, summarized in Figure 7-2. Mills and Wiser (2012b) examine progressive increases in solar penetration in a model of California in 2030 and show that as PV and CSP without storage increase their share of energy production, they earn progressively lower energy benefits than CSP with 6 hours of thermal storage.38 Additions of CSP with storage initially do not earn significantly higher energy benefits ($/MWh) than CSP without storage or PV until penetration levels exceed 5% annual energy. The $1-3/MWh difference in benefits reported at the low penetration levels are lower than those of the California studies discussed above, and could be due to the “equal energy” profiles being modeled as well as the hourly prices being calculated in their model.39 However, as solar penetration increases, an incremental CSP plant with 6 hours of storage has $9/MWh higher energy benefits at a 10% solar energy penetration, $17/MWh at 15%, $20/MWh at 20% and $36/MWh at 30%.
Figure 7-2: Energy benefits ($/MWh) of solar resources from selected studies of increasing solar penetration
38 In contrast, wind, although not a technology that can be dispatched flexibly, does not experience the same diminishment in energy value in Mills and Wiser’s model because its production is spread more evenly on average across the day, due in part to assumptions about geographical distribution, such that energy prices during the sunlight hours aren’t suppressed as much (noting again that the wind scenario does not include any solar energy).39 Although its hourly price results have not been released, the Mills and Wiser model may not generate the same range of hourly prices that are found in the actual CAISO markets. We have observed that some power system models used to forecast prices yield flatter prices across the day (due to relatively similar heat rates of the marginal units), which then results in little added value for stored thermal energy shifted to those hours.
0
20
40
60
80
100
120
0 5 10 15 20 25 30 35
$/MWh
% Solar Energy Sioshansi and Denholm (2010): CSP, CAISO 2005 Sioshansi and Denholm (2010): CSP-‐TES, CAISO 2005 Sioshansi and Denholm (2010): CSP, ERCOT 2005 Sioshansi and Denholm (2010): CSP-‐TES, ERCOT 2005 Denholm and Hummon (2012): PV, Colorado 2020 Denholm and Hummon (2012): CSP, Colorado 2020 Denholm and Hummon (2012): CSP-‐TES, Colorado 2020 Denholm et al. (2013): PV, California 2020 Denholm et al. (2013): CSP-‐TES, California 2020 Mills and Wiser (2012): PV, California 2030 Mills and Wiser (2012): CSP, California 2030 Mills and Wiser (2012): CSP-‐TES, California 2030 Jorgenson et al. (2014): PV, California 2022 Jorgenson et al. (2014): CSP-‐TES, California 2022
Color code: PV = red, CSP (no storage) = yellow, CSP-‐TES = green
Source: based on a figure in Helman (2014).
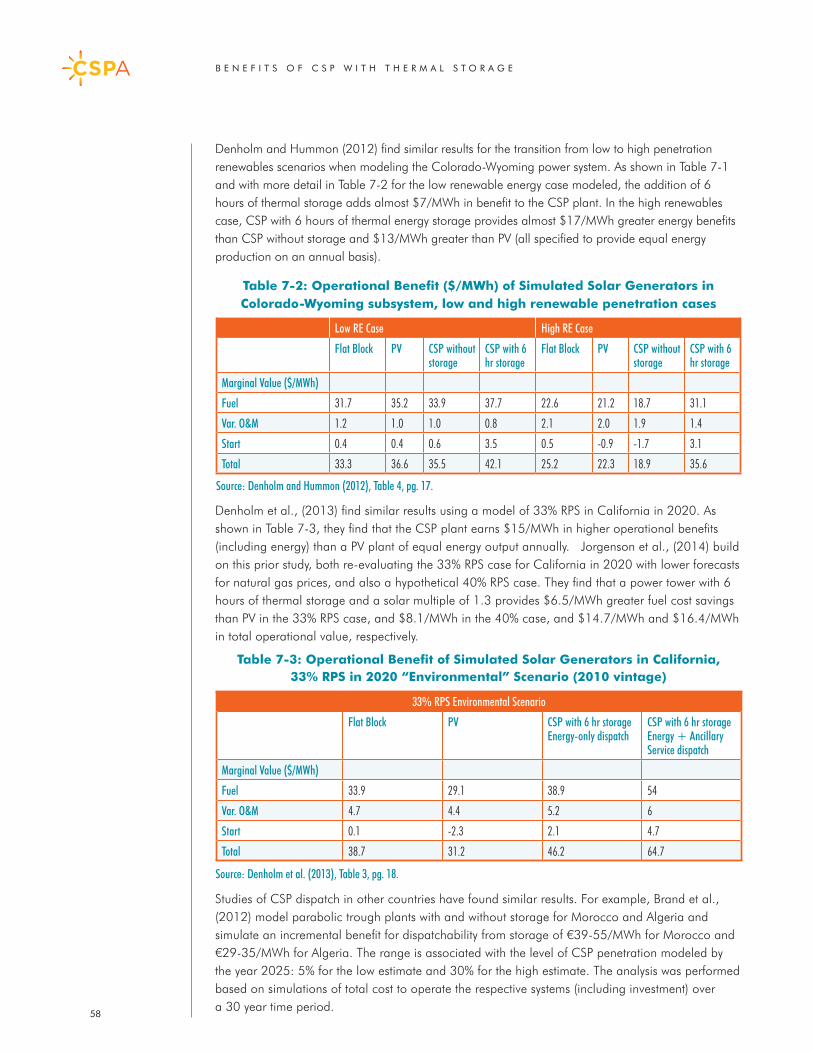
B E N E F I T S O F C S P W I T H T H E R M A L S T O R A G E
58
Denholm and Hummon (2012) find similar results for the transition from low to high penetration renewables scenarios when modeling the Colorado-Wyoming power system. As shown in Table 7-1 and with more detail in Table 7-2 for the low renewable energy case modeled, the addition of 6 hours of thermal storage adds almost $7/MWh in benefit to the CSP plant. In the high renewables case, CSP with 6 hours of thermal energy storage provides almost $17/MWh greater energy benefits than CSP without storage and $13/MWh greater than PV (all specified to provide equal energy production on an annual basis).
Table 7-2: Operational Benefit ($/MWh) of Simulated Solar Generators in Colorado-Wyoming subsystem, low and high renewable penetration cases
Denholm et al., (2013) find similar results using a model of 33% RPS in California in 2020. As shown in Table 7-3, they find that the CSP plant earns $15/MWh in higher operational benefits (including energy) than a PV plant of equal energy output annually. Jorgenson et al., (2014) build on this prior study, both re-evaluating the 33% RPS case for California in 2020 with lower forecasts for natural gas prices, and also a hypothetical 40% RPS case. They find that a power tower with 6 hours of thermal storage and a solar multiple of 1.3 provides $6.5/MWh greater fuel cost savings than PV in the 33% RPS case, and $8.1/MWh in the 40% case, and $14.7/MWh and $16.4/MWh in total operational value, respectively.
Table 7-3: Operational Benefit of Simulated Solar Generators in California, 33% RPS in 2020 “Environmental” Scenario (2010 vintage)
Studies of CSP dispatch in other countries have found similar results. For example, Brand et al., (2012) model parabolic trough plants with and without storage for Morocco and Algeria and simulate an incremental benefit for dispatchability from storage of €39-55/MWh for Morocco and €29-35/MWh for Algeria. The range is associated with the level of CSP penetration modeled by the year 2025: 5% for the low estimate and 30% for the high estimate. The analysis was performed based on simulations of total cost to operate the respective systems (including investment) over a 30 year time period.
33% RPS Environmental Scenario
Flat Block PV CSP with 6 hr storage Energy-only dispatch
CSP with 6 hr storage Energy + Ancillary Service dispatch
Marginal Value ($/MWh)
Fuel 33.9 29.1 38.9 54
Var. O&M 4.7 4.4 5.2 6
Start 0.1 -2.3 2.1 4.7
Total 38.7 31.2 46.2 64.7
Source: Denholm et al. (2013), Table 3, pg. 18.
Low RE Case High RE Case
Flat Block PV CSP withoutstorage
CSP with 6 hr storage
Flat Block PV CSP without storage
CSP with 6 hr storage
Marginal Value ($/MWh)
Fuel 31.7 35.2 33.9 37.7 22.6 21.2 18.7 31.1
Var. O&M 1.2 1.0 1.0 0.8 2.1 2.0 1.9 1.4
Start 0.4 0.4 0.6 3.5 0.5 -0.9 -1.7 3.1
Total 33.3 36.6 35.5 42.1 25.2 22.3 18.9 35.6
Source: Denholm and Hummon (2012), Table 4, pg. 17.
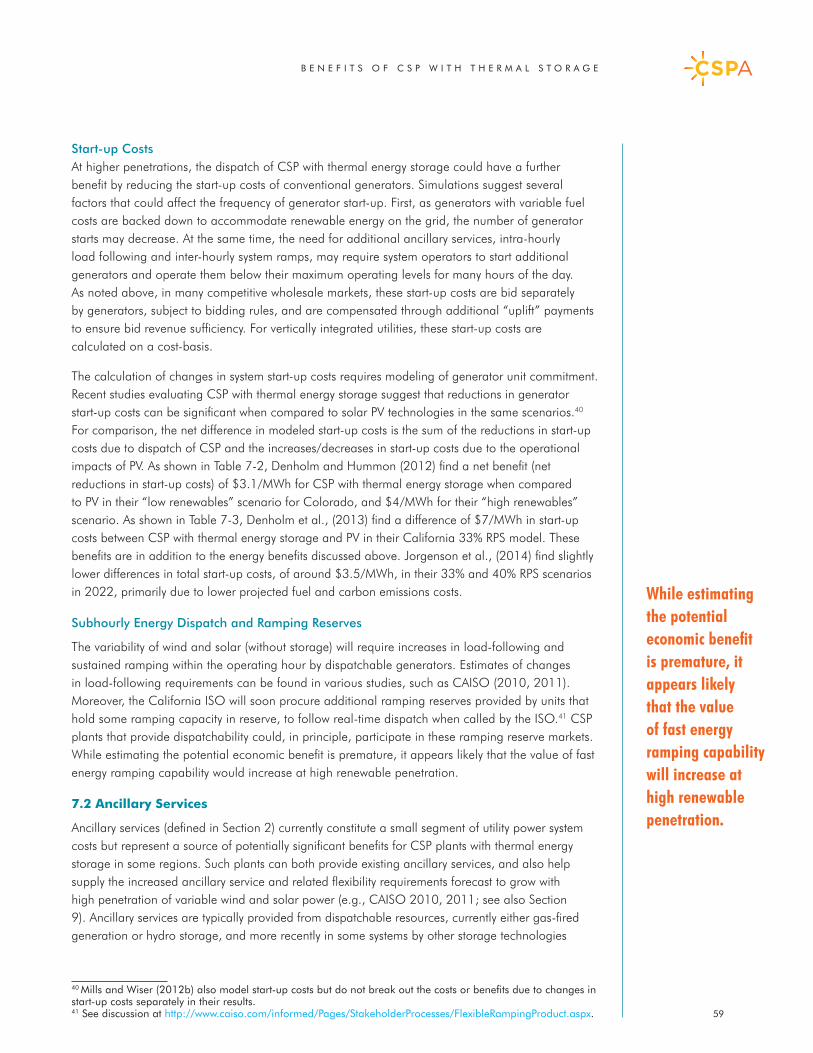
B E N E F I T S O F C S P W I T H T H E R M A L S T O R A G E
59
Start-up CostsAt higher penetrations, the dispatch of CSP with thermal energy storage could have a further benefit by reducing the start-up costs of conventional generators. Simulations suggest several factors that could affect the frequency of generator start-up. First, as generators with variable fuel costs are backed down to accommodate renewable energy on the grid, the number of generator starts may decrease. At the same time, the need for additional ancillary services, intra-hourly load following and inter-hourly system ramps, may require system operators to start additional generators and operate them below their maximum operating levels for many hours of the day. As noted above, in many competitive wholesale markets, these start-up costs are bid separately by generators, subject to bidding rules, and are compensated through additional “uplift” payments to ensure bid revenue sufficiency. For vertically integrated utilities, these start-up costs are calculated on a cost-basis.
The calculation of changes in system start-up costs requires modeling of generator unit commitment. Recent studies evaluating CSP with thermal energy storage suggest that reductions in generator start-up costs can be significant when compared to solar PV technologies in the same scenarios.40 For comparison, the net difference in modeled start-up costs is the sum of the reductions in start-up costs due to dispatch of CSP and the increases/decreases in start-up costs due to the operational impacts of PV. As shown in Table 7-2, Denholm and Hummon (2012) find a net benefit (net reductions in start-up costs) of $3.1/MWh for CSP with thermal energy storage when compared to PV in their “low renewables” scenario for Colorado, and $4/MWh for their “high renewables” scenario. As shown in Table 7-3, Denholm et al., (2013) find a difference of $7/MWh in start-up costs between CSP with thermal energy storage and PV in their California 33% RPS model. These benefits are in addition to the energy benefits discussed above. Jorgenson et al., (2014) find slightly lower differences in total start-up costs, of around $3.5/MWh, in their 33% and 40% RPS scenarios in 2022, primarily due to lower projected fuel and carbon emissions costs.
Subhourly Energy Dispatch and Ramping Reserves
The variability of wind and solar (without storage) will require increases in load-following and sustained ramping within the operating hour by dispatchable generators. Estimates of changes in load-following requirements can be found in various studies, such as CAISO (2010, 2011). Moreover, the California ISO will soon procure additional ramping reserves provided by units that hold some ramping capacity in reserve, to follow real-time dispatch when called by the ISO.41 CSP plants that provide dispatchability could, in principle, participate in these ramping reserve markets. While estimating the potential economic benefit is premature, it appears likely that the value of fast energy ramping capability would increase at high renewable penetration.
7.2 Ancillary Services
Ancillary services (defined in Section 2) currently constitute a small segment of utility power system costs but represent a source of potentially significant benefits for CSP plants with thermal energy storage in some regions. Such plants can both provide existing ancillary services, and also help supply the increased ancillary service and related flexibility requirements forecast to grow with high penetration of variable wind and solar power (e.g., CAISO 2010, 2011; see also Section 9). Ancillary services are typically provided from dispatchable resources, currently either gas-fired generation or hydro storage, and more recently in some systems by other storage technologies
40 Mills and Wiser (2012b) also model start-up costs but do not break out the costs or benefits due to changes in start-up costs separately in their results.41 See discussion at http://www.caiso.com/informed/Pages/StakeholderProcesses/FlexibleRampingProduct.aspx.
While estimating the potential economic benefit is premature, it appears likely that the value of fast energy ramping capability will increase at high renewable penetration.
B E N E F I T S O F C S P W I T H T H E R M A L S T O R A G E
60
and demand-side resources. A CSP plant operated from storage can offer both “upward” and “downward” services when there is the capability to increase or decrease energy from a prior set point. These plants are particularly suited to providing spinning reserves and Regulation, but can also provide any other ancillary service offered from a synchronous generator (without significant loss of solar energy production), such as frequency response, inertial response, and voltage control.
For most CSP plants, the ability to provide these services will vary over the operating day, depending on the state of charge of the thermal energy storage system. The operator of the plant will seek to optimize the use of the stored thermal energy for energy production and ancillary services to obtain the highest benefits across these products. Box 7-1 provides a simple example of co-optimization for energy production and spinning reserves; a similar methodology would be used for optimizing the supply of any ancillary service provided by the CSP plant.
Simulations of CSP with thermal energy storage providing ancillary services generally use two methods: optimizing a plant-level model against a set of historical or forecast prices, similarly to the example in Box 1 (e.g., Madaeni et al., 2012b), or calculating the change in total production costs or marginal prices when the plants are added to the resource mix and allowed to provide ancillary services (e.g., Denholm et al, 2013; Mills and Wiser, 2012b).
Turning to the first simulation method, in competitive wholesale markets, historical hourly ancillary service prices are available publicly, allowing for simulation of these benefits using CSP plant models dispatched from thermal storage against published prices (e.g., Madaeni et al., 2012b).42 For example, in the California ISO average ancillary service prices in 2011, were $10.84/MW for Regulation Up, $9.15/MW for spinning reserve, $6.97/MW for Regulation Down and $1.06/MW for Non-spinning Reserve (CAISO 2012a). As shown in Figure 7-3 on page 64, the hourly prices for ancillary services in the California market vary substantially over the operating day, with higher prices for “upwards” services in the late afternoon and early evening hours. Similar patterns occur in prior years as well as in the simulations of future conditions under the 33% RPS. Based on these historical prices in Cali fornia, CSP plants charging the thermal storage system during the sunlight hours are well positioned to then obtain the highest value when providing ancillary services during the evening hours.
42 In wholesale markets, the ancillary service price is denominated in $/MW, representing the capacity (MW) reserved on the resource to provide the service. The market price is typically calculated as the opportunity cost of the marginal unit providing the service, although in some markets, bids are allowed. Any energy provided by the plant is settled at the wholesale price. Recently, the markets for Regulation in the United States have been required also to pay a “mileage” payment, in which the resource is paid according to a measure of how frequently it responds to Regulation dispatch (allowing, all other things equal, for higher payments to faster Regulation resources).
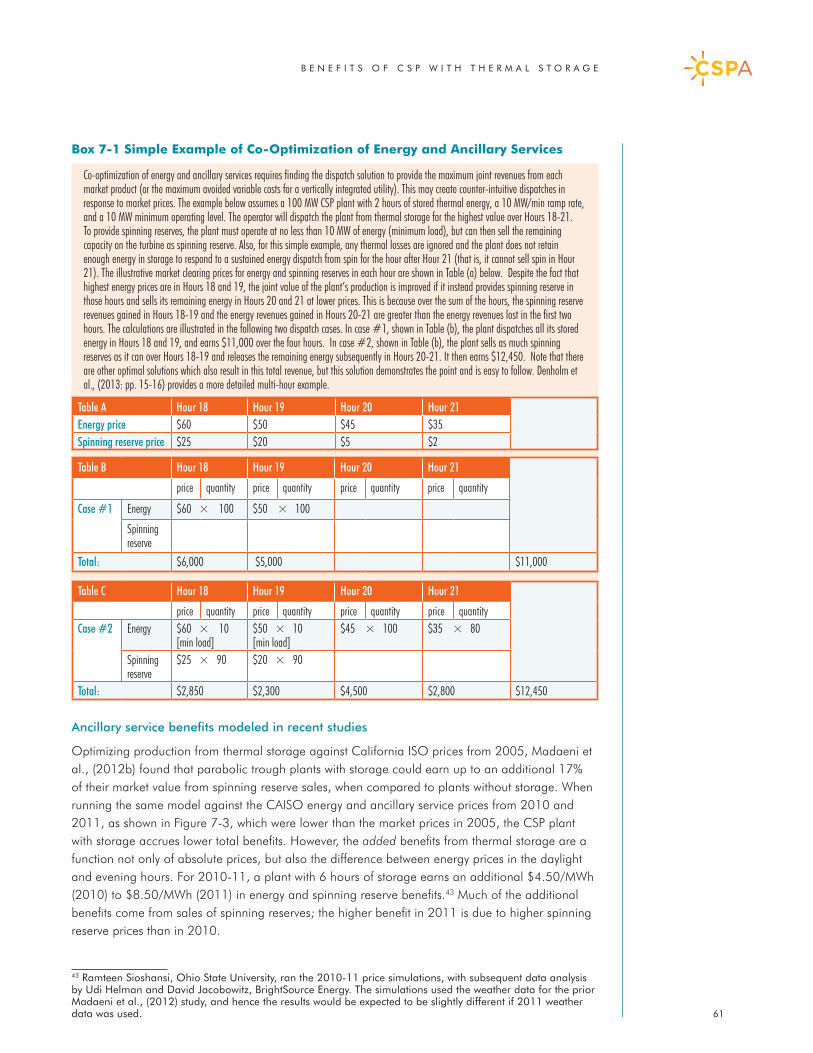
B E N E F I T S O F C S P W I T H T H E R M A L S T O R A G E
61
Box 7-1 Simple Example of Co-Optimization of Energy and Ancillary Services
Ancillary service benefits modeled in recent studies
Optimizing production from thermal storage against California ISO prices from 2005, Madaeni et al., (2012b) found that parabolic trough plants with storage could earn up to an additional 17% of their market value from spinning reserve sales, when compared to plants without storage. When running the same model against the CAISO energy and ancillary service prices from 2010 and 2011, as shown in Figure 7-3, which were lower than the market prices in 2005, the CSP plant with storage accrues lower total benefits. However, the added benefits from thermal storage are a function not only of absolute prices, but also the difference between energy prices in the daylight and evening hours. For 2010-11, a plant with 6 hours of storage earns an additional $4.50/MWh (2010) to $8.50/MWh (2011) in energy and spinning reserve benefits.43 Much of the additional benefits come from sales of spinning reserves; the higher benefit in 2011 is due to higher spinning reserve prices than in 2010.
43 Ramteen Sioshansi, Ohio State University, ran the 2010-11 price simulations, with subsequent data analysis by Udi Helman and David Jacobowitz, BrightSource Energy. The simulations used the weather data for the prior Madaeni et al., (2012) study, and hence the results would be expected to be slightly different if 2011 weather data was used.
Table A Hour 18 Hour 19 Hour 20 Hour 21Energy price $60 $50 $45 $35Spinning reserve price $25 $20 $5 $2
Table B Hour 18 Hour 19 Hour 20 Hour 21
price quantity price quantity price quantity price quantity
Case #1 Energy $60 × 100 $50 × 100
Spinning reserve
Total: $6,000 $5,000 $11,000
Table C Hour 18 Hour 19 Hour 20 Hour 21
price quantity price quantity price quantity price quantityCase #2 Energy $60 × 10
[min load]$50 × 10[min load]
$45 × 100 $35 × 80
Spinning reserve
$25 × 90 $20 × 90
Total: $2,850 $2,300 $4,500 $2,800 $12,450
Co-optimization of energy and ancillary services requires finding the dispatch solution to provide the maximum joint revenues from each market product (or the maximum avoided variable costs for a vertically integrated utility). This may create counter-intuitive dispatches in response to market prices. The example below assumes a 100 MW CSP plant with 2 hours of stored thermal energy, a 10 MW/min ramp rate, and a 10 MW minimum operating level. The operator will dispatch the plant from thermal storage for the highest value over Hours 18-21. To provide spinning reserves, the plant must operate at no less than 10 MW of energy (minimum load), but can then sell the remaining capacity on the turbine as spinning reserve. Also, for this simple example, any thermal losses are ignored and the plant does not retain enough energy in storage to respond to a sustained energy dispatch from spin for the hour after Hour 21 (that is, it cannot sell spin in Hour 21). The illustrative market clearing prices for energy and spinning reserves in each hour are shown in Table (a) below. Despite the fact that highest energy prices are in Hours 18 and 19, the joint value of the plant’s production is improved if it instead provides spinning reserve in those hours and sells its remaining energy in Hours 20 and 21 at lower prices. This is because over the sum of the hours, the spinning reserve revenues gained in Hours 18-19 and the energy revenues gained in Hours 20-21 are greater than the energy revenues lost in the first two hours. The calculations are illustrated in the following two dispatch cases. In case #1, shown in Table (b), the plant dispatches all its stored energy in Hours 18 and 19, and earns $11,000 over the four hours. In case #2, shown in Table (b), the plant sells as much spinning reserves as it can over Hours 18-19 and releases the remaining energy subsequently in Hours 20-21. It then earns $12,450. Note that there are other optimal solutions which also result in this total revenue, but this solution demonstrates the point and is easy to follow. Denholm et al., (2013: pp. 15-16) provides a more detailed multi-hour example.
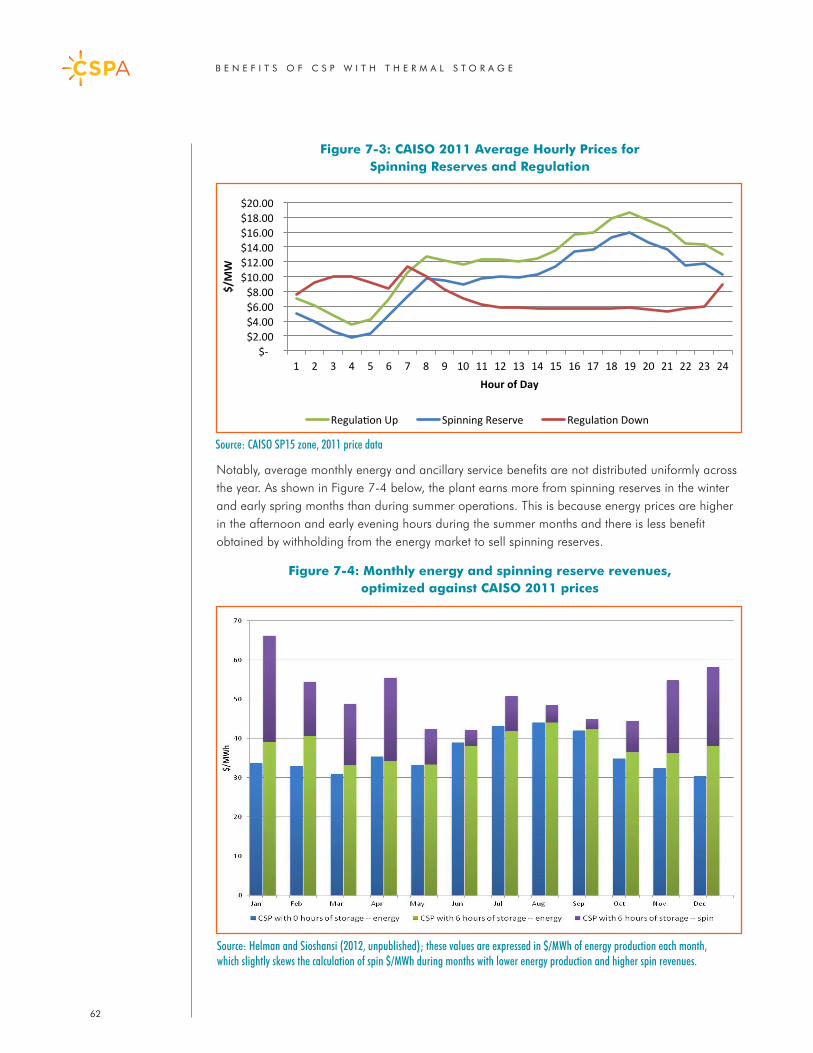
B E N E F I T S O F C S P W I T H T H E R M A L S T O R A G E
62
Figure 7-3: CAISO 2011 Average Hourly Prices for Spinning Reserves and Regulation
Notably, average monthly energy and ancillary service benefits are not distributed uniformly across the year. As shown in Figure 7-4 below, the plant earns more from spinning reserves in the winter and early spring months than during summer operations. This is because energy prices are higher in the afternoon and early evening hours during the summer months and there is less benefit obtained by withholding from the energy market to sell spinning reserves.
Figure 7-4: Monthly energy and spinning reserve revenues, optimized against CAISO 2011 prices
$-‐ $2.00 $4.00 $6.00 $8.00
$10.00 $12.00 $14.00 $16.00 $18.00 $20.00
1 2 3 4 5 6 7 8 9 10 11 12 13 14 15 16 17 18 19 20 21 22 23 24
$/MW
Hour of Day
Regula5on Up Spinning Reserve Regula5on Down
Source: CAISO SP15 zone, 2011 price data
Source: Helman and Sioshansi (2012, unpublished); these values are expressed in $/MWh of energy production each month, which slightly skews the calculation of spin $/MWh during months with lower energy production and higher spin revenues.
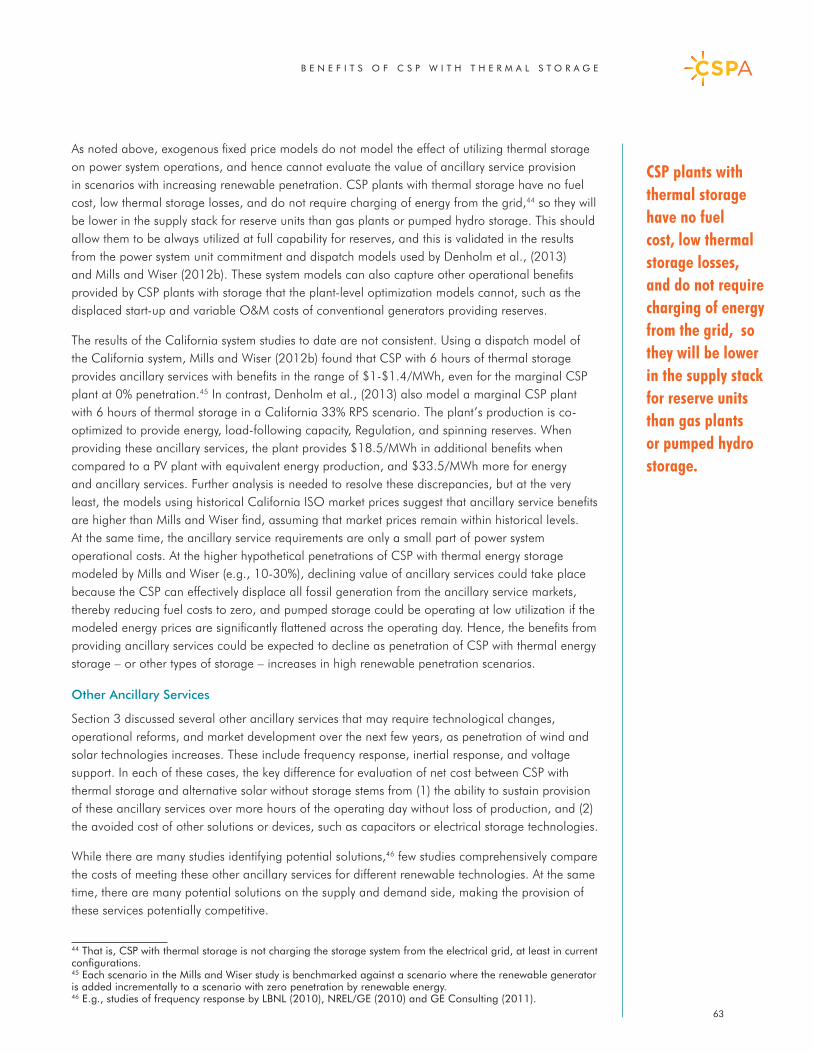
B E N E F I T S O F C S P W I T H T H E R M A L S T O R A G E
63
As noted above, exogenous fixed price models do not model the effect of utilizing thermal storage on power system operations, and hence cannot evaluate the value of ancillary service provision in scenarios with increasing renewable penetration. CSP plants with thermal storage have no fuel cost, low thermal storage losses, and do not require charging of energy from the grid,44 so they will be lower in the supply stack for reserve units than gas plants or pumped hydro storage. This should allow them to be always utilized at full capability for reserves, and this is validated in the results from the power system unit commitment and dispatch models used by Denholm et al., (2013) and Mills and Wiser (2012b). These system models can also capture other operational benefits provided by CSP plants with storage that the plant-level optimization models cannot, such as the displaced start-up and variable O&M costs of conventional generators providing reserves.
The results of the California system studies to date are not consistent. Using a dispatch model of the California system, Mills and Wiser (2012b) found that CSP with 6 hours of thermal storage provides ancillary services with benefits in the range of $1-$1.4/MWh, even for the marginal CSP plant at 0% penetration.45 In contrast, Denholm et al., (2013) also model a marginal CSP plant with 6 hours of thermal storage in a California 33% RPS scenario. The plant’s production is co-optimized to provide energy, load-following capacity, Regulation, and spinning reserves. When providing these ancillary services, the plant provides $18.5/MWh in additional benefits when compared to a PV plant with equivalent energy production, and $33.5/MWh more for energy and ancillary services. Further analysis is needed to resolve these discrepancies, but at the very least, the models using historical California ISO market prices suggest that ancillary service benefits are higher than Mills and Wiser find, assuming that market prices remain within historical levels. At the same time, the ancillary service requirements are only a small part of power system operational costs. At the higher hypothetical penetrations of CSP with thermal energy storage modeled by Mills and Wiser (e.g., 10-30%), declining value of ancillary services could take place because the CSP can effectively displace all fossil generation from the ancillary service markets, thereby reducing fuel costs to zero, and pumped storage could be operating at low utilization if the modeled energy prices are significantly flattened across the operating day. Hence, the benefits from providing ancillary services could be expected to decline as penetration of CSP with thermal energy storage – or other types of storage – increases in high renewable penetration scenarios.
Other Ancillary Services
Section 3 discussed several other ancillary services that may require technological changes, operational reforms, and market development over the next few years, as penetration of wind and solar technologies increases. These include frequency response, inertial response, and voltage support. In each of these cases, the key difference for evaluation of net cost between CSP with thermal storage and alternative solar without storage stems from (1) the ability to sustain provision of these ancillary services over more hours of the operating day without loss of production, and (2) the avoided cost of other solutions or devices, such as capacitors or electrical storage technologies.
While there are many studies identifying potential solutions,46 few studies comprehensively compare the costs of meeting these other ancillary services for different renewable technologies. At the same time, there are many potential solutions on the supply and demand side, making the provision of these services potentially competitive.
44 That is, CSP with thermal storage is not charging the storage system from the electrical grid, at least in current configurations.45 Each scenario in the Mills and Wiser study is benchmarked against a scenario where the renewable generator is added incrementally to a scenario with zero penetration by renewable energy.46 E.g., studies of frequency response by LBNL (2010), NREL/GE (2010) and GE Consulting (2011).
CSP plants with thermal storage have no fuel cost, low thermal storage losses, and do not require charging of energy from the grid, so they will be lower in the supply stack for reserve units than gas plants or pumped hydro storage.
B E N E F I T S O F C S P W I T H T H E R M A L S T O R A G E
64
These include, as listed in various studies:
• Electrical storage devices,• Provision by inverter-based wind and solar resources,• Fast acting, flexible demand response,• Improvements in generator flexibility, and• Expansion and coordination of balancing areas and regional wholesale markets.
For the CSP sector and utility procurement, these developments need careful monitoring and consideration in plant engineering. CSP with thermal storage presents an opportunity to obtain a very broad range of ancillary service capabilities offered by synchronous generators at no additional plant cost, and requiring essentially no new methods for system operations, other than forecasting to determine the hourly state of charge on the energy storage system.
7.3 Summary and Additional Research Needs
The added energy and ancillary services benefits provided by CSP with thermal energy storage are significant when compared to other solar and wind resources. Studies differ on the added benefits at low solar penetration, where the difference with PV ranges from insignificant (Mills and Wiser, 2012) to estimates between $3-10/MWh in other studies, including those using historical market price data from California. The higher end of the range reflects periods with higher natural gas prices, such as 2005. In low penetration scenarios, some of these differences are also due to the methodology, particularly studies assuming equal energy production between alternative technologies.
At higher levels of solar penetration on the grid, studies consistently identify significant benefits for addition of incremental CSP with thermal storage of up to $33/MWh when compared to incremental PV or CSP without storage (Denholm et al., 2013; Denholm and Hummon, 2012; Mills and Wiser, 2012b). Table 7-1 summarizes some of these results.
To date, these studies focused on modeling hourly blocks of energy and reserves the benefits of the operational flexibility provided by CSP with thermal energy storage could be greater as operational needs increase. Additional research is needed to improve the understanding of the ancillary service ratings of actual CSP plants and to model sub-hourly energy dispatch, Regulation dispatch, and frequency responsive reserves from solar thermal storage. Finally, related to the analysis of energy and ancillary services is assessment of the likelihood and cost of solar energy curtailment during congestion or overgeneration conditions. The additional potential benefits of avoiding these system conditions are discussed in Section 8 under integration analysis, but are also considered in forward energy procurement.
Power system operations at increasing penetration of wind and PV technologies create new operational needs and requirements for interconnection standards that could increase the installed costs of deploying these technologies. In the case of PV, these costs could be incurred through additional inverter controls, addition of transmission equipment such as capacitors, and through loss of production if the plant is actively controlling production. CSP plants with or without storage utilize synchronous generators, providing similar short-term reliability and operational benefits to the system as conventional power plants at no additional cost.
B E N E F I T S O F C S P W I T H T H E R M A L S T O R A G E
65
8. Resource Adequacy and Long-term ReliabilitySolar energy production from PV or CSP without storage is highly correlated with annual peak demand in many power systems. As discussed in Sections 4 and 6, when coupled with sufficient solar insolation, this results in high capacity credits and long-term capacity value, especially at low penetration of such technologies. However, as solar penetration increases, the capacity value of new variable energy solar projects declines. A key finding is that under such conditions, incremental CSP with thermal storage retains much of its capacity value due to its ability to shift energy to hours of highest reliability risk; it also provides operational flexibility, which will be more highly valued under future “flexible capacity” requirements.
This section reviews several studies which demonstrate these findings for different solar technologies. The section is organized as follows:
• Section 8.1 briefly reviews the methodology for capacity valuation, complemented by the more detailed discussion in Appendix A.
• Section 8.2 surveys results from studies that evaluate low solar penetration scenarios.• Section 8.3 reviews results from scenarios with higher solar penetration.• Section 8.4 reviews the recent requirements for flexible capacity and its relationship
to the value of alternative solar technologies.• Section 8.5 summarizes and identifies analytical needs for further research.
8.1 Methodology for Capacity Valuation
The methods for calculating capacity credits and capacity value of variable energy resources are reviewed in some detail in Appendix A. Table A-1 lists the capacity credit methodology currently used by different utilities and system operators in the United States and Canada. These methods are computationally complex. They are made even more complicated by the need to consider renewable penetration at historically unprecedented levels as well as the associated, and still undefined, requirements for operational flexibility.
The capacity credit or rating (MW) of a generator is its contribution to maintaining a reliability standard, typically based on a risk of loss-of-load. The capacity value of a particular generator ($/MW) is the capacity credit multiplied by the prevailing capacity market price or by the avoided cost of new capacity. The most robust approach to calculating capacity credits is to use statistical methods to determine the contribution of different types of existing and planned resources to achieve a loss of load probability (LOLP) for a particular power system that meets a reliability criterion. This criterion is typically measured in the United States as one (1) loss-of-load event in 10 years, a standard which has been interpreted differently in different locations (Pfeifenberger et al., 2013). As described in Appendix A and Table A-1, these types of models, and approximation methods that simplify the analysis for incremental resource additions, can be used to calculate the effective load carrying capability (ELCC) of incremental variable wind or solar plants under different resource scenarios (ELCC methods measure the additional load that can be added for each MW of variable wind and/or solar while maintaining the same reliability standard). Importantly, valuation of CSP plants with thermal storage typically requires further methodological modifications, because detailed dispatch models are used to calculate how forecast solar energy is stored in the thermal energy storage systems, converted into energy production, and then dispatched to the hours with highest capacity value.
In regions with sufficient solar insolation, CSP resources with substantial thermal energy storage capacity have high capacity value, approaching that of conventional gas-fired generators. Non-dispatchable technologies, such as PV and CSP without storage, have rapidly declining capacity value at higher penetrations. The difference in long-term benefit can be as much as $10-30/MWh.
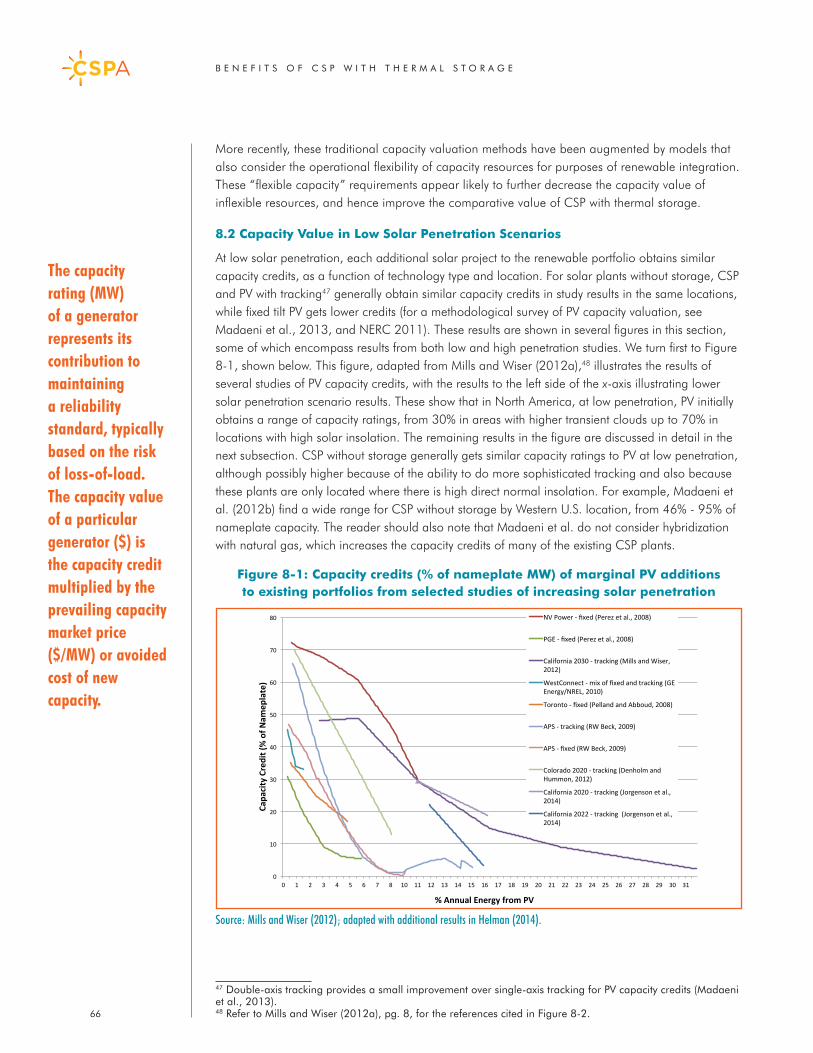
B E N E F I T S O F C S P W I T H T H E R M A L S T O R A G E
66
0
10
20
30
40
50
60
70
80
0 1 2 3 4 5 6 7 8 10 11 12 13 14 15 16 17 18 19 20 21 22 23 24 25 26 27 28 29 30 31
Capa
city Credit (% of N
amep
late)
% Annual Energy from PV
NV Power -‐ fixed (Perez et al., 2008)
PGE -‐ fixed (Perez et al., 2008)
California 2030 -‐ tracking (Mills and Wiser, 2012)
WestConnect -‐ mix of fixed and tracking (GE Energy/NREL, 2010)
Toronto -‐ fixed (Pelland and Abboud, 2008)
APS -‐ tracking (RW Beck, 2009)
APS -‐ fixed (RW Beck, 2009)
Colorado 2020 -‐ tracking (Denholm and Hummon, 2012)
California 2020 -‐ tracking (Jorgenson et al., 2014)
California 2022 -‐ tracking (Jorgenson et al., 2014)
Source: Mills and Wiser (2012); adapted with additional results in Helman (2014).
More recently, these traditional capacity valuation methods have been augmented by models that also consider the operational flexibility of capacity resources for purposes of renewable integration. These “flexible capacity” requirements appear likely to further decrease the capacity value of inflexible resources, and hence improve the comparative value of CSP with thermal storage.
8.2 Capacity Value in Low Solar Penetration Scenarios
At low solar penetration, each additional solar project to the renewable portfolio obtains similar capacity credits, as a function of technology type and location. For solar plants without storage, CSP and PV with tracking47 generally obtain similar capacity credits in study results in the same locations, while fixed tilt PV gets lower credits (for a methodological survey of PV capacity valuation, see Madaeni et al., 2013, and NERC 2011). These results are shown in several figures in this section, some of which encompass results from both low and high penetration studies. We turn first to Figure 8-1, shown below. This figure, adapted from Mills and Wiser (2012a),48 illustrates the results of several studies of PV capacity credits, with the results to the left side of the x-axis illustrating lower solar penetration scenario results. These show that in North America, at low penetration, PV initially obtains a range of capacity ratings, from 30% in areas with higher transient clouds up to 70% in locations with high solar insolation. The remaining results in the figure are discussed in detail in the next subsection. CSP without storage generally gets similar capacity ratings to PV at low penetration, although possibly higher because of the ability to do more sophisticated tracking and also because these plants are only located where there is high direct normal insolation. For example, Madaeni et al. (2012b) find a wide range for CSP without storage by Western U.S. location, from 46% - 95% of nameplate capacity. The reader should also note that Madaeni et al. do not consider hybridization with natural gas, which increases the capacity credits of many of the existing CSP plants.
Figure 8-1: Capacity credits (% of nameplate MW) of marginal PV additions to existing portfolios from selected studies of increasing solar penetration
47 Double-axis tracking provides a small improvement over single-axis tracking for PV capacity credits (Madaeni et al., 2013).48 Refer to Mills and Wiser (2012a), pg. 8, for the references cited in Figure 8-2.
The capacity rating (MW) of a generator represents its contribution to maintaining a reliability standard, typically based on the risk of loss-of-load. The capacity value of a particular generator ($) is the capacity credit multiplied by the prevailing capacity market price ($/MW) or avoided cost of new capacity.
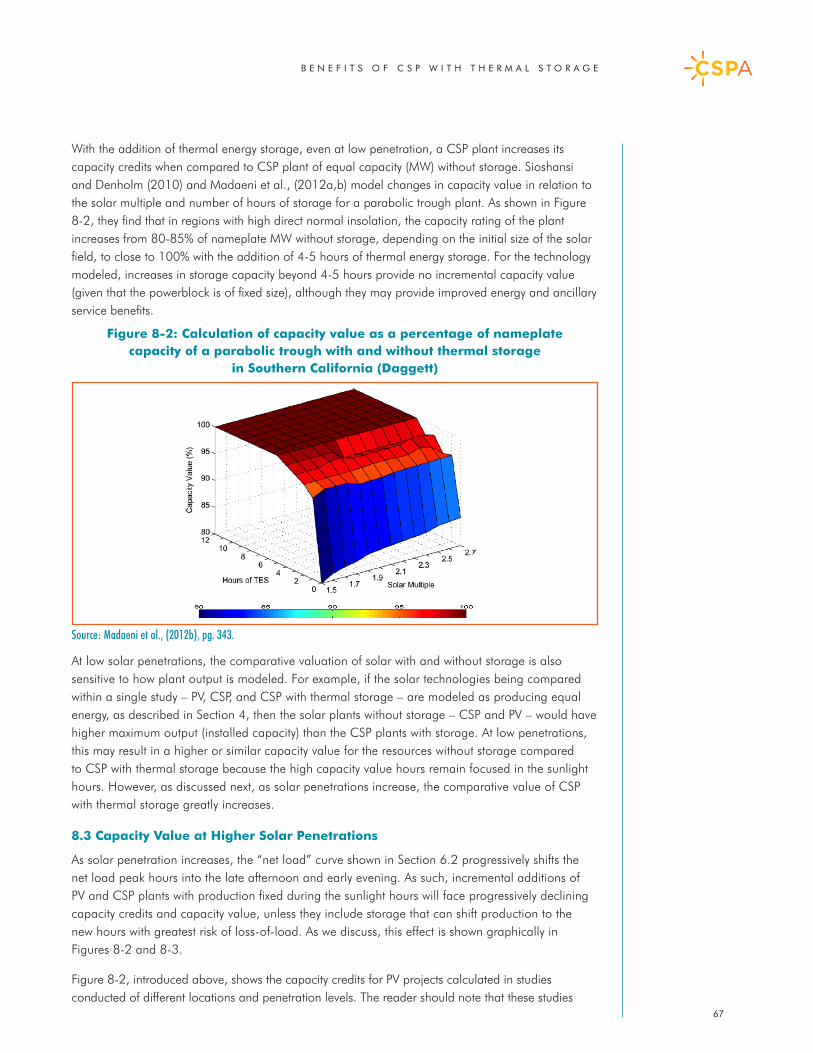
B E N E F I T S O F C S P W I T H T H E R M A L S T O R A G E
67
With the addition of thermal energy storage, even at low penetration, a CSP plant increases its capacity credits when compared to CSP plant of equal capacity (MW) without storage. Sioshansi and Denholm (2010) and Madaeni et al., (2012a,b) model changes in capacity value in relation to the solar multiple and number of hours of storage for a parabolic trough plant. As shown in Figure 8-2, they find that in regions with high direct normal insolation, the capacity rating of the plant increases from 80-85% of nameplate MW without storage, depending on the initial size of the solar field, to close to 100% with the addition of 4-5 hours of thermal energy storage. For the technology modeled, increases in storage capacity beyond 4-5 hours provide no incremental capacity value (given that the powerblock is of fixed size), although they may provide improved energy and ancillary service benefits.
Figure 8-2: Calculation of capacity value as a percentage of nameplate capacity of a parabolic trough with and without thermal storage
in Southern California (Daggett)
At low solar penetrations, the comparative valuation of solar with and without storage is also sensitive to how plant output is modeled. For example, if the solar technologies being compared within a single study – PV, CSP, and CSP with thermal storage – are modeled as producing equal energy, as described in Section 4, then the solar plants without storage – CSP and PV – would have higher maximum output (installed capacity) than the CSP plants with storage. At low penetrations, this may result in a higher or similar capacity value for the resources without storage compared to CSP with thermal storage because the high capacity value hours remain focused in the sunlight hours. However, as discussed next, as solar penetrations increase, the comparative value of CSP with thermal storage greatly increases.
8.3 Capacity Value at Higher Solar Penetrations
As solar penetration increases, the “net load” curve shown in Section 6.2 progressively shifts the net load peak hours into the late afternoon and early evening. As such, incremental additions of PV and CSP plants with production fixed during the sunlight hours will face progressively declining capacity credits and capacity value, unless they include storage that can shift production to the new hours with greatest risk of loss-of-load. As we discuss, this effect is shown graphically in Figures 8-2 and 8-3.
Figure 8-2, introduced above, shows the capacity credits for PV projects calculated in studies conducted of different locations and penetration levels. The reader should note that these studies
Source: Madaeni et al., (2012b), pg. 343.
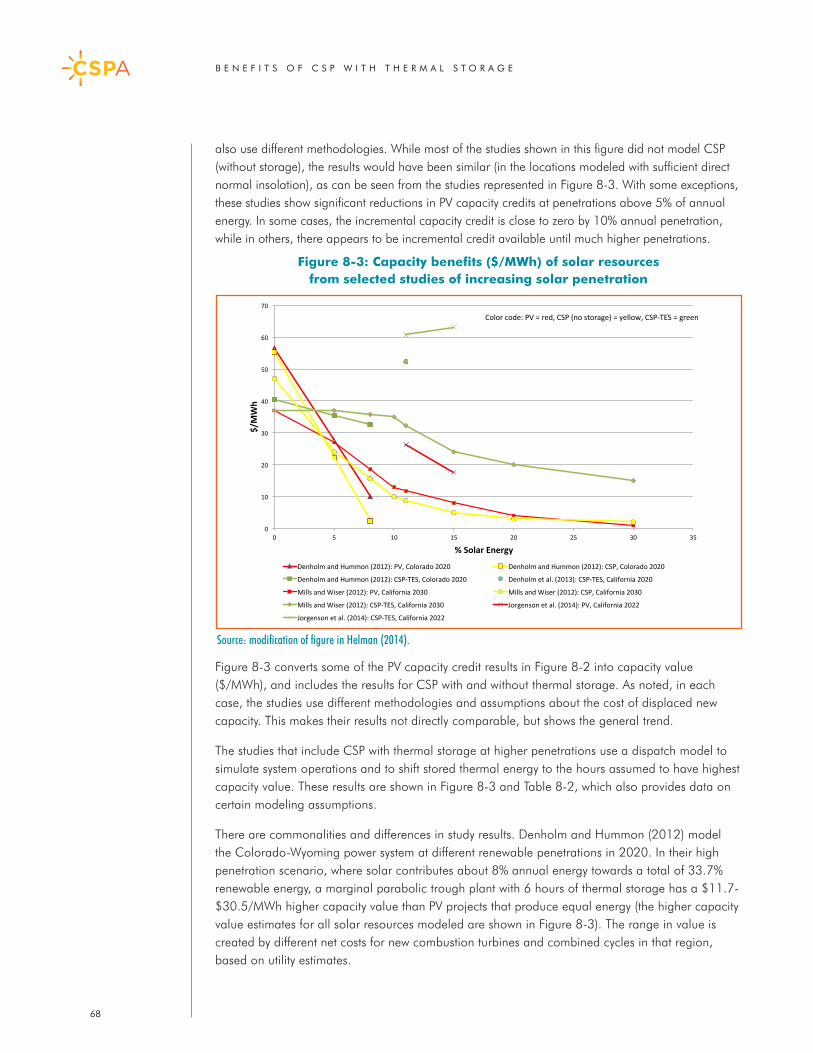
B E N E F I T S O F C S P W I T H T H E R M A L S T O R A G E
68
also use different methodologies. While most of the studies shown in this figure did not model CSP (without storage), the results would have been similar (in the locations modeled with sufficient direct normal insolation), as can be seen from the studies represented in Figure 8-3. With some exceptions, these studies show significant reductions in PV capacity credits at penetrations above 5% of annual energy. In some cases, the incremental capacity credit is close to zero by 10% annual penetration, while in others, there appears to be incremental credit available until much higher penetrations.
Figure 8-3: Capacity benefits ($/MWh) of solar resources from selected studies of increasing solar penetration
Figure 8-3 converts some of the PV capacity credit results in Figure 8-2 into capacity value ($/MWh), and includes the results for CSP with and without thermal storage. As noted, in each case, the studies use different methodologies and assumptions about the cost of displaced new capacity. This makes their results not directly comparable, but shows the general trend.
The studies that include CSP with thermal storage at higher penetrations use a dispatch model to simulate system operations and to shift stored thermal energy to the hours assumed to have highest capacity value. These results are shown in Figure 8-3 and Table 8-2, which also provides data on certain modeling assumptions.
There are commonalities and differences in study results. Denholm and Hummon (2012) model the Colorado-Wyoming power system at different renewable penetrations in 2020. In their high penetration scenario, where solar contributes about 8% annual energy towards a total of 33.7% renewable energy, a marginal parabolic trough plant with 6 hours of thermal storage has a $11.7-$30.5/MWh higher capacity value than PV projects that produce equal energy (the higher capacity value estimates for all solar resources modeled are shown in Figure 8-3). The range in value is created by different net costs for new combustion turbines and combined cycles in that region, based on utility estimates.
0
10
20
30
40
50
60
70
0 5 10 15 20 25 30 35
$/MWh
% Solar Energy
Denholm and Hummon (2012): PV, Colorado 2020 Denholm and Hummon (2012): CSP, Colorado 2020
Denholm and Hummon (2012): CSP-‐TES, Colorado 2020 Denholm et al. (2013): CSP-‐TES, California 2020
Mills and Wiser (2012): PV, California 2030 Mills and Wiser (2012): CSP, California 2030
Mills and Wiser (2012): CSP-‐TES, California 2030 Jorgenson et al. (2014): PV, California 2022
Jorgenson et al. (2014): CSP-‐TES, California 2022
Color code: PV = red, CSP (no storage) = yellow, CSP-‐TES = green
Source: modification of figure in Helman (2014).
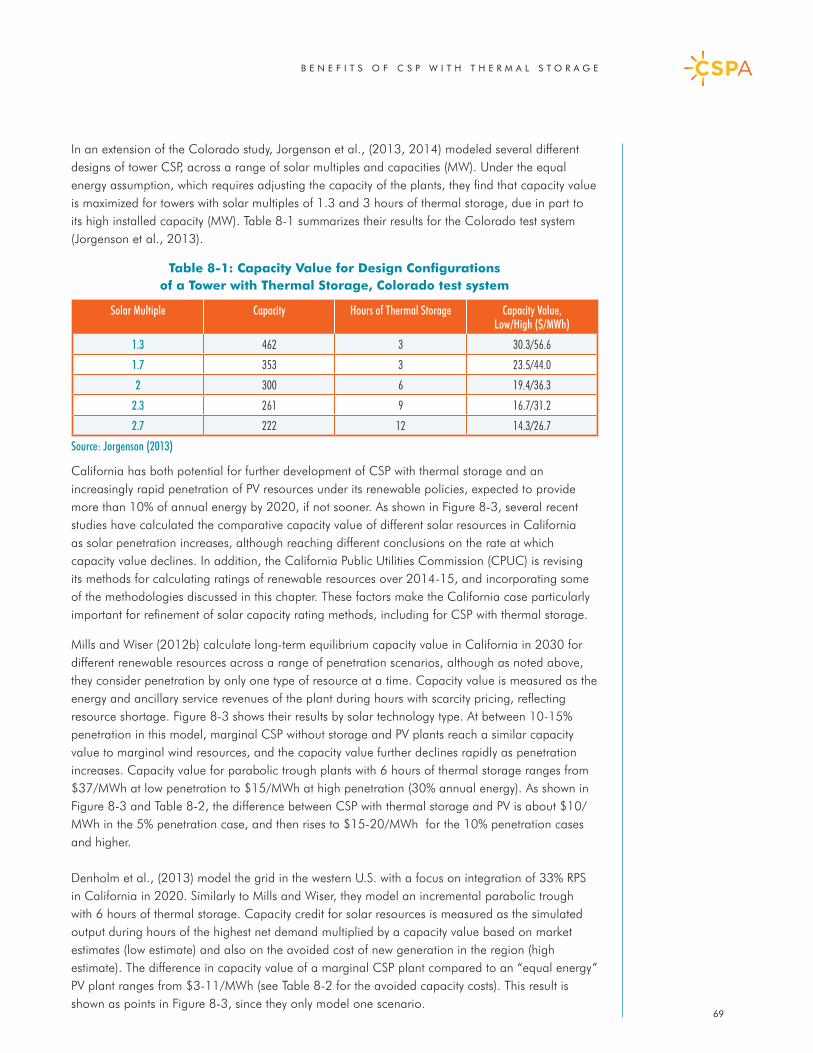
B E N E F I T S O F C S P W I T H T H E R M A L S T O R A G E
69
In an extension of the Colorado study, Jorgenson et al., (2013, 2014) modeled several different designs of tower CSP, across a range of solar multiples and capacities (MW). Under the equal energy assumption, which requires adjusting the capacity of the plants, they find that capacity value is maximized for towers with solar multiples of 1.3 and 3 hours of thermal storage, due in part to its high installed capacity (MW). Table 8-1 summarizes their results for the Colorado test system (Jorgenson et al., 2013).
Table 8-1: Capacity Value for Design Configurations of a Tower with Thermal Storage, Colorado test system
California has both potential for further development of CSP with thermal storage and an increasingly rapid penetration of PV resources under its renewable policies, expected to provide more than 10% of annual energy by 2020, if not sooner. As shown in Figure 8-3, several recent studies have calculated the comparative capacity value of different solar resources in California as solar penetration increases, although reaching different conclusions on the rate at which capacity value declines. In addition, the California Public Utilities Commission (CPUC) is revising its methods for calculating ratings of renewable resources over 2014-15, and incorporating some of the methodologies discussed in this chapter. These factors make the California case particularly important for refinement of solar capacity rating methods, including for CSP with thermal storage.
Mills and Wiser (2012b) calculate long-term equilibrium capacity value in California in 2030 for different renewable resources across a range of penetration scenarios, although as noted above, they consider penetration by only one type of resource at a time. Capacity value is measured as the energy and ancillary service revenues of the plant during hours with scarcity pricing, reflecting resource shortage. Figure 8-3 shows their results by solar technology type. At between 10-15% penetration in this model, marginal CSP without storage and PV plants reach a similar capacity value to marginal wind resources, and the capacity value further declines rapidly as penetration increases. Capacity value for parabolic trough plants with 6 hours of thermal storage ranges from $37/MWh at low penetration to $15/MWh at high penetration (30% annual energy). As shown in Figure 8-3 and Table 8-2, the difference between CSP with thermal storage and PV is about $10/MWh in the 5% penetration case, and then rises to $15-20/MWh for the 10% penetration cases and higher.
Denholm et al., (2013) model the grid in the western U.S. with a focus on integration of 33% RPS in California in 2020. Similarly to Mills and Wiser, they model an incremental parabolic trough with 6 hours of thermal storage. Capacity credit for solar resources is measured as the simulated output during hours of the highest net demand multiplied by a capacity value based on market estimates (low estimate) and also on the avoided cost of new generation in the region (high estimate). The difference in capacity value of a marginal CSP plant compared to an “equal energy” PV plant ranges from $3-11/MWh (see Table 8-2 for the avoided capacity costs). This result is shown as points in Figure 8-3, since they only model one scenario.
Solar Multiple Capacity Hours of Thermal Storage Capacity Value, Low/High ($/MWh)
1.3 462 3 30.3/56.6
1.7 353 3 23.5/44.0
2 300 6 19.4/36.3
2.3 261 9 16.7/31.2
2.7 222 12 14.3/26.7
Source: Jorgenson (2013)
B E N E F I T S O F C S P W I T H T H E R M A L S T O R A G E
70
In a follow-on study, Jorgenson et al., (2014) model power towers with different storage capacities and at different solar multiples in both 33% and 40% RPS scenarios in California in 2020. They find that CSP capacity credits and capacity value increases with the increase in solar penetration between the 33% and 40% scenario, while PV capacity value decreases, resulting in a difference in capacity value with PV of $34.5/MWh and $45.5/MWh, respectively. The increase in capacity value results because of a narrowing of the daily peak hours due to the increased penetration of solar PV.
These findings illustrate that as penetration of variable solar resources increases, the capacity value of marginal variable solar plants decreases, sometimes fairly rapidly. In most studies to date, CSP with thermal storage also loses some capacity value as penetration increases, but is able to retain much of its value by shifting energy to the highest capacity value hours as they change. However, Jorgenson et al., (2014) have also found that CSP with thermal storage may experience an increase in capacity value as aggregate solar production increases from around 12% to 16% annual energy. Additional research is clearly needed to clarify the range of solar capacity valuations in different penetration scenarios of the same regions.
8.4 Capacity Resources with Flexible Operational Attributes
With the penetration of wind and solar technologies, in many regions new approaches are being considered for the calculation of capacity requirements to ensure adequate operational attributes of existing, retrofitted or new capacity resources (e.g., Lannoye et al, 2012).49 Such market rules may result in multiple classes of capacity differentiated by operational characteristics such as sustainable ramp rate over some period of time, and other factors such as start-up times. These developments reflect a concern that the sequence of retirements of existing capacity, and additions of new capacity, may not provide the operational flexibility needed to integrate variable energy resources. In regions with organized power markets, this could be because short-term price signals, sent through energy and ancillary service markets, will be insufficient to provide the incentives for the investment required to support rapid increases in needs for operational flexibility, which some power systems may experience at high renewable penetration. Hence, capacity requirements (or forward reserve markets, which serve similar purposes) could be modified to establish these requirements through forward procurement on a 1-3 year basis.
CSP with thermal energy storage can contribute to utilities’ evolving flexible capacity requirements. As noted above, once synchronized with the grid, these plants offer fast ramp rates, the capability to support a ramp for several hours (as a function of storage capacity), and provide other desirable operational attributes. Based on industry discussions, start-up times are not especially fast from “cold” (i.e., full shutdown) conditions when utilizing thermal energy storage systems but can be reasonably fast from warm or hot conditions. Further analysis is also needed to determine the storage capacity needed to qualify CSP as flexible capacity, because ramping may be required for system operations at times other than the top seasonal peak load or net load hours.
Flexible capacity requirements may further reduce the capacity value of incremental generation resources that do not provide flexibility. This will increase the difference in capacity value of alternative solar technologies as renewable penetration increases, in addition to the difference already noted above.
49 For progress towards flexible capacity requirements in California, see papers at http://www.cpuc.ca.gov/PUC/energy/Procurement/RA/ra_history.htm.
Additional research is clearly needed to clarify the range of solar capacity valuations in different penetration scenarios of the same regions.
CSP with thermal energy storage can contribute to utilities’ evolving flexible capacity requirements.
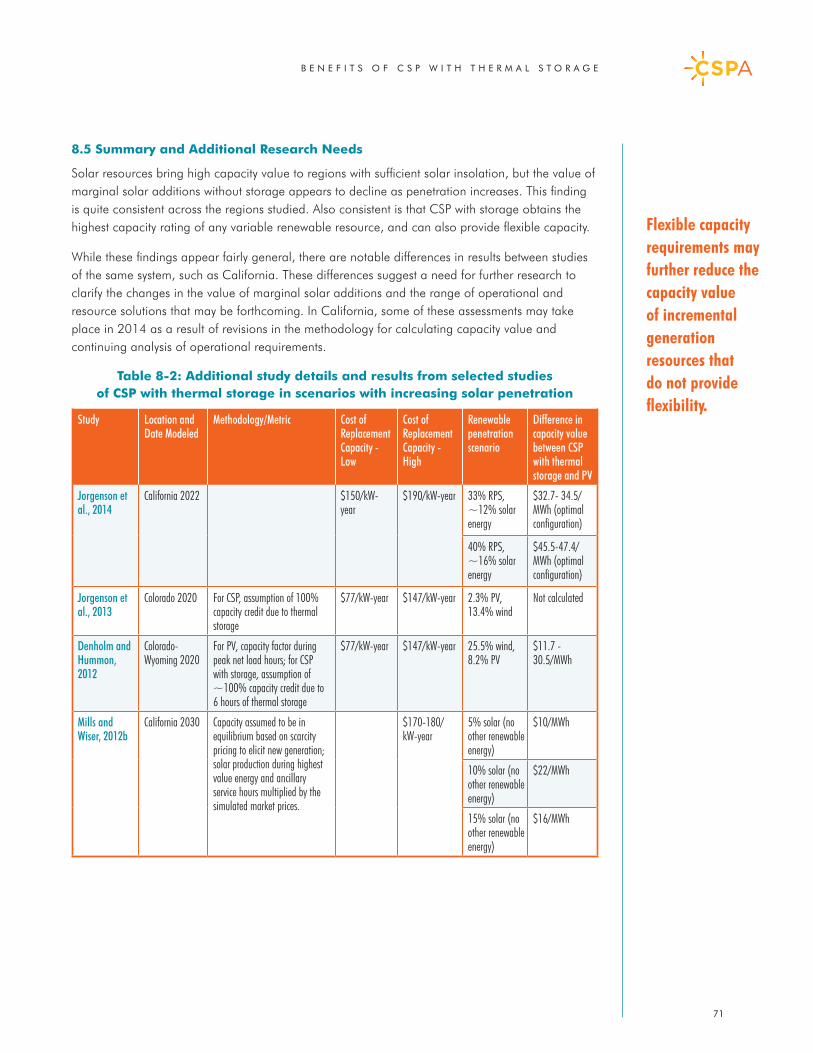
B E N E F I T S O F C S P W I T H T H E R M A L S T O R A G E
71
8.5 Summary and Additional Research Needs
Solar resources bring high capacity value to regions with sufficient solar insolation, but the value of marginal solar additions without storage appears to decline as penetration increases. This finding is quite consistent across the regions studied. Also consistent is that CSP with storage obtains the highest capacity rating of any variable renewable resource, and can also provide flexible capacity.
While these findings appear fairly general, there are notable differences in results between studies of the same system, such as California. These differences suggest a need for further research to clarify the changes in the value of marginal solar additions and the range of operational and resource solutions that may be forthcoming. In California, some of these assessments may take place in 2014 as a result of revisions in the methodology for calculating capacity value and continuing analysis of operational requirements.
Table 8-2: Additional study details and results from selected studies of CSP with thermal storage in scenarios with increasing solar penetration
Study Location and Date Modeled
Methodology/Metric Cost of Replacement Capacity - Low
Cost of Replacement Capacity - High
Renewable penetration scenario
Difference in capacity value between CSP with thermal storage and PV
Jorgenson et al., 2014
California 2022 $150/kW-year
$190/kW-year 33% RPS, ~12% solar energy
$32.7- 34.5/MWh (optimal configuration)
40% RPS, ~16% solar energy
$45.5-47.4/MWh (optimal configuration)
Jorgenson et al., 2013
Colorado 2020 For CSP, assumption of 100% capacity credit due to thermal storage
$77/kW-year $147/kW-year 2.3% PV, 13.4% wind
Not calculated
Denholm and Hummon, 2012
Colorado-Wyoming 2020
For PV, capacity factor during peak net load hours; for CSP with storage, assumption of ~100% capacity credit due to 6 hours of thermal storage
$77/kW-year $147/kW-year 25.5% wind, 8.2% PV
$11.7 - 30.5/MWh
Mills and Wiser, 2012b
California 2030 Capacity assumed to be in equilibrium based on scarcity pricing to elicit new generation; solar production during highest value energy and ancillary service hours multiplied by the simulated market prices.
$170-180/kW-year
5% solar (no other renewable energy)
$10/MWh
10% solar (no other renewable energy)
$22/MWh
15% solar (no other renewable energy)
$16/MWh
Flexible capacity requirements may further reduce the capacity value of incremental generation resources that do not provide flexibility.
B E N E F I T S O F C S P W I T H T H E R M A L S T O R A G E
72
9. Integration and Curtailment CostsVariable wind and solar resources may increase certain types of power system operational requirements, due to the combination of variability and forecast error which characterizes their production (e.g., NERC 2009). Moreover, as penetration of these resources increases, renewable production can potentially encounter physical operating constraints on the power system, such as ramping constraints and increased frequency of surplus or over-generation. Resolving these constraints could require curtailment of some renewable production and/or new or upgraded infrastructure to support further integration. These integration requirements have not proven to be a long-term impediment to high penetration of renewables in most regions to date, but they do affect decisions about the portfolio of renewable resources in each phase of procurement. Due to its operating flexibility, CSP with thermal storage can both avoid some or all integration and curtailment costs, and simultaneously also provide several of the services needed to integrate other variable energy resources.
Because there are few studies that explicitly calculate solar integration and curtailment costs, this section surveys the available qualitative and quantitative results. It also includes some illustrative examples. The section is organized as follows:
• Section 9.1 describes some basic methodological issues.• Section 9.2 reviews both quantitative and qualitative estimates of solar integration costs.• Section 9.3 uses data from California 33% RPS scenarios to illustrate three examples
of how CSP with thermal storage can mitigate “net load” system ramps.• Section 9.4 summarizes and identifies analytical needs for further research.
9.1 Renewable integration requirements
Integration analysis is generally divided into two questions:
• Systemrequirements. What are the additional system operational constraints and needs under different renewable penetration scenarios?
• Systemcapabilities. What are the capabilities of existing generation and non-generation resources across an interconnected region to meet those requirements? When are new capabilities needed to support the integration of renewable resources and what is the optimal mix of system resources needed over time to meet energy and environmental policy goals while ensuring reliability?
With respect to system requirements for integrating variable wind and solar generation, these include most notably the following:
• Increasedmulti-hoursystemramps. As renewable penetration increases, both predictable and more variable multi-hour system ramps will increase in magnitude and duration.
• Increasedintra-hourlyload-following.Because of the combination of forecast error and actual, real-time variability, system operators must commit sufficient flexible generation to follow wind and solar production on a 5- to 10-minute basis. Due to forecast error, this may require ramping reserves.
Due to its operating flexibility, CSP with thermal storage can both avoid some or all integration and curtailment costs, and simultaneously also provide several of the services needed to integrate other variable energy resources.
B E N E F I T S O F C S P W I T H T H E R M A L S T O R A G E
73
• Increasedfrequencyregulation. In between dispatch of generation, system operators will require additional automated response to solar and wind variability on time-frames of seconds.
• Frequencyresponseandinertialresponsereserves.Many regions are implementing additional reserves for primary frequency control.
There is a growing body of research literature on these topics.50 This paper limits itself to studies and surveys of solar integration costs, and particularly those that model CSP with thermal storage. Section 9.3 below also provides some illustrative simulations of the effect of CSP with thermal storage on system ramps. The provision of these services generally may require retrofit of existing conventional generation and hydro plants to provide greater operating flexibility. As described in Section 3, inverter-based renewable technologies will also be adapted to provide these services, although typically with some loss of production. Finally, new flexible conventional generation and non-generation resources, such as electrical storage, may also be needed over time.
9.2 Avoided integration costs
As renewable portfolios expand, estimates of integration requirements and costs are increasingly being used by utilities and regulators to influence the mix of renewable resources that they procure. The integration costs are just one component of the net system cost equation. However, these costs have attracted more policy attention recently as some power systems attempt to move rapidly to very high penetrations of renewable energy. In regions where CSP with thermal energy storage is a viable technology, avoided integration costs, including renewable curtailments, should thus be considered in the evaluation. Several recent papers have provided initial estimates of comparative solar integration costs, some identified explicitly while others are embedded in aggregate economic benefits (e.g., Denholm et al., 2013; Denholm and Mehos, 2011; Mills and Wiser, 2012b).
Analogous to the calculation of the value of thermal energy storage, the calculation of integration costs associated with variable energy resources requires a baseline case. As discussed in Section 3, several such baselines have been used in the current literature, including a “flat block” of energy and a base-case in which no additional renewables are added to the power system to meet load growth (Milligan et al. 2011; Mills and Wiser, 2012b; Denholm et al., 2013). Another approach is to make incremental adjustments to the renewable portfolio – by comparing equal energy contributions from different technologies, with accompanying changes in integration requirements – and measure the changes in production costs or market value (e.g., Denholm et al., 2013).
The actual and forecast costs of integrating wind and solar PV generation into the grid range widely based on the region and the level of penetration of the technologies. In the northwestern U.S., several utilities charge wind balancing fees, which currently range from $3.60-$9.50/MWh, depending on the utility (e.g., GE Energy and Exeter Associates, 2012). Other estimates of wind integration costs are from simulations. A semi-annual survey of wind integration costs (DOE 2012) finds a wide range of costs depending on the penetration up to about $11/MWh, but with most costs in the range of $2-8/MWh.
To date, there are fewer studies to date focused on integration of solar generation. Variable solar generation creates daily morning and evening production ramps, which increase as the portfolio expands. These ramps interact with load curves and wind generation in those periods to both reduce and increase the magnitude and rate of aggregate system ramps. With respect to
50 E.g., surveys in Milligan, et al., (2009) and DOE (2012). On solar integration costs used by western U.S. utilities, see Mills and Wiser (2012a).
New flexible conventional generation and non-generation resources, such as electrical storage, may also be needed over time.
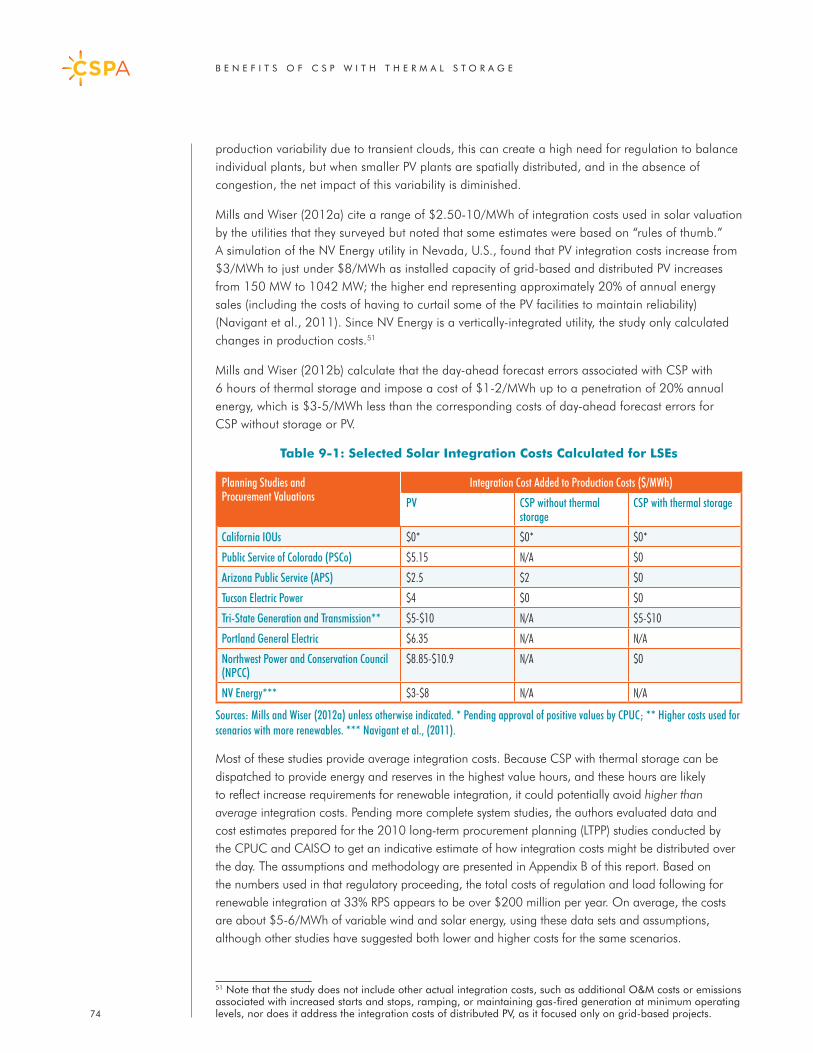
B E N E F I T S O F C S P W I T H T H E R M A L S T O R A G E
74
production variability due to transient clouds, this can create a high need for regulation to balance individual plants, but when smaller PV plants are spatially distributed, and in the absence of congestion, the net impact of this variability is diminished.
Mills and Wiser (2012a) cite a range of $2.50-10/MWh of integration costs used in solar valuation by the utilities that they surveyed but noted that some estimates were based on “rules of thumb.” A simulation of the NV Energy utility in Nevada, U.S., found that PV integration costs increase from $3/MWh to just under $8/MWh as installed capacity of grid-based and distributed PV increases from 150 MW to 1042 MW; the higher end representing approximately 20% of annual energy sales (including the costs of having to curtail some of the PV facilities to maintain reliability) (Navigant et al., 2011). Since NV Energy is a vertically-integrated utility, the study only calculated changes in production costs.51
Mills and Wiser (2012b) calculate that the day-ahead forecast errors associated with CSP with 6 hours of thermal storage and impose a cost of $1-2/MWh up to a penetration of 20% annual energy, which is $3-5/MWh less than the corresponding costs of day-ahead forecast errors for CSP without storage or PV.
Table 9-1: Selected Solar Integration Costs Calculated for LSEs
Most of these studies provide average integration costs. Because CSP with thermal storage can be dispatched to provide energy and reserves in the highest value hours, and these hours are likely to reflect increase requirements for renewable integration, it could potentially avoid higher than average integration costs. Pending more complete system studies, the authors evaluated data and cost estimates prepared for the 2010 long-term procurement planning (LTPP) studies conducted by the CPUC and CAISO to get an indicative estimate of how integration costs might be distributed over the day. The assumptions and methodology are presented in Appendix B of this report. Based on the numbers used in that regulatory proceeding, the total costs of regulation and load following for renewable integration at 33% RPS appears to be over $200 million per year. On average, the costs are about $5-6/MWh of variable wind and solar energy, using these data sets and assumptions, although other studies have suggested both lower and higher costs for the same scenarios.
51 Note that the study does not include other actual integration costs, such as additional O&M costs or emissions associated with increased starts and stops, ramping, or maintaining gas-fired generation at minimum operating levels, nor does it address the integration costs of distributed PV, as it focused only on grid-based projects.
Planning Studies and Procurement Valuations
Integration Cost Added to Production Costs ($/MWh)
PV CSP without thermal storage
CSP with thermal storage
California IOUs $0* $0* $0*
Public Service of Colorado (PSCo) $5.15 N/A $0
Arizona Public Service (APS) $2.5 $2 $0
Tucson Electric Power $4 $0 $0
Tri-State Generation and Transmission** $5-$10 N/A $5-$10
Portland General Electric $6.35 N/A N/A
Northwest Power and Conservation Council (NPCC)
$8.85-$10.9 N/A $0
NV Energy*** $3-$8 N/A N/A
Sources: Mills and Wiser (2012a) unless otherwise indicated. * Pending approval of positive values by CPUC; ** Higher costs used for scenarios with more renewables. *** Navigant et al., (2011).
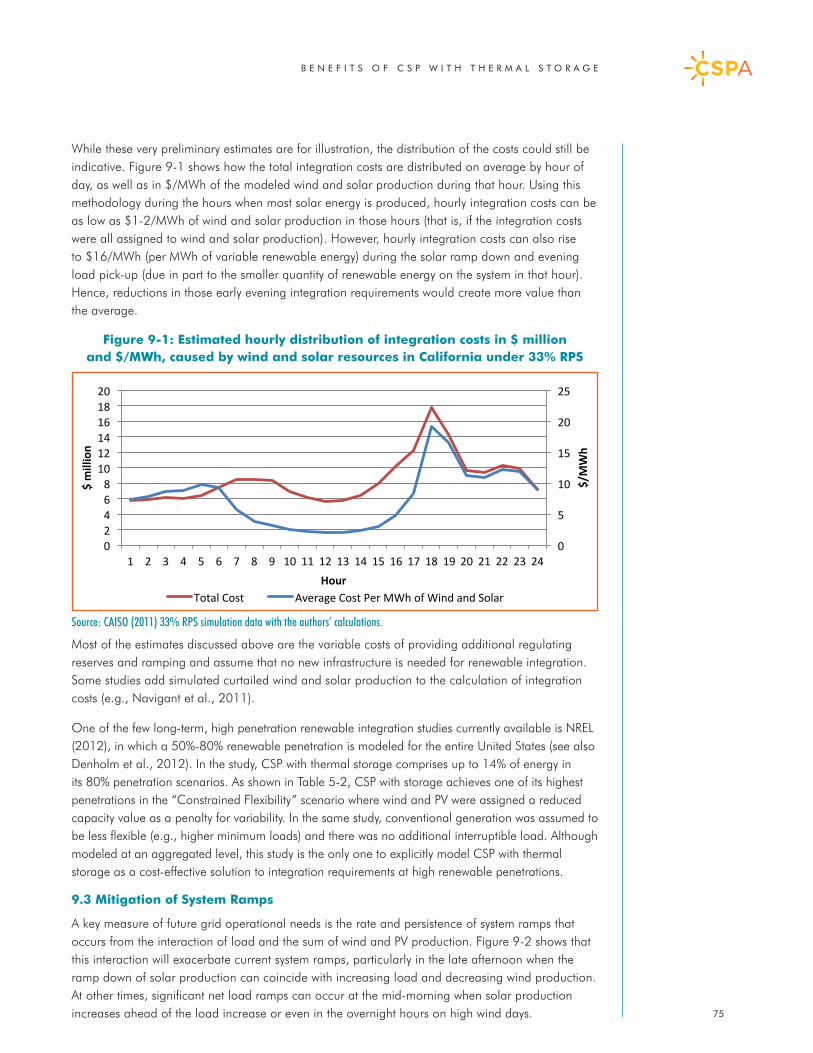
B E N E F I T S O F C S P W I T H T H E R M A L S T O R A G E
75
While these very preliminary estimates are for illustration, the distribution of the costs could still be indicative. Figure 9-1 shows how the total integration costs are distributed on average by hour of day, as well as in $/MWh of the modeled wind and solar production during that hour. Using this methodology during the hours when most solar energy is produced, hourly integration costs can be as low as $1-2/MWh of wind and solar production in those hours (that is, if the integration costs were all assigned to wind and solar production). However, hourly integration costs can also rise to $16/MWh (per MWh of variable renewable energy) during the solar ramp down and evening load pick-up (due in part to the smaller quantity of renewable energy on the system in that hour). Hence, reductions in those early evening integration requirements would create more value than the average.
Figure 9-1: Estimated hourly distribution of integration costs in $ million and $/MWh, caused by wind and solar resources in California under 33% RPS
Most of the estimates discussed above are the variable costs of providing additional regulating reserves and ramping and assume that no new infrastructure is needed for renewable integration. Some studies add simulated curtailed wind and solar production to the calculation of integration costs (e.g., Navigant et al., 2011).
One of the few long-term, high penetration renewable integration studies currently available is NREL (2012), in which a 50%-80% renewable penetration is modeled for the entire United States (see also Denholm et al., 2012). In the study, CSP with thermal storage comprises up to 14% of energy in its 80% penetration scenarios. As shown in Table 5-2, CSP with storage achieves one of its highest penetrations in the “Constrained Flexibility” scenario where wind and PV were assigned a reduced capacity value as a penalty for variability. In the same study, conventional generation was assumed to be less flexible (e.g., higher minimum loads) and there was no additional interruptible load. Although modeled at an aggregated level, this study is the only one to explicitly model CSP with thermal storage as a cost-effective solution to integration requirements at high renewable penetrations.
9.3 Mitigation of System Ramps
A key measure of future grid operational needs is the rate and persistence of system ramps that occurs from the interaction of load and the sum of wind and PV production. Figure 9-2 shows that this interaction will exacerbate current system ramps, particularly in the late afternoon when the ramp down of solar production can coincide with increasing load and decreasing wind production. At other times, significant net load ramps can occur at the mid-morning when solar production increases ahead of the load increase or even in the overnight hours on high wind days.
0
5
10
15
20
25
0 2 4 6 8
10 12 14 16 18 20
1 2 3 4 5 6 7 8 9 10 11 12 13 14 15 16 17 18 19 20 21 22 23 24
$/MWh
$ million
Hour Total Cost Average Cost Per MWh of Wind and Solar
Source: CAISO (2011) 33% RPS simulation data with the authors’ calculations.
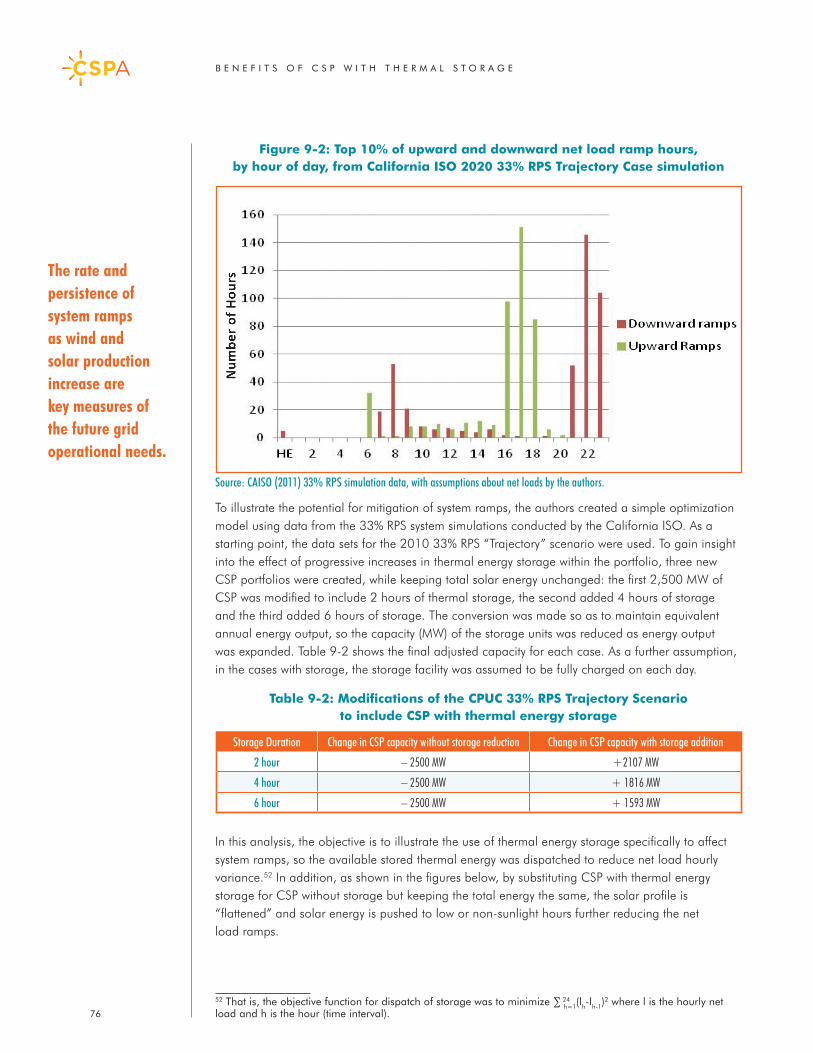
B E N E F I T S O F C S P W I T H T H E R M A L S T O R A G E
76
Figure 9-2: Top 10% of upward and downward net load ramp hours, by hour of day, from California ISO 2020 33% RPS Trajectory Case simulation
To illustrate the potential for mitigation of system ramps, the authors created a simple optimization model using data from the 33% RPS system simulations conducted by the California ISO. As a starting point, the data sets for the 2010 33% RPS “Trajectory” scenario were used. To gain insight into the effect of progressive increases in thermal energy storage within the portfolio, three new CSP portfolios were created, while keeping total solar energy unchanged: the first 2,500 MW of CSP was modified to include 2 hours of thermal storage, the second added 4 hours of storage and the third added 6 hours of storage. The conversion was made so as to maintain equivalent annual energy output, so the capacity (MW) of the storage units was reduced as energy output was expanded. Table 9-2 shows the final adjusted capacity for each case. As a further assumption, in the cases with storage, the storage facility was assumed to be fully charged on each day.
Table 9-2: Modifications of the CPUC 33% RPS Trajectory Scenario to include CSP with thermal energy storage
In this analysis, the objective is to illustrate the use of thermal energy storage specifically to affect system ramps, so the available stored thermal energy was dispatched to reduce net load hourly variance.52 In addition, as shown in the figures below, by substituting CSP with thermal energy storage for CSP without storage but keeping the total energy the same, the solar profile is “flattened” and solar energy is pushed to low or non-sunlight hours further reducing the net load ramps.
52 That is, the objective function for dispatch of storage was to minimize ∑ 24 h=1(lh-lh-1)
2 where l is the hourly net load and h is the hour (time interval).
Source: CAISO (2011) 33% RPS simulation data, with assumptions about net loads by the authors.
Storage Duration Change in CSP capacity without storage reduction Change in CSP capacity with storage addition
2 hour – 2500 MW +2107 MW
4 hour – 2500 MW + 1816 MW
6 hour – 2500 MW + 1593 MW
The rate and persistence of system ramps as wind and solar production increase are key measures of the future grid operational needs.
B E N E F I T S O F C S P W I T H T H E R M A L S T O R A G E
77
To identify interesting days, the California ISO data sets were searched for days with particularly high sustained multi-hour net load ramps and other examples of significant variability. The results for three such days are discussed below. Each figure accompanying the example day shows the following components. At the bottom of the figures labeled (a) are the:
• wind profile for the day (which remains fixed in all cases), • the base aggregate solar (CSP plus PV) production profile (before adjustment), and • profiles for the three cases with CSP with thermal energy storage shown in Table 10.
At the top of the figures labeled (a) are the:
• base hourly load profiles (which remains fixed in all cases), and • net load profiles corresponding to the three cases with CSP with storage.
The figures labeled (b) are closer views of the load and net load profiles from each figure (a). In each case, figure (b) uses the same legend as figure (a).
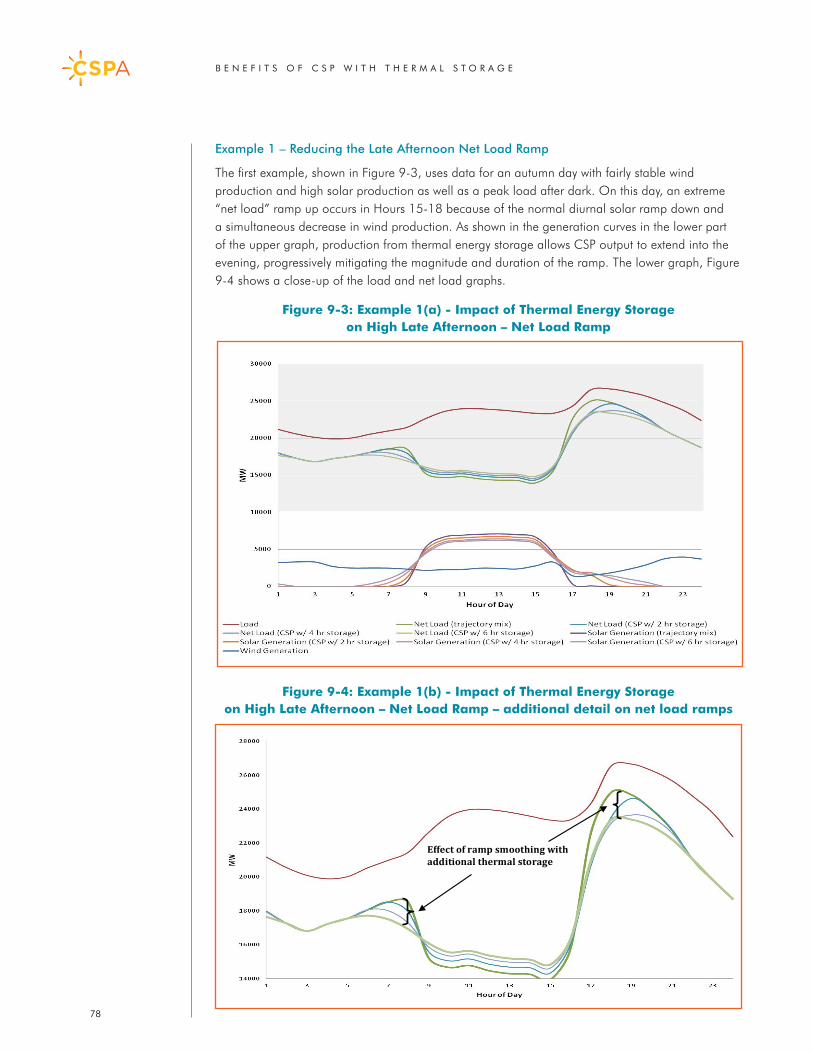
B E N E F I T S O F C S P W I T H T H E R M A L S T O R A G E
78
Example1–ReducingtheLateAfternoonNetLoadRamp
The first example, shown in Figure 9-3, uses data for an autumn day with fairly stable wind production and high solar production as well as a peak load after dark. On this day, an extreme “net load” ramp up occurs in Hours 15-18 because of the normal diurnal solar ramp down and a simultaneous decrease in wind production. As shown in the generation curves in the lower part of the upper graph, production from thermal energy storage allows CSP output to extend into the evening, progressively mitigating the magnitude and duration of the ramp. The lower graph, Figure 9-4 shows a close-up of the load and net load graphs.
Figure 9-3: Example 1(a) - Impact of Thermal Energy Storage on High Late Afternoon – Net Load Ramp
Figure 9-4: Example 1(b) - Impact of Thermal Energy Storage on High Late Afternoon – Net Load Ramp – additional detail on net load ramps
Effect of ramp smoothing with additional thermal storage
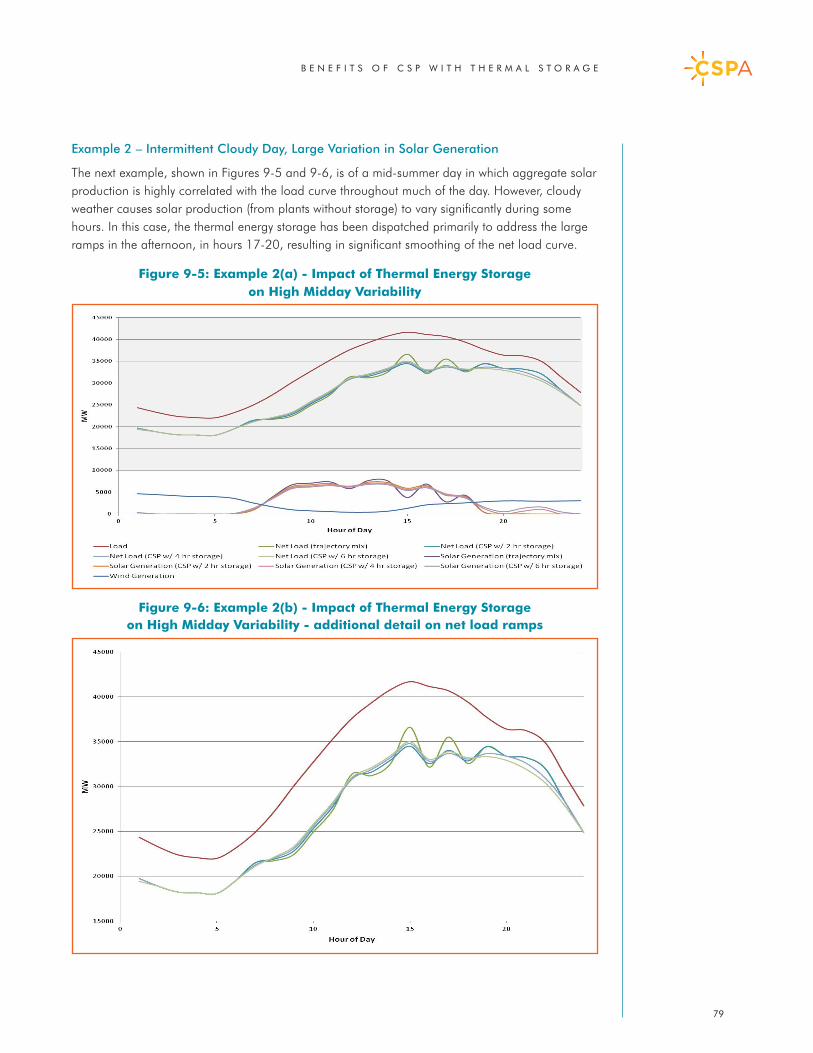
B E N E F I T S O F C S P W I T H T H E R M A L S T O R A G E
79
Example2–IntermittentCloudyDay,LargeVariationinSolarGeneration
The next example, shown in Figures 9-5 and 9-6, is of a mid-summer day in which aggregate solar production is highly correlated with the load curve throughout much of the day. However, cloudy weather causes solar production (from plants without storage) to vary significantly during some hours. In this case, the thermal energy storage has been dispatched primarily to address the large ramps in the afternoon, in hours 17-20, resulting in significant smoothing of the net load curve.
Figure 9-5: Example 2(a) - Impact of Thermal Energy Storage on High Midday Variability
Figure 9-6: Example 2(b) - Impact of Thermal Energy Storage
on High Midday Variability - additional detail on net load ramps
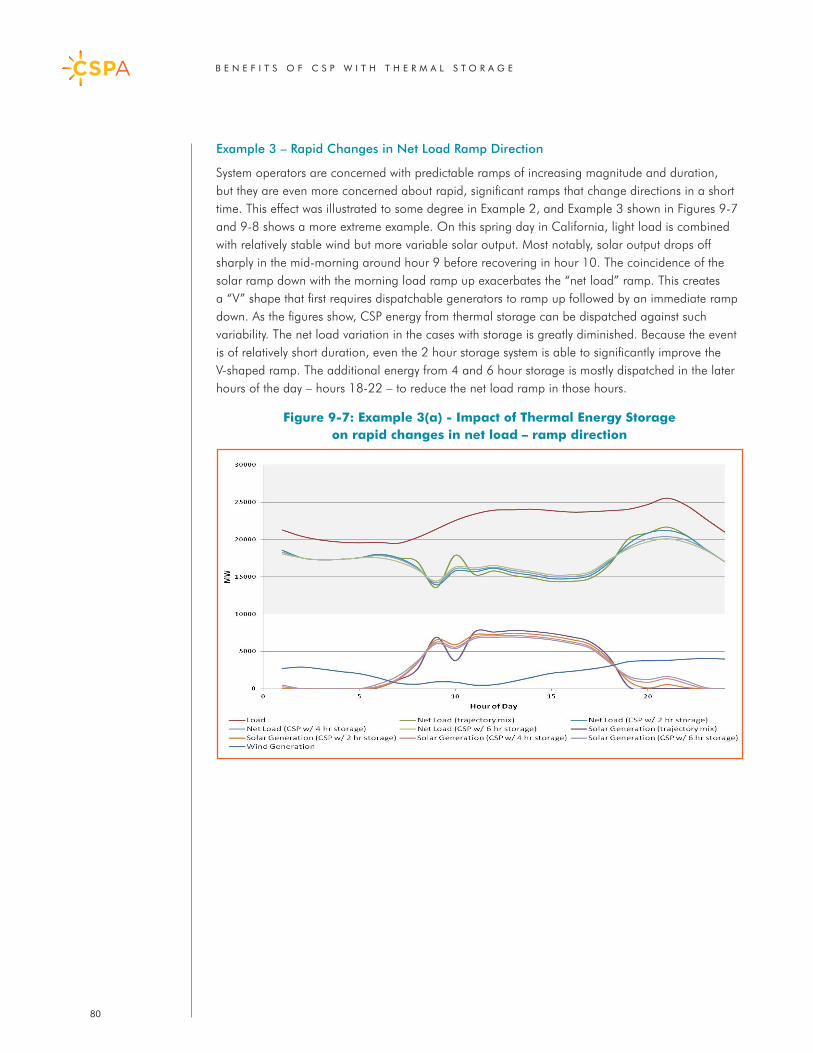
B E N E F I T S O F C S P W I T H T H E R M A L S T O R A G E
80
Example3–RapidChangesinNetLoadRampDirection
System operators are concerned with predictable ramps of increasing magnitude and duration, but they are even more concerned about rapid, significant ramps that change directions in a short time. This effect was illustrated to some degree in Example 2, and Example 3 shown in Figures 9-7 and 9-8 shows a more extreme example. On this spring day in California, light load is combined with relatively stable wind but more variable solar output. Most notably, solar output drops off sharply in the mid-morning around hour 9 before recovering in hour 10. The coincidence of the solar ramp down with the morning load ramp up exacerbates the “net load” ramp. This creates a “V” shape that first requires dispatchable generators to ramp up followed by an immediate ramp down. As the figures show, CSP energy from thermal storage can be dispatched against such variability. The net load variation in the cases with storage is greatly diminished. Because the event is of relatively short duration, even the 2 hour storage system is able to significantly improve the V-shaped ramp. The additional energy from 4 and 6 hour storage is mostly dispatched in the later hours of the day – hours 18-22 – to reduce the net load ramp in those hours.
Figure 9-7: Example 3(a) - Impact of Thermal Energy Storage on rapid changes in net load – ramp direction
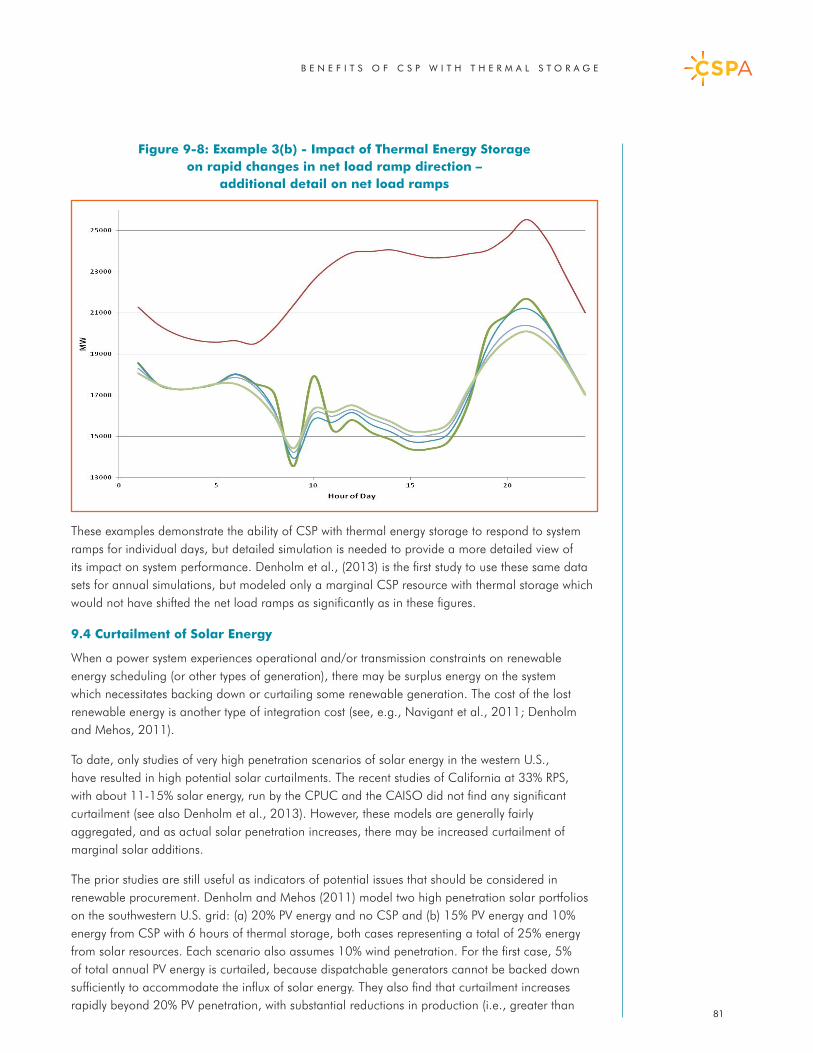
B E N E F I T S O F C S P W I T H T H E R M A L S T O R A G E
81
Figure 9-8: Example 3(b) - Impact of Thermal Energy Storage on rapid changes in net load ramp direction –
additional detail on net load ramps
These examples demonstrate the ability of CSP with thermal energy storage to respond to system ramps for individual days, but detailed simulation is needed to provide a more detailed view of its impact on system performance. Denholm et al., (2013) is the first study to use these same data sets for annual simulations, but modeled only a marginal CSP resource with thermal storage which would not have shifted the net load ramps as significantly as in these figures.
9.4 Curtailment of Solar Energy
When a power system experiences operational and/or transmission constraints on renewable energy scheduling (or other types of generation), there may be surplus energy on the system which necessitates backing down or curtailing some renewable generation. The cost of the lost renewable energy is another type of integration cost (see, e.g., Navigant et al., 2011; Denholm and Mehos, 2011).
To date, only studies of very high penetration scenarios of solar energy in the western U.S., have resulted in high potential solar curtailments. The recent studies of California at 33% RPS, with about 11-15% solar energy, run by the CPUC and the CAISO did not find any significant curtailment (see also Denholm et al., 2013). However, these models are generally fairly aggregated, and as actual solar penetration increases, there may be increased curtailment of marginal solar additions.
The prior studies are still useful as indicators of potential issues that should be considered in renewable procurement. Denholm and Mehos (2011) model two high penetration solar portfolios on the southwestern U.S. grid: (a) 20% PV energy and no CSP and (b) 15% PV energy and 10% energy from CSP with 6 hours of thermal storage, both cases representing a total of 25% energy from solar resources. Each scenario also assumes 10% wind penetration. For the first case, 5% of total annual PV energy is curtailed, because dispatchable generators cannot be backed down sufficiently to accommodate the influx of solar energy. They also find that curtailment increases rapidly beyond 20% PV penetration, with substantial reductions in production (i.e., greater than
B E N E F I T S O F C S P W I T H T H E R M A L S T O R A G E
82
50% of energy from incremental PV resources) reached by about 25% penetration. In the second case, solar energy comprises 5% more of total annual energy needs but experiences only 2% curtailment of annual solar production due to the energy shifting of CSP with thermal storage.
Mills and Wiser (2012b) corroborate these general findings in a model of the California power system in 2030. They calculate not only the amount of renewable energy curtailment but also the amount of production at very low energy prices; in other words, production during hours when economic value is very low, which may indicate that curtailment is more likely. They find that CSP with 6 hours of thermal storage is required to curtail only at very high renewable penetration -- 30% of annual energy -- and even then at less than 1% of its available energy. Moreover, only 2% of production is sold in hours with low energy prices. In contrast, CSP without storage and PV experience increasing curtailment with greater penetration – approximately 7% curtailment at 30% penetration – as well as selling 48% of their energy at low energy prices. The Mills and Wiser result is thus more optimistic than the earlier Denholm and Mehos study about solar integration; however, both of these studies use simplified models of the power grid and thus need to be followed by more detailed network modeling.
To date, there remains uncertainty about when PV curtailment rates will rise sufficiently in California to significantly increase the comparative value of CSP with thermal storage. Jorgenson et al., (2014) model both 33% and 40% RPS scenarios with solar penetrations of about 12% and 16%, respectively, on the California and western US grid in 2022. They find negligible PV curtailment in the 40% case if exports from California are allowed, but rising to about 0.1% of total solar energy under the assumption that no solar energy can be exported from California, a strict bounding assumption. In this case, the operational value of a marginal CSP plant with storage increases by only about $1/MWh over a marginal PV plant. However, based on the growing frequency of negative prices in the CAISO markets, actual power system operations may provide a real test of the need for curtailment earlier than is suggested in these studies.
9.5 Summary and Additional Research Needs
CSP with thermal energy storage can provide renewable energy with greatly reduced variability and forecast errors, when compared to solar PV and wind generation. The operational flexibility of CSP with storage also supports increased aggregate production by other variable energy resources. While the simulations conducted by NREL and LBNL have greatly advanced the analytical framework, to fully characterize the potential of CSP with thermal storage, additional regional power system simulations are needed to evaluate the integration requirements of high penetration scenarios with and without CSP with thermal energy storage. Further work is also needed to validate the sub-hourly operational capabilities of CSP with thermal energy storage, particularly to provide Regulation and intra-hourly load-following.
There is still substantial uncertainty about integration costs for high renewable energy scenarios on the power system. If such costs are not considered, then CSP with thermal energy storage could be disadvantaged when compared to other renewable resources. Hence, until there is greater clarity on these costs, utilities and regulators considering CSP with thermal energy storage will have to apply judgment about the possible range of avoided integration costs based on available simulations of the power system.
B E N E F I T S O F C S P W I T H T H E R M A L S T O R A G E
83
10. The Total Economic Benefits of CSP with Thermal StorageAs the transition to cleaner power systems accelerates, and especially as system operations and reliability become more salient factors in renewable procurement decisions, net system costs will become a key metric for comparison of alternative renewable technologies. The prior sections of the report reviewed the valuation of the individual economic benefit and integration cost components of the net system cost equation. This section examines the summation of these values to allow for more accurate estimates of comparative net system costs for different solar technologies, across future scenarios.
To date, the research literature on western U.S. power systems under renewable penetrations of 33% to 40% of annual energy suggests that incremental CSP with thermal storage plants provide total economic benefits in the range of $30-60/MWh greater than incremental variable solar resources, whether CSP without storage or PV. There may also be changes on the cost side of the equation that favor CSP with storage, in the event of increased curtailment of energy from variable solar resources. The initial analyses of renewable penetration scenarios greater than 33% of annual energy in California and elsewhere suggest that this difference in net system costs could become higher, due in part to such curtailment (in the absence of mitigating measures).
This section is organized as follows:
• Section 10.1 briefly reviews the methodology for calculating total economic benefits.• Section 10.2 surveys study results.• Section 10.3 summarizes and identifies research needs.
10.1 Advances in integrated system modeling for comprehensive analysis of CSP
economic benefits
As discussed in Section 4, in the past, different simulation models have been required to quantify different components of plant operations and economic benefits. More recently, there has been further development of integrated modeling approaches which can capture additional hourly and sub-hourly operational benefits as well as capacity value in a single modeling framework. Such integrated analyses have been demonstrated by Denholm and associated researchers at NREL (e.g., Denholm and Hummon, 2012; Denholm et al., 2013; Jorgenson et al., 2013) and Mills and Wiser (2012b). These studies have greatly improved the understanding of potential economic benefits from alternative solar resources within a consistent set of assumptions. They also provide a foundation for building further models to examine plant capabilities on subhourly time-frames.
California has been a particular focus of these recent studies, in part because of its aggressive renewable policies and also because of the expectation until recently of significant near-term CSP development. The models used by Denholm et al., (2013) and Jorgenson et al., (2014) are based on an evolving methodological framework being used for long-term procurement planning in California, which can capture not only hourly energy and spinning reserve benefits, but also simultaneously, the reservation of capacity to provide regulation and ramping reserves (load-following) on a sub-hourly basis. This model can also be further used to conduct sensitivities on resource portfolios and CSP technology configurations. Jorgenson et al., (2013) also demonstrate some of these applications in a Colorado test system.
Incremental CSP with thermal storage plants provide total economic benefits in the range of $30-60/MWh greater than incremental variable solar resources, whether CSP without storage or PV.
B E N E F I T S O F C S P W I T H T H E R M A L S T O R A G E
84
Mills and Wiser (2012b) have also developed an integrated valuation model, which incorporates additional operational factors not considered by Denholm et al., such as day-ahead forecast errors. The model also builds capacity based on long-term equilibrium assumptions. However, their model has less network and operational detail compared to those used by Denholm et al. In addition, unlike Denholm’s work, the resource portfolios used by Mills and Wiser are not directly related to the actual California utility portfolios.
Other studies reviewed here have addressed some but not all categories of benefits. Madaeni et al., (2012b) added together energy, spinning reserves and capacity value using an hourly model, but their exogenous fixed price model does not extend to evaluating alternative renewable portfolios and the impact on system operations and production costs. On the other hand, in market regions, results based on modeling using historical market prices incorporate the effect of additional power system constraints and bidding behaviors which influence market prices, which the system models may not capture.
Hence, the calculation of net system costs (costs minus benefits) by a utility could require consideration of results from different models or settings, with due attention to how those results are derived.
10.2 Total economic and reliability benefits in recent studies
As shown in Figure 10-1, a key finding in the studies surveyed is that economic benefits of variable energy resources decline as a function of increasing penetration, although not necessarily linearly. As solar penetration increases and displaces fossil-fuel generation, the energy benefit of incremental solar resources during the sunlight hours declines, while the capability of CSP with thermal storage to shift energy allows it obtain $13-25/MWh in higher energy benefits (Jorgenson et al., 2013, 2014; Denholm et al., 2013; Denholm and Hummon, 2012; Mills and Wiser, 2012b). For similar reasons, studies predict a significant decline in capacity value of incremental PV and CSP without storage as penetration increases. While U.S. studies appear to agree that PV capacity value declines sharply in the range of 5-10% penetration by energy, there are differences in the rate of change among studies of particular regions that need to be resolved. CSP with thermal energy storage has a higher retained capacity value in the high penetration scenarios, in the range of $10-20/MWh, and possibly higher (Jorgenson et al., 2013; Denholm et al., 2013; Denholm and Hummon, 2012; Mills and Wiser, 2012b). At least one study has found an increase in CSP with thermal storage capacity value as PV penetration increases, due to counter-intuitive changes in the shape of the peak net load hours (Jorgenson et al., 2014).
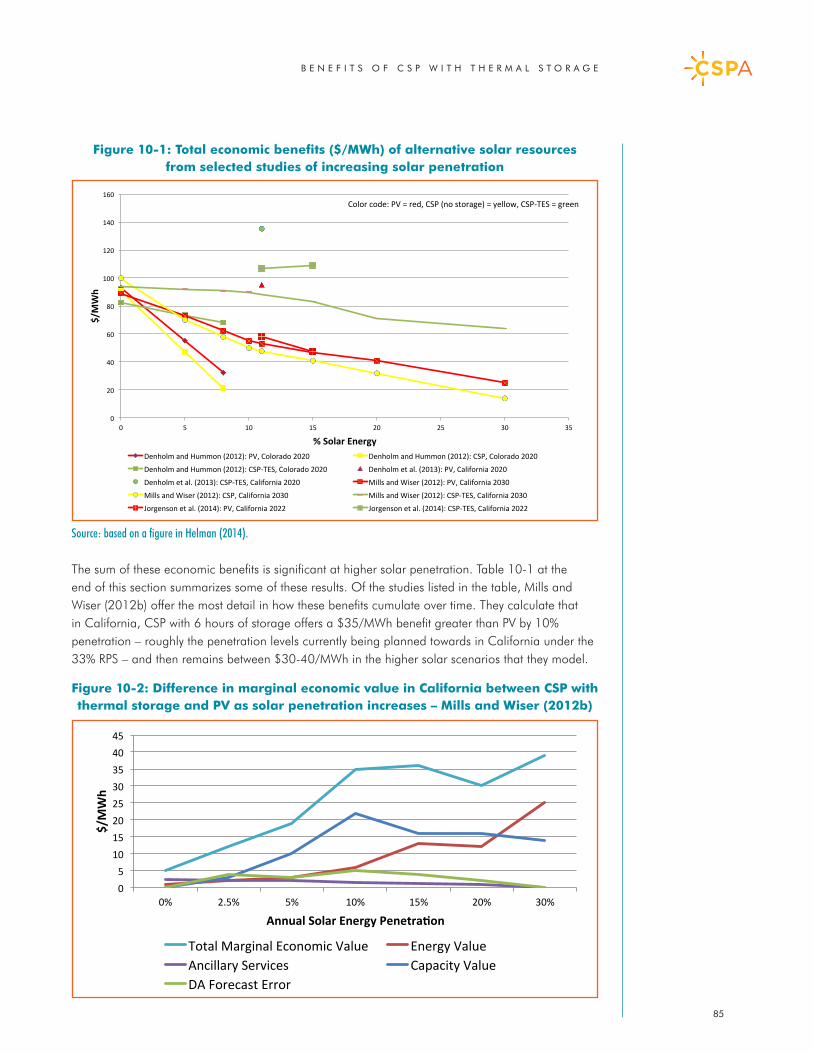
B E N E F I T S O F C S P W I T H T H E R M A L S T O R A G E
85
Figure 10-1: Total economic benefits ($/MWh) of alternative solar resources from selected studies of increasing solar penetration
The sum of these economic benefits is significant at higher solar penetration. Table 10-1 at the end of this section summarizes some of these results. Of the studies listed in the table, Mills and Wiser (2012b) offer the most detail in how these benefits cumulate over time. They calculate that in California, CSP with 6 hours of storage offers a $35/MWh benefit greater than PV by 10% penetration – roughly the penetration levels currently being planned towards in California under the 33% RPS – and then remains between $30-40/MWh in the higher solar scenarios that they model.
Figure 10-2: Difference in marginal economic value in California between CSP with thermal storage and PV as solar penetration increases – Mills and Wiser (2012b)
0 5
10 15 20 25 30 35 40 45
0% 2.5% 5% 10% 15% 20% 30%
$/MWh
Annual Solar Energy Penetra5on
Total Marginal Economic Value Energy Value Ancillary Services Capacity Value DA Forecast Error
0
20
40
60
80
100
120
140
160
0 5 10 15 20 25 30 35
$/MWh
% Solar Energy Denholm and Hummon (2012): PV, Colorado 2020 Denholm and Hummon (2012): CSP, Colorado 2020
Denholm and Hummon (2012): CSP-‐TES, Colorado 2020 Denholm et al. (2013): PV, California 2020
Denholm et al. (2013): CSP-‐TES, California 2020 Mills and Wiser (2012): PV, California 2030
Mills and Wiser (2012): CSP, California 2030 Mills and Wiser (2012): CSP-‐TES, California 2030
Jorgenson et al. (2014): PV, California 2022 Jorgenson et al. (2014): CSP-‐TES, California 2022
Color code: PV = red, CSP (no storage) = yellow, CSP-‐TES = green
Source: based on a figure in Helman (2014).
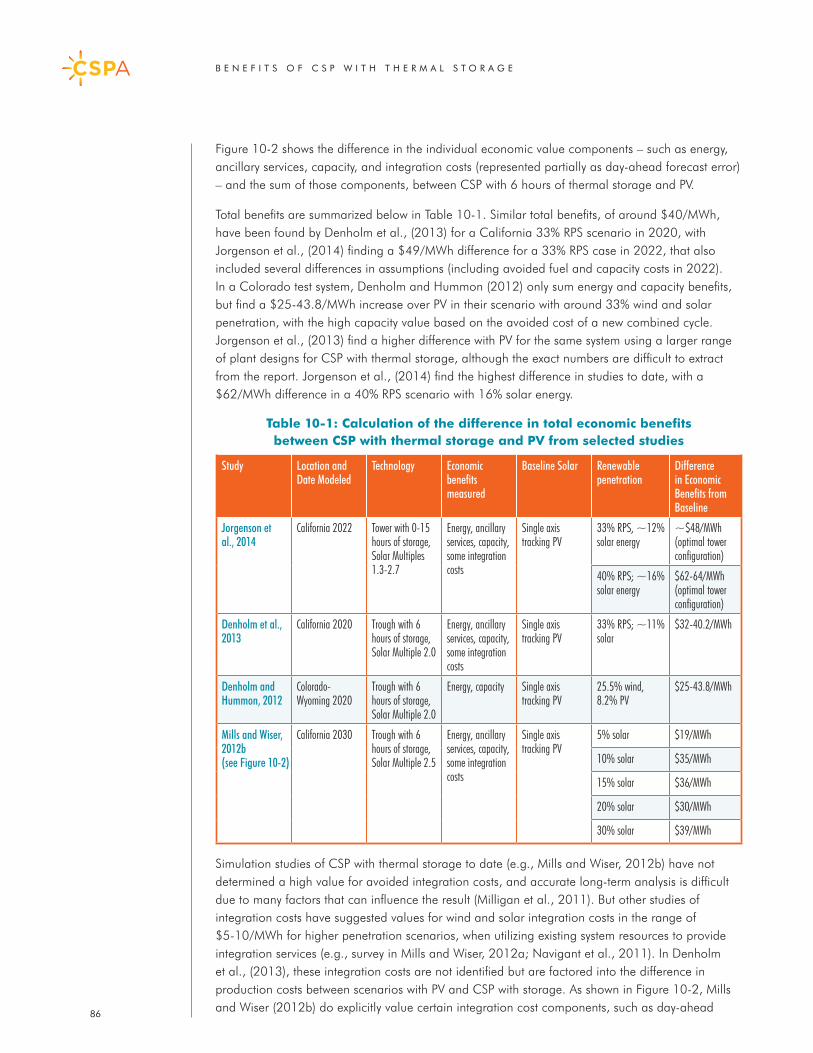
B E N E F I T S O F C S P W I T H T H E R M A L S T O R A G E
86
Figure 10-2 shows the difference in the individual economic value components – such as energy, ancillary services, capacity, and integration costs (represented partially as day-ahead forecast error) – and the sum of those components, between CSP with 6 hours of thermal storage and PV.
Total benefits are summarized below in Table 10-1. Similar total benefits, of around $40/MWh, have been found by Denholm et al., (2013) for a California 33% RPS scenario in 2020, with Jorgenson et al., (2014) finding a $49/MWh difference for a 33% RPS case in 2022, that also included several differences in assumptions (including avoided fuel and capacity costs in 2022). In a Colorado test system, Denholm and Hummon (2012) only sum energy and capacity benefits, but find a $25-43.8/MWh increase over PV in their scenario with around 33% wind and solar penetration, with the high capacity value based on the avoided cost of a new combined cycle. Jorgenson et al., (2013) find a higher difference with PV for the same system using a larger range of plant designs for CSP with thermal storage, although the exact numbers are difficult to extract from the report. Jorgenson et al., (2014) find the highest difference in studies to date, with a $62/MWh difference in a 40% RPS scenario with 16% solar energy.
Table 10-1: Calculation of the difference in total economic benefits between CSP with thermal storage and PV from selected studies
Simulation studies of CSP with thermal storage to date (e.g., Mills and Wiser, 2012b) have not determined a high value for avoided integration costs, and accurate long-term analysis is difficult due to many factors that can influence the result (Milligan et al., 2011). But other studies of integration costs have suggested values for wind and solar integration costs in the range of $5-10/MWh for higher penetration scenarios, when utilizing existing system resources to provide integration services (e.g., survey in Mills and Wiser, 2012a; Navigant et al., 2011). In Denholm et al., (2013), these integration costs are not identified but are factored into the difference in production costs between scenarios with PV and CSP with storage. As shown in Figure 10-2, Mills and Wiser (2012b) do explicitly value certain integration cost components, such as day-ahead
Study Location and Date Modeled
Technology Economic benefits measured
Baseline Solar Renewable penetration
Difference in Economic Benefits from Baseline
Jorgenson et al., 2014
California 2022 Tower with 0-15 hours of storage, Solar Multiples 1.3-2.7
Energy, ancillary services, capacity, some integration costs
Single axis tracking PV
33% RPS, ~12% solar energy
~$48/MWh (optimal tower configuration)
40% RPS; ~16% solar energy
$62-64/MWh (optimal tower configuration)
Denholm et al., 2013
California 2020 Trough with 6 hours of storage, Solar Multiple 2.0
Energy, ancillary services, capacity, some integration costs
Single axis tracking PV
33% RPS; ~11% solar
$32-40.2/MWh
Denholm and Hummon, 2012
Colorado- Wyoming 2020
Trough with 6 hours of storage, Solar Multiple 2.0
Energy, capacity Single axis tracking PV
25.5% wind, 8.2% PV
$25-43.8/MWh
Mills and Wiser, 2012b(see Figure 10-2)
California 2030 Trough with 6 hours of storage, Solar Multiple 2.5
Energy, ancillary services, capacity, some integration costs
Single axis tracking PV
5% solar $19/MWh
10% solar $35/MWh
15% solar $36/MWh
20% solar $30/MWh
30% solar $39/MWh
B E N E F I T S O F C S P W I T H T H E R M A L S T O R A G E
87
forecast errors, but their results appear lower than comparable studies. Curtailment of PV energy due to constraints in power system operations could also increase at higher solar penetrations, and there is the potential for CSP with thermal energy storage to reduce overall solar energy curtailment (Denholm and Mehos, 2011). Studies suggest that these avoided integration and curtailment costs should be considered when comparing CSP with thermal energy storage to other renewable technologies.
10.3 Summary and Additional Research Needs
The studies surveyed in this report suggest similar ranges of total economic benefits for CSP with thermal storage as well as similar differences with the total benefits of comparable PV projects. In the earlier studies of CSP with thermal storage, total benefits were summed using plant-level dispatch models. In the most recent studies, network models at different levels of aggregation, and incorporating different assumptions about scheduling, have allowed a more detailed look at comparative benefits of alternative solar technologies under different scenarios.
Analysis of sub-hourly operational benefits will require combinations of production simulation and other models. A forthcoming study sponsored by the California Energy Commission will utilize the model framework in Denholm et al., (2013), but link it to a detailed sub-hourly model of system frequency control that can explicitly model the CSP plants with storage operating to provide frequency response, frequency regulation and economic dispatch. When new types of system requirements are identified, such as frequency response requirements, additional re-formulation of power system simulation models used for valuation will be needed, to add new constraints.
There also needs to be further development of portfolio planning models, such as NREL (2012), to examine in more detail how CSP with thermal storage fits into the next generation of renewable and integration solutions. The portfolios developed by those models then need to be evaluated using production cost models to allow for greater insight into the economic benefits of different technologies.
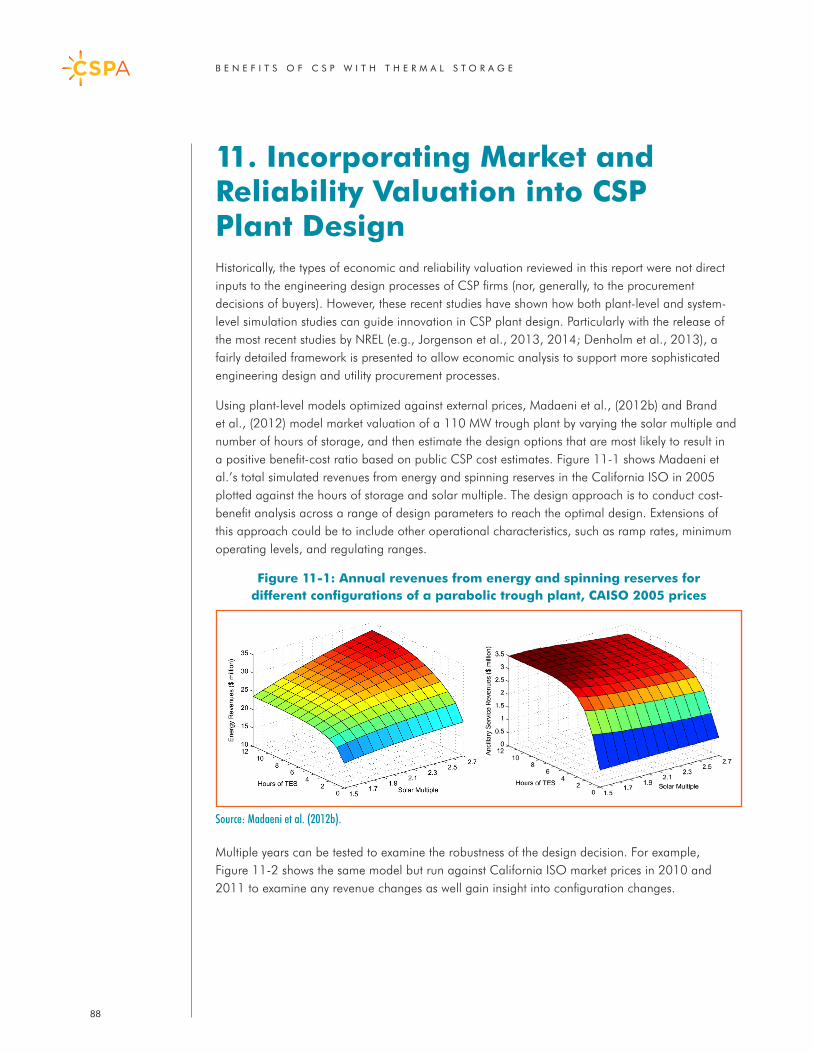
B E N E F I T S O F C S P W I T H T H E R M A L S T O R A G E
88
11. Incorporating Market and Reliability Valuation into CSP Plant DesignHistorically, the types of economic and reliability valuation reviewed in this report were not direct inputs to the engineering design processes of CSP firms (nor, generally, to the procurement decisions of buyers). However, these recent studies have shown how both plant-level and system-level simulation studies can guide innovation in CSP plant design. Particularly with the release of the most recent studies by NREL (e.g., Jorgenson et al., 2013, 2014; Denholm et al., 2013), a fairly detailed framework is presented to allow economic analysis to support more sophisticated engineering design and utility procurement processes.
Using plant-level models optimized against external prices, Madaeni et al., (2012b) and Brand et al., (2012) model market valuation of a 110 MW trough plant by varying the solar multiple and number of hours of storage, and then estimate the design options that are most likely to result in a positive benefit-cost ratio based on public CSP cost estimates. Figure 11-1 shows Madaeni et al.’s total simulated revenues from energy and spinning reserves in the California ISO in 2005 plotted against the hours of storage and solar multiple. The design approach is to conduct cost-benefit analysis across a range of design parameters to reach the optimal design. Extensions of this approach could be to include other operational characteristics, such as ramp rates, minimum operating levels, and regulating ranges.
Figure 11-1: Annual revenues from energy and spinning reserves for different configurations of a parabolic trough plant, CAISO 2005 prices
Multiple years can be tested to examine the robustness of the design decision. For example, Figure 11-2 shows the same model but run against California ISO market prices in 2010 and 2011 to examine any revenue changes as well gain insight into configuration changes.
Source: Madaeni et al. (2012b).
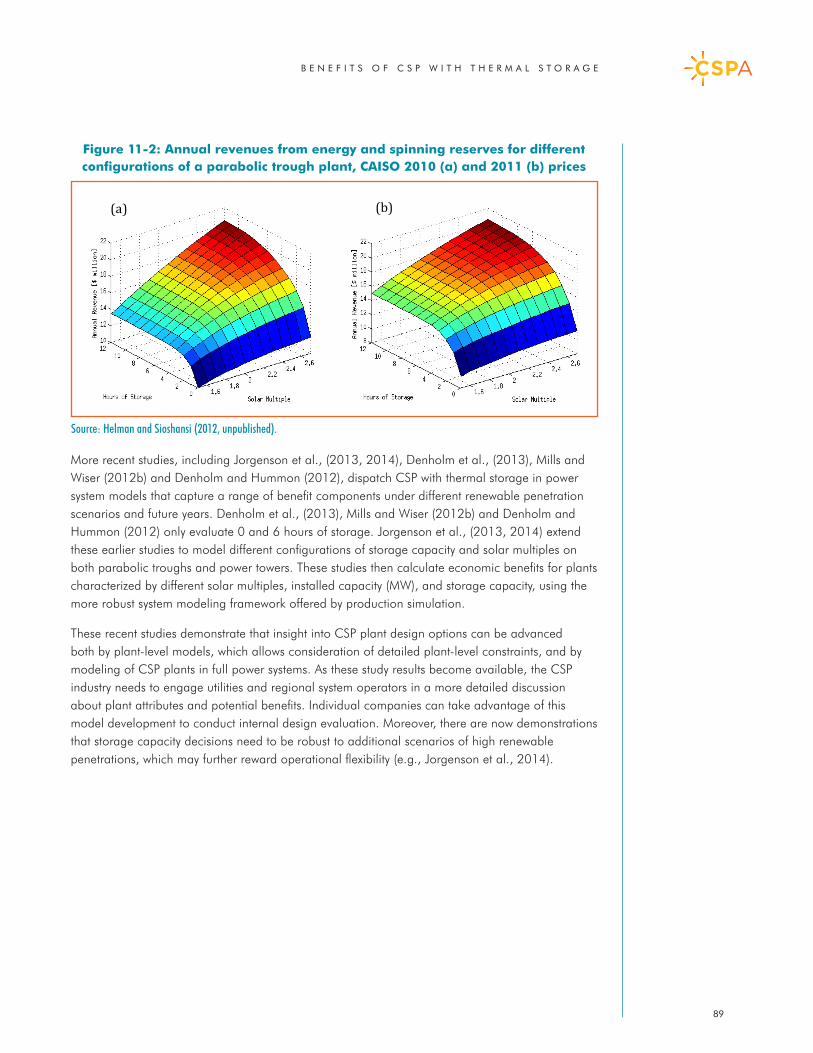
B E N E F I T S O F C S P W I T H T H E R M A L S T O R A G E
89
Figure 11-2: Annual revenues from energy and spinning reserves for different configurations of a parabolic trough plant, CAISO 2010 (a) and 2011 (b) prices
More recent studies, including Jorgenson et al., (2013, 2014), Denholm et al., (2013), Mills and Wiser (2012b) and Denholm and Hummon (2012), dispatch CSP with thermal storage in power system models that capture a range of benefit components under different renewable penetration scenarios and future years. Denholm et al., (2013), Mills and Wiser (2012b) and Denholm and Hummon (2012) only evaluate 0 and 6 hours of storage. Jorgenson et al., (2013, 2014) extend these earlier studies to model different configurations of storage capacity and solar multiples on both parabolic troughs and power towers. These studies then calculate economic benefits for plants characterized by different solar multiples, installed capacity (MW), and storage capacity, using the more robust system modeling framework offered by production simulation.
These recent studies demonstrate that insight into CSP plant design options can be advanced both by plant-level models, which allows consideration of detailed plant-level constraints, and by modeling of CSP plants in full power systems. As these study results become available, the CSP industry needs to engage utilities and regional system operators in a more detailed discussion about plant attributes and potential benefits. Individual companies can take advantage of this model development to conduct internal design evaluation. Moreover, there are now demonstrations that storage capacity decisions need to be robust to additional scenarios of high renewable penetrations, which may further reward operational flexibility (e.g., Jorgenson et al., 2014).
(a) (b)
Source: Helman and Sioshansi (2012, unpublished).
B E N E F I T S O F C S P W I T H T H E R M A L S T O R A G E
90
12. Conclusions and Next StepsCSP with thermal energy storage combines the operational flexibility of a conventional thermal power plant with a completely renewable fuel source and long duration storage, resulting in improved availability and reliability. There are over 20 utility-scale parabolic trough and power tower plants with storage currently in commercial operation globally, with several more under construction or in advanced planning stages. As wind and solar PV costs have decreased, the future applications of this solar technology are increasingly focused on its operational characteristics. CSP plants are expected to obtain higher value when compared to other renewable resources as power systems transition to higher penetration of renewable generation. CSP with thermal storage is particularly well suited to help manage key operational challenges on the planning horizon, including mitigating the diurnal net load system ramps created by variable solar generation, surplus generation conditions during the sunlight hours, increased requirements for ancillary services, such as frequency regulation, and new requirements for frequency response and inertial response services.
Consideration of net system costs in utility procurement
The early phases of renewable procurement around the world focused primarily on rapid deployment of available technologies at the lowest levelized cost of energy (LCOE), and less so on planning towards long-term, reliable clean power systems. The study findings reviewed here demonstrate that a more comprehensive approach to cost-benefit analysis is needed for accurate comparison among renewable technologies and integration solutions (e.g., Jorgenson et al., 2013, 2014; Mills and Wiser, 2012b; Denholm et al., 2013; Joskow 2010). Without such analysis, CSP with thermal energy storage will be significantly under-valued in renewable procurement.
Recently, utilities and regulators in California and other parts of the western U.S. have begun to conduct more detailed, scenario-based planning studies, some of which have directly included CSP with thermal storage or have been used by other parties to conduct such analysis (e.g., Jorgenson et al., 2014; Denholm et al., 2013). These studies have improved perception of the technology’s applications and economic benefits. CSP with thermal storage may also be assisted by other policy requirements, such as the storage mandate in California, which has included it as an eligible technology.
The studies surveyed in this report suggest similar ranges of total absolute economic benefits for CSP with thermal storage as well as similar differences with the total benefits of comparable PV projects under the same scenarios. There are differences in some results that require further investigation, but the comparison of total benefits remain similar, in the range of $30-60/MWh, for solar penetrations of 10%-16% and greater. A number of factors could shift this range up. Most notably, if the potential for curtailment of incremental variable solar resources increases in higher penetrations, such as the 40-50% RPS now being modeled in California, then the lost solar energy will increase the net cost difference with CSP with thermal storage, which should be sufficiently dispatchable to minimize its own curtailments. CSP with storage will also gain advantages with the establishment of flexible capacity requirements and ramping reserves. Finally, any new ancillary services could further improve the valuation of CSP with thermal storage, compared to inverter-based renewable plants that could have to curtail some energy to provide these services.
The study findings reviewed here demonstrate that a more comprehensive approach to cost-benefit analysis is needed for accurate comparison among renewable technologies and integration solutions.
B E N E F I T S O F C S P W I T H T H E R M A L S T O R A G E
91
Summary of Specific Recommendations
In addition to the general recommendations above, this survey suggests a number of researchable topics:
• Replication of study results at higher renewable penetration levels, such as the 40%-50% RPS currently under evaluation in California. Jorgenson et al. (2014) addresses one scenario for the 40% case (with some results shown in this report), and there are several other such studies underway, although not necessarily focused on CSP with thermal energy storage.
• Improved understanding of the ancillary service capabilities and operational characteristics of actual CSP plants with thermal storage. Additional industry input is needed to refine the studies to date.
• Modeling of sub-hourly dispatch of energy from CSP with thermal energy storage on a 5-minute and 15-minute basis. Plant level models are needed first to ensure sufficient operational detail to validate plant operations. Power system models, such as production simulation models, can then be run with validated operational parameters to measure the potential economic benefits.
• Modeling of regulation dispatch from CSP with thermal storage using dynamic subhourly models; to date, the research has focused on maintaining regulating reserve capacity, but has not examined the actual dispatch of regulation (up and down) in response to 4-second signals.
• Addition of a frequency responsive reserve to the co-optimized ancillary services in subsequent research. Although quantities of such a reserve have not been finalized, at least some indicative reserve level based on published estimates should be added to reflect the potential contribution of CSP with thermal storage.
• Analysis of the inertial response contribution of CSP with thermal storage in high renewable penetration power systems, in which much conventional spinning generation is off-line.
Next Steps
This survey has benefited from review by CSP experts. Collectively, these experts have recommended that the U.S. research program on CSP continue the large-scale simulation initiatives by the California Energy Commission (CEC), the National Renewable Energy Lab (NREL), the Lawrence Berkeley National Labs (LBNL), the California ISO (CAISO) and other entities. Such work will further quantify the benefits identified in this report and the studies to date. The national labs and other research entities are also conducting valuation studies of other types of bulk storage and other integration solutions, using similar modeling approaches, which will be useful for comparison.
Most recently, NREL has conducted studies of California at high RPS using a model of the regional western U.S. that incorporates detailed operating constraints for several parabolic trough and power tower configurations (Jorgenson et al., 2014, and Denholm et al., 2013). The next phase of this work considers the interaction of CSP with thermal storage with additional resource portfolios, including other types of storage.
Another study sponsored by the California Energy Commission promises to expand simulation of CSP with thermal energy storage operating on sub-hourly time-frames to provide Regulation and 5-minute economic dispatch.
B E N E F I T S O F C S P W I T H T H E R M A L S T O R A G E
92
The CSP industry needs to carefully examine and contribute to refining the results of NREL’s 2012 study of high penetration renewable electricity futures (NREL, 2012; Denholm et al., 2012), which utilizes a capacity expansion model that constructs CSP with thermal energy storage in response to both lower cost forecasts but also operational and other constraints that are emphasized in certain sensitivities.
While there are recent studies of the economic benefits of CSP with thermal energy storage in other countries (e.g., Brand et al., 2012; Rutovitz, J., et al. 2013), additional research is needed, perhaps sponsored by national agencies and international cooperative research networks, such as SolarPACES.53 In addition, the World Bank has recently concluded that the “value-based” criteria for CSP evaluation is obtaining only limited consideration in procurement processes in developing countries (Kulichenko and Wirth, 2011). Clearly, industry support is needed to improve such analyses. This is important because several countries, including South Africa, several Middle Eastern and North African countries, and Chile are proceeding with further deployment of CSP, including plants with thermal storage. Moreover, China has set new targets for CSP development.
53 For further details on SolarPACES, see http://www.solarpaces.org/.
B E N E F I T S O F C S P W I T H T H E R M A L S T O R A G E
93
References(a) References in the Text
Bolinger, M., and S. Weaver. 2013. “Utility-Scale Solar 2012: An Empirical Analysis of Project Cost, Performance, and Pricing Trends in the United States,” Lawrence Berkeley National Laboratory, LBNL06408E, September, http://emp.lbl.gov/sites/all/files/lbnl-6408e_0.pdf.
Brand, B., A.B. Stambouli, and D. Zejli, “The value of dispatchability of CSP plants in the electricity systems of Morocco and Algeria,” Energy Policy, 47, 2012, 321-331.
Burkhardt, J.H., G.A Heath, and C.S. Turchi, “Life cycle Assessment of a Parabolic Trough Concentrating Solar Power Plant and the Impacts of Key Design Alternatives,” Environmental Science and Technology, Vol 45, pp. 2457-64. Feb 23, 2011. See http://pubs.acs.org/doi/abs/10.1021/es1033266.
California ISO (CAISO), Comprehensive Forward Capacity Procurement Framework, California Independent System Operator, February 26, 2013a. See http://www.caiso.com/Documents/CaliforniaISO-BriefingPaper-LongTermResourceAdequacySummit.pdf.
California ISO (CAISO), “Annual Report on Market Issues & Performance, 2012”, Department of Market Monitoring, April 2013b. See www.caiso.com.
California ISO (CAISO), “Renewables Integration Studies Update”, February 10, 2012b, See http://www.caiso.com/Documents/RenewablesIntegration_StudiesUpdate_Feb10_2012.pdf.
California ISO (CAISO), “Track I Direct Testimony of Mark Rothleder on Behalf of the California Independent System Operator Corporation,” Before the Public Utilities Commission of the State of California, Order Instituting Rulemaking to Integrate and Refine Procurement Policies and Consider Long-Term Procurement Plans, Rulemaking 10-05-006, Submitted July 11, 2011.
California ISO (CAISO), “Integration of Renewable Resources: Operational Requirements and Generation Fleet Capability at 20% RPS,” August 31, 2010. See http://www.caiso.com/2804/2804d036401f0.pdf.
California ISO (CAISO) and DNV-KEMA, “Final Report for Assessment of Visibility and Control Options for Distributed Energy Resources,” June 21, 2012. See http://www.caiso.com/Documents/FinalReport-Assessment-Visibility-ControlOptions-DistributedEnergyResources.pdf.
Denholm, P., Wan, Y-H., Hummon, M., and M. Mehos, “An Analysis of Concentrating Solar Power with Thermal Energy Storage in a California 33% Renewable Scenario,” National Renewable Energy Laboratory, Technical Report, NREL/TP-6A20-58186, March 2013.
Denholm, P., M. Hand, T. Mai, R. Margolis, G. Brinkman, E. Drury, M. Mowers, and C. Turchi, The Potential Role of Concentrating Solar Power in Enabling High Renewables Scenarios in the United States, Technical Report, NREL/TP-6A20-56294, October 2012.
Denholm, P. and M. Hummon, “Simulating the Value of Concentrating Solar Power with Thermal Energy Storage in a Commercial Production Cost Model,” National Renewable Energy Laboratory, Technical Report, NREL/TP-6A20-56731, November 2012.
B E N E F I T S O F C S P W I T H T H E R M A L S T O R A G E
94
Denholm, P. and M. Mehos, “Enabling Greater Penetration of Solar Power via the Use of CSP with Thermal Energy Storage,” National Renewable Energy Laboratory, Technical Report, NREL/TP-6A20-52978, November 2011. See http://www.nrel.gov/csp/pdfs/52978.pdf.
Denholm, P., R. Margolis, and J. Milford, “Production Cost Modeling for High Levels of Photovoltaics Penetration,” National Renewable Energy Laboratory, 2008. See http://www1.eere.energy.gov/solar/pdfs/42305.pdf.
Denholm, P., and R. M. Margolis, “Evaluating the Limits of Solar Photovoltaics (PV) in Electric Power Systems Utilizing Energy Storage and Other Enabling Technologies.” Energy Policy 35 (9) (September), 2007, pp. 4424–4433.
Department of Energy (DOE), “2011 Wind Technologies Market Report, Energy Efficiency and Renewable Energy,” DOE/GO-102012-3472 August 2012. See http://www1.eere.energy.gov/wind/pdfs/2011_wind_technologies_market_report.pdf.
Dinter, F., “Operability, Reliability and Economic Benefits of CSP with Thermal Energy Storage: First Year of Operation of ANDASOL 3,” Presentation at SolarPACES 2013, September 18, 2013, Las Vegas, NV.
Ela, E., M. Milligan, and B. Kirby, “Operating Reserves and Variable Generation,” National Renewable Energy Laboratory, Technical Report, NREL/TP-5500-51978, August 2011.
Federal Energy Regulatory Commission (FERC), Frequency Response and Frequency Bias Setting Reliability Standard, Order No. 794, 146 FERC 61,024, January 16, 2014. See http://www.ferc.gov/whats-new/comm-meet/2014/011614/E-2.pdf.
Federal Energy Regulatory Commission (FERC), Principles for Efficient and Reliable Reactive Power Supply and Consumption, Feb 4, 2005. Docket AD05-1-000. See http://www.ferc.gov/eventcalendar/files/20050310144430-02-04-05-reactive-power.pdf.
Fthenakis, V.M., H.C. Kim, E. Alsema, “Emissions from Photovoltaic Life Cycles,” Environmental Science and Technology, Vol 42, pp. 2168-74, Feb 6, 2008. <http://pubs.acs.org/doi/abs/10.1021/es071763q>
GE Energy and Exeter Associates (2012), “Task Report: Review Of Industry Practice And Experience In The Integration Of Wind And Solar Generation, PJM Renewable Integration Study.” Prepared for: PJM Interconnection, LLC. Prepared by: Exeter Associates, Inc. and GE Energy, November, 2012.
GE Energy Consulting, California ISO (CAISO) “Frequency Response Study, Final Draft.” Prepared by Nicholas W. Miller, Miaolei Shao, and Sundar Venkataraman, November 09, 2011. See http://www.caiso.com/Documents/Report-FrequencyResponseStudy.pdf.
GE Energy/ National Renewable Energy Laboratory (NREL), May 2010, Western Wind and Solar Study, NREL, Golden, Colorado. See http://www.nrel.gov/docs/fy10osti/47434.pdf.
Giostri, A., et al. “Comparison of different solar plants based on parabolic trough technology.” Solar Energy 86.5 (2012): 1208-1221.
Helman, U., “Economic and Reliability Benefits of Large-Scale Solar Plants,”in L. Jones (ed.), Renewable Energy Integration: Practical Management of Variability, Uncertainty and Flexibility in Power Grids, Elsevier, 2014.
B E N E F I T S O F C S P W I T H T H E R M A L S T O R A G E
95
Ho, C. K., S. S. Khalsa, and N. P. Siegel. “Modeling on-sun tests of a prototype solid particle receiver for concentrating solar power processes and storage.” ASME 2009 3rd International Conference on Energy Sustainability collocated with the Heat Transfer and InterPACK09 Conferences. American Society of Mechanical Engineers, 2009.
Ibanez, E., G. Brinkman, G., M. Hummon, and D. Lew. A Solar Reserve Methodology for Renewable Energy Integration Studies Based on Sub-Hourly Variability Analysis. Conference Paper, NREL/CP-5500-56169, August 2012.
International Energy Agency (IEA), “Technology Roadmap: Concentrating Solar Power,” OECD/IEA, 2010. See http://www.iea.org/publications/freepublications/publication/csp_roadmap.pdf.
International Renewable Energy Agency (IRENA), “Concentrating Solar Power, Renewable energy technologies: cost analysis series,” Volume 1: Power Sector, Issue 2/5, IRENA Working Paper, June 2012.
Jorgenson, J., P. Denholm, and M. Mehos, “Estimating the Value of Utility-Scale Solar Technologies in California Under a 40% Renewable Portfolio Standard,” National Renewable Energy Laboratory, Technical Report, TP-6A20-61685, May 2014.
Jorgenson, J., P. Denholm, M. Mehos, and C. Turchi, “Estimating the Performance and Economic Value of Multiple Concentrating Solar Power Technologies in a Production Cost Model, Technical Report, NREL/TP-6A20-58645, December 2013.
Joskow, P., “Comparing the Costs of Intermittent and Dispatchable Electricity Generating Technologies,” Center for Energy and Environmental Policy Research, September 2010.
Katzenstein, W and Apt, J., “Air Emissions Due to Wind and Solar Power,” Environmental Science and Technology, Vol 43, No 2, pp 253-8, 2009. See http://pubs.acs.org/doi/abs/10.1021/es801437t.
KEMA, Inc. 2010. Research Evaluation of Wind and Solar Generation, Storage Impact, and Demand Response on the California Grid. Prepared for the California Energy Commission. CEC-500-2010-010
Kulichenko, N., and J. Wirth, Regulatory and Financial Incentives for Scaling Up Concentrating Solar Power in Developing Countries, Energy And Mining Sector Board Discussion Paper, Paper No.24, June 2011. http://www-wds.worldbank.org/external/default/WDSContentServer/WDSP/IB/2011/08/09/000386194_20110809005344/Rendered/PDF/636700WP0P118700Box0361520B0PUBLIC0.pdf.
Lawrence Berkeley National Laboratory (LBNL), “Use of Frequency Response Metrics to Assess the Planning and Operating Requirements for Reliable Integration of Variable Renewable Generation,” December 2010. See http://www.ferc.gov/industries/electric/indus-act/reliability/frequencyresponsemetrics-report.pdf.
Lannoye, E., M. Milligan, J. Adams, A. Tuohy, H. Chandler, D. Flynn, and M. O’Malley, “Integration of Variable Generation: Capacity Value and Evaluation of Flexibility”, IEEE Power Engineering Society (PES) Summer Meeting, 2012.
Madaeni, S.H., R. Sioshansi, and P. Denholm, “Estimating the Capacity Value of Concentrating Solar Power Plants: A Case Study of the Southwestern United States,” IEEE Transactions on Power Systems, Vol 27, No 2, pp 1116-1124, May, 2012a.
B E N E F I T S O F C S P W I T H T H E R M A L S T O R A G E
96
Madaeni, S.H., R. Sioshansi, and P. Denholm, “How Thermal Energy Storage Enhances the Economic Viability of Concentrating Solar Power,” Proceedings of the IEEE, Vol 100, No 2, pp 335-347, February, 2012b.
Madaeni, S.H., R. Sioshansi, and P. Denholm, “The Capacity Value of Concentrating Solar Power Plants,” NREL Technical Report, NREL/TP-6A20-51253, June 2011. See http://www.nrel.gov/docs/fy11osti/51253.pdf.
Milligan, M., E. Ela, B-M. Hodge, B. Kirby, D. Lew, C. Clark, J. DeCesaro, and K. Lynn, “Cost-Causation and Integration Cost Analysis for Variable Generation,” Technical Report, NREL/TP-5500-51860, June 2011.
Milligan, M., et al., “Large-Scale Wind Integration Studies in the United States: Preliminary Results,” Conference Paper, NREL/CP-550-46527, September 2009.
Mills, A., and R. Wiser, “An Evaluation of Solar Valuation Methods Used in Utility Planning and Procurement Processes,” Environmental Energy Technologies Division, Lawrence Berkeley National Laboratory, LBNL-5933E, December 2012a.
Mills, A., and R. Wiser, “Changes in the Economic Value of Variable Generation at High Penetration Levels: Pilot Case Study of California”, Environmental Energy Technologies Division, Lawrence Berkeley National Laboratory, LBNL-5445E, June 2012b. See http://eetd.lbl.gov/ea/emp/reports/lbnl-5445e.pdf.
Montes, M. J., A. Abánades, and J. M. Martinez-Val. “Thermofluidynamic model and comparative analysis of parabolic trough collectors using oil, water/steam, or molten salt as heat transfer fluids.” Journal of Solar Energy Engineering, 132.2, 2010: 021001.
Navigant, Sandia National Laboratories, and Pacific Northwest National Laboratory, “Large-Scale PV Integration Study prepared for NV Energy,” July 30, 2011. See http://www.navigant.com/~/media/Site/Insights/NVE_PV_Integration_Report_Energy.ashx.
North American Electricity Reliability Corporation (NERC), “Special Report: Accommodating High Levels of Variable Generation,” 2009. See http://www.nerc.com/files/ivgtf_report_041609.pdf.
NERC, Methods to Model and Calculate Capacity Contributions of Variable Generation for Resource Adequacy Planning (Princeton, NJ: NERC, March 2011), http://www.nerc.com/pa/RAPA/ra/Reliability Assessments DL/IVGTF1-2.pdf.
National Renewable Energy Laboratory (NREL), National Renewable Energy Laboratory. (2012). Renewable Electricity Futures Study. Hand, M.M.; Baldwin, S.; DeMeo, E.; Reilly, J.M.; Mai, T.; Arent, D.; Porro, G.; Meshek, M.; Sandor, D. eds. 4 vols. NREL/TP-6A20-52409. Golden, CO: National Renewable Energy Laboratory. http://www.nrel.gov/analysis/re_futures/.
Perez, R., M. Taylor, T. Hoff, and J.P. Ross. “Reaching Consensus in the Definition of Photovoltaics Capacity Credit in the USA: A Practical Application of Satellite-Derived Solar Resource Data.” IEEE Journal of Selected Topics in Applied Earth Observations and Remote Sensing, 1 (1): 28–33, 2008.
Pfeifenberger, J.P., K. Spees, K. Carden, and N. Wintermantel, “Resource Adequacy Requirements: Reliability and Economic Implications,” September 2013, available at https://www.ferc.gov/legal/staff-reports/2014/02-07-14-consultant-report.pdf.
B E N E F I T S O F C S P W I T H T H E R M A L S T O R A G E
97
Rutovitz, J., J. Peterseim, B. Elliston, S. Harris, S. Mohr, K. Lovegrove, A. Want, E. Langham, and I. MacGill, “Breaking the solar gridlock: Potential benefits of installing concentrating solar thermal power at constrained locations in the NEM,” Prepared for the Australian Solar Thermal Energy Association (AUSTELA) by the Institute for Sustainable Futures, UTS, 2013, http://breakingthesolargridlock.net/documents/Breakingthesolargridlock_finalv2.pdf
Sioshansi, R., P. Denholm, and T. Jenkin, “Market and Policy Barriers to Deployment of Energy Storage,” Economics of Energy & Environmental Policy, 1 (2) (April), 2012, doi:10.5547/2160-5890.1.2.4
Sioshansi, R., and P. Denholm, “The Value of Concentrating Solar Power and Thermal Energy Storage.” IEEE Transactions on Sustainable Energy. 1 (3) 173-183, 2010.
Sioshansi, R. “Emissions Impacts of Wind and Energy Storage in a Market Environment,” Environmental Science and Technology, Vol 45, No 24, pp 10728-10735, December 2011.
Stoffel, T., D. Renné, D. Myers, S. Wilcox, M. Sengupta, R. George, and C. Turchi. Concentrating Solar Power: Best Practices Handbook for the Collection and Use of Solar Resource Data, Technical Report, NREL/TP-550-47465, September 2010
Turchi, C., M. Mehos, C. K. Ho, and G. J. Kolb, “Current and future costs for parabolic trough and power tower systems in the US market,” National Renewable Energy Laboratory, Technical Report, NREL/ CP-5500-49303, October 2010.
Usaola, J., “Participation of CSP plants in the reserve markets: A new challenge for regulators,” Energy Policy, 2012, http://dx.doi.org/10.1016/j.enpol.2012.06.060.
Western Electricity Coordinating Council (WECC), 10-Year Regional Transmission Plan, 2020 Study Report, TEPPC 2010 Study Program, September 2011, http://www.wecc.biz/library/StudyReport/Documents/2020%20Study%20Report.pdf
B E N E F I T S O F C S P W I T H T H E R M A L S T O R A G E
98
(b) References for Tables 5-1 to 5-4
In addition to summary reports provided by several of the report contributors listed in the Acknowledgments, several English language references were referred to for background information and additional data. The references listed below are generally public and do not include project documents from governmental and international agencies. Some general sources are presented first, followed by country references in alphabetical order. The list is not intended to be comprehensive.
General and Regional Sources
EU National Renewable Energy Action Plans and Progress Reports, http://ec.europa.eu/energy/renewables/action_plan_en.htm
IRENA, Renewable Energy Country Profiles: European Union, http://www.irena.org/DocumentDownloads/Publications/_EU27Complete.pdf
IRENA, MENA Renewables Status Report, 2013, http://www.ren21.net/Portals/0/documents/activities/Regional%20Reports/MENA_2013_lowres.pdf
REN21, Renewables 2013: Global Status Report, http://www.ren21.net/Portals/0/documents/Resources/GSR/2013/GSR2013_lowres.pdf
Manfred Hafner, Simone Tagliapietra and El Habib El Andaloussi, Outlook for Electricity and Renewable Energy in Southern and Eastern Mediterranean Countries, MEDPRO Technical Report No. 16/October 2012
NREL/SolarPACES Concentrating Solar Power Projects, available at http://www.nrel.gov/csp/solarpaces/.
U.S. Energy Information Agency (EIA), International Energy Outlook 2013 http://www.eia.gov/forecasts/ieo/electricity.cfm
U.S. Energy Information Agency (EIA), Country Data including Analysis Briefs http://www.eia.gov/countries/
Algeria
U.S. Energy Information Administration, Algeria analysis brief, revision May 20, 2013 http://www.eia.gov/countries/analysisbriefs/Algeria/algeria.pdf
Algerian Ministry of Energy and Mines, Renewable Energy and Energy Efficiency Development Plan, 2011, Available at http://www.mem-algeria.org/francais/uploads/enr/Programme_ENR_et_efficacite_energetique_en.pdf
Australia
Australian Energy Market Operator, http://www.aemo.com.au/
Australian Energy Regulator, State of the Energy Market 2013, http://www.aer.gov.au/sites/default/files/Complete%20report%20A4.pdf
B E N E F I T S O F C S P W I T H T H E R M A L S T O R A G E
99
Botswana
African Development Bank. Botswana, Country Strategy Paper (2009-2013) http://www.afdb.org/fileadmin/uploads/afdb/Documents/Project-and-Operations/BOTSWANA_2009%20%E2%80%93%202013%20COUNTRY%20STRATEGY%20PAPER.pdf
Renewable Energy and Energy Efficiency Partnership – REEGLE - Botswana http://www.reegle.info/countries/botswana-energy-profile/BW
Botswana Power Corporation – Power Sector Presentation, February 2013, http://www.usea.org/sites/default/files/event-/Botswana%20Power%20Sector.pdf
Brazil
U.S. Energy Information Administration, Brazil analysis brief, revision October 1, 2013, http://www.eia.gov/countries/analysisbriefs/brazil/brazil.pdf
Chile
Government of Chile, National Energy Strategy 2012-2030, http://www.centralenergia.cl/uploads/2012/06/National-Energy-Strategy-Chile.pdf
Central Energia - http://www.centralenergia.cl/en/
IEA Emergency Response of IEA countries – Chile, 2012, http://www.iea.org/publications/freepublications/publication/Chile_2012.pdf
China
U.S. Energy Information Administration, China analysis brief, revision February 4, 2014, http://www.eia.gov/countries/analysisbriefs/China/china.pdf
China’s Twelfth Five Year Plan (2011- 2015) - the Full English Version http://www.britishchamber.cn/content/chinas-twelfth-five-year-plan-2011-2015-full-english-version
Gulf Cooperation Council (except Saudi Arabia)
Solar GCC Alliance: http://www.solargcc.com/
Arab Monetary Fund, The Joint Arab Economic Report 2011 (Overview & Statistical Annexes), 2011
Manfred Hafner and Rabia Ferroukhi, Electricity Interconnection and Market Integration in the GCC: Challenges and Opportunities, EU-GCC Clean Energy Network GCC Clean Energy Network Discussion Groups’ Meeting, 24-25 November, 2011, Athens, Greece, http://www.eugcc-cleanergy.net/LinkClick. spx?fileticket=yBdoSX2V93k%3D&tabid=262&mid=938
U.S. Energy Information Administration, Kuwait analysis brief, revision July 8, 2013, http://www.eia.gov/countries/analysisbriefs/Kuwait/kuwait.pdf
U.S. Energy Information Administration, Oman analysis brief, revision October 10, 2013, http://www.eia.gov/countries/analysisbriefs/Oman/oman.pdf
U.S. Energy Information Administration, Saudi Arabia analysis brief, revision February 26, 2013, http://www.eia.gov/countries/analysisbriefs/Saudi_Arabia/saudi_arabia.pdf
B E N E F I T S O F C S P W I T H T H E R M A L S T O R A G E
100
U.S. Energy Information Administration, UAE analysis brief, revision December 5, 2013, http://www.eia.gov/countries/analysisbriefs/UAE/uae.pdf
Greece
IEA, Energy Policies of IEA Countries, Greece, 2011 Review, http://www.iea.org/publications/freepublications/publication/Greece2011_unsecured.pdf
India
U.S. Energy Information Administration, India analysis brief, revision March 18, 2013 http://www.eia.gov/countries/analysisbriefs/India/india.pdf
Government of India, Ministry of New and Renewable Energy, Strategic Plan for New and Renewable Energy Sector for the Period 2011-17, February 2011, http://mnre.gov.in/file-manager/UserFiles/strategic_plan_mnre_2011_17.pdf
Italy
IEA, Energy Policies of IEA Countries, Italy, 2009 Review, http://www.iea.org/publications/freepublications/publication/italy2009.pdf
Associazione Nazionale Energia Solare Termodinamica (ANEST), CSP in Italy: 2013-2020 the age of accomplishments: An overview on CSP in Italy by the Italian Association ANEST.
Kenya
Renewable Energy and Energy Efficiency Partnership – REEGLE – Kenya http://www.reegle.info/countries/kenya-energy-profile/KE
Mexico
U.S. Energy Information Administration, Mexico analysis brief, revision October 17, 2012, http://www.eia.gov/countries/analysisbriefs/Mexico/Mexico.pdf
Morocco
Library Briefing: Solar energy development in Morocco, Library of the European Parliament 08/05/2013, http://www.europarl.europa.eu/RegData/bibliotheque/briefing/2013/130515/LDM_BRI(2013)130515_REV1_EN.pdf
Moroccan Ministry of Energy, Mining, Water and Environment: www.mem.gov.ma
Office National de l’Electricité: www.one.org.ma
Moroccan Agency for Solar Energy (MASEN): http://www.masen.org.ma/
Namibia
Assessing regulatory performance: The case of the Namibian electricity supply industry http://www.erc.uct.ac.za/jesa/volume21/21-4jesa-kapika-eberhard.pdf.
Namibia: seeking independent power producers http://www.gsb.uct.ac.za/files/Namibia.pdf
African Development Bank: Namibia, Country Strategy Paper (2009-2013) http://www.afdb.org/fileadmin/uploads/afdb/Documents/Project-and-Operations/Namibia-CSP-OPs%20COM%206.pdf
B E N E F I T S O F C S P W I T H T H E R M A L S T O R A G E
101
Namibia’s Energy Future; A Case for Renewables http://www.kas.de/wf/doc/kas_34264-1522-1-30.pdf?130503111302
Renewable Energy and Energy Efficiency Partnership – REEGLE – Namibia http://www.reegle.info/countries/namibia-energy-profile/NA#renewable_energy
Namibia’s first CSP plant gets closer, http://www.csp-world.com/news/20130220/00759/namibias-first-csp-plant-gets-closer
Nigeria
Renewable Energy and Energy Efficiency Partnership – REEGLE – Nigeria http://www.reegle.info/countries/nigeria-energy-profile/NG#sources
Nigerian Electricity Regulation Commission http://www.nercng.org/index.php/industry-operators/licensing-procedures/licencees?limitstart=0
Matching Electricity Supply with Demand in Nigeria http://www.iaee.org/en/publications/newsletterdl.aspx?id=56
CSP Technology and Its Potential Contribution to Electricity Supply in Northern Nigeria http://www.ijrer.org/index.php/ijrer/article/download/688/pdf
Nigeria: FG Promises Support for 450 Megawatt Aura Power Plant http://allafrica.com/stories/201403061089.html
South Africa
Integrated Resource Plan 2013 draft http://www.doe-irp.co.za/content/IRP2010_updatea.pdf
Multi Year Price Determination 3 – 2012 http://www.eskom.co.za/CustomerCare/MYPD3/Pages/Multi_Year_Price_Determination_3_MYPD3.aspx
Electric Power Research Institute Final Technical Update Power Generation Technology Data for Integrated Resource Plan of South Africa 2012, http://www.doe-irp.co.za/content/EpriEskom_2012July24_Rev5.pdf
Eskom - http://www.eskom.co.za/Pages/Landing.aspx
Spain
Red Eléctrica De España, The Spanish Electricity System, Preliminary Report, 2013, http://www.ree.es/sites/default/files/downloadable/preliminary_report_2013.pdf
Spain’s National Renewable Energy Action Plan, 2011-2020, June 30, 2010, available at http://ec.europa.eu/energy/renewables/action_plan_en.htm
IEA, Energy Policies of IEA Countries, Spain, 2009 Review, http://www.iea.org/publications/freepublications/publication/spain2009.pdf
Turkey
U.S. Energy Information Administration, Turkey analysis brief, 2013, http://www.eia.gov/countries/analysisbriefs/Turkey/turkey.pdf
B E N E F I T S O F C S P W I T H T H E R M A L S T O R A G E
102
United States
DSIRE - Data-base on State Incentives for Renewables and Efficiency - http://www.dsireusa.org/incentives/index.cfm?EE=1&RE=1&SPV=0&ST=0&searchtype=RPS&sh=1
Arizona RPS - http://www.azcc.gov/divisions/utilities/electric/environmental.asp
Arizona - emPOWER Arizona: Executive Energy Assessment and Pathways, 2013 - http://www.azenergy.gov/doclib/EmPowerAZ.pdf
California CPUC-jurisdictional RPS - http://www.cpuc.ca.gov/PUC/energy/Renewables/index.htm
New Mexico Energy, Minerals & Natural Resources Department, Annual Reports, http://www.emnrd.state.nm.us/ADMIN/publications.html
State of Oregon, Oregon Department of Energy, 2013-2015 Biennial Energy Plan http://www.oregon.gov/energy/docs/reports/legislature/2013/ODOE%202013%202015%20EnergyPlan.pdf
B E N E F I T S O F C S P W I T H T H E R M A L S T O R A G E
103
Appendix A: Methodologies for Calculating Capacity Value of CSP with Thermal Energy StorageThis appendix provides a brief review of the methodologies for calculating the capacity credits and capacity value of solar technologies, with a focus on CSP with thermal energy storage. There are several surveys available on this topic and this appendix benefits in particular from the reviews in Sioshani and Denholm (2010), NERC (2011), Madaeni et al., (2012a,b) and Mills and Wiser (2012a,b). The appendix also expands on the surveys in those papers to include the method used by Denholm et al., (2013) and also discusses the evolving flexible capacity metrics under discussion in some regions, which would apply to CSP with thermal storage. Table A-1 below surveys actual applications of these methods to capacity ratings of renewable resources by U.S. and Canadian utilities, ISOs and regulatory entities.
Capacity ratings or credits (MW) are a measure of the contribution of individual resources – generation, storage, and demand response – and the full portfolio of available resources to meeting demand during periods in which there is a high probability of loss-of-load. As discussed further below, each individual resource obtains a capacity credit as a percentage of its rated maximum seasonal production, or its actual or forecast production in some period. The conventional loss-of-load criterion is availability of sufficient resources to ensure no more than one loss-of-load event in 10 years, typically evaluated probabilistically. This criterion is interpreted differently in different regions; in the United States, it is generally a conservative requirement which has long been debated in the effort to align the actual, economic benefits of different levels of resource adequacy with consumers demand for reliability (Pfeifenberger et al., 2013). Not all regions use a explicit probabilistic approach to determine resource adequacy requirements. For example, California currently establishes its requirement based on regional reliability standards that result from approximate measures, in this case forecast peak load plus a 15-17% reserve margin.
Once the capacity requirement has been determined, capacity value ($/kW-year or $/MW) is the bilateral or market clearing price of existing or new capacity. In the event that new capacity resources are needed to meet the requirements, capacity value is measured with respect to the avoided cost of either procuring capacity from a market (where any new qualified resource can set the price), or a generic generation technology assumed to be the benchmark “new entrant”, which in the United States is a 50-100 MW combustion turbine.
When there is a shortage of supply to ensure the loss-of-load standard or other defined capacity requirement, the value of capacity will be the net cost of a new entrant. When there is a surplus of supply and new entrants are not required, the capacity value of existing capacity resources should be at least the net going-forward costs of the marginal capacity resource. Capacity prices are also a function of how utilities structure forward contracts. In California, monthly and annual capacity prices are also based on residual capacity offers from resources that obtain long-term bundled contracts and can be substantially lower than the going-forward costs. In most of the studies reviewed in this report, the capacity price used for valuation was the cost of new entry.
The methods for evaluating the long-term reliability of power systems have developed over many decades (e.g., Billinton and Allan, 1994) and there are substantial regional differences in methods (e.g., Pfeifenberger et al., 2013). Hence this appendix will only lightly review basic methodology,
B E N E F I T S O F C S P W I T H T H E R M A L S T O R A G E
104
particularly as applicable to solar technologies. The appendix examines the two primary approaches for measuring capacity credits – statistical methods based on meeting the loss-of-load criterion and approximation methods. In several of the CSP studies reviewed, the approximation method is coupled with a dispatch model, which can replicate dispatch results in a market that is “energy-only” or one in which both energy and capacity are separately procured. The appendix also reviews the related topics of flexible capacity, locational capacity requirements, and the choice of resource to use as the avoided new entry resource.
Basic definitions
A “resource” is any generator, storage technology or demand response provider that is qualified as a capacity resource; this generally entails the resource being available during the period being evaluated and either being able to follow the system operator’s dispatch instructions or otherwise having some known probability of production. A resource is labeled generically as R (whereas most papers refer to generation, G) because in many regions, demand response and storage are also providing capacity, which merits the more generic term.
The loss of load probability (LOLP) is defined as the probability of a loss-of-load event where available resources are insufficient to meet load, designated as L. The loss of load expectation (LOLE) is the expected loss-of-load over all of the periods being evaluated or the sum of the LOLPs over all time intervals being evaluated, i ∈ T.
As noted above, the capacity credit or capacity rating for a resource is expressed typically as a percentage of nameplate capacity (MW). For the case of a conventional fossil-fired or nuclear generator, the hourly capacity rating is the plant’s maximum operating level de-rated by an expected forced outage rate (EFOR). Conventional plants or limited energy plants, such as many hydroelectric plants, obtain a capacity rating derated also by the availability of the generator subject to emission, fuel, or environmental restrictions. A variable energy resource such as wind or solar obtains a rating based on the coincidence of its forecast production with the hours of highest loss-of-load risk. Notably, CSP with thermal storage is operationally a conventional thermal generator with a variable fuel stock, which requires additional methods for calculating availability as a function of direct normal insolation and plant design, particularly storage capacity, as discussed further below.
Some studies (e.g., Madaeni et al, 2012a,b) refer to the capacity rating as the “capacity value.” Generally, capacity value or capacity payment ($/kW-year or $/MW) refers to the market revenue or economic benefits calculated for a plant with a particular capacity credit.
LOLE/ELCC Methods
CSP with thermal storage is a more complicated resource for analysis than either a conventional generator or a CSP plant without thermal storage. For a CSP plant without storage, the hourly capability is based on the design of the plant and the forecast direct normal insolation. However, CSP with thermal storage has a variable fuel stock, similar to some hydro plants, but on daily and hourly time-frames, which has to be dispatched, or otherwise estimated, to determine its operations to meet capacity requirements. The modeling should also assume an EFOR on the powerblock.
Effective load carrying capability (ELCC) methods modify the LOLE calculations to measure the additional load that can be added for each MW of wind and/or solar while maintaining the same reliability standard. The general steps used to calculate the ELCC of a CSP generator without storage are as follows (e.g., Madaeni et al., 2012a):
B E N E F I T S O F C S P W I T H T H E R M A L S T O R A G E
105
First, calculate the LOLE of the system without the CSP plant, such that
LOLE = ∑Ti=1P(Ri<Li).
Second, calculate the LOLE with the CSP plant by adding it to the resource portfolio, such that
LOLECSP = ∑Ti=1P(Ri+Ci<Li).
Third, calculate the LOLE with the CSP plant removed and a conventional generator, G, included, such that
LOLEG = ∑Ti=1P(Ri+Gi<Li).
To fully capture its operational flexibility, modeling CSP with thermal storage requires a method for determining whether the plant has available energy from thermal storage during the hours with high risk of loss-of-load. This requires an optimization model of the plant.
Approximation-Based Methods
Because LOLE/ELCC calculations are analytically intensive and often require substantial stakeholder review of inputs and results, the operators of many power systems utilize simpler, approximation methods for setting capacity credits for renewable resources. In approximation methods, the capacity value of a resource is estimated during a set of hours that correspond to the highest probabilities of loss-of-load. These are typically the seasonally adjusted, highest load hours, or variants that use the highest LOLP hours or LOLP-weighted highest load hours (Madaeni et al., 2012a). Table A-1 lists the actual hours used for these approximations by different system operators in the United States. For illustration, Figure A-1 shows the hours currently used by the California Public Utilities Commission (CPUC) (note that no hours before 12 pm are measured). In California, a higher weight is put on the mid-afternoon hours (hours 14-18) from April to October while in the remaining months, a higher weight is placed on the early evening hours because of the higher loads in those hours. In practice, the annual system peak loads occur in the summer in most years in California and so the summer capacity hours are currently considered more important as measures of total available system resources. The CPUC is also currently developing a probabilistic modeling method to calculate wind and solar ELCC.
The advantages of the approximation-based methods for variable energy resources is that only the production of the individual wind or solar resource during the hours being evaluated needs to be simulated or measured in actual operations. One of the issues with highest-load-hour approximations is that, if the number of hours being measured is too large, averaging can result in capacity ratings that over-estimate actual performance during high-load hours. In certain regions, the solution has been to reduce the number of hours being considered using a statistical approach. For example, in California, the original approximation method, which counted average production in the hours shown in Figure A-1, has been modified to include an “exceedance” method where only the 70th percentile capacity credit is used to determine the capacity rating. Madaeni et al. (2012) evaluated alternative approximations, including a range between the top 10 load hours and the top 10% of load hours and their convergence to the hours identified by ELCC models. They find that the top 10 hours is closest to more robust techniques.
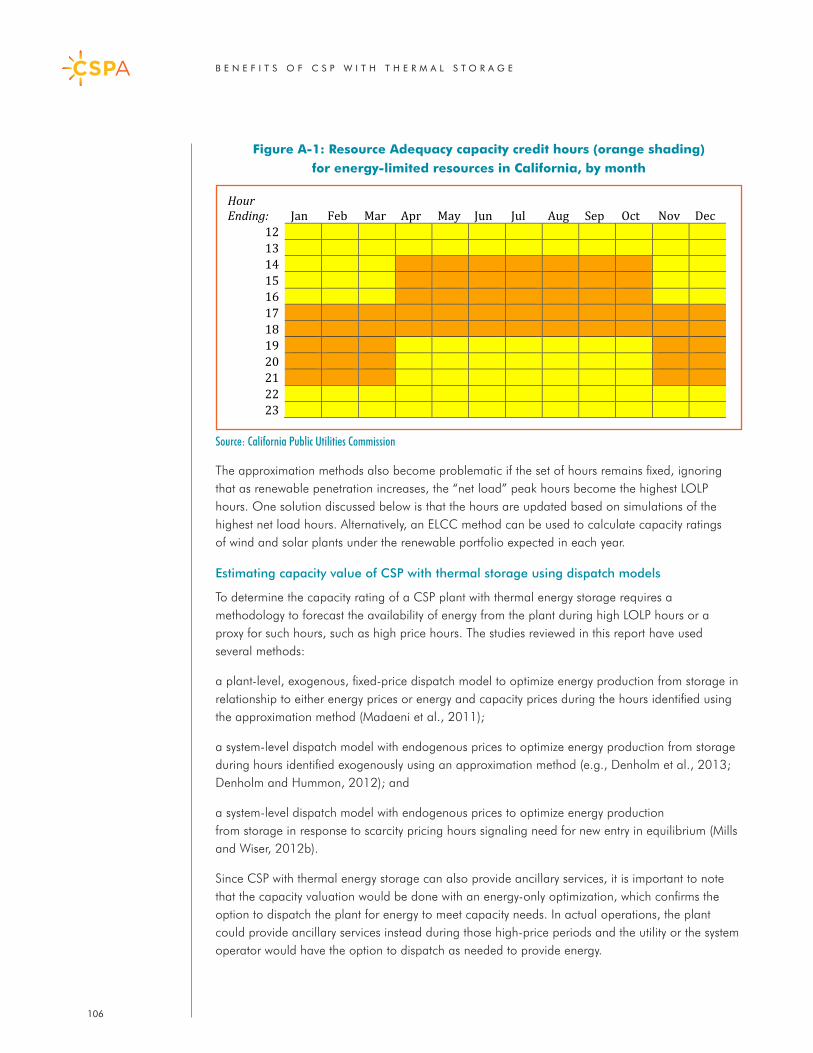
B E N E F I T S O F C S P W I T H T H E R M A L S T O R A G E
106
Figure A-1: Resource Adequacy capacity credit hours (orange shading) for energy-limited resources in California, by month
The approximation methods also become problematic if the set of hours remains fixed, ignoring that as renewable penetration increases, the “net load” peak hours become the highest LOLP hours. One solution discussed below is that the hours are updated based on simulations of the highest net load hours. Alternatively, an ELCC method can be used to calculate capacity ratings of wind and solar plants under the renewable portfolio expected in each year.
Estimating capacity value of CSP with thermal storage using dispatch models
To determine the capacity rating of a CSP plant with thermal energy storage requires a methodology to forecast the availability of energy from the plant during high LOLP hours or a proxy for such hours, such as high price hours. The studies reviewed in this report have used several methods:
a plant-level, exogenous, fixed-price dispatch model to optimize energy production from storage in relationship to either energy prices or energy and capacity prices during the hours identified using the approximation method (Madaeni et al., 2011);
a system-level dispatch model with endogenous prices to optimize energy production from storage during hours identified exogenously using an approximation method (e.g., Denholm et al., 2013; Denholm and Hummon, 2012); and
a system-level dispatch model with endogenous prices to optimize energy production from storage in response to scarcity pricing hours signaling need for new entry in equilibrium (Mills and Wiser, 2012b).
Since CSP with thermal energy storage can also provide ancillary services, it is important to note that the capacity valuation would be done with an energy-only optimization, which confirms the option to dispatch the plant for energy to meet capacity needs. In actual operations, the plant could provide ancillary services instead during those high-price periods and the utility or the system operator would have the option to dispatch as needed to provide energy.
Source: California Public Utilities Commission
Hour Ending: Jan Feb Mar Apr May Jun Jul Aug Sep Oct Nov Dec
12 0 0 0 0 0 0 0 0 0 0 0 0 13 0 0 0 0 0 0 0 0 0 0 0 0 14 0 0 0 1 1 1 1 1 1 1 0 0 15 0 0 0 1 1 1 1 1 1 1 0 0 16 0 0 0 1 1 1 1 1 1 1 0 0 17 1 1 1 1 1 1 1 1 1 1 1 1 18 1 1 1 1 1 1 1 1 1 1 1 1 19 1 1 1 0 0 0 0 0 0 0 1 1 20 1 1 1 0 0 0 0 0 0 0 1 1 21 1 1 1 0 0 0 0 0 0 0 1 1 22 0 0 0 0 0 0 0 0 0 0 0 0 23 0 0 0 0 0 0 0 0 0 0 0 0
B E N E F I T S O F C S P W I T H T H E R M A L S T O R A G E
107
Plant-level dispatch models
Using an approximation methodology, a plant-level dispatch model of CSP with thermal energy storage can be used to determine the plant’s hourly availability to provide energy whether during the hours set for capacity rating by a system operator/utility , operating at the highest load hours in some year, or another metric.
Madaeni et al. (2011) develop a dispatch model for a parabolic trough plant with thermal energy storage and show three applications:
a baseline energy production model with an energy accounting equation that verifies the availability of energy production during capacity hours identified with using an approximation method;
an “energy-only” market model in which the plant is dispatched against exogenous fixed prices for energy; and
an “energy and capacity” market model in which the plant is jointly dispatched against exogenous fixed prices for energy and capacity, as realized by production in hours identified with an approximation method.
The addition of thermal storage to a CSP plant (starting from a model without storage) increases the plant’s capacity value although with declining marginal value as storage capacity increases beyond some point – and which will be unique to each plant design. The results of the Madaeni et al.’s (2011) “energy-only” dispatch, using prices from the California ISO and “system lambdas” from western U.S. utilities, demonstrate that the energy dispatch may not be aligned with the highest capacity value hours. In other words, there may be high capacity value hours when energy prices are lower than subsequent hours with low capacity value. In contrast, the results of the “energy and capacity” market model suggest that, if the CSP plant is provided with a capacity payment based on production during the hours with high capacity value, it would shift energy to those hours (even if energy revenues were lower) and thus earn the higher capacity rating.
One implication of these results is that the capacity rating of a CSP plant with thermal energy storage should not be based on the dispatch history of the plant, which may not accurately reflect its availability to meet the highest capacity value hours.
Another implication is that the market design should allow for better alignment between plant operations and maintenance of resource adequacy. That is, going into the operating day during peak load or “net load” peak hours, the plant should receive incentives to retain sufficient energy in storage for the highest LOLP hours. In many wholesale markets, this has been achieved by introducing scarcity pricing during periods of reserve shortage.
One limitation of plant-level, dispatch models is that they are not able to evaluate the changes in relative capacity values as renewable penetrations increase over time, as can be captured in system models such as Denholm et al., (2013) or Mills and Wiser (2012b). The plant-level models can be used to test changes in relative capacity values through parameter sensitivities. For example, Madaeni et al., (2011) conduct a test of how shifting net load peak hours to one hour later in the day could affect the capacity valuation results in a plant-level dispatch model. However, more accurate analysis requires utilizing system-level models. One approach under discussion is to have system-level models generate market prices and capacity requirements for a range of future scenarios, while using plant-level models for subsequent testing of detailed plant operations against those future prices.
B E N E F I T S O F C S P W I T H T H E R M A L S T O R A G E
108
System-level dispatch models
Detailed system-level dispatch models can be used to estimate capacity value of CSP with thermal energy storage under different renewable scenarios as well as to evaluate the impact of additional operational constraints on the value of capacity resources. For example, Denholm et al., (2013) utilize a production cost model and measure the capacity factors of the CSP with thermal storage plants during the highest price hours in the model, as a proxy for the highest LOLP hours.
Variants on expansion planning models can be used to measure the capacity value of incremental CSP resources. Using a variant of the “energy-only” market framework, Mills and Wiser (2012b) utilize a dispatch model of the California power system with endogenous capacity expansion in response to exogenous market scarcity prices triggered by reserve shortages. The capacity value ($/MWh) of each renewable resource is measured as their short-run profits from energy and ancillary services earned during hours with scarcity prices (defined to be equal or greater than $500/MWh),
The equilibrium relationship between LOLE, scarcity pricing and the cost of new entry is represented in the following equation from Mills and Wiser (2012b: p.111):
LOLE =∑Ti=1P(Ri<Li)= ∑T
i=1 Psl =FCp/ ls = constant,
where the LOLE is assumed to be held constant in equilibrium as a function of the ratio of the fixed costs of a peaker plant FCp to the allowed maximum scarcity price ls. In other words, the scarcity price is used as an exogenous parameter to set the level of reliability.
In most wholesale power markets, bid caps prevent energy and ancillary service prices from reaching sufficient levels to encourage long-term entry equilibrium. More recently, the market entry of wind and solar power supported by production or capacity-based incentives have also started to suppress market prices. Hence, many of these markets are using separate capacity markets to make up the revenues that would otherwise have been available during scarcity. In such a model, caps on ls would be made up by capacity payments tuned to achieve the same LOLE at equilibrium.
Other Determinants of Capacity Value
Locational Value
Capacity requirements are generally divided into two categories differentiated by transmission transfer capability: local and system. A local capacity resource is qualified to serve load in a location that is transmission-import constrained, sometimes called a load pocket or local area. It may also be qualified to serve load outside of the specified location. A system capacity resource is qualified to serve loads outside of local areas and may serve those inside the local area up to the available transmission transfer capability. The power flow studies needed to qualify capacity resources for different locations are conducted by system operators. The final capacity value for a resource may thus be derated by the availability of transmission transfer capability.54
For capacity value studies of regional power systems, further analysis is thus needed about how the solar technology capacity value for incremental projects serving particular utilities and subregions is derived. In some cases, CSP plants with thermal storage may be located in areas where transmission limitations would reduce their capacity value to certain utility buyers in the absence of transmission upgrades.
54 In California, this is known as the “net qualifying capacity.”
B E N E F I T S O F C S P W I T H T H E R M A L S T O R A G E
109
Flexible Capacity
As noted in Section 8 of this report, several regions of the U. S. that have high penetration of renewables are considering modifying their capacity requirements from generic MW to MW plus operational characteristics. New metrics are being developed to measure flexible capacity, such as Effective Ramping Capability (ERC) as the operational analogue to ELCC (e.g., Lannoye et al., 2012). In California, an initial requirement for flexible capacity is the ability to support a continuous 3 hour net load ramp for certain hours of the day, incorporating the diurnal solar ramps.
None of the studies examined here have attempted to measure the flexible capacity ratings of CSP with thermal storage against a range of possible metrics. However, any of the system models that can dispatch the plants against system ramps can be utilized to do so.
Avoided Cost of New Generation
The avoided cost of new generation used in the analysis is a major driver of the resulting long-
term capacity value. There are many generic and regional surveys of the cost of new generation,
some updated on a periodic basis. For generation in particular regions, surveys particular to that
region are preferred to more generic estimates, as local taxes, insurance, and land costs may be
significant components of the final cost.
Conventionally, the marginal “new entrant” in the U.S. power markets is assumed to be a new
peaker, typically a 50 MW-100 MW combustion turbine. However, some studies also conduct
sensitivity studies for combined cycles as the new entrant (e.g., Denholm and Hummon, 2012).
The avoided capacity cost estimates used in the studies surveyed here are shown in Table 8-2.
For studies examining capacity value in wholesale markets into which generation will also sell
energy and ancillary services, the cost of new entry is often adjusted to reflect the net capacity cost
once the plant’s other net market revenues (market payments minus operating costs) have been
determined (see, e.g., CAISO 2013b). This is the residual capacity payment that the plant would
have to recover. In models where equilibrium entry is determined (e.g., Mills and Wiser 2012b),
the net cost of new capacity is determined endogenously in the model.
Conclusions
Over the past few years, several methods for capacity valuation of solar resources, including CSP with thermal energy storage, have been presented in the research literature. These include applications and extensions of conventional LOLE models, such as the ELCC models, and a number of approximation methods. CSP with thermal storage requires either a plant-level or system-level dispatch model to account for the dispatchability of the thermal storage system. The system-level dispatch simulations include the operations of resources required for renewable integration, and thus can also measure the “flexible capacity” capabilities of the CSP plants.
Using any of these capacity valuation methodologies, CSP with thermal energy storage is shown to obtain a high capacity rating and capacity value as a function of the storage capacity. These results are reviewed in Section 8.
Table A-1 summarizes the methods used in different regions of North America for capacity valuation and resource procurement. The table is based on a table in Porter et al., (2012) and updated with data from similar surveys in Mills and Wiser (2012a), and other sources. In some cases the description is a direct quote from one of these sources.
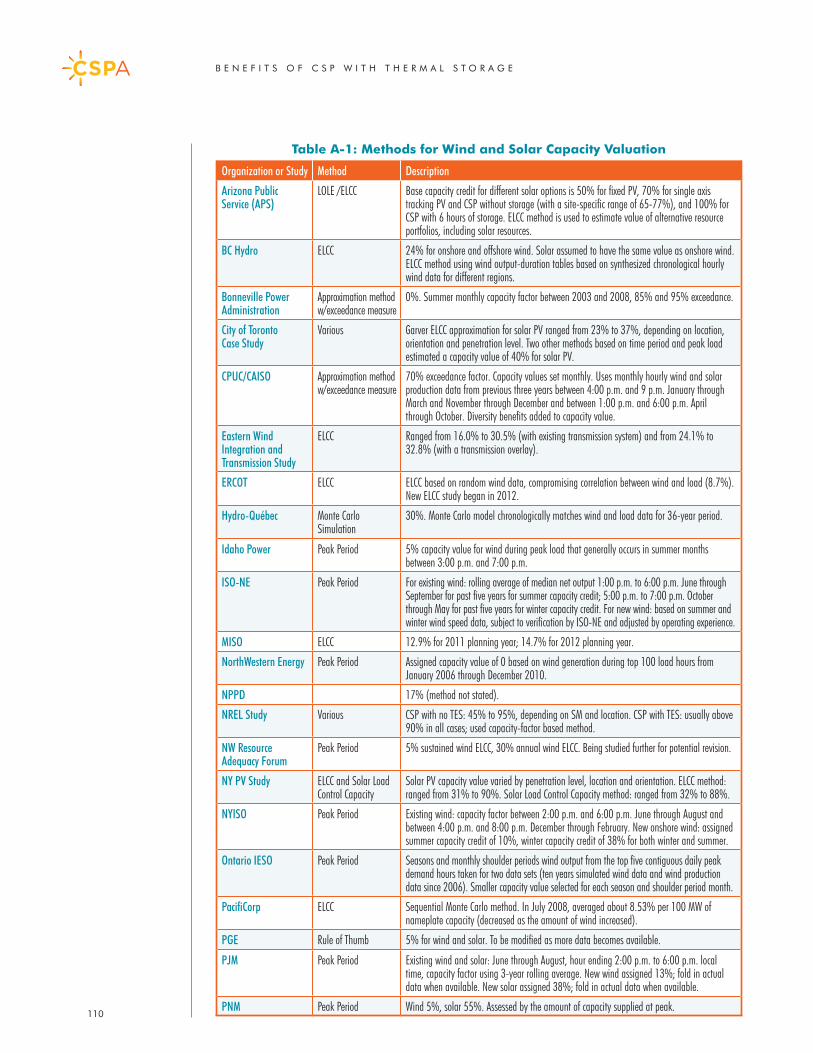
B E N E F I T S O F C S P W I T H T H E R M A L S T O R A G E
110
Table A-1: Methods for Wind and Solar Capacity Valuation
Organization or Study Method Description
Arizona Public Service (APS)
LOLE /ELCC Base capacity credit for different solar options is 50% for fixed PV, 70% for single axis tracking PV and CSP without storage (with a site-specific range of 65-77%), and 100% for CSP with 6 hours of storage. ELCC method is used to estimate value of alternative resource portfolios, including solar resources.
BC Hydro ELCC 24% for onshore and offshore wind. Solar assumed to have the same value as onshore wind. ELCC method using wind output-duration tables based on synthesized chronological hourly wind data for different regions.
Bonneville Power Administration
Approximation method w/exceedance measure
0%. Summer monthly capacity factor between 2003 and 2008, 85% and 95% exceedance.
City of Toronto Case Study
Various Garver ELCC approximation for solar PV ranged from 23% to 37%, depending on location, orientation and penetration level. Two other methods based on time period and peak load estimated a capacity value of 40% for solar PV.
CPUC/CAISO Approximation method w/exceedance measure
70% exceedance factor. Capacity values set monthly. Uses monthly hourly wind and solar production data from previous three years between 4:00 p.m. and 9 p.m. January through March and November through December and between 1:00 p.m. and 6:00 p.m. April through October. Diversity benefits added to capacity value.
Eastern Wind Integration and Transmission Study
ELCC Ranged from 16.0% to 30.5% (with existing transmission system) and from 24.1% to 32.8% (with a transmission overlay).
ERCOT ELCC ELCC based on random wind data, compromising correlation between wind and load (8.7%). New ELCC study began in 2012.
Hydro-Québec Monte Carlo Simulation
30%. Monte Carlo model chronologically matches wind and load data for 36-year period.
Idaho Power Peak Period 5% capacity value for wind during peak load that generally occurs in summer months between 3:00 p.m. and 7:00 p.m.
ISO-NE Peak Period For existing wind: rolling average of median net output 1:00 p.m. to 6:00 p.m. June through September for past five years for summer capacity credit; 5:00 p.m. to 7:00 p.m. October through May for past five years for winter capacity credit. For new wind: based on summer and winter wind speed data, subject to verification by ISO-NE and adjusted by operating experience.
MISO ELCC 12.9% for 2011 planning year; 14.7% for 2012 planning year.
NorthWestern Energy Peak Period Assigned capacity value of 0 based on wind generation during top 100 load hours from January 2006 through December 2010.
NPPD 17% (method not stated).
NREL Study Various CSP with no TES: 45% to 95%, depending on SM and location. CSP with TES: usually above 90% in all cases; used capacity-factor based method.
NW Resource Adequacy Forum
Peak Period 5% sustained wind ELCC, 30% annual wind ELCC. Being studied further for potential revision.
NY PV Study ELCC and Solar Load Control Capacity
Solar PV capacity value varied by penetration level, location and orientation. ELCC method: ranged from 31% to 90%. Solar Load Control Capacity method: ranged from 32% to 88%.
NYISO Peak Period Existing wind: capacity factor between 2:00 p.m. and 6:00 p.m. June through August and between 4:00 p.m. and 8:00 p.m. December through February. New onshore wind: assigned summer capacity credit of 10%, winter capacity credit of 38% for both winter and summer.
Ontario IESO Peak Period Seasons and monthly shoulder periods wind output from the top five contiguous daily peak demand hours taken for two data sets (ten years simulated wind data and wind production data since 2006). Smaller capacity value selected for each season and shoulder period month.
PacifiCorp ELCC Sequential Monte Carlo method. In July 2008, averaged about 8.53% per 100 MW of nameplate capacity (decreased as the amount of wind increased).
PGE Rule of Thumb 5% for wind and solar. To be modified as more data becomes available.
PJM Peak Period Existing wind and solar: June through August, hour ending 2:00 p.m. to 6:00 p.m. local time, capacity factor using 3-year rolling average. New wind assigned 13%; fold in actual data when available. New solar assigned 38%; fold in actual data when available.
PNM Peak Period Wind 5%, solar 55%. Assessed by the amount of capacity supplied at peak.
B E N E F I T S O F C S P W I T H T H E R M A L S T O R A G E
111
Additional References
Billinton, R., and R.N. Allan, Reliability Evaluation of Power Systems, Second Edition, New York: Plenum Press, 1994.
Milligan, M., and K. Porter, Determining the Capacity Value of Wind: An Updated Survey of Methods and Implementation, Conference Paper, NREL/CP-500-43433, June 2008.
NERC, Methods to Model and Calculate Capacity Contributions of Variable Generation for Resource Adequacy Planning (Princeton, NJ: NERC, March 2011), http://www.nerc.com/pa/RAPA/ra/Reliability Assessments DL/IVGTF1-2.pdf.
Perez, R., M. Taylor, T. Hoff, and J.P. Ross. “Reaching Consensus in the Definition of Photovoltaics Capacity Credit in the USA: A Practical Application of Satellite-Derived Solar Resource Data.” IEEE Journal of Selected Topics in Applied Earth Observations and Remote Sensing, 1 (1): 28–33, 2008.
B E N E F I T S O F C S P W I T H T H E R M A L S T O R A G E
112
Appendix B: Simplified Calculation of Integration Costs in California under 33% RPSTo date, most wind and solar integration studies have reported average integration costs in the ranges discussed in Section 9 of this report, but have not reported costs on an hourly basis across the year. Because CSP with thermal energy storage charges during daylight hours, it can generally be available to generate during hours with high system ramps in the late afternoon and early evening. In this case, there can be above-average value for the energy, in terms of avoided integration costs. To evaluate this hypothesis, the authors examined the data from the simulations conducted by the California ISO of integration under 33% RPS and derived simplified estimates of hourly integration costs, as shown below. These results are intended to illustrate the finding but need further testing and validation.
To date, the California Public Utility Commission (CPUC) has not allowed integration costs to be considered in renewable energy procurement by its jurisdictional utilities, although such costs may be considered in 2015 procurement. As such, the California ISO simulations (conducted in 2010-11) were not used to explicitly calculate integration costs but rather focused on simulating whether additional resource “needs” could be defined. These “needs” were evaluated using a set of operational requirements and assumptions about future load and resources needed to meet the planning reserve margin in 2020. The study evaluated four “core” 33% RPS scenarios as well as several sensitivity cases on both input assumptions (e.g., forecast errors) and scenario definitions. While the study did not result in findings of new resource needs, it did define additional integration requirements for hourly system operations. The integration requirements were defined as the capacity (MW) of Regulation Up (RU), Regulation Down (RD), Load-following Up (LFU) and Load-following Down (LFD) needed for reserves on an hourly basis. In actual practice, only a portion of the future load-following requirement is likely to be procured as a load-following ramping reserve with the remainder procured through 5-minute economic dispatch. However, the calculated load-following requirements in the data sets still indicates the likely hours of greatest real-time market price impact.
Methodology
The methodology for assessing integration costs was to calculate on a per-period basis the cost of integration (defined as the incremental cost of load following and regulation over and above historical levels) and divide it by the RPS energy production for the period resulting in a $/MWh integration cost.
Hourly ancillary service (AS) prices and requirements for the LTPP 33% RPS Trajectory scenario (and other scenarios) were available directly from the publicly released CAISO and joint IOU integration study files. The CAISO system currently procures a certain quantity of Regulation and provides a certain range of load-following without having to commit additional ramping reserves. To isolate the incremental requirements associated with integrating RPS energy, the typical current-day quantities for the required load following and regulation requirements were deducted from the total quantities in the CAISO data: 350 MW for each of regulation up and regulation down, and 1000 MW for each of load following up and down.
B E N E F I T S O F C S P W I T H T H E R M A L S T O R A G E
113
The denominator in the calculation, the hourly RPS energy, is calculated using the following methodology:
Capacities (MW) and annual generation (GWh) for each category of renewable resource are provided in the LTPP documentation. Because some of these resources are out of state (OOS) and the CAISO only modeled management of the integration for 15% of the OOS resources, the net capacity to be integrated for each resource type was calculated as total MW – 0.85 × OOS MW.
Hourly output profiles for an array of wind, large solar, and solar DG resource were available in the California ISO study input files (in the “Fixed Dispatch” folders). From the available resource profiles, we selected those that were easily identified as being in California and normalized their output to an hourly capacity factor. The normalization was performed using the stated capacity of the resource, if it was available in the file. If there was no stated capacity in the input file, the highest hourly output of the year was assumed to represent the capacity of the given resource.
For CSP solar, the authors used their own non-storage hourly capacity factors.
For each resource type of wind, large solar, solar DG, and CSP, the hourly capacity factors were scaled to meet the LTPP planning capacity for the given scenario, then used to generate hourly output curves.
All the curves were summed to yield an aggregate renewable energy quantity (MWh) on an hourly basis.
Using these 8784 hour strips (2020 is a leap-year) for AS requirements, AS-prices, and RPS MWh, integration costs were calculated as shown below.
Integ_cost[t] = Prc_LFU[t] × ( Req_LFU_scenario[t] – Req_LFU_baseline[t]) +
Prc_LFD × (Req_LFD_scenario[t] – Req_LFD_baseline[t]) +
Prc_RU[t] × (Req_RU_scenario[t] – Req_RU_baseline[t]) +
Prc_RD × (Req_RD_scenario[t] – Req_RD_baseline[t]).
Where t is the hour and t ∈ 8784 hours, LFU is load-following up, LFD is load-following down, RU is Regulation Up, RD is Regulation Down, Req means “requirement”, Prc means “price”, and baseline refers to the historical quantity deducted to isolate the incremental requirement for variable energy resources. From these quantities, the costs assignable to wind and solar were calculated.
Hourly integration cost assigned to renewable ($/MWh) [i] = Integ_cost[i] / RPS_energy[i]
This calculation was performed on an hourly basis but the results can be somewhat misleading because the cost to integrate a resource is not necessarily tied to its behavior in that hour alone but also to the duration and magnitude of the system ramps caused in the hours preceding and following the hour in question. Ideally, a full system dispatch model would be used to gain better insight into the full range of integration costs, as shown, e.g., in Denholm et al., 2013 or Mills and Wiser, 2012a.
In the next two figures, some of the relationships between absolute hourly integration costs, integration costs in $/MWh assigned to wind and solar, and renewable production found by this analysis are plotted. The results are discussed in Section 9.
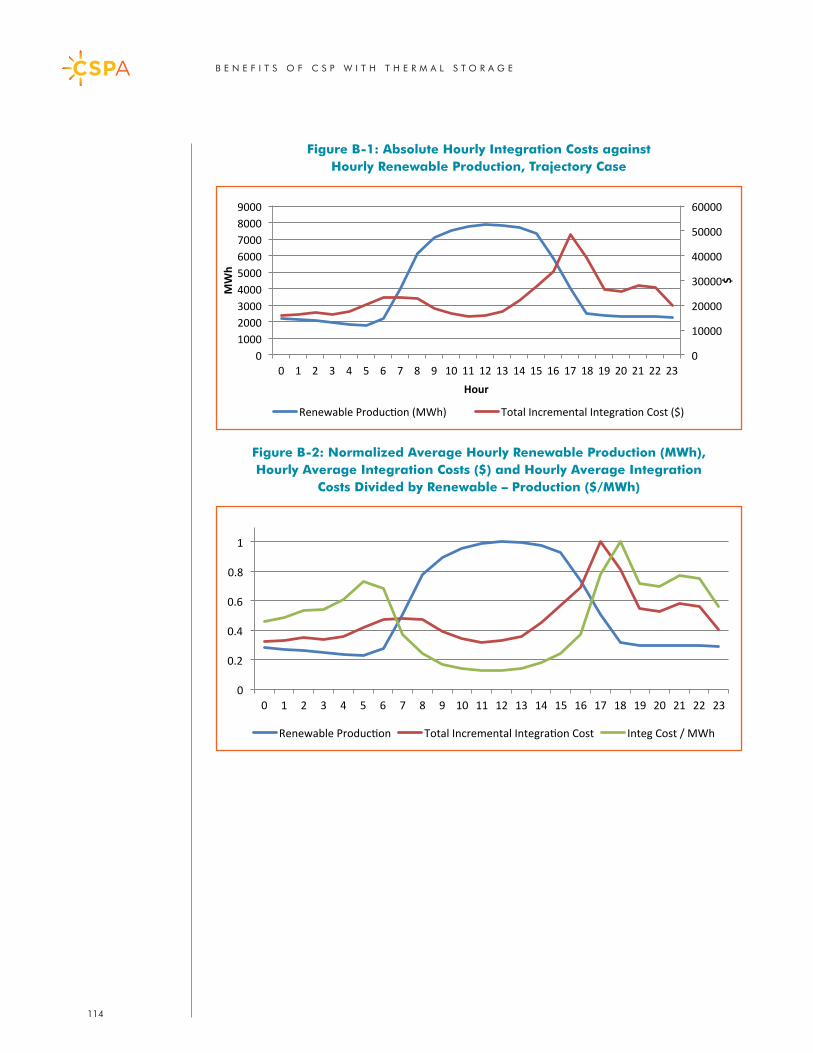
B E N E F I T S O F C S P W I T H T H E R M A L S T O R A G E
114
Figure B-1: Absolute Hourly Integration Costs against Hourly Renewable Production, Trajectory Case
Figure B-2: Normalized Average Hourly Renewable Production (MWh), Hourly Average Integration Costs ($) and Hourly Average Integration
Costs Divided by Renewable – Production ($/MWh)
0
10000
20000
30000
40000
50000
60000
0 1000 2000 3000 4000 5000 6000 7000 8000 9000
0 1 2 3 4 5 6 7 8 9 10 11 12 13 14 15 16 17 18 19 20 21 22 23
$
MWh
Hour
Renewable Produc9on (MWh) Total Incremental Integra9on Cost ($)
0
0.2
0.4
0.6
0.8
1
0 1 2 3 4 5 6 7 8 9 10 11 12 13 14 15 16 17 18 19 20 21 22 23
Renewable Produc:on Total Incremental Integra:on Cost Integ Cost / MWh