61
i The Economic and Social Costs of Anti-Social Behaviour: A Review CME Whitehead, JE Stockdale and G. Razzu London School of Economics and Political Science October 2003
i
The Economic and Social Costs of Anti-Social Behaviour: A Review
CME Whitehead, JE Stockdale
and G. Razzu
London School of Economics and Political Science
October 2003
ii
Contents List of Tables iii List of Acronyms iv Executive Summary v 1. Context 1 2. Defining anti-social behaviour 2 3. Measuring anti-social behaviour 6 3.1. Measurement problems 6 3.2. Implications for costing 7 4. Incidence and importance of anti-social behaviour 10 4.1. Trends 10 4.2. Scale of the problem 11 4.3. Differential experience 12 4.4. Action to tackle anti-social behaviour 13 4.5. Significance of anti-social behaviour 13 4.6. Implications for costing 14 5. A framework for estimating costs of ASB 15 5.1. Estimating costs 15 5.2. Applying the general principles to anti-social behaviour 15 5.3. The elements involved in assessing the economic and social costs of anti-social behaviour 16 5.4. Problems in evaluating the economic costs of anti-social behaviour 17 5.5. Financial evaluation 18 5.6. Current approaches to evaluating costs 19 5.7. Conclusions 20 6. Evidence on the costs of anti-social behaviour 22 6.1. Differential vulnerability 22 6.2. Sources of cost estimates 22 6.3. Cost estimates 23 6.4. Aggregate costs of ASB to different agencies 31 6.5. Aggregate costs of crime to society 32 6.6. Issues in the real measurement of costs 38 6.7. Conclusions 39 7. Gaps and proxies 43 7.1 Gaps in direct costs 43 7.2. Gaps in costs to victims not covered by alleviation costs 43 7.3. Property value proxies: a means of evaluating the overall impact of ASB 45 7.4 Home Insurance weightings as a proxy measure 46 8. Conclusions 47 References 49
iii
List of Tables Table 2.1: Behaviours for which ASBOs have been awarded 2 Table 3.1: Activities deemed to be ASB for the purpose of the day count 7 Table 3.2: Template for identifying/measuring costs of activities deemed to constitute ASB 9 Table 5.1: Stages in the evaluation of economic and social costs of ASB 16 Table 5.2: Stages in the evaluation of financial costs to agencies of ASB 18 Table 5.3: Types of costs arising from neighbour nuisance 20 Table 6.1: Total resource costs of alcohol misuse (England & Wales) 25 Table 6.2: Total cost estimates, by crime type and cost category 26 Table 6.3: Costs for local authorities 29 Table 6.4: A case study 29 Table 6.5: Costs of intervention by local authority housing departments by form and level of intervention 30 Table 6.6: Costs of legal action to landlords 1996/97 31 Table 6.7: Cost of neighbour disputes over 12 months 32 Table 6.8: Total opportunity cost of crime 33 Table 6.9: Aggregate burden of crime 34 Table 6.10: Examples of ASB costs to agencies 36 Table 6.11: Estimates of unit costs of ASB 41
iv
List of Acronyms CRESR: Centre for Regional and Social Research CHP: Centre for Housing Policy CDRP: Crime and Disorder Reduction Partnership ASBO: Anti-social Behaviour Order ASB: Anti-social behaviour HMIC: Her Majesty’s Inspectorate of Constabulary BCS: British Crime Survey SHE: Survey of English Housing DETR: Department of Environment, Transport and Regions LGA: Local Government Association BSA: British Social Attitudes NDC: New Deal for Communities RSL: Registered Social Landlords
v
Executive Summary I The Objectives of the Report 1. The report aims to provide a framework for assessing the costs of anti-social
behaviour (ASB); to integrate available estimates of cost into that framework; identify key knowledge gaps; and advise on the use of proxies.
II Definitions of ASB 2. ASB is defined in relation to the harm caused to others. Estimates of the costs of
ASB should therefore take account of the costs incurred by all those affected and not just of the costs to government and its agencies.
3. ASB is also defined by categories of behaviours or activities, some of which directly
harm people, others of which damage property and some of which are simply a nuisance. In the literature and policy documents, these categories are often exemplification, rather than a complete listing. Some of these categories relate mainly to the home and its neighbourhood. Others are more general, including schools, workplaces and commercial/leisure areas.
4. Some definitions of ASB suggest that the behaviours must be (i) severe and/or (ii)
persistent. This would imply that only a sub-set of activities in each category should be included in ASB.
5. Most definitions of ASB involve some overlap with definitions of crime. Some
indeed include all crimes. Common sense would suggest some delineation – although it may be that all criminal activity has some element of ASB within it.
III Measuring ASB 6. Given the problems of definition listed above, it is hardly surprising that
measurement of the extent of ASB presents considerable difficulties. It does not fall readily into categories. It does not lie within the remit of a single agency and many incidents go unrecorded.
7. The Home Office day count on 10 September 2003 addressed these issues by
providing a defined set of categories which is inherently only a sub-set of ASB (e.g. it excludes some types of behaviour that have been subject to ASBOs). It concentrates on recording by as wide a set of agencies as possible. It includes reports by the public and behaviours directly observed by agencies. Many incidents will not have been counted. Others will have been included more than once. Finally, the quality of the count and what is included will undoubtedly vary greatly across localities.
8. The number of behaviours is only one element in measuring the extent of ASB
because of its inherent attribute of affecting others. To address issues of cost fully it would be necessary to know the numbers of direct and indirect victims as well as the extent of any wider impact e.g. changes in general attitude to the neighbourhood or to fear of crime, and the extent of the distress of those affected. All that the count can provide is numbers of reports by category. The impact on others has to be assessed indirectly from additional evidence.

vi
IV Incidence and Importance of ASB 9. There is considerable evidence in the literature of increases both in ASB itself and in
the extent to which ASB is being addressed in a formal manner. However, there are categories where both recorded incidents have fallen and survey respondents have perceived improvement.
10. ASB appears to be particularly prevalent in large metropolitan areas and in deprived
neighbourhoods. Incidence of ASB is thus positively correlated with many of the variables used to categorise neighbourhoods.
11. There is considerable discussion of the extent to which ASB generates a ‘broken
window’ syndrome, although very little quantitative evidence relating to this hypothesis. Equally, there is some evidence that for victims who experience ASB, additional incidents may incur lower costs – although total costs continue to increase.
12. It is clear both from survey evidence and analyses of neighbourhood problems that
ASB is a non-trivial problem, placing heavy burdens on agencies and on a wide range of direct and indirect victims. Measuring the extent of these costs is however much more difficult.
V A Framework for Estimating the Costs of ASB 13. ASB generates negative values, thus reducing the welfare of all those affected by the
behaviours. It also incurs costs of prevention and alleviation. To the extent that these reduce the costs borne by the victims, victim costs should be measured in net terms – i.e. they should take account of the costs incurred to offset or prevent their loss of welfare.
14. Major problems arise in measuring the costs of ASB because of the lack of a clear
definition, the extent to which the effect varies with the type of activity, and the concentration of activities, in time, place and the categories of victims. Ideally, therefore, one would wish to measure costs by category of ASB together with a range of other factors.
15. A general framework would have seven stages:
• the definition of categories and a count of the numbers in each category;
• clarification of the outputs/outcomes from each category; • specification of the groups affected and the numbers in each group; • as assessment of the reduction in welfare associated with each
category of ASB and victim; • clarification of any major non-linearities in impact; • estimation of the costs of offsetting the welfare loss through (i) direct
costs of amelioration/prevention; (ii) direct costs of non-amelioration; and (iii) the net losses of welfare to victims measured after (i) and (ii) by compensation or preparedness to pay;
• summation of these costs into an overall economic (including social) cost of ASB.
16. In practice most analyses of costs concentrate on the actual costs to agencies of
alleviation or non-alleviation (not even necessarily the best approach). A simplified approach which delineates ASB; measures levels of activity; estimates the costs incurred by agencies for the mix of activities that they face; estimates the costs of

vii
dealing with perpetrators; sums these costs; and measures the cost of a percentage increase or decrease in ASB to agencies would provide at least a partial answer to the costs of addressing ASB. However it would deal only with financial costs. It would not measure the overall costs of ASB because it excludes the net impact on victims.
17. Current approaches to providing a framework for evaluating the costs of ASB do little
more than generate categories of costs incurred by categories of agency (with victims sometime mentioned as a residual).
VI Evidence on the costs of ASB 18. There are two general types of evidence on the costs of ASB available: (i) direct
costs (including sometimes imputed costs) to agencies and (ii) some general usually correlational or, on occasions, ordinal measures of attitudes to types of ASB and related activity. Data are also available at different levels of aggregation from individual to national.
19. There is a large number of more or less detailed estimates of particular types of cost.
However, the majority of the evidence is agency and location specific and the details provided are rarely adequate for generalisation.
20. There is however some consistency perhaps enough to provide some initial estimates
of unit costs. This suggests that in estimating costs it would be appropriate to distinguish:
(i) ASB incidents which require only staff time to note the report/refer the
incident; (ii) ASB incidents which involve low levels of physical damage or staff
intervention; (iii) ASB incidents which involve larger-scale remediation either physical or in
terms of staff time; (iv) ASB incidents involving formal intervention, including legal action such as
eviction or ASBOs. 21. At the lower end costs are of the order of £20-£50. At the upper end, there are
examples of over £1m. For the vast majority of incidents when action is taken however the costs vary between £100 and £10,000. These are very general estimates based on estimates using widely varying approaches. They do not directly reflect costs of non-alleviation such as increased vacancies. Most importantly they exclude any net costs to victims.
22. There is little or not direct evidence on the costs to victims other than survey evidence
of how people perceive their neighbourhoods. Some American reports do attempt to address the issue particularly in terms of longer term costs.
VII Gaps and Proxies 23. It is clear that there are far more gaps than there is evidence, although both the
qualitative and quantitative material available gives useful indications of what is required.
24. One important area of decision is the extent to which costs can be associated with
categories of ASB and thus to the evidence of the count. In the main what is available is couched in different terms – the costs of dealing with certain types of output/outcome or the correlational evidence on victims’ attitudes.
viii
25. To address this issue some qualitative evidence was obtained on the proportions of
recorded ASB that are dealt with in different ways. It suggested that agencies categorise ASB by severity rather than by the type of ASB and that more costly action was taken in a relatively small but significant proportion of all incidents.
26. It is clear that any more detailed estimate even of direct costs would require:
• clear categorisation of the numbers and types of victims as well as the numbers of incidents;
• detailed understanding of the resources used (both staff costs and materials/other impacts) in addressing each type of activity;
• detailed evidence of the proportions of each type of ASB activity attracting each type of response.
27. The most fundamental gap however relates to measures of the net welfare loss to
victims of different types. These should, in principle, be measured by preparedness to pay to avoid of by the compensation required to offset that loss. Both measures have limitations which are well discussed in the cost-benefit literature.
28. Some elements could be addressed by estimating the real resource costs of secondary
alleviation activity – such as hospital costs and improvements to the area. Here there is no direct evidence at the present time. Others can only be addressed by examining values that have been employed in existing cost benefit approaches where victims have suffered damage. Most of these related to health costs and/or to value of life. A fundamental problem in using these estimates is that there is no direct evidence on the impact of different categories of ASB to which to apply these values.
29. Proxies that can be employed include insurance costs, compensation payments and
property values. Insurance costs provide the market’s estimate of the cost of alleviation of particular outputs/outcomes. They specifically take no account of subjective values of welfare loss. Compensation e.g. for victims of criminal activity takes some account of these costs but only as perceived by a third party.
30. Changes in property values have been estimated as a proxy for the value of certain
types of activity. Some of the estimates are very high, suggesting problems of specification and omitted values. There are also perverse results, perhaps arising from recording biases. As such they can provide some indication that ASB is important but are not yet well specified enough to use in direct measures of cost. This input relates back to problems of definition, measurement and recording of ASB.
VIII Conclusions 31. Overall the principles by which the costs of ASB might be measured are clear.
However the evidence in the literature on actual costs gives little more than exemplification. It is clear that ASB is a non-trivial problem. Equally different types of behaviour can be grouped into categories to which cost ranges can be attached. But these refer only to agency costs, not to wider social costs.

1
The Economic and Social Costs of Anti-social Behaviour: A Review
1. Context This report aims to inform the Government’s action plan to tackle anti-social behaviour (ASB) by setting out a methodology for assessing the costs of ASB. It provides a review of the key issues which must be addressed in determining the economic and social costs of ASB. The ITT to which this review is a response points out that little is known about the total economic and social costs of ASB. Ideally a measure incorporating financial costs as well as market and non-market costs should be available, in order to provide an indication of the total resource cost to the economy of ASB and to demonstrate the importance of what in the past have been regarded as minor problems. Disaggregated costs would also provide a valuable input to cost benefit analyses of policies to reduce specific aspects of ASB. This review is the first stage of a two-stage economic analysis of the costs of ASB which in turn is part of a programme of work that the ASB Unit in the Home Office is developing to improve knowledge of ASB. The report covers four major elements:
a methodological framework for assessing the costs of ASB; integration of existing estimates of economic and social costs within that framework; identification of key areas where there are knowledge gaps; and advice on how proxies might be used where direct estimates are not available.
The elements are framed within discussion of contextual issues relating to the definition and measurement of ASB. These are inextricably linked to the assessment of its cost to individuals, local communities and society in general.

2
2. Defining anti-social behaviour There is considerable lack of clarity in the definition of ASB which inevitably impacts on the measurement of the problem. The incidence of ASB will depend on the breadth of definition and the precision of the constituent categories. The Crime and Disorder Act 1998 defines ASB, in relation to obtaining an Anti-Social Behaviour Order (ASBO) as acting: ‘in a manner that caused or was likely to cause harassment, alarm or distress to one or more persons not of the same household [as the defendant]‘ (CDA, 1998 Section 1 (1) (a)). This definition is clearly open to different forms of interpretation as it focuses on the consequences of certain behaviours rather than identifying specific behaviours. An alternative approach is to define ASB in terms of the behaviours for which ASBOs are awarded. A recent Home Office review of ASBOs identified seventeen behaviours for which ASBOs had been granted in the areas covered by the study (Campbell, 2002). These are listed in Table 2.1. Table 2.1: Behaviours for which ASBOs have been awarded Harassment Arson Threats Racial harassment or abuseVerbal abuse Criminal behaviour Intimidation Drunk and disorderly Graffiti and criminal damage Prostitution Assault Shoplifting Noise Throwing missiles Public disturbance Trespass Harassing a specific person Source: Campbell (2002) Although there are operational definitions of some of the behaviours listed in Table 2.1, others – such as noise or threats - lack clarity of definition. Many of these behavioural categories are also not independent of the context in which they occur. For example, what is considered to be an unacceptable level of noise in a rural environment or in a neighbourhood dominated by elderly residents would not be regarded as such in an inner city area. The lack of an agreed definition of ASB has led to many Crime and Disorder Reduction Partnerships (CDRPs) adopting their own definitions of the problem. Locally determined definitions can have a number of advantages – they can be tailored to the local context, ownership of the problem is enhanced and, there is greater standardisation of monitoring practices where all partner agencies use the same definition. However, the use of a multiplicity of definitions does not aid the task of measuring ASB. In a national postal survey of CDRPs, one in every two partnerships (48%) which responded reported having a common working definition. For the majority (77%) this was the definition contained in the Crime and Disorder Act 1998 (CRESR and CHP, 2003a). However, the existence of a definition within the CDRP did not necessarily mean that it had been adopted by all partner agencies nor did it imply a shared understanding – a factor which is critical to effective multi-agency partnership working to tackle the problem.

3
The definition given by the Youth Offending Team of the Royal Borough of Chelsea and by Cherwell District Council, North Oxfordshire, is considered to be very useful by the CRESR at Sheffield Hallam University and CHP at University of York (CRESR and CHP, 2003a) as it does not specify a particular behaviour and takes into account the different perspectives of the member agencies involved in partnership working: “behaviour causing disturbance, distress, harm or fear which has a significant effect on peoples life styles and routines. Persistence, intensity and the numbers involved are relevant factors. The behaviour need not be a breach of the criminal law” (Cherwell District Council, www.cherwell-dc.gov.uk/environment/antisocial.cfm accessed on 18/07/2003) The lack of consensus in defining ASB is illustrated by the range of other definitions currently in use, examples of which are provided below. The Chartered Institute of Housing Good Practice Briefing (1995) “ Behaviour that unreasonably interferes with other people’s rights to use and enjoyment of their home and community” (Quoted in SEU, 2000: page 15) Shelter “Anti-social behaviour occurs where behaviour by one household or individuals in an area threatens the physical or mental health, safety or security of other households or individuals” http://www.shelter.org.uk/images/pdfs/campaign/dltr_%20asb_%20response.pdf accessed on 14 August 2003) Borough of Barrow in Furness “Neighbour nuisance or anti social behaviour is anything which interferes with the peaceful enjoyment of the home and surrounding area.” (www. barrowbc.gov.uk/housing/neighbour_nuisance.htm accessed on 18/07/2003) Housing Act (1996) Chapter III of Part V deals with injunctions against anti-social behaviour. Anti-social behaviour is such when a person is: “engaging in or threatening to engage in conduct causing or likely to cause a nuisance or annoyance to a person residing in, visiting or otherwise engaging in a lawful activity in residential premises to which this section applies or in the locality of such premises, using or threatening to use residential premises to which this section applies for immoral or illegal purposes, or entering residential premises to which this section applies or being found in the locality of any such premise.’ RSL Officer “a range of things at one end of the spectrum is lifestyle clashes where some one play music of a certain type quite loud all the way through to more serious anti-social behaviour which has included threats of and actual physical violence against another resident. The whole myriad of things in between, dogs barking, kids playing” (CRESR and CHP, 2003a)

4
Private Landlord “We see anti-social behaviour as situations or things which cause criminal damage which really disrupt the life of our residents. Certainly things like drug dealings. That’s what we would consider anti-social” (CRESR and CHP, 2003a) Welsh Office “such behaviour manifests itself in many different ways and at varying levels. It can include vandalism, noise, verbal and physical abuse, threats of violence, racial harassment, damage to property, trespass, nuisance from dogs, car repairs on the street, so-called joyriding, domestic violence, drugs and other criminal activities, burglary”(Papps, 1998) Good Practice Unit – CIH (1995) “behaviour that opposes society’s norms and accepted standards of behaviour” (CIH, 1995: page3) ASB Sub-Committee - Newport County Borough Council (1993) “the term anti-social is to a certain extent a subjective one, but is taken to mean any action which a reasonable person would consider as likely to adversely affect the quiet enjoyment of their home” Scottish Affairs Committee (1996) “ASB is a direct result of behaviour by one household or individuals in an area which threatens the physical or mental health, safety or security of other households and individuals” (Scottish Affairs Committee, 1996: p.1) Public surveys in the UK on crime and policing suggest that the public place a high priority on tackling incidents described as ASB, minor disorder or ‘quality of life’ issues (Bland, 1997; HMIC, 1997; 1999a; 1999b). In their guidance to Registered Social Landlords (RSLs), The Housing Corporation emphasises that ASB ranges from the mildly irritating – people leaving litter in a resident’s front garden – to life threatening - serious harassment where a resident fears for his/her life (Ganderton, 2000). Another feature of many definitions of ASB is that they include both criminal activity (only certain rather than all offences) and misdemeanours or other actions which are not breaches of the criminal code. Some analyses explicitly recognise that ASB includes different phenomena. For example, Bannister and Scott (2000) argue that ASB comprises three distinct types of problem:
neighbour – a dispute arising from nuisance e.g. noise; neighbourhood – incivilities within public spaces e.g. rubbish; and crime – all forms of criminal activity e.g. housebreaking.
As others have pointed out, the definition of ASB lacks clarity and suffers from a lack of consensus on the behaviours to which it refers (CRESR and CHP, 2003b). The terms crime, disorder and anti-social behaviour are frequently used interchangeably to refer to a variety of behaviours ranging from a low level of nuisance to criminal behaviour. Also, it is important to recognise that virtually any activity can be anti-social depending on a range of background

5
factors, such as the context in which it occurs, the location, people’s tolerance levels and expectations about the quality of life in the area. CRESR and CHP (2003b) argue that, whatever approach is used to defining ASB there are a number of issues which need to be addressed:
the impact of behaviour on others and the perceptions of local residents are key determinants of whether the behaviour is anti-social;
context and location matter, as what is anti-social here and now might not necessarily be the same in another context; and
a broad definition can result in a process of negative stereotyping while a too narrow a definition can result in the tendency for agencies to abrogate responsibility for taking action.
There are a number of important aspects of the definition of ASB which impact on how to define and estimate costs:
1. the fundamental is that the behaviour must impact on others, causing or being likely to cause distress. By implication therefore the costs that should be measured, at least in principle, are those incurred by these other people;
2. lists of behaviours that may be included as ASB vary considerably from the broadest which counts all crime as ASB to exemplification, which does not aim to provide a comprehensive listing. That which has been included in ASBOs is simply the current position, not a full delineation;
3. including some crimes in ASB – which has clearly occurred in the context of ASBOs – complicates the definition and can lead to double counting and/or misunderstanding. For instance, most commentators would regard drug dealing as a crime rather than as ASB. Including the full costs within ASB might be seen as an incorrect interpretation of the issue. Excluding crimes, however, would exclude many activities which cause alarm and distress to others;
4. some of the definitions suggest that the problem must be (a) significant and (b) persistent. The first raises issues of who determines whether it is significant, given the cost relates to the victims’ suffering; the second has similar implications for costing – should the ASB count zero below a certain threshold and/or should the costing be proportional to the level of activity/number of occasions or rise disproportionately with persistence?
5. some of the definitions clearly relate ASB to the home (remembering that the sufferers are defined as those outside the household) and the neighbour/ neighbourhood. Yet many of the activities will take place elsewhere: on the street; in shops; at the workplace. Equally, it is clear that ASB does not simply include activities against people - e.g. graffiti is usually not directed at a person;
6. finally, context clearly matters and an action may be seen as ASB in one context when it is just a nuisance or irritant in another. This makes estimation of cost, except at the broadest scale, almost impossible.
Thus, the definitions are based on some commonsense approach and are likely to be subject to re-interpretation and extension with experience, through the Courts and over time as social attitudes change. From the point of view of the current attempt to estimate costs, the definition of ASB must be the set of behaviours considered for the purpose of the Home Office one-day count conducted on 10 September 2003. These are listed in Table 3.1. This will therefore exclude other behaviour that have already been subject to ASBOs and/or which are generally accepted as ASB. As such it will provide a conservative estimate of both the level of ASB activity and the cost of that behaviour.

6
3. Measuring anti-social behaviour 3.1 Measurement problems Measurement of ASB is difficult because it is not clear what should be measured. Also, its measurement is problematic because ASB does not fall within the remit of a single agency and so a range of agencies are involved in data collection, such as the police, various local authority departments – including housing and environmental health – the fire service, local hospital accident and emergency (A&E) departments. Many incidents of ASB are not recorded because it is not clear who is responsible for data collection. For example, as Armitage (2002) points out, the 2000 British Crime Survey (BCS) indicates that the most commonly experienced ASB was ‘young people being rude or abusive’ (Budd and Sims, 2001). Not only is such behaviour subjectively defined, no agency is responsible for collecting data on this form of behaviour. Furthermore, many instances of ASB are never recorded because they are never reported. People will fail to report for a variety of reasons: they do not know to whom they should report; they do not think it is worth reporting because they do not think any effective action will be taken to counter the problem or the costs of reporting outweigh any potential benefit; they fear reprisals from the perpetrators, or, if the behaviour is serious – such as a criminal act – they may not wish to get involved with the police. In any count of ASB, it is therefore likely that:
some relevant behaviours will not be counted at all – because of failure to report or because no agency is responsible for data collection;
some will be counted twice or more – because they are recorded by more than one agency; and
some will be counted not only as incidents of ASB but also as criminal offences and therefore will contribute to more than one cost domain.
The one-day count carried out by the Home Office on 10 September 2003 aims to provide a snapshot of the amount and nature of ASB in England and Wales. The key organisations for the one day count were the public services, especially the police and local authorities, but any organisation in England and Wales that receives first hand reports of ASB was encouraged to take part in the count, such as RSLs, the fire service, tenant organisations and businesses. Data collection involved completion of a one-page form on which were listed thirteen categories of behaviour. These were selected to include those activities commonly considered to be anti-social, based on a typology of behaviours which contains four activity domains: misuse of public space; disregard for community/ personal well-being; acts directed at people and environmental damage. Organisations were asked to detail for each activity the total number of reports received. The activities deemed to be ASB for the purpose of the one-day count are listed in Table 3.1. Although some of the categories listed are quite specific (e.g. hoax calls), others are open to interpretation (e.g. inappropriate vehicle use). Also, in some cases the distinction between categories is not always clear (e.g. noise, rowdy behaviour and nuisance behaviour).

7
Table 3.1: Activities deemed to be ASB for the purpose of the day count
Type of ASB Drug/substance misuse and drug dealing
Street drinking; begging Prostitution; kerb crawling; sexual acts
Vehicle related nuisance and inappropriate vehicle use Abandoned vehicles
Noise Rowdy behaviour
Nuisance behaviour Hoax calls
Animal-related problems Intimidation/harassment
Criminal damage/vandalism Litter/rubbish
3.2 Implications for costing In order to cost activities and their impact directly it is necessary
(a) to delineate the set of activities; (b) to count them and, most importantly; and (c) to determine who was affected and in what way.
• The question of delineation has been addressed under definitions – but clearly leaves
many unanswered questions relating to what is included and excluded; • with respect to (b) all that in practice can be counted is what is reported and recorded.
In the context of reporting it can be hypothesised that those behaviours that impact most on others will be those that are reported – and, indeed, that those which are reported more than once, either by more than one person or to more than one agency, are likely to be the most costly to others. This implicitly reflects the disproportionate costs of different incidents. On the other hand reporting will also be a function of the cost of reporting which will vary by type of activity, area and the people involved;
• with respect to recording without reporting by a directly affected party – e.g. where a local authority official records graffiti, there are two distinct problems, (i) the evaluation of whether or not this is ASB has been done by a third party. Yet it is the costs to those that are affected that it is intended to estimate - and (ii) the count may reflect a ‘stock’ of problems rather than a ‘flow’ of those behaviours which happened on the day of the count;
• reporting and recording is likely to be strongly related to views as to whether anything is expected to happen as a result of reporting/recording – as there are no direct benefits to the process itself.
These factors can generate major biases in calculating levels of activity and cost which raise issues in interpretation. In particular: • one important question for policy makers is whether, with respect to the September
10th count, there should be any grossing up either for omitted localities or for under reporting/recoding. Given how little is actually known, it would probably be most appropriate to limit the assessment to the actual count (but see section 4);

8
• counting the number of activities is only part of the problem of measuring incidents. In addition, we need some idea of the numbers of those affected and how. If a direct measurement is to be undertaken one would ideally want to know: (i) the number of direct victims and the extent of their distress; (ii) the number of indirect victims – i.e. who felt distress by the fact that others/
the neighbourhood were affected or by the fact that ASB had occurred – e.g. in terms of fear of crime/the look of the neighbourhood. Again, ideally one needs evidence of the extent of their distress.
These could be averages (e.g. on average intimidation might be expected to affect one household but everyone around or within the estate feels some distress) or they could be categories – e.g. criminal damage could at the limit be associated with death; with damage requiring demolition; or with minor damage. Table 3.2 gives some idea of the likely possibilities with respect to type of victims and the nature of damage/distress. As such it defines a framework for determining the costs of ASB. In terms of measurement, what will actually be possible will depend on the information available. If, as seems likely, it is not possible to measure victims and those indirectly involved from the evidence available, alternatives will have to be sought. These could be in the form of estimated average impacts based on general evidence or could involve proxy measures of different types. In particular, these could involve costs of alleviating the results of ASB, which are often borne by third parties such as the local authority, the police of the RSL.

9
Table 3.2: Template for identifying/measuring costs of activities deemed to constitute ASB Column 1 Behaviour
Column 2 Direct Victims
Column 3 Indirect Victims
Column 4 Wider Impact
Drug/substance misuse and dealing
None in ASB terms Those immediately affected by sight/ noise/other ASB that follows from its occurrence
Attitudes to neighbourhood Fear for children Fear of crime etc.
Street drinking; begging
Those accosted/ threatened
as above as above Liveability reduced
Prostitution; k-c, sexual acts
Those directly accosted as above as above
Vehicle related nuisance
Those whose vehicles are affected/anyone injured or shaken
Those who live in area and are subject to higher risks to property/person
as above
Abandoned vehicles None in ASB terms Those affected by sight; or by other activities which occur as a result (including more abandoned vehicles)
Potential growth in activity → worsening neighbourhood etc.
Noise Those who hear the noise and suffer from it (not all people dislike noise)
None in ASB terms except to extent that one noise event may lead to another
Changing view of neighbourhood/ capacity to control children etc.
Rowdy behaviour Those who come in direct contact/suffer
as above as above
Nuisance behaviour as above as above as above Hoax calls Those receiving calls Those who have to
look after those affected – family friends etc.
Those whose fear of hoax call style activity is increased
Animal related problems
Those directly affected by physical contact
Those who walk along street etc (also noise?)
General fear levels increased; distaste for area
Intimidation/ harassment
Those directly intimidated/harassed
Witnesses; those who help or those affected; family, friends
General fear, refusal to go out, value of home reduced for individual
Criminal damage/ vandalism
Those whose property is damaged
Witnesses; those who have to take additional precautions
Fear/ liveability etc.
Litter/rubbish Those who are directly affected by sight of litter and rubbish. Those to clear it up
None in ASB terms except to extent leads to other occasions
General attitude to area/liveability
10
4. Incidence and importance of anti-social behaviour 4.1 Trends Although the term ASB may only have become prominent in recent years, the activities to which it commonly refers have always existed (Armitage, 2002). There is some evidence, however, that the incidence of ASB is increasing and that concern about these behaviours is also growing. Ganderton (2000), for the Housing Corporation, stresses how tackling ASB is no longer a marginal activity for housing management staff. For instance, over the two-years period 1996-1998, RSLs had seen an increase in the number of ‘notices of seeking possession’ for nuisance of 126%. More broadly in the period 1996-1998, the number of ‘notices of seeking possession’ and possession summons issued on the ground of ASB more than doubled (Hunter and Nixon, 2002). Disorder offences represent a growing proportion of total police incidents – calls to the police for these offences increased by 19 per cent between 1995-98 (Audit Commission, 1999). Eighty per cent of landlords state that legal action was used more frequently in cases of ASB now than five years ago (Nixon et al., 1999). The Chartered Institute of Environmental Health Officers reported in 1997 that complaints about neighbours had risen by 50 per cent since in 1993 (Audit Commission, 1999). With the exception of noisy neighbours and litter, the percentage of people perceiving various disorders to be a big problem increased between 1992 and 2000. The proportion considering drug misuse to be a problem more than doubled (Budd and Sims, 2001). In Leicester, the number of reported cases of ASB was 1,377 (966 reported nuisance, 324 minor ASB and 87 major ASB) in 2002/3 compared with 1,115 cases in the previous year (http://www.leicester.gov.uk/newssite/newsview) British Crime Survey (BCS) data over the period 1992 to 2001/2 shows that there have generally been increases in the proportions of respondents saying various forms of ASB are a problem in their area. Equally, there are data which suggest that the picture is less clear. The British Crime Survey (BCS) 2001 reported a nine per cent reduction in vandalism between 1999 and 2000. Police recorded crime figures show a one per cent reduction in vandalism over the same period (Kershaw et al., 2001). Between 1997/1998 and 1999/2000, local perceptions of problems such as vandalism, hooliganism, graffiti and crime declined among survey respondents (Survey of English Housing (SEH) cited by DETR, 2000a) SEH data over the period 1992-1999/2000 show that the general trend has been for fewer people to highlight each behaviour– crime, vandalism and hooliganism, litter and rubbish, graffiti and noise – as a serious problem or as a problem at all in recent years.

11
In considering this evidence, it must be recognised that the lack of an agreed definition makes it difficult to obtain realistic estimates of the scale of the problem or to be confident about whether or not such behaviour is increasing. As Armitage (2002) points out, unless ASB is clearly defined, measurement and consequently patterns and trends, will vary. Also, there is the possibility that increases in recorded occurrence reflect greater awareness of the problem, changing government priorities and associated legislative changes. Further, differences in the direction of trends in perceptions of ASB revealed by different survey sources, such as the BCS and SEH, may reflect differences in question wording, sampling and/or survey context. 4.2 Scale of the problem A number of national surveys – including the BCS – show that ASB is a common problem. The British Social Attitudes (BSA) survey (1998) shows that rubbish/litter and teenagers hanging about were commonly experienced by two in five respondents and that vandalism and people selling drugs are common experiences for one in five (Reported in MORI, 2003). The Survey of English Housing (SEH) in 1999/2000 indicates that litter and rubbish is a serious problem for 13 per cent of householders, vandalism for 8 per cent, noise for 6 per cent and graffiti for 4 per cent. The comparable figures for those reporting these issues to be problems at all in their area are: 29 per cent; 32 per cent; 18 per cent and 18 per cent respectively. The BCS 2002/3 (Simmons, 2003) found that around one-third of respondents perceived the following to be a ‘very’ or ‘fairly’ big problem: vandalism, graffiti and other deliberate damage to property (35%); teenagers hanging around on the streets (33%); rubbish or litter (33%) and people using or dealing drugs (32%). Smaller numbers of people reported being attacked/harassed because of their colour (8%) and noisy neighbours or loud parties (10%) as a very/fairly big problem. One element of the national evaluation of New Deal for Communities (NDC) is a household survey of over 19,500 respondents living in 39 areas across the country selected for targeted funding (MORI, 2003). Inspection of the aggregate data suggests that there is a similar rank order of concerns to that which emerges in the BCS and SEH, with teenagers hanging about, litter and vandalism being most problematic. However, the proportion selecting each of the categories as serious – where comparative data exist – is higher in NDC areas than nationally. For example, litter/rubbish is seen as problem by 70 per cent in NDC areas compared to 42 per cent nationally. The comparative figures for teenagers hanging around are 69 per cent and 52 per cent and for vandalism/graffiti are 63 per cent and 40 per cent. Youth nuisance, drug-related activities, harassment, abuse/intimidation, crime, noise nuisance, vandalism, racial harassment and substance abuse are, in decreasing order, the behaviours which are perceived by social landlords to be the most serious forms of ASB. These sources of concern also appear to apply in the private sector (CRESR and CHP, 2003a). ASB is considered to be a medium-to-large problem for three out of four social landlords (Nixon et al., 1999). Some 250,000 neighbour disputes are reported each year to local authority and environmental health service departments in England and Wales (Dignan et al., 1996). One form of ASB which has received particular attention is alcohol-related violence. In a survey commissioned for The Portman Group by MORI in 2000, a quarter of respondents reported that they had been victim of alcohol-related violence – in most cases in a public house (cited in The Portman Group, 2002). Also, over half of the respondents considered that alcohol-related violence in pubs and on the streets was increasing. In order to try to ascertain

12
if this widely-held perception was correct, the Portman Group commissioned the Social Issues Research Centre to investigate how different agencies – the police, hospital accident and emergency (A&E) departments, town centre managers, representatives of CDRPs and others – approach the problem of defining, recording and measuring alcohol-related disorder (The Portman Group, 2002) Among the study’s principal findings is the widespread variation in the definition and the recording of alcohol-related violence and disorder by both the police and A&E departments. This makes the interpretation and comparison of available data difficult. The frequently made claim that 70-80 per cent of all late-night violence in town centres is linked to alcohol consumption cannot be empirically substantiated by police data - empirical studies conducted within hospitals suggest that the figure is substantially lower. The report concluded that current data recording practices and the lack of an agreed definition of ‘alcohol-related’ do not permit the nature and scale of alcohol-related violence and disorder to be assessed with any degree of accuracy. ASB is seen as a priority by the majority of local authorities (LGA, 2001). In a survey of over 320 authorities, ASB was selected as important by nine out of ten authorities in relation to their role in promoting community safety; over seven out of ten reported that they had or were developing an ASB policy; and two out of three had dedicated staff to deal with the problem of ASB. 4.3 Differential experience ASB is neither experienced uniformly across the country nor equally by everyone. There is evidence, for example, that ASB is particularly problematic in large metropolitan authorities and deprived neighbourhoods – typically urban and inner city areas; that it is linked to the broader issues of social exclusion, poverty and family breakdown; and that young people and vulnerable communities are particularly at risk (SEU, 2000). The NDC survey shows a high level of experience of ASB in deprived areas. In the last year, more than one in five (22%) have experienced damage to their property (14% incidence), intimidation (9% incidence) or racial abuse (4% incidence). Being a victim of any of these forms of ASB is associated with being more likely to say that all forms of ASB are a serious problem. This is particularly the case when asking about ASB factors that could be directly related to past ASB experience (e.g. vandalism) but also occurs in relation to unrelated issues (e.g. litter). According to MORI’s (2003) data, although the ordering of concerns shows considerable similarity across a number of surveys, the results may differ when local priorities vary across particular groups. For example, a survey with Black residents in Haringey shows that drug dealing is considered the greatest problem in this community (selected by 64 per cent), followed by muggings/street robbery and vandalism/theft from cars (each selected by 56 per cent). The results may also be different when the range of options is changed. For example, when the option ‘lack of things for young people to do’ was included in a survey in Oldham in 2002, this was the most frequently identified as a problem - selected by 70 per cent compared with 48 per cent for rubbish/litter and teenagers hanging around 44 per cent. Both the BCS and the NDC survey show differences between demographic sub-groups in their perceptions and direct experience of ASB (For more details see Budd and Sims, 2001). In the NDC survey – and in the country as a whole - those aged 65 or over are less likely to consider any of the issues to be serious problems. This probably reflects the lower levels of mobility of older age groups and therefore their lower experience of these type of behaviours.

13
People aged 16-24 in NDC areas are those most likely to be concerned about vandalism and graffiti. Asian residents are the ethnic group least likely to say that vandalism and graffiti are serious problems in their local area but are more likely to see a range of other problems - teenagers hanging around, litter/rubbish and drug dealing/use – as serious. In line with the analysis of BCS data, younger groups in the NDC survey are more likely to be victims. Those aged 35-54 are more likely to be victims of criminal damage while Black or Asian NDC residents are more than twice as likely to experience racial harassment as White residents. 4.4 Action to tackle ASB A range of legal remedies are available to tackle ASB but for many of them – such as eviction, injunction (or interdict in Scotland), tenancy agreements, covenants or title conditions, and noise control powers - there is scant information about the frequency of use. Similarly, although local authorities are developing innovative approaches to ASB, many of which take a problem solving approach and/or use novel solutions such as Acceptable Behaviour Contracts (ABCs), information is typically available only on a case study basis (Lucas and Whitworth, 2002). Action against ASB can also be taken through the civil courts, using ASBOs, but there is a clear overlap between serious ASB and crime and, in some instances, action will be taken in the criminal courts. For example, in 1998 over 59 thousand defendants were proceeded against for criminal damage offences (80 per cent of whom were male); nearly 67 thousand for public order offences; and nearly two thousand for intimidation or harming of witnesses, jurors and others (SEU, 2000). 4.5 Significance of anti-social behaviour Irrespective of whether or not ASB is increasing and whatever its current level, ASB is a non- trivial issue. There is evidence that minor ASB can lead to more serious ASB (Wilson and Kelling, 1982) and can act as a catalyst for more serious crimes (Skogan, 1990). The link between disorder and crime is supported by findings of the BCS 2000, which suggest that areas in which respondents perceived disorder to be highest had the highest levels of actual crime (Budd and Sims, 2001). Research also suggests that ASB can increase fear and social withdrawal and undermine residents’ ability or desire to exercise control over the situation (Skogan, 1990). By resulting in exclusion from school, eviction and involvement in the criminal justice system, ASB can increase the level of social exclusion experienced by perpetrators and their families (Nixon et al, 1999). Finally, ASB can be costly for a wide range of people including individuals and families, communities, organisations and agencies – such local authorities and social landlords - and businesses. The range of people involved is of particular importance, especially if the aim is to measure the costs of ASB directly. In some cases there are direct victims who suffer distress caused by the behaviour and the fact that the ASB is aimed at them. In all cases there are those who suffer as a result of the ASB occurring – e.g. because the fear of crime/distress is increased or their immediate neighbourhood is affected. There are also a broader category whose attitudes to liveability in the area may be affected. These are all victims. In addition, the household of the perpetrator may suffer because of the impact both of the ASB on their own comfort and distress but also because of the response to that ASB e.g. when an eviction order is issued.
14
4.6 Implications for costing Evidence on the incidence and importance of ASB has a number of implications for costing: a. the scale of the overall cost clearly depends on how ASB is delineated – notably with
respect to its relationship to crime; b. ASB which directly affects other people e.g. the case of criminal damage or
neighbourhood disputes can be seen as rather different from ASB where the impact is more generalised. It should also be remembered that sometimes there is an interaction and direct victims and perpetrators are not separable from one another;
c. an important aspect of ASB which may increase its costs in relation to concentration of
activity is the ‘broken-window’ syndrome – the hypothesis that one ASB activity leads to another and that the process thus builds on itself;
d. on the other hand there is some evidence that the greater the level of problem the less
the cost of the additional incident to the victim; e. in part because of the recognition of ASB as a definable and separate set of activities
there is growing qualitative evidence of both its importance and concern that it is an increasing menace;
f. even so there are few direct measures available of either extent or costs.

15
5. A framework for estimating costs of ASB 5.1 Estimating costs In principle estimating the costs of any activity involves three distinct elements: (i) defining the activity; (ii) determining the resources necessary to achieve that activity; and (iii) clarifying the cost per unit of resource. This allows an estimate of both the cost per unit of activity and the total cost of a given level of activity. The calculation requires additional information if marginal costs – i.e. the costs of an additional unit – vary, being either less or more than the average cost. In this case for each level of activity, there will be a different average cost. An important distinction is between the financial costs of an activity which include only actual payments made and the economic or real resource costs of the activity, which measure the opportunity cost of the resources involved in producing an activity. These two measures will only be the same when all resources are priced and the price paid for resources measures the value in their next best use. Normally they will differ for a range of reasons including: (a) some resources will not be priced on the market – so values must be imputed e.g. a
person’s own time in assisting a victim; (b) some resources may be subject to additional constraints – so e.g. there may be a
limited amount of staff time so the value of what is given up may be higher than the direct financial cost of employment; and
(c) some prices may be subject to monopoly pricing, or other reasons why equilibrium is not achieved – e.g. hours worked by those who are unemployed are likely to have less resource cost than those who are employed.
If the objective is to measure the economic costs (which include social costs where real opportunities are foregone) then the value of all resources should be measured in opportunity cost terms and financial costs should only be used when they correctly measure these opportunity costs. There is an additional question that must be answered before an estimate can be determined: the costs to whom. Possibilities include the costs to the consumer (or producer); the costs to government; and the costs to society as a whole. It is the third of these that includes the full economic costs, including those to people indirectly affected. 5.2 Applying the general principles to ASB The fundamental difference between determining the economic (including social) costs of ASB and of activities in general is that ASB provides negative value. Measuring costs to victims and others is therefore about measuring the reduction in value that occurs as a result of the ASB activity. In some circumstances this may be imputed by a direct cost – e.g. the cost incurred by the owner of replacing the door that has been vandalised or of rebuilding the house that has had to be demolished. Even here there will be problems of estimation – if the door replacement is done by an outside firm there will be a price; if it is done by the owner, in principle, one wants an imputed cost of labour plus materials. In many other cases there is no direct activity that reflects the replacement of the value lost. Instead there is the reduction in liveability, or other lost value, which must be measured by some other means. As such, instead of relying on the literature on different measures of cost,

16
the relevant conceptualisation is that relating to benefits (in this case loss of benefit). To achieve a full costing based on this approach would require: (i) a clear understanding of all those affected by the incident of ASB; and (ii) a measure, either directly from those affected or from a proxy of behaviour e.g. the
impact on relevant house prices of persistent ASB problems in an area. Thus, for example, if there is a spate of rowdy and nuisance behaviour there may be (a) some physical damage the costs of which can be estimated by the cost of replacement/repair (b) some damage to people in terms of e.g. additional stress, involving visiting the doctor, prescription medicine, counselling etc. which could in principle be measured by the costs of doctors and counselling time, drugs etc. and (c) more general distress which is not directly addressed but reduces the quality of life which can only be measured by survey asking for imputed monetary value by appropriate compensation, or by a proxy relating to perceived value of the area. 5.3 The elements involved in assessing the economic and social costs of ASB A framework for evaluating the economic and social costs of ASB would thus involve seven basic stages: Table 5.1: Stages in the evaluation of economic and social costs of ASB Stage 1: Define categories of ASB and the numbers of ASB occurrences in each
category Stage 2: Clarify the outputs/outcomes of each category of ASB Stage 3: Specify the groups affected by each category of ASB and the numbers in each
category Stage 4: Assess the reduction in welfare associated with each ASB occurrence by
category of ASB/category of victim Stage 5: Determine any significant non-linearity in impact of different levels of
occurrence Stage 6: Estimate costs of bringing value (welfare) back to original level distinguishing
(i) direct resource costs of amelioration to original level (ii) direct resource costs of non-amelioration (e.g. additional vacancies/turnover) and (iii) reductions in individual welfare that are not included in (i) and (ii) measured by compensation that victims would expect or other proxies of reduction in value
Stage 7: Sum all costs to estimate costs of ASB The distinction made between economic and social costs in the original specification needs to be clarified. Economic costs take account of all real resources (including losses in value) that occur as a result of the activity of ASB. As such they include both any direct costs involved and any intangible costs whether borne by the victim, those who deal with the problem (although here great care must be taken not to double count costs both in terms of their occurrence and their amelioration – only the least cost way of measuring/addressing the reduction in value should be included), and those who are indirectly affected e.g. by changes in their attitude to living in the neighbourhood. Social costs in terms of the specification are seen as what economists would call externalities – i.e. those costs borne by those not directly involved in the “transaction”. They should be clearly distinguished from ‘private’ costs – those borne by providers and consumers directly involved. The two types of cost – ‘private’ (or direct) and external (or indirect) together make up economic costs – i.e. the costs to society of ASB.

17
Estimating costs by the seven stage method set out above could in principle provide an estimate of the cost of each identified category of ASB and by summation the overall cost of ASB. Finally it should be noted that this provides a measure of the cost of ASB; not of alleviating or reducing the extent of ASB. 5.4 Problems in evaluating economic costs of ASB This approach however raises major issues of both principle and practice; (i) different types of ASB are clearly associated with different potential costs (as is
reflected in Table 3.2); (ii) some types of ASB have very little direct costs of themselves but may become more
costly if persistent; (iii) the ‘broken-window’ hypothesis implies that concentrations of ASB of similar or
different types are likely to feed on themselves, increasing the marginal costs of additional ASB activity;
(iv) those measures of cost which relate to undertaking activity to put back value may or may not actually take place. They should in principle be included in terms of the least opportunity cost means of achieving a return to the pre-existing value. In some cases, however, they may be measured by the impact of non-amelioration e.g. the cost of additional vacancies and their impact on the estate. The financial costs actually incurred are unlikely to reflect this economic cost both because what is done may not be the least cost approach and because in many cases such alleviation will not take place;
(v) when measuring reductions in value, market prices – e.g. in terms of house prices – reflect not only people’s understanding of the situation – and expectations of how this situation will develop, but in particular the income distribution of those affected and the choices available to the relevant group. Thus, the poorest households will normally value the negative impact much less in money terms than middle-income households and will accept lower compensation to offset their costs. Equally, households in the social sector who generally have limited choices in relation to their housing may value their costs less than those who have invested in their homes. Finally, those who regard ASB as a more normal environment may attach a lower value to the disbenefit of additional incidents than those who have less experience. Measures of cost that directly measure people’s own estimates of loss are therefore heavily dependent on experience, opportunity and income. This may imply that third party values could provide a better estimate of society’s costs;
(vi) a rather different problem relates to the fact that people have very different attitudes to the specifics of ASB. Some people may see a small amount of litter as reflecting the decline of the area and imposing high costs in terms of future outcomes; another set of people may not even notice the litter. The problem is exacerbated to the extent that perpetrators and victims may often be the same people, while others may be directly and indirectly affected by all perpetrating groups. In practice some form of average is likely to be the only solution. But, this still implies detailed measures of people’s attitude in money terms and knowledge of who is affected.
All of these problems mean that any assessment of the cost of ASB is likely to be hedged around with caveats at least until there is much greater understanding of the impact of particular behaviour and activity levels not just on agencies that have to address the outputs and outcomes but also on those individuals affected. These can only be measured very imprecisely by proxies – however good those values in themselves – until the relationships between inputs (ASB behaviour) and outputs/outcomes (reductions in value/welfare in different ways) are better understood.

18
The day count of ASB can only provide information (and even that partial) about stage 1 and 2 (cf Table 5.1). It provides no direct information about any of the other stages. 5.5 Financial Evaluation A rather different approach would be one which concentrated more directly on the financial costs of ASB in terms of the costs incurred by different agencies in alleviating the outputs/ outcomes of ASB and of dealing with the perpetrators. This is (i) dependent upon the choices made by agencies in terms of their ASB strategies and (ii) does not of itself include the costs incurred by direct and indirect victims which are not subject to alleviation/enforcement. The benefit of this type of approach is that it can, at least in part, be made consistent with the evidence that is available from the different agencies involved. As such it would consist of the following six stages: Table 5.2: Stages in the evaluation of financial costs to agencies of ASB Stage 1: Delineation of ASB (clarifying the major categories where costs of alleviation
differ) Stage 2: Measurement of the levels of ASB activity/activities) occurring in the relevant
area covered (e.g. neighbourhood, local authority, nationally) Stage 3: Estimation of the costs incurred by different agencies – e.g. the local authority;
housing associations involved in controlling and alleviating ASB (in general or by category); the police and fire service. Note: this could and should include owner-occupiers, employers etc. in order to cover all financial costs rather than simply those of the social sector
Stage 4: Estimation of the costs incurred in dealing with perpetrators where these are additional to stage 3
Stage 5: Sum of costs measured in stages 3 and 4 in relation to the level of activity of each category of ASB and of total activity; and, ideally,
Stage 6: An estimate of the marginal cost of reducing ASB activity by a given quantity or percentage point
This approach is very much a measure of the costs incurred in addressing ASB – by alleviation and enforcement. At its simplest, the approach would only include the financial costs incurred. It could however be made more consistent with an economic approach by including opportunity costs rather than financial costs where these clearly differ and, in particular, by including imputed costs where the resources involved are not marketed. As it stands this approach includes no measure of the costs to victims either direct or indirect. It simply includes what third parties (i.e. different agencies) regard as the most appropriate means of addressing the problem, given their priorities and resources. This is an important limitation, especially in areas where resources are strained. In particular, it excludes costs where no alleviation takes place. However, the approach is more clearly consistent with the types of evidence available on the costs of ASB which mainly relate to the costs borne by relevant agencies that keep records accounting for their expenditure. One way of including a measure of the costs borne by victims is to assess the compensation that people might be prepared to accept for their continued losses (i.e. excluding those that had been alleviated). Available compensation estimates do not address this directly but again provide some third party evaluations in certain cases of greatest direct impact.
19
5.6 Current approaches to evaluating costs There have been at least two attempts to delineate the costs in the UK literature – by Elaine Ganderton (2000) for the Housing Corporation and by Atkinson et al (2000) for the Scottish Executive. Both are partial in their coverage and intent. Neither provides any direct evidence of costs. Managing nuisance, harassment and ASB (Ganderton, 2000) sets out some of the costs that should be included from the point of view solely of RSLs. It concentrates on how these costs should be identified and accounted for. It raises three main issues:
1. Identification of the total costs of ASB to the organisation is made difficult by the already existing coding structures. The costs of ASB could include, amongst others:
- lost rental income from voids - maintenance costs for void and tenanted properties - service costs for communal areas - legal costs - compensation payments - rehousing costs - mediation and support services - staff time - increased insurance premiums and higher excesses.
These exclude costs to residents, to the wider community and to other agencies as well as less easily quantifiable costs to the health and well-being of individuals affected.
2. The report advises on the need to put in place policies and procedures to tackle ASB effectively, which involves substantial infrastructure and resource requirements. The suggested strategy requires:
- resident involvement - awareness raising - skills training - budgeting, coding and accounting framework - performance monitoring system - jobs structure and workload management - updating occupancy agreement to include ASB clauses - establishing partnerships.
All these activities cost but often do not vary with the level of ASB above a certain threshhold.
3. In setting up a budgeting, coding and accounting framework, the following costs have to be included:
- legal costs - costs of other specialist services, such as mediation - repair costs to rectify vandalism and abuse of individual properties and
communal areas - security costs - void costs when properties are difficult to let because an area has a poor
reputation for ASB - staff time spent on dealing with ASB - staff absence due to stress from ASB related problems - costs of redesign and improvement schemes to improve security and reduce crime - residents involvement costs - insurance costs

20
- costs of dealing with increased stock turnover in areas with a poor reputation for ASB.
As such it provides a list of some of the costs incurred by the RSL in addressing ASB, clarifies the type of strategy the RSL might put in place, and therefore the investment necessary to implement a strategy and specifies the accounting codes that would be appropriate. There is no evidence that this approach has actually been put into practice to the point of providing any estimates of cost. The discussion of the use of legal remedies for neighbour nuisance in Scotland (Atkinson et al., 2000) simply sets out a classification of the types of costs associated with neighbourhood nuisance, separating out costs to landlords and to other agencies arising directly from the ASB and from consequentials of that ASB. At an organisational level they clarify the costs as: Table 5.3: Types of costs arising from neighbour nuisance Direct costs to landlords - Housing staff time spent dealing with neighbour complaints
by housing officers, area managers, senior staff, caretakers - Costs of implementing initiatives and on-going costs associated with these
Additional Direct Costs - Legal costs for advice, interdicts. Eviction action - Costs of repairs for vandalism and graffiti - Staff time of homeless and allocation staff in dealing with requests for transfer
Indirect Costs - Loss of rental income due to additional voids - Voids security and repairs - Reduction in desirability of property (reduced market value/reduction in demand) - Opportunity Costs: diversion of staff time from other work - Increase in staff stress related illness from work
Societal Costs - Costs to disputants and other residents - Costs to other departments/agencies including police, social work, environmental health, courts - Decrease in social cohesion and loss of informal social control
Source: Atkinson et al (2000) They point out that there may be other outcomes which cannot be given a monetary value, but can be assessed qualitatively, such as reduced demand for an area as a result of its reputation for neighbour problems and reduced tenant satisfaction (the cost to the community). 5.7 Conclusions • The principles involved in costing ASB are fairly well understood although they do
raise particular issues because so much of the cost is associated with reductions in welfare rather than the use of resources.
• There are clear distinctions to be made between measuring the costs of ASB and the
costs of alleviating that ASB. Equally, distinctions need to be drawn between addressing the general impact of ASB (e.g. through the effect on house prices) and measuring levels of activity and the impact of specific types of ASB.
• While it would be highly desirable in principle to measure the costs of ASB in the
ways set out in section 5.3 above, our level of understanding of the nature of ASB, let
21
alone its impact on different groups of individuals, makes this impractical at the present time (although something to be strived towards as understanding of ASB improves).
• In practice, a measure of costs which starts from actual expenditures (including where
appropriate imputed costs) to agencies is probably all that can be achieved in the short run. This provides only a measure of actual costs of alleviation to agencies. As such this will not generate a measure of the true economic cost of ASB both because current expenditures are not optimal and because it excludes costs that are not alleviated, notably with respect to reduced liveability. Estimates of these can only be obtained by analogy and proxy – and will in particular require some understanding of the numbers of people affected and the extent of distress.

22
6. Evidence on the costs of ASB 6.1 Differential vulnerability The impact of ASB, and hence the costs of ASB, are likely to be higher than average for certain groups of people. Such groups would include the poorest individuals and families who are least able to move away or bear the cost of ASB; those who are already discriminated against (e.g. ethnic minorities or homosexuals) who may have fewer support networks or be less willing to ask for help; young people who can be an easy target for negative peer group pressure or who are vulnerable because they are outside traditional support structures such as school or work; and other vulnerable people, such as older people, women and disabled people – i.e. some of the people most affected by fear of crime. For example, there is very convincing evidence that, even though they are not the main perpetrators, women may suffer disproportionately from ASB. This is particularly because, regardless of the difficulty and, in some cases, the impossibility of controlling the behaviour of their teenage sons or boyfriends, women are deemed responsible for the behaviour. Hunter and Nixon (2001) for instance showed that two out of three (64%) households involved in ASB had dependent children - compared with one in three households (34%) for tenants of social landlords – and that one in two (58%) are lone women-headed households, the majority of which (77%) involve lone mothers having sole responsibility of their children. Such households may suffer acutely from the initiation of punitive action (e.g possession) rather than the development of remedial interventions. 6.2 Sources of cost estimates There is evidence in the research literature of a range of sources of costs but, in the majority of cases, the evidence is correlational – i.e. there is evidence of a relation between particular forms of ASB and dissatisfaction, neighbourhood decline, decreased liveability etc. - and does not yield cost estimates. There is evidence that disorder is related to dissatisfaction and plans to move, suggesting that ASB can undermine stability and confidence in an area’s housing market (Skogan, 1990; Hope and Hough, 1998). The Policy Action Teams on Unpopular Housing (PAT 7) and on Anti-social Behaviour (PAT 8) both recognised that ASB, if left unchecked, can lead to neighbourhood decline, destabilising areas as people move out, sometimes abandoning housing. Research by DTLR (2000b) on low demand housing and unpopular neighbourhoods found that housing practitioners across all sectors also perceive ASB and fear of crime to be among the most important causal factors of low demand. ASB can also affect the success of local businesses and it can be expensive or impossible to repair the damage to the viability of the firms involved, as well as impacting adversely on future investment. MORI’s (2003) research study of ASB for the Home Office, which draws on a range of sources about ASB, provides evidence of the impact and consequences of ASB, and hence its associated sources of cost in terms of liveability and other aspects of quality of life. As the report notes, it is difficult to untangle cause and effect but, there is evidence that ASB is strongly associated with lower quality of life and satisfaction with area. Analysis of the BCS 2000 showed that the five forms of ASB which were most frequently cited as having a negative effect on quality of life were: teenagers hanging around (15%),
23
rubbish or litter (12%), vandalism and graffiti (10%), noisy neighbours (8%) and people using drugs (6%) – the BCS 2000 did not include drunk or rowdy behaviour as an option. Evidence from the GLA London Housing Survey undertaken in 2000 showed that, among social tenants expecting to move, 42% saw crime as a serious problem in their neighbourhood with vandalism and hooliganism only slightly less important at 40%; presence of drug dealers/users were a serious problem to 37% and litter and rubbish problems to 36% (GLA, forthcoming). Comparison of perceived levels of disorder with reported negative impact on quality of life shows a very clear link between the perceived amount of disorder and the impact on quality of life. Further analysis in terms of CACI ACORN groups shows that, while more deprived areas have higher levels of perceived disorder and impact on quality of life, it is more affluent people living in deprived areas (e.g. better off executives in inner city areas) who are often among the most negatively affected. This finding is in line with findings from other surveys, such as the SEH. In general, those in lower social classes tend to be less satisfied with their area as a place to live - not surprisingly as they live in poorer areas – but the least satisfied groups are higher social classes living in deprived areas. As MORI pointed out, this pattern is likely to be linked to the higher expectations of this group, as well as their more mobile lifestyle and therefore greater likely experience of ASB. In line with the BCS findings, analysis of data from the NDC and other local surveys shows that people who say that various forms of ASB are serious problems in their area are also more likely to feel unsafe. For example, of the NDC residents who feel that teenagers hanging around is a serious problem, 68 % feel unsafe outside on their own after dark. This group accounts for half of all people in the NDC area who feel unsafe alone after dark. This might appear contradictory with earlier findings that older people consider ASB less of a serious problem than those in younger generations. However, the survey on the impact on safety considers the responses of four groups (those who think teenagers hanging around a serious problem; residents who had been deliberately hit in the last 12 months; NDC average; BCS average) which are likely to be biased against older groups. In addition, if the various forms of ASB considered in the survey include only the top 5 responses (teenagers hanging around; litter; vandalism; drug dealing and use; disturbance from crowds and hooliganism) and not, for instance, people being attacked or harassed, the feeling of security among older groups might also be underestimated. Analysis of the NDC survey data also serves to highlight the link between views of different forms of ASB as problems and satisfaction with area as a place to live. Those dissatisfied with areas are much more likely to see each issue asked about as a serious problem. No one aspect appeared to be more closely related to area dissatisfaction. For example, among those who were dissatisfied 61 % saw teenagers hanging around and 55 % saw litter as problems, while among those who were satisfied, 29% saw both teenagers hanging around and litter as serious problems. However, it must be emphasised that these data do not provide any information about the direction of the relationship or the role of any mediating variables. 6.3 Cost estimates Data relating to the costs of ASB are limited but there are a range of estimates which relate to individual elements of ASB, such as criminal damage, vandalism and neighbour nuisance. There is also some work which estimates the costs of criminal offences and crime in general, which are likely to provide some insights into the costs of ASB.
24
Vandalism Bradford LA estimates that vandalism to LA owned property in 1998-99 cost £895,593 (SEU, 2000). According to the ODPM website, Bradford owned 25,552 dwellings in April 2002. Using these data, the average cost of vandalism per dwelling is £35. However, these costs would have been concentrated on a small proportion of these properties – implying a cost per incident of at least ten times this amount and maybe very much higher. Direct costs to the victim and criminal justice system of vandalism were estimated in £450 per case. The total cost, based on the number of incidents reported in the British Crime Survey, exceeds £1.3 billion (SEU, 2000). The British Transport Police (BTP) (2003) reports on the cost of graffiti. The figures go from £5,000 - being the fine given to a vandal for a series of attacks on the Tube in South London - to £63,000 for the damage created to Northern Line trains by a 19 year old offender. The BTP also estimates direct costs alone, not including indirect costs of lost revenue and delays, to be at least £5 million a year. London Underground Limited’s direct costs are at least £2 million per annum, borne by paying customers. Some 70,000 staff hours a year are spent just cleaning off graffiti. The London Assembly Graffiti Investigative Committee (London Assembly, 2002) estimated the total cost of graffiti in London to be over £100 million per annum. Costs go beyond just removing the graffiti and include damage to economic development and loss of capital values to people’s homes. Expenditure by London Boroughs and transport companies has been estimated in £13 million per annum. The average per Borough is £203,694 with Wandsworth (£625,000), Lambeth (£600,000) and Lewisham (£390,000) having the highest figures and the Corporation of London (£1,500) and Tower Hamlets (£10,500) having the lowest ones. Among the transport companies, London Underground suffers the highest cost (£2,500,000) and Metroline the lowest one (£20,000). The Committee reports that the City of San Diego state the American public spends nearly US$12 billion per annum fighting graffiti. “If this cost were extrapolated to London, taking into account weighting for population and exchange rates, London could be spending anything up to £200m per annum”. Gateshead Council (2003) estimates that the annual costs of providing the service of removing graffiti and flyposting for the Council’s Local Environmental Services has been £50,000. The Council also estimated the annual repair costs and graffiti removal to bus shelter at £100,000, while the cost of replacing a bus shelter has been on average £2,000 per bus shelter. Alcohol Consumption Dubourg et al. (1996) review the literature on the social costs of alcohol consumption. They report the study by McDonnell and Maynard (1985) in which the total resource costs of alcohol misuse in England and Wales (1983 prices) had been estimated in £1614.50 million (including unemployment and premature death). The figure was broken down as follows:
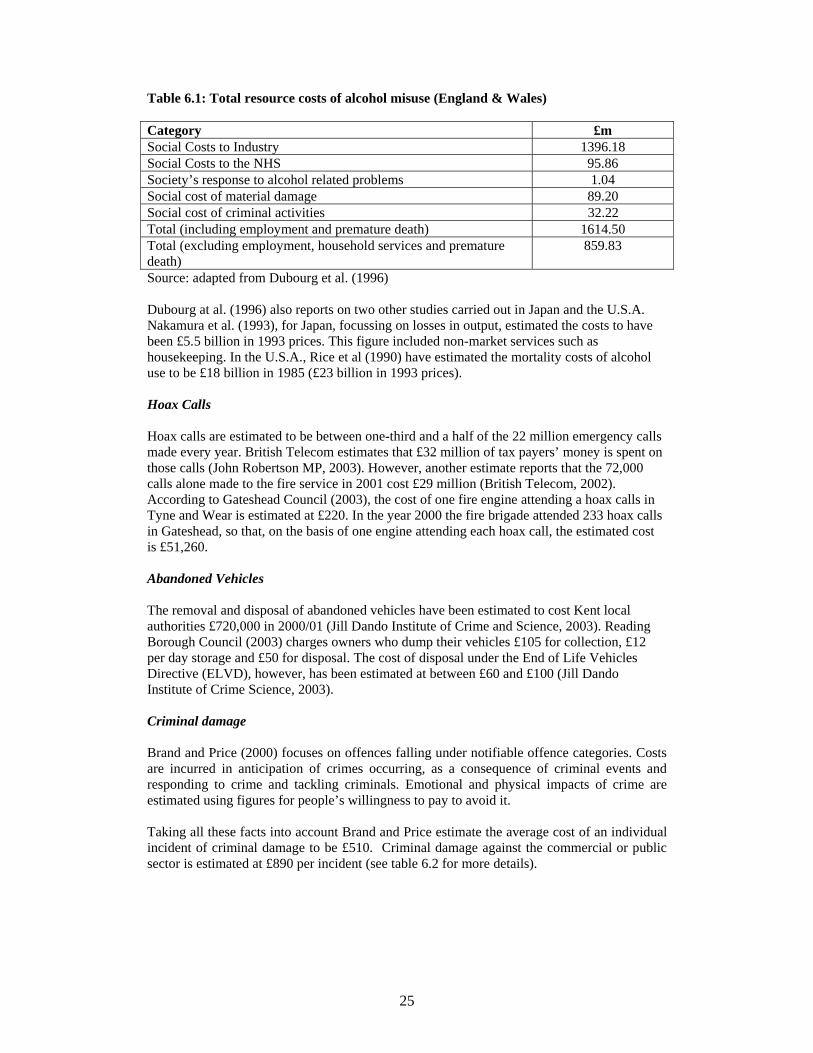
25
Table 6.1: Total resource costs of alcohol misuse (England & Wales) Category £m Social Costs to Industry 1396.18 Social Costs to the NHS 95.86 Society’s response to alcohol related problems 1.04 Social cost of material damage 89.20 Social cost of criminal activities 32.22 Total (including employment and premature death) 1614.50 Total (excluding employment, household services and premature death)
859.83
Source: adapted from Dubourg et al. (1996) Dubourg at al. (1996) also reports on two other studies carried out in Japan and the U.S.A. Nakamura et al. (1993), for Japan, focussing on losses in output, estimated the costs to have been £5.5 billion in 1993 prices. This figure included non-market services such as housekeeping. In the U.S.A., Rice et al (1990) have estimated the mortality costs of alcohol use to be £18 billion in 1985 (£23 billion in 1993 prices). Hoax Calls Hoax calls are estimated to be between one-third and a half of the 22 million emergency calls made every year. British Telecom estimates that £32 million of tax payers’ money is spent on those calls (John Robertson MP, 2003). However, another estimate reports that the 72,000 calls alone made to the fire service in 2001 cost £29 million (British Telecom, 2002). According to Gateshead Council (2003), the cost of one fire engine attending a hoax calls in Tyne and Wear is estimated at £220. In the year 2000 the fire brigade attended 233 hoax calls in Gateshead, so that, on the basis of one engine attending each hoax call, the estimated cost is £51,260. Abandoned Vehicles The removal and disposal of abandoned vehicles have been estimated to cost Kent local authorities £720,000 in 2000/01 (Jill Dando Institute of Crime and Science, 2003). Reading Borough Council (2003) charges owners who dump their vehicles £105 for collection, £12 per day storage and £50 for disposal. The cost of disposal under the End of Life Vehicles Directive (ELVD), however, has been estimated at between £60 and £100 (Jill Dando Institute of Crime Science, 2003). Criminal damage Brand and Price (2000) focuses on offences falling under notifiable offence categories. Costs are incurred in anticipation of crimes occurring, as a consequence of criminal events and responding to crime and tackling criminals. Emotional and physical impacts of crime are estimated using figures for people’s willingness to pay to avoid it. Taking all these facts into account Brand and Price estimate the average cost of an individual incident of criminal damage to be £510. Criminal damage against the commercial or public sector is estimated at £890 per incident (see table 6.2 for more details).

26
Table 6.2: Total Cost estimates, by crime type and cost category
Source: adapted from Brand and Price (2000)
In anticipation of crime
(£b) As a consequence of crime (£b) In response to crime (£b) Total Security Insurance Property stolen Emotional and physical Lost Victim Health Criminal Justice Offence Type expenditure adm. or damaged impact on victims output services services system Crime against individuals and households 0.7 0.5 4.1 17.0 2.9 0.0 1.3 5.7 32.2
Violence against the person (£) 2 11,000 2,200 10 1,100 2,400 16.8 Wounding (£) 2 10,000 1,800 5 1,100 2,400 15.6
Common assault (£) 0 780 70 20 870 1.7 Sexual offences (£) 0 1,600 270 2 160 510 2.5
Robbery/Mugging (£) 0 20 130 990 180 2 80 580 2.0 Burglary in a dwelling (£) 460 140 1,200 770 60 5 680 2.7
Theft (£) 260 250 2,200 1,200 70 0 450 4.4 Criminal damage (£) 70.0 560.0 600.0 90.0 0.0 180.0 1.5
Commercial and Public sector victimisation 3.2 0.2 4.2 0.0 0.1 0.0 0.0 1.4 9.1 Fraud 1.1 10.3 0.6 13.8 Motoring/Other 0.7 0.2 0.0 3.9 4.8 TOTAL Cost of Crime 4.9 0.6 18.6 17.7 3.3 0.0 1.3 11.6 59.9
27
Criminal offences which lie outside the definition of ASB Brand and Price (2000) provide estimates of the costs of a number of offence categories which typically lie outside the definition of ASB. The offence categories considered comprise: burglary (dwelling and non-dwelling), vehicle crime (theft of, from and attempted theft), theft from a shop, other theft and handling, criminal damage (against individuals and households and against commercial or public sector property), homicide, violence against the person (serious and other wounding), sexual offences, robbery (of individuals and of commercial or public sector premises), and common assault. Clearly, this list is not exhaustive – several offence categories are not included. However, this work does provide a starting point for comparing the cost of crimes to society. Brand and Price (2000) found that that average cost estimates vary widely between categories of crime/offence. The most costly property crimes are theft of vehicles (£4,700 per incident). Burglaries are estimated to cost £2,300. Personal crimes are far more costly on average than property crimes. Homicides are estimated to cost at least £1 million and other violence against the person on average £19,000 per incident. Robberies are estimated to incur costs of almost £5000 on average and common assault, the least costly, is around £500 per offence. Whilst cost estimates of crime can be useful, they should be treated with considerable caution. As Brand and Price (2000) point out, although the estimates they provide are the best estimates of costs given the information available, they are inevitably imprecise and are sensitive to changes in assumptions made or to improvements in the quality of the supporting data. They argue that better estimates are needed of the emotional and physical impact of crime on its victims, the impact of crime on quality of life and fear of crime, the cost of precautionary behaviour, health service costs, costs to offenders and their families and police costs. These are precisely the sorts of estimates that are relevant when assessing the full costs of ASB. Moreover, average cost estimates are, by definition, aggregations of crimes with widely different impacts. Thus different crimes within the same offence category will have vastly different costs. These and other potential pitfalls in using average cost of crime estimates identified by Brand and Price (2000) highlight the complexities of undertaking cost-benefit analyses of crime reduction initiatives. (These are also explored in Dhiri and Brand, 1999). Brand and Price (2000) conclude that further work needs to be done before average cost of crime estimates can be used with any degree of confidence in the cost benefit analysis of crime reduction initiatives. ASB and housing management Incidents of ASB have very high costs for housing management mostly in terms of staff time. Aldbourne Associates (1993) found that the 20 per cent of social landlords management time was spent dealing with complaints about neighbours’ behaviour. The Housing Corporation (Ganderton, 2000) reports that staff estimate they spend around 40 per cent of their time on ASB problems. CIH in Scotland estimates that between 5 per cent and 40 per cent of staff time is spent on dealing with neighbour complaints (Scottish Executive, 2000). Dignan et al. (1996) estimate that housing officers’ time devoted to dealing with neighbour disputes varies depending on the type of department, ranging from over 20% in a City department to 5% in a housing association department. The estimate is 18.3 % for a
28
district/borough, 17.5% for a metropolitan authority department and 13.8% for a London borough. Overall, the average is 17.5%. It is important to recognise that not all neighbourhood disputes would necessarily be defined as ASB – especially when confined to a small number of neighbours in conflict with one another. However, it is likely that a significant proportion would be – suggesting that ASB is extremely time consuming. This type of cost can be measured by staff time as long as it is possible to clarify the definition of what is included. Equally, it would be desirable to know more about the extent of concentration of problems and what percentage of properties are affected, so that it is possible to provide a better basis for measuring the impact of ASB on others. ASB and CDRP time Little is know about the time devoted to dealing with ASB by CDRPs. However, according to a study of alcohol-related violence and disorder, for the majority of CDRPs, the amount of work directed at alcohol-related issues amounts to less than 30 per cent of their total activity (The Portman Group, 2002). ASB and town centre management time Similarly, little is known about the time spent dealing with ASB by town centre management. In the majority of cases around 10 per cent of town centre managers work was devoted to alcohol-related issues, while 5 per cent of town centre managers compiled reports of alcohol-related incidents (The Portman Group, 2002). ASB and demolition of property PAT 8 highlights that ASB attracts a variety of direct costs with demolition of recently built property and the reduction of the value of assets to zero being perhaps the most extreme (SEU, 2000). The cost of demolition has been estimated at around £5,000 per dwelling. This figure is in addition to the significant cost of re-landscaping the site and compensating previous tenants or owners. The estimate is conservative as it only includes direct costs – it does not include the cost of re-housing. In some areas it would be correct to include only the costs of demolition and landscaping as properties are in low demand areas. In others, it should include the cost of rebuilding to house a family. In both cases there are other potential costs to the public, such as the ones determined by the damage to public goods and utilities. The choice of management method is likely to reflect the demand conditions in the area and full demolition would only be used in extremis in areas of high demand. However, renovation is likely to be as or more costly (See Dignan et al, 1996). ASB and the costs of legal action and other forms of intervention PAT 8 suggests that the estimate of legal cost to local authorities could be around £10,000 per case (SEU, 2000). This estimate derives from the study of neighbour nuisance, social landlords and the law by Hunter et al (2000). Hunter et al (2000) identify three categories of ASB as warranting consideration for legal action:
- low level but persistent behaviour; - behaviour causing severe distress; and - behaviour having an adverse or potentially adverse effect on the wider
neighbourhood.
29
According to Hunter et al. (2000), landlords generally have little idea about the costs involved in taking legal action, reflecting the lack of effective recording and monitoring procedures. Using the data that were available, their study found that the median cost for taking legal action for authorities was £10,400 (range between £142 and £305,338), while the median costs reported for RSLs was £4,000 (range between £500 and £80,000). The fact that the authorities’ costs were more than twice as high as the costs for social landlords arises because local authorities have to bear a higher proportion of the overall costs of legal action than do RSLs. Details of overall costs involved in taking legal action are not available and, where such information is gathered together, wide variations emerge. For instance, an undefended possession action can cost as little as £5,000 or £1,000 (£1,500 if the cost of officer time is included). The cost of possession tended to be estimated in the region of £3000 (but this becomes £4000-£5000 for private solicitors and £10000 if witnesses and a two/three day trial are involved). Injunction action was estimated to cost less than possession action, with the average in the region of £1000. If barristers’ fees were included, one local authority solicitor cited a minimum of £2000-£3000 for a successful defended case. PAT 8 (SEU, 2000) provides a break down of costs of intervention by LA housing departments: Table 6.3: Costs for local authorities Informal intervention £50 Special tenancy transfer (involving one party of dispute) £824 Case involving legal advice but stopping short of court action £365 Notice to seek possession served £596 Application for injunction £1,239 Granting of (contested) possession order £3,908 Dignan et al (1996) take a case by case approach in their comparative analysis of the cost effectiveness of mediation and alternative approaches to dealing with neighbour disputes. In one case, the conflict is estimated to have cost one of the disputants over £1 million comprising: Table 6.4: A case study Cost of legal action already undertaken and paid for £250,000 Bankruptcy claims £363,484 Cost of bankruptcy fees £200,000 Legal aid to be repaid (estimated) £200,000 Outstanding claim by another pair of residents £86,441 Outstanding claim by a firm of London builders £76,363 Total £1,176,288 Source: Dignan et al (1996) In another example, the neighbour dispute costs incurred by a council over a twelve month period had been £49.27 per case (117 cases with 1.74 average hours per case). The imputed cost (i.e. taking account of other resources employed) was £245.18, five times greater. In another example, the direct cost of involvement was estimated at £911.42, while in another
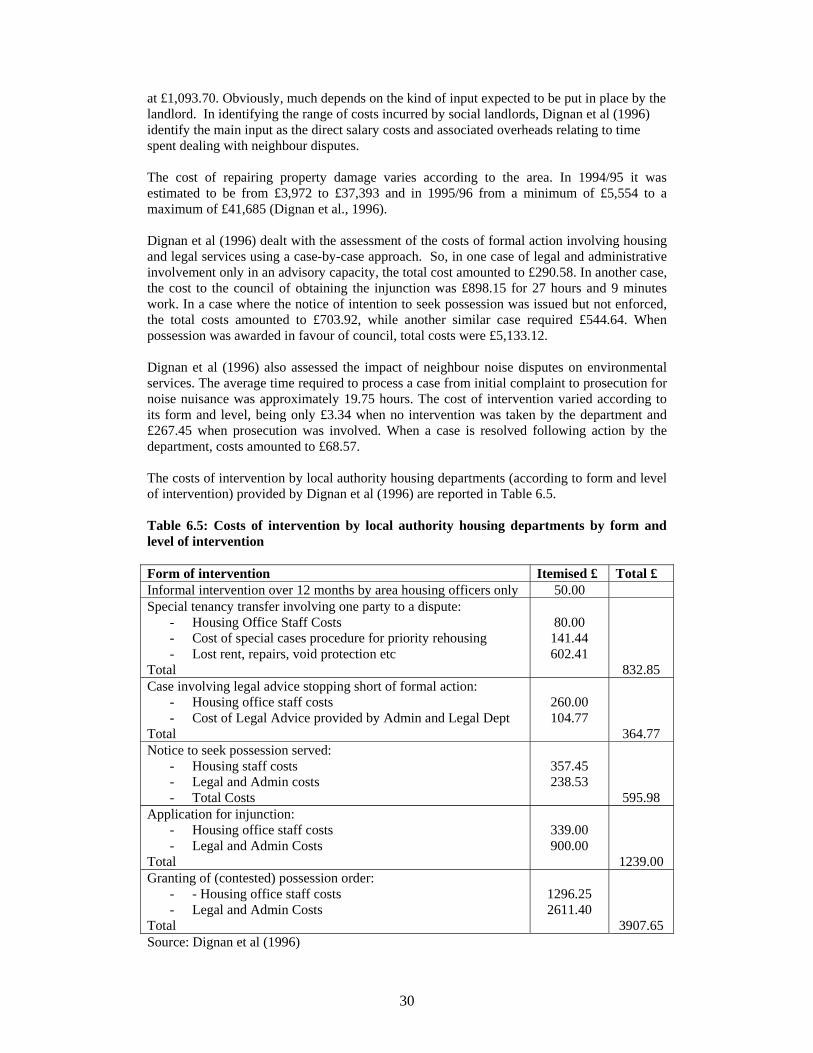
30
at £1,093.70. Obviously, much depends on the kind of input expected to be put in place by the landlord. In identifying the range of costs incurred by social landlords, Dignan et al (1996) identify the main input as the direct salary costs and associated overheads relating to time spent dealing with neighbour disputes. The cost of repairing property damage varies according to the area. In 1994/95 it was estimated to be from £3,972 to £37,393 and in 1995/96 from a minimum of £5,554 to a maximum of £41,685 (Dignan et al., 1996). Dignan et al (1996) dealt with the assessment of the costs of formal action involving housing and legal services using a case-by-case approach. So, in one case of legal and administrative involvement only in an advisory capacity, the total cost amounted to £290.58. In another case, the cost to the council of obtaining the injunction was £898.15 for 27 hours and 9 minutes work. In a case where the notice of intention to seek possession was issued but not enforced, the total costs amounted to £703.92, while another similar case required £544.64. When possession was awarded in favour of council, total costs were £5,133.12. Dignan et al (1996) also assessed the impact of neighbour noise disputes on environmental services. The average time required to process a case from initial complaint to prosecution for noise nuisance was approximately 19.75 hours. The cost of intervention varied according to its form and level, being only £3.34 when no intervention was taken by the department and £267.45 when prosecution was involved. When a case is resolved following action by the department, costs amounted to £68.57. The costs of intervention by local authority housing departments (according to form and level of intervention) provided by Dignan et al (1996) are reported in Table 6.5. Table 6.5: Costs of intervention by local authority housing departments by form and level of intervention Form of intervention Itemised £ Total £ Informal intervention over 12 months by area housing officers only 50.00 Special tenancy transfer involving one party to a dispute:
- Housing Office Staff Costs - Cost of special cases procedure for priority rehousing - Lost rent, repairs, void protection etc
Total
80.00
141.44 602.41
832.85 Case involving legal advice stopping short of formal action:
- Housing office staff costs - Cost of Legal Advice provided by Admin and Legal Dept
Total
260.00 104.77
364.77 Notice to seek possession served:
- Housing staff costs - Legal and Admin costs - Total Costs
357.45 238.53
595.98 Application for injunction:
- Housing office staff costs - Legal and Admin Costs
Total
339.00 900.00
1239.00 Granting of (contested) possession order:
- - Housing office staff costs - Legal and Admin Costs
Total
1296.25 2611.40
3907.65 Source: Dignan et al (1996)
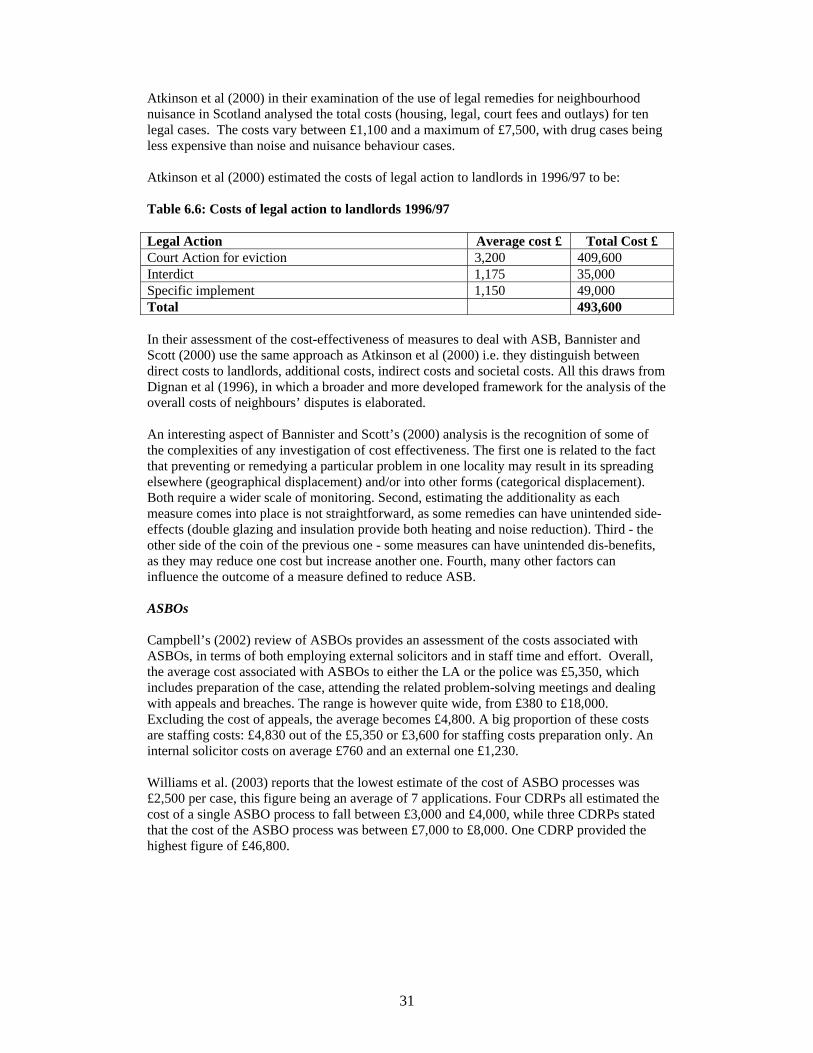
31
Atkinson et al (2000) in their examination of the use of legal remedies for neighbourhood nuisance in Scotland analysed the total costs (housing, legal, court fees and outlays) for ten legal cases. The costs vary between £1,100 and a maximum of £7,500, with drug cases being less expensive than noise and nuisance behaviour cases. Atkinson et al (2000) estimated the costs of legal action to landlords in 1996/97 to be: Table 6.6: Costs of legal action to landlords 1996/97 Legal Action Average cost £ Total Cost £ Court Action for eviction 3,200 409,600 Interdict 1,175 35,000 Specific implement 1,150 49,000 Total 493,600 In their assessment of the cost-effectiveness of measures to deal with ASB, Bannister and Scott (2000) use the same approach as Atkinson et al (2000) i.e. they distinguish between direct costs to landlords, additional costs, indirect costs and societal costs. All this draws from Dignan et al (1996), in which a broader and more developed framework for the analysis of the overall costs of neighbours’ disputes is elaborated. An interesting aspect of Bannister and Scott’s (2000) analysis is the recognition of some of the complexities of any investigation of cost effectiveness. The first one is related to the fact that preventing or remedying a particular problem in one locality may result in its spreading elsewhere (geographical displacement) and/or into other forms (categorical displacement). Both require a wider scale of monitoring. Second, estimating the additionality as each measure comes into place is not straightforward, as some remedies can have unintended side-effects (double glazing and insulation provide both heating and noise reduction). Third - the other side of the coin of the previous one - some measures can have unintended dis-benefits, as they may reduce one cost but increase another one. Fourth, many other factors can influence the outcome of a measure defined to reduce ASB. ASBOs Campbell’s (2002) review of ASBOs provides an assessment of the costs associated with ASBOs, in terms of both employing external solicitors and in staff time and effort. Overall, the average cost associated with ASBOs to either the LA or the police was £5,350, which includes preparation of the case, attending the related problem-solving meetings and dealing with appeals and breaches. The range is however quite wide, from £380 to £18,000. Excluding the cost of appeals, the average becomes £4,800. A big proportion of these costs are staffing costs: £4,830 out of the £5,350 or £3,600 for staffing costs preparation only. An internal solicitor costs on average £760 and an external one £1,230. Williams et al. (2003) reports that the lowest estimate of the cost of ASBO processes was £2,500 per case, this figure being an average of 7 applications. Four CDRPs all estimated the cost of a single ASBO process to fall between £3,000 and £4,000, while three CDRPs stated that the cost of the ASBO process was between £7,000 to £8,000. One CDRP provided the highest figure of £46,800.

32
6.4 Aggregate costs of ASB to different agencies We have already discussed some estimates of total costs for particular agencies where some estimate of average cost per incident could be achieved. Leeds LA estimated the cost of ASB to be between £3 million and £5 million per year (Allen and Sprigings, 1999). NACRO (1998) found that dealing with the consequences of ASB costs 15 per cent of housing departments more than £100,000 per year. In their analysis of the use of legal remedies for neighbour nuisance in Scotland, Atkinson et al. (2000) estimate the total figure for landlords’ costs of civil legal action for ASB (deducted by applying costs for the three categories of legal action – court action for eviction, interdict and specific implement – to the court action figures) in 1996/97 as nearly 0.5 million pounds (£493,600) The total cost of neighbour disputes as sustained by a single urban housing area over a twelve-month period has been estimated to be £20,942.10 (Dignan et al., 1996). This comprises: Table 6.7: Cost of neighbour disputes over 12 months Direct salary and related costs incurred as a result of informal action £5,764.10 Cost associated with moving one of the parties to a dispute £12,040.00 Cost of repairing property damage resulting from neighbour nuisance £3,138.00 Total £ 20,942.10 Source: Dignan et al (1996) A study of costs of vandalism in schools in Scotland estimated that the bill for insuring against vandalism and damage was higher than the amount spent on books each year (Accounts Commission, 1997). Salford Housing Department estimated that ASB by tenants cost it £2 million per year (Audit Commission, 1999). A study of the costs of crime in Hull estimated that overall the cost to the city was £177 million per annum, comprising £37 million in crime prevention measures, £49 million in responding to crime and £30 million in prosecuting and dealing with offenders (SEU, 2000). PAT 8 (SEU, 2000) highlights the problems resulting from the lack of information on financial costs; lack of record-keeping by landlords on prevention and reparation costs and little data of costs on police and other service providers. 6.5 Aggregate costs of crime to society UK A number of estimates of the overall costs of crime are provided by Brand and Price (2000) in their analysis of the economic and social costs of crime. Their report states that the huge costs imposed by crime on society have been estimated in the range from £35 billion to £60 billion per year, for England and Wales. These estimates include:
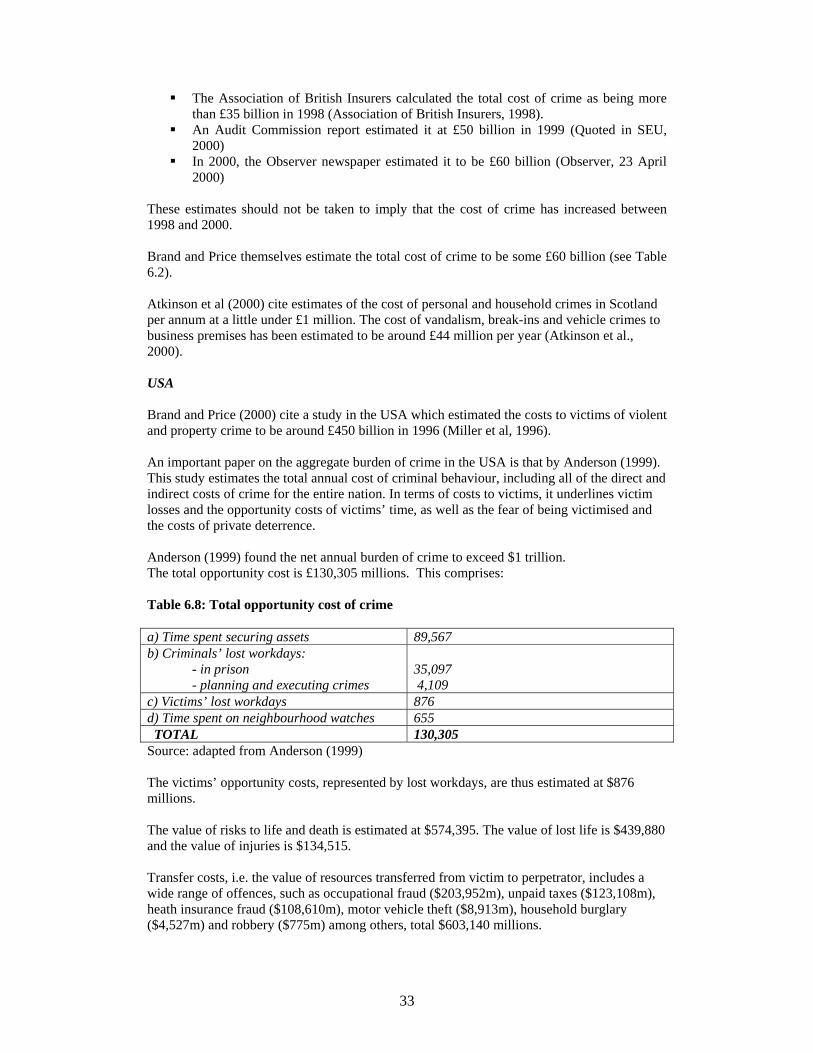
33
The Association of British Insurers calculated the total cost of crime as being more than £35 billion in 1998 (Association of British Insurers, 1998).
An Audit Commission report estimated it at £50 billion in 1999 (Quoted in SEU, 2000)
In 2000, the Observer newspaper estimated it to be £60 billion (Observer, 23 April 2000)
These estimates should not be taken to imply that the cost of crime has increased between 1998 and 2000. Brand and Price themselves estimate the total cost of crime to be some £60 billion (see Table 6.2). Atkinson et al (2000) cite estimates of the cost of personal and household crimes in Scotland per annum at a little under £1 million. The cost of vandalism, break-ins and vehicle crimes to business premises has been estimated to be around £44 million per year (Atkinson et al., 2000). USA Brand and Price (2000) cite a study in the USA which estimated the costs to victims of violent and property crime to be around £450 billion in 1996 (Miller et al, 1996). An important paper on the aggregate burden of crime in the USA is that by Anderson (1999). This study estimates the total annual cost of criminal behaviour, including all of the direct and indirect costs of crime for the entire nation. In terms of costs to victims, it underlines victim losses and the opportunity costs of victims’ time, as well as the fear of being victimised and the costs of private deterrence. Anderson (1999) found the net annual burden of crime to exceed $1 trillion. The total opportunity cost is £130,305 millions. This comprises: Table 6.8: Total opportunity cost of crime a) Time spent securing assets 89,567 b) Criminals’ lost workdays: - in prison - planning and executing crimes
35,097 4,109
c) Victims’ lost workdays 876 d) Time spent on neighbourhood watches 655 TOTAL 130,305 Source: adapted from Anderson (1999) The victims’ opportunity costs, represented by lost workdays, are thus estimated at $876 millions. The value of risks to life and death is estimated at $574,395. The value of lost life is $439,880 and the value of injuries is $134,515. Transfer costs, i.e. the value of resources transferred from victim to perpetrator, includes a wide range of offences, such as occupational fraud ($203,952m), unpaid taxes ($123,108m), heath insurance fraud ($108,610m), motor vehicle theft ($8,913m), household burglary ($4,527m) and robbery ($775m) among others, total $603,140 millions.
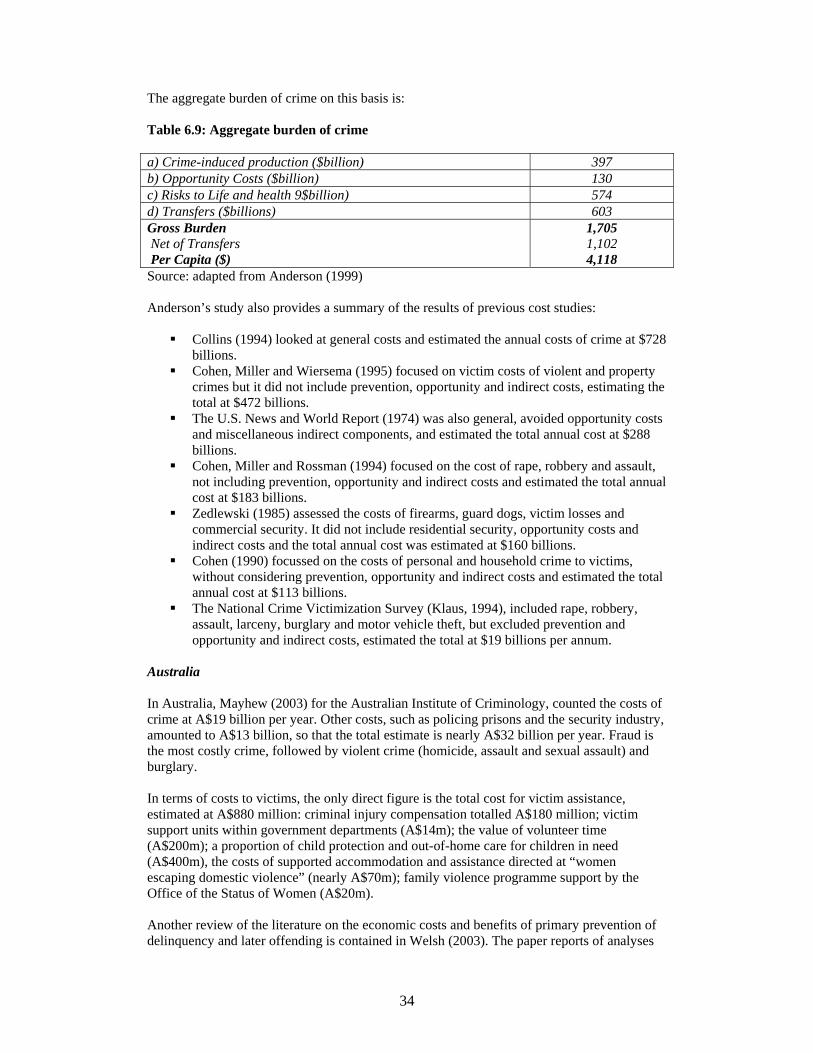
34
The aggregate burden of crime on this basis is: Table 6.9: Aggregate burden of crime a) Crime-induced production ($billion) 397 b) Opportunity Costs ($billion) 130 c) Risks to Life and health 9$billion) 574 d) Transfers ($billions) 603 Gross Burden Net of Transfers Per Capita ($)
1,705 1,102 4,118
Source: adapted from Anderson (1999) Anderson’s study also provides a summary of the results of previous cost studies:
Collins (1994) looked at general costs and estimated the annual costs of crime at $728 billions.
Cohen, Miller and Wiersema (1995) focused on victim costs of violent and property crimes but it did not include prevention, opportunity and indirect costs, estimating the total at $472 billions.
The U.S. News and World Report (1974) was also general, avoided opportunity costs and miscellaneous indirect components, and estimated the total annual cost at $288 billions.
Cohen, Miller and Rossman (1994) focused on the cost of rape, robbery and assault, not including prevention, opportunity and indirect costs and estimated the total annual cost at $183 billions.
Zedlewski (1985) assessed the costs of firearms, guard dogs, victim losses and commercial security. It did not include residential security, opportunity costs and indirect costs and the total annual cost was estimated at $160 billions.
Cohen (1990) focussed on the costs of personal and household crime to victims, without considering prevention, opportunity and indirect costs and estimated the total annual cost at $113 billions.
The National Crime Victimization Survey (Klaus, 1994), included rape, robbery, assault, larceny, burglary and motor vehicle theft, but excluded prevention and opportunity and indirect costs, estimated the total at $19 billions per annum.
Australia In Australia, Mayhew (2003) for the Australian Institute of Criminology, counted the costs of crime at A$19 billion per year. Other costs, such as policing prisons and the security industry, amounted to A$13 billion, so that the total estimate is nearly A$32 billion per year. Fraud is the most costly crime, followed by violent crime (homicide, assault and sexual assault) and burglary. In terms of costs to victims, the only direct figure is the total cost for victim assistance, estimated at A$880 million: criminal injury compensation totalled A$180 million; victim support units within government departments (A$14m); the value of volunteer time (A$200m); a proportion of child protection and out-of-home care for children in need (A$400m), the costs of supported accommodation and assistance directed at “women escaping domestic violence” (nearly A$70m); family violence programme support by the Office of the Status of Women (A$20m). Another review of the literature on the economic costs and benefits of primary prevention of delinquency and later offending is contained in Welsh (2003). The paper reports of analyses
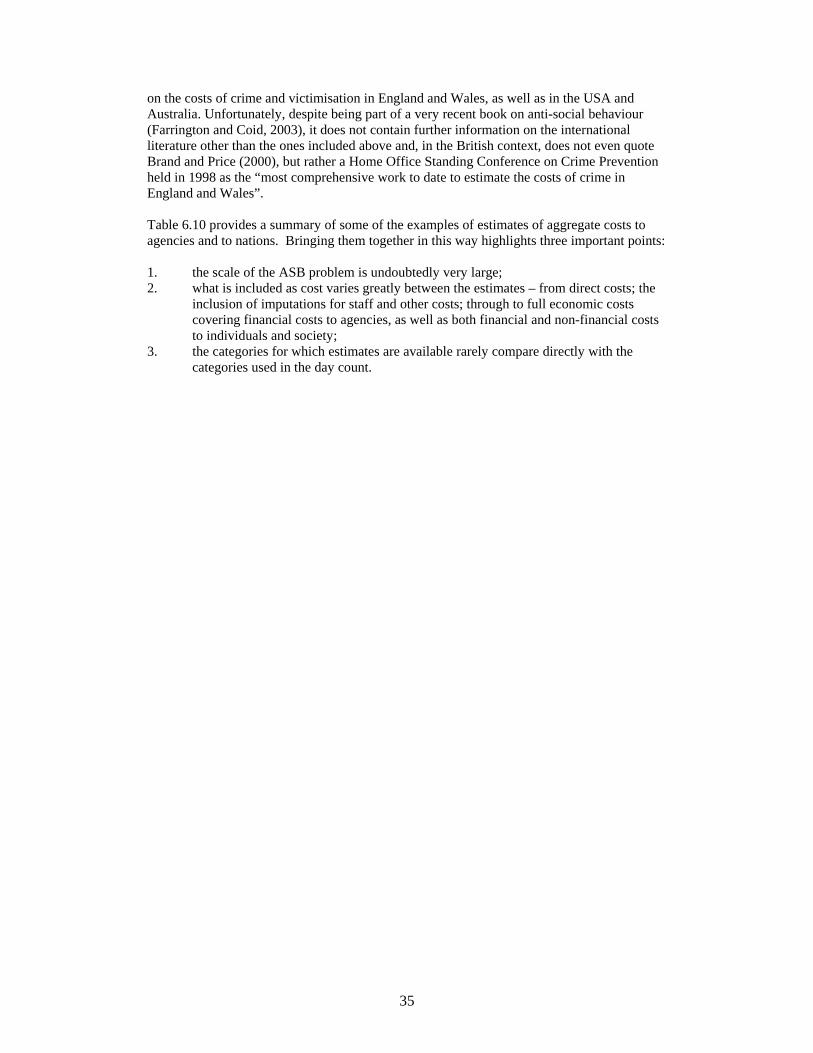
35
on the costs of crime and victimisation in England and Wales, as well as in the USA and Australia. Unfortunately, despite being part of a very recent book on anti-social behaviour (Farrington and Coid, 2003), it does not contain further information on the international literature other than the ones included above and, in the British context, does not even quote Brand and Price (2000), but rather a Home Office Standing Conference on Crime Prevention held in 1998 as the “most comprehensive work to date to estimate the costs of crime in England and Wales”. Table 6.10 provides a summary of some of the examples of estimates of aggregate costs to agencies and to nations. Bringing them together in this way highlights three important points: 1. the scale of the ASB problem is undoubtedly very large; 2. what is included as cost varies greatly between the estimates – from direct costs; the
inclusion of imputations for staff and other costs; through to full economic costs covering financial costs to agencies, as well as both financial and non-financial costs to individuals and society;
3. the categories for which estimates are available rarely compare directly with the categories used in the day count.
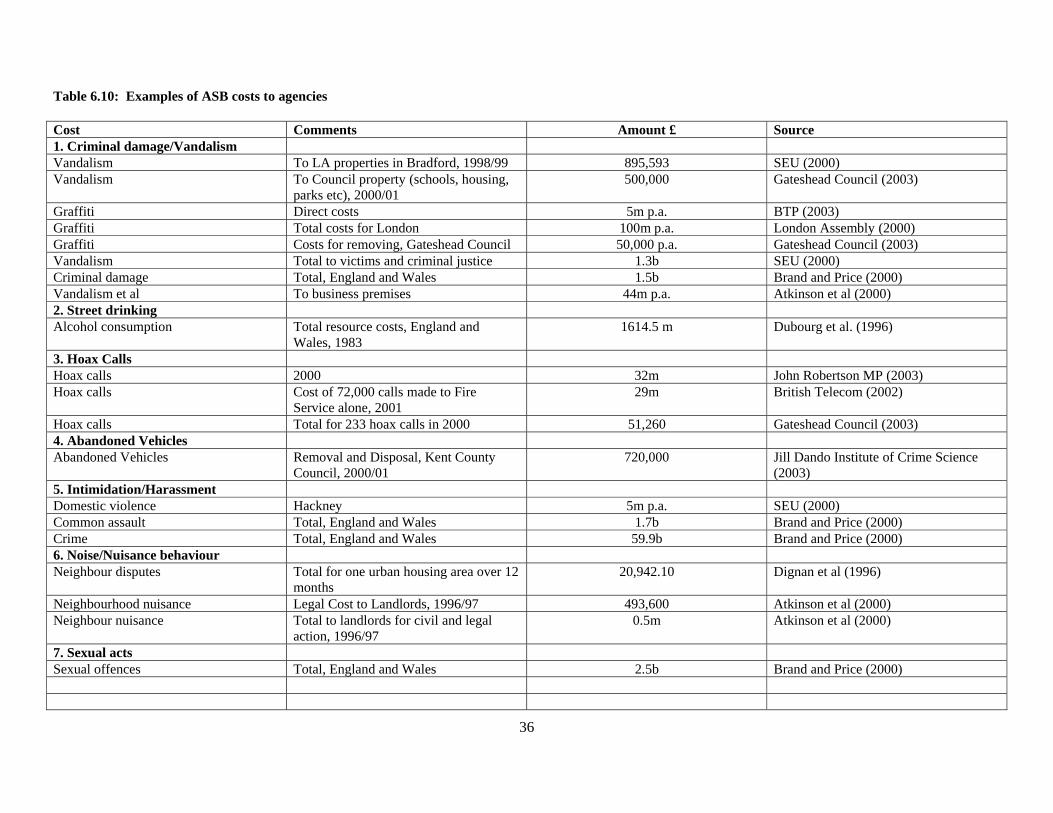
36
Table 6.10: Examples of ASB costs to agencies Cost Comments Amount £ Source 1. Criminal damage/Vandalism Vandalism To LA properties in Bradford, 1998/99 895,593 SEU (2000) Vandalism To Council property (schools, housing,
parks etc), 2000/01 500,000 Gateshead Council (2003)
Graffiti Direct costs 5m p.a. BTP (2003) Graffiti Total costs for London 100m p.a. London Assembly (2000) Graffiti Costs for removing, Gateshead Council 50,000 p.a. Gateshead Council (2003) Vandalism Total to victims and criminal justice 1.3b SEU (2000) Criminal damage Total, England and Wales 1.5b Brand and Price (2000) Vandalism et al To business premises 44m p.a. Atkinson et al (2000) 2. Street drinking Alcohol consumption Total resource costs, England and
Wales, 1983 1614.5 m Dubourg et al. (1996)
3. Hoax Calls Hoax calls 2000 32m John Robertson MP (2003) Hoax calls Cost of 72,000 calls made to Fire
Service alone, 2001 29m British Telecom (2002)
Hoax calls Total for 233 hoax calls in 2000 51,260 Gateshead Council (2003) 4. Abandoned Vehicles Abandoned Vehicles Removal and Disposal, Kent County
Council, 2000/01 720,000 Jill Dando Institute of Crime Science
(2003) 5. Intimidation/Harassment Domestic violence Hackney 5m p.a. SEU (2000) Common assault Total, England and Wales 1.7b Brand and Price (2000) Crime Total, England and Wales 59.9b Brand and Price (2000) 6. Noise/Nuisance behaviour Neighbour disputes Total for one urban housing area over 12
months 20,942.10 Dignan et al (1996)
Neighbourhood nuisance Legal Cost to Landlords, 1996/97 493,600 Atkinson et al (2000) Neighbour nuisance Total to landlords for civil and legal
action, 1996/97 0.5m Atkinson et al (2000)
7. Sexual acts Sexual offences Total, England and Wales 2.5b Brand and Price (2000)
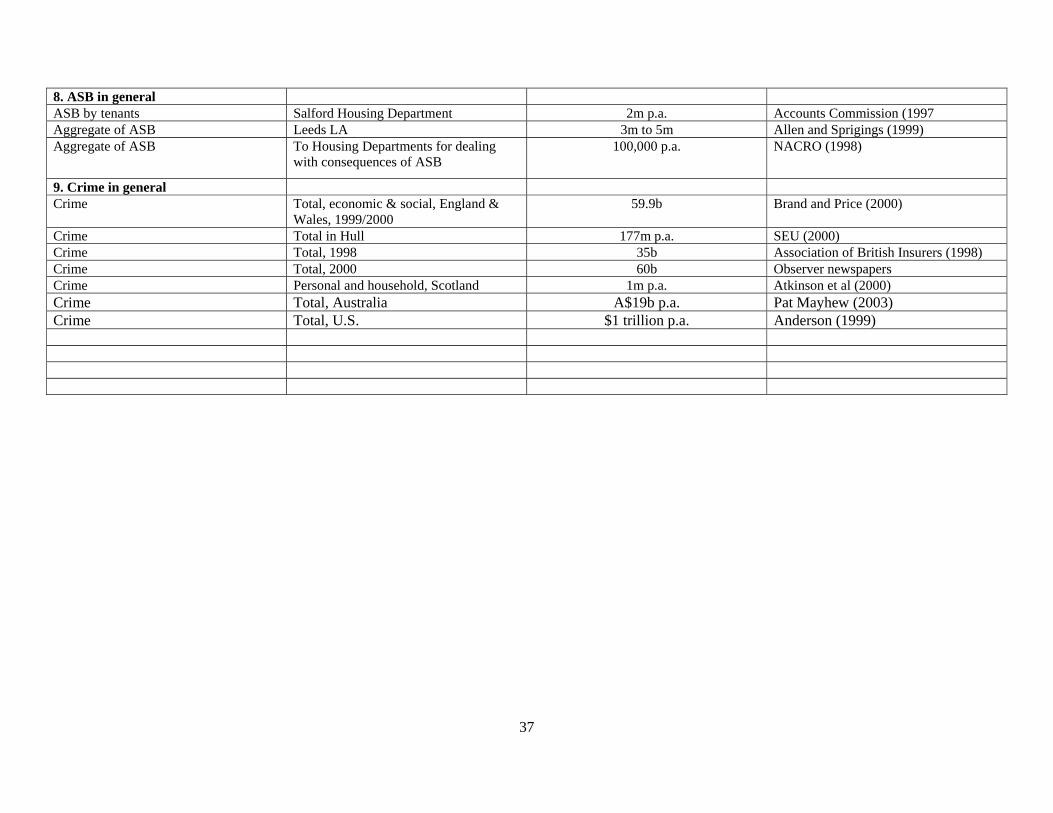
37
8. ASB in general ASB by tenants Salford Housing Department 2m p.a. Accounts Commission (1997 Aggregate of ASB Leeds LA 3m to 5m Allen and Sprigings (1999) Aggregate of ASB To Housing Departments for dealing
with consequences of ASB 100,000 p.a. NACRO (1998)
9. Crime in general Crime Total, economic & social, England &
Wales, 1999/2000 59.9b Brand and Price (2000)
Crime Total in Hull 177m p.a. SEU (2000) Crime Total, 1998 35b Association of British Insurers (1998) Crime Total, 2000 60b Observer newspapers Crime Personal and household, Scotland 1m p.a. Atkinson et al (2000) Crime Total, Australia A$19b p.a. Pat Mayhew (2003) Crime Total, U.S. $1 trillion p.a. Anderson (1999)

38
6.6 Issues in the real measurement of costs The preceding review of available estimates of the costs of ASB focuses on the costs of dealing with incidents of ASB rather than on the costs associated with preventing its occurrence. However, any comprehensive analysis of the costs of ASB would need to take into account the costs associated with the total range of strategies which have been used to tackle the problem of ASB. These will include not only enforcement and prevention but also longer-term strategies of diversion and education/culture change. It is clear that many local authorities are already using a diverse mix of strategies for dealing with ASB and that many have developed a range of innovative and creative projects (Lucas and Whitworth, 2002). Many local authorities take a problem-solving approach to dealing with ASB and seek to develop a multi-agency strategy to ASB with the aim of improving quality of life for both individuals and the community as a whole, both now and in the longer-term. Strategies used by local authorities include:
ASBOs; Injunctions; Acceptable behaviour contracts/agreements; Parental control agreements; Tenancy enforcement action; Street sex workers scheme Warning letters Mediation Mobile closed-circuit television van; and Diversionary activities.
Diversionary activities typically involve work with the youth service and/or leisure services. They often include the use of outreach youth workers to access ‘hard to reach’ young people who are not in contact with mainstream services. Use of mobile youth provision has proved popular particularly in rural areas. Summer schemes are also valuable in providing activity for young people who might otherwise have limited opportunities when on holiday from school. As the report Innovative Practice in Tackling ASB (CRESR and CIH, 2003b) points out, any framework for action to tackle ASB will include a number of core elements:
Understanding the nature of the problem; Engagement of residents and building community confidence; Established multi-agency partnerships; and Effective interventions – providing a mixture of prevention, enforcement and
support. Each of these elements will have associated costs. Another important element to be considered when assessing the real measurement of costs of ASB relates to the long-term perspective which needs to be adopted. The long-term focus has to look not only to the potential costs emerging after a solution has been reached - as the case above about women disproportionately suffering the consequences of ASB clearly outlines – but also to costs incurred before ASB and its consequences occur.
39
Scott et al. (2001) assesses the costs of public services (excluding private, voluntary agency, indirect and personal costs) used through adulthood by individuals. Individuals’ lives were followed from the age of 10 to 28. At the age of 28, a panorama of their life was considered, looking at the use of public services (education, health, residential care, benefits etc) so far. Scott et al. then compares this with their situation in terms of ASB. Three groups were analysed: no problems, conduct problems and conduct disorder, meaning persistent and pervasive pattern of ASB in childhood or adolescence. Total costs (education, health, foster and residential care, relationships, benefits, crime) for the no problems group are £7,423 (1998 prices), £2,322 for females and £11,792 for males. For the conduct problems group, total costs are £23,014 and for the conduct disorder £70,019. Crime is the costliest domain in all the groups, constituting almost two-thirds of the total cost in the conduct disorder group. Being male led to higher costs. Cohen (1998) estimates the present discounted value of the external marginal costs imposed by the career criminal, the typical heavy drug abuser and the high school dropout in America. Based on a 2% discount rate, the typical career criminal causes $1.3-$1.5 million in external costs; a heavy drug user, $370,000 to $970,000; and a high-school dropout, $243,000 to $388,000. Eliminating duplication between crimes committed by individuals who are both heavy drug users and career criminals results in an overall estimate of the "monetary value of saving a high-risk youth" of $1.7 to $2.3 million. Although this evidence suggests that the long-term costs of dealing with those in “problem” groups are very substantial, it is not possible to establish a direct link with specific cases of ASB. 6.7 Conclusions • There are no current estimates of the costs of ASB overall, for particular localities or
for individual incidents which are couched in the economic cost terms. • What evidence there is concentrates on direct costs to agencies, notably housing
management, whether RSL or LA Housing Department, and particularly on legal costs.
• Some of the evidence provides estimates of cost per incident; some the annual cost
for a Department without evidence on the scale of the Department or of the number of incidents; some provide estimates of the proportion of a Department’s overall costs associated with ASB/neighbourhood disputes; some list direct costs, particularly of taking legal action; some list all identified financial costs of dealing with disputes and particularly ASBOs; some mention secondary costs, e.g. rehousing costs, and other imputed costs of resources used. In no case is all the evidence provided necessary to calculate even both the direct cost per incident and the overall cost to all the agencies involved let alone the broader economic costs.
• The concentration of evidence on disputes means that the evidence may only apply to
a small proportion of ASB – i.e. those where there are a small number of identified victims directly involved.
• Even though the evidence is fragmentary it is clear that the costs to many agencies –
including in particular local authorities, the police, fire and ambulance services, RSLs and the legal services are very significant (see Table 6.10).

40
• Brand and Price and evidence from outside the UK provide the best attempts at examining costs to victims and society – but these refer to crime, not to ASB.
• Direct unit cost estimates relate mainly to vandalism, hoax calls, abandoned vehicles,
specific cases of neighbourhood nuisance and legal action such as ASBOs when it is fairly easy to identify the action taken.
• Estimates of the cost of certain crimes, such as criminal damage, can help to provide
indications of ballpark figures for certain ASB activities. • Aggregrate cost estimates relate mainly to the costs incurred by a specific agency or
sometime to a locality rather than to the overall costs of addressing incidents. • There is more evidence both in the UK and in the USA and Australia on overall costs
of crime, some of these include non-finance costs. • There is thus a clear methodology, both from the principles of cost benefit analysis
and by analogy from the costs of crime literature for measuring the costs of ASB. • However at the present time the literature provides only very limited evidence as to
actual costs per incident or response. • What evidence there is clearly points to very different costs within each category of
ASB depending on the severity of the incident and the nature of the response. • This suggests that in estimating costs it would be appropriate to distinguish
(i) ASB incidents which require only staff time to note the report/refer the incident;
(ii) ASB incidents which involve low levels of physical damage or staff intervention;
(iii) ASB incidents which involve larger-scale remediation either physical or in terms of staff time;
(iv) ASB incidents involving formal intervention; including legal action such as eviction or ASBOs.
• The evidence from the literature on unit costs (see Table 6.11) reflects the hypothesis
that costs vary widely with severity. In some instances the direct costs are very small and the main cost is staff time. At the other extreme costs can be over £1m although the cost probably covers many instances of ASB.
• The day count provides a total figure on incidents reported per category. It does not
provide any evidence on the proportions of these incidents that lead to different levels of action. Even if this were available it would only provide some evaluation of agency costs of alleviation.
• There is no evidence on the impact on victims in terms of numbers of people affected
and type of effect, except in relation to some measures of compensation paid – based on actual payments, rather than real costs to victims.
• Evidence on longer-term costs suggests that the costs of dealing with certain groups
of perpetrators categories, such as heavy drug users and those dropping out of school, are very high. However, their direct relationship to particular incidents of ASB is unclear.
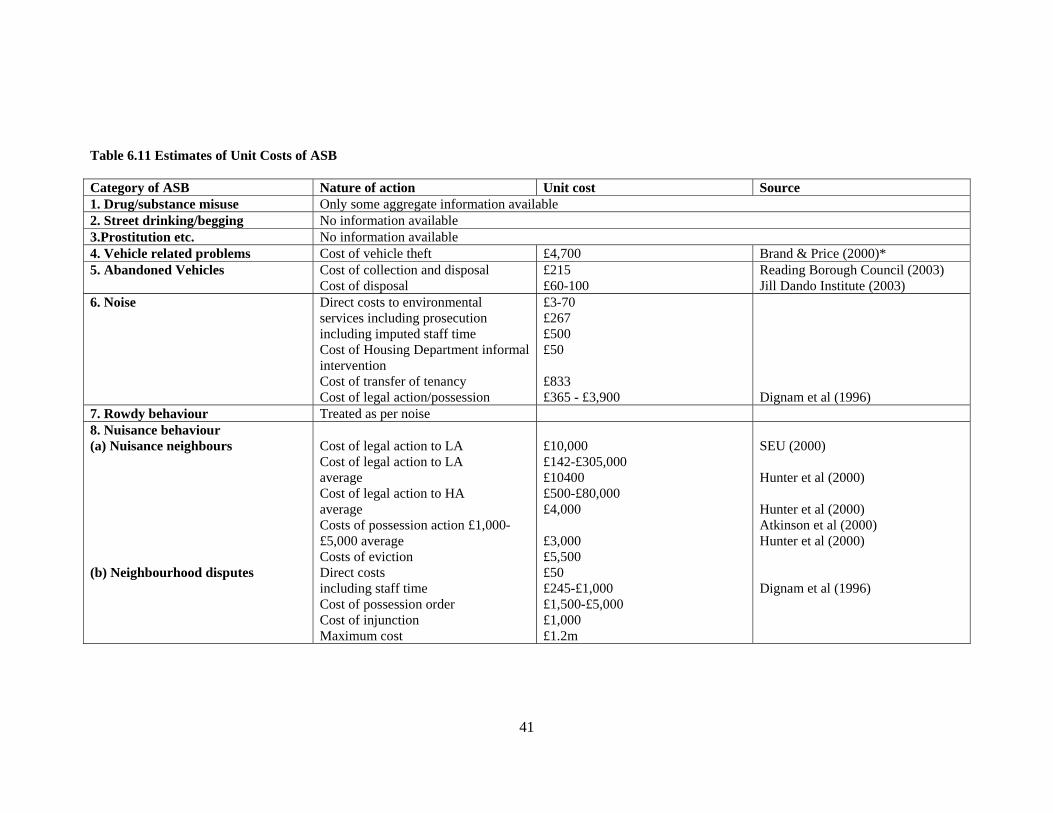
41
Table 6.11 Estimates of Unit Costs of ASB Category of ASB Nature of action Unit cost Source 1. Drug/substance misuse Only some aggregate information available 2. Street drinking/begging No information available 3.Prostitution etc. No information available 4. Vehicle related problems Cost of vehicle theft £4,700 Brand & Price (2000)* 5. Abandoned Vehicles Cost of collection and disposal
Cost of disposal £215 £60-100
Reading Borough Council (2003) Jill Dando Institute (2003)
6. Noise Direct costs to environmental services including prosecution including imputed staff time Cost of Housing Department informal intervention Cost of transfer of tenancy Cost of legal action/possession
£3-70 £267 £500 £50 £833 £365 - £3,900
Dignam et al (1996)
7. Rowdy behaviour Treated as per noise 8. Nuisance behaviour (a) Nuisance neighbours (b) Neighbourhood disputes
Cost of legal action to LA Cost of legal action to LA average Cost of legal action to HA average Costs of possession action £1,000-£5,000 average Costs of eviction Direct costs including staff time Cost of possession order Cost of injunction Maximum cost
£10,000 £142-£305,000 £10400 £500-£80,000 £4,000 £3,000 £5,500 £50 £245-£1,000 £1,500-£5,000 £1,000 £1.2m
SEU (2000) Hunter et al (2000) Hunter et al (2000) Atkinson et al (2000) Hunter et al (2000) Dignam et al (1996)

42
9. Hoax calls One fire engine to hoax call Cost of sending fire response to 999 call
£220 £300-£500
Gateshead Council (2003) British Telecom (2002)
10. Animal related problems No information available 11. Intimidation/Harassment Cost of common assault offence £500 Brand & Price (2000)* 12. Criminal damage/vandalism Cost of individual incident
Cost of incident against commercial/ public sector Average cost per LA dwelling in Bradford Assuming 5% vandalised cost per incident Cost of demolition of property Cost of replacing bus shelter Cost of graffiti for single incident Property damage max cost to LA
£510 £890 £35 £700 £5000 £2000 from £5000 (fine) to £63,000 £42,000
Brand & Price (2000)* Brand & Price (2000)* SEU (2000) SEU (2000) Gateshead (2003) BTP (2003) Dignan et al (1996)
13. Litter/rubbish Only some information available 14. ASOBs Cost to LA/Police
Lowest Highest
£5,350 £2,500 £46,800
Campbell (2002) Williams et al (2003)
*Includes social costs
43
7. Gaps and proxies
7.1 Gaps in direct costs The discussion in section 6 makes it clear that, except for the financial cost of certain types of alleviation, there are very few estimates of costs which can be directly related to ASB activities. The cost estimates that do exist are all partial. However, some of them provide useful insights and indicators of possible ways forward. Even the estimates provided at the end of chapter 6 can be used only if the evidence from the count can be linked to evidence on the proportions of each type of ASB that generate each type of response. That information is not available from the literature. It was therefore suggested that one way forward here would be to ask local authorities, RSLs and the police what their own estimates would be. By surveying a structured sample of these agencies it is likely that some qualitative and/or proportional estimates would be forthcoming. A pilot survey was therefore carried out in September 2003. Twenty agencies were contacted of which fourteen were able to assist. The responses suggested that: (a) agencies were generally not able to categories the ASBs with which they were
involved, except by severity and particularly by level of legal action; (b) they tended to distinguish between those that involved a simple report (costing
perhaps £20-£50); those involving further action; and those that required legal action; (c) some evidence suggested that maybe ten percent of cases required significant further
action and in some cases legal action. However, the proportion of ASBOs varies enormously between areas and agencies.
On the basis of table 6.11 and the evidence from the practioners, costing based on four levels of severity seems a reasonable first approximation. These could be:
(i) £20 - £50 - implying a simple report; (ii) £100 - £300 – implying a call-out together with some remedial action; (iii) £500 - £1000 – involving significant mediation/remediation; and (iv) from £2000 to anything up to £1m involving significant and often legal
intervention. In particular ASBOs appear to cost around £5,000 per order. It is clear from the evidence presented in section 6 that the vast majority of the costs associated with addressing ASB are staff costs together with some fairly well defined activity costs – such as cleaning off graffiti, replacing lights, bus shelters, landscaping etc. Again in the longer term it would probably be more accurate to survey local authorities and other agencies about both their use of time on these activities and, equally importantly, about what activities these staff would be undertaking if levels of ASB were to decline. It should be reasonably easy to obtain measures of direct cost for particular physical alleviation procedures. Where it is not, one possible proxy would be insurance costs for different types of damage. 7.2 Gaps in costs to victims not covered by alleviation costs With respect to the costs to victims – direct, indirect or within the perpetrators’ households – there is little or no quantitative evidence currently available.
44
ASB bears many similarities to environmental hazards – like air and noise pollution – which impose costs on individuals, but for which no explicit market or prices exist. Methods used for eliciting willingness to pay to avoid environmental hazards are, given appropriate data, directly applicable to the problem of evaluating the economic costs of ASB. One approach is to ask individuals how much financial compensation they would be prepared to accept to tolerate various levels of ASB, or how much they would be prepared to pay to reduce it. This contingent valuation methodology is widespread in environmental economics. It also requires specifically and carefully designed survey questionnaires. These measures, even in principle, have fundamental flaws. First, they are heavily dependent on distribution of income and on people’s expectations that payment or compensation will occur. Thus, poorer households, and particularly the elderly, are likely to give low values because of their experience of living on very limited incomes. Those on higher incomes will usually give higher values both for preparedness to pay and acceptable compensation. Second, the estimates rely on honest statements of preference. Much of ASB is not addressed at the individual and is thus what economists would call a public ‘bad’. As such this presents important questions of ‘free-ridership’ – people will guess at values, given what they expect others to do, rather than what their actual values are. In fact, portrayal of this problem may be perhaps oversophisticated. Rather, in many circumstances people are likely to be indifferent between different outcomes, through lack of experience and understanding. Third, ideally one wants to measure marginal values – i.e. the cost of an additional occurrence, rather than average or general values. There is some evidence that costs to victims do vary considerably depending on understanding and experience of ASB activity. The evidence available provides some instances of compensation paid. But in all such cases there is no evidence that this reflects the victims’ evaluation but rather the amount the system will allow. In the main, compensation is made available where criminality is involved or to achieve a housing management objective rather than to assess loss of welfare associated with ASB. Because the problems of direct measurement are so great – not least because they must be subjective and will vary greatly across people, types of ASB, context and location – it is often suggested that proxies that measure the implicit cost of putting people back to the position without ASB should be employed. The most direct approach here would be to cost the resources necessary to offset the damage to the individual – e.g. in terms of ‘good’ activities in the area; counselling, hospital and other costs; and any other means that can be identified which can compensate and ameliorate those problems which remain after the direct response has been taken into account. At the present time there is almost no evidence that could be applied for this purpose. However, it would be possible to develop a methodology for pursuing this resource cost approach, based on the cost-benefit literature. The general cost benefit literature (c.f. Layard and Glaister, 1994) provides some evidence of “shadow prices” applied to different outcomes. For instance, if people take time off work the wage rate can be applied as a measure of loss of output. At the limit, the willingness to pay for reducing the risk to life can provide a baseline of the value of reducing mortality risks. However, much of what is required here – e.g. measures of the cost of the increased fear of crime – is far less tangible. Most importantly, there is no direct evidence on the relationship between a given ASB incident and the outputs/outcomes against which these “shadow prices” could be applied.

45
7.3 Property value proxies: a means of evaluating the overall impact of ASB A second way forward is to look for evidence of preferences revealed through prices in markets that do exist – usually the land or housing market. This method has been used with environmental or other hazards that are unevenly spatially distributed, and where these geographical patterns are persistent. If different places suffer different levels of exposure to a hazard, then these differences should be reflected in differences in the price of quality-adjusted land or housing units at different locations. Translating these price differences into a price per unit change in the hazard leads to an estimate of its ‘implicit’ price, and is a starting point for evaluating the economic costs. Property-value based methods for eliciting the costs of ASB require geographically detailed data, not only on property prices and ASB, but on property characteristics and on other local characteristics. With these data in hand, the researcher can estimate the relationship between prices and ASB, after adjusting for other differences between the physical characteristics of properties and the neighbourhoods in which they are located. In Britain, detailed property and neighbourhood data are obtainable, but a major stumbling block is the lack of any data on incidence of ASB, at least at any useful level of geographical disaggregation. For the most part, ASB is unmeasured and unrecorded, one exception being the recording of perceptions of ASB by respondents in the BCS (Budd and Sims, 2001). Until such data become available, direct estimation of the cost using a property-value approach is impossible. One of the reasons for concern over ASB behaviour is its link with crime and the fear of crime (Budd and Sims, 2001), so analysis of the relationship between certain types of crime and property prices may give some insights into the costs of ASB, especially if coupled with a supporting analysis of the links between anti-social behaviour and crime. A number of studies in the US look at the crime-property price link, going back to Hellman and Naroff (1979) and Thaler (1978). In more recent estimates for the US, Lynch and Rasmussen (2001) find that a one percent increase in violent crime rates reduces prices by 0.05 percent, but report positive associations of property crime rates with prices. This they attribute to higher reporting rates in wealthier neighbourhoods, but higher victimisation rates may provide a better explanation. Such unobserved neighbourhood characteristics present a serious obstacle to successful measurement of the causal impacts of crime on property prices. A wealthy neighbourhood may have low rate of ASB and higher property prices even without a direct causal link from ASB to prices. To try to eliminate this type of problem in the crime setting, Schwartz et al (2003) estimate models based on repeat sales of the same properties in New York. They too find a negative violent crime-price relationship, but only weakly positive links between property crimes or misdemeanours and prices. A one per cent increase in violent crime decreases prices by about 11 per cent, and the authors attribute one-third of the post-1994 boom in New York property prices to falling crime rates!
In one respect, ASB does leave a direct trail: reported and recorded incidents of vandalism, graffiti and arson appear in the criminal damage category of the recorded crime statistics for England and Wales. The Metropolitan Police Service also records property-related crimes, including criminal damage, at a highly geographically disaggregate scale (On 100m Ordnance Survey Gird References corresponding to address postcodes). One study, Gibbons (2003), uses these data to provide estimates of the costs of urban crime that have a direct bearing on evaluation of the impacts of ant-social behaviour. This research is London focussed, and looks at highly geographically localised links between crime and prices, adjusting for broader area and socio-economic effects. The findings are that burglary has no effect on property prices in London, but that crimes in the criminal damage category have substantial negative impacts. For the average property in the average neighbourhood, a 1% increase in the number of recorded incidents of criminal damage per year reduces prices

46
by around 0.16%. Apparently, neighbourhood vandalism, graffiti and related acts really do matter in the housing market. The actual costs implied by the estimates in Gibbons (2003) are substantial. The average household is willing to pay around £110 per year to reduce the incidence of criminal damage by one-tenth of a standard deviation below the average in London. Given the low probability of victimisation, this translates into a cost of over £100,000 per crime! These estimates should be treated with considerable care both because of the strong assumptions involved in the hedonic price approach and because of the possibility of missing variables. Clearly, what we see reflected in the housing market is a valuation of something other than the direct costs of victimisation. One explanation is that criminal damage is part of a wider spectrum of neighbourhood ASB, and that this ASB generates real social costs. An alternative view is that actions of criminal damage and related behaviours are simply visible symptoms of deeper disruptions in social cohesion and community expectations – what Sampson and Raudenbush call ‘collective-efficacy’ (Sampson and Raudenbush, 1999). In this case cleaning up anti-social behaviour may indeed weaken the signal to home-buyers that something is wrong in the community, but may not fix the underlying problem. 7.4. Home insurance weightings as a proxy measure Another proxy measure for crimes relies on home insurance weightings, where premiums are set to reflect primarily the level of crime risk in local areas. Such a measure is currently used in the DETR Index of Local Deprivation. The viability of using home contents insurance premiums in mapping geographical variations of crime risk has been examined by Combes et al. (1994) and Wong (1997). They see home insurance data as more likely than annual crime statistics to meet the prerequisites for making valid comparisons of spatial variations in crime risk. They argue that such data should be statistically adequate to reflect the genuine contrast in the local experience, able to provide reliable trend information, and include detailed location coding (e.g. by postcode district). Wong’s (1997) study found high correlations between premiums and various deprivation indicators. Wong concluded that residents in poor areas are more vulnerable to crime and suffer from more expensive insurance, and that therefore premiums can serve as a proxy for exposure to crime risk. A similar argument can be applied to the experience of certain form of ASB. However, the use of home insurance weightings and, by extension ASB, as a proxy measure of crime is problematic for several reasons. As Wong (1997) recognises, the representativeness of insurance data is affected by the number of uninsured households. As low income area with high rates of crime typically have the most expensive insurance premiums, poor households are disproportionately unlikely to have household insurance if they live in these areas. Wong, drawing on the 1991 Family Expenditure Survey estimated that 75% of households (90% of owners occupiers) had home contents insurance. However, Howarth et al (1998) using figures produced by the Association of British Insurers in 1997 suggested that over 50% of households in the bottom quintile of income distribution have no insurance, compared with 22% in the middle band and 1% in the next band up. The 1999 review of the Index of Local Deprivation concluded that the use of home insurance weightings reflects the extent of insurance cover rather than crime, and that it is likely to underestimate the extent of crime in low-income areas, where fewer residents have households insurance cover (Noble et al., 1999).

47
8. Conclusions 1. The principles by which the costs of ASB could be measured are relatively
straightforward. However, the practice involves fundamental difficulties of definition, measurement and interpretation.
2. Ideally, measuring the costs of ASB would involve seven stages:
• the definition of categories and a count of the numbers in each category;
• clarification of the outputs/outcomes from each category; • specification of the groups affected and the numbers in each group; • as assessment of the reduction in welfare associated with each
category of ASB and victim; • clarification of any major non-linearities in impact; • estimation of the costs of bringing welfare back to the original level
through (i) direct costs of amelioration/prevention; (ii) direct costs of non-amelioration; and (iii) the net losses of welfare to victims, measured after (i) and (ii) by compensation or preparedness to pay;
• summation of these costs into an overall economic (including social) cost of ASB.
3. The count of September 10th will permit an estimate of stage 1 but no other element
can be directly measured. This is in the main because little is known about the nature of victimisation and the costs associated with the reduction in welfare. It is possible to give some estimates based on quantitative evidence of the direct costs of amelioration but the difficulties involved even here are significant.
4. Using a simpler approach which provides some overall estimates of costs related to
different levels of response to ASB could give a first ballpark figure of costs to agencies based on the daycount.
5. Much of the detail of costings which are available in the literature relate either to
crime or to neighbour disputes. It is extremely difficult without additional evidence to know how closely these relate to ASB. On the other hand there is some consistency in cost ranges for different types of ASB and levels of response which can be used as indications of direct financial costs per ASB incident.
6. The pilot survey of those directly involved in addressing ASB suggested that it would
be appropriate, given the limited evidence available, to group the ASB categories into two main groups and apply the four ‘conservative’ cost estimates provided from simply recording the report to legal action. The survey however could only provide first indications on the proportion of reports which fall into each cost category.
7. Estimating the net costs to victims of all types requires, very different types of
information, in particular understanding of the numbers and types of victim, of the nature of the outputs and outcomes and evidence of subjective valuations of damage.
8. True economic cost estimates would address the costs to all those involved based on
the most efficient approaches to alleviating damage and reducing risks. This requires much greater understanding of both prevention and alleviation methods.
48
9. Using proxies such as house values can only provide general evidence relating to the perceived level of ASB as well as other neighbourhood attributes. The evidence that already exists suggests that ASB is an important element in determining differential house prices – implying that people’s valuation of the cost of these activities is high.
10. A reasonable application of the methodology in the longer term would thus require
much greater understanding of the relationship between ASB behaviours and the outputs and outcomes of those behaviours and much greater understanding of the different approach to alleviation, (non-alleviation and prevention of ASB) and the resources involved. Most importantly it would require direct or indirect evidence of numbers affected and the impact of ASB on different groups. All of this could be provided through survey and direct analysis – but not in the short-term.
49
References
Accounts Commission (1997) A safer place: property Risk Management in Schools. Edinburgh: Accounts Commission for Scotland.
Aldbourne Associates (1993) The Management of Neighbourhood Complaints in Social
Housing. Allen C. and Sprigings N. (1999) Managing Risk Together. Salford Housing and Urban
Studies Unit. University of Salford. Armitage R. (2002) Tackling Anti-social Behaviour. What Really Works. NACRO,
Community and Safety Practice Briefing. Association of British Insurers, 1998. “Crime Cost Average Household £31 per week”. News
Release, 14 September 1998. London: ABI. Atkinson R., Mullen T., Scott S. (2000) The Use of Legal Remedies for Neighbour Nuisance
in Scotland. Scottish Executive Central Research Unit. Audit Commission (1999) “Safety in Numbers, Promoting Community Safety”. Abingdon:
Audit Commission Publications. Bannister J., Scott S. (2000) Assessing the Cost-Effectiveness of Measures to Deal with Anti-
Social Behaviour. Housing and Social Policy Research Group Discussion Paper 1. University of Glasgow.
Bland, n. (1997) Measuring Public Expectations of Policing: An Evaluation of Gap Analysis.
Police Research Series, Paper 24. London: Home Office. Brand S. and Price R. (2000) The Economic and Social Costs of Crime. Home Office
Research Study 217. British Telecom (2002) BT Campaigns to Cut Hoax Calls to 999. Accessed from
www.btplc.com/mediacentre/Agencynewsreleases/2002/an105.htm, 03 September 2003
BTP (2003) Annual Report 2002/03. www.btp.police.uk/documents/AnnualReport/Report.pdf Budd T. and Sims L. (2001) Anti-social Behaviour and Disorder: Findings from the 2000
British Crime Survey (Home Office Research Findings 145). London: Home Office. Campbell, S. (2002) A review of Anti-Social Behaviour Orders. Home Office Research Study
236. London: Home Office. Chartered Institute of Housing (CIH) (1995) Good Practice Briefing No.3: Neighbour
Nuisance: Ending the Nightmare. London: Chartered Institute of Housing. Cohen M. (1998) The Monetary Value of Saving a High-Risk Youth. In Journal of
Quantitative Criminology, 14 (1): 5-33 Collins S. (1994) Cost of Crime: 674 Billion. U.S. News and World Report.

50
Combes M., Wong C., Charlton M., Atkins D. (1994) Crime Risk in Urban and Rural Neighbourhoods: an Experimental Analysis of insurance data. In Environment and Planning, B21: 489-504.
CRESR and CIH (2003a) Tackling Anti-social Behaviour in Mixed Tenure Areas.
London: Office of the Deputy Prime Minister. CRESR and CIH (2003b) Innovative Practice in tackling Anti-social Behaviour. London:
Office of the Deputy Prime Minister.
DETR (2000a) Survey of English Housing: Preliminary Results. Housing Statistics No. 7, 1999/00. London: DETR.
DETR (2000b) Low Demand Housing and Unpopular Neighbourhood. Housing Research
Summary 114. Dhiri S. and Brand S. (1999) Analysis of Costs and Benefits: Guidance for Evaluators. Crime
Reduction programme Guidance Note 1. London: Home Office. Dignan J., Sorsby A., Hibbert J. (1996) Neighbour Disputes – Comparing the Cost
Effectiveness of Mediation and Alternative Approaches. University of Sheffield: Centre for Criminological and Legal Research.
Dubourg W. R., Pearce D., Cathrop E. (1996) The Social Costs of Alcohol Consumption:
Definitions and Measurement. CSERGE Working Paper GEC 96-20. Farrington D. P., Coid J. W. (eds) (2003) Early Prevention of Adult Anti-social Behaviour.
Cambridge Studies in Criminology.
Ganderton E. (2000) Managing Nuisance, Harassment and Anti-social Behaviour – a Framework for RSLs. The Housing Corporation.
Gateshead Council (2003) The Economics and Social Costs of Crime. Accessed from
www.gateshead.gov.uk/CrimeAudit5.pdf, 04 September 2003. Gibbons S. (2003) The Costs of Urban Property Crime. Centre for Economic Performance,
Discussion Paper, DP574, June Greater London Authority (forthcoming) The GLA Housing Survey Hellman D. A. and Naroff J. L. (1979) The Impact of Crime on Urban Residential Property
Values. In Urban Studies, vol. 16, pp. 105-112. HMIC (1997) Winning the Race: Policing Plural Communities. London: HMSO. HMIC (1999a) Winning the Race: Revisited. London: HMSO. HMIC (1999b) Keeping the Peace: Policing Disorder. London: HMSO. Hope T. and Hough M. (1998) Area, Crime and Incivility: a profile from the British Crime
Survey. In Hope and Shaw (eds) “Communities and Crime Reduction”. London: HMSO.
51
Howarth, C. Kenway, P. Palmer, G. & Street, C. (1998) Monitoring Poverty and Social Exclusion: Labour’s inheritance, Joseph Rowntree Foundation.
Hunter C., Nixon J., Shayer S. (2000) Neighbour Nuisance, Social Landlords and the Law.
CIH and JRF.
Hunter C. and Nixon J (2001) Taking the Blame and Losing the Home: Women and Anti-social Behaviour. In Journal of Social Welfare and Family Law, 23 (4): 395-410.
Hunter C. and Nixon J. (2002) Anti-social Behaviour and Housing. Safer Society Spring
2002.
Kershaw C. et al (2001) The 2001 British Crime Survey. London: Home Office. Jill Dando Institute of Crime and Science (2003) Measuring the Impact of MVRIB Initiatives
on Abandoned Vehicles. University College London. John Robertson MP (2003) Hoax Calls. Speeches 12th February 2003. Accessed from
www.johnrobertsonmp.co.uk/speeches/hoaxcalls1.htm, 3 September 2003. Layard, R. and Glaister, S. (Eds.) (1994) Cost Benefit Analysis. Cambridge University Press. LGA (2001) Partners Against Crime: a Survey of Local Authority Approaches to Community
Safety. LGA Research Report 24. London: Local Government Association. London Assembly (2002) Graffiti in London. Report of the London Assembly Graffiti
Investigative Committee. London: Greater London Authority. Lucas R. and Whitworth J. (2002) Tackling Anti-social Behaviour: Information and Case
Studies About Local Authority Work – LGA Research Briefing. London: Local Government Association.
Lynch A. K. and Rasmussen D. W. (2001) Measuring the Impact of Crime on House Prices.
In Applied Economics, vol. 33, pp. 1981-1989. McDonnell R. and Maynard A. (1985) The Costs of Alcohol Misuse. In British Journal of
Addiction, 80:27-35. Miller T., Cohen M.A., Wiersema B. (1996) Victim Costs and Consequences: A New Look.
National Institute of Justice Research Report. Washington D.C: NIJ. MORI (2003) Anti-social Behaviour. Research Study conducted for the Home Office. Draft
Report. NACRO (1998) Nuisance and Anti-social Behaviour – a Report of a Survey of Local
Authority Housing Departments. Nakamura K., Tanaka A., Takano T. (1993) The Social Costs of Alcohol Abuse in Japan. In
Journal of Studies on Alcohol, 54: 618-625 Nixon J., Hunter S., Shayer S. (1999) The Use of Legal Remedies by Social Landlords to deal
with Neighbour Nuisance. Sheffield Hallam University: Centre for Regional Economic and Social Research (CRESR).

52
Noble M., Penhale B., Smith G., Wright G. (1999) Measuring Multiple Deprivation at Local Level. Index of Local Deprivation 1999 Review. University of Oxford.
Observer, 23 April 2000, “Crime is costing UK £60bn a year”. Papps, P (1998) “Anti-social behaviour strategies – Individualistic or Holistic?” Housing Studies, Vol 13:5 pp 639-656 Reading Borough Council (2003) Spotlight on Abandoned Vehicles. Accessed from
www.reading.gov.uk/ourenvironment/abandonedvehicles/abandonedvehicles.stm, 5 September 2003
Rice D. P., Kelman S., Miller L.S., Dunmeyer S. (1990) The Economic Costs of Alcohol and
Drug Abuse and Mental Illness: 1985. DHHS Publication No. (ADM) 90-1694, US Department of Health and Human Services.
Sampson R. J. and Raudenbush S. W. (1999) Systematic Social Observation of Public Spaces:
A New Look at Disorder in Urban Neighbourhoods. In American Journal of Sociology, vol. 105(3), pp. 603-651.
Scott S., Knapp M., Henderson J., Maughan B. (2001) Financial Costs of Social Exclusion. In
British Medical Journal, 323:1-5
Scottish Affairs Committee (1996) Housing and Anti-social Behaviour: First Report. London: HMSO.
Scottish Executive (2000) Housing and Anti-social Behaviour: the Way Ahead. Downloaded
from www.scotland .gov.uk/library2/doc10/hasb-00.asp on 26/02/2002 SEU (1999) National Strategy for Neighbourhood Renewal – Report of Policy Action Team
7: Unpopular Housing. SEU (2000) National Strategy for Neighbourhood Renewal – Report of Policy Action Team
8: Anti-social Behaviour. Simmons J. (2003) Crime in England and Wales 2002/03. London: Home Office Skogan W. (1990) Disorder and Decline – Crime and the Spiral of Decay in American
Neighbourhoods. University of California Press. Schwartz A. E., Susin S., Voicu I. (2003) Has Falling Crime Driven New York City’s Real
Estate Boom? In Journal of Housing Research, forthcoming. Tackling Anti-social Tenants. Consultation Paper from ODPM. Shelter’s Response. Available
on http://www.shelter.org.uk/images/pdfs/campaign/dltr_%20asb_%20response.pdf , accessed on 14 August 2003.
Thaler R. (1978) A Note on the Value of Crime Control: Evidence from the Property Market.
In Journal of Urban Economics, vol. 5, pp. 137-145.
The Portman Group (2002) Counting the Cost: the Measurement and Recording of Alcohol-related Violence and Disorder.

53
Welsh B. C. (2003) Economic Costs and Benefits of Primary Prevention of Deliquency and Later Offending: a Review of the Research. In Farrington D. P. and Coid J. W. (eds) Early Prevention of Adult Anti-social Behaviour. Cambridge Studies in Criminology.
Welsh Office (1995) Williams S., Dale M., Roden L. (2003) Crime and Disorder Reduction Partnerships in the
East of England. Approaches to Anti-social Behaviour. Government Office for the East of England.
Wilson JQ. and Kelling G. (1982) Broken Windows. In “The Atlantic Monthly”, February.
Wong C. (1997) Crime Risk in Urban Neighbourhoods: the Use of Insurance Data to
Analyse Changing Spatial Forms. In Area, 29 (3): 228-240.


