The Economic Costs of Unsupplied Electricity: Evidence from Backup Generation among African Firms EPRG Working Paper 1326 Cambridge Working Paper in Economics 1351 Musiliu O. Oseni, Michael G. Pollitt Abstract Public electricity provision in Africa has been marred by under investment and frequent power outages. One of the strategies often adopted by firms to cope with this poor public supply is investment in backup generation. This strategy is not without cost however. Extant literatures on outage cost estimation have shown that firms possessing certain characteristics have a higher tendency to invest in backup generation. What is less known, however, is whether those firms suffer lesser or higher unmitigated outage losses (costs). Using cross-sectional data from 6854 firms currently operating in 12 African countries, this study investigated the extent to which firms’ characteristics might create incentives for auto-generation and whether these incentives lead to lesser unmitigated outage costs. We used three different methods including marginal cost, incomplete backup and subjective evaluation techniques. The results reveal that large firms, firms engaging in exports, and those using the Internet for their operation still suffer higher unmitigated outage costs despite having a higher propensity of investing in backup generation. The results further reveal that unmitigated costs still account for the larger proportion of the total outage costs despite high prevalence of backup ownership among the firms. This reflects the inefficiency in backup generation due to small backup capacity held by firms. Our estimates also indicate that ignoring firms’ characteristics such as size and the nature of operation (e.g. export promotion, internet usage, etc.) may result in underestimation of outage losses. The analysis further suggests that firms can still benefit significantly even when the current subsidised tariffs are replaced by cost-reflective rates that ensure stable electricity supply. The net outage cost (having adjusted for a cost-reflective tariff) incurred by firms are large enough to expand their scope of operation and hire more workers, suggesting the macroeconomic effect could be significant. www.eprg.group.cam.ac.uk
Transcript
The Economic Costs of Unsupplied Electricity: Evidence from Backup Generation among African Firms
EPRG Working Paper 1326
Cambridge Working Paper in Economics 1351
Musiliu O. Oseni, Michael G. Pollitt
Abstract Public electricity provision in Africa has been marred by under investment and frequent power outages. One of the strategies often adopted by firms to cope with this poor public supply is investment in backup generation. This strategy is not without cost however. Extant literatures on outage cost estimation have shown that firms possessing certain characteristics have a higher tendency to invest in backup generation. What is less known, however, is whether those firms suffer lesser or higher unmitigated outage losses (costs). Using cross-sectional data from 6854 firms currently operating in 12 African countries, this study investigated the extent to which firms’ characteristics might create incentives for auto-generation and whether these incentives lead to lesser unmitigated outage costs. We used three different methods including marginal cost, incomplete backup and subjective evaluation techniques. The results reveal that large firms, firms engaging in exports, and those using the Internet for their operation still suffer higher unmitigated outage costs despite having a higher propensity of investing in backup generation. The results further reveal that unmitigated costs still account for the larger proportion of the total outage costs despite high prevalence of backup ownership among the firms. This reflects the inefficiency in backup generation due to small backup capacity held by firms. Our estimates also indicate that ignoring firms’ characteristics such as size and the nature of operation (e.g. export promotion, internet usage, etc.) may result in underestimation of outage losses. The analysis further suggests that firms can still benefit significantly even when the current subsidised tariffs are replaced by cost-reflective rates that ensure stable electricity supply. The net outage cost (having adjusted for a cost-reflective tariff) incurred by firms are large enough to expand their scope of operation and hire more workers, suggesting the macroeconomic effect could be significant.
Contact [email protected] Publication November 2013 Financial Support Cambridge Judge Business School Scholarship
www.eprg.group.cam.ac.uk
EPRG 1326
The Economic Costs of Unsupplied Electricity: Evidence from Backup Generation
among African Firms
Musiliu O. Oseni*’1, Michael G. Pollitt*
* University of Cambridge Judge Business School, CB2 1AG, Cambridge, UK *Energy Policy Research Group (EPRG), University of Cambridge
Abstract
Public electricity provision in Africa has been marred by under investment and frequent power outages. One of the strategies often adopted by firms to cope with this poor public supply is investment in backup generation. This strategy is not without cost however. Extant literatures on outage cost estimation have shown that firms possessing certain characteristics have a higher tendency to invest in backup generation. What is less known, however, is whether those firms suffer lesser or higher unmitigated outage losses (costs). Using cross-sectional data from 6854 firms currently operating in 12 African countries, this study investigated the extent to which firms’ characteristics might create incentives for auto-generation and whether these incentives lead to lesser unmitigated outage costs. We used three different methods including marginal cost, incomplete backup and subjective evaluation techniques. The results reveal that large firms, firms engaging in exports, and those using the Internet for their operation still suffer higher unmitigated outage costs despite having a higher propensity of investing in backup generation. The results further reveal that unmitigated costs still account for the larger proportion of the total outage costs despite high prevalence of backup ownership among the firms. This reflects the inefficiency in backup generation due to small backup capacity held by firms. Our estimates also indicate that ignoring firms’ characteristics such as size and the nature of operation (e.g. export promotion, internet usage, etc.) may result in underestimation of outage losses. The analysis further suggests that firms can still benefit significantly even when the current subsidised tariffs are replaced by cost-reflective rates that ensure stable electricity supply. The net outage cost (having adjusted for a cost-reflective tariff) incurred by firms are large enough to expand their scope of operation and hire more workers, suggesting the macroeconomic effect could be significant. Keywords: Africa, Backup, Electricity, Firms, Outage costs, Two-Limit Tobit JEL Classification: L6, L81, L94, N77, Q4
1. Introduction
The importance of electricity to the economic development of any nation cannot be overemphasised.
Access to reliable electricity supply increases the productivity and welfare of society. To business
enterprises, electricity serves as an indispensable input. Apart from its necessity for running many
industrial machines, its contributions to the productivity of human capital are enormous. Virtually all
business activities, especially industrial units, require constant and effective flow of electricity.
Similarly, efficient functioning of the electricity system sometimes determines the comfort of workers
while the possession of a generator has a significant positive effect (Arnold et al., 2008). Indirect costs
(of which energy costs account for the largest share) are a major factor responsible for the low
productivity of enterprises in Africa (Eifert, Gelb, & Ramachandran, 2008). A study of 17 micro-
enterprises (12 carpentry and 5 tailoring workshops) in Kenya has also found that the use of electricity
2 A report by ADB (2009) shows that lack of a reliable electricity supply was by far the most binding constraint to doing business in Nigeria for more than 80% of the firms surveyed.
can raise productivity per worker by approx. 100-200% for carpenters and by 50-170% for tailors,
depending on the item being produced (Kirubi et al., 2009).
Between 2006 and 2010, more than 50% of the Sub-Sahara African firms identified electricity as a
major constraint to their businesses compared to just 27.8% that named transportation as the most
critical problem in the World Bank Surveys of Business Enterprises (World Bank, 2012)3. In 2007,
about 25% of firms in Sub-Sahara Africa identified electricity as the biggest obstacle followed by
financial constraint identified by 20% of the firms (Figure 1).
Figure 1: Percentage of Firms Identifying each of the Constraints as the Biggest Obstacle in 2007
0.0
10.0
20.0
30.0
40.0
50.0
60.0
70.0
Percentage
Data Source: World Bank Survey of Public Enterprises Database 2012
Finance
Land Access
Licensing
Corruption
Courts
Crime
Trade Reg.
Electricity
Inadeq. edu. workforce
Labor reg.
Political instab.
Informal sector pract.
Tax admin.
Furthermore, an average Sub-Sahara African firm suffers the loss of economic activities for about 77
hours a month due to power outages. The situation is even more pathetic in some countries and more
worrisome when compared with other developing regions of the world. In 2007 for instance, an
average firm in Nigeria experienced an outage of 8.2 hours 26.3 times in a typical month. This
translates to loss of economic activities for 216 hours (9 days), on average, in every month, assuming
no palliative measure. Meanwhile, an average firm in East Asia & Pacific experiences power outages
of less than 15 hours a month. Similarly, a typical firm in Latin America & the Caribbean only suffers
electricity cuts of about 6 hours a month (World Bank, 2012).
Given the prevalence of power outages, firms in Africa have adopted different strategies to cope with
this poor electricity supply. Some of these response adjustments include choice of business, choice of
location, output reduction, factor substitution and self generation. While all these strategies are
observable among African firms, the most commonly adopted strategy by firms is investments in
3
3 In 2007, the percentage of firms identifying electricity as a major constraint in Ghana was 86%.
4
alternative generation (i.e., complementary capital). Many electricity users – both households and
firms – now find it necessary to make their own generation in part or in whole to make up for the
inadequate provision resulting from the inefficiencies of the public power system. As a matter of fact,
many end users of electricity (from small to large enterprises) now operate small to medium-sized
plants with capacities ranging between 1 MW and 700 MW for own generation (Karekezi & Kimani,
2002). Self generation has been on the increase and own generation now accounts for more than 20%
of generation capacity in some countries in Africa (Foster & Steinbuks, 2009).
A great issue of concern with this strategy is that while investment in a generator enables firms to
continue their operations in the event of power outage; it undermines firms’ capacity to finance other
productive investments. Reinikka & Svensson (2002) find that unreliable and inadequate electric
power supply significantly reduces investment in productive capacity by firms in Uganda. Firms
invest in auto-generation when the public provision is unreliable. The direct cost of this action,
however, is that less productive capital is installed. In addition to this there are diseconomies of scale
in self generation. A joint report by the UNDP/World Bank in 1993, for instance, estimated the cost
differential between self generation and public provision for large industrial firms in Nigeria to be
between 16 – 30% (World Bank, 1993). However, previous studies might have over-exaggerated the
cost-differential between own generation and national grid because they ignored the fact that the
currently operated tariffs of public utility in Africa are highly subsidised.
Auto-generation does not necessarily mitigate the electrical impact of losses due to the unreliability or
lack of full capacity of the own generator. Unmitigated outage losses (or costs) are the losses (e.g.
damage to equipment stock, loss of output, restart costs, etc) suffered by a firm due to the inadequate
or lack of proactive measures against the incident of power outages. Unmitigated outage losses are
equal to the total outage losses if no portion of the potential losses or damages due to power outages is
mitigated – e.g. when a firm had not invested in backup generation. For a firm that has invested in
auto-generation, unmitigated outage losses/costs are the portion of the losses/costs that the firm is
unable to alleviate due to the inadequate backup capacity or the unreliability of the backup.
Although the use of a backup generator is common among African firms given poor public provision
of power, a number of studies have argued that firms’ size and export promotion significantly
influence the decision to own a generator (Adenikinju, 2003, Steinbuks & Foster, 2010). In other
words, larger firms and those that own International Standard Organisation (ISO) certification do self-
generate more than others. However, what is less known is whether larger firms – considering their
tendency for backup capacity – suffer more or less unmitigated outage loss (cost) compared to smaller
firms. Similarly, it is (still) not clear whether firms holding ISO certificates suffer less or more
5
unmitigated losses. Besides, the effect of the use of the Internet on backup generation and how it
affects unmitigated outage losses have not been examined. We investigate these issues using data on
the year 2007 backup generation by 6854 business enterprises in 12 African countries. We first re-
examine the roles of firms’ size and export promotion as well as the use of the Internet on backup
generation. We then investigate how those factors affect unmitigated loss (cost) using the method
proposed by Beenstock et al. (1997). Specifically, we concentrate on the following questions:
What is the relationship between firm size, export promotion (e.g. ISO certificate ownership),
internet operation and unmitigated outage loss?
To what extent does investment in backup generation mitigate outage loss? In other words, are
firms able to mitigate most of their outage costs by investing in backup generation?
Is own generation (measured in terms of outage cost) still costly compared to public utilities
under a cost-reflective tariff regime?
The rest of this study is structured as follows. Next section presents the theoretical framework and
hypotheses tested in this study. Section 3 presents some of the previous blackouts experienced in the
world. Section 4 reviews the literature while Section 5 presents the methodology explored in the
analysis. Section 6 presents the overview of data followed by discussion of empirical results in
Section 7. The last section concludes.
2. Theoretical Framework and Hypotheses
2.1. Theoretical Framework
Making an investment decision is critical to business activities as it relates to or affects the overall
business objectives. The profitability level of a firm depends on how good or bad its investment
decision is. While a good investment decision increases the profitability and enhances the financial
viability of firms, poor choice of investment reduces the financial capability and sometimes causes
firms to be liquidated. Investment in fixed capital, often referred to as business fixed investment, has
both the relative costs and (expected) benefits that often influence firm’s decision to embark on such
spending. The user or rental cost of investment is affected by the price of capital, the real interest rate
and the depreciation rate4. The real cost of a unit of capital to a firm is the ratio of rental cost to the
price of a unit output produced from the capital installed. On the other hand, the benefit of a unit of
capital is the marginal product of output derived from adding it to the production process. Like the
cost, the extent to which a firm benefits from capital investment depends on the existing capital level,
4 In relative term, the real cost of capital depends on the relative price of a capital good, the real interest rate, and the depreciation rate.
6
the amount of labour employed and the level of technology. A rational firm would invest in capital if
the marginal product of capital exceeds or equals the associated marginal cost, and vice versa
(Jorgenson, 1963). In other words, in making an investment decision, firms would equate the expected
marginal benefit from that investment to the marginal cost of the investment.
Investing in backup generation is not costless and therefore has to be taken judiciously. A firm
experiencing power outages would have to consider the marginal benefit of investing in backup and
the marginal cost of purchasing and running the plant. For instance, a firm experiencing frequent
power outages would have to decide whether (1) to invest in backup generation and be able to
continue operations in the event of outages but at the required costs, or (2) not to invest in backup
generation and shut down operations during power outages. A firm can choose the first option if it
considers it to be a rational decision to own a generator in order to be able to continue operations
during outages. On the contrary, another firm may consider the second alternative to be its rational
and optimal decision. The latter might consider the costs of owning and operating a generator (i.e., the
user cost) to be too high compared to the gain from continuing operations in the events of outages.
Investment in new capital stock with respect to changes in its determinants may be limited if the fixed
adjustment costs are too great to justify the potential gains (Nickell, 1978). Therefore, a rational firm
would equate at the margin the expected cost of generating a kWh of its own electricity to the
expected benefit from that kWh (Bental & Ravid, 1982). That gain consists of the continued operation
that the self-generated electricity makes possible, and the damage to equipment stock that would have
been caused by a power outage.
Decisions to invest in energy related goods can be driven by many non-economic factors as long as
those factors influence the marginal benefits of such investments. Company size, sectoral and regional
differences, and other organisational factors play important roles as economic drivers in explaining
firms’ lighting investment decisions (Decanio & Watkins, 1998; DeCanio, 1998). The level of gain
from investing in backup generation (i.e., the marginal benefit or marginal product of a unit backup)
can be driven in part by certain organisation’s characteristics. The number of workers in a firm, for
instance, may influence the marginal productivity of backup generator. Purchasing a backup generator
alone does not earn direct benefits to a firm; it is meant to power the available capital or machines
whose productivity in turn depends on the human capital available to the firm.
Traditionally, size of firms is considered an important factor that influences the behaviour of firms or
organisations. A number of management literatures, for instance, have shown that organisational size
plays important roles in the investment decisions of firms. Bøhren et al. (2007); Gugler et al. (2007);
and Raza et al. (2012) found that the size of firms positively and significantly affects the level of
investments and cash flow-investments sensitivity. The existence of a positive relationship between
7
the firm’s size and the level of investment can be linked to the ability of large firms to attract more
funds to finance investments compared to smaller firms.
Many business organisations (both large and small) now make use of the Internet for their operations
in order to become more productive and competitive. The use of the Internet (synonymous with
technological innovation in neo-classical theory) for business operations enhances the connections
between firms, their suppliers and consumers; this in turn increases productivity and competitive
advantage. A number of studies have focussed on the impacts of the Internet on existing business
models (see Cronin et al., 1994; Hoffman & Novak, 1997). Fuller and Jenkins (1995) conduct an
experimental study on the learning and business transformation process of small business adoption.
They found that the information richness of the environment in which the firm operates, the necessity
for collaboration in order to compete, and the business cultures present in electronic communication
play important roles in the use of the Internet by business enterprises. Similarly, a study by Poon &
Swatman (1997) presents the results from a case study of 23 Australian small businesses which were
both the early adopters and current users of the Internet. They found that firms predominantly use the
Internet as a medium of communications, advertising and as a document transfer channel. Also, the
study revealed that management enthusiasm and perceived benefits are the driving forces for the use
of the Internet by businesses.
Although a firm can benefit by investing in own generation, investment in a backup generator does
not always guarantee complete outage mitigation. In some cases, a firm may hold backup and still
suffer outage loss; this may be in form of restart cost and/or loss due to the inability of the backup
capacity to generate and supply the total required power load of the firm. Beenstock et al. (1997)
found that firms in Israel still incur unmitigated outage cost despite investing in backup generation.
Although the unmitigated portion of the total outage cost per kWh in their study is lower than the cost
of generating a kWh of own power, this may reflect the omission of the other factors (e.g., firm’s
characteristics) that may affect the amount of unmitigated cost as well as a firm’s incentive to invest
in backup.
While a firm’s characteristics may add to its incentive to invest in backup due to the perceived high
marginal productivity, they can equally play significant roles in determining the level of outage cost or
loss suffered by a firm. A larger firm, all things being equal, that experiences a power outage of two
hours would suffer more loss compared to a smaller firm which experiences the same duration of
outage. Similarly, effective usage of the Internet depends on continuous supply of electricity. A firm
whose operations depend on the use of the internet would suffer more outage loss, ceteris paribus, as
outage would affect its performance. Furthermore, an event of a power outage that prevents a firm
from meeting the international quality standard would reduce the firm’s competitive advantage and
8
results in higher outage losses compared to a firm without such certification. Considering both the
negative effect (in terms of the possible high outage costs) and the positive effect (in terms of the
incentive to invest in backup due to high marginal productivity) of firms’ characteristics would result
in some interesting questions that are needed to be answered: To what extent do these characteristics
affect the incentive to invest in backup technology? How do they affect the power outage costs,
especially unmitigated outage costs? In other words, do firms that possess particular characteristics
suffer more or less unmitigated outage costs compared to their counterparts?
2.2. Hypotheses
All over the world, the issue of (un)reliability of the power system has been a great source of concern
to both the regulators and other players (including consumers) in the sector. An unreliable power
system poses serious challenges to the socio-economic and political structure of an economy. Some of
these challenges include loss of welfare, pressure on governance, and loss of output among others.
Because of these challenges however, the affected consumers (especially industrial users) usually
provide alternative measures in order to curtail the effects of the poor public provision on their
economic activities. A prominent measure usually taken by firms is the generation of own electricity.
Firms invest in backup generation in order to continue operations during power outages. Therefore, it
is reasonable to expect the firms owning generators be able to curtail a greater portion of outage costs
through this action. Thus, our first hypothesis is
Hypothesis 1: Although power outages impose substantial costs on business enterprises, the greater proportion of these costs is curtailed by investing in backup generation. In other words, the value of unmitigated cost in total cost per kWh unsupplied is very small. Compared to smaller firms, larger firms are more likely to exercise demand for backup generator and
have less relative unmitigated costs compared to smaller firms. Furthermore, competitive advantage,
reduction in business operating costs and increased productivity enjoyed by firms from the use of the
Internet for their operations have greatly increased internet usage among business enterprises. Firms
use the Internet to communicate with their suppliers and for marketing and sales purposes. However,
the use of the internet can be greatly hindered by constant power outages. Since the efficient usage of
the internet requires an effective electricity supply, any power outage that affects firms’ internet usage
would result in decreased productivity, loss of sales and profits. Considering these effects however,
firms that use the Internet would probably invest more in backup generation and therefore suffer less
outage costs.
Firms are often issued an International Standard Organisation (ISO) certificate. ISO certificate is a
written assurance (certificate) given to a firm by an independent body, indicating that the products,
9
processes and services offered by a holding firm meet the specific requirements as stated by the
International Standard Organisation. A number of studies have identified significant potential benefits
for organisations holding ISO certificates. A 2011 survey from the British Assessment Bureau showed
that 44% of their certified clients had won new business as a result of becoming certified to the quality
management standard (British Assessment Bureau (BAB), 2011). Similarly, a study from Cornell
University’s Centre for Hospitality Research found that Spanish hotels that are certified to ISO 14001
environmental management standard are more profitable than those without (Segarra-Oña et al.,
2011). It is therefore logical to expect that the need to meet the international quality standard in order
to prevent the withdrawal of the ISO certificate would influence the internationally certified firms to
invest in backup generation compared to firms without such certification. Therefore, it is hypothesised
that:
Hypothesis 2: All else being equal, larger firms, firms using the internet for their operation and those that hold an ISO certificate suffer lower unmitigated costs relative to others, because they invest more in backup generation. Previous studies on the estimation of outage costs to firms in an African context have all concluded
that the outage costs suffered by firms are greater than the prices of electricity supplied from the
public grid. However, it is not clear whether this conclusion was driven by the fact that the current
electricity prices in Africa are heavily subsidised. Since the willingness to pay for reliability at a cost-
reflective tariff by firms would likely be influenced by whether outage costs incurred by firms are
more than the new tariffs or not, we hypothesise and test the rationality of own generation under a
cost-reflective regime as:
Hypothesis 3: Firms would incur outage cost higher than the cost (price) of electricity from the public grid when prices are cost-reflective; thus, it is irrational for firms to generate own electricity even under a cost-reflective tariff regime.
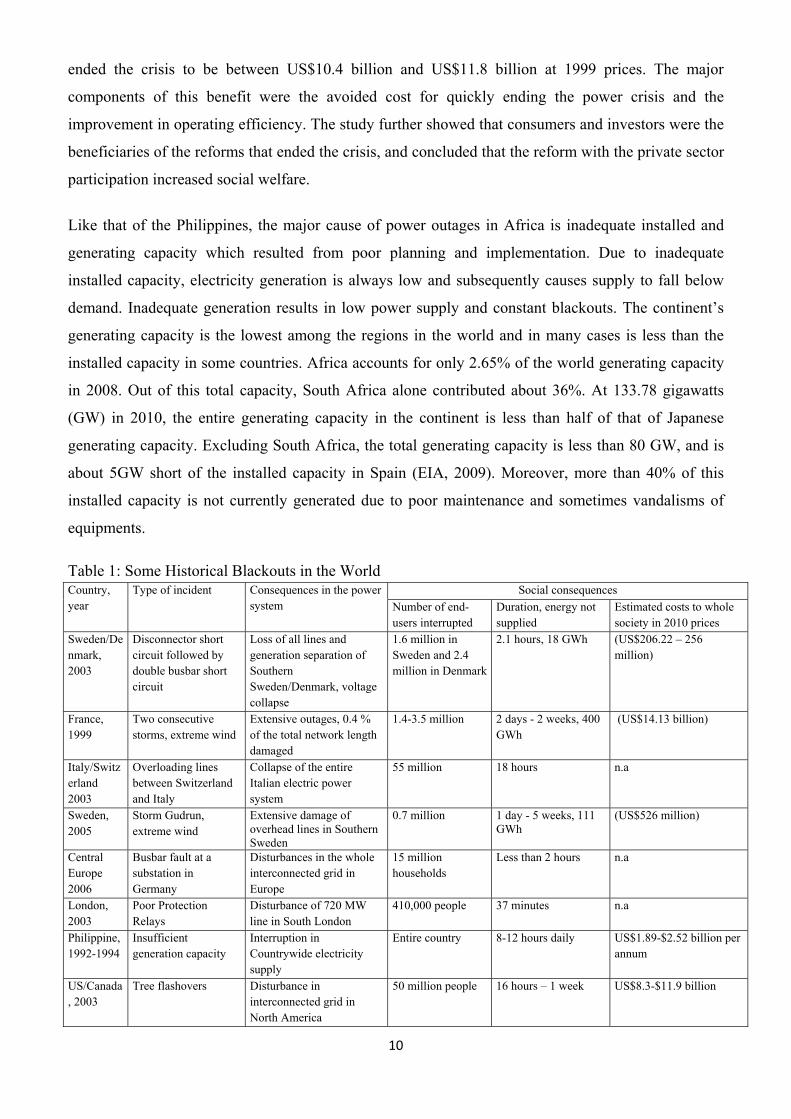
3. Historical Blackouts in the World Table 1 presents a summary of some major blackouts previously experienced in the world. Among the
previous outages, only the incident in the Philippines was caused by a factor similar to the main cause
of power outages in Africa. While the causes of major outages in Europe and North America have
been attributed to natural disasters or technical faults, the massive blackouts in the Philippines (1992-
1994) was caused by inadequate generating capacity. The inadequate capacity brought by poor
implementation of energy planning and obsolete power plants resulted in outage averaged 8-12 hours
per day. The estimated economic loss of this outage ranges from US$600 million –US$800 million
per annum (Austria, 1999). Meanwhile, Toba (2004) has estimated the economic benefits of ending of
power crisis in the Philippines. The study estimated the net benefit of reform and privatisation that
10
ended the crisis to be between US$10.4 billion and US$11.8 billion at 1999 prices. The major
components of this benefit were the avoided cost for quickly ending the power crisis and the
improvement in operating efficiency. The study further showed that consumers and investors were the
beneficiaries of the reforms that ended the crisis, and concluded that the reform with the private sector
participation increased social welfare.
Like that of the Philippines, the major cause of power outages in Africa is inadequate installed and
generating capacity which resulted from poor planning and implementation. Due to inadequate
installed capacity, electricity generation is always low and subsequently causes supply to fall below
demand. Inadequate generation results in low power supply and constant blackouts. The continent’s
generating capacity is the lowest among the regions in the world and in many cases is less than the
installed capacity in some countries. Africa accounts for only 2.65% of the world generating capacity
in 2008. Out of this total capacity, South Africa alone contributed about 36%. At 133.78 gigawatts
(GW) in 2010, the entire generating capacity in the continent is less than half of that of Japanese
generating capacity. Excluding South Africa, the total generating capacity is less than 80 GW, and is
about 5GW short of the installed capacity in Spain (EIA, 2009). Moreover, more than 40% of this
installed capacity is not currently generated due to poor maintenance and sometimes vandalisms of
equipments. Table 1: Some Historical Blackouts in the World Country, year
Type of incident Consequences in the power system
Social consequences Number of end-users interrupted
Duration, energy not supplied
Estimated costs to whole society in 2010 prices
Sweden/Denmark, 2003
Disconnector short circuit followed by double busbar short circuit
Loss of all lines and generation separation of Southern Sweden/Denmark, voltage collapse
1.6 million in Sweden and 2.4 million in Denmark
2.1 hours, 18 GWh (US$206.22 – 256 million)
France, 1999
Two consecutive storms, extreme wind
Extensive outages, 0.4 % of the total network length damaged
1.4-3.5 million 2 days - 2 weeks, 400 GWh
(US$14.13 billion)
Italy/Switzerland 2003
Overloading lines between Switzerland and Italy
Collapse of the entire Italian electric power system
55 million 18 hours n.a
Sweden, 2005
Storm Gudrun, extreme wind
Extensive damage of overhead lines in Southern Sweden
0.7 million 1 day - 5 weeks, 111 GWh
(US$526 million)
Central Europe 2006
Busbar fault at a substation in Germany
Disturbances in the whole interconnected grid in Europe
15 million households
Less than 2 hours n.a
London, 2003
Poor Protection Relays
Disturbance of 720 MW line in South London
410,000 people 37 minutes n.a
Philippine, 1992-1994
Insufficient generation capacity
Interruption in Countrywide electricity supply
Entire country 8-12 hours daily US$1.89-$2.52 billion per annum
US/Canada, 2003
Tree flashovers Disturbance in interconnected grid in North America
50 million people 16 hours – 1 week US$8.3-$11.9 billion
11
Source: (Bialek, 2004; Cowie et al., 2004; Ekraft-System, 2003; Larsson & Danell, 2006; Lu et al., 2006; Makarov et al., 2005; NERC, 2004; Silvast & Kaplinsky, 2007; UCTE, 2004; US-Canada Power System Outage Task Force, 2003, 2004). 4. Literature Review
The literature on the economics of power outages has so far been dominated by two different but
related issues. The first has to do with the cost of unsupplied electricity to the consumers (see
Andersson & Taylor, 1986; Beenstock et al., 1997; Bose et al., 2006; Lacommare & Eto, 2006; Pasha
et al., 1989; Sanghvi, 1982; Serra & Fierro, 1997), while the second has focused on the optimal
reliability of electricity supply (Munasinghe, 1981; Sanghvi, 1983). These issues are related because
the consumer facing an unreliable power supply will insure himself against possible power outages by
investing in backup generators and related equipment to cover, in whole or in part, the loss induced by
power outages.
A study by Bental & Ravid (1982) was the first to point out that the costs of power outages to a firm
can be estimated using data on backup generators. The study assumed that decision makers in a firm
act rationally and hedge to insure themselves against part or total damages that can be caused by
power cuts, by investing in backup generating plants. They further assumed that firms are
competitively risk-neutral, and thus will equate at the margin, the expected cost of self generation of a
kWh to the expected benefit from that kWh. They compute the marginal cost of unsupplied electricity
for the US and Israel. Their results indicate that outage cost varies proportionally with reliability (low
outage time); outage cost tends to be higher in the US where reliability is higher than in Israel where
reliability is lower. Beenstock (1991) proposed a refinement of the methodology proposed by Bental
& Ravid (1982). The study distinguished between the absolute, mitigated and unmitigated costs of
power outages, and also incorporated risk aversion phenomenon in computing the cost of power
outages. Contrary to Bental & Ravid (1982), the study found that, based on self constructed or
assumed data, the cost of outage varies inversely with the levels of reliability of electricity supply and
that expenditure on generator is sensitive to outage risks. Of course, consumers would be willing to
invest in backup as service becomes less reliable but would face a discontinuity at a point when risks
associated with additional loss of service or interruption appear to be insignificant.
The use of backup data to infer the cost of power supply reliability was pioneered by Matsukawa &
Fujii (1994). They empirically examined the consumer preferences for reliability in electricity supply
using data on backup investments among the Japanese firms using large computer systems. Utilising a
probabilistic discrete choice model, the study found that customers faced a trade-off between the price
and reliability of the power system. Their results indicate that demand for backup varies inversely
with the reliability of electricity supply and the user cost of backup investments. They also showed
that the characteristics of customers such as the type of business and levels of electricity consumption
12
significantly affect the choice of backup equipments. The major problem with their methodology is
the omission of information on the quantity of backup which may have important implications for
their findings. This problem was corrected in a study by Beenstock et al. (1997). They built on the
methodology proposed by Beenstock (1991) and applied it to data on investments in backup
generators and uninterruptible power supplies (UPS) to empirically examine the implied cost of power
outages on Israeli industrial and public sectors. Based on a neutrality assumption about the behaviour
of the firms and the public sector, they estimated two-limit Tobit models of demand for backup to
simulate the mitigated and unmitigated cost of power outages in the sectors. They found that the
demand for backup and the total cost of outages varies inversely with reliability of service, while the
marginal cost per kWh of unsupplied electricity varies directly with service reliability. In other words,
the decision to invest in backup and the total outage cost increases as power outage increases but the
marginal cost of this outage declines, possibly due to investments in backup that have already taken
place which mitigates the incremental effects of any additional outage duration.
Pasha et al. (1989) quantify the economic cost of power outages using a surveyed data on a sample of
843 firms in industrial sector of Pakistan. They estimated the overall cost of outages to be about 8.8%
of the value added by the industrial sector in 1984-85. Their results showed that the shares of planned
and unplanned outages in these costs are about 65% and 35% respectively. Their analysis further
indicates that industries that are most severely affected by outages are food, beverages and tobacco,
textiles, metal and metal products, and machinery and equipment. The study further estimate the
multiplier effects of the industrial outages’ cost to be 1.34 and concluded that power outages in the
industrial sector led to 1.8% reduction in overall GDP in 1984-1985.
However, while this analysis might provide a good insight about the multiplier effects of power
outages in an economy, it has suffered from some major flaws. The analysis was principally based on
the loss reported directly by the surveyed firms (i.e. self assessment). Such self-assessment data
obtained from business are often inaccurate and may not actually represent the true cost of outages.
For instance, firms may exaggerate their reported outage costs in order to impress the utility company
and the regulator or the government about the need for more reliable electricity. Or they may do that
so that they can disproportionately shift the burden of a little increase in tariffs to consumers of their
products thereby making economic profits. For example, the utility company or the regulator may
raise the electricity tariff, based on the reported outage costs, in order to improve reliability in the
system. If this happens, firms may use this as an opportunity to significantly increase the price of their
products (by claiming that the increasing tariff rates have significantly raised their cost of production),
thereby making economic rents. Another reason that may account for the bias in the reported loss is
the difficulty in measuring the output of some businesses/sectors. For example, it is difficult to
13
measure the output of some firms (e.g., hospitals, police, hostelry, etc.) and any reported loss in the
event of an outage may be incorrect. Furthermore, such data based on self assessment may be
unreliable given the possibility that interviewees may be unaware of the costs or may be unable to
devote sufficient time to carefully complete the questionnaire.
A variant of revealed preference method have been used by Caves et al. (1992) to infer the cost of
outages from the decision of large industrial consumers to participate in interruptible service programs
(i.e. curtailable schemes) introduced by a US utility in the early 1980s. The participants were assumed
to experience outage costs that were less than the discounts they receive in return for their
participation in the schemes. However, this methodology ignores the possible effects of backup
investments on the decision of firms to participate in curtailable services. While backup investment
may be a cheaper and a preferred option for some firms, other firms may find both backup and
curtailable schemes necessary. Backup investments are not 100% reliable and also have fixed cost that
has to be spread on the units of output produced, depending on the scale of operation, which may
make it unaffordable to small firms. While backup investment may be a cheaper (e.g. large firms may
find it cheaper but not always the case) and a preferred option for some firms, other firms may find
both backup and curtailable schemes necessary especially when considering the incomplete reliability
of backup investment. Thus, a complete analysis of this type would involve a concurrent treatment of
backup investments and participation in curtailable schemes service.
Despite the low reliability of electricity supply in developing countries, empirical studies on the
economic costs of power outages in Africa are still very limited, probably due to the lack of
appropriate data that could be used for such research. As a matter of fact, the methods employed by
the few existing studies on this issue in African context have been very limited and could not provide
proper understanding of the costs of outages. Steinbuks & Foster (2010) have studied the causes of in-
house electricity generation and its costs among 8483 firms in 25 African countries using a panel data
from 2002 – 2006. They estimated two binary choice models of generator ownership and its capacity.
They found that the size of the firm and export regulation play more important roles than reliability of
supply in the decision to invest in backup generator. Using the Bental & Ravid (1982) proposed
method, their estimates of costs of power outages show that firm incurs more cost to generate its own
electricity than the price paid for a kWh of electricity supplied by utilities. However, the study could
not find a significant difference between the costs and benefits of own generation, probably because
14
the study ignored other benefits that can result from self generation.5Table 2 summarises some of the
previous studies on the cost of power outages.
5 Their analysis of benefit was only based on reduction in lost sales due to self generation. They did not account for other important benefits such as reduction in damage to equipments, raw materials, restart costs, etc which may sometimes constitute the largest components of outage costs.
EPRG 1326 Table 2: Summary of Some Previous Studies on the Estimation of Cost of Power Outages
Study Scope Method/Data Focus Findings/Outage cost estimates in 2007 prices Bental & Ravid (1982)
US & Israel
Data on firms’ average outage duration in 1980. -US: 10 hours p.a. -Israel: 70 hours p.a. Marginal cost approach.
Computation of marginal outage costs.
Reliability varies directly with outage costs. Outage cost: Israel - US$0.40/kWh US – US$2.23/kWh
Pasha et al. (1989)
Pakistan Nationwide random survey of 843 firms in 1984/85 Reported loss data - Planned outages - Unplanned outages
Computation of output loss due to power outages, Computation of the multiplier effects of firms’ loss due to outages on the overall economy.
Overall outage cost accounts for 8.8% of industrial output value added. Off which - Planned outages: 65% - Unplanned outages: 35% Outage multiplier: 1.34 Overall impact on GDP: 1.8% reduction Outage costs per kWh: - Planned: $0.58 - Unplanned: $1.02
Caves et al. (1992)
US Use of data on interruptible service schemes. - 8 participants - 11 non-participants
Estimation of shortage cost. None of the parameter estimates was significant. Expected outages costs decrease as the size of the interruption increases. Shortage cost (Utility): $4.63 - $5.58/kWh. Outage cost for Industry: $6.97-$34.85/kWh.
Matsukawa & Fujii (1994)
Japan 1988 Survey of backup among industrial & commercial consumers with large computers by CRIEPI, Japan Mailed questionnaires - Sample: 2,200 -Complete questionnaire Returned: 236 Discreet choice model
Computation of outage costs using back-up data, Evaluation of the factors affecting the demand for back-up.
Demand for backup varies inversely with reliability & user costs of backup investments Customers face trade-off between price & reliability of power supply Customers characteristics have significant effects on backup investment Outage cost: $50.72 - $236.17/KW
Beenstock et al. (1997)
Israel Surveying of 794 business and public sectors. -Data on backup -Reported losses -Firms characteristics Two-limit tobit model.
Separation of total outage cost from unmitigated cost, Comparison between the computed costs from revealed datasets and subjective datasets analyses
Outage cost - $9.21/kWh Unmitigated cost- $3.45/kWh Total annual cost – $45.34/KW Back-up rate – 33 percent Reliability varies inversely with demand for backup and total outage cost, but varies directly with marginal cost per kWh unsupplied.
Steinbuks & Foster (2010)
Africa Use of firms’ datasets on back-up & sale losses - 25 countries - 8483 firms - dataset between 2002 & 2006 Probit & tobit models Marginal cost method
Computation of outage costs, Investigation of drivers of auto-generation, Evaluation of cost-benefits with focus only on sale loss reduction.
Impact of power unreliability on demand for generator is limited Outage cost varies directly as reliability The cost-benefit of self generation is not significant Outage cost: $0.13 - $0.76/kWh
15
EPRG 1326
16
5. Methodology
Many empirical studies have attempted to measure the cost of power outages to businesses
(industrial sector) using different methodologies. These methodologies can be generally categorised
into two: estimates based on macro data, and studies based on micro analysis of individual plants.
One of the most popular and pioneering is the use of macro data by Telson (1975) to compute the
upper and lower bounds on cost estimates of unsupplied electricity. The upper bound is
approximately the ratio between GNP and total electricity consumption while the lower bound is the
aggregate wage bill per unit of electric energy consumed. Among the studies that have used similar
techniques include the literatures on value of lost load (VOLL) such as Leahy & Tol (2011), Tol
(2007), Willis & Garrod (1997), de Nooij et al. (2007). The macro approach benefits from its
simplicity and ease of implementation compared to many other methods.
Despite the advantages enjoyed by this approach however, its implicit assumption of no substitution
between electricity and other factors of production is questionable. The use of (value added of)
output-energy ratio in each sector as an estimate for the output lost due to unserved energy unit
clearly demonstrates that the industries that are less electricity-intensive would have the largest loss
per unit of energy unsupplied. Furthermore, such computations only estimate average cost of
unserved energy, whereas the interest should be on (1) the marginal cost, since an electric utility has
to decide on additional capacity or marginal cost or worth of reliability; (2) the curtailable risks (or
mitigated costs) by customers, since the amount of loss that consumers are able to curtail through
their actions in the event of an outage would definitely have impacts on their willingness to pay for
extra reliability from the grid; and (3) the unmitigated costs, because the amount of loss the
customers are unable to prevent through their actions would affect their decisions in evaluating how
much more reliability is necessary for their businesses.
The first sub-category of studies on micro analysis of individual plants are usually based on
questionnaires where firms are either asked to report the losses suffered from outages and the
average outage duration experienced in a typical period, or to estimate the costs to their companies
during typical interruption scenarios. Such reported loss components often include lost sales,
damage to goods or raw materials, damage to equipment, etc. Among these literature are
Munasinghe & Gellerson (1979), Pasha et al. (1989), Raesaar et al. (2006), and Tishler (1993).
Analyses based on such reported data are often referred to as subjective evaluation because the
estimates are normally prone to severe inaccuracies. Firms may have good reasons to overstate or
17
ignorantly understate their losses.6 Furthermore, it is often very difficult to aggregate the different
estimates that may ensue from individual plants; and therefore, it may be difficult to formulate
policy based on such estimates.
The last category is based on the principle of revealed preference or investment method in which
the costs of outage are inferred from the actions taken (e.g. captive power generation) by firms to
reduce the economic costs of power interruptions. In comparison with the methods previously cited,
this one allows for the estimation of the marginal cost of an unserved kWh of energy, the total cost
of unserved energy, the mitigated and unmitigated costs (or losses), and it is free from (or less prone
to) over or undervaluation problems. Among the studies that support this approach are Adenikinju
(1994), and Steinbuks & Foster (2010). The present study explores this approach in two different
forms. First, it uses the marginal cost method version to compute the cost of unserved energy (as in
Adenikinju, 2003; Bental & Ravid, 1982; Steinbuks & Foster, 2010). Second, it computes other
outage costs (unmitigated and total) using a better methodology that allows for incomplete backup
following Beenstock et al. (1997). Lastly, the study also computes outage cost estimates using the
subjective evaluation method (as in Pasha et al., 1989) for comparative purposes. We also allow for
the effect of incomplete backup in the subjective evaluation technique by including backup rates.
As earlier stated, the latter may overstate or understate the costs of outage because the analysis
relies on the reported outage losses by respondents, given the previously stated reasons.
5.1. Revealed Preference (Investment) Approach
In every case, power interruptions impose economic loss on businesses, though some functions of a
business (or some businesses) may be more vulnerable to power outages than others. That is, an
outage of a given duration may impose large losses on certain parts of a business (or on certain
firms) while other parts (or other businesses) may be less affected or left virtually unscathed. For
example, an emergency unit of a specialist hospital would require constant flow of electricity for
running its blood bank, ECHO machine, CTC scan, X-ray machines etc, and any power interruption
would result in great losses, while the parking department of the hospital may be left virtually
unscathed or suffer minor inconvenience. Similarly, expensive raw materials may be wasted as a
result of power outages in an iron and steel producing firm, while a book distribution business may
only suffer some minor inconvenience. Firms are rational and have an incentive to take alternative
measure by investing in auto-generation to mitigate, in whole or in part, the damage that may result
from power outages. In most cases, given the rationality of the firms’ managers, they always
6 The reasons for businesses to overstate or understate their losses are already discussed under literature review.
18
prioritise those functions of their businesses that are most vulnerable to outages when deciding to
invest in backup technology. In other words, rational managers would back up that part of the load
that serves the business most vulnerable units.
5.1.1. Marginal Cost Method
Investing in backup generation is expensive and may not be economically viable if it is not well
planned. Firms have to choose the optimal amount of backup power by considering its energy load
and the damage the remaining unserved energy would cause. Therefore, the firm’s problem is to
decide and choose the optimal degree of backup that minimises the sunk costs incurred in procuring
generation capacity as well as the damage that would result from power interruption. A competitive
risk-neutral firm will maximise the expected benefits from generating a kWh from its plant by
equating at the margin, the expected cost of generating the kWh to the expected benefit from that
kWh. This benefit consists of the continued production (even if partial) made possible by self-
generated electricity, and the reduction or prevention of other costs, such as damage to equipment,
loss of reputation due to inability to meet customers’ demand, etc, that would have resulted from
power interruption. The marginal cost of own-generation serves as an estimate for marginal outage
cost because the expected marginal gain from auto-generation equals the expected loss from the
kWh not supplied by the utility provider.
Following earlier l re, the equation that computes the marginal cost of power outage is: iteratu
1
Where , are generator capacity, outage time and variable cost per kWh respectively.
Equation (1) can be used to compute the marginal cost of self-generation using data on the firm’s
acquisition and running cost of own-generating capacity, and the duration of power outages. To
achieve this result, values for , , and must be obtained.
5.1.2. Incomplete Backup Method
The method proposed by Beenstock et al. (1997), unlike the marginal cost method, account for the
possible losses that a firm may incur due to incomplete backup in the event of power interruption7.
Thus, the method allows for separate estimation of the total and unmitigated outage costs. The
underlying functional heterogeneity in the risk exposure to power interruptions of different 7 In most cases, investment in backup capacity does not guarantee 100 percent reliability. Thus, a company that invests in own generation may still suffer some losses because of the inability to completely back up its load. This is also linked to the earlier statement that firms will at least try to back up the most vulnerable functions of its establishment.
19
business’ units simply implies that rational managers will likely ensure continuous electric service
to the most vulnerable units by investing in backup generation. The optimal level of scale of this
backup would mostly depend on the level of vulnerability, the capital and the operating cost of
backup generator, and the expected outage time. Similarly, mitigated and unmitigated losses depend
on the backup size. In other words, the greater the backup capacity, the higher will be the mitigated
loss, and t e smaller will be the unmitigated loss in the event of an outage. h
Defining as a point on the loss distribution incurred due to power outage, and assuming that the
portion of the loss below (i.e., the maximum affordable loss) is not backed up while the loss
above it is backed up, a competitive risk neutral firm will minimise its total yearly cost of outages –
i.e. user cost of backup plus the unmitigated loss – with respect to . At the optimum, the firm will
equate the cost of a marginal kW that is not backed up to the marginal cost of backup ,
w i s of : h ch is a sumed to be constant. Thus, the following equation holds for the optimal level
There will be some backup if 0 and there will be complete backup when
, where and are respectively backup capacity an c loa of the f m. d ele tricity d ir
Assuming an exponential loss distribution of form , where is a scale variable,
Beenstock et al. (1997) have shown that the optimal demand for backup is
2
This implies that the demand for backup varies inversely with the cost of backup , but directly
with the firm’s load , and the unreliability of the power supply, . Firm knows the loss distribution
, and the mean outage time . Equation 2 may be rewritten to express the underlying mean
value of an outage loss (see Beenstock et al., 1997) as
1Ε 3
and nca be parameterised as:
βΖ 4
Where β is a row vector of parameters; Ζ is a vector of observable variables hypothesised to
determine the underlying mean value of an outage loss (i.e, 1 ). ; 0,
represents unobserved heterogeneity in losses across firms; and ~ 0, captures the
20
optimisation error by firms. Lastly, , 0 indicates that the unobserved heterogeneity is
independent of firms’ tendency to invest in too small or too much backup relative to the optimal
level.
Firms may report during the survey that they do not suffer losses in the event of power interruptions
for some few possible reasons. They can be naturally immune to outage losses (given the nature of
their businesses) in which case they do not need to invest in backup, or they are fully backed up
(i.e., ). Firms may invest in complete backup because it is optimal (e.g., there may be
economies of scale in backup investment), due to optimisation error, or due to indivisibility in
backup investment. Similarly, the same reasons apply to those firms that do not invest in backup.
Rationally, there are four possible cases regarding the investment in backup generation and outage
losses. These are cases of incomplete backup (i.e., there is backup and reported outage losses), no
backup but there are outage losses, complete backup (i.e., backup and zero outage losses) and lastly
natural immunity to outages (i.e., no backup and no losses).8These four possible cases imply that
the dependent variable in Eq. (4) is a censored variable, censored from below at zero and from
above at , where is an unknown positive parameter above which only complete backup is
econom as ically valuable. Thus, the latent variable is defined
0 Ζ 0 . ., 0 Ζ . . , Ζ . . ,
5
The estimates of parameters in Eq. (4) are obtained by regressing on the observed variables
using “two-limit tobit” estimation (see Maddala, 1983 pp. 160-162). The estimate of the mean
outage loss for firm will be 1 Ζ ̂ and the unmitigated loss of an outage can be inferred,
given the estimate for , as9:
6
wh aile the tot l outage cost to a firm can be estimated as
6
Thus, Eq. (7) computes the expected unmitigated outage loss to a firm , having classified the firm
into any of the four categories discussed above using their backup-outage losses information, as:
8 A possible irrational case could be when a firm still invests in backup despite being naturally immune to power outage. This irrational case is ignored in this empirical study. 9 Readers are referred to Beenstock et al. (1997) for detailed procedures involved in this method.
21
Ε 1 ⁄ 7
5.2. Subjective Evaluation Method
As noted earlier, this method estimates the cost of outages from the losses suffered due to electricity
outages by firms. During the survey, firms are asked to report the values of the losses they suffer
due to power outages. The reported loss data are then regressed on the outage duration and the other
characteristics of the firm. A key element of these characteristics of the firms is the backup rate,
which captures the impacts of backup investment on outage losses. All things being equal, a firm
with more backup are likely to suffer smaller unmitigated loss. Eq. (8) relates the firms’ total loss to
a set of variables that may account for variation in losses across firms
Η 8
Reported loss due to an unsupplied kWh to customer of duration ,
A matrix representing the characteristics of consumers and outages, Η
= A row vector of unknown parameters,
Random error term.
The dependent variable is a restricted variable considering the fact that some firms may report
zero loss, either because they have natural immunity to outage or because they have fully backed up
their loads. Using zero as the lower limit and setting the upper limit at Α (where Α represents the
maximum loss set by the author to control for “protest responses” in the reported losses, and in this
case it is set at –$100 per kWh. This restriction is to control for a number of instances where the
reported losses may be unreasonably large. As noted earlier, the respondents (firms) may report
unusually high losses to register their discontent with the public utilities. So, to control for these
instances, we set the upper limit at $100 per kWh. This amount is considered high enough
considering the trends of the reported outage losses. In fact, less than 5% of the firms reported
outage losses of $100 and above.10 Thus, we can estimate Eq. (8) using a two limit Tobit estimator
as
Α Η Α
Η 0 Η Α
0 Η
Finally, the unmitigated outage cost for an average firm can be computed as follows
10 Upper limit of $80 and $120 per kWh are also considered but do not yield significantly different estimates. This is because those firms which reported values greater than $100 recorded significantly higher values above this threshold.
22
Η Θ Θ 1 Α 9
Where
ulative standard normal density function at Cum Η ,
ulative standard normal density function at Η , Cum
Standard normal density fun , Θ ction at Η
Standard normal function at Η , Θ
Standard deviation of ̂ .
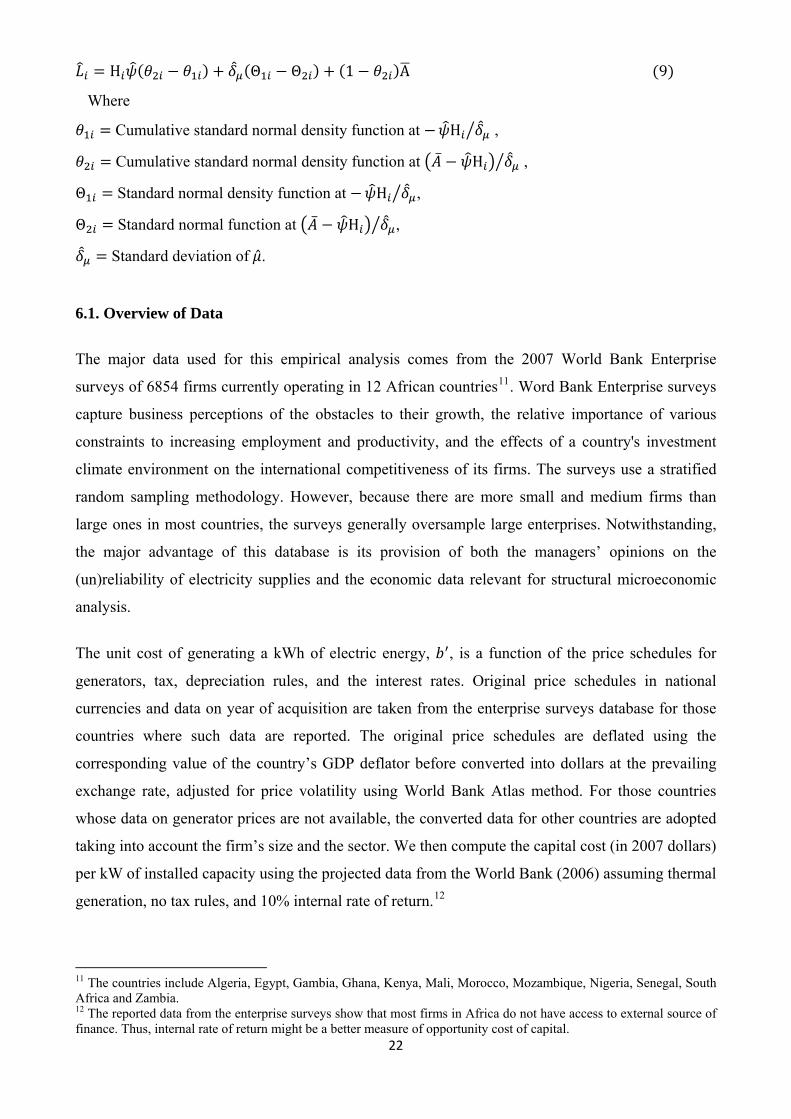
6.1. Overview of Data
The major data used for this empirical analysis comes from the 2007 World Bank Enterprise
surveys of 6854 firms currently operating in 12 African countries11. Word Bank Enterprise surveys
capture business perceptions of the obstacles to their growth, the relative importance of various
constraints to increasing employment and productivity, and the effects of a country's investment
climate environment on the international competitiveness of its firms. The surveys use a stratified
random sampling methodology. However, because there are more small and medium firms than
large ones in most countries, the surveys generally oversample large enterprises. Notwithstanding,
the major advantage of this database is its provision of both the managers’ opinions on the
(un)reliability of electricity supplies and the economic data relevant for structural microeconomic
analysis.
The unit cost of generating a kWh of electric energy, , is a function of the price schedules for
generators, tax, depreciation rules, and the interest rates. Original price schedules in national
currencies and data on year of acquisition are taken from the enterprise surveys database for those
countries where such data are reported. The original price schedules are deflated using the
corresponding value of the country’s GDP deflator before converted into dollars at the prevailing
exchange rate, adjusted for price volatility using World Bank Atlas method. For those countries
whose data on generator prices are not available, the converted data for other countries are adopted
taking into account the firm’s size and the sector. We then compute the capital cost (in 2007 dollars)
per kW of installed capacity using the projected data from the World Bank (2006) assuming thermal
generation, no tax rules, and 10% internal rate of return.12
11 The countries include Algeria, Egypt, Gambia, Ghana, Kenya, Mali, Morocco, Mozambique, Nigeria, Senegal, South Africa and Zambia. 12 The reported data from the enterprise surveys show that most firms in Africa do not have access to external source of finance. Thus, internal rate of return might be a better measure of opportunity cost of capital.
23
The operating cost , is computed by multiplying the unit cost of fuel by the generator’s fuel
efficiency (fuel consumption per kWh). Assuming that the firms’ industrial plants rely on thermal
generation, the unit cost of fuel is approximated by an average per litre of diesel fuel; the fuel prices
are obtained from the 2007 GTZ International Fuel Prices (World Bank, 2007). The data on fuel
efficiency was obtained from the Web sites of two leading manufacturers of generators –W�rtsil�
and Cummins. The data on outage time , are obtained from the information on monthly outage
frequency and average duration reported by firms in the enterprise surveys. Although the data on
national average outage time are not officially available, we assume a value of 8 hours per day.13
Data on employments and the weekly operating hours are obtained from the survey of enterprises.
The data on electricity loads are not directly available from enterprise surveys but the costs of
electricity are reported. To derive the data on firms’ loads, we first convert the reported electricity
costs into electricity using the data on electricity prices. We then converted the results into kW
using the average annual operation hours reported in the survey. For the non-backup firms that
reported zero outage loss the converted electricity figures were taken as their loads. For 100%
backup firms – i.e., firms with backups that reported zero outage loss – we adjust for the electricity
generated from backups to derive their electricity loads. For those with incomplete backups and
those without backups but suffer outage loss, we adjust for their electricity consumption with the
electricity they would have consumed if they had not experienced power outage using their reported
outage time. The data on electricity prices are obtained from the regulators and from a 2009 study
of electricity tariffs used in Africa by UPDEA. Other variables are dummies used to capture firms’
export promotion (proxy by whether a firm has International Quality Certificate – ISO Certificate),
and to reflect technological differences across firms as well as their usage of the Internet for
operation14.
Figure 2 presents the percentage distribution of the reported outage time and outage losses when
controlling for outage time. The figure shows that, contrary to expectation, the country that
accounts for the largest percentage of the outage time is not necessarily the country that experiences
the largest outage loss. Nigeria accounts for 32.36% of the reported average outage time but
accounts for only 3.72% of the average outage loss. On the contrary, South Africa which accounts
for 0.85% of the reported outage time accounts for 23.74% of the average outage loss. This suggests
that the distribution of outage losses might not only be influenced by outage time but may also
depend on other factors such as the size of the firms, export promotion, nature of operation, etc. For
13 We also assume 9 hours outage time to examine how cost of outage changes with respect to reliability, see Table 3. 14 Firms using internet (e.g., emails or own websites) for their operations are likely to rely more on electricity and this may reflect in their decisions to invest in backup.
instance, a larger firm that experiences an outage of 2 hours may suffer greater loss compared to a
smaller firm that experiences a power outage of 3 hours duration, ceteris paribus.
Figure 2: Percentage Distribution of the Reported Outage Time and Losses in 2007
24
0.00
5.00
10.00
15.00
20.00
25.00
30.00
35.00
Perc
enta
ge
Average Loss per hour Average Monthly Outage Time
Data Source: World Bank Surveys of Business Enterprises 2007 7. Discussion of Empirical Results
7.1. Revealed Preference – Marginal Cost Method
Table 3 presents the estimated (marginal) costs of unsupplied kWh of electricity obtained from
Equation (1)15. The results show that the cost of generating own electricity ranges between $0.16 in
Algeria and $0.58 in Zambia. The results further indicate that as the system becomes less reliable,
(marginal) cost of unsupplied electricity reduces over the range of 2% and maximum of 9%. A
plausible explanation for this is that, an unreliable system is characterised by huge investments in
backup so that an additional rise in unreliability results in less (marginal) cost per unit due to huge
backup investments already made. In all the countries (including Algeria and Egypt where fuel is
heavily subsidised), the cost of own generation is substantially higher than the cost of electricity
supplied from the public grid. This may reflect the diseconomies of scale in own generation due to
the small backup generators widely used by firms compared to the large power plants being utilised
in the public grid. On the other hand however, these high cost differentials might be because the
public electricity grid is highly subsidised in Africa. This issue is investigated further later.
15 Recall that as earlier stated, Equation (3) does not account for additional outage cost that may result from incomplete backup.
25
Table 3: Estimated Costs of Unsupplied Electricity and Public Grid Prices per kWh, 2007 US$ Prices
Table 4 presents the results of the two-limit –Tobit estimation of Equation (4). It should be noted
that the dependent variable in Eq. (4) is a transformation of the rate of backup per unit user
cost where the latter is equal in equilibrium, to the maximal loss. Thus, the estimated
parameters from Eq. (4) bear the interpretation of semi-elasticity of demand for backup:
Ζ 10
That is, the demand for backup varies directly with electricity consumption, inversely with the user
cost of backup , directly with outage time , and with the heterogeneous firm’s characteristics.
We capture the observed heterogeneity by the firm’s load, and by firm’s characteristics such as
sizes, export promotion (proxy by ISO certificate holding), use of the Internet for firm’s operation
and by a series of sectoral dummies designed to account for technological differences.
The first five explanatory variables, as expected, indicate that the demand for backup varies directly
with load, export promotion, firm’s size, and the use of internet facilities by firms. In other words,
the results show that larger firms, those that hold international standard certificate and those whose
activities involve the use of the Internet are likely to demand more backup. This is not surprising
given that a firm with export promotion (i.e., holding international quality standard) is likely to back
up its system in order to meet the international quality standard. Similarly, since the use of the
Internet requires efficient running of electricity, firms which use internet services for their day to
day operations (e.g., marketing, procurements, etc) will likely demand for backup against the
occurrence of power outages.
26
Table 4: Estimation of Equation (4) by Two Limit Tobit
Variable Coefficient P-value Variable Coefficient P-value Intercept -0.88*** 0.00 Plastics 0.22* 0.06 Load 2.74x10-7* 0.06 Retails 0.29** 0.01 Export Promotion 0.15*** 0.00 Textile 0.16 0.14 Small -0.18*** 0.00 Wood & Furniture 0.08 0.50 Large 0.25*** 0.00 Algeria 0.40*** 0.00 Internet 0.09*** 0.00 Egypt 0.12*** 0.00 Chemicals 0.37*** 0.00 Gambia 0.89*** 0.00 Construction -0.03 0.96 Ghana 0.36*** 0.00 Electronics 0.31** 0.01 Kenya 0.57*** 0.00 Fabrications 0.11 0.35 Mali 0.32*** 0.00 Food 0.28** 0.01 Mozambique 0.12* 0.05 Garments 0.34 0.38 Nigeria 1.27*** 0.00 Information Technology 0.37*** 0.00 Senegal 0.80*** 0.00 Machine & Equipment 0.31** 0.01 South Africa 0.06 0.19 Metal 0.26** 0.02 Zambia 0.01 0.47 Non-Metal 0.26 0.03 Other Manufacturing 0.15 0.14
= 0.51 (0.010)
=0.26 = 0.44
(0.008)
= 0.85
N= 5920 of which 3767 censored from below and 457 censored from above. Note: Base country: Morocco; base sector: Other retails; Hotels & Restaurants dropped due to collinearity. Operation hours removed from the model because it negatively affects the performance of the model. Source: World Bank, Enterprise Survey Database. Furthermore, larger firms and firms that require more electricity are likely to invest more in backup
to mitigate outage losses. Overall however, firms’ size, export promotion and internet usage play
major roles in firms’ decision to invest in backup. In terms of a country’s demand for generator, the
results suggest that, all things being equal, firms operating in Nigeria, Gambia, Senegal and Kenya
are likely to invest more in own generation. This reflects the contributions of the above factors on
the demand for backup in those countries. The parameter was estimated by choosing the value of
that maximized the likelihood function through a search procedure. An estimate of 0.85 suggests
that because of indivisibilities and installation costs, firms begin to invest in complete backup once
it is worth investing in 85% backup capacity.
7.3. Subjective Evaluation
The estimates from Equation (8) based on Two-Limit Tobit estimation of the reported outage losses
are presented in Table 5. We include backup rates to capture the effects of backups on outage
losses. This allows us to account for the effects of incomplete backup on outage losses. As
expected, the first eight variables yield the expected signs and they (except the use of the internet)
are highly significant. The coefficient on load (though small) indicates that firms which depend
more on electricity for their activities are likely to be more vulnerable to power outages. Also, a
larger firm has a higher probability of suffering more outage loss compared to smaller firms.
Similarly, firms that experience outages of long duration and those holding quality standard
certificates are more likely to suffer more outage loss. In the same vein, a firm operating for long
hours is more likely to suffer more loss. All things being equal, a firm that operates for longer hours
per day is likely to witness more outages and therefore suffers more outage loss than a firm which
operates for fewer hours.
The negativity of the coefficient on backup rate has two implications. First, it indicates that a firm
that owns or shares a generator has low probability of suffering outage loss. The second is that the
higher the backup rate, the lower the outage loss to be suffered by a firm, ceteris paribus. The
significance of the parameter on backup rate indicates that having a backup has significant effects in
reducing outage loss. Surprisingly however, the results indicate that the construction industry suffer
more loss from power outages than other industry. This reflects the low demand for backup
generation by construction firms (see Table 4). Construction firms might consider electricity less
important for their operations and therefore do not border to invest much on backup generation. So,
when outage occurs, parts of their activities that may require electricity will be left undone. This
effect can be more pronounced when the next process which does not depend on electricity can not
be carried out until those parts that are dependent on electricity are completed.
Table 5: Estimation of Equation (8) by Two Limit Tobit (TLT)
Note: N= 4359 of which 1649 censored from below and 100 censored from above.
a t-value. Base country: Morocco; base sector: Hotel & Restaurants; Information Technology dropped due to collinearity.
27
28
One puzzle with the estimates reported in Table 5 is that our empirical might be subject to selection
biases or endogeneity problems from unobserved heterogeneity in firms’ behaviour.16 Specifically,
the key variable (backup rate) might be endogenous. One reason is that omitted variables like
motivation or managerial ability both might influence the decision to invest in backup capacity and
firm’s outage loss and might not be sufficiently captured by other control variables. If the last
statement is true, therefore, a causal interpretation of the results in Table 5 is not warranted. In order
to deal with possible or test for the existence of endogeneity problem that might affect our
estimates, we apply Newey's (1987) two-step estimation procedure. While finding appropriate
identifying variables is in many cases a prohibitive challenge, we use data measuring manager’s
years of experience in the industry as the instrument. This variable satisfies the necessary
conditions. Preliminary analyses show that manager’s experience is correlated with backup rate but
not correlated with the dependent variable (outage loss per kWh unsupplied) in Table 5.
The results from the two-step estimation procedure show that the use of instrumental variable does
not improve the performance of the model.17 Although the results reject the hypothesis that all the
instruments are jointly zero at 1% level of significance, all the variables change to being
individually insignificant. With regards to the treatment, the 2SLS estimation confirms the Tobit
results partly: there is no difference in the sign of the parameter on backup rate; however, the
coefficient is larger and insignificant. Overall, however, the Wald test of exogeneity of the
instrumented variable (i.e., backup rate) indicates that the test statistic is not significant, suggesting
that the null hypothesis of no endogeneity cannot be rejected. In other words, the estimates in Table
5 are valid.
It is also important to point out that this study relies more on the estimates from the incomplete
backup method given some possible biases in self reported losses as pointed out previously. The
estimates from subjective evaluation are mainly used for comparative purposes. Therefore, a
possible problem of endogeneity (even if there is any) in the model in Table 5 should not be a
serious issue for this study.
16 We acknowledge the anonymous reviewer for suggesting to us to test for endogeneity in the model. 17 The results from this estimation procedure are available upon request from the authors.
29
7.4. Unmitigated Outage Costs
The computed expected unmitigated outage costs based on both the incomplete backup method
(Table 4 and Eq. 7) and the subjective evaluation (Table 5 and Eq. 9) are reported in Table 618. The
table also includes the total outage costs based on the incomplete backup method. Based on the
subjective evaluation technique, the unmitigated costs of unsupplied kWh of electricity range from
US$2.78 (Algeria and Mali) to US$3.32 (Kenya). Using the incomplete backup method however,
the unmitigated cost per kWh of unserved energy ranges from US$0.37 in Egypt to as high as
US$2.39 in Nigeria. The total cost per kWh (i.e. both unmitigated and mitigated) ranges between
$0.62 (Zambia) and US $3.32 (Nigeria). Moreover, the results show that the unmitigated costs still
account for a significant proportion of outage costs ranging between 45.7% and 72.0% of the total
cost per kWh. Therefore, we reject the first hypothesis that the unmitigated cost accounts for a
lower proportion of the outage cost per kWh. The last column of the table further shows that an
average firm in Africa incurs between US$1,752.0 and US$9,694.4 per KW due to power outages.19
Table 6: Cost (US$) of Unsupplied Electricity based on Incomplete Backup and Subjective methods, 2007 Prices
Unmitigated costs per kWh Estimates based on Incomplete backup method
7.5. Relationship between Outage Costs and Firms’ Characteristics
In Table 4 and 5, we found that export promotion, firms’ size and the use of the Internet for
operation significantly influence firms’ decision to invest in backup generation. In Table 7 and 8,
we compare the unmitigated ouatge costs suffered by firms possessing the aforesaid characteristics
with those that do not. Our results reveal that – despite having high propensity for backup – firms 18 The estimates are based on outage time of 8 hours daily. 8 hours outage duration is assumed throughout this study for the purpose of making comparison with the previous studies on Africa and to compare the estimates from the various methods explored in this study. 19 This is based on the assumption of 8 hour outage time per day.
30
holding an international quality standard certificate (export promotion), larger firms, and those that
use the Internet for their operation still suffer greater unmitigated outage losses than others. The
unmitigated outage cost increases with firm size in all the countries. In terms of the magnitudes, the
unmitigated costs range from $0.12 for small firms in Mozambique to $3.20 for large firms in
Nigeria (Table 7).
Table 5: Unmitigated Cost (US$) per kWh Based on Incomplete Backup According to Firms’ Characteristics, 2007 Prices Small Medium Large ISO Firms Non-ISO Internet No Internet Algeria 0.45 0.63 0.91 0.83 0.56 0.63 0.47 Egypt 0.21 0.35 0.57 0.60 0.32 0.49 0.27 Gambia 0.92 1.43 2.69 2.63 1.07 2.04 1.03 Ghana 0.35 0.60 1.06 1.05 0.45 0.76 0.40 Kenya 0.61 0.90 1.33 1.27 0.86 1.05 0.67 Mali 0.32 0.65 1.05 0.71 0.37 0.61 0.32 Morocco 0.18 0.36 0.63 0.65 0.39 0.48 0.23 Mozambique 0.12 0.40 0.67 0.48 0.20 0.44 0.17 Nigeria 1.26 2.71 3.20 3.00 2.52 2.91 2.41 Senegal 0.86 1.21 2.01 1.54 0.95 1.23 0.85 South Africa 0.22 0.41 0.75 0.64 0.31 0.47 0.26 Zambia 0.14 0.32 0.58 0.47 0.25 0.37 0.20 Small: 1-19; medium: 20-99; large: 100+
Similar to firms’ size, firms operating at international quality standard level suffer unmitigated
outage costs of between $0.47 and $3.00 inclusive, while the unmitigated costs for non-international
quality standard firms range from $0.20 to $2.52. Firms using the Internet for their operation also
suffer outage costs from $0.37 to $2.91 compared to others with outage costs raanging between
$0.20 and $2.41 (Table 7). Similar trends are reported in Table 8 using the subjective evaluation
method. Given this evidence therefore, we reject the hypothesis 2 that larger firms, firms holding
international quality standard certificate and those using the Internet for their operation suffer lesser
unmitigated loss because they tend to invest more in backup generation.
31
Table 8: Unmitigated Outage Costs (US $) Based on Subjective Evaluation According to Firms Characteristics, 2007 Prices
One puzzle from the above findings is why firms having a higher propensity to invest in backup
capacity continued to suffer higher unmitigated outage costs.20 The reason simply is that although
firms with certain characteristics have a propensity to invest in backup generation, they in most
cases make partial investments which still make them vulnerable to power outages. Table 8a below
shows the distribution of backup status of firms across the countries. Between 76% and 100% of
firms that have invested in backup generation make partial investments and complement their
energy needs from the services from the national grid. If a firm invests in its own generation, it can
still suffer more unmitigated outage costs if the investment is partial depending on the proportion of
the firm’s energy loads the investment is able to cover. Although larger firms have a higher
tendency of investing in backup generation, they can still suffer more unmitigated outage costs than
smaller firms if their investments are partial and could not cover the larger proportion of their
potential outage losses.
Table 8a further shows that even in countries with a higher distribution of firms with investments in
backup capacity, the backup rates are still very low. On average, none of the countries has up to
50% backup rates. The implication of this low backup capacity is that even if certain firms (due to
their characteristics) tend to invest more in backup capacity, they might still suffer significantly
from power outages due to low installed backup capacity relative to their energy needs. There are
several reasons why firms might decide to run significantly less than 100% backup. First, firms may
decide to invest in small backup capacity and complement it with the energy from the national grid
because it is cheaper. The costs of electricity supplied from the national grid are significantly lower
than the own-generation costs (see Table 11). Another reason for running less capacity could be due
20 Thanks to an anonymous referee for suggesting to us the need to further explore this issue.
32
to financial constraints. That is, firms may go for less backup capacity if they do not have adequate
financial capacity to invest in 100% backup generation.
Table 8a: Distribution of Backup Capacity and Estimated Unmitigated Outage Costs per kWh (US$) % of firms with backup Backup rate (%) % of firms with backup Country Overall Complete Partial Costs Overall Backup
7.6. Comparison of the Estimates from Different Methods
Table 9 presents the results from the three outage cost estimation techniques. As expected, the
results from the marginal cost method are significantly lower than the estimates from the other two
techniques. This is because the marginal cost technique does not account for outage losses due to
the inadequate backup capacity. That is, the marginal cost method only estimates the portion of an
outage cost that a firm is able to mitigate by investing in backup generation. Similarly, the results
from the subjective evaluation method are higher than those from the incomplete backup estimation
technique. Subjective evaluation estimates are based on the reported outage losses by firms which
might lead to biased results. Bias might occur because firms might overstate their reported outage
losses to impress the regulators or the policymakers that they are seriously suffering from power
outages. They might do that to evade taxes by declaring high outage losses and low profits.
Therefore, estimates from the incomplete backup method are more reliable because the method
accounts for unmitigated outage costs, and it is also based on the revealed preferences rather than
subjective estimates.
33
Table 9: Estimated Outage Costs (US$) per kWh from the Three Different Techniques, 2007 Prices Estimated total outage cost ($) per kWh Unmitigated outage costs ($) per kWh Country Marginal cost
b Test of significant difference between outage cost and the true cost of provision. *** indicates significant at 1% level. a True provision costs ($) per kWh (2003-2008) were sourced from: http://www.infrastructureafrica.org/models/canned/
Figure 3 shows the estimated costs of power outage per kWh based on the incomplete backup
method, the current prices of electricity from the public grid and the true costs of provision. In most
countries, the price of the electricity from the public utilities is so low that the cost of outage is as
high as 6 to 66 times the public tariff. Even in Mali where the current tariff is the highest, the cost
of unsupplied kWh is about 3 times the currently operating tariff.
21 see http://www.infrastructureafrica.org/models/canned/
The currently operating heavily subsidised tariffs in most African countries have been one of the
reasons for the low installed and generating capacity that results in frequent power outages in the
continent. Installed and generating capacity has been very low because many Independent Power
Producers have refused to enter the market claiming that the tariff rates do not guarantee their
returns. However, given that own generation costs (outage costs) are significantly higher than the
provision costs, it suggests that the utility regulators should raise the currently operating industrial
tariffs to reflect the true generating and supply costs. This will encourage the private investors to
invest in the power sector and therefore reduces the problem of inadequate electricity supply faced
in the continent.
Figure 3: Cost of Power Outage, Current Tariff and Cost-Reflective Tariffs in US$ per kWh
35
Note: n.a – indicates data not available
1.23
0.81
2.33
0.97
1.80
0.79 0.84
0.60
3.32
1.90
0.83
0.62
0.06
0.05 0.
20
0.11
0.12 0.
24
0.14
0.10
0.05 0.
21
0.04
0.03
n.a
n.a
n.a 0.
12 0.14 0.
34
n.a 0.
11
0.10 0.
25
0.06
0.07
0
0.5
1
1.5
2
2.5
3
3.5
Outage cost per kWh US$ 2007 PricesCurrent tariff (US$)
True provision cost (US$) as at 2008
8. Summary and Conclusion
Several studies have demonstrated that firms possessing certain characteristics are more likely to
demand backup (i.e., invest in own generation) when facing an unreliable electricity supply. What is
less known, however, is whether those firms suffer lesser or higher unmitigated outage losses
(costs) compared to firms without those characteristics. This study examined whether larger firms,
firms engaging in exports (i.e., holding ISO certificate), and those using the Internet for operation
suffer lesser unmitigated outage losses because they were able to invest in auto-generation. The
study has extended the existing literature on costs of power outage estimation in several ways. First,
it re-examined how firms’ characteristics might influence the decision on own generation, and how
that might affect outage costs. Second, we extended the analysis to examine whether electricity
36
from the public grid is cheaper for the consumers (firms) than self generation when a cost-reflective
pricing system is allowed. Lastly, we combined three different methods to compute the costs of
power outages in order to make a comparative analysis.
We found that though firms possessing certain characteristics have a higher tendency to invest in
auto-generation, they still suffer higher unmitigated outage losses (costs) compared to firms that do
not possess those characteristics. For instance, although larger firms are more likely to invest in
backup, they still suffer higher unmitigated outage costs compared to smaller firms despite having a
higher propensity of investing in auto-generation. Similarly, firms holding the International
Standard Organisation (ISO) certificates and those using the Internet for their operations suffer
more outage losses despite having a higher tendency to invest in backup generator. This is due to
less backup capacity often run by most of those firms.
The results from the three estimation techniques also showed that the cost of an unsupplied kWh of
electricity is significantly higher than the cost of electricity from the public grid. In comparison, the
estimates based on the incomplete backup method and those based on subjective evaluations are
significantly higher than the estimates obtained from the marginal cost method. This suggests that
the past studies on Africa, whose estimated outage costs had been obtained without allowing for
additional losses due to incomplete backup, have underestimated the costs of unserved energy.
Steinbuks and Foster (2010), using the marginal cost method of revealed preference approach,
estimate the outage costs between $0.13 and $0.76 (2007 prices) per kWh for African firms for
surveys of complete firm subsectors. Using a revealed preference method, that accounts for
incomplete backup, our estimates range between $0.60 and $3.32 per kWh at 2007 prices. For all
the countries reported in their studies which also feature in the present study, the previously
estimated outage costs reported in their paper are significantly lower than ours.
Lastly, we found that the cost of mitigating a kWh of electricity (measured by outage cost per kWh)
is significantly higher than a cost-reflective tariff, suggesting that firms can still benefit
substantially from a cost-reflective tariff that ensures reliability.
A number of conclusions that inform thinking about energy policy can be drawn from the analyses
conducted in this study. The estimated costs of unsupplied electricity show that power outages
impose substantial costs on the economy. For instance, after adjusting for a cost-reflective tariff, an
average firm in Africa incurs a net outage cost of between US$1,314 and $9,402 per kW annually.
This amount is substantial enough for some firms to expand their scope of operation and increase
employment opportunities. This suggests that a stable electricity supply may have strong impact in
reducing poverty and promoting economic activities. Apart from the loss of jobs related to poor
37
power supply, another cost that was not properly captured in the above analysis is environmental
and health problem (cost) due to self generation. The use of diesel generators by firms results in
noise pollution and environmental hazards through carbon emissions. Considering the impacts of
these on global warming and health, governments need to find a way of solving the problems posed
by poor electricity supply in the continent.
Since the cost of power outage to consumers (firms) is still higher than the expected cost-reflective
tariff, the government should be more committed to its reform policy and should embark on the
removal of subsidy on industrial and commercial electricity tariffs to encourage the private
investors’ participation in the industry. This will solve the problem of inadequate generating
capacity and also reduce the capacity constraints posed to firms by poor power supply. The
reduction in capacity constraints would likely increase employment opportunities in the private
sector. Moreover, the withdrawal of subsidy on the electricity tariff would reduce energy waste and
encourage energy efficiency among users. Also, government can use the amount realised from
subsidy removal to finance other important projects. One way forward is that the government may
gradually increase supply to the private sector at cost-reflective rates, while retaining supply to
other consumers at the current tariff. This will reduce the shocks and mass protests that a sudden
removal of the overall subsidy across consumers may attract.
This study is not without its limitation however. The conversion of the reported electricity
expenditure by firms to obtain their corresponding electricity demand may not be perfect. Given
that some countries operate different pricing systems, such as two-part pricing where a fixed
amount is first charged to consumers before the evaluation of the cost of electricity consumed per
kWh. The use of price to divide the expenditure to obtain electricity consumption in such a case
may not be accurate. However, such an effect is assumed to be insignificant because such fixed
charges are usually small. Acknowledgements
We would like to thank an anonymous reviewer, Daniel Ralph, Jaideep Prabhu and Michelle Baddeley for their useful comments during the previous presentations of this study. Sincere thanks are also due to Aoife Brophy Haney, Jim Krane and David Reiner for their useful advice. Musiliu Oseni is also grateful to the University of Cambridge Judge Business School for the award of a full scholarship that has financed his PhD studies at Cambridge University.
References
Adenikinju, A. F. (2003). Electric infrastructure failures in Nigeria: a survey-based analysis of the costs and adjustment responses. Energy Policy, 31(14), 1519–1530.
38
Andersson, R., & Taylor, L. (1986). The social cost of unsupplied electricity: A critical review. Energy Economics, 8(3), 139–146.
Arnold, J. M., Mattoo, A., & Narciso, G. (2008). Services Inputs and Firm Productivity in Sub-Saharan Africa: Evidence from Firm-Level Data. Journal of African Economies, 17(4), 578–599.
Austria, B. S. (1999). Development of the energy industry in the philippines. Challenges and Opportunities in Energy (pp. 107–110).
Beenstock, M. (1991). Generators and the cost of electricity outages. Energy Economics, 13(4), 283–289.
Beenstock, M., Goldin, E., & Haitovsky, Y. (1997). The Cost of Power Outages in the Business and Public Sectors in Israel: Revealed Preference vs . Subjective Valuation. Energy Journal, 18(2), 39–61.
Bental, B., & Ravid, S. A. (1982). A simple method for evaluating the marginal cost of unsupplied electricity. The Bell Journal of Economics, 13(1), 249–253.
Bialek, J. W. (2004). Recent blackouts in US and continental Europe: is liberalisation to blame? University of Cambridge, Cambridge Working Papers in Economics, CWPE 0407. Cambridge, UK. Retrieved from https://www.repository.cam.ac.uk/bitstream/1810/386/1/EP34.pdf
Bøhren, Ø., Cooper, I., & Priestley, R. (2007). Corporate Governance and Real Investment Decisions. SRN Electronic Journal, 1–30. Retrieved from http://ssrn.com/abstract=891060
Bose, R. K., Shukla, M., Srivastava, L., & Yaron, G. (2006). Cost of unserved power in Karnataka, India. Energy Policy, 34(12), 1434–1447.
British Assessment Bureau (BAB). (2011). ISO 9001 proven to help win new business. Retrieved August 24, 2013, from http://www.british-assessment.co.uk/news/iso-9001-proven-to-help-win-new-business
Caves, D. W., Herriges, J. A., & Windle, R. J. (1992). The Cost of Electric Power Interruptions in Industrial Sector�: Estimates Derived from Interruptible Service Programs. Land Economics, 68(1), 49–61.
Cowie, J. H., Ogielski, A. T., Premore, B. J., Smith, E. A., & Underwood, T. (2004). Impact of the 2003 Blackouts on Internet Communications: Preliminary Report. Communications (pp. 1–21). Retrieved from www.renesys.com
Cronin, B., Overfelt, K., Fouchereaux, K., Manzvanzvike, T., Cha, M., & Sona, E. (1994). The internet and competitive intelligence: A survey of current practice. International Journal of Information Management, 14(3), 204–222.
De Nooij, M., Koopmans, C., & Bijvoet, C. (2007). The value of supply security. Energy Economics, 29(2), 277–295.
DeCanio, S. J. (1998). The efficiency paradox: bureaucratic and organizational barriers to profitable energy-saving investments. Energy Policy, 26(5), 441–454.
Decanio, S. J., & Watkins, W. E. (1998). Investment in Energy Efficiency: Do the Characteristics of Firms Matter? The Review of Economics and Statistics, 80(1), 95–107.
EIA. (2009). Energy Information Administration. Retrieved from http://www.eia.gov/
Eifert, B., Gelb, A., & Ramachandran, V. (2008). The Cost of Doing Business in Africa: Evidence from Enterprise Survey Data. World Development, 36(9), 1531–1546.
39
Elkraft-System. (2003). Power failure in Eastern Denmark and Southern Sweden on 23 September 2003: Final report on the course of events. Power. Elkraft System Ballerup.
Escribano, A., Guasch, J. L., & Pena, J. (2009). Assessing the Impact of Infrastructure Quality on Firm Productivity in Africa. Africa Infrastructure Country Diagnostic Working Paper 9, The World Bank, Washington DC.
Foster, V., & Steinbuks, J. (2009). Paying the Price for Unreliable Power Supplies�: In-House Generation of Electricity by Firms in Africa. World Bank Policy Research Paper 4913, (January).
Gugler, K., Mueller, D. C., & Yurtoglu, B. B. (2007). Corporate Governance and the Determinants of Investment. Journal of Institutional and Theoretical Economics, 163, 598–626.
Hoffman, D. L., & Novak, T. P. (1997). A New Marketing Paradigm for Electronic Commerce. The Information Society, 13, 43–54.
Jorgenson, D. W. (1963). Capital Theory and Investment Behavior. American Economic Review, 53(2), 247–259.
Karekezi, S., & Kimani, J. (2002). Status of power sector reform in Africa�: impact on the poor. Energy, 30, 923–945.
Kariuki, K. K., & Allan, R. N. (1996). Evaluation of reliability worth and value of lost load. IEE Proc.-Gener. Transm. Distrib., 143(2), 171–180.
Kirubi, C., Jacobson, A., Kammen, D. M., & Mills, A. (2009). Community-Based Electric Micro-Grids Can Contribute to Rural Development: Evidence from Kenya. World Development, 37(7), 1208–1221.
Lacommare, K., & Eto, J. (2006). Cost of power interruptions to electricity consumers in the United States (US). Energy, 31(12), 1845–1855.
Larsson, S., & Danell, A. (2006). The black-out in southern Sweden and eastern. In Power Systems Conference and Exposition, Oct. 29-Nov. 1 2006 (pp. 309–313). Atlanta, GA.
Leahy, E., & Tol, R. S. J. (2011). An estimate of the value of lost load for Ireland. Energy Policy, 39(3), 1514–1520.
Lu, W., Bésanger, Y., Zamaï, E., & Radu, D. (2006). Blackouts�: Description , Analysis and Classification. Proceedings of the 6th WSEAS International Conference on Power Systems, Lisbon, Portugal, September 22-24, 2006, 429–434.
Maddala, G. S. (1983). Limited-Dependent and Qualitative Variables in Econometrics. Cambridge University Press, Cambridge U.K.
Makarov, Y. V., Reshetov, V. I., Stroev, V. a., & Voropai, N. I. (2005). Blackouts in North America and Europe: Analysis and generalization. In 2005 IEEE Russia Power Tech (pp. 1–7). Ieee. Retrieved from http://ieeexplore.ieee.org/lpdocs/epic03/wrapper.htm?arnumber=4524782
Matsukawa, I., & Fujii, Y. (1994). Customer preferences for reliable power supply�: using data on actual choices of back-up equipment. The Review of Economics and Statistics, 76(3), 434–446.
Munasinghe, M. (1981). Optimal electricity supply Reliability , pricing and system planning. Energy Economics, 3(3), 140–152.
Munasinghe, M., & Gellerson, M. (1979). Economic criteria for optimizing power system reliability levels. The Bell Journal of Economics, 10(1), 353–365.
40
NERC. (2004). Technical Analysis of the August 14, 2003 Blackout: What Happened, Why, and What Did We Learn?Report to the NERC Board of Trustees by the NERC Steering Group. System (pp. 1–119).
Newey, W. K. (1987). Efficient Estimation of Limited Dependent Variable Models with Endogenous Explanatory Variables. Journal of Econometrics, 36, 231–250.
Nickell, S. J. (1978). The Investment Decision of Firms. Cambridge: Cambridge University Press.
Pasha, H. A., Ghaus, A., & Malik, S. (1989). The economic cost of power outages in the industrial sector of Pakistan. Energy Economics, 11(4), 301–318.
Poon, S., & Swatman, P. M. C. (1997). Small business use of the Internet: Findings from Australian case studies. International Marketing Review, 14(5), 385–402.
Raesaar, P., Tiigimägi, E., & Valtin, J. (2006). Assessment of electricity supply interruption costs under restricted time and information resources. In Proceedings of the 2006 IASME/WSEAS International Conference on Energy & Environmental Systems, Chalkida, Greece, May 8-10 (Vol. 2006, pp. 409–415). Greece.
Raza, S. A., Ali, S. A., & Abassi, Z. (2012). Effect of corporate income tax and firms’ size on investment: evidence by Karachi stock exchange. MPRA. Retrieved from http://mpra.ub.uni-muenchen.de/36800/
Reinikka, R., & Svensson, J. (2002). Coping with poor public capital. Journal of Development Economics, 69, 51 – 69.
Sanghvi, A. P. (1982). Economic costs of electricity supply interruptions. Energy Economics, 4(3), 180–198.
Sanghvi, A. P. (1983). Optimal electricity supply reliability using customer shortage costs. Energy Economics, 5(2), 129–136.
Segarra-Oña, M.-V., Peiró-Signes, Á., & Verma, R. (2011). Environmental Management Certification and Performance in the Hospitality Industry: A Comparative Analysis of ISO 14001 Hotels in Spain. Cornell Hospitality Report, 11(22). Retrieved from http://www.hotelschool.cornell.edu/chr/pdf/showpdf/1597/chr/research/marival.pdf
Serra, P., & Fierro, G. (1997). Outage costs in Chilean industry. Energy Economics, 19, 417–434.
Silvast, A., & Kaplinsky, J. (2007). Project UNDERSTAND White Paper on Security of European Electricity Distribution (pp. 1–63). Retrieved from http://www.linkconsulting.it/Bandi/white_paper.pdf
Steinbuks, J., & Foster, V. (2010). When do firms generate? Evidence on in-house electricity supply in Africa. Energy Economics, 32(3), 505–514.
Telson, M. L. (1975). The Economics of Alternative Levels of Reliability for Electric Power Generation Systems. The Bell Journal of Economics, 6(2), 679–694.
Tishler, A. (1993). Optimal production with uncertain interruptions in the supply of electricity Estimation of electricity outage costs. European Economic Review, 37(6), 1259–1274.
Toba, N. (2004). Welfare Impacts of Electricity Generation Sector Reform in the Philippines. DAE Working Paper 0316 & CMI Working Paper 23. University of Cambridge. Cambridge, UK.
Tol, R. S. J. (2007). The Value of Lost Load. Economic and Social Research Institute Working Paper 214. Dublin. Retrieved from http://www.econstor.eu/bitstream/10419/68056/1/548400857.pdf
41
UCTE. (2004). Final Report of the Investigation Committee on the 28 September 2003 Blackout in Italy. Union for the Coordination of Transmission of Electricity (UCTE). Retrieved from www.rae.gr/cases/C13/italy/UCTE_rept.pdf
US-Canada Power System Outage Task Force. (2003). U.S.-Canada Power System Outage Task Force Interim Report: Causes of the August 14th Blackout in the United States and Canada. System.
US-Canada Power System Outage Task Force. (2004). U.S.-Canada Power System Outage Task ForceFinal Report on the August 14, 2003 Blackout in the United States and Canada: Causes and Recommendations. System.
Willis, K. G., & Garrod, G. D. (1997). Electricity supply reliability: Estimating the value of lost load. Energy Policy, 25(1), 97–103.
Woo, C.K., Pupp, R. L. (1992). Cost of Service Distruptions to Electricity Consumers. Energy, 17(2), 109–126.
World Bank. (1993). Energy Sector Management Assistance Programme (ESMAP). Nigeria: Issues and Options in the Energy Sector. Report No. 11672-UNI. World. The World Bank, Washington D.C.
World Bank. (2006). Technical and Economic Assessment of Off-Grid , Mini-Grid and Grid Electrification Technologies Annexes. Discussion Paper, Energy, Transport and Water Department. World Bank, Washington, DC; September, 2006. Retrieved from http://siteresources.worldbank.org/EXTENERGY/Resources/336805-1157034157861/ElectrificationAssessmentRptAnnexesFINAL17May07.pdf
World Bank. (2007). International Fuel Prices 2007 5th Edition. Division 44: Environment and Infrastructure. Retrieved from http://www.worldbank.org/transport/transportresults/global/fuelprices-final2007.pdf
World Bank. (2012). World Bank Surveys of Business Enterprises. Retrieved from http://www.enterprisesurveys.org/