Introduction: Telehealth is a healthcare innovation that provides new prospects for cost
saving and quality of care. This study conducts a cost-benefit analysis of the Manitoba
Provincial Health Contact program for congestive heart failure to determine whether the
program is cost-saving relative to usual care. It also offers a cost-effectiveness study to
determine whether there are additional benefits to the program that would justify an
additional cost. Both studies are conducted from the perspective of the healthcare system.
Methods: This economic evaluation is “piggy-backed” on an effectiveness study
conducted by Drs Katz and Doupe, and entitled Testing the Effectiveness of Health Lines
in Chronic Disease Management of Congestive Heart failure (2005). 179 patients were
randomized into three study groups: usual care, a health-lines intervention (HL) and a
health-lines with monitoring intervention (HLM). I calculated the benefit-cost ratio in
terms of the program intervention cost and the cost savings from averted healthcare visits
in order to determine whether the program would pay for itself. Then I conducted a cost-
effectiveness study in which outcomes were measured in terms of quality-adjusted life
years (QALYs) derived from the SF-36. Bootstrap-resampled incremental cost-
effectiveness ratios were computed to allow us to take into account the uncertainty
related to small sample size.
Results: The two study groups in this study generated a net saving of $28,307, however,
cost savings between the study groups were not statistically significant. Therefore, the
ii
cost-benefit study cannot conclude that the program paid for itself. The cost-effectiveness
analysis suggests that the HL intervention can generate an additional QALY for $26,486
and HLM for $70,266. Sensitivity analysis, which takes into account program costs, cost
savings from reduced utilization, improvements in health and the uncertainty surrounding
each of these estimates, suggests that there is a probability of 60% that HL is cost-
effective, and 63% that HLM is cost-effective relative to usual care. Moreover, which of
the two programs is optimal depends on how a decision-maker values health system
savings relative to subjective health. HLM offers greater system savings than HL, but HL
generates superior subjective health scores.
Conclusion: The findings demonstrate that the Health Lines strategy for congestive heart
failure holds great promise. While small sample size limits the strength of our
conclusions, it is probable that both HL and HLM offer better outcomes at reduced cost.
iii
Acknowledgements
I would first and foremost like to thank my advisor, Dr. Evelyn L. Forget, for
providing me endless support and inspiring me to conduct scientific research. This thesis
would not have been completed without her guidance. I would also like to thank the
members of my MSc. thesis committee, Dr. Alan Katz, Dr. Malcolm Doupe and Dr.
Richard Lobdell for their advice, encouragement and support.
I would also like to acknowledge financial support from the Western Research
Training Centre for Health Services Research and the Dr Evelyn Shapiro Award for
Health Services Research.
My sincere thanks to the Manitoba Centre for Health Policy for providing a
supportive work place and the technical assistance from Charles Burchill.
I also really appreciate the support from Paul Nyhol, the director of the Manitoba
Provincial Health Contact Centre (PHCC) and his spectacular team (Muriel, Debby and
Janet et al.) for offering me the program cost data, an impressive tour at PHCC and
explaining how the telehealth service worked and how it was delivered.
I would also like to extend my thanks to the staff and students of the Department of
Community Health Sciences who helped me during these years.
Last, but not the least, I would like to thank my husband Agassi Cheung. His
constant support, encouragement, and understanding provided the inspiration to complete
this thesis.
iv
Table of Contents Abstract ................................................................................................................................ i Acknowledgements ............................................................................................................ iii Table of Contents ............................................................................................................... iv List of Tables ...................................................................................................................... vi List of Figures .................................................................................................................. viii Chapter 1: Introduction ....................................................................................................... 1
1.1 Introduction ............................................................................................................... 1 1.2 Study purpose and objectives .................................................................................... 3 1.3 Research questions .................................................................................................... 4
Chapter 2: Background........................................................................................................ 6 2.1 Literature review ....................................................................................................... 6
2.1.1 The economic burden of chronic disease ........................................................... 6 2.1.2 Effectiveness of telehealth intervention for patients with chronic disease ........ 8 2.1.3 Studies of telehealth for chronic disease management..................................... 11 2.1.4 Framework for economic analysis ................................................................... 19 2.1.5 Telehealth program in Canada and Manitoba .................................................. 21
2.2 Summary of Testing the Effectiveness of Health Lines in Chronic Disease Management of Congestive Heart Failure .................................................................... 23
2.2.1 Purpose ............................................................................................................. 23 2.2.2 Study Participants ............................................................................................. 24 2.2.3 Instrumentation................................................................................................. 24 2.2.4 Summary of Methods ....................................................................................... 26 2.2.5 Summary of Results ......................................................................................... 28
5.1 Summary of Findings .............................................................................................. 87 5.2 Study limitations and strengths ............................................................................... 90
References ......................................................................................................................... 96 Appendix A Tables and charts ........................................................................................ 104 Appendix B The Revised Heart Failure Self-care Behaviour Scale ............................... 121 Appendix C Client Satisfaction Questionnaire ............................................................... 122 Appendix D The SF-36 Questionnaire ............................................................................ 123
vi
List of Tables Table 1: Summary of clinical outcome comparisons of the usual care and home telehealth
in the management of chronic disease from the literature ........................................ 13 Table 2: Description of dependent, independent and control variables used in the Health
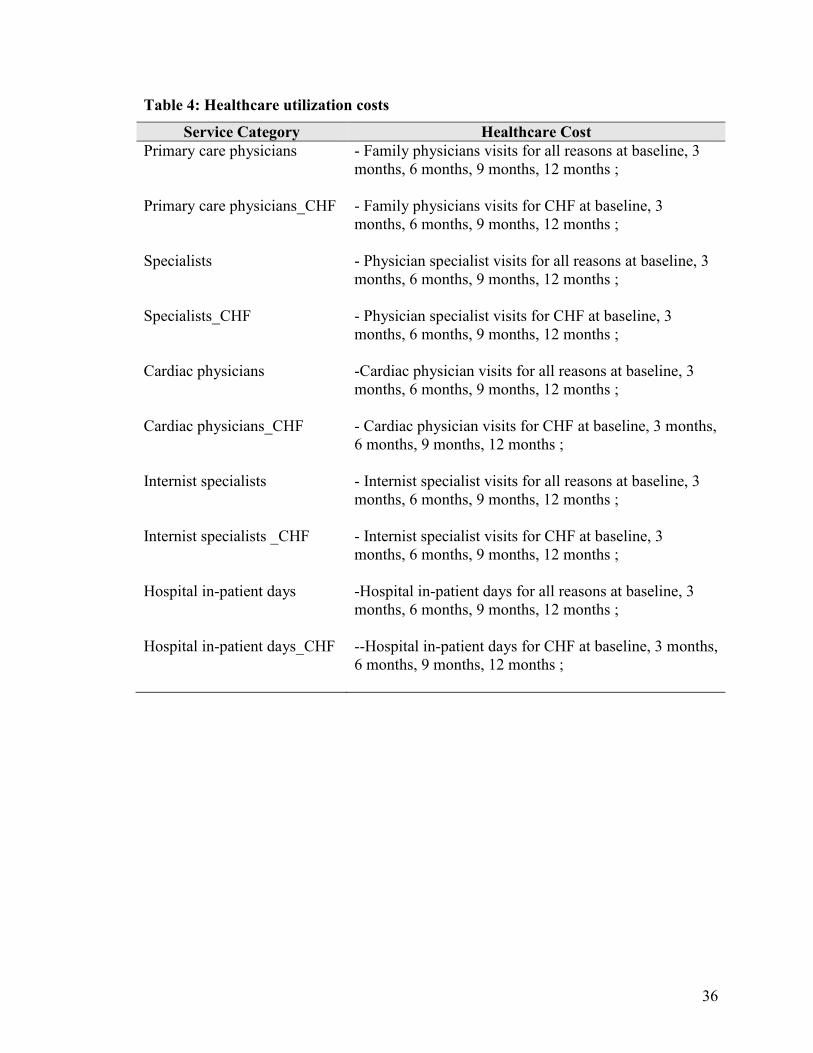
Lines study ................................................................................................................ 27 Table 3: Cost categories of Health Lines intervention program ....................................... 34 Table 4: Healthcare utilization costs ................................................................................. 36 Table 5: Demographic characteristics across three study groups ..................................... 48 Table 6: Counts of primary care and emergency contacts by groups ............................... 51 Table 7: Counts of hospital in-patient days by groups ...................................................... 52 Table 8: Annual costs of CHF intervention program ........................................................ 54 Table 9: Healthcare utilization costs for the three study groups ....................................... 57 Table 10: Estimated total cost for Emergency Department visits for all reasons for
patients in Winnipeg Health Region ......................................................................... 60 Table 11: Survey sample distribution by study group....................................................... 62 Table 12: Mean (SD) QALY for intervention groups relative to the control group ......... 65 Table 13: SF-36 mean (SD) domain scores and SF-6D mean (SD) utility score by group
................................................................................................................................... 66 Table 14: Mean (SD) score for Self-Care Behavior Scale Survey .................................... 68 Table 15: Mean scores (SD) for the Client Satisfaction Questionnaire ............................ 70 Table 16: Benefit-cost ratio between control and HL intervention group ........................ 73 Table 17: Benefit-cost ratio between control and HLM intervention group ..................... 73 Table 18: Incremental cost-effectiveness ratio (ICER) based on the first follow-up survey
................................................................................................................................... 76 Table 19: Summery of mean incremental costs and effects from 1,000 bootstrap re-
samples ...................................................................................................................... 79 Table 20: Counts of healthcare uses by type for each three-month period of the study
intervention for CONTROL group .......................................................................... 104 Table 21: Counts of healthcare uses by type for each three-month period of the study
intervention for HL group ....................................................................................... 105 Table 22: Counts of healthcare uses by type for each three-month period of the study
intervention for HLM group .................................................................................... 106 Table 23: Mean (SD) cost of healthcare utilization for each 90-day period of the study
intervention.............................................................................................................. 107 Table 24: Healthcare utilization mean cost (SD) of 12-month for by gender, and age
groups and New York Heart Association functional status .................................... 108 Table 25: Healthcare utilization mean cost (SD) for all reasons for each 90 days
intervention by gender ............................................................................................. 109 Table 26: Healthcare utilization mean cost (SD) for CHF for each 90 days intervention by
gender ...................................................................................................................... 110 Table 27: Healthcare utilization mean cost (SD) for all reasons for each 90 days
intervention by age groups ...................................................................................... 111 Table 28: Healthcare utilization mean cost (SD) for CHF for each 90 days intervention by
age groups ............................................................................................................... 112
vii
Table 29: Healthcare utilization mean cost (SD) for all reasons for each 90 days intervention by New York Heart Association function status................................. 113
Table 30: Healthcare utilization mean cost (SD) for CHF for each 90 days intervention by New York Heart Association function status .......................................................... 114
Table 31: Healthcare utilization mean cost (SD) for all reasons for each 90 days intervention by location ........................................................................................... 115
Table 32: Healthcare utilization mean cost (SD) for CHF for each 90 days intervention by location .................................................................................................................... 116
viii
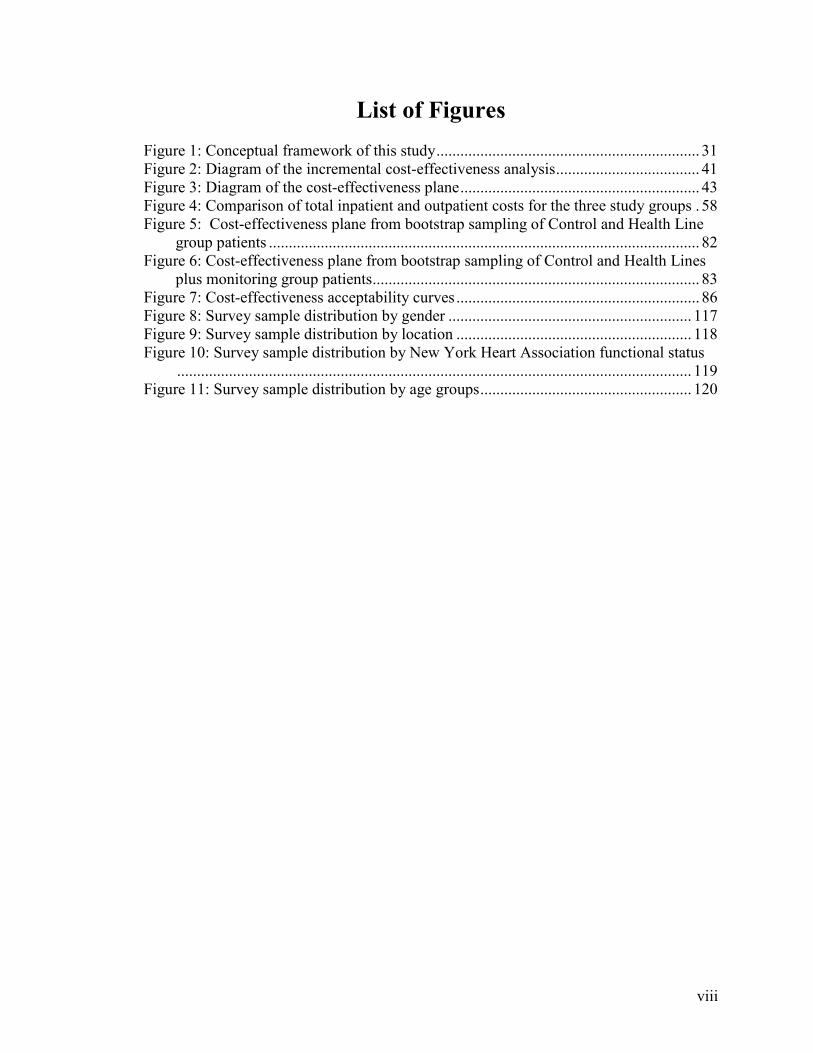
List of Figures Figure 1: Conceptual framework of this study .................................................................. 31 Figure 2: Diagram of the incremental cost-effectiveness analysis .................................... 41 Figure 3: Diagram of the cost-effectiveness plane ............................................................ 43 Figure 4: Comparison of total inpatient and outpatient costs for the three study groups . 58 Figure 5: Cost-effectiveness plane from bootstrap sampling of Control and Health Line
group patients ............................................................................................................ 82 Figure 6: Cost-effectiveness plane from bootstrap sampling of Control and Health Lines
plus monitoring group patients .................................................................................. 83 Figure 7: Cost-effectiveness acceptability curves ............................................................. 86 Figure 8: Survey sample distribution by gender ............................................................. 117 Figure 9: Survey sample distribution by location ........................................................... 118 Figure 10: Survey sample distribution by New York Heart Association functional status
................................................................................................................................. 119 Figure 11: Survey sample distribution by age groups ..................................................... 120
1
Chapter 1
Introduction
1.1 Introduction
Chronic diseases are the major cause of death and disability worldwide. They may
cause premature deaths, functional disability, decrease quality of life and have a negative
economic impact on patients, families and society. According to the World Health
Organization, thirty-five million people were estimated to have died from chronic
diseases, which accounted for 60% of all deaths globally in 2005 (World Health
Organization, 2011). Many studies have shown that chronic diseases account for a
significant portion of morbidity and mortality among Canadians (Health Canada, 2002;
Heart and Stroke Foundation of Canada, 2003; Canadian Cancer Society, 2010). In
Canada in 2005, it was estimated that 207,000 people died from chronic diseases, which
accounted for 89% of all deaths. Most prevalent were deaths from cardiovascular
diseases (34%), following by cancer (29%), chronic respiratory disease (6%), diabetes
(3%), and other chronic disease (17%) (World Health Organization, 2005). Chronic
diseases also create increasing health and long-term care costs. In Canada, 50% of the
population suffers from a chronic disease such as cancer, congestive heart failure,
diabetes, arthritis or a mental health disorder (Manuel, Schultz, & Kopec, 2002).
There is a growing interest in shifting healthcare service from costly hospitals to
community settings. Healthcare innovation such as telehealth and virtual clinics provide
new prospects for cost saving and quality of care in a community setting. Telehealth uses
information and communication technologies, such as telephone, and videoconferencing,
2
to examine, monitor and treat patients over long or short distances. Telehealth services
can assist both chronically ill patients and caregivers to effectively prevent and manage
chronic disease in a timely manner in patient homes. Telehealth, the provision of care at a
distance, is a key component of integrated care between primary care and patient self-
management. It functions as a chronic disease management system. Although telehealth
is not a replacement for human service, it is growing into an increasingly sophisticated
and operable technology (Priyan, 2009). The main features of telehealth for patients with
chronic disease are:
• using telephone or internet applications to provide healthcare services;
• monitoring of patients’ vital signs and symptoms in their home environment;
• helping patients manage their chronic conditions;
As healthcare costs increased dramatically in recent years, cost-containment
has become increasingly important to healthcare planners and decision makers. Interest in
the potential cost savings of telehealth has correspondingly grown. Evidence related to
cost-effectiveness, however, is mixed. A few international studies have demonstrated that
telehealth for congestive heart failure and Chronic Obstructive Pulmonary Disease
(COPD) has better outcomes than traditional care and lower costs (Schmidt, Schuchert,
Krieg, & Oeff, 2010; Vontetsianos et al., 2005; Whitten, & Mickus, 2007; Wooden et al,
2008) Other studies, however, show telehealth to be associated with unchanged or
increased costs. Analyses of cost-effectiveness of telephonic disease management in heart
failure by Smith et al. found that direct medical and intervention costs showed no cost
savings associated with the intervention. This randomized control trial was based on
1,069 community-dwelling patients with systolic heart failure and diastolic heart failure
3
between 1999 and 2003 (Smith, Hughes-Cromwick, Forkner, & Galbreath, 2008).
Another cost-effectiveness study of telephonic disease management in heart failure also
found that the intervention was effective but costly to implement and did not reduce
healthcare utilization (Pyne et al., 2010).
This study will offer an economic evaluation of the Manitoba Provincial Health
Contact program for congestive heart failure interventions. Cost-benefit analysis will
determine whether the program will generate more saving than the investment. That is,
will the program pay for itself? Cost-effectiveness analysis will allow us to estimate the
costs associated with improving patient’s health and well-being, in order to determine
whether the investment is reasonable. That is, even if a program does not pay for itself in
cost saving, it might generate better outcomes that justify a higher cost. Economic
evaluation is an important tool for decision making on priority-setting, because economic
evaluation includes a set of formal analytical techniques that provide systematic
information about costs and benefits of alternatives.
1.2 Study purpose and objectives
This study is “piggy-backed” on to a previous effectiveness study conducted by
Alan Katz and Malcolm Doupe. The previous study is entitled: Testing the Effectiveness
of Health Lines in Chronic Disease Management of Congestive Heart Failure (2005)
(hereafter Health Lines study). 179 patients were randomized into three groups. Group
one received the standard care. Group two received standard care plus Health Lines (HL):
that is, nurses were available on the telephone to provide suggestions about the patient’s
daily management of the disease. Group three received standard care plus Health Lines
4
plus in-house monitoring (HLM): that is, they were provided with monitoring devices
and instructions on how to use them. I used the intervention outcomes and healthcare
utilization data that were already collected for the Health Line study to conduct an
economic evaluation of the intervention. In addition, I was provided with the program
cost data for the HL and HLM study groups. No additional data were collected for this
study.
The specific objectives for this thesis are described below to:
1) compare standard care with two Health Lines interventions provided by the
Provincial Health Contact Centre in terms of their total costs as they relate to
patient outcomes; and,
2) conduct the cost-effectiveness and cost-benefit analyses of the Health Lines
interventions versus standard treatment for congestive heart failure patients
from the Winnipeg and Central Health Regions in Manitoba.
The results yielded from this study are intended to help policy and program
planners make efficient use of healthcare resources. This study will provide evidence to
determine whether the Provincial Health Contact Centre is a good option as a heart
failure intervention strategy compared to usual care.
1.3 Research questions
This study proposes to answer the following questions:
1) what are the total and mean program costs for the congestive health failure
intervention program at the Provincial Health Contact Centre?
5
2) can the Health Lines strategy be shown to pay for itself in terms of averted
healthcare utilization costs using a cost-benefit analysis? That is, are estimated
net benefits positive?
3) is the Health Lines strategy a cost-effective intervention for congestive heart
failure patients compared to the usual standard of care? That is, even if the
Health Lines strategy costs more than standard care, are the outcomes
(including patient satisfaction and scores on the SF-36) sufficient to justify the
increased costs?
In light of these research questions, the following hypotheses will be tested:
1) total healthcare costs, including program costs and system utilization costs, will
be lower for the intervention groups compared to the usual standard of care
group.
2) Health Lines will reduce the healthcare utilization costs as measured by primary
care, specialist physician visits and hospitalization compared to the control
group (usual standard of care group).
3) Health Lines will improve patient satisfaction and patient outcomes measured
on the Client Satisfaction Questionnaire and SF-36.
6
Chapter 2
Background
This chapter consists of a broad literature review on the effectiveness and cost-
effectiveness of telehealth programs for chronic disease management. A summary of the
previous Health Lines study, conducted by Katz and Doupe, in terms of its purpose,
methods and results will be provided in the second part of this chapter.
2.1 Literature review
2.1.1 The economic burden of chronic disease
There is compelling evidence to show that the economic burden of chronic disease
is high, and costs are particularly high among those with co-morbid chronic illness
(Health Canada, 2004).The economic costs of chronic disease include: 1) direct costs
related to physician services, diagnostic testing, hospitalization, drug expenses and
additional direct health expenditures (including other professionals, capital, public health,
insurance administration, and other costs); 2) indirect costs related to loss of productivity,
and premature mortality due to the disease; 3) intangible costs such as pain, grief and
other associated quality of life issues. Chronic diseases result in a significant drain on
Canada’s economy in terms of both direct impact on healthcare, and indirect impact on
productivity as a result of premature death and illness. Researchers have estimated that as
much as 80% of all health care expenditures can be attributed to the treatment of chronic
illness (Health Canada, 2004). A US study stated that in 2003 the total treatment costs of
7
chronic diseases were $277 billion US dollars, (Polisena, D. Coyle, K. Coyle, & McGill,
2009).
It is estimated that there are 400,000 Canadians living with congestive heart failure
(Heart & Stroke Foundation of Manitoba., 2010). In addition, heart failure is the most
frequent indication for hospital readmission and the most frequent discharge diagnosis in
Canada. The number of patients with congestive heart failure increases with age. In 2005,
there were 54,333 hospitalizations for congestive heart failure in the country, and the
hospitalization rates increased by more than three times for those aged 65 and over. Many
people had more than one hospitalization during the year (Public Health Agency of
Canada, 2009). In Canada, cardiovascular disease is one of the most costly chronic
diseases (Patra et al, 2007). In 2000, a conservative cost estimate of cardiovascular
disease was $22.2 billion, including $7.6 billion for healthcare costs and $14.6 billion for
indirect costs due to loss of economic activity (Public Health Agency of Canada, 2009).
With the predicted increase of older adults in the Canadian population over the next
decade, the demand for healthcare services is also anticipated to increase. The economic
burden of caring for patients with heart failure is enormous. As both direct and indirect
costs of chronic disease are significantly high, effective strategies for controlling,
preventing and reducing the cost of chronic disease interventions are imperative.
Therefore, health services planners are exploring effective strategies to reduce healthcare
spending and improve the patient outcomes.
8
2.1.2 Effectiveness of telehealth intervention for patients with chronic disease
Heart failure is a chronic disease and a leading cause of death in North America.
The prevalence and incidence of heart failure are expected to increase in industrialized
countries due to the aging population (Seto, 2008). Congestive heart failure, the inability
of the heart to maintain an adequate pumping function throughout the body, is a major
public health problem associated with high morbidity and mortality in Canada. Patients
with congestive heart failure face a number of daily self-management tasks, including
using medication, monitoring symptoms, managing acute episodes, as well as dealing
with exercise, stress reduction and appropriate use of resources (Burke, Dunbar-Jacob, &
Hill, 1997). Chronic disease management is a systematic approach to improving and
maintaining the health of patients with chronic disease conditions. Telehealth programs
have been implemented and increased dramatically in the past years. As defined by the
American Telemedicine Association, home telehealth is remote care delivery or
monitoring in that the healthcare providers deliver the services to patients at home by
using information and communication technology (American Telemedicine Association,
2011). The patients take greater responsibility for their own care. Telehealth can be
tailored to meet an individual patient’s specific needs; this allows healthcare providers to
provide more appropriate surveillance and advice and prevent deterioration in a patient’s
condition. The purpose of telehealth is to assist patients’ self management of their long-
term chronic conditions and minimize the effects of disability and illness. Telehealth is an
innovative model in self-management support and provides an alternative for some
aspects of traditional care in chronic disease such as diabetes, congestive heart failure,
COPD, hypertension etc.
9
The infrastructure of home telehealth consists of:
• client devices: software, hardware, and services to assist in patient monitoring and
managing condition;
• central systems: client management system that collects and displays the client’s
condition of vital signs and stores clinical and assessment documents;
• communication network: software, hardware, network, and communication
infrastructure required for service delivery and operational support to maintain the
integrity of the home telehealth system;
• care team activities: clinical staff and the professional services that are necessary
for consultative support to clients using home telehealth. (Tran et al., 2008):
Home telehealth technology can establish a link between patients and healthcare
professionals, and motivate patient participation in becoming more active in managing
their conditions. Over the past decade, several studies have been undertaken to assess the
effectiveness of telehealth and/or to examine issues related to healthcare service
utilization and quality of life for patients with chronic heart disease.
Studies have shown that telehealth improves patient-healthcare professional
communication and this can increase patient satisfaction and use of preventive services.
For example, Paget et al. using home telehealth to empower patients to monitor and
manage their long term conditions of heart failure and COPD found the patients felt more
involved in their care and more able to manage their care at home; most patients found
the service helpful and comfortable (Paget, Jones, Davies, Evered, & Lewis, 2010).
Wakefield et al. demonstrated a home telehealth intervention significantly delayed
time to hospital readmission relative to control group patients. In this study a total of 148
10
patients with heart failure were randomly assigned in the three groups: 49 were randomly
to usual care, 52 to videophone intervention and 47 to telephone intervention. Nurses
contacted the intervention patients each week for 90 days after hospital discharge. After
the 90 day intervention period, the intervention group patients were more likely to show
increased knowledge about their medications (Wakefield et al., 2009).
A systematic review of 13 worldwide randomized controlled studies about home
telemonitoring for congestive heart failure patients found that five studies reported
significant reductions in mortality, and six studies reported some reduction in congestive
heart failure hospital admission, although none of them reported a significant reduction in
all-cause hospital admission. Four studies found no significant difference in emergency
department visits among the patients in the treatment and control group (p=0.43).
However, three studies found either lower emergency contacts or an increase in
emergency department visits (Clarke, Shah, & Sharma, 2011).
Polisena et al. also conducted a systematic review of 21 original studies
(including one Canadian study) which included 3,082 patients with congestive heart
failure to identify the average effects of home telemonitoring compared with usual care.
The evidence suggested home telemonitoring may provide better clinical outcomes.
Home telemonitoring was associated with reduced mortality rates (risk ratio =0.64; 95%
CI: 0.48-0.85), but also with increased primary care visits, specialist visits and home care
visits. This study also found that home telemonitoring helped reduce hospital admission,
emergency department visits and bed-days of care for all-cause or congestive heart failure
related cause. Thirteen studies reported quality of life or patient satisfaction using various
instruments, such as the Minnesota Living with Heart Failure Questionnaire, SF-12
11
Health Survey, or the Barnason Efficiency Expectation Scale-Heart Failure. Overall,
patient quality of life and satisfaction with home monitoring were similar or better than
with usual care (Polisena et al., 2010).
However, not many Canadian studies examined the effectiveness of the telehealth
for congestive heart failure. Only one Canadian study was included in the Clarke and
Polisena’s review studies. Woodend et al. in Canada conducted a randomized controlled
trial and tested the impact of a three-month telehome monitoring intervention on hospital
admission, quality of life, and functional status in patients with heart failure or angina. A
total of 249 patients (121 with heart failure and 128 with angina) were enrolled and
randomized to receive either 3 months of telehome care after discharge or usual post-
discharge care. The intervention consisted of video conferencing and phone-line
transmission of weight, blood pressure, and electrocardiograms. After the three-month
intervention, the results showed home telemonitoring significantly reduced the number of
hospital readmissions, hospital days for patients with angina and improved quality of life
and functional status in patients with heart failure or angina. The study used the SF-36
survey to measure the quality of life between groups and found higher quality of life in
the telemonitoring group than usual care patients. Patients also found the technology easy
to use and expressed high levels of satisfaction (Wooden et al., 2008)
2.1.3 Studies of telehealth for chronic disease management
A number of researchers have found that telehealth can be an effective method to
reduce healthcare use rates and costs as well as improve quality of life (Clark, Inglis,
For example, studies have shown that telehealth can better control HbA1c and
blood pressure for diabetes and hypertension patients (Izquierdo et al., 2003; Shea, 2007).
Many studies have also found that telehealth program improve self-management behavior,
such as the proper use of medication and self-monitoring (Piette, 2005; Po, 2000; P. Suter,
W. Suter, & Johnston, 2011).
A system review by Barlow et al. concluded that the most effective telehealth
interventions were related to automated vital signs monitoring and telephone follow-up
by nurses, which reduced health service use and improved clinical indicators (Barlow,
Singh, Bayer, & Curry, 2007). Six other randomized controlled trial studies in the US and
Europe of the application of telehealth to individuals with congestive heart failure
reported a reduction of between 27% and 40% in overall hospital admissions, and a
significant reduction in the hospital length of stay and healthcare services used (K. A.
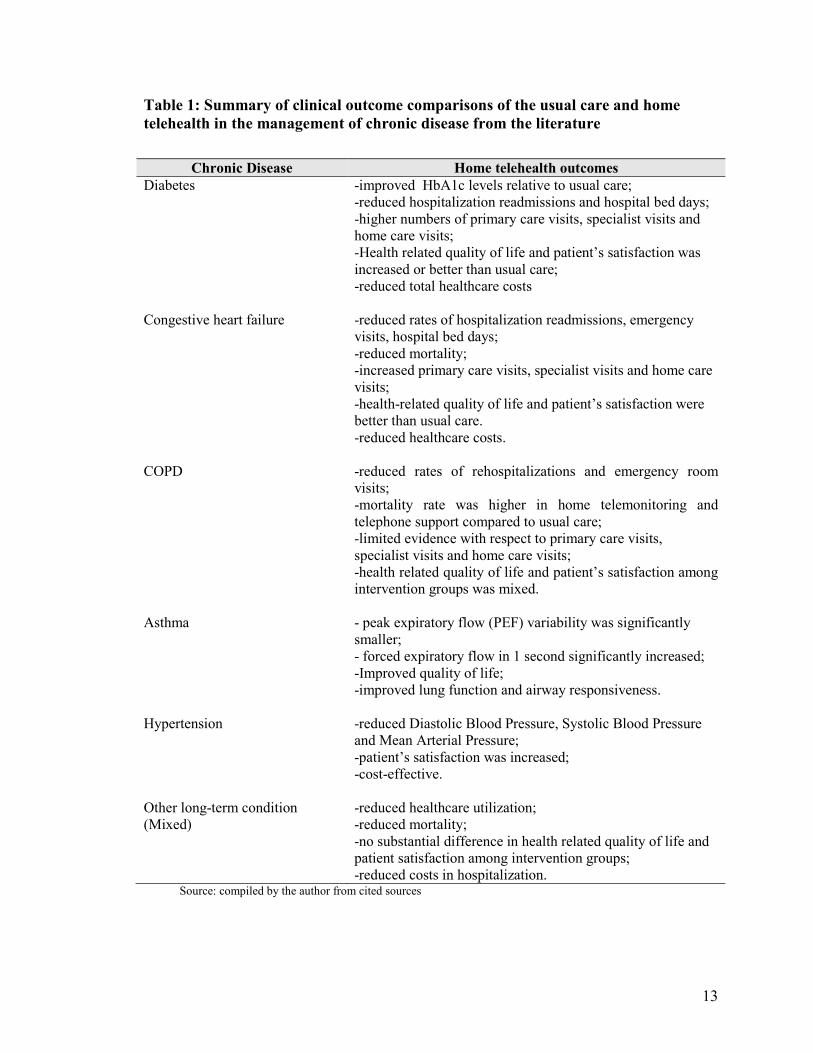
Stroetmann, Robinson, K.C. Stroetmann, McDaid, 2010). The following table 1
summarizes the main telehealth intervention clinical outcomes for the chronic diseases of
diabetes, congestive heart failure, hypertension, asthma, COPD and mixed chronic
conditions.
13
Table 1: Summary of clinical outcome comparisons of the usual care and home telehealth in the management of chronic disease from the literature
Chronic Disease Home telehealth outcomes
Diabetes -improved HbA1c levels relative to usual care; -reduced hospitalization readmissions and hospital bed days; -higher numbers of primary care visits, specialist visits and home care visits; -Health related quality of life and patient’s satisfaction was increased or better than usual care; -reduced total healthcare costs
Congestive heart failure -reduced rates of hospitalization readmissions, emergency visits, hospital bed days; -reduced mortality; -increased primary care visits, specialist visits and home care visits; -health-related quality of life and patient’s satisfaction were better than usual care. -reduced healthcare costs.
COPD -reduced rates of rehospitalizations and emergency room visits; -mortality rate was higher in home telemonitoring and telephone support compared to usual care; -limited evidence with respect to primary care visits, specialist visits and home care visits; -health related quality of life and patient’s satisfaction among intervention groups was mixed.
Asthma - peak expiratory flow (PEF) variability was significantly smaller; - forced expiratory flow in 1 second significantly increased; -Improved quality of life; -improved lung function and airway responsiveness.
Hypertension -reduced Diastolic Blood Pressure, Systolic Blood Pressure and Mean Arterial Pressure; -patient’s satisfaction was increased; -cost-effective.
Other long-term condition (Mixed)
-reduced healthcare utilization; -reduced mortality; -no substantial difference in health related quality of life and patient satisfaction among intervention groups; -reduced costs in hospitalization.
Source: compiled by the author from cited sources
14
In summary, telehealth applications showed an improvement in clinical outcomes,
such as reductions in hospital readmission, emergency visits, and mortality. Most patients
were satisfied with the services. In addition, telehealth used in congestive heart failure
interventions provided better outcomes in terms of reduction of reduced hospitalization,
emergency visits, and mortality.
2) Economic Evaluations
The economic evaluation of telehealth in the literature includes interventions for
cardiology, diabetes, COPD, dermatology and psychiatry, and these studies analyzed
interventions in primary care, secondary care and home care settings using telephone,
videoconferencing and monitoring. The results indicated that investment in technology
enhanced the healthcare services. Some of these studies showed that telehealth
substantially lowered hospitalization and emergency visits during the intervention and
resulted in a saving of costs in healthcare utilization. For example, Noel et al. found when
home telehealth was integrated with the health facility’s electronic medical record system,
the intervention for complex heart failure, chronic lung disease, and diabetes showed a
significant reduction in healthcare costs for elderly high- resource users with complex co-
morbidities. The bed-days-of-care (p < 0.0001) and urgent clinic/emergency room visits
were significantly decreased at 6 months intervention (p = 0.023). Although functional
levels and patient-rated health status did not show a significant difference between groups,
the intervention improved cognitive status, treatment compliance and stability of chronic
CHF severity* NYHA class II 38 (22%) 11 (20%) 14 (23%) 13 (22%) NYHA class III 82 (47%) 27 (49%) 30 (49%) 25 (43%) NYHA class IV 54 (31%) 17 (31%) 17 (28%) 20 (35%) *New York Heart Association functional status
49
As compared to the control group, healthcare service utilization for all causes was
lower in both intervention groups although this is not significantly different between
groups (p=0.3893). Winnipeg patients in the intervention groups had fewer emergency
department visits, but there are no statistically significant differences between the three
study groups. The number of CHF healthcare visits was apparently higher in the
intervention groups, but it was not significantly different from the control group1
(p=0.1147). CHF specific primary care visits accounts for roughly 10% of all cause
primary care visits of each group (table 6). This finding indicates that the patients might
have co-morbidity conditions. The number of deaths during the intervention period was
small in each group. There were 3 deaths in the control group, 3 deaths in the HL group;
and 5 deaths in the HLM group respectively. Differences between groups are not
statistically significant.
Hospital in-patient days during the intervention are summarized in table 7. Patients
in the control group had more all-reasons hospital inpatient days than both intervention
groups, but the differences were not significant. However, hospital inpatient days for
CHF were significantly higher for the intervention groups relative to the control group
(p<.05).
Tables 20 to 22 in Appendix A show the counts of healthcare contacts for all causes
and for CHF in each 90-day intervention period. These tables detail the primary care
visits and hospitalizations, including family physician visits, physician specialist visits,
cardiac specialist visit, and internist visits as well as in-patient days. In each study group,
patients had more healthcare visits at the baseline and the first 90-day intervention period
1 Recall that not all CHF related contacts will be flagged as CHF-related by the data. Identification, particularly for physician visits, depends on the practice of the physician.
50
than in subsequent periods. This is probably because the study was stopped early before
all patients had been followed for a year.
51
Table 6: Counts of primary care and emergency contacts by groups2
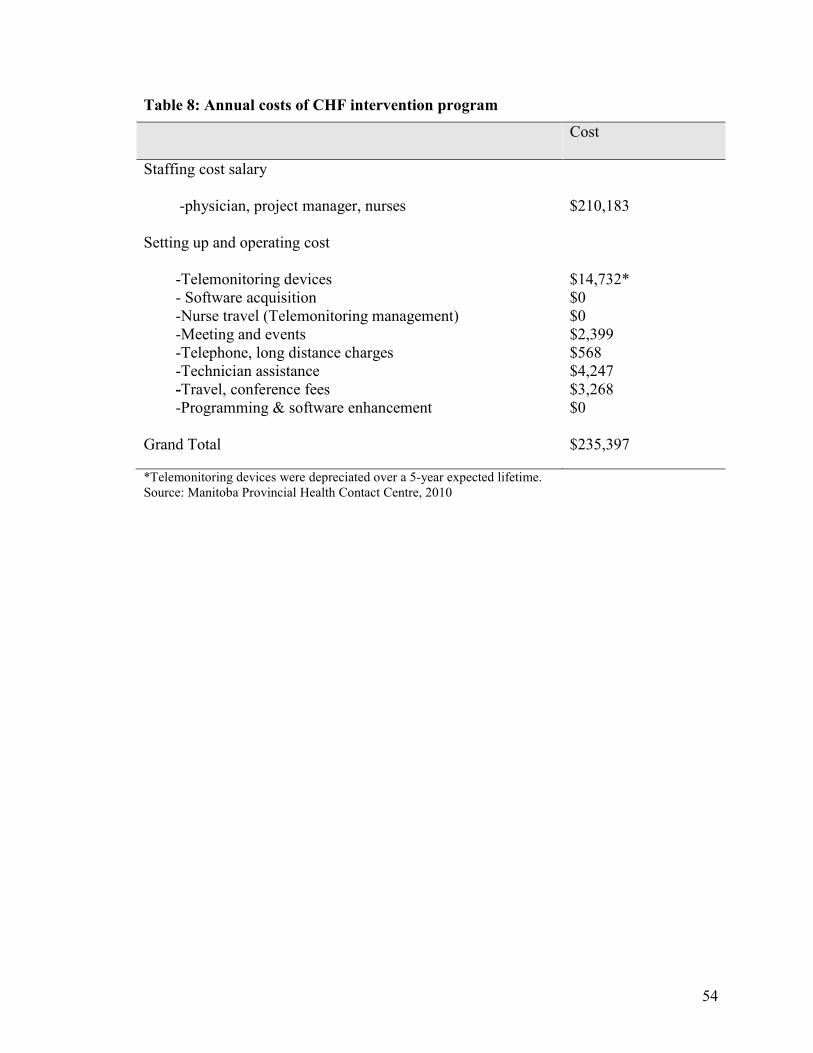
*Telemonitoring devices were depreciated over a 5-year expected lifetime. Source: Manitoba Provincial Health Contact Centre, 2010
55
4.3 Healthcare utilization cost
Two types of healthcare utilization cost data were analyzed: 1) healthcare utilization
cost for all reasons and 2) healthcare utilization cost with a diagnosis of congestive heart
failure. The cost data for healthcare services in this study are skewed, because costs are
naturally bounded by zero and there are a small proportion of patients with very high
costs. Therefore, this small number of patients has a much bigger effect on mean cost.
Faced with skewed data, Drummond et al. suggested presenting as much detail about the
cost distribution as possible. Therefore, both mean and median costs of the healthcare
service were reported by this study (Drummond et al., 2005).
Table 9 presents the mean (SD) and the total cost4 for all-reason visits to primary
care providers and hospitalizations for three study groups. Compared to the control group,
both HL and HLM intervention groups had lower healthcare utilization costs, including
both inpatient and outpatient costs. The one-year mean cost of healthcare utilization for
all causes was $7,151 for the usual care group, $4,576 for the HL group and $4,203 for
the HLM group respectively. Overall the healthcare costs per patient were higher in the
control group, but the difference is not statistically significant (p=0.7765). Figure 4
compares the total inpatient and outpatient costs for the three study groups. Inpatient
costs were found to account for a big proportion (more than 70%) of the total cost of
healthcare utilization in each study group.
Table 23 in Appendix A compares the mean (SD) cost of healthcare utilization of
each study group for all cause visits and for a diagnosis of congestive heart failure visits
for each 90-day period of the study period. Differences in the total cost were not
4 Not including ER visit cost of Winnipeg patients.
56
statistically significant between groups, but there was a decrease of mean cost during the
last 90-day study period compared to the baseline for each group.
The mean cost for all-cause visits was also not significantly different by gender,
geographical location, age groups and New York Heart Association functional status
between groups (Appendix A). Females and males in the control group had the highest
mean cost of healthcare utilization for all reasons compared to the two telehealth
intervention groups. Patients with an advanced stage of heart failure had relatively higher
mean cost. However, in most cases there was no statistically significant difference
between groups.
57
Table 9: Healthcare utilization costs for the three study groups
Control HL HLM p* For all reasons
Mean (SD) cost $7,151 (18106) $4,576 (9,996) $4,203 (8,651) Median cost $1,054 $788 $1,025 Total cost $ 393,316 $279,158 $243,770 0.7583 Minimum cost $98 $47 $178 Maximum cost $118,407 $65,894
$42,775
With a diagnosis of CHF Mean (SD) cost $180 (376) $198 (474) $1,212 (4504) Median cost $33 $92 $66 Total cost $9,915 $12,050 $70,283 0.2804 Minimum cost $0 $0 $0 Maximum cost $2,435 $3,592 $24,818 *Non-parametric Kruskal-Wallis test
58
Figure 4: Comparison of total inpatient and outpatient costs for the three study groups
$0
$50,000
$100,000
$150,000
$200,000
$250,000
$300,000
$350,000
$400,000
$450,000
Control HL HLM
Study group
Out-patient cost
In-patient cost
59
Emergency department costs for the Winnipeg patients were also estimated in this
study. Dawson and Zinck determined the ED spending in Canada in 2005-2006 based on
CIHI’s Canadian Management Information Systems Database. They found that the
average cost per ED visit in Manitoba was $103 (Dawson & Zinck, 2009). Using this
estimated ED cost per visit, the total cost of ED visits in each 90-day intervention period
was quantified as shown in table 10. All study groups had higher ED costs at baseline and
the first 90 days. Both intervention groups had a decreasing trend of ED spending over
time. However, the costs of ED visits for the intervention groups were not significantly
different from the control group.
60
Table 10: Estimated total cost for Emergency Department visits for all reasons for patients in Winnipeg Health Region
Control HL HLM p Baseline $2,892 $1,326 $1,446 0.1807 0-3 months $1,446 $1,687 $1,326 0.9852 4-9 months $482 $844 $844 0.8783 10-12 month $603 $603 $0 0.1094 *Non-parametric Kruskal-Wallis test
61
4.4 Survey outcomes
Study participants were asked to complete surveys during the study period at
baseline, 3 months, 6 months and 12 months. The following filters were used to remove
invalid surveys for three reasons: 1) surveys occurring after September 25, 2006 (when
WRHA started providing the intervention to the control group); 2) surveys completed one
month or more after people indicated they were formally out of the study; 3) people with
only one survey.
A total of 410 surveys were used to analyze the effectiveness of the intervention,
including 131 patients who completed baseline and the first follow-up surveys, 92
patients who completed the second follow-up survey and 56 patients who completed the
last survey. The follow-up surveys were completed, on average, at 100 days (follow-up
survey one), 191 days (follow-up survey two) and 365 days (follow-up survey three) after
study enrollment. Patient demographics were similar comparing this sub-sample to the
overall study group. For example, 51.1% of the survey sample was female with an
average patient age of 75.1 years. Fifty-five percent of patients resided in the WRHA and
31.8% of all patients had an advanced stage of heart failure.
62
Table 11: Survey sample distribution by study group
Health status can be measured by using the SF-36 questionnaire. The mean scores
(SD) of the eight SF-36 health domains and health utility are presented in table 13. Each
domain is scored from 0-100, with higher scores representing better health. Mixed effects
repeated measures models were used to test the statistical significance of each health
domain score for four surveys over time between groups. Significance level was set at
p<.05.
Overall, the domain scores of SF-36 physical functioning and role limitation
(physical) were significantly different over time among groups. In particular, physical
functioning was observed to be significantly different between groups over time
(p=0.0011). The domain scores of bodily pain and role limitation (emotional) were
significantly different between groups. None of other health domains were observed
significantly different over time or between groups.
In order to use this information in a cost-effectiveness analysis, SF-36 scores in the
eight domains were converted to a single ‘preference based’ utility score indicating the
value that would be placed on a health state. The SF-6D algorithm was used to convert
SF-36 responses and generate a utility score for each subject. The SF-6D is based on 6 of
the 8 dimensions of SF-36 –‘General Health’ is omitted and ‘role limitation (physical)’
and ‘role limitation (emotional)’ are combined. Each dimension has a number of levels
such as ‘limited a lot’ and ‘limited a little’ and the combination of levels over dimensions
describes 18,000 (=6×4×5×6×5×5) unique health states. Using a fractional factorial
design, 249 health states were valued by a representative sample of the UK general
population. The standard gamble technique was used to elicit utility values (Brazier et al.,
64
2002). In this way, a utility score was generated for the different health states based on
patients’ responses to the SF-36 questions.
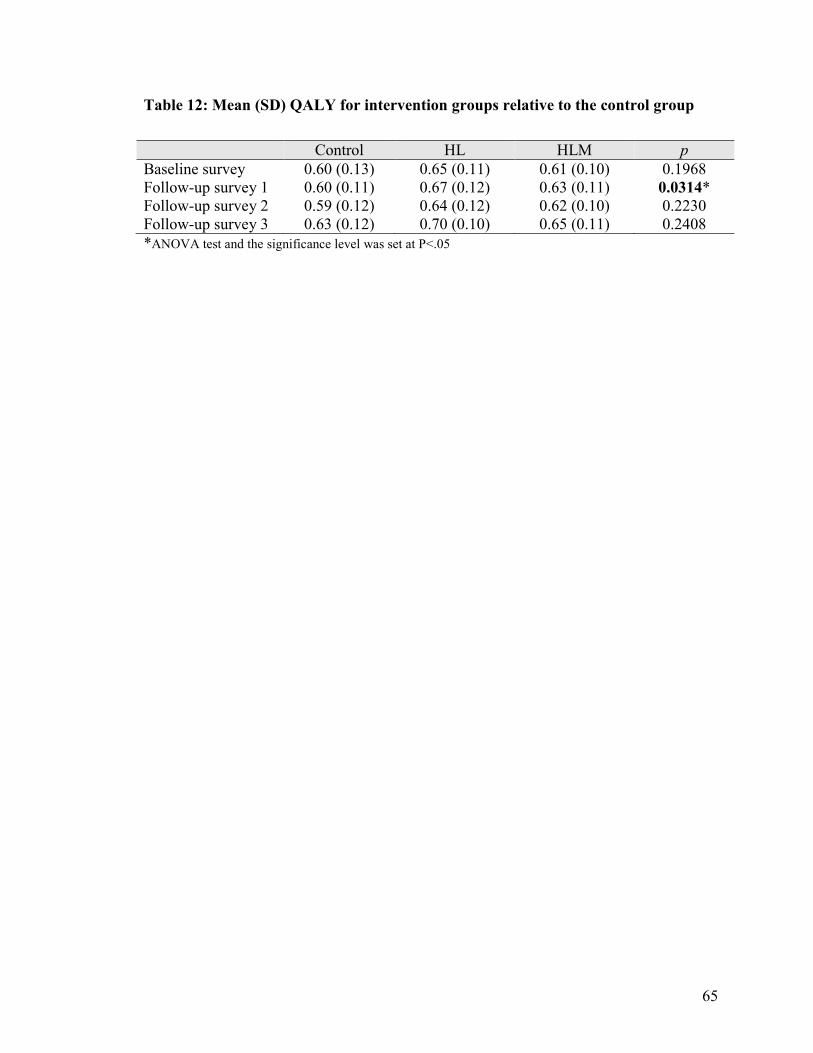
In order to generate the QALY, I used an algorithm developed by Brazier et al. to
calculate the SF-6D utility scores from baseline, 3-, 6-, and 12-month SF-36 data (Brazier,
Deverill, Green, Harper, & Booth, 1999). Table 12 illustrates that the SF-6D utility scores
from the control group ranged from 0.59 to 0.63; the HL group ranged from 0.64 to 0.70;
the HLM group ranged from 0.61 to 0.65. There are significant differences in QALYs
between groups for the first survey. Mixed effects repeated measures models test the
significant difference in the SF-36 utility scores between groups and over time for all four
survey points and show that the SF-6D health utility for the intervention groups was
significantly higher than the control group; the differences were also statistically
significant between groups and over time.
65
Table 12: Mean (SD) QALY for intervention groups relative to the control group
Control HL HLM p Baseline survey 0.60 (0.13) 0.65 (0.11) 0.61 (0.10) 0.1968 Follow-up survey 1 0.60 (0.11) 0.67 (0.12) 0.63 (0.11) 0.0314* Follow-up survey 2 0.59 (0.12) 0.64 (0.12) 0.62 (0.10) 0.2230 Follow-up survey 3 0.63 (0.12) 0.70 (0.10) 0.65 (0.11) 0.2408 *ANOVA test and the significance level was set at P<.05
66
Tab
le 1
3: S
F-3
6 m
ean
(SD
) dom
ain
scor
es a
nd S
F-6
D m
ean
(SD
) uti
lity
scor
e by
gro
up
SF36
B
asel
ine
Follo
w-u
p su
rvey
1
Follo
w-u
p su
rvey
2
Follo
w-u
p su
rvey
3
Tim
e p
Gro
up
p
Tim
e*st
udy
grou
p
p
C
ontr
ol
(N=4
4)
H
L
(N=4
7)
H
LM
(N
=40)
C
ontr
ol
(N=4
4)
H
L
(N=4
7)
H
LM
(N
=40)
C
ontr
ol
(N=3
1)
H
L
(N=3
2)
H
LM
(N
=29)
C
ontr
ol
(N=1
9)
H
L
(N=1
8)
H
LM
(N
=19)
Ph
ysic
al
func
tioni
ng
40.1
8 (2
7.61
) 37
.66
(2
8.85
) 40
.93
(27.
62)
35.8
3 (2
3.79
) 45
.22
(29.
84)
41.8
8 (2
8.77
) 35
.67
(26.
90)
32.5
0 (2
6.09
) 41
.72
(29.
80)
41.5
8 (2
9.30
) 53
.44
(23.
36)
42.5
0 (2
9.67
) 0.
0113
0.
5200
0.
0011
Rol
e Ph
ysic
al
28.2
9 (3
6.19
) 37
.41
(28.
85)
33.1
3 (3
8.56
) 25
.61
(34.
68)
42.0
2 (4
0.41
) 33
.13
(38.
56)
19.1
7 (2
9.86
) 30
.47
(35.
77)
26.7
2 (3
5.31
) 38
.16
(45.
16)
39.0
6 (3
8.70
) 38
.89
(43.
91)
0.03
17
0.25
37
0.83
37
Bod
ily p
ain
53.3
0 (3
0.75
)
64.2
8 (2
4.95
) 56
.00
(28.
38)
50.9
3 (2
7.48
) 66
.04
(25.
65)
54.5
6 (2
7.31
) 54
.27
(26.
64)
61.7
8 (2
9.44
) 49
.14
(27.
86)
53.0
5 (2
6.82
) 80
.67
(28.
38)
60.3
3 (3
2.62
) 0.
1107
0.
0017
0.
2323
Gen
eral
he
alth
44.6
1 (2
3.30
)
45.9
3 (1
9.47
) 44
.73
(17.
79)
46.1
0 (2
1.61
) 49
.13
(18.
28)
45
.85
(21.
29)
47.4
3 (2
1.25
) 46
.13
(17.
68)
42.5
2 (2
3.26
) 49
.05
(19.
59)
55.6
3 (2
7.51
) 40
.17
(23.
38)
0.20
87
0.53
41
0.53
00
Vita
lity
39.2
0 (2
0.88
) 42
.17
(23.
28)
42.5
0 (2
0.29
) 39
.64
(23.
44)
44.3
6 (2
2.71
) 41
.67
(24.
50)
38.1
7 (2
2.22
) 39
.69
(25.
71)
41.7
2 (2
1.85
)
41.8
4 (2
2.68
) 45
.67
(23.
74)
36.1
1 (2
3.49
) 0.
9763
0.
9205
0.
4495
Soci
al
Func
tioni
ng
61.0
8 (3
0.29
) 73
.91
(26.
06)
73.1
3 (2
5.72
) 62
.80
(29.
54)
75.0
0 (2
7.21
) 71
.88
(23.
64)
62.0
8 (3
1.74
) 69
.53
(28.
56)
66.3
8 (3
0.45
) 63
.82
(3
4.33
) 77
.50
(26.
81)
73.6
1 (2
7.75
) 0.
5313
0.
0598
0.
9811
Rol
e E
mot
iona
l
49.6
1 (4
1.39
)
62.7
7 (4
0.71
) 57
.50
(43.
35)
55.6
9 (4
6.19
) 72
.34
(38.
90)
61.6
7 (4
0.33
)
53.3
3 (4
6.81
) 69
.79
(43.
47)
60.9
2 (4
4.60
) 59
.65
(47.
89)
77.7
8 (3
4.88
) 75
.93
(35.
80)
0.09
94
0.03
96
0.95
63
Men
tal
heal
th
68.6
4
(21.
81)
75
.48
(1
9.63
)
71.2
5 (1
6.30
) 71
.19
(21.
07)
78.3
8 (2
0.49
) 73
.85
(20.
86)
70.6
7 (2
1.10
) 79
.25
(23.
82)
75.1
7 (1
9.67
) 73
.82
(17.
98)
78.9
3 (2
1.51
) 81
.78
(12.
96)
0.10
05
0.28
82
0.47
43
SF-6
D
utili
ty
0.60
(0
.13)
0.
65
(0.1
1)
0.61
(0
.10)
0.
60
(0.1
1)
0.67
(0
.12)
0.
63
(0.1
1)
0.59
(0
.12)
0.
64
(0.1
2)
0.62
(0
.10)
0.
63
(0.1
2)
0.70
(0
.10)
0.
65
(0.1
1)
0.02
47
0.04
52
0.89
93
*Dom
ain
scor
es ra
nge
0-10
0 **
Mix
ed e
ffec
ts re
peat
ed m
easu
res
mod
els,
p v
alue
was
set
<.0
5 fo
r ove
rall
follo
w-u
p ov
er ti
me
and
follo
w-u
p di
ffer
ence
bet
wee
n gr
oups
67
4.4.2 Outcome of Self-Care Behavior Scale survey
The Revised Heart Failure Self-Care Behavioral Scale outlines activities that
patients with CHF must perform to some extent so that they can continue to function in
their daily life. As examples, patients are asked if they take their medications daily, if
they contact their doctor when they are short of breath, and if they spread their activities
out over the whole day so that they do not get too tired. Patients in this study were asked
29 questions about how often they demonstrated each behavior with a choice of ‘none of
the time’ which scores a zero to ‘all of the time’ which scores a five on the Likert scale
(Appendix B). Individual items are summed to provide scores from 0-145, with higher
scores ranking better.
There is some evidence to suggest that health lines is an effective intervention for
helping patients with CHF improve self-maintenance so that they can continue to
function in their daily life. Based on the results (table 14), overall the control group had
lower mean score than the study groups. The results also revealed a significant
improvement in Self-Care Behavior in the intervention groups over time (p<.05).
68
Table 14: Mean (SD) score for Self-Care Behavior Scale Survey
Control HL HLM P*
Baseline 98.48 (19.19)
105.90 (17.80)
101.90 (19.65)
0.1153
Follow-up survey 1
101.00 (15.43)
108.59 (20.70)
104.60 (19.29)
0.1219
Follow-up survey 2
103.31 (17.70)
106.06 (16.75)
102.61 (19.72)
0.6917
Follow-up survey 3
105.18 (19.00)
120.77 (17.80)
110.57 (17.52)
0.0067
* ANOVA test at 5% significance level
69
4.4.3 Outcome of client satisfaction survey
Patient satisfaction with the telehealth intervention was estimated using the Client
Satisfaction Questionnaire administered when the study was completed. The
questionnaire has an 8-item, 4-point Likert scale that asked a patient’s general
satisfaction with the telehealth intervention services that they were receiving. Examples
of the questions included in this questionnaire are: “How would you rate the quality of
the service you received?”, “Did you get the kind of service you wanted?”, “How
satisfied are you with the amount of help you received?”, “Have the services you
received helped you deal more effectively with your problems?”
A total of 74 patients including 30 patients from the control group, 36 patients from
HL study group and 8 from HLM study group completed the questionnaire. Most patients
who responded to the survey (76%) were 70 years and older; 60% were female and 40%
were male.
As a general measure of satisfaction, the mean total (SD) score results were:
Control group patient 27.07 (4.38); HL patients 26.69 (4.35); HLM patients 28.88 (2.47)
(p= 0.4211). Given that the maximum possible score in the CSQ-8 is 32, the patients’
scores were high and similar within and across groups. Patients in the HLM intervention
group gave the highest satisfaction scores for all questions.
Table 15 demonstrates the mean score for client responses to specific questions.
These indicated that patients generally felt good about the quality of the services and
thought it helped them deal more effectively with problems, even though no statistically
significant differences were found between groups.
70
Table 15: Mean scores (SD) for the Client Satisfaction Questionnaire5
Client Satisfaction Question
Control (N=30)
HL (N=36)
HLM (N=8)
Mean (S.D.)
Mean (S.D.)
Mean (S.D.)
How would you rate the quality of service your received? 1. Poor 2. Fair 3. Good 4. Excellent
3.50
(0.73)
3.36
(0.72) 3.63
(0.52)
Did you get the kind of service you wanted? 1. No, definitely not 2. No, not really 3. Yes, generally 4. Yes, definitely
3.40 (0.67)
3.22 (0.72)
3.50 (0.53)
To what extent has our program met your needs? 1. None of my needs have been met 2. Only a few of my needs have been met 3. Most of my needs have been met 4. Almost all of my needs have been met
3.07 (0.74)
2.86 (0.83)
3.13 (0.83)
If a friend were in need of similar help, would you recommend our program to him/her? 1. No, definitely not 2. No, not really 3. Yes, I think so 4. Yes, definitely
3.67 (0.55)
3.72 (0.51)
4.00 (0.00)
How satisfied are you with the amount of help you received? 1. Quite dissatisfied 2. Indifferent, or mild dissatisfied 3. Mostly satisfied 4. Very satisfied
3.33 (0.66)
3.28 (0.70)
3.63 (0.52)
Have the service you received helped you to deal more effectively with your problems? 1. No, they seemed to make things worse 2.No, they really did not help 3. Yes, they helped somewhat 4. Yes, they helped a great deal
3.20 (0.61)
3.19 (0.71)
3.25 (0.46)
In an overall, general sense, how satisfied are you with the service you received? 1. Quite dissatisfied 2. Indifferent, or mild dissatisfied 3. Mostly satisfied 4. Very satisfied
3.40 (0.67)
3.36 (0.72)
3.88 (0.35)
If you were to seek help again, would you come back to our program? 1. No, definitely not 2. No, I don't think so 3. Yes, I think so 4. Yes, definitely
3.50 (0.78)
3.69 (0.62)
3.88 (0.35)
5 ANOVA test shows that there is no significant difference between groups at 5% significance level.
71
4.5 Does the intervention program pay for itself?
4.5.1 Cost-benefit analysis
The goal of the cost-benefit analysis is to determine whether the benefit of the
Health Lines intervention exceeds its cost; a positive net benefit indicates the program
will pay for itself. The benefits from the healthcare provider’s perspectives are the
immediate savings in terms of the utilization averted. The costs for this analysis include
the costs of delivering the program. In the cost-benefit analysis, costs and benefits of the
program were compared over the study period of one year and the consequences are
expressed in monetary terms in order to see which is larger. The benefit-cost ratio is the
healthcare system savings caused by reduced system utilization divided by the total costs
of offering the telehealth program intervention. The higher the ratio, the better the
intervention strategy is. If the ratio is greater than 1, then the intervention cost less to
offer than it saves the provider in terms of reduced utilization. If the ratio is less than 1,
the intervention costs more to offer than it saves.
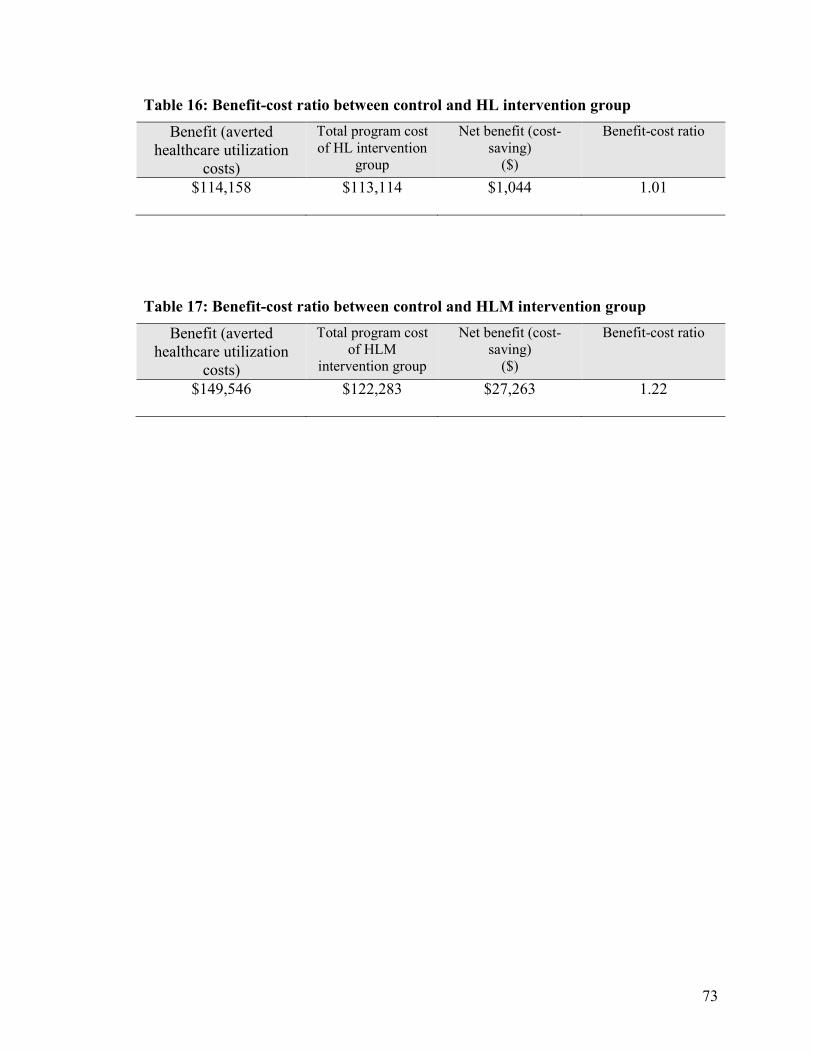
As mentioned in section 4.2, the total program cost covered equipment, staff
salaries and wages of physicians and nurses, etc. at $113,114 (HL group) and $122,283
(HLM group) respectively6. Compared to the control group, the total benefits from the
averted healthcare utilization costs through the Health Lines intervention were $114,158
and through the Health Lines plus Monitoring were $149,546. Consequently, the Health
Lines interventions generated a net savings for the healthcare system of about $28,307.
Table 16 shows the benefit-cost ratio is 1.01 between the control group and HL
intervention group, indicating approximately $1.01 in savings was gained for every dollar
spent on the HL intervention, for a total of was approximately $1,044. Similarly, Table 17 6 Program costs were calculated based on the cost items listed by table 8.
72
shows the benefit-cost ratio between usual care and HLM intervention is 1.22, which
implies 1.22 in savings are gained for every dollar spent on the HLM intervention, for a
total net saving of $27,263. Therefore, we conclude that the Health Lines intervention
program is a valuable one that pays for itself. Health Line and Health Lines plus
Monitoring intervention strategies for congestive heart failure intervention proved less
expensive than usual care and should be implemented.
However, it must be noted that we could not demonstrate that the total costs of
either intervention group were significantly different from the costs for the control group.
Therefore, the “benefit” used to calculate the above ratio is a notional one and requires
validation through ongoing monitoring after the program is introduced.
73
Table 16: Benefit-cost ratio between control and HL intervention group
Benefit (averted healthcare utilization
costs)
Total program cost of HL intervention
group
Net benefit (cost-saving)
($)
Benefit-cost ratio
$114,158 $113,114 $1,044 1.01
Table 17: Benefit-cost ratio between control and HLM intervention group
Benefit (averted healthcare utilization
costs)
Total program cost of HLM
intervention group
Net benefit (cost-saving)
($)
Benefit-cost ratio
$149,546 $122,283 $27,263 1.22
74
4.6 Cost-effectiveness analysis
Benefit-cost analysis suggested that telehealth was potentially cost saving, however
we were unable to draw a strong conclusion because cost differences between groups
were not statistically significant. Cost-effectiveness analysis can be used to evaluate an
intervention even if it is not cost saving. Many health interventions cost more than usual
care, but are justified because they yield additional benefits to the patient that more than
make up for additional cost.
Cost-effectiveness analysis is complex because both differences in costs and
differences in effects are taken into account in the analysis. The incremental cost-
effectiveness ratio (ICER) measures the value of the Health Lines interventions. The
ICER is the additional cost per additional unit of output or effect. To evaluate the ICER,
the program costs of the interventions were divided by the additional QALYs generated
by the intervention in order to generate a cost-effectiveness ratio for each intervention
group. The incremental cost-effectiveness ratio tells us how much it costs to generate an
additional QALY through each intervention.
The ICERs were calculated based on the first follow-up survey because there is a
statistically significant difference in the health effects between groups. Table 18 shows
the ICERs of the two interventions-HL and HLM. The ICERs in this table compared the
intervention options by simply dividing an intervention’s cost by its additional
effectiveness. The ICER relative to HL intervention was $26,486/QALY; the ICER
relative to HLM intervention was $70,266/QALY. The HLM intervention group had a
higher ICER, indicating the cost of generating additional QALYs through HLM services
was higher than generating additional QALYs through the HL intervention.
75
However, the above analysis is based purely on a point estimate of observed cost
and effect. In order to allow for sampling variation, the sensitivity analysis below allows
us to visualize uncertainty by employing a bootstrapping technique.
76
Table 18: Incremental cost-effectiveness ratio (ICER) based on the first follow-up survey
Study group Increment cost Incremental effectiveness
Incremental cost-effectiveness ratio
HL vs Usual care $1,854 0.07 $26,486/QALY HLM vs Usual care $2,108 0.03 $70,266/QALY
77
4.7 Sensitivity analysis
The ICERs provide estimates of the mean cost per QALY gained by providing the
program intervention. However, the ICERs may not have a normal distribution and the
calculation in section 4.6 takes into account only the first survey point which is
statistically significant. Moreover it only includes program cost. This section considers
all four survey points and takes into account both the program costs and the health system
savings generated by the program.
It is necessary to estimate the sampling distribution around the point estimate non-
parametrically. The most appropriate technique is to use the “bootstrap” (Brigg,
Wonderling, & Mooney, 1997). A non-parametric bootstrap with replacement method
was used to create 1,000 resamples of the cost and effectiveness data from all four survey
points for replacement. By using this method, 1,000 further hypothetical incremental
costs and incremental effects were modeled.
Table 19 below shows that the mean increase in QALYs for each intervention over
all four survey points, and the incremental cost of each intervention, taking into account
health system savings as well as program costs. The simulation shows that the mean
incremental costs of the interventions relative to the usual care were negative once we
take into account savings from healthcare utilization averted: HL versus the usual care
was -$1,789 (95% CI -$18,433, $12,282); HLM versus the usual care was -$7,410 (95%
CI -22,952, $1,540). The mean incremental effects of the interventions were positive
compared to the usual care: HL versus the usual care was 0.066 (95% CI -0.01, 0.130);
HLM versus the usual care was 0.01 (95% CI -0.063, 0.088). Note, however, that neither
incremental costs nor incremental effects were significantly different from zero.
78
The negative ICER indicates that by adopting Health Lines strategies rather than the
usual care, there is improvement in life-years gained and lower expected costs. This
finding suggests that both Health Lines strategies are cost-effective alternatives to usual
care. However, since both mean incremental cost and mean incremental QALY intervals
include zero, the interventions cannot be shown to be cost-effective at the conventional
5% significance level.
79
Table 19: Summery of mean incremental costs and effects from 1,000 bootstrap re-samples
Mean incremental cost
(2.5th-97.5th percentile)
Mean Incremental QALY (2.5th-97.5th
percentile)
Mean ICER
HL vs Usual care
-$1,789
(-$18,433,$12,282)
0.066
(-0.01, 0.130)
-$27,523
HLM vs Usual care
-$7,410
(-22,952,$1,540)
0.01
(-0.063, 0.088)
-$741,000
80
Using the above data from the bootstrap sample, the cost-effective plane diagrams
resulting from 1,000 bootstrap replications of the incremental cost and effectiveness were
plotted in figures 5 and 6. The scatter diagrams depict the mean difference in costs and
effects from a bootstrap sample (N=1,000) with replacement from this study. Incremental
cost and effect data are combined on a two dimensional cost effectiveness plane. It
models the cost difference in one dimension and the effect difference in the other.
The bootstrap replications in each quadrant have different implications. If the bootstrap
replications fall in the southeast quadrant (quadrant II) (negative costs and positive
effects), the decision on the intervention is clear and considered cost-effective because
the intervention costs less and generates better outcomes. By contrast, if the bootstrap
replications fall in the northwest quadrant (quadrant IV) with positive cost and negative
effect, the intervention is not considered cost-effective because it costs more and
generates poorer outcomes. If the bootstrap replications fall in the southwest (quadrant III)
and northeast (quadrant I), the decision making will be complex, because better outcomes
come with a higher cost. The intervention may be cost-effective, depending on whether
the bootstrap replications fall below the amount that decision makers are prepared to pay
for better outcomes. The threshold is the amount of money which a decision maker is
willing to pay for a quality-adjusted year of life. It is an administrative decision because
the decision makers are responsible for the health service budgets.
Figures 5 and 6 illustrate the scatters of simulated bootstrap replications across the
four quadrants of the planes. In figure 5, 56.9% of simulated bootstrap replications appear
in the southeast quadrant, indicating that the Health Lines intervention will generate
QALYs while at the same time reducing the overall cost of patient care. Approximately
81
39.6% simulated bootstrap replications fall in the northeast quadrant, indicating that
QALYs are gained at increased cost (more costly, more effective). Few of these
simulations show a reduction of QALYs.
Similarly, in figure 6, around 55.9% of simulated bootstrap replications fall in the
southeast quadrant, illustrating that the HLM intervention produced beneficial effects and
reduced costs for the healthcare system compared to usual care. Only 3.1% bootstrap
replications fall in the northeast quadrant. In addition, about thirty-four percent of the
bootstrap replications fall in southwest quadrant indicating no QALY gain but cost saving
(less costly and less effective).
82
Figure 5: Cost-effectiveness plane from bootstrap sampling of Control and Health Line group patients
-$40,000
-$30,000
-$20,000
-$10,000
$0
$10,000
$20,000
$30,000
$40,000
-0.1 -0.05 0 0.05 0.1 0.15 0.2
Additional Effect
Additional Cost
83
Figure 6: Cost-effectiveness plane from bootstrap sampling of Control and Health Lines plus Monitoring group patients
-$40,000
-$30,000
-$20,000
-$10,000
$0
$10,000
$20,000
$30,000
$40,000
-0.15 -0.1 -0.05 0 0.05 0.1 0.15
Additional Effect
Additional Cost
84
4.7.1 Cost-effectiveness acceptability curve
The cost-effectiveness acceptability curve (CEAC) is a method for summarizing the
uncertainty in estimates of cost-effectiveness. The CEAC shows the probability that the
intervention is cost-effective compared with the alternative in a range that the decision
makers might be willing to pay for a unit change in outcome. The CEAC is derived from
the joint distribution for incremental costs and incremental effects from the bootstrapping
result and shows the probability that the decision evaluated is cost-effective (the y-axis),
given joint uncertainty in model parameters for different values of the decision maker’s
willingness to pay for health benefit (the x-axis).
There is no explicit standard about an appropriate threshold 5.7This is an
administrative and ultimately political decision. In this study, different thresholds
between $0 and $100,000 were used to estimate the probability that the intervention will
generate additional QALYs for less than the decision-maker is prepared to spend.
The corresponding cost-effectiveness acceptability curves are presented in Figure 7
which indicates a probability of 60% that the Health Lines intervention is cost-effective
relative to usual care if the decision-maker is not prepared to spend anything to gain
better outcomes for patients. That is, the potential cost-saving alone may be sufficient to
justify the introduction of the intervention. Similarly, there is a probability of 63.1% that
a Health Lines plus Monitoring intervention is cost-effective compared to usual care,
even when the decision-maker will spend nothing to generate additional QALYs. If
better outcomes for patients are taken into account, the probability that the intervention is
7 The most popular arbitrary thresholds in the literature include from $20,000, $50,000 to $100,000. Among more than 500 published papers (Grosse, 2008)about cost-utility studies in 2003, half of al studies used a single value of $50,000 as the threshold, therefore, cost-effective studies often refer to use this amount as ‘generally accepted’. The second most popular threshold is $100,000.
85
cost-effective increases. The most often used threshold in the literature is $50,000/QALY
in the literature; at this point, a decision to adopt the HL intervention over usual care has
a 75.4% probability of being cost-effective. A decision to adopt HLM over the usual care
has a 70.4% probability of being cost-effective at that point. When the cost-effectiveness
threshold exceeds $30,000, the HL intervention becomes more cost-effective than HLM.
The curves cross as decision makers are prepared to pay more for an additional QALY. If
they are not prepared to pay anything for an additional QALY, then HLM (the cheapest
alternative when you take into account health system savings alone) dominates. As
willingness to pay for additional QALYs increases, HL begins to dominate. These curves
just represent another way of looking at the data in figures 5 and 6.
The purpose of this study was to determine whether Health Lines interventions are
cost-effective interventions relative to the standard treatment for congestive heart failure
patients from the Winnipeg and Central Health Regions in Manitoba. The first goal was
to use a cost-benefit analysis to determine whether introducing HL and/or HLM would
pay for itself in terms of health system savings.
Although there were program costs in providing HL and HLM, both interventions
generated net health system savings through reduced utilization. Differences in total costs
were not significant among groups, largely because the sample size was too small. If
either program were to be introduced for all eligible patients, the larger sample size
would likely demonstrate statistically significant cost reductions. Moreover, the per
capita costs of offering the program would fall if the overhead could be spread over a
greater number of patients. (There is no evidence that the program was operating at
capacity.)
There are, however, sometimes reasons to offer a program even if it does not pay
for itself. If patient health and satisfaction are improved, decision-makers might decide to
pay an additional cost for a new program. Cost-effectiveness analysis allows us to
compare the benefits patients derive from a program with the costs of offering the
program.
88
Our cost-effectiveness analysis was also limited by sample size. We measured
patient satisfaction with the Client Satisfaction Questionnaire, and found that patients in
all three groups were very satisfied with their treatment. There were no statistically
significant differences among groups. We used the SF-36, a generic Health-Related
Quality of Life survey, to measure subjective health. Patients receiving either of the two
interventions reported significantly better scores in physical functioning, physical pain,
emotional health and overall health utility compared to the control group. Using an
algorithm supplied by the University of Sheffield, we converted the SF-36 scores into
Quality-Adjusted Life Years (QALYs) and found that there were statistically significant
differences in QALYs generated by the three programs at the time of the first survey. A
standard cost-effectiveness calculation, taking into account only the program costs and
the significant QALY outcomes, demonstrated that the HL intervention could generate an
additional QALY for $26,486 and HLM could generate an additional QALY for $70,266.
The HL intervention falls well within the usual threshold of $50,000 that decision-makers
sometimes adopt.
Finally, I conducted a sensitivity analysis to take into account the uncertainty
associated with small samples sizes, and to try to generate advice helpful to decision-
makers. Sensitivity analysis does not add any additional information to the statistical
analysis already reported. It does, however, allow us to simulate outcomes to better
estimate the probability that an intervention will be cost-effective.
When we took into account the increased QALYs generated by both interventions
at all four survey points using mixed effects repeated measures models, and combined
apparent health system savings with program costs to generate a net cost, the analysis
89
suggests that both HL and HLM generate better outcomes at a lower cost than usual
treatment. These results are associated with a great deal of uncertainty because most of
the results we used in this part of the analysis were not statistically significant. That is,
we report the results of a modeling exercise based on our best information.
Assuming that a decision-maker would be interested in implementing only one of
the two interventions, our sensitivity analysis suggests that the best program to
implement depends on how much the decision-maker values reduced healthcare system
costs relative to improvements in subjective quality of life. Even though it costs more on
a per capita basis to offer HLM, health system savings more than offset this cost. The
more important a patient’s subjective quality of life becomes to the decision-maker, the
more cost-effective the HL strategy becomes.
This may seem odd. One would expect that reduced health system utilization would
be associated with better health outcomes, and all the evidence suggests that HLM
patients are receiving more appropriate care with lower overall costs. Yet, HL patients
report better subjective health outcomes. It may be that HLM focuses attention of patients
on their health to a greater extent than HL, which leads them to worry more about their
health. It might be possible to find out more about why patients react the way they do
through a qualitative study.
In any case, the decision about which program to implement belongs to the
decision-makers responsible for allocating the healthcare budget. Our evidence suggests
that either HL or HLM is better than usual care.
90
5.2 Study limitations and strengths
Like other studies, this study has its strengths and weaknesses. This study has four
main strengths:
o a key strength is that both cost and effects were compared. Patient quality of
life as the intervention effect was included to determine whether the patients
benefit from the intervention compared to the standard treatment. The QALYs
used in the cost-effective analysis are derived from a generic instrument, SF-36.
o secondly, this study was designed as an RCT, and results based on rigorous
RCT can provide a ‘gold standard’ to assess the impact of the Health Line
interventions.
o thirdly, this study introduced information on participants’ characteristics, study
perspective, and detailed medical and intervention costs.
o lastly, this study addressed uncertainty and used sensitivity analysis to assess its
validity.
The majority of the economic evaluation studies of telemedicine focused on cost
estimates alone; only a few studies investigated cost-effectiveness or cost-benefit,
especially for heart failure intervention. In this study, both costs and consequences of the
interventions are considered, making it easy for decision makers to compare different
programs and to make an evidence-based decision as to which is worth implementing
from a healthcare provider’s perspective.
There are four limitations in this study that should be taken into consideration when
using the findings.
91
o a small sample size that might not precisely reflect the outcome difference for the
target population, thus posing statistical challenges and limiting the scope of the
possible analysis;
o the long term outcomes, such as mortality prevention due to the Health Lines
intervention and the program sustainability, cannot be examined;
o complete emergency department data were not be included in the study since data
for Portage cannot be accurately captured using current administrative data files.
o Indirect costs such as travel cost to healthcare facilities, losses of productivity,
leisure time and absenteeism from work and premature death were not estimated;
therefore, the total societal cost due to congestive heart failure disease was
excluded. However, this might imply that telehealth intervention can generate
more economic benefits for both the healthcare system and congestive heart
failure patients than this study suggests.
Despite these limitations, this study provided some evidence of cost patterns and
short-term intervention outcomes in order to help decision-makers to allocate resources
efficiently.
92
Chapter 6
Conclusions
6.1 Conclusion
This study provides evidence that both Health Lines interventions are preferable to
the standard care. The findings add to the growing body of evidence that telehealth for
congestive heart failure patients have positive effects on outcomes. Moreover, our study
suggests that either both interventions would very probably pay for itself in terms of
reduced healthcare costs once patient volume is increased. Even at low patient volume,
however, it appears that both HL and HLM hold great promise in terms of saving cost for
the healthcare system and improving health outcome for patients with congestive heart
failure.
Each of the interventions, however, is unique. HLM has its strongest impact on
health system utilization averted. Even at low patient volumes, it comes very close to
showing a statistically significant reduction in net costs for the healthcare system. It has,
however, little impact on perceived well-being among patients relative to usual care. HL,
by contrast, increases health scores for patients. They perceive and report themselves to
be healthier than do their counterparts receiving usual care or the HLM intervention.
Unfortunately, this perceived improvement in health does not translate into reduced
utilization of the healthcare system. HL produces better outcome, but it does not reduce
net costs relative to usual care.
This creates a bit of a challenge for healthcare decision-makers. Either intervention
would appear to be better than usual care, but which one should be adopted? If the
93
decision-makers want to improve the patient’s health outcome, then HL is optimal. If the
decision-makers consider only the cost saving for the healthcare system, then HLM is the
optimal strategy to be implemented. If a decision has to be made about which of the two
interventions should be provided for the patients in question, the CEAC offers useful
information about the probability that the intervention is cost-effective, given a decision-
maker’s willingness to pay for perceived improvements in health. Our results allow us to
go beyond standard statistical concerns about significance levels. Taking into account the
joint uncertainty surrounding all the parameters in the model, the CEAC allows a
decision to be made based on the best available information. It does not yield an
automatic conclusion about which intervention is optimal; rather, it recognizes that the
decision will be based on administrative and political decisions about the appropriate
amount to spend to improve patient well-being. Trade-offs between the desires of patients
and the net cost of providing services are an unavoidable part of healthcare decision-
making.
While standard statistical concerns might lead us to be cautious about
recommending an intervention when our results do not meet a 5% level of significance,
this caution seems misplaced in this case. There is very good circumstantial evidence that
either intervention is preferable to usual care. Moreover, the total amount of money for
the intervention program is not substantial. In the worst case, the program would have
little effect on either costs or outcomes; in the best, patient health would benefit at lower
net cost to the system. Therefore, it seems reasonable to continue the program, and
monitor data on costs and outcomes to see if it is as effective as our study suggests it
might be.
94
On the basis of these findings, this study will guide healthcare providers and policy
makers who are responsible for integrating telehealth into chronic disease management,
funding telehealth programs, and creating policies that encourage the use of
communication technology to support healthcare services and improve the quality of care.
This information is critical for moving telehealth from its current limited use for a few
chronic disease interventions to become an integral component of the healthcare delivery
system in Manitoba.
6.2 Further directions
This study does suggest some considerations that should guide future economic
evaluations of telehealth, or indeed other economic evaluation to be “piggy-backed” on
clinical trials. Long observation periods are recommended to investigate the long term
economic impact on the healthcare system. Such investigations should include
measures of overall costs from both the healthcare provider’s perspective and patients’
perspectives. A societal perspective is optimal. Future prospective research should:
• consider that sample size calculation before the study should be determined not
only on the basis of clinical endpoints of the trial, but also on economic
endpoints (Briggs & Tambour, 1998) in order to have an appropriate sample
size to detect significance from the economic evaluation. Costs are always
heavily skewed and outliers common. Sample size calculations must take into
account, in addition to all the ordinary factors that govern power calculations,
the covariance between cost and outcome. It is likely that sample size for
economic evaluation will exceed that for clinical analysis.
95
• collect long term intervention and healthcare service cost and outcome data to
evaluate the long term sustainability of the intervention.
• include costs from the patient’s perspectives such as productivity loss,
absenteeism from work and extra travel cost to the health facilities due to the
disease in order to have a broader economic view of the cost-effectiveness of
the new technology.
96
References American Telemedicine Association. (2011). Telemedicine defined. Retrieved 02/21,
2011, from http://www.americantelemed.org/i4a/pages/index.cfm?pageid=3333
Aoki, N., Dunn, K., Fukui, K., Beck, J., Schull, W., Li, H. (2004). Cost-effectiveness analysis of telemedicine to evaluate diabetic retinopathy in a prison population. Diabetes Care, 27(5), 1095-101.
Artinian N, Harden J, Kronenberg M, Vander Wal J, Daher E, Stephens Q, et al. (2003). Pilot study of a web-based compliance monitoring device for patients with congestive heart failure. Heart & Lung, 32(4), 226-33.
Artinian N, Magnan M, Sloan M, Lange M. (2002). Self-care behaviors among patients with heart failure. Heart & Lung, 31(3), 161-72.
Attkisson C, & Zwick R. (1982). The client satisfaction questionnaire. psychometric properties and correlations with service utilization and psychotherapy outcomes. Evaluation and Program Planning, 5, 233-37.
Barlow, J., Singh, D., Bayer, S., & Curry, R. (2007). A systematic review of the benefits of home telecare for frail elderly people and those with long-term conditions. J Telemed Telecare, 13(4), 172-9.
Barnett, T. E., Chumbler, N. R., Vogle, W. B., Beyth, R. J., Ryan, P., & Figueroa, S. (2007). The cost-utility of a care coordination/home telehealth programme for veterans with diabetes. wJournal of Telemedicine and Telecare, 13, 318-321.
Bergmo, T. S. (2009). Can economic evaluation in telemedicine be trusted? A systematic review of the literature. Cost Effectiveness and Resource Allocation, 7, 18.
Bergmo, T. S. (2010). Economic evaluation in telemedicine-still room for improvement. J Telemed Telecare, 16, 229-231.
Black, W. C. (1990). The CE plane: A graphic representation of cost-effectiveness. Medical Decision Making, 10, 212-14.
Brazier, J., Deverill, M., Green, C. (1999). A review of the use of health status measures in economic evaluation. Health Technol Assess, 3(9), 1-164.
97
Brazier, J., Roberts, J., Deverill, M. (2002). The estimation of a preference-based measure of health from the SF-36. J Health Econ, 21, 271-292.
Brigg, A. H., Wonderling, D. E., & Mooney, C. Z. (1997). Pulling cost-effectiveness analysis up by its bootstraps: A non-parametric approach to confidence interval estimation. Health Econ, 6, 327-40.
Briggs, A., & Tambour, M. (1998). The design and analysis of stochastic cost-effectiveness studies for the evaluation of health care intervention. Unpublished manuscript.
Burke, L.E., Dunbar-Jacob, J. M., & Hill, M. N. (1997). Compliance with cardiovascular disease prevention strategies: A review of the research. Ann Behav Med, 19(3), 239-63.
Canadian Agency for Drugs and Technologies in Health. (2008). Home telehealth programs in Canada. Ottawa: Canadian Agency for Drugs and Technologies in Health.
Canadian Cancer Society. (2010). Canadian cancer statistics. Toronto: Canadian Cancer Society.
Clark, R.A., Inglis, S.C., McAlister, F.A., Cleland, J.G., & Stewart, S. (2007). Telemonitoring or structured telephone support programmes for patients with chronic heart failure: Systematic review and meta-analysis. BMJ, 334, 942.
Clarke, M., Shah, A., & Sharma, U. (2011). Systematic review of studies on telemonitoring of patients with congestive heart failure: A meta-analysis. J Telemed Telecare, 17, 7-14.
Dávalos, M. E., French, M. T., Burdick, A. E., & Simmons, S. C. (2009). Economic evaluation of telemedicine: Review of the literature and research guidelines for benefit-cost analysis. Telemed J E Health, 15(10), 933-948.
Dawson, H., & Zinck, G. (2009). ED spending in Canada: A focus on the cost of patients waiting for access to an in-patient bed in Ontario. Healthcare Quarterly, 12(1), 25-28.
Drummond, M. F., Sculpher, M. J., Torrance, G. W., O'Brien, B. J., & Stoddart, G. L. (2005). Methods for the economic evaluation of health care programmes. (Third ed.). New York: Oxford University Press Inc.
98
Glanz, K., Rimer, B.K., & Viswanath, K. (2002). Health behavior and health education. (Fourth edition ed.). San Francisco: Jossey-Bass.
Gledhill, J., Wheeler, K., Christine, A., & Ryan, J. Telehealth a review of the evidence. UK: Turnshall Healthcare Group.
Grosse, S. D. (2008). Assessing cost-effectiveness in healthcare: History of the $50000 per QALY threshold. Expert View of Pharmacoecon Outcomes Res, 8, 165-78.
Health Canada. (2002). Economic burden of illness in Canada, 1998. Ottawa: Health Canada.
Health Canada. (2004). What are chronic and non-communicable diseases? Retrieved 03/10, 2010, from http://www.hc-sc.gc.ca/pphb-dgspsp/ccdpc-cpcmc/topics/chronic_disease.
Heart & Stroke Foundation of Manitoba. (2010). Statistics. Retrieved 03/12, 2010, from http://www.heartandstroke.mb.ca/site/c.lgLSIVOyGpF/b.3661109/k.34F4/Statistics.htm. Winnipeg.
Heart and Stroke Foundation of Canada. (2003). The growing burden of heart disease and stoke in Canada. Ottawa: Heart and Stoke Foundation of Canada.
Hochbaum, G. M. (1958). Public participation in medical screening programs: A socio-psychological study. Washington D. C.: U.S. Dept of Health, Education, and Welfare.
Inglis, S., C., Clark, R., A., McAlister, F., A., Ball, J., Lewinter, C., Cullington, D., Stewart, S., & Cleland, G. (2010). Structured telephone support or telemonitoring programmes for patients with chronic heart failure. Cochrane Database Syst Rev., 4(8), CD007228.
Izquierdo, R. E., Kearns, J., Knudson, P. E., Ploutz-Snyder, R., Meyer, S., & Weinstock, R. S. (2003). A comparison of diabetes education administered through telemedicine versus in person. Diabetes Care, 26(4), 1002-7.
Jaarsma, T., Halfens, R., Abu-Saad, H., Dracup, K., Gorgels T., van Ree J., et al. (1999). Effects of education and support on self-care and resource utilization in patients with heart failure. Eur Heart J, 20(9), 673-82.
Jennett, P. A., Hall, L. A., Hailey, D., Ohinmaa, A., Anderson, C., Thomas, R., et al. (2003). The socio-economic impact of telehealth: A systematic review. J Telemed Telecare, 9, 311-20.
Katz, A., & Doupe, M. (2009). Preliminary report of research findings from the chronic disease management of congestive heart failure through health lines initiative. Unpublished manuscript.
Kennedy, C., & Yollowless, P. (2000). A community-based approach to evaluation of health outcomes and costs for telepsychiatry in a rural population: Preliminary results. J Telemed Telecare, 6, 155-157.
Kostuk, W. J. (2001). Congestive heart failure: What can we offer our patients? CMAJ, 165, 1053-5.
Manuel, D. G., Schultz, S. E., & Kopec, J. A. (2002). Measuring the health burden of chronic disease and injury using health adjusted life expectancy and the health utilities index. J Epidemiol Community Health, 56, 843-850.
Martínez, M., Villarroel, V., Puig-Junoy, J., Seoane, J., & del Pozo, F. (2007). An economic analysis of the EHAS telemedicine system in Alto Amazonas. J Telemed Telecare, 13, 7-14.
Mclntosh, E., & Cairns, J. (1997). A framework for the economic evaluation of telemedicine. J Telemed Telecare, 3, 132-9.
Moehr, J. R. (2003). BC telehealth program final evaluation report. Victoria, Canada.: University of Victoria.
Noel, H. D., Vogel, D. C., Erdos, J. J., Cornwall, D., & Levin, F. (2004). Home telehealth reduces healthcare costs. Telemed J E Health, 10, 170-183.
Ontario Ministry of Health and Long-term Care. (2008). Telehealth Ontario. Retrieved 03/15, 2011, from http://www.health.gov.on.ca/en/public/programs/telehealth/tele_faq.aspx
Orem, D. (1991). Nursing concepts of practice (6th Ed ed.). St. Louis: Mosby.
100
Paget, T., Jones, C., Davies, M., Evered, C., & Lewis, C. (2010). Using home telehealth to empower patients to monitor and manage long term conditions. Nurs Times, 106(45), 17-9.
Patra, J., Popova, S., Rehm, J., Bondy, S., Flint, R., & Giesbrecht, N. (2007). Economic cost of chronic disease in Canada 1995-2003Ontario Chronic Disease Prevention Alliance and the Ontario Public Health Association.
Piette, J. (2005). Using telephone support to manage chronic disease. Oakland: California HealthCare Foundation.
Po, Y. M. (2000). Telemedicine to improve patients' self-efficacy in managing diabetes. J Telemed Telecare, 6, 263-7.
Polisena, J., Coyle, D., Coyle, K., & McGill, S. (2009). Home telehealth for chronic disease management: A systematic review and an analysis of economic evaluation. Int J Technol AssessHealth Care, 25, 339-49.
Polisena, J., Tran, K., Cimon, K., Hutton, B. McGill, S., Palmer, K., & Scott, R., E. (2010). Home telemonitoring for congestive heart failure: A systematic review and meta-analysis. J Telemed Telecare, 16, 68-76.
Priyan, S. (2009). Increasing scope of telehealth markets in Europe-A concise analysis. Retrieved Feb/05, 2011, from http://www.frost.com/prod/servlet/market-insight-top.pag?docid=168892280
Public Health Agency of Canada. (2009). Tracking heart disease and stroke in Canada. Ottawa.: Public Health Agency of Canada.
Pyne, J. M., Fortney, J. C., Tripathi, S. P., Maciejewski, M. L., Edlund, M. J., & Williams, D. K. (2010). Cost-effectiveness analysis of a rural telemedicine collaborative care intervention for depression. Arch Gen Psychiatry, 67(8), 812-821.
Raatikainen, M. J., Uusimaa, P., van Ginneken, M. M., Janssen, J. P., & Linnaluoto, M. (2008). Remote monitoring of implantable cardioverter defibrillator patients: a safe, time-saving, and cost-effective means for follow-up. Europace, 10(10), 1145-51.
Reardon, T. (2005). Research findings and strategies for assessing telemedicine costs. Telemed J E Health., 11, 348-69.
101
Rector T, & Cohn J. (1992). Assessment of patient outcome with the Minnesota Living with Heart Failure questionnaire: reliability and validity during a randomized, double-blind, placebo-controlled trial of pimobendan. Am Heart J, 124(4), 1017-25.
Scalvini, S., Capomolla, S., Zanelli, E., Benigno, M., Domenighini, D., Paletta, L., et al. (2005). Effect of home-based telecardiology on chronic heart failure: Costs and outcomes. J Telemed Telecare, Suppl 1, 16-8.
Schaafsma, J., Pantazi, S. V., Moehr, J.R., Anglin, C. R., & Grimm, N. A. (2007). An economic evaluation of a telehealth network in British Columbia. J Telemed Telecare, 13, 251-6.
Schmidt, S., Schuchert, A., Krieg, T., & Oeff, M. (2010). Home telemonitoring in patients with chronic heart failure: a change to improve patient care? Dtsch Arztebl Int, 107(8), 131-8.
Seto, E. (2008). Cost comparison between telemonitoring and usual care of heart failure: A systematic review. Telemed J E Heart, 14(7), 679-86.
Shea, S., IDEATel Consortium. (2007). The informatics for diabetes and education telemedicine (IDEATel) project. Trans AM Clin Climatol Assoc, 118, 289-304.
Siegel, J. E., Weinstein, M. C., Russell, L. B., & Gold, M. R. (1996). Recommendations for reporting cost-effectiveness analyses. Panel on cost-effectiveness in health and medicine. JAMA, 276(16), 1339-41.
Slater, M. R., Phillips, D. M., & Woodard, E. K. (2008). Cost-effective care a phone call away: A nurse-managed telephonic program for patients with chronic heart failure. Nurs Econ, 26(1), 41-4.
Smith, B., Hughes-Cromwick, P. F., Forkner, E., & Galbreath, A. D. (2008). Cost-effectiveness of telephonic disease management in heart failure. Am J Manag Care., 14(2), 106-15.
Stroetmann, K. A., Robinson, L. K. S., Stroetmann, K. C., & McDaid, D. (2010). How can telehealth help in the provision of integrated care? Copenhagen, Denmark: World Health Organization.
Suter, P., Suter, W. N., & Johnston, D. (2011). Theory-based telehealth and patient empowerment. Popul Health Manag, 14(2), 87-92.
102
Tran, K., Polisena, J., Coyle, D., Coyle, K., Kluge E-H, W., Cimon, K, McGill, S., Noorani, H., Palmer, K., & Scott, R. (2008). Home telehealth for chronic diseases management. No. Technology report number 113). Ottawa: Canadian Agency for Drugs and Technologies in Health.
Verhoeven, F., van Gemert-Pijnen, L., Dijkstra, K., Nijland, N., Seydel, E., & Steehouder, M. (2007). The contribution of teleconsultation and videoconferencing to diabetes care: A systematic literature review. J Med Internet Res, 9(5), e37.
Vontetsianos, T., Giovas, P., Katsaras, T., Rigopoulou, A., Mpirmpa, G., Giaboudakis, P., Koyrelea, S., Kontopyrqias, G. & Tsoulkas, B. (2005). Telemedicine-assisted home support for patients with advanced chronic obstructive pulmonary disease: Preliminary results after nine-month follow-up. J Telemed Telecare, 11, 86-8.
Wade, V. A., Karnon, J., Elshaug, A. G., & Hiller, J. E. (2010). A systematic review of economic analyses of telehealth services using real time video communication. BMC Health Serv Res., 10, 233.
Wakefield, B.J., Holman, J. E., Ray, A., Scherubel, M., Burns, T. L., Kienzle, M. G., & Rosenthal, G. E. (2009). Outcomes of a home telehealth intervention for patients with heart failure. J Telemed Telecare, 15(1), 46-50.
Ware, J. E., Jr, & Sherbourne, C. D. (1992). The MOS 36-item short-form health survey (SF-36). I. conceptual framework and item selection. Med Care, 30(6), 473-83.
Whitten, P., & Mickus, M. (2007). Home telecare for COPD/CHF patients: Outcomes and perceptions. J Telemed Telecare, 13, 69-73.
Willems, D. C., Joore, M. A., Hendriks, J. J., Wouters, E. F., & Severens, J. L. (2007). Cost-effectiveness of a nurse-led telemonitoring intervention based on peak expiratory flow measurements in asthmatics: Results of a randomised controlled trial. Cost Eff Resour Alloc, 5, 10.
Wooden, A. K., Sherrard, H., Fraser, M., Stuewe, L., Cheung, T., & Struthers, C. (2008). Telehome monitoring in patients with cardiac disease who are at high risk of readmission. Heart Lung, 37(1), 36-45.
World Health Organization. (2005). Preventing chronic diseases: A vital investment. facing the facts: The impact of chronic disease in Canada. Geneva: World Health Organization.
103
World Health Organization. (2011). Chronic diseases and health promotion. Retrieved Feb/02, 2011, from http://www.who.int/chp/en/
104
Appendix A Tables and charts Table 20: Counts of healthcare uses by type for each three-month period of the study intervention for CONTROL group
Type Overall Baseline 0-3 months
4-6 months
7-9 months
10-12 months
Visits for all reasons Family physician
1,030 252 251 199 153 175
Specialist
589 190 176 94 69 60
Cardiac specialist
154 44 50 20 25 15
Internist
337 110 117 49 35 26
Hospital separation
43 10 11 9 7 6
Hospital length of stay
514 118 103 50 21 222
Hospital in-patient days
625 121 141 197 111 56
Emergency department visit
45 24 12 N/A 4 5
Visits related to CHF Family physician
122 29 31 25 19 18
Specialist
44 17 17 7 2 1
Cardiac specialist
14 4 5 2 2 1
Internist
44 17 17 7 2 1
Hospital separation
0 0 0 0 0 0
Hospital length of stay
0 0 0 0 0 0
Hospital in-patient days
0 0 0 0 0 0
Emergency department visit
N/A N/A N/A N/A N/A N/A
105
Table 21: Counts of healthcare uses by type for each three-month period of the study intervention for HL group
Type Overall Baseline 0-3
months 4-6
months 7-9
months 10-12
months Visits for all reasons
Family physician 923 212 265 168 145 133
Specialist
547 166 173 114 69 52
Cardiac specialist
106 37 36 14 13 6
Internist
305 98 105 52 31 19
Hospital separation
44 5 17 8 6 8
Hospital length of stay
326 47 114 45 58 62
Hospital in-patient days
326 57 104 62 46 57
Emergency department visit
37 11 14 N/A 7 5
Visits related to CHF Family physician
210 67 66 31 24 22
Specialist
20 13 5 0 2 0
Cardiac specialist
9 5 4 0 0 0
Internist
18 13 5 0 0 0
Hospital separation
1 0 1 0 0 0
Hospital length of stay
7 0 7 0 0 0
Hospital in-patient days
7 0 7 0 0 0
Emergency department visit
N/A N/A N/A N/A N/A N/A
106
Table 22: Counts of healthcare uses by type for each three-month period of the study intervention for HLM group
Type Overall Baseline 0-3
months 4-6
months 7-9
months 10-12
months Visits for all reasons
Family physician
796 253 216 147 96 84
Specialist
488 177 109 96 59 47
Cardiac specialist
49 26 9 6 5 3
Internist
251 110 43 54 22 22
Hospital separation
23 5 7 5 3 3
Hospital length of stay
187 35 62 50 24 16
Hospital in-patient days
269 50 107 72 24 16
Emergency department visit
40 12 11 N/A 7 0
Visits related to CHF Family physician
165 54 39 37 18 17
Specialist
22 14 1 4 2 1
Cardiac specialist
11 5 1 2 2 1
Internist
21 14 1 3 2 1
Hospital separation
4 1 1 1 0 1
Hospital length of stay
34 1 19 10 0 4
Hospital in-patient days
106 18 64 20 0 4
Emergency department visit
N/A N/A N/A N/A N/A N/A
107
Table 23: Mean (SD) cost of healthcare utilization for each 90-day period of the study intervention