Bernard Baumohl Chief Global Economist www.EconomicOutlookGroup.com The Economic & Geopolitical Outlook: What Are the Risks and Opportunities Ahead? 82 nd ACIL Annual Meeting October 10, 2019
Transcript
Bernard BaumohlChief Global Economist
www.EconomicOutlookGroup.com
The Economic & Geopolitical Outlook:What Are the Risks and Opportunities Ahead?
82nd ACIL Annual MeetingOctober 10, 2019
We are at a “Pivotal Moment” in US Economic History!
The economy is well into its 11th straight year of growth, the longest stretch ever!
The fundamentals still look very good: • Unemployment rate (3.7%). Tightest labor market in 50 years!
• Wages have been edging higher and consumers are spending.
• Inflation remains dormant! • Borrowing costs are among the lowest ever seen.
• There’s ample capital looking for investments. • Technological innovations continue to transform the fabric of our economy and society.
But worries of recession are becoming more prevalent. Is this business cycle about to peak?
The Economic Outlook Group
Three most common causes of past recessions
1. High “real” interest rates. It shuts down borrowing and spending; delinquencies surge. (1953- 1954, 1957 - 1958, 1969 - 1970, 1981 - 1982)
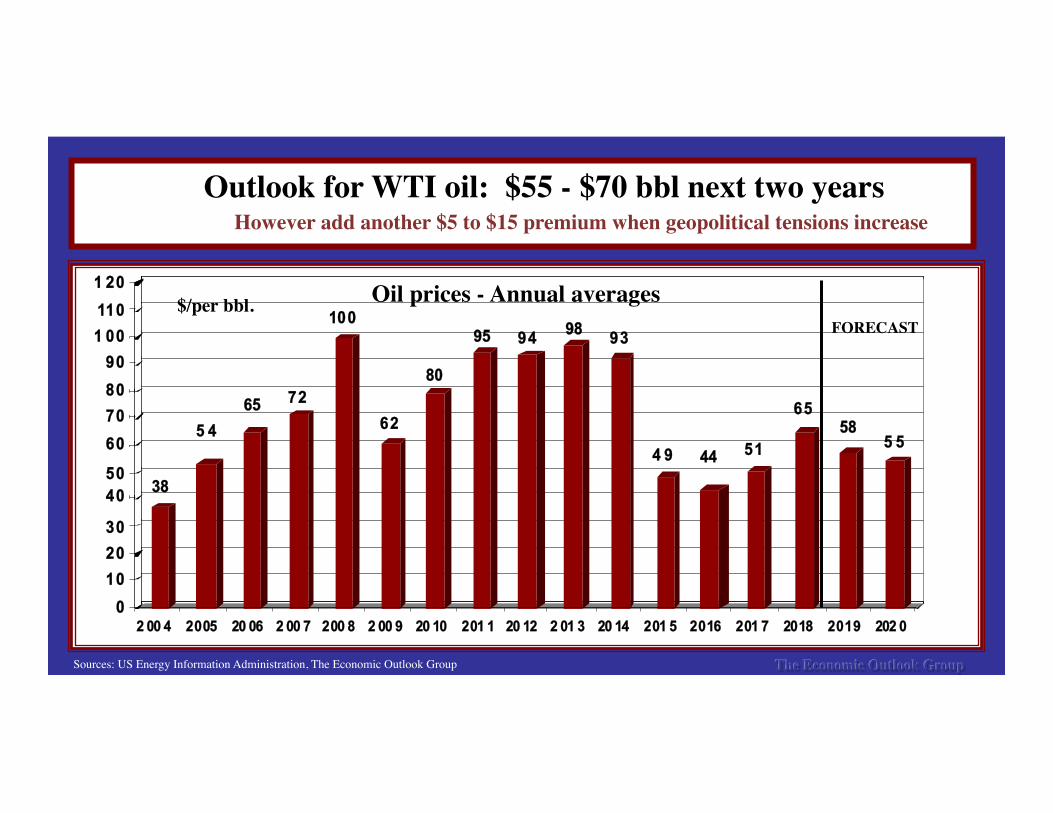
2. A major geopolitical eruption that causes oil prices to spike. Sharply higher energy costs can bring economic activity to a screeching halt. (1973-1975, 1980)
3. Acts of human folly; Self-inflicted economic wounds. (2001, 2008 - 2009, …2020 ?)
The Economic Outlook Group
• A trade war with China that spirals out of control. The world economy is in danger of shutting down as
global exports shrinks and countries devalue currencies.
• Federal Reserve can not bail out this economy with lower rates! Monetary policy is being held hostage to
geopolitical events. Nor is there room for more fiscal stimulus, given $1 trillion deficits.
• Geopolitical threats are flashing “RED.” (Iran, North Korea, South China Sea, Hong Kong,
Venezuela, India/Pakistan, Brexit ) • Threat of extreme political warfare as the 2020 presidential campaign ramps up. A highly polarized political climate may depress consumer and business spending.
What could puncture this economy?
The Economic Outlook Group
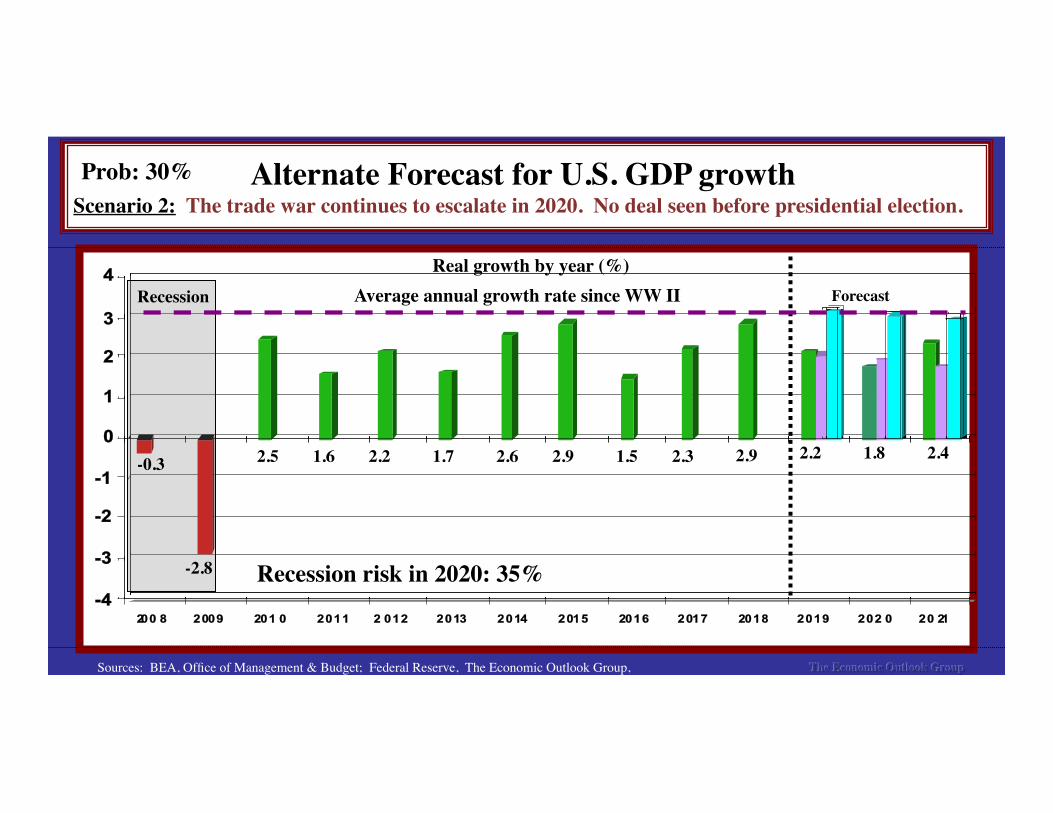
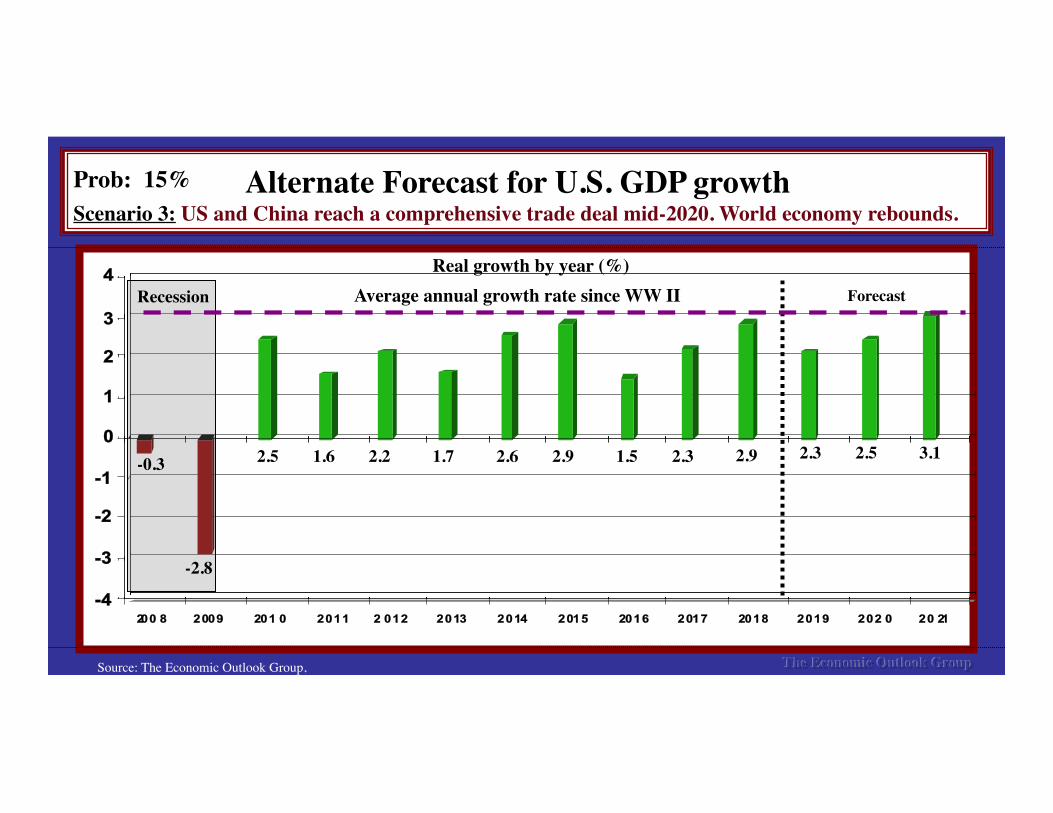
Main Forecast for U.S. GDP growth Scenario 1: US & China reach interim deal by 2020. Some rollback in tariffs. Talks continue.
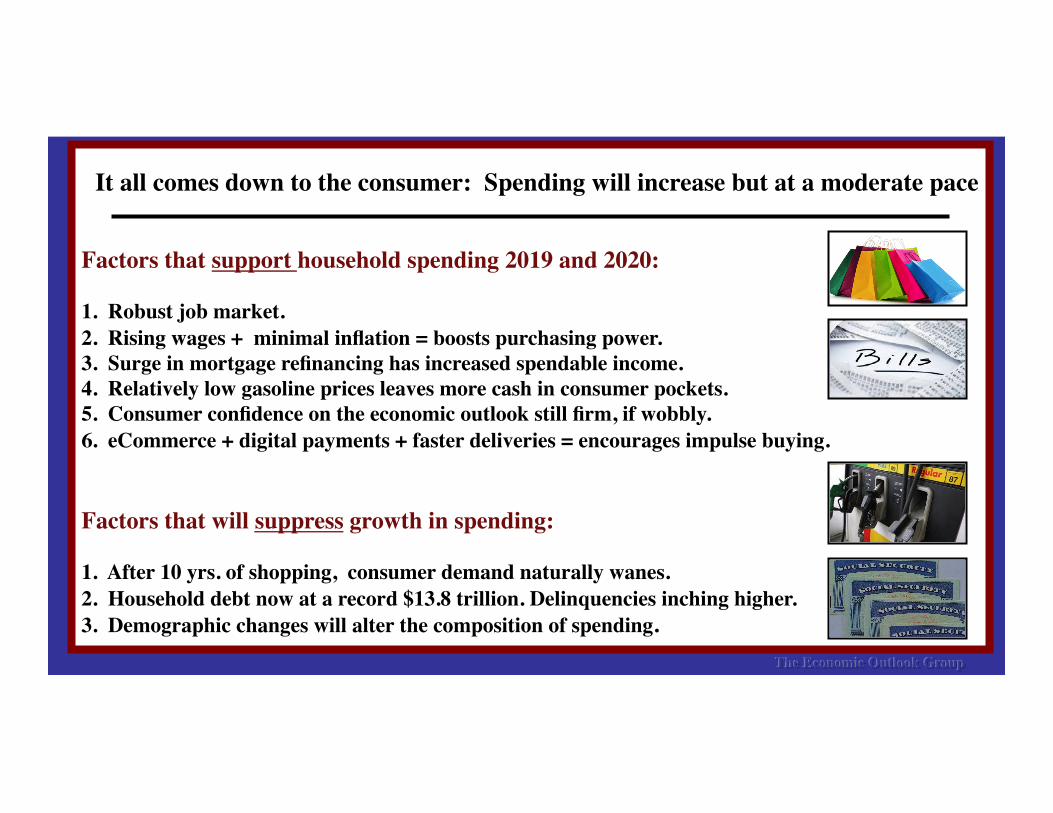
Factors that support household spending 2019 and 2020: 1. Robust job market. 2. Rising wages + minimal inflation = boosts purchasing power. 3. Surge in mortgage refinancing has increased spendable income. 4. Relatively low gasoline prices leaves more cash in consumer pockets. 5. Consumer confidence on the economic outlook still firm, if wobbly. 6. eCommerce + digital payments + faster deliveries = encourages impulse buying.
Factors that will suppress growth in spending:
1. After 10 yrs. of shopping, consumer demand naturally wanes. 2. Household debt now at a record $13.8 trillion. Delinquencies inching higher. 3. Demographic changes will alter the composition of spending.
The Economic Outlook Group
It all comes down to the consumer: Spending will increase but at a moderate pace
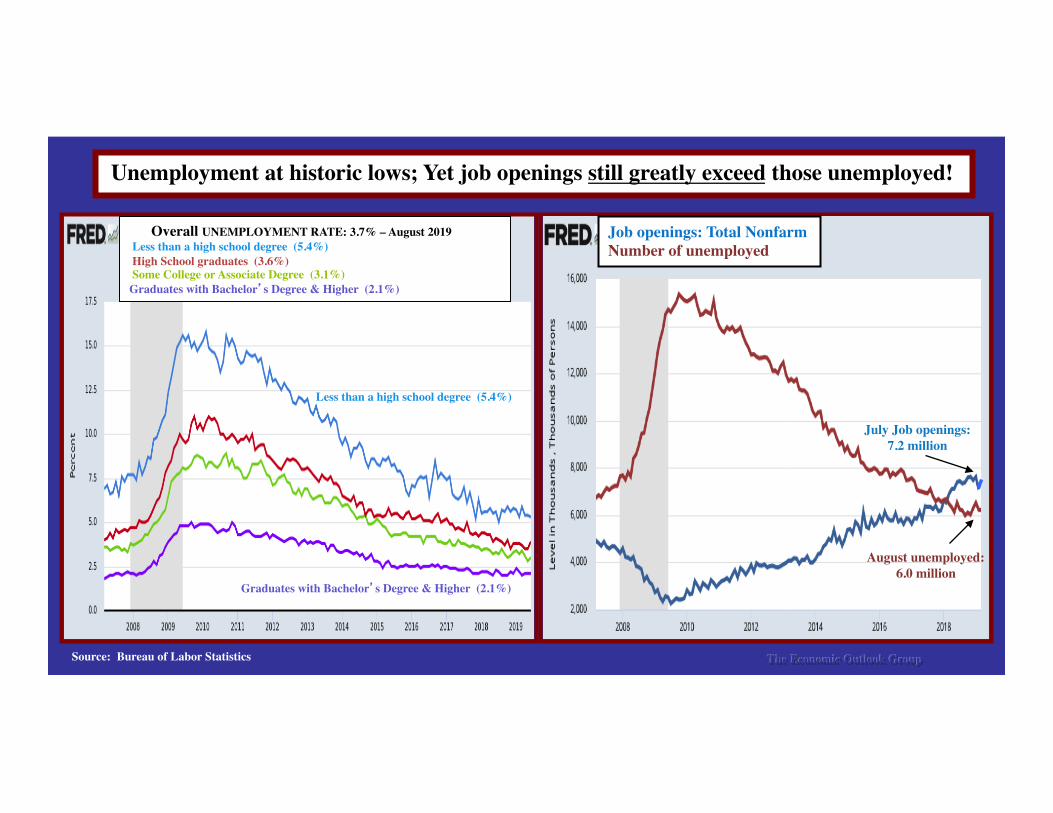
Unemployment at historic lows; Yet job openings still greatly exceed those unemployed!
The Economic Outlook GroupSource: Bureau of Labor Statistics
Job Openings - January 2019 = 7.6 million
Less than a high school degree (5.4%)
Graduates with Bachelor’s Degree & Higher (2.1%)
Job openings: Total NonfarmNumber of unemployed
August unemployed: 6.0 million
July Job openings: 7.2 million
Overall UNEMPLOYMENT RATE: 3.7% – August 2019 Less than a high school degree (5.4%) High School graduates (3.6%) Some College or Associate Degree (3.1%)Graduates with Bachelor’s Degree & Higher (2.1%)
Factors depressing inflation• eCommerce • Globalization• Stronger dollar• Improved productivity• Changing demographics• Low interest rates• Moderate energy prices• Decline in union membership
Historic tug-of-war over inflation: eCommerce is the greatest deflationary force in modern economic history
Companies are scaling back investments. Hard to deploy capital when there are so many economic and geopolitical uncertainties
The Economic Outlook Group
-- Evidence mounts of recession in manufacturing. Is a full-blown economic recession next? -- Trade tensions slash global trade and cause havoc with international supply chains. -- Corporate profits are under pressure due to rising labor costs, tariffs and limited pricing power.-- Passage of the USMCA stalled in Congress. US election politics may jeopardize US ratification. -- How will the outcome of 2020 presidential election impact trade, tax and spending policies?
46
48
50
52
54
56
58
60
62
64
66
J F M A M J J A S O N D J F M A M J J A S
2018 2019
ISM: New Orders - Manufacturing
48
50
52
54
56
58
60
62
64
66
J F M A M J J A S O N D J F M A M J J A
ISM: New Orders - Non-Manufacturing (Services)
2018 2019
Above “50” indicates new order are expandingBelow “50” indicates new orders are contracting
Source: Institute for Supply Management The Economic Outlook Group
Decrepit infrastructure holds back economic growth: But money and politics often gets in the way of much-needed repairs.
Sources: American Society of Civil Engineers, American Water Works Association, Center for Neighborhood Technology The Economic Outlook Group
EXAMPLES: • Philadelphia still relies on underground pipes installed before the Civil War.• 84,000 bridges considered functionally obsolete.• 58,000 bridges deemed “structurally deficient,” yet still carry 180 million cars a day!
• There are more than 650 water main breaks a day on average in the US; 240,000 a year.• Leakages and spills waste an average of 5.8 billion gallons of water each day!
US - China trade war: A game theory gone wrong! Trump and Xi have blundered into a minefield of tariffs, retaliation and other provocations.
Both feel pressure to demonstrate toughness to their constituents.
The Economic Outlook Group
US goals: 1. Slash the US trade deficit with China2. Get China to codify a new trading relationship with the US.
• Protect US intellectual property. • End forced joint ventures & transfer of proprietary technology.• Stop exports of counterfeit goods.• End its cyber warfare against US firms & military.• Seek strong measures to monitor and enforce future trade agreements.
3. Keep the US ahead of China in the technology race. ––––––––––––––––––––––––––––––––––––––––––––––––China’s goals: Maintain domestic economic & political stability at all costs!• Avoid formalizing trade reforms into law; emphasize agreements as memorandum of understandings.• Seek immediate rollback of all punitive US tariffs once a deal is made. • Otherwise stall, bob & weave and offer minimal concessions until after US elections.
-12.5%
10.0%
11.3%
20.0%
33.1%
-15% -5% 5% 15% 25% 35% 45%
China
India
South Korea
Taiwan
Vietnam
To avoid paying higher tariffs on goods from China, US firms have imported more from other suppliers in Asia.
(% change in exports to the US 1st half 2019 vs. 1st half in 2018)
Source: US Commerce Department (Trade on C.I.F. Basis) The Economic Outlook Group
US vs. China: Who has the capacity to endure more economic and political pain?
1. Will there be sufficient political cohesion in the White House for a protracted trade war as we get closer to 2020 elections?
Tension is brewing in the WH between China hawks (Lighthizer and Navarro) and the pragmatists (Mnuchin and Kudlow). Who will have Trump’s support as the presidential race heats up?
2. Xi Jinping may be president “for life” but the Politburo is getting impatient. • Xi still needs to listen to both Communist Party hardliners AND those favoring market-oriented reforms. • Several of China’s top policymakers are US trained economists. (Liu He, Yi Gang)
• China celebrates the 70th anniversary of its founding in October. Symbolizes liberation from Western dominance. • Xi will closely monitor US polls in the 2020 presidential election. • Chinese leaders believe Trump’s criticism of the Federal Reserve reflects his fear the US economy is in trouble.
3. Do not underestimate China’s ability to withstand US pressure. • Weaponize the RMB vs. US dollar --or -- scale back net new purchases of US treasuries• Encourage local shadow banks to resume lending to private firms • Further slash RRR and other interest rates• Impose new red tape on US firms operating in China• Boycott purchases of US goods• Ignore US sanctions against North Korea and Iran• Slash tariffs on imported goods from US competitors
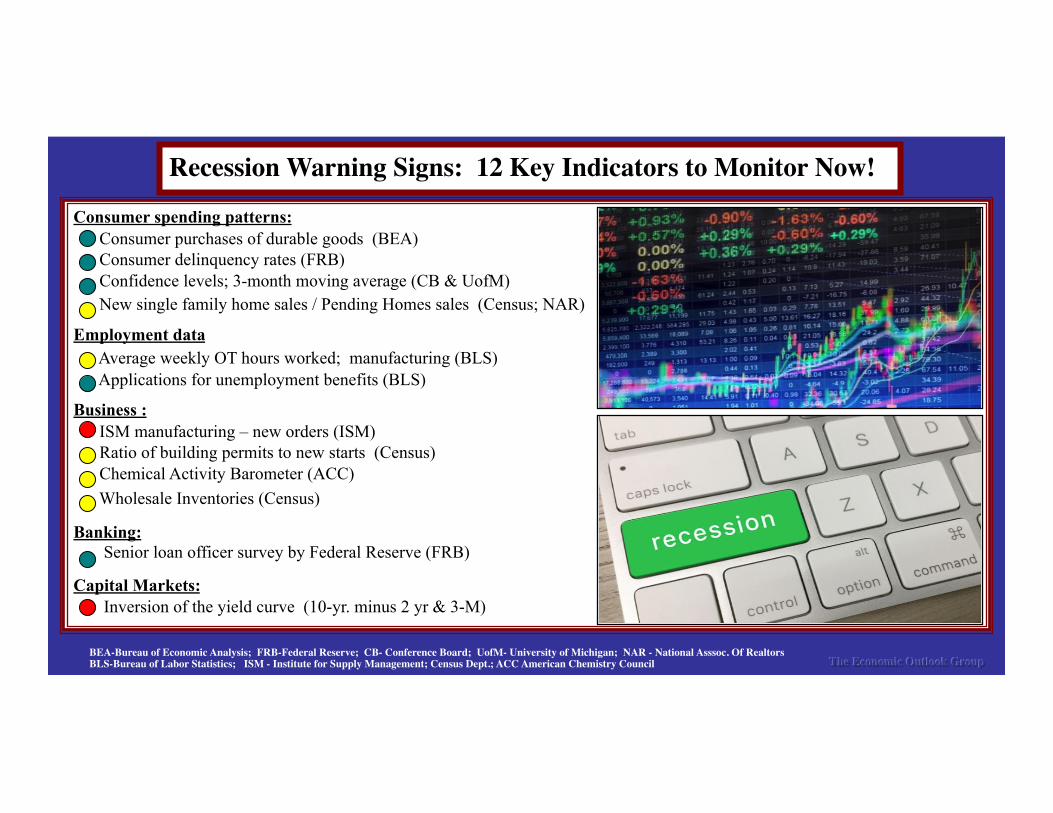
Consumer spending patterns: Consumer purchases of durable goods (BEA) Consumer delinquency rates (FRB) Confidence levels; 3-month moving average (CB & UofM) New single family home sales / Pending Homes sales (Census; NAR)
Employment data Average weekly OT hours worked; manufacturing (BLS) Applications for unemployment benefits (BLS) Business : ISM manufacturing – new orders (ISM) Ratio of building permits to new starts (Census) Chemical Activity Barometer (ACC) Wholesale Inventories (Census) Banking: Senior loan officer survey by Federal Reserve (FRB) Capital Markets: Inversion of the yield curve (10-yr. minus 2 yr & 3-M)
Recession Warning Signs: 12 Key Indicators to Monitor Now!
BEA-Bureau of Economic Analysis; FRB-Federal Reserve; CB- Conference Board; UofM- University of Michigan; NAR - National Asssoc. Of RealtorsBLS-Bureau of Labor Statistics; ISM - Institute for Supply Management; Census Dept.; ACC American Chemistry Council The Economic Outlook Group
Moderate: A full blown global trade and currency war triggers new financial crises • Trade talks w/China collapse; US threatens more tariffs on Europe, India, Vietnam. • Volume of world trade shrinks. Global wave of competitive currency devaluations.
HIGH: Exogenous shocks pose the greatest threat to the economy. (1) Foreign state launches cyber attack that paralyzes parts of the US economy.
(2) US and Chinese military confrontation: South China Sea, Hong Kong, Taiwan. (3) Saudi Arabia retaliates against Iran. Threat of full scale war looms. (4) Iran enriches uranium above 20%. Prompts US or Israel to strike back militarily. (5) India and Pakistan edge closer to nuclear war as tensions soar over Kashmir. (6) Venezuela: a major flashpoint between the U.S. and Russia.
The Economic Outlook Group
Biggest hazards on the radar screen
Risk Level
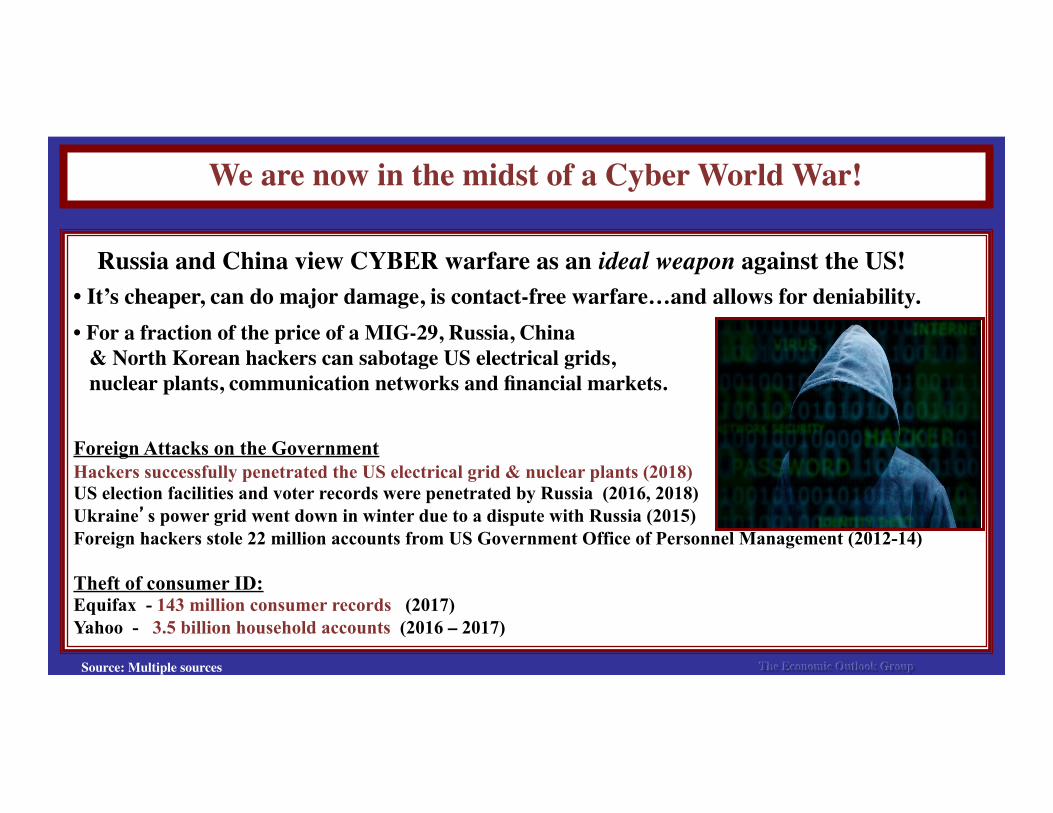
We are now in the midst of a Cyber World War!
The Economic Outlook Group
Russia and China view CYBER warfare as an ideal weapon against the US! • It’s cheaper, can do major damage, is contact-free warfare…and allows for deniability.• For a fraction of the price of a MIG-29, Russia, China & North Korean hackers can sabotage US electrical grids, nuclear plants, communication networks and financial markets. Foreign Attacks on the Government Hackers successfully penetrated the US electrical grid & nuclear plants (2018) US election facilities and voter records were penetrated by Russia (2016, 2018) Ukraine’s power grid went down in winter due to a dispute with Russia (2015) Foreign hackers stole 22 million accounts from US Government Office of Personnel Management (2012-14) For the first time in more than eight years, "our hotels' collective revenues per room fell last month," Cramer warned. "That's a sit-up-and-take notice figure from a segment of the economy that's been very strong," he said Theft of consumer ID: Equifax - 143 million consumer records (2017) Yahoo - 3.5 billion household accounts (2016 – 2017)
Source: Multiple sources
1. Companies should undertake “rigorous” stress tests to determine their greatest vulnerabilities. • Conduct “what if” scenarios: Introduce adverse hypothetical scenarios (e.g. systemic power failure or events that can disrupt operations, revenue flow, access to the internet & intranet and block credit lines.) • How to cope under such dire circumstances and remain both operational and profitable?
2. Consider cyber theft insurance, upgrade software, and finally hire firms to hack into your system. • Average time it takes a U.S. firm to identify a breach = 201 days • Average time it takes to contain the breach = 70 days
• Average cost of a single data breach = more than $4 million (Source: IBM)
3. Geopolitical threat anticipation: • Dedicate a risk management team to engage in geopolitical forecasting, especially where one has foreign exposure (e.g., customers, supply chain sources, key investors, real estate, banking relationships.)4. Customers demand reliability of service --- or they’ll walk! Be proactive. Focus on being agile. • Prepare in advance a governance plan that can be implemented quickly to mitigate any harmful fallout from an external shock. Your firm’s reputation is always at risk.
Exogenous shocks will become more common…and more consequential!How to prepare for such scenarios?
The Economic Outlook Group
Bernard Baumohl
Chief Global economist 475 Wall Street
Princeton, New Jersey (609) 529-1300
www.EconomicOutlookGroup.com
2017 2018 2019 2020 2021
Euro (in US dollars) 1.20 1.15 1.13 1.18 1.19
Japanese yen 113 111 109 111 114
UK pound (in US dollars) 1.35 1.27 1.21 1.29 1.42
Canadian dollar 1.25 1.36 1.33 1.30 1.26
Chinese yuan 6.51 6.88 7.01 7.04 6.96
Brazil’s real 3.31 3.87 4.10 4.11 4.12
Mexican pesos 19.79 19.68 20.10 20.50 19.85
Key Foreign Exchange Rates (per U.S. dollar, year-end level)
The Economic Outlook Group
US Dollar strengthens US Dollar weakens
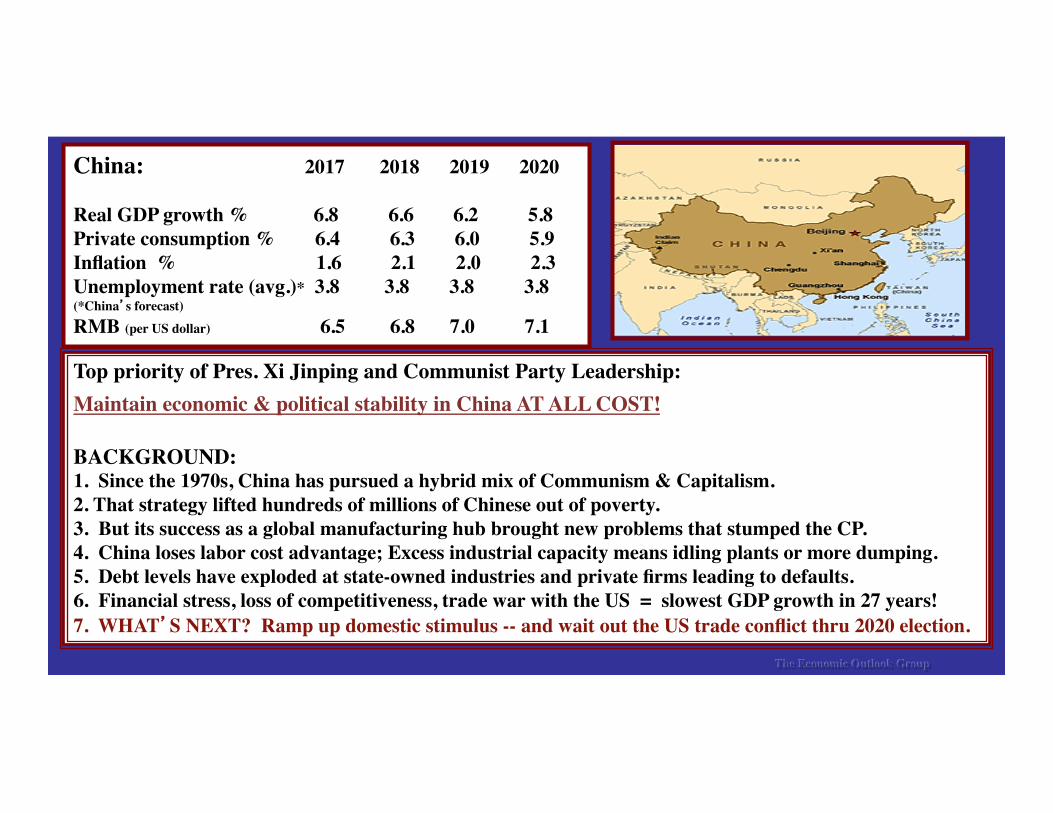
Top priority of Pres. Xi Jinping and Communist Party Leadership: Maintain economic & political stability in China AT ALL COST!
BACKGROUND: 1. Since the 1970s, China has pursued a hybrid mix of Communism & Capitalism. 2. That strategy lifted hundreds of millions of Chinese out of poverty. 3. But its success as a global manufacturing hub brought new problems that stumped the CP. 4. China loses labor cost advantage; Excess industrial capacity means idling plants or more dumping.5. Debt levels have exploded at state-owned industries and private firms leading to defaults.6. Financial stress, loss of competitiveness, trade war with the US = slowest GDP growth in 27 years!7. WHAT’S NEXT? Ramp up domestic stimulus -- and wait out the US trade conflict thru 2020 election.
“Is this economic cycle about to end?” An inverted yield curve has been a (near) perfect predictor of recessions.
?
The Economic Outlook Group
10 yr minus 2 yr Treasuries10 yr minus 3-month Treasuries
Access to bank loans still fairly easy; No evidence yet that lenders are turning cautious out of concern about the outlook and loan defaults.
Bank lending standards to small firmsBank lending standards to medium and large firms
Above zero = more banks get tougher issuing creditBelow zero = more banks make it easier to obtain credit
(Federal Reserve: Senior loan officer opinion survey on bank lending practices)
The Economic Outlook Group
Homebuilders confront a perfect storm!
Cost of building material has increased due to tariffs. (Steel, aluminum, softwood lumber, plastic pipes, screws, bolts)
Severe shortage of skilled labor. • Number of residential construction workers is down 20% from 2006. • After the housing bust, many found more lucrative opportunities in the shale oil-related industry. • One in four construction workers were immigrants. (Source: NAHB)
The burden of excessive government regulations: • Local, state and federal requirements account for 25% of constructing cost of a home.
Scarcity of suitable land: Price of lots in preferred locations have skyrocketed. • Builders moving out into “Xburbs” to construct more affordable homes. • But high-end homes still provide greater margins for builders.
The Economic Outlook Group
Housing demand has been lackluster!
• Household formation has slowed: --- aging demographics --- birth rates are lowest in 30 years --- severe curbs on immigration --- US population growth now slowest in 80 years --- Household formation to slow from 1.40 million (2018) to 1.22 million (2023)
• Millennials and Gen Zs are more budget conscious. --- High college debt burdens (record $1.6 billion) have made renting more attractive --- Pressure to build private savings because of doubts on solvency of SS and Medicare --- Witnessed financial crisis: saw home values plummet and how friends/families declared bankruptcy --- Uncertain about future economy given the trade war and fears of a global recession.
• Provisions of the 2017 Tax Act raised the after-tax cost of homeownership• Banks tightening lending standards given lateness in the credit cycle.• Lack of affordable entry level homes: --- Large investment firms buying thousands of homes for rent; record numbers of flippers in the market.
The Economic Outlook Group
Demographic changes will alter the composition of spending
The Economic Outlook Group
• Retiring baby boomers--> They are downsizing, selling off possessions, moving into smaller homes. --> Result: No interest in buying “stuff.” Will focus more on health, fitness and travel.
• Millennials: They’re greater in size than baby boomers but display a different set of values. More risk aversive.--> Many are heavily burdened with college debt. (Currently a record $1.5 trillion)--> Skeptical about the solvency of SS & Medicare. Pressure to save more income.--> Experienced the Great Recession; witnessed families lose their homes or declare bankruptcy.--> More practical spenders. Prefer Uber over car buying, streaming not cable, cell phone not landlines, home rental not purchase. --> Result: More inclined toward experiential spending, travel, entertainment, healthy eating,
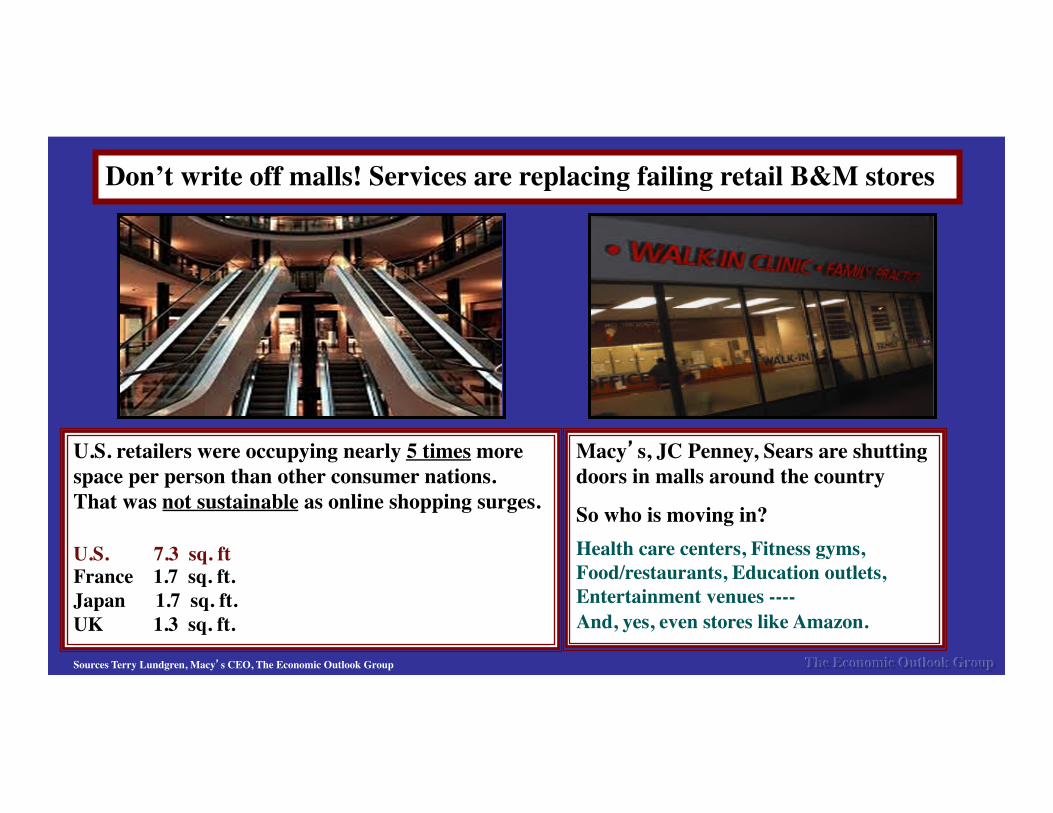
Don’t write off malls! Services are replacing failing retail B&M stores
U.S. retailers were occupying nearly 5 times more space per person than other consumer nations.That was not sustainable as online shopping surges.
U.S. 7.3 sq. ft France 1.7 sq. ft.Japan 1.7 sq. ft.UK 1.3 sq. ft.
Macy’s, JC Penney, Sears are shuttingdoors in malls around the country
So who is moving in? Health care centers, Fitness gyms,Food/restaurants, Education outlets, Entertainment venues ----And, yes, even stores like Amazon.
Sources Terry Lundgren, Macy’s CEO, The Economic Outlook Group The Economic Outlook Group