Global Health Working Group for the 2016 G7 Summit (GHWG) Roundtable Discussion December 17, 2015, Tokyo, Japan _______________________________________________________________________ The Economic Impact and Challenges of Universal Health Coverage in Japan GROUP 2 Takashi Oshio, Reiko Hayashi, Yuki Murakami, Yohsuke Takasaki
2. National Institute of Population and Social Security Research
3. Organisation for Economic Co-operation and Development
Abstract
In this paper, we overview the impact of UHC in Japan over the past half a century from an economic viewpoint, for the purpose of drawing lessons for countries that are in the initial stage of establishing social healthcare programs. Japan’s experience suggests that UHC can reduce income inequality via contributions and benefits, in addition to its major target of ensuring that all people equally obtain the health services they need. However, Japan’s experience also highlights that the sustainability of UHC depends largely on demographic and economic conditions. One of the most formidable, albeit foreseeable, challenges is the aging population, which will substantially reduce fiscal space for UHC. Also, changes in industry and labor market structures are likely to make UHC programs differ from their original goals, especially if UHC has a history of expanding from the formal to the informal sectors. It would be advisable to design a system that is sufficiently robust to withstand expected demographic and economic pressures and carry out forward-looking reforms.
1. Introduction
Japan instituted universal health coverage (UHC) in 1961, by passing a law implementing
Citizens’ Health Insurance (CHI) plans (Campbell, Ikegami, and Tsugawa, 2014). This law
did not unify the health insurance programs created before World War II; it kept employees
and their dependent family members covered by their existing plans. The biggest change
was that all other citizens were covered by municipality-provided CHI plans, thereby
making the coverage of healthcare insurance mandatory and universal. In this sense, Japan’s
UHC aimed at financing health benefits mainly through social health insurance (SHI)
premiums, rather than through tax revenues. The new system ensured the same access to
health services as the existing plans for employees; all the insured were entitled to go to any
physician or hospital they chose and could receive the same procedures and medications. In
addition, the introduction of the nationally standardized fee schedule, which was applicable
to all physicians, providers and hospitals regardless of public or private status, enabled SHI
coverage to be expanded smoothly throughout the country by reducing any distortion of
incentives in providing healthcare services.
As a result, Japan’ UHC achieved a successful expansion from the formal to the
informal sector at a relatively early stage by establishing an integrated SHI system thanks to
the government’s initiatives. It should be noted, however, that Japan’ system is
2
decentralized rather than centralized; the CHI plans are managed by each municipality,
although the central government distributes the subsidies to local governments.
It should, however, also be remembered that it took more than twenty years for CHI to
be fully implemented after its introduction in Japan, suggesting that CHI implementation
cannot be completed in a short time. UHC, which was instituted in 1961, was further
enhanced with the establishment of financial protection in 1973, when the High-cost
Medical Care Benefit System became available in all SHI programs. This system allows the
insured to claim medical care costs from their SHI programs if they exceed the cost-bearing
limits, although it does not completely avoid the risk of extremely high payments, leaving
the system not fully equitable. Finally, UHC was further enhanced with the introduction of
a system of the Highly Advanced Medical Technology Exemption in 1984, which allows the
actual costs of highly selective medical services to be charged to patients in addition to their
SHI coverage as an exception to the principle of banning mixed billing.
Although UHC established a foundation for the subsequent development of the
healthcare system and social well-being in Japan, it now faces several challenges, which
puts a strain on its sustainability (Ikegami et al., 2011). In this paper, we will briefly discuss
the economic impact of UHC, including how it has affected household income and income
inequality as well as the government’s fiscal position in Japan, extending the discussion by
Oshio, Miake, and Ikegami (2014).
The bottom line is that the efficiency and sustainability of Japan’s UHC have depended
heavily on the demographic and macroeconomic conditions of the economy. When Japan
was “young” and growing at a rapid pace in the 1960s and 70s, UHC as a whole contributed
to a reduction in income inequality at the national level, in addition to an improvement in
people’s health conditions and equal access to health services. However, the aging
population and changing economic structure have required adjustments to the existing UHC
scheme. The Japanese government has continuously made efforts to improve efficiency of
healthcare provision, including an introduction of public long-term care insurance programs,
and it should maintain those efforts in the future. However, additional policy measures are
needed to enhance the sustainability of UHC. Among others, potential work capacity among
the elderly should be utilized and social healthcare coverage of lower-income households
should be strengthened.
2. Success: Favorable Impact on Household Income and Income
Distribution
With the expanded coverage of health insurance plans, UHC has been reducing people’s
reliance on out-of-pocket spending to purchase health services. When UHC was expanded
to the informal sector, national and local governments were obliged by law to utilize more
tax revenues to finance spending on the costs of health services.
As seen in Figure 1, the proportion of out-of-pocket spending in overall health
expenditures gradually declined from 38.7 percent in 1955 to 13.4 percent in 1975. Such a
remarkable reduction in the dependence on out-of-pocket spending was largely attributable
to an expansion of SHI coverage until 1961 and the reduction of co-payment rates since
then.
3
Table 1 shows that the disparity between the types of health insurance and categories of
the insured was reduced step by step, until it fully disappeared in 2003. At the onset of UHC
in 1961, it was only the employees insured by employer-provided health insurance plans
who could receive medical care with almost no co-payment. In contrast, dependents (i.e.,
wife and children) of employees and those insured by CHI had to pay half of their medical
cost as co-payment. In 1968, the co-payment rate of CHI was reduced to 30%, followed by
a reduction to 30% for dependents covered by employer-provided plans in 1973 and the
introduction of 10% co-payments for employees covered by employer-provided plans in
1984. The rates were finally unified across all programs by increasing the co-payments of
employees covered by employer-provided plans to 30% in 2003. Those who benefitted most
from the reduction of co-payment rates in 1960s were those covered by CHI engaged in the
informal sector, which consisted of more low-income households than in the formal sector.
These changes in the structure of overall health expenditures had two important
implications for household income and income distribution. First, health services became
more evenly accessible. Figure 2 compares the concentration curves of healthcare benefits,
which were provided by social healthcare insurance, between 1952 (before the
establishment of UHC) and 1967 (after its establishment). The concentration curve graphs
the cumulative proportion of healthcare benefits against the cumulative proportion of
households ranked by income (Van Doorslaer et al., 2000). We observe that the curve for
1952 is located below the diagonal, indicating that the receipt of healthcare benefits was
distributed in favor of richer households. By comparison, the curve for 1967 is located close
to the diagonal, indicating a relatively even distribution of benefits. We also can calculate
the concentration index, which indicates the degree of inequality in the distribution of
healthcare and is measured as twice the area between the concentration curve and the
diagonal. The higher this index is, the more concentrated the distribution of benefits is on
the richer households. The index declined from 0.145 in 1952 to –0.001 in 1967.
The health equity achieved by UHC assured the extension of healthy lives among
people in Japan. As seen in Figure 3, average life expectancy has increased smoothly for
both males and females after the introduction in UHC. We also observe that the Gini index
of life expectancy at the prefecture level gradually declined along with extended life
expectancy. Here, the Gini index is calculated almost in the same way as the concentration
index, by replacing income with average life expectancy. The index reflects widespread and
even distribution of the benefits of UHC, which contributed to improvement in health
conditions and equal access to public healthcare especially in rural areas and informal
sectors via CHI plans.
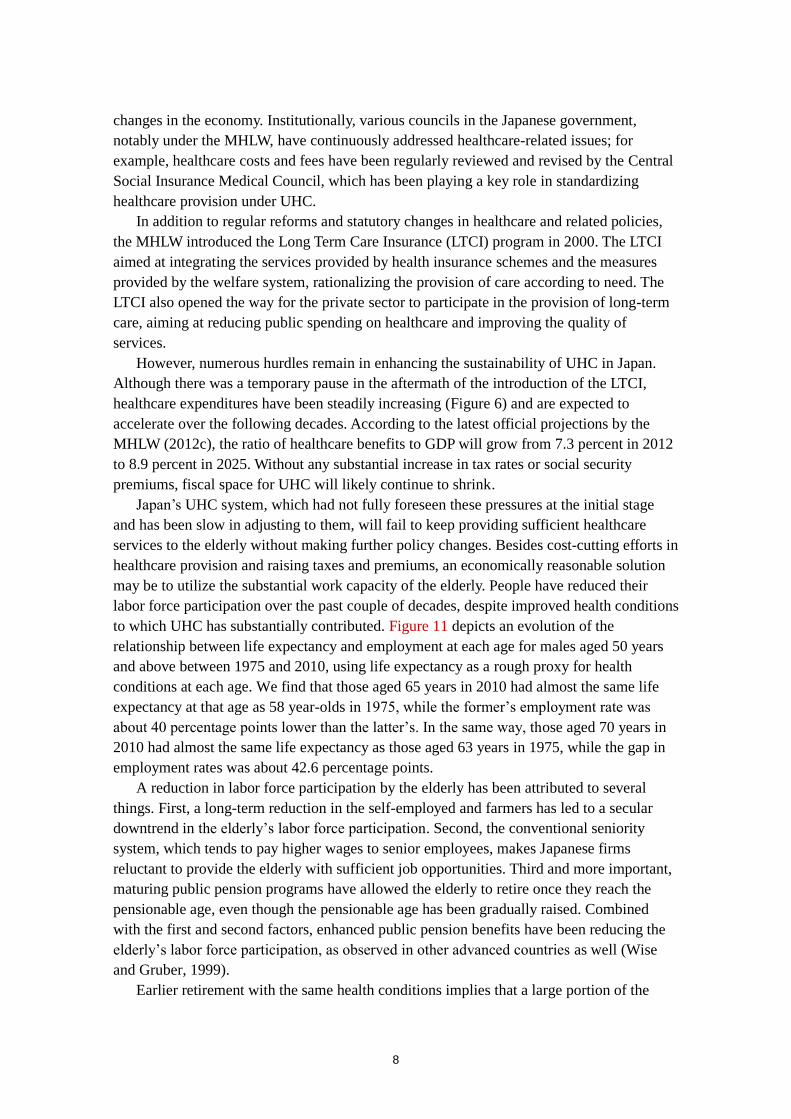
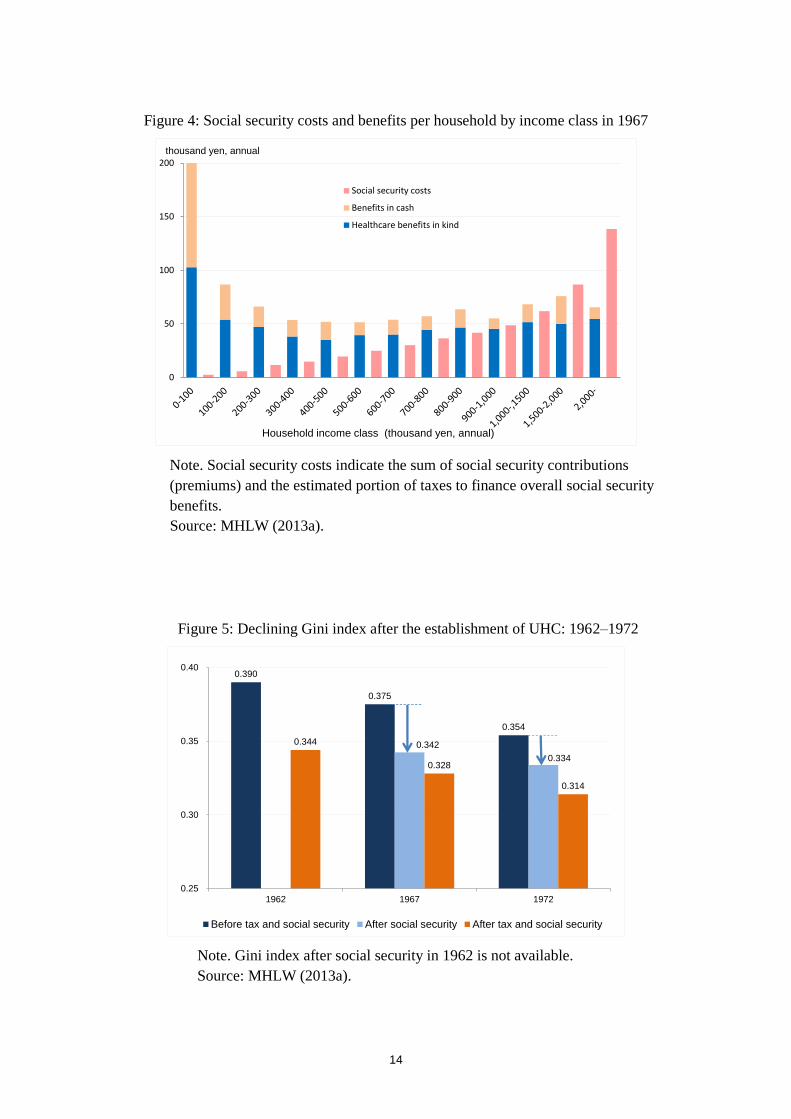
The second implication, related to the first one, of the expansion of UHC is the
increasing importance of income transfer through social security programs as well as
taxation. Figure 4 confirms this by showing healthcare benefits in kind and benefits in cash
by income class in 1967, compared to social security costs, which are the sum of social
security contributions (premiums) and an estimated portion of taxes used to finance overall
social security benefits.
We can see three findings in this figure. First, healthcare benefits dominated social
security benefits except for the lowest income group, reflecting a limited number of public
pension recipients in the younger population structure. In 1960, the proportion of people
4
aged 65 and older was only 5.7 percent of the population and the average age was 28.5,
compared to 24.1 percent of the population and 45.3 years of age in 2013.
Second, healthcare benefits in kind vary little across income groups reflecting an equal
access to healthcare services, except for the lowest income group again. This is consistent
with the shape of the concentration curve for 1967 in Figure 2.
Third, the observed relationship between social security benefits and costs across
income groups suggests income transfer from the rich to the poor—that is, the net benefits
were positive for the poor and negative for the rich. It may be controversial whether, and to
what extent, income redistribution should be expected from social security programs, which
were originally designed to reduce peoples’ exposure to social risks. However, the fact that
UHC had the favorable byproduct of reducing income inequality in Japan should be
remembered; it has important implication for countries that do not have a rigorous taxation
system. Equal coverage across different insurance schemes has helped reduce the level of
income inequality.
Income redistribution by UHC has reduced overall income inequality, which is
measured by an income version of the Gini index. Figure 5 shows the changes in the official
estimates of the Gini index over the decade after the establishment of UHC, beginning at its
initial stage. For both types of income—before and after redistribution through taxes and
social security programs, the figure shows that income inequality successfully declined
during that period. The main driver of the reduction in income inequality in Japan was rapid
and well-balanced economic growth, which raised the mean household income. Also, the
relatively equal development across areas and the nationwide income redistribution of tax
revenues across local governments favored equitable income redistribution (Tachibanaki,
2004).
It should be noted here that UHC was another main contributor to equitable income
redistribution. Figure 5 decomposes the reduction in the Gini index after income
redistribution into those attributable to taxation and social security programs for 1967 and
1972 (but not 1962 due to limited data availability). This decomposition indicates that
social security programs reduced the Gini index from 0.375 to 0.342 in 1967, meaning that
they accounted for 69.4% of its reduction to 0.328 after total income redistribution. We also
find that social security programs accounted for 50.4% of a reduction of the Gini index due
to total income redistribution in 1972. Considering that public pension benefits had not
matured at the time and only gave limited effect of income redistribution, we can argue that
reduced income inequality was highly attributable to income transfer via healthcare
programs. It should be also noted that income redistribution at that time was not much
attributable to the income transfer from the young to the elderly, because the population was
young. Healthcare and pension benefits for the elderly accounted for 6.6% (7.8% if
including social welfare service) and 17.2%, respectively, of the total social security
expenditures in 1973, much more limited compared to 11.8% (19.8% if including social
welfare service) and 48.4%, respectively, in 2013 (IPSS, 2015).
Finally, we can argue that a gradual introduction of UHC was helped by rapid economic
growth. Between 1955 and 1970, the real gross domestic product (GDP) increased at nearly
a 10 percent rate per year and kept overall healthcare expenditures below 3 percent of GDP
until 1973. Rapid economic growth also raised government revenues through taxes and
5
social security contributions, which sustained sufficient fiscal space for healthcare benefits.
3. Challenges: Pressures From the Aging Population and Changing
Economic Structure
Japan’s UHC was successfully established in the 1960s and had favorable effects on
household income and income distribution, as well as on equity and people’s overall health.
A young population structure provided favorable conditions for establishing UHC, because
it minimized the transfer of income from the young to the old via social security programs.
Public pension programs had not matured yet, and healthcare benefits to the elderly had not
started to mount.
Half a century later, however, Japan’s UHC is facing several challenges because of the
aging population and structural changes in the economy. The proportion of people aged 65
and over has been rising rapidly and is 26.1 percent as of 2014, making Japan the “oldest”
country in the world. At the same time, the economy has experienced a reduction in the
self-employed and farmers, as well an increase in non-regular employees. These secular
changes have reduced fiscal space for UHC and have put a strain on the existing social
healthcare insurance system.
Aging affects the fiscal space on both the expenditure and revenue sides. On the
expenditure side, a rising proportion of the elderly naturally raised total health expenditures
because the elderly consume more healthcare services than the younger population. As seen
in Figure 6, the share of healthcare benefits for the elderly (aged 70 and older) out of total
benefits rose from 15.2 percent in 1975 to 47.2 percent in 2013, and an increase in benefits
for the elderly accounts for more than half of the increase in total benefits during the same
period. On the revenue side, the elderly—mostly retired and depending heavily on pension
benefits—tend to have lower incomes so that the amount they contribute is less in terms of
income tax and healthcare insurance premiums.
As a result, health insurance has become similar to pensions in that they have led to
large-scale income transfers from the young to the elderly, as discussed later in more detail.
Increasing income transfers between age groups has made the healthcare insurance system
less sustainable with an aging population. To be sure, there is a substantial “second
demographic dividend,” which results from older workers motivated to expend their
financial assets during retirement to lower reliance on their families or the government for
providing for their needs in old age. In 2014, households whose heads were 60 years old
and over accounted for 50.2 percent of total households (excluding one-person households),
and held 68.9 and 90.5 percent of total financial assents on gross and net terms,
respectively.
To be sure, a portion of the second demographic dividend has been transferred in the
form of informal, intra-family income transfer from the elderly to their offspring and, more
broadly, they have contributed to economic growth through accumulating capital stock. As
discussed later, however, a higher dependence on government subsidized healthcare benefits,
which has led to mounting issues of government bonds, indicates shrinking fiscal space for
social healthcare plans. This suggests that this dividend has not been fully utilized and that
there remains much room to take advantage of them to strengthen the financial position of
6
UHC.
The government was not aware of the potential pressures of its aging population on
UHC until the 1980s. Indeed, it made healthcare for the elderly free of charge at the national
level in 1973 (until ten years later), along with other generous reforms in social security
programs. Since then, the government has gradually become more concerned about its
deteriorating fiscal position and its causes: population aging and lower economic growth.
Policymakers have tried to reduce the fiscal burden on the general budget by forcing health
insurance plans to contribute more to the health expenditures of the elderly. However, they
have faced increasing resistance from employers and employees, who are members of the
employer-provided plans, because they are already contributing nearly half of their
premium revenue to the funding pool to finance health expenditures of the elderly.
Decreased growth in government revenues, due to prolonged economic slowdown, and
mounting healthcare and other social security benefits for the elderly have increased
dependence on taxes. As seen in Figure 7, the proportion of health expenditure financed by
government subsidies resumed rising in the 1990s when the “bubble” economy collapsed,
and it was as high as 38.6 percent in 2012 pointing to strong pressures on government
budgeting. This has led to a steady increase in government deficits, because people have
been consistently opposed to tax hikes and the elderly have been usually resisting any
reduction in healthcare benefits.
Shrinking fiscal space has been accompanied by a change in the structure of income
transfer related to UHC. Healthcare insurance programs are pay-as-you-go in nature
because people are most exposed to health risks when they are old and pay more premiums
and taxes when they are young. Figure 8 compares healthcare costs to the sum of
co-payments and premiums by age group in 2010. When the population was young in the
initial stage of UHC, the magnitude of this inter-generational transfer of income was
relatively limited at the national level and dominated by intra-generational transfer.
However, population aging has accelerated the inter-generational transfer and reduced fiscal
space for healthcare programs. This is because the elderly do not want to accept reduced
benefits and also because the young are usually opposed to higher taxes and premiums.
Hence, policymakers have been consistently reluctant to promote any reform to Japan’s
UHC programs.
Another key challenge to UHC has come from structural changes in the labor market.
Japan has not established a unified system of healthcare insurance, and citizens are covered
by either employee-based plans (for employees and their family dependents) or
municipality-based plans (for others). The latter—CHI plans—originally were supposed to
cover self-employed workers, farmers, and their family dependents. Industrialization of the
economy has reduced the proportion of these types of individuals in the total population,
and hence the structure of CHI group membership, as seen in Figure 9.
The CHI plans are now absorbing an increasing number of non-regular employees, who
are not covered by employer-provided health insurance plans. Employees accounted for
35.3 percent of the CHI insured in 2012, compared to 19.5 percent in 1965. This contradicts
the original purpose of CHI. The rising proportion of non-working people, most of whom
are retired or unemployed, makes the CHI plans less sustainable. Moreover, the uneven
rates of aging and economic growth across municipalities have led to a wider disparity in
7
the premium rates of CHI plans, which are municipality-based and thus exposed to the
fiscal pressures faced by each (Takaku et al., 2014). The Japanese government is now
planning to integrate municipality-based CHI plans into prefecture-level plans, but the
disparity in CHI premiums among municipalities is not expected to disappear because the
premium level depends not only on income level but also on accessibility to healthcare
facilities. This is a typical example of the difficulty in reforming a system once it has been
established.
The increasing numbers of members with low incomes and a lack of incentives to
enhance efficiency has put a strain not only on the CHI plans but also on the country’s
healthcare plans as a whole, because more subsidies were needed to fill the revenue
shortages of the CHI plans. Along with a change in membership composition and financial
vulnerability of the CHI plans, the regressive structure of CHI premiums and the risk that
more people will no longer be able to participate in CHI plans have attracted increasing
attention in recent years. Unlike the premiums of employer-provided health insurance plans,
which are basically proportional to wage income and not affected by the number of the
insured, CHI premiums consist of three to four components: a flat-rate component per
household, a component proportional to the number of the insured, a component
proportional to income, and a component related to real estate taxes (in some municipalities
only). The first two components account for the regressive nature of the CHI premium,
creating an outsized financial burden on lower-income households.
Figure 10 compares the premium rates per household between CHI and
employer-provided health insurance plans for low- and middle-income households that
consist of a married couple and their unmarried child(ren), and whose head of household is
20–59 years old. As clearly seen in this table, the CHI premium rates are consistently higher
than those of employer-provided health insurance plans, indicating higher burdens on CHI
members than others in the same household income bracket. Equally important, CHI
premiums have a regressive structure; the premium rates are higher for lower-income
households even after adjusting for household-size, as shown by Takaku et al. (2014).
These two features of CHI premiums—i.e., heavier burdens compared to
employment-based health insurance programs and the regressive structure—have become
increasingly serious in recent years, as the CHI plans are absorbing an increasing number of
non-regular employees. According to an estimation by Ikegami et al. (2011), about 1.6
million people were not covered by any SHI plan in 2007 even if they earned enough in
wages to pay the CHI premiums. Their estimation suggests that a substantial proportion of
non-regular employees were not covered by either employer-provided or CHI plans.
Furthermore, a combination of heavy premiums and low income earnings raises the risk of
these people being kept out of CHI plans, despite it being a lesser risk compared to not
maintaining coverage under public pension plans for those who are not covered by
employer-provided pension plans. These changes might bring into question Japan’s status as
a country with universal coverage.
4. Policy Agenda: Enhancing the Sustainability of UHC
Japan’s UHC is now facing serious challenges because of its aging population and structural
8
changes in the economy. Institutionally, various councils in the Japanese government,
notably under the MHLW, have continuously addressed healthcare-related issues; for
example, healthcare costs and fees have been regularly reviewed and revised by the Central
Social Insurance Medical Council, which has been playing a key role in standardizing
healthcare provision under UHC.
In addition to regular reforms and statutory changes in healthcare and related policies,
the MHLW introduced the Long Term Care Insurance (LTCI) program in 2000. The LTCI
aimed at integrating the services provided by health insurance schemes and the measures
provided by the welfare system, rationalizing the provision of care according to need. The
LTCI also opened the way for the private sector to participate in the provision of long-term
care, aiming at reducing public spending on healthcare and improving the quality of
services.
However, numerous hurdles remain in enhancing the sustainability of UHC in Japan.
Although there was a temporary pause in the aftermath of the introduction of the LTCI,
healthcare expenditures have been steadily increasing (Figure 6) and are expected to
accelerate over the following decades. According to the latest official projections by the
MHLW (2012c), the ratio of healthcare benefits to GDP will grow from 7.3 percent in 2012
to 8.9 percent in 2025. Without any substantial increase in tax rates or social security
premiums, fiscal space for UHC will likely continue to shrink.
Japan’s UHC system, which had not fully foreseen these pressures at the initial stage
and has been slow in adjusting to them, will fail to keep providing sufficient healthcare
services to the elderly without making further policy changes. Besides cost-cutting efforts in
healthcare provision and raising taxes and premiums, an economically reasonable solution
may be to utilize the substantial work capacity of the elderly. People have reduced their
labor force participation over the past couple of decades, despite improved health conditions
to which UHC has substantially contributed. Figure 11 depicts an evolution of the
relationship between life expectancy and employment at each age for males aged 50 years
and above between 1975 and 2010, using life expectancy as a rough proxy for health
conditions at each age. We find that those aged 65 years in 2010 had almost the same life
expectancy at that age as 58 year-olds in 1975, while the former’s employment rate was
about 40 percentage points lower than the latter’s. In the same way, those aged 70 years in
2010 had almost the same life expectancy as those aged 63 years in 1975, while the gap in
employment rates was about 42.6 percentage points.
A reduction in labor force participation by the elderly has been attributed to several
things. First, a long-term reduction in the self-employed and farmers has led to a secular
downtrend in the elderly’s labor force participation. Second, the conventional seniority
system, which tends to pay higher wages to senior employees, makes Japanese firms
reluctant to provide the elderly with sufficient job opportunities. Third and more important,
maturing public pension programs have allowed the elderly to retire once they reach the
pensionable age, even though the pensionable age has been gradually raised. Combined
with the first and second factors, enhanced public pension benefits have been reducing the
elderly’s labor force participation, as observed in other advanced countries as well (Wise
and Gruber, 1999).
Earlier retirement with the same health conditions implies that a large portion of the
9
elderly can potentially shift from beneficiaries of UHC to contributors to UHC by paying
more in premiums and taxes. A combination of providing firms with more incentives to hire
the elderly and increasing the eligibility age for claiming pension benefits should be an
effective solution to utilizing an outcome of UHC to make UHC more sustainable. However,
this policy option is challenging, given a secular downtrend in the proportion of the
self-employed and farmers as well as limited work capacity of those aged 75 and above.
Hence, in addition to the promotion of employment for the younger elderly, diverse options
such as collecting revenues from different types of taxes other than wage-related premiums
should be considered. In addition, the Social Security and Tax Number System, which was
introduced in 2015, is expected to enhance the efficiency of taxes and premiums collection.
Another imminent policy issue is to keep UHC working as originally defined—that is, keep
all citizens covered by social healthcare plans. The government has decided to expand the
coverage of employer-provided health insurance plans (as well as pension plans) to
part-time workers (who work more than 20 hours per week) as of 2016. However, it is
uncertain to what extent this reform will be effective in widening the coverage of
employer-provided plans, because Japanese firms will likely remain under strong
cost-cutting pressures due to severe competition with other Asian countries.
To sustain UHC in name and in reality, policy measures should keep focusing on
supporting lower-income households, who are supposed to be covered by CHI plans but are
at risk of leaving the insurance market. The government is planning to integrate the current
municipality-managed CHI plans to wider, prefecture-level ones to enhance their efficiency
and reduce inequalities across municipalities. An open question, however, is whether the
regressive structure of CHI plans will be fully addressed by this reform. A comprehensive
reform of the social security and tax systems—such as offsetting premiums through tax
refunds—is needed to reduce the regressive nature of CHI premiums among lower-income
households and prevent those households from losing coverage. In addition, the unequal
access to healthcare between urban and rural areas should be addressed before the
prefecture-level unification of CHI premiums.
5. Conclusion: Implications From Japan’s Experience With UHC
In this paper, we have overviewed the impact of UHC in Japan over the past half-century
from an economic viewpoint. Japan’s experience with UHC provides important
lessons—both positive and negative—for countries that are in the initial stages of
establishing healthcare and other social security programs.
The goal of universal health coverage is to ensure that all people obtain the health
services they need without suffering financial hardship when paying for them. A Japanese
version of UHC—which is characterized by equal coverage and benefits, a universal fee
schedule, a high-cost medical expenses payment system, subsidies for the vulnerable, a mix
of premiums and taxes to finance public healthcare benefits, and the importance of
municipalities in the management of the scheme—has generally succeeded to achieve this
goal.
The system, which Japan established to finance its UHC program, had another
important effect: it indirectly reduced income inequality via contributions and benefits. This
10
income transfer worked effectively during the initial stage of establishing UHC because the
population structure was young. Income distribution is a key contributor to social
well-being. These equitable outcomes should be stressed as favorable byproduct of Japan’s
UHC.
At the same time, we should remember that the sustainability of UHC depends largely
on demographic and economic conditions. One of the most formidable, albeit foreseeable,
challenges is the aging population, and it is advisable to make the system as robust as
possible at the initial planning stage, in order to counter its future stress on the economy and
fiscal space for UHC. Japan’s experience clearly reveals that once a population starts to
shrink and the economy stops expanding, the fiscal sustainability of the system will decline.
In addition, changes in industry and labor market structures are likely to have substantial
effects on UHC programs that differ from their original goals. This is especially the case
given that UHC in Japan has a history of expanding from the formal to the informal sectors
and has not been unified at the national level.
It is politically challenging to reform UHC once these needs for change are recognized,
as evidenced by Japan’s experience. Under conditions of an aging population and low
economic growth, any reform in UHC should take the form of a zero-sum game. Any
proposal to reduce the elderly’s healthcare benefits will face fierce opposition from elderly
voters, making politicians and bureaucrats reluctant to reform the current programs. It
would be advisable to design a system that is sufficiently robust to withstand expected
demographic and economic pressures and carry out forward-looking reforms, before these
pressures mount.
11
References
Campbell, J. C., Ikegami, N., and Tsugawa, Y. (2014). The political-historical context of
Japanese healthcare. In N. Ikegami (ed.) Universal Health Coverage for Inclusive and
Sustainable Development: Lessons from Japan. (pp.15–26), Washington: World Bank
Group.
Gruber J, Wise D. Social Security and Retirement around the World, The University of
Chicago Press, 1999, 239-267.
Ikegami, N., Yoo, B.-K., Hashimoto, H. et al. (2011). Japanese universal health coverage:
evolution, achievements, and challenges. Lancet, 378 (9796), 1106–1115.
Ministry of Health, Labour and Welfare (MHLW) (2011). Comprehensive Survey of Living