The Economic Impact of a Banking Oligopoly: Britain at the turn of the 20th century * Fabio Braggion, Narly Dwarkasing, and Lyndon Moore † September 19, 2014 Abstract We investigate the impact of the formation of the ‘Big 5’ highly concentrated bank- ing market in England and Wales. By 1920 five banks controlled 80% of the deposit base, following several decades of mergers and acquisitions and aggressive branch ex- pansion. Borrowers in the counties that experienced higher bank concentration received smaller loans, had to post more collateral, and were granted loans of shorter duration. In those high bank concentration counties, the quality of loan applicants had improved, which suggests that it is likely the oligopoly restricted credit, rather than changing the quality of loan applicants. We find signs that bank concentration negatively impacted local economies. Counties with a more concentrated banking system generated lower tax revenues and had lower employment to population ratios. * We thank the archivists at HSBC, RBS, and Lloyds for graciously providing us with access to their internal records. Dwarkasing would like to thank the NWO-Mozaiek program and Moore the Faculty of Business and Economics at the University of Melbourne for financial support. Lisa Gardner, Owen Horton, Zoi Pittaki, Pamela Schievenin, Emily Stammitti, and Marc di Tomassi provided excellent research assistance. † Braggion is from EBC, CentER, & Tilburg University. Dwarkasing is from the University of Bonn. Moore is from the University of Melbourne. 1
Transcript
The Economic Impact of a Banking Oligopoly: Britain
at the turn of the 20th century ∗
Fabio Braggion, Narly Dwarkasing, and Lyndon Moore†
September 19, 2014
Abstract
We investigate the impact of the formation of the ‘Big 5’ highly concentrated bank-
ing market in England and Wales. By 1920 five banks controlled 80% of the deposit
base, following several decades of mergers and acquisitions and aggressive branch ex-
pansion. Borrowers in the counties that experienced higher bank concentration received
smaller loans, had to post more collateral, and were granted loans of shorter duration.
In those high bank concentration counties, the quality of loan applicants had improved,
which suggests that it is likely the oligopoly restricted credit, rather than changing the
quality of loan applicants. We find signs that bank concentration negatively impacted
local economies. Counties with a more concentrated banking system generated lower
tax revenues and had lower employment to population ratios.
∗We thank the archivists at HSBC, RBS, and Lloyds for graciously providing us with access to their
internal records. Dwarkasing would like to thank the NWO-Mozaiek program and Moore the Faculty of
Business and Economics at the University of Melbourne for financial support. Lisa Gardner, Owen Horton,
Zoi Pittaki, Pamela Schievenin, Emily Stammitti, and Marc di Tomassi provided excellent research assistance.†Braggion is from EBC, CentER, & Tilburg University. Dwarkasing is from the University of Bonn.
Moore is from the University of Melbourne.
1
1 Introduction
The effects of bank concentration on credit extension and the economy are complicated
phenomena. In the modern era bank mergers, the usual path to a concentrated banking
system, are politically sensitive issues in most countries. Such mergers are usually strictly
vetted by national (and sometimes state) regulators. Banks, particularly in the United
States, are regulated by a maze of rules and guidelines. As at the start of 2014, the U.S.
had 18 bank regulatory authorities which together had issued 8872 pages of regulations.1
The high, and changing, degree of bank regulation makes empirical conclusions about the
effect of concentration on the economy difficult to interpret. Is a documented effect of
bank concentration on the economy, in a particular market at a particular point in time, an
intrinsic effect of the behavior of profit-maximizing banks and utility maximizing consumers?
Or is observed behavior, in settings with voluminous regulations, a complex constrained
maximization problem by agents where the effect of bank concentration per se is difficult
to disentangle from the constraints? Rather than attempt to isolate the effect of banking
concentration on the economy in a highly regulated environment we instead study the laissez-
faire British banking environment of the late 19th and early 20th centuries.
We construct a data set of about 25,000 loans granted by English and Welsh banks
between 1885 and 1925. Our information includes the amount and the duration of the loans,
the interest rates applied and the collateral requested. We complement this information
with balance sheet information for all banks that operated in England and Wales during our
sample period and data on the economic conditions of various British counties. Using this
information we relate local banking market concentration to banks’ loan provisions, banks’
risk taking, and ultimately local economic outcomes.
A study of the British financial system between 1885 and 1925 has several advantages.
First, we analyze a consolidation process in an almost completely unregulated environment.
Neither anti-trust authorities nor merger legislation existed in the period. The Barth, Caprio,
and Levine (2006) measure of regulation and supervision would have awarded the U.K. bank-
1See Code of Federal Regulations, 2014 edition, U.S. Government Printing Office.
2
ing system in our period the minimum score for regulation in the categories of competition,
capital ratios, deposit insurance, and the degree of supervision. Mergers, even between very
large banks, were possible and did occur, especially in the first two decades of the twentieth
century. In addition, banks were lightly regulated in their everyday activities; mandatory
capital ratios and deposit insurance did not exist, and interest rates were unrestricted.2 New
banks were free to incorporate in a joint-stock form with limited liability. Neither the govern-
ment nor the Bank of England guaranteed the bailout of a single bank (during non-systemic
crisis times). The Bank of England’s public role was limited to providing rediscount services
to solvent, but illiquid, banks at a penalty interest rate during a systemic crisis as well as
setting the minimum discount rate for bills, known as Bank Rate, under normal market
conditions.
The unregulated environment is important, as it removes concerns that the observed
mergers (and their effects) were permitted by the government or a regulator to proceed
because economic conditions, geographic location, or ‘good citizenship’ standing (such as
under the Community Reinvestment Act(CRA) in the U.S.) were judged acceptable to the
regulator. For instance, Agarwal, Benmelech, Bergman, and Seru (2012) document that U.S.
banks increased lending in CRA-tracts around the time of regulatory exam dates. They do
so in order to gain regulatory approval for mergers and extensions to their branch networks.
Previous studies, such as Dahl, Evanoff and Spivey (2000), failed to find an effect of the
CRA since they did not search for an effect in a CRA-tract around the regulatory exam
date. The absence of regulation also lowers the probability that bank officers were extending
loans to poorly performing, but politically connected, firms in order to receive favors (see for
instance Khwaja and Mian (2005)). The lack of regulation means that there was little need
to bribe officials in order to obtain permits and licenses (see Shleifer and Vishny (1993)). A
series of studies of U.S. bank branch deregulation in the 1970s, 1980s and 1990s has shown
that deregulation improves loan quality and aids economic growth(see Jayaratne and Strahan
2Formal supervision by the Bank of England only began with the Bank Act of 1979. Deposit insurance
was introduced in 1982 (see Saunders and Wilson, 1999). In contrast, many U.S. states maintained usury
laws until the late nineteenth century (see Benmelech and Moskovitz (2010)).
3
(1996) and Strahan (2003)), improves bank efficiency (Jayaratne and Strahan (1997)) as well
as increases new business incorporations (Black and Strahan (2000)). However, these results
have been shown to be sensitive to regional effects (see Freeman (2002) and Wall (2004)),
or, as suggested by Huang (2008), expectations of future growth, unenforced banking laws,
or substitution towards unregulated non-bank financial institutions.
A second advantage of our study is the detailed loan level data that exist for a large
number of banks. Due to the passage of time, records which are not typically available for
contemporary studies of banking are available to us. We are able to observe loans granted to
individuals and companies and match it to a bank branch. The loan data typically provide
information on the size of the loan granted (or rejected), the interest rate charged, the
duration of the loan, and any collateral the bank required. We are also able to observe if
the loan is a new one or a roll-over. In addition, comments of the bank on the quality of
the debtor are recorded, when such comments were made by the bank. Such confidential
comments are similar to an internal credit rating system.
The debate on whether a concentrated or dispersed banking market better serves firms
in need of credit, and the economy more generally, has not been resolved. The traditional
argument has been that concentration is bad for borrowers, since banks exert market power
to raise loan interest rates and restrict credit (see e.g., Klein (1971), Monti (1992), Pagano
(1993) and Guzman (2000)). In more concentrated markets banks could also restrict credit
to entrepreneurs as they pursue safer strategies, as larger market power increases their op-
portunity cost of bank failure (Keeley, 1990). Beck, Demirguc-Kunt, and Maksimovic (2004)
find that more concentrated banking markets cause firms to perceive larger financing obsta-
cles in a 74 country study, but that the effect is particularly bad for small firms. They find
that the negative effects, for borrowers, of banking concentration are diminished in countries
with higher levels of GDP and fewer banking regulations. In contrast, theories of informa-
tion asymmetry indicate that a more concentrated banking market may be good, at least
for younger, smaller firms. Petersen and Rajan (1995) develop a model that explains why
banks in concentrated markets lend to start-up firms at a lower interest rate than banks in a
competitive market. They then show empirically that in the U.S. small firms receive greater
4
funding in concentrated banking markets. Marquez (2002) derives the result that in a more
concentrated banking market the interest rate charged on loans is lower since larger banks
are more effective at screening borrowers. Zarutskie (2006) finds that in the U.S. following
bank deregulation newly formed firms operated with less outside debt than before branching
deregulation, which is consistent with the hypothesis of Petersen and Rajan.
In our unregulated environment we find results consistent with the traditional view of
bank concentration. In English and Welsh counties characterized by high banking concen-
tration, banks granted smaller loans with shorter maturities. A 1% increase in the county
Herfindhal index of banking concentration leads to a 3% decrease in the value of loans and a
1% decrease in the maturity of the loan for commercial borrowers. Banks also charged higher
interest rates and they were more likely to demand collateral in those counties. In high con-
centration counties, the quality of successful loan applicants also improved, suggesting that
oligopoly restricted credit rather than decreasing the quality of the borrowers.
These results are also confirmed by an analysis of banks’ balance sheets. Banks that
mainly operated in highly concentrated counties invested more in safe securities and lent less
to entrepreneurs and households. A one standard deviation increase in market concentration,
in the county in which a bank had the most branches, increased banks’ holdings of safe
marketable securities by about 11% . Banks located in highly concentrated counties had
higher levels of authorized capital and less volatile stock prices. We also find indications that
bank concentration was negatively reflected in counties’ economic performance. Counties
with higher banking concentration had lower proportions of the population employed and
collected lower tax revenues.
Our detailed data also allows us to check whether the lending policies of a certain branch
change in the aftermath of an acquisition. We find that recently taken over branches had
more ‘generous’ lending policies than otherwise identical branches that had not been recently
(or ever) taken over. These acquired branches granted larger loans with longer maturities,
charged lower interest rates, and were less likely to demand collateral. As many banks that
were acquired were local, small banks, our results suggest that acquired branches were able
to improve their monitoring and screening abilities.
5
Our county measure of banking concentration and the probability that a bank is taken
over might be endogenous. We alleviate endogeneity problems by using two instrumental
variables: the degree of land inequality and the distribution of postal offices saving banks
in the counties where a particular bank branch operated. We find evidence supporting the
idea that counties with more unequal land ownership also had higher banking concentra-
tion. Banks had an incentive to collude with local landowners to obtain the rights to collect
taxes on behalf of the Crown and in exchange the large landlords, often members of the
House of Lords, shielded them from competition.3 Counties with high degrees of land in-
equality tended to have a few large landholders who banked in London, rather than locally.
These two effects tended to restrict the advance of banking in counties with more unequal
land distribution. The degree of land inequality at the end of the nineteenth century was
strongly influenced by the allocation of land following the Norman Conquest. Almost all
of the land in England was redistributed by William the Conqueror, with a high priority
in the redistribution being to reward his knights and to place powerful nobles in strategic
locations. Therefore, the degree of land inequality in 1086 is unlikely to reflect nineteenth
and twentieth century economic opportunities, although it does influence nineteenth century
land ownership patterns.
Postal office saving banks were government run financial institutions that were mainly
concerned with collecting deposits from poorer households to invest them into safe securities
such as government bonds. The distribution of the post office banks network probably re-
flected the deposit-taking opportunities of a certain county rather than that county’s lending
opportunities. At the turn of the twentieth century commercial banks started to actively
target small depositors and compete with Saving banks (private institutions also devoted
to collecting the savings of those with modest wealth, see Horne, 1947, p. 287). To the
extent that the presence of postal office saving banks reflected good deposit opportunities, a
large number of saving bank branches should have induced commercial banks to open new
branches or acquire commercial banks in the same area. This is exactly what we find: com-
3Tax collectors would collect the levies, hold them for extended periods, a year or more was common,
and then remit the taxes to London. During the extended period banks had an interest-free source of funds.
6
mercial banks located in areas with a larger presence of post office saving banks branches
were more likely to be takeover targets.
In section 2 we describe the main institutional features of the British banking system
at the turn of the twentieth century. In Section 3 we describe our data sources, present
descriptive statistics, and discuss our instruments. We present the results in Section 4, while
Section 5 concludes.
2 Literature Review
Two competing hypothesis relate bank competition and concentration to the availability of
credit. The traditional argument, formalized by Klein (1971), is that concentration is bad for
borrowers, as banks raise loan interest rates and restrict credit. Berger and Hannan (1989),
Hannan (1991), and Hannan and Prager (1995) show that a more concentrated banking
market leads to lower deposit rates for bank customers, while Corvoisier (2002) illustrates
larger bank loan margins and demand deposit margins in areas of high concentration. Kahn,
Pennacchi and Sopranzetti (2005) find that increased concentration increases personal loan
rates, while Garmaise and Moskovitz (2006) report a similar finding for real estate loan
rates as well as less housing construction and more local crime. Cetorelli (2004, 2006) shows
that bank concentration is associated with fewer, but larger, firms, which he suggests is
consistent with banks using their market power to protect large incumbent firms. Haltenhof
et al (2014) depict the effect of bank loan contraction in the U.S. during the Great Recession.
A restriction on credit, via both personal loans to consumers and loans made directly to a
firm, leads to a drop in employment in the manufacturing sector in the state in which credit
was tightened.
In contrast, theories of information asymmetry indicate that a more concentrated banking
market may be good, at least for younger, smaller firms. Petersen and Rajan (1995) develop
a model that explains why banks in concentrated markets can afford to charge start-up
firms a lower interest rate to borrow than could banks in a competitive market. They
then show empirically that in the U.S. small firms receive greater funding in concentrated
7
banking markets. Marquez (2002) derives the result that in a more concentrated banking
market the interest rate charged on loans is lower since larger banks are more effective at
screening borrowers. Cetorelli and Gambera (2001) show that higher bank concentration
is good for small firms which are dependent on external finance, although the aggregate
effect of concentration is slower economic growth. Bonaccorsi and Dell’Ariccia (2000) show
that in Italian provinces with a more concentrated banking sector there is faster creation of
new firms. Manove, Padilla, and Pagano (2001) suggest that collateral demands for loans
may decline with increases in concentration as banks shift towards using screening before
extending credit. Zarutskie (2006) finds that in the U.S. following bank deregulation newly
formed firms operated with less outside debt than before branching deregulation, which
is consistent with the hypothesis of Petersen and Rajan. In contrast to the previously
mentioned papers that find evidence in support of Petersen and Rajan’s hypothesis, Degryse
and Ongena (2007) report that in more concentrated markets there is less, rather than more,
relationship banking.
Alternate theories also relate the level of banking competition with the degree of banks’
risk taking. On one hand, several theoretical papers argue that increased market concentra-
tion leads banks to embark on safer business strategies (e.g., Smith (1984), Keeley (1990),
Carletti and Hartmann (2003), and Repullo (2004)). The main reason is that greater market
power increases the value of a bank franchise (or the ‘charter value’). This increases the cost
to a bank of failing. As a result banks act more prudently and pursue low-risk strategies.
On the other hand, another family of studies rejects the previous view and emphasizes that
banks in uncompetitive markets are more likely to originate risky loans and generate finan-
cial instability. For instance Mishkin (1999) argues that banks in concentrated systems are
more likely to be subject to ‘too big to fail’ policies that encourage risk-taking behaviour by
bank managers. Boyd and De Nicolo (2005) argue that by increasing lending rates, banks
in less competitive markets exacerbate moral hazard problems with their borrowers, which
induces borrowers to undertake riskier projects. As a result, banks that face less competition
hold riskier loans in their portfolios.
A large number of studies have tested these competing hypotheses (see Berger et al.
8
(2004) for a survey). Using concentration as a proxy for banks’ marker power, De Nicolo
et al. (2004) show that more concentrated systems are more likely to experience crises. In
contrast, Beck et al. (2006) present evidence that concentrated banking systems are more
stable. Schaeck et al. (2009), who use the Panzar and Rosse H-statistic as a measure of
bank competition, find in a cross-country analysis that more competitive banking systems
are less likely to experience a systemic crisis. Schaeck and Cihak (2010) provide evidence
consistent with the notion that competition increases financial stability because it makes
the banking sector more efficient. Berger et al. (2008) relate various measures of banking
competition in 23 countries to several proxies of risk taking and they find that banks with a
higher degree of market power also have less overall risk exposure. Carlson and Mitchener
(2006, 2009) show that U.S. states that allowed bank branching during the Great Depression
had more stable banking systems: branching opportunities increased local competition and
made banks sounder and more efficient.
While these studies have been carried out in settings where regulation plays a very
important role, we study how banks reacted to the degree of concentration in an environment
where virtually all types of regulation were absent. Our study helps to understand banks’
equilibrium risk choices and concentration levels when the government does not oversee the
banking sector.
Our paper is also connected to the literature on the economic effects of bank mergers,
loan provisions, and the real economy. Akhavien, Berger, and Humphrey (1997) report
that banks shifted their portfolios towards holding more loans and fewer securities after
mega-mergers, which acted to increase profitability. Berger, Saunders, Scalise, and Udell
(1998) find that merging banks reduce their loans to small businesses, although market-wide
dynamic effects mostly offset the merger driven reduction in loans. Erel (2011) reports that
bank mergers tend to lower loan rates by banks, as long as market concentration is at low
or moderate level, and that this beneficial effect is particularly concentrated amongst small
businesses. Sapienza (2002) studies the Italian banking market between 1989 and 1995, a
period of hectic merger activity after branching deregulation in 1990. She finds that small
mergers tend to lower the loan rates charged by banks, but as local market concentration
9
increases mergers lead to higher loan rates. After a merger large Italian banks tend to reduce
the loans made to small borrowers. Focarelli and Panetta (2003) document a dynamic effect
of mergers on bank deposit rates in Italy from 1990 to 1998. They examine the dynamic
effects of mergers, since any potential efficiency gains from mergers may take several years
to be fully realized. In the year of the merger deposit rates for the merging bank decline but
than rise above pre-merger levels in subsequent years. Karceski et al (2005) find that the
client firms of Norwegian banks are differentially affected by a merger. Publicly traded firms
that are clients of target banks experience a drop in their share price following a merger
announcement whereas firms that are customers of the acquirer witness their share price
rise.
There is a large body of evidence that documents the effects of the financial sector on
the real economy. Cross-country studies have shown a strong correlation between financial
sector development and future economic growth (see e.g., King and Levine (1993 (a), (b)),
Levine and Zervos (1998), Levine et al (2000), and Bekaert et al (2005)). Studies of individ-
ual markets, where transmission channels may be clearer, provide corroborating evidence.
Peek and Rosengren (2000) show that the Japanese banking crisis of the 1990s led to less
commercial real estate credit in U.S. states heavily dependent on Japanese banks as well as
lower levels of construction activity in those states.
3 The British banking market
We consider the banking system of England and Wales from 1885 until 1925. Scotland and
Ireland were subject to different banking laws and those markets were not integrated with
England and Wales. Despite various attempts to codify the running of U.K. banks during
the first half of the nineteenth century, by 1885 the British banking system was still largely
unregulated (see Grossman (2010) p. 175-183). Banks’ lending and underwriting practices
were not restricted and limits on capital, branching, and deposit insurance did not exist.
Private banks were not even required to be registered before passage of the Private Banks Act,
1892. From 1858 onwards banks were not regulated in a special fashion by the government
10
and were according to Grossman (2010, p. 183): ‘essentially governed by corporation law’
(see also Schooner and Taylor (1998) p. 608).4 Limited liability incorporation was permitted
for banks after 1858 (see Grossman p. 183), and reincorporating unlimited liability banks was
facilitated by the Companies Act of 1879, which also required audited financial statements
from the banks. The alternatives to joint-stock and private banks were trustee savings banks
or the Post Office Savings Bank (POSB) system. These alternative financial institutions
catered to small depositors, comprised a small part of total deposits, and paid a fixed interest
rate of 2.5% (see Mackenzie (1932) pp. 42-44). The lack of regulation in the United Kingdom
stands in contrast to the heavily regulated U.S. market. In the U.S. banking regulation had
become entrenched following passage of the National Bank Act of 1864 and a regulator, the
Office of Comptroller of the Currency, had been established.
Moral hazard problems in England and Wales were mitigated as a bank bail-out was
unlikely (see Turner (2009)). Investors were aware that bank failures could occur (see Good-
hart and Schoenmaker (1995)) and several small public banks failed, without intervention
by the government, during the 40 year period we consider.5 Whether or not the Bank of
England would aid a bank in crisis was unclear ex-ante. The City of Glasgow Bank had been
allowed to fail in 1878, as well as the small banks just mentioned. On the other hand it had
certainly facilitated aid for Barings in its time of crisis in 1890, although whether this was
a bank bail-out, as currently understood, is still debated (see Ferguson(2008), Eichengreen
(2008) (p. 34), and Cassis (1994)). All joint-stock banks hastily invoked limited liability
protection soon after the failure of the City of Glasgow Bank, and all bank shareholders in
our sample are covered by limited liability.
In 1870 a total of 387 banks were operating in the United Kingdom (see Capie and
Rodrik-Bali (1982)). British banks were mainly commercial banks involved in various types
of business activities: they provided short-term credit to local firms and attracted deposits.6
4In fact, company law did not specify what organizations were ‘banks’ until passage of the 1967 Companies
Act (see Schooner and Taylor, footnote 47).5London and General Bank (1892), Dumbell’s Bank (1900), Carlton Bank (1901), Cheque Bank (1901),
Economic Bank (1905), London Trading Bank (1910), Birkbeck Bank (1911), and Civil Service Bank (1914).6In contrast to German banks British banks did not purchase large equity stakes in industrial concerns,
11
Towards the end of the nineteenth century the British banking industry experienced con-
siderable growth in M&A activity (see Figure 1). Between 1870 and 1921 there were 264
bank mergers (or ‘amalgamations’, as contemporaries referred to them). By 1920 only 75
banks were left in the U.K., of which just 20 were English or Welsh public (also known
as ‘joint-stock’) banks (see Capie and Rodrik-Bali (1982) and The Economist’s Banking
Supplement).
The purely domestic nature of the British banking market is useful, in that external
influence on the intermediation process is very limited. Only domestic banks operated branch
networks within England and Wales, although many foreign banks had a single branch in
London, as London was the world’s financial capital at the time. In addition English and
Welsh banks did not operate branches abroad (with the exception of two or three branches
just north of the Scottish border). The ‘Big 5’ banks set up some small subsidiaries in
Europe in the early 1910s, but no serious foreign expansion was undertaken until after the
end of World War One (see Jones (1982)).
Part of the rationale for the U.K. merger wave was technological progress. There was a
spread of financial and general journalism, along with improved accounting techniques and
the widespread publication of balance sheets (see Collins and Baker (2003)). These factors
provided broader access to information for prospective lenders. The expansion of railways,
telegraph, and (later) telephone lines and the spread of head office ‘best practice’ managerial
techniques (see Collins and Baker (2003)) brought the various British provinces ‘closer’ to
London. These technological improvements offered greater control by head office over a
dispersed branch network.
The merger wave was mostly characterized by London-based banks (and provincial banks
that had relocated to London) taking over other banks (see Sykes (1926)). Large provincial
banks would often take over a London-based bank which was a member of the clearing house
(in order to obtain clearing house membership), and then subsequently relocate to London.
In this way Barclays, Lloyds, and Midland Bank all became London-based. Over the period
nor would they lend at long durations for the acquisition of property, plant, and equipment (see Fohlin (1998)
and Collins and Baker (2003) p. 63).
12
1885 to 1905, takeovers of private and small targets were more common and the two merging
banks’ branch networks were usually geographically diverse.
The British consolidation process was almost entirely driven by voluntary mergers, al-
though a few smaller banks were taken over while in financial distress. After the outbreak
of World War One mergers required the assent of Treasury, which was always given. The
result of this process was the emergence of the ‘Big Five’ banks in Britain by 1918: Bar-
clays, Lloyds, Midland, National Provincial, and Westminster. The concentration of banking
power generated fears of increased monopoly power in the financial industry. The Report of
the Treasury Committee on Bank Amalgamations reported in April 1918 that: ‘there is at
present no idea of a Money Trust’ although ‘it appears to us not altogether impossible that
circumstances might produce something approaching to it at a comparatively early date.’
Scholars have defined the British banking industry after the merger wave was complete
as: ‘a highly cartelised and rigid system’ (Griffiths (1973) p. 3, see also Capie and Billings
(2004)). On April 14, 1919, the government presented to Parliament the Joint Stock Banks
Amalgamation Bill.7 If approved the bill would have made mergers subject to the approval of
the Board of Trade and Treasury, forbidden interlocking directorships, and banned the sale
of any bank assets to a rival bank. Discussion of legislation restricting mergers proceeded
for years in Parliament (e.g., November 19, 1919, April 13, 1921, and February 26, 1924)
although none was ever passed.
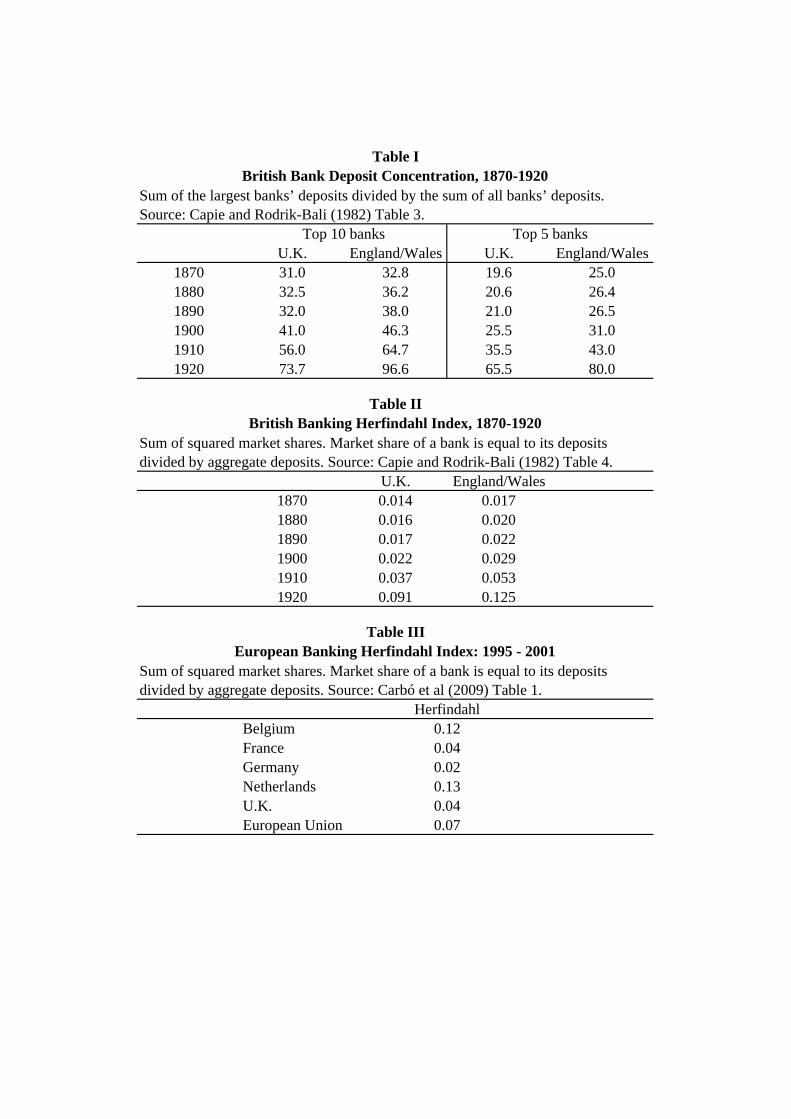
Table I shows that in 1880 the top 5 banks in England and Wales held 26.4% of deposits
this figure increased to 80% by 1920, while the deposit share of the top 10 banks rose from
36.2% to 96.6%. The deposits Herfindahl index, one measure of industry concentration,
increased from 0.020 in 1880 to 0.125 in 1920 for England and Wales (see Table II). In 1880
the U.K. banking system resembled the dispersed system of Germany in the late 1990s (see
Table III), whereas by 1920 the British system was closer to countries that have a high
contemporary degrees of concentration, such as Belgium and the Netherlands.
7Hansard record of parliamentary proceedings (available at hansard.millbanksystems.com).
13
4 Data and Method
We collect data on the loan registers of banks from the archives of HSBC, Lloyds, and
Royal Bank of Scotland. These loans were usually considered by the board of directors,
if the bank was small, or by a branch manager or loan committee, for larger banks. The
vast majority of loans in the register were approved. This is probably due to one of two
scenarios. First, borrowers who would have (with high likelihood) been denied a loan by
the bank, if an application were made, may have self-censored and failed to apply for a
loan. Second, verbal enquiries about obtaining a loan had been denied at the lower levels
of bank management and consequently no paperwork was submitted to the branch manager
or board of directors. We have collected 25,990 loans from 41 banks, ranging from the very
small (Altwood Spooner with 19 loans) to the very large (Barclays, 4484 loans; Lloyds, 1940
loans; and London City and Midland Bank, 2099 loans). The loan registers cover branches
in 34 of the 54 counties of England and Wales. The loans we observe are determined by the
survival of archival records. Nonetheless, we have good sample sizes in most of the larger
counties. We observe 4497 loans from Lancashire (Liverpool and Manchester), 6356 from
Middlesex (London), 1279 from Warwickshire (Birmingham), and 3501 from the West Riding
of Yorkshire (Bradford, Leeeds, and Sheffield).
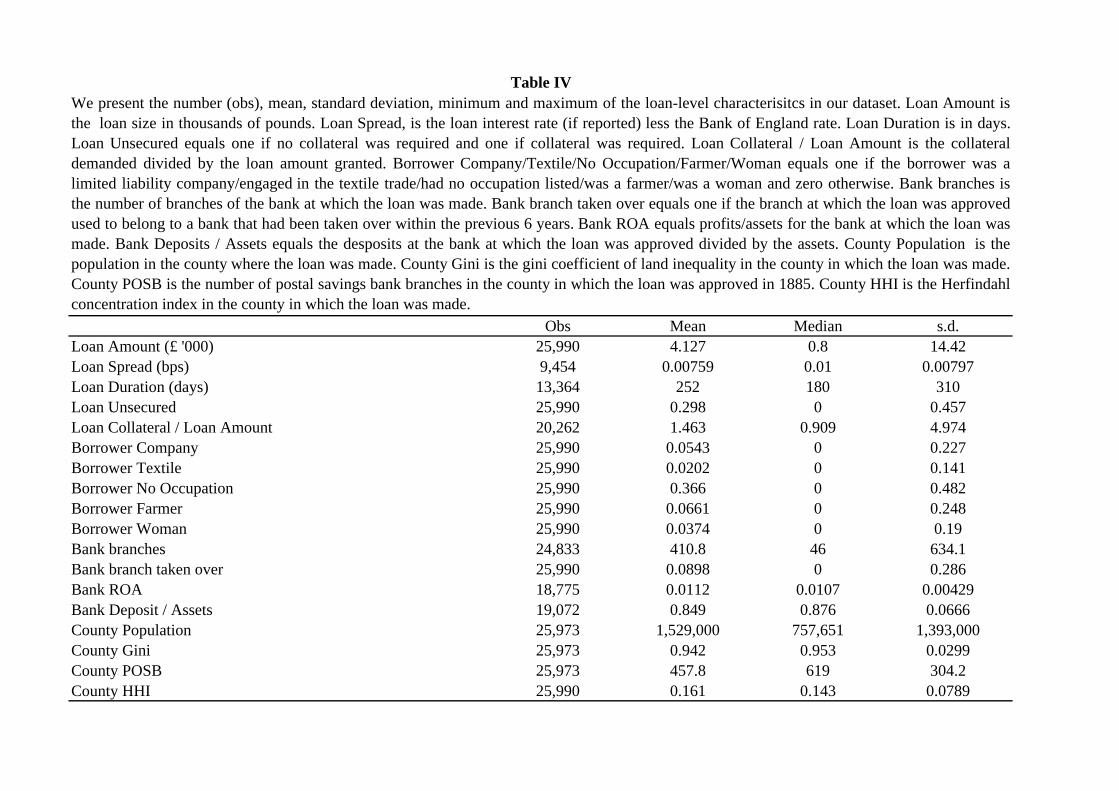
In Table IV we report summary statistics of the loan data. The average loan size was
4.1 thousand pounds, with a minimum loan size of £1 and a maximum of £500,000. The
average, reported, loan spread was 76 basis points over the Bank of England rate, although
only a little over 36% of loans reported an interest rate. The average loan duration was
of 217 days. Roughly 70% of all loans required collateral to be posted, with the average
collateral requirement being 146% of the loan size. 5.4% of our borrowers were limited
liability companies, 2% were individuals or firms engaged in the textile trade, 6.6% were
farmers and 3.7% were females. 36.6% of the borrowers had no occupation stated in the
bank’s records. This may have been because the bank did not record that information,
or perhaps because the borrower was a lord, gentleman, or esquire, with no occupation as
such but inherited wealth. The average HHI banking concentration index in the county in
14
which the loan was made was 0.161. The average loan was approved by a bank with 411
branches, with a minimum network size of 1 branch and a maximum of 1858 branches. The
average return on assets (ROA) of banks making loans was a little over 1.1% with a standard
deviation of 0.4%. The average loan was granted by a bank with deposits comprising 84.9%
of assets, with a standard deviation of 6.7%. In terms of land ownership concentration, the
average Gini coefficient of the county in which a loan was made was 0.94, and ranged from
0.81 to 0.98.
Data on bank profitability, assets, liabilities and the branch network were retrieved from
London Banks and Kindred Companies, The Banker’s Magazine, and The Banking Almanac.
We obtain balance sheet information from The Economist’s banking supplement, published
semi-annually in May and October. We construct the entire branch networks for all banks
in England and Wales annually between 1885 and 1925, at annual frequency.
We place each bank branch into one of the 54 historic counties of England and Wales,
using the Association of British Counties’ Gazetteer of British Place Names.8
We collect county level data on employment, population, land area, and rainfall. The
employment, population data, and county area data come from Lee (1979). The data on
rainfall are obtained from the Met Office Hadley Centre Observation Data.9
4.1 Instruments
Both bank concentration (County HHI) and the probability of a particular bank being taken
over can affect credit extension and the economy more generally. A natural concern is that
all financial and economic factors are jointly determined or perhaps correlated with some
omitted variables that are also likely to affect credit extension and the economy (see Berger et
al. (2004) for an overview of endogeneity concerns within the bank concentration literature).
In order to address possible endogeneity issues, we use two instrumental variables that we
argue are exogenous: land inequality at the county level and the number of Post Office
Savings Bank branches.
8www.gazetteer.co.uk. We treat the North, East, and West Ridings of Yorkshire as separate counties.9http://www.metoffice.gov.uk/hadobs/hadukp/data/download.html
15
Our historical measure of county-level land inequality is based upon John Bateman’s
The Great Landowners of Great Britain and Ireland. The government publication Return of
Owners of Land, 1873 was a compilation of all landholdings of 1 acre or over which Bateman
verified, corrected, and aggregated to the county level in his 1883 book.10 As Bateman’s land
ownership data are so temporally close to the beginning of our data sample we need to treat
them with some care. Clearly, land ownership in 1873 could have been influenced by economic
and financial conditions then existing in Britain. However, landownership in Britain at the
end of the nineteenth century appears to have had strong historical determinants and its
concentration is related to events that happened during the Middle Ages.
Land tenure in England and Wales was completely restructured by William the Conqueror
in the years after the Norman conquest of 1066. He introduced a feudal system to Britain, and
directly allocated virtually all land in England as rewards for his knights, retainers, and clergy
(see Posner (1990) p.4). The Domesday Book was a land survey undertaken on William’s
orders in 1086. Its purpose was to determine taxation, land holdings, and their values. Every
landowner in 34 counties of England were surveyed.11 The distributed land varied largely
in the size of acres and its allocation was often done with the intention of placing powerful
Norman knights in strategic locations to ensure England remained pacified. Land stakes were
inherited and passed on from generation to generation, driven by primogeniture, in which
the first born male child typically inherited the entire estate (see May (1987) p. 74). This
created a class system that was fairly stable and based upon land owning (see Thompson
(1963) and Daunton (1995) pp. 65-9). Measures of land concentration in England in 1086
and 1873 are strongly related. A regression of county level land ownership HHI in 1873 on
the land ownership HHI in 1086 yields a slope coefficient of 0.27 with an associated t-statistic
of 3.51.12
10Bateman grouped landowners into Peers, Great Landowners, Squires, Greater Yeomen, Less Yeomen,
Small Proprietors, and Cottagers depending on the size of their land holding.11Counties in Wales and the North of England were not included in the Domesday Book since they had
not at that stage been conquered by the Normans.12This regression has 34 counties as observations. We assume that land ownership within a county-group
in 1873, e.g. Peers in Bedfordshire is equally distributed.
16
Land ownership appears to have determined banking in a county through both the supply
of deposits and collusion with local aristocrats. Pressnell (1956), in writing about country
banking during the Industrial Revolution, says that (p.247): ‘the aristocracy and the local
gentry sometimes kept accounts with local banks, but these were often supplementary, if
not subordinate, to accounts maintained with some London banker’. In highly concentrated
land ownership counties there tended to be a small group of very wealthy landowners. These
landowners (often aristocrats) tended to bank more with London-based banks, reducing
the supply of deposits to local banks. Cannadine (1973) writes that it was ‘West End’
(ie. London) banks that (p. 635): ‘limited their activity to ‘the landowning groups”. He
also notes the strong financial connections between wealthy landowners and (London-based)
insurance companies, rather than local banking interests. To diversify their portfolio, in an
era with no deposit insurance, wealthy landowners would have had an incentive to send their
money to London where it could have been invested in several banks as well as used to build
an equity and bond portfolio on the London Stock Exchange (see Daunton (1995) p. 346).
A lower supply of deposits would have led to fewer banks being active in those counties,
leading to a more concentrated local banking system as compared to those counties where
land was more equally divided.
In the nineteenth century banks collected taxes at the local level on behalf of the Crown.
It was a lucrative activity as banks could earn interest on the taxes between the collection
date and its remittance to London (often many months later). This system provided in-
centives for landowners to collude with banks. Banks could have been helped to maintain
a local monopoly in exchange for more flexibility for the landlords to make their tax pay-
ments. In counties with more concentrated land ownership the large landowners would have
had proportionally more influence. One example of such cooperation is a deal undertaken in
the county of Rutland between a local banker and the Duke of Rutland (see Pressnell (1956)
p. 69): ‘The mayor is the son of Mr. Mortlock, a banker here, who, having command of the
Corporation, is himself a humble friend of the Duke of Rutland, through whom he has pro-
cured for himself the Receivership General of the Salt Office . . . for another son (the Mayor)
the Auditorship of Excise, for another son the distribution of stamps.’ Bankers also exerted
17
influence through holding public office in their local communities (see Pressenll (1956) p.
240): ‘Social prestige . . . was supported by the wide participation of bankers in public life,
especially at the local level the reports named many bankers as aldermen, some as mayors,
others as holders of privileged positions, a few as local ‘bosses’.’ We would therefore expect
that in counties with more concentrated land ownership, that is more concentrated political
power, we should expect a more concentrated banking system and the probability of bank
takeovers would be lower.
We use the number of Post Office Savings Bank (POSB) branches in a county as an
instrument for the take-over probability faced by an individual bank. A recently taken
over bank (branch) might have had systematically different lending practices compared to
those that were not taken over. In order to address this issue, and hence avoid potential
selection biases, we construct a measure that uses the number of POSB branches within a
country in the year 1885, the starting year of our sample period. The POSB system was
established in 1861 to attract the deposits of the less well-off in society, with a maximum
annual deposit of 30 allowed. Their business model was to attract small scale deposits and
invest them in the national debt. The growth of POSBs was rapid, by 1891 there were 5.8
million depositors (see Rubinstein (1986) p. 92). These activities were not related to the
lending market of a particular county and therefore reflected deposit opportunities only, in
line with the reasoning of Canales and Nanda (2012). A county with many POSBs is one
that was probably ‘underbanked’ and attractive for a commercial bank to enter, either via
establishing its own branch network on taking over currently existing banks. A commercial
bank in a county with many POSB branches in 1885, may have a higher probability of being
taken over than if it were in a county with fewer POSB branches.
18
5 Results
5.1 Loans
To measure the impact of bank concentration on the financial sector we first examine how
banks’ loan making decisions were affected by changing concentration in a particular county.
We first run ordinary least squares of various loan characteristics on County HHI using
borrower, bank, and county level controls. A loan decision is a joint determination by
the bank and customer on the amount, interest rate, collateral, and duration of the loan.
Since these four loan characteristics are determined as part of a package, we run separate
regressions of each characteristic on County HHI and the controls. County HHI is itself
clearly an endogenous variable for the British financial sector, which we will address with
an instrumental variables approach in the next section. Therefore, these OLS results need
to be treated with a great deal of caution.
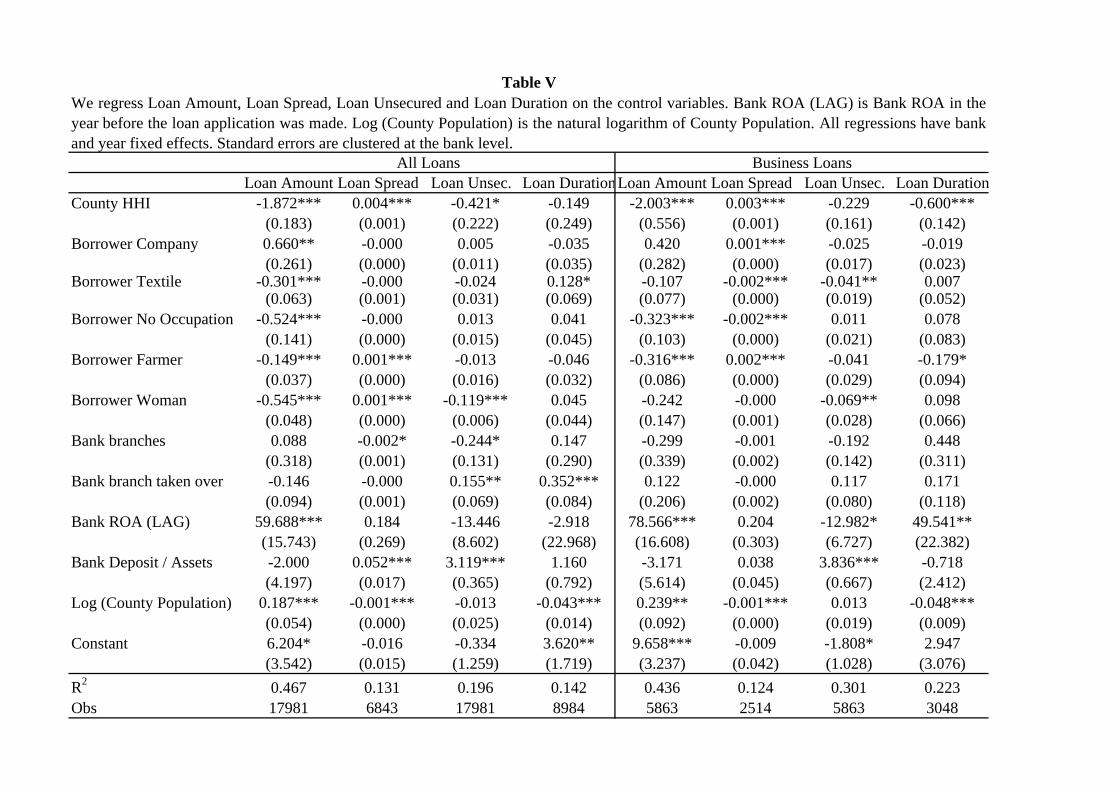
We first consider all loans jointly, in columns (1) through (4) of Table V, and then the
subset of business loans in columns (5) through (8). We define a business loan as one that
is granted to either a business partnership or to a limited liability company. We see that
counties with higher levels of bank concentration are those in which loans are of a smaller
amount, interest rate spreads are higher, and fewer unsecured loans are made. A 1% increase
in County HHI is associated with a loan that is 0.84% smaller and a spread that is 0.004%
higher. A one standard deviation increase in County HHI makes a loan 3.3% less likely to be
unsecured. Of the controls, companies were likely to get loans that were £660 larger than
individuals. Borrowers in the textile industry, farmers, and women tended to be granted
smaller loans, as were borrowers without a stated occupation. More profitable banks were
associated with larger loan amounts, and loans in the more populous counties were of larger
amounts. Loan spreads tended to be higher for farmers, and female borrowers, as well as for
banks that had fewer branches and relied more on deposits. Spreads were on average lower
in the more populous counties. Collateral for a loan was more likely to be required for female
borrowers, and by banks with fewer branches and less reliance on deposits. The branches of
banks that had been taken over in the previous six years, and who often retained substantial
19
decision making power via the retention of the previous management as ‘local directors’ were
less likely to demand collateral and more likely to extend loans of a longer duration than
an equivalent branch that had not been recently acquired. If we just consider the business
loans we see broadly similar results. Increased County HHI is again associated with less
generous loan conditions. Loans tend to be for smaller amounts, with higher spreads, and for
shorter durations than equivalent loans in counties with low levels of banking concentration.
Together these results lend support to the traditional argument that higher levels of bank
concentration are bad for borrowers.
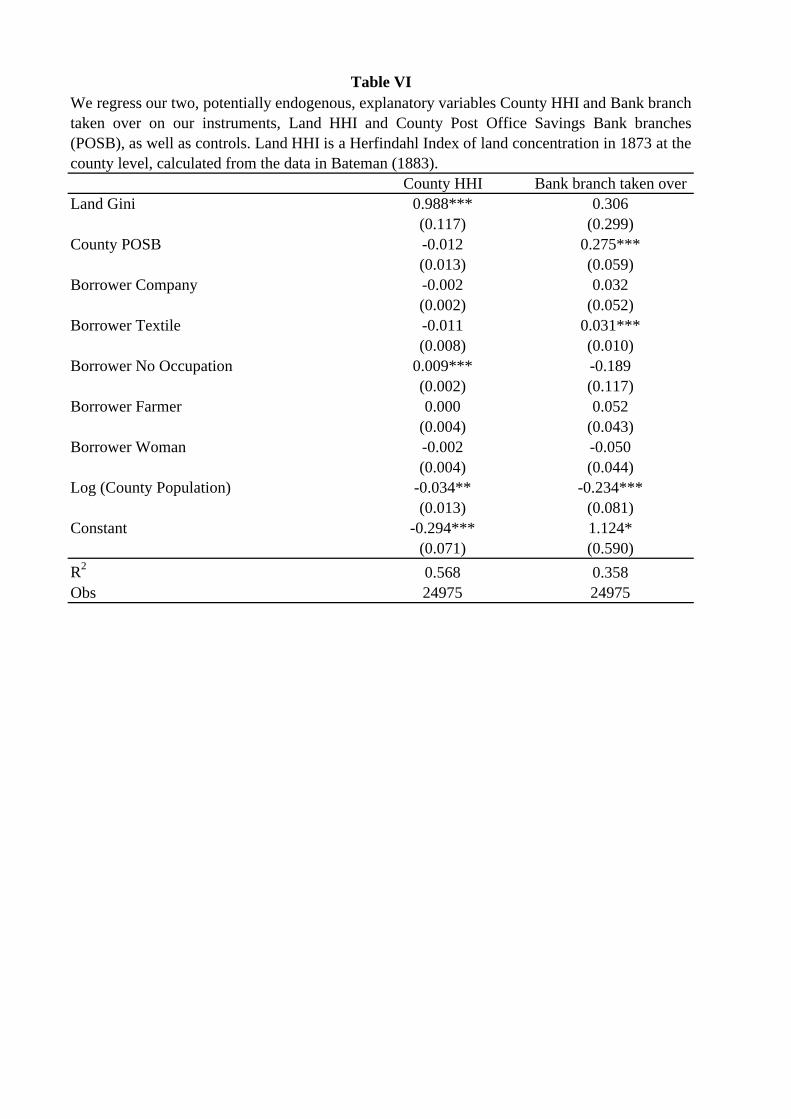
In Table VI we present the results of our first stage instrumental variables regression. In
column (1) We see that the measure of banking concentration in the local county, County
HHI, of each loan is strongly positively associated with concentrated land ownership, Land
Gini. Counties with more concentrated land holdings tend to be those with more concen-
trated banking sectors. In column (2) we see that an indicator variable measuring whether
or not the branch that made a loan was taken over in the previous six years is positively
associated with the number of POSBs in the county. Banks located in deposit rich counties
were more likely to be take over targets, conditional on the characteristics of the borrowers
and the county.
In the second stage of our two-stage least squares regression we regress the various char-
acteristics of the loans in our sample on the fitted values of County HHI and Bank branch
taken over as well as appropriate controls. In general, using instrumental variables makes
our results stronger. A 1% increase in County HHI is associated with a loan that is also 1%
smaller and a spread that is 0.017% higher. A one standard deviation increase in County
HHI makes a loan 7.9% less likely to be unsecured with collateral. When we turn to the
results purely for business loans (columns (5) through (8)) we see broadly similar results,
although the coefficient on loan spread is no longer statistically significant, although the
coefficient showing the higher bank concentration is associated with shorter duration loans
becomes significant at the 5% level. In both the OLS and 2SLS results there is strong
evidence that female borrowers receive worse loan terms than male borrowers, at least con-
ditional on observed characteristics. The estimated effect of a branch being taken over on
20
its credit extension decisions does not appear to be great, with the notable exception that
branches that were recently taken over tend to make loans to business customers almost two
thousand pounds larger than branches that were not recently taken over. As with Table V
all regressions use bank and year fixed effects.
5.2 Balance Sheets Analysis
In this section, we infer the aggregate changes in bank behaviour by measuring the impact
of bank concentration on banks’ balance sheets. We present the aggregate ratios across all
public banks that operated in England and Wales in Figure 1.13 Loans over assets declined by
about 10 percentage points over our sample period, whereas cash over assets and investments
over assets increased by about 5 percentage points. Book and market capital ratios halved
during the sample period, from 28% of assets to 14% and from 20% to 10% respectively. By
the end of the period banks’ capital ratios were very close to modern U.S. capital ratios (see
Berger et al., 2008).14 Such a large decline in capital ratios could be due to the geographic
expansion of the banking activity and the risk diversification benefits such an expansion
brought to banks. Alternatively, the decline in capital ratios may be due to other factors.
Grossman (2007) documents a decline in banks’ capital ratios in 12 developed countries over
roughly the same time period. He attributes some of this decline to a decline in economic
risk during the gold standard.
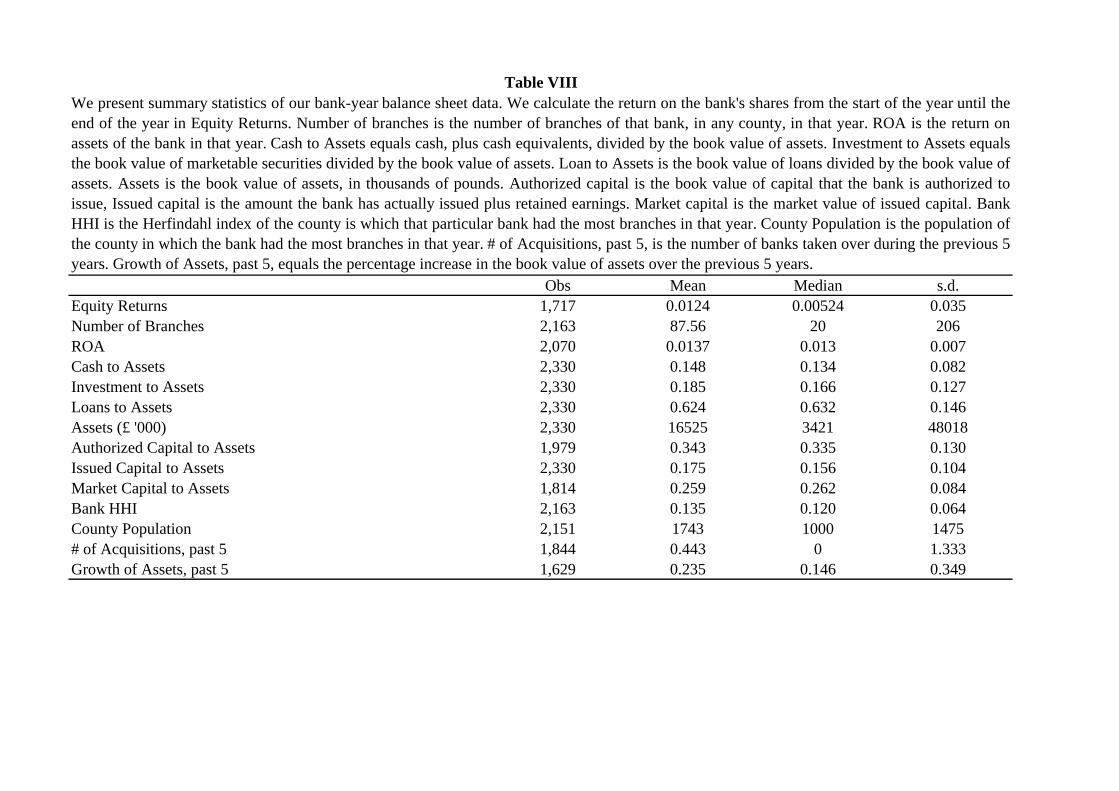
Table VIII reports summary statistics of the bank-year data we have collected on balance
sheets. The mean return on a bank’s equity was 1.2% per year, excluding dividends, with a
standard deviation of 3.5%. The mean bank had 87 branches, although there is high skewness
in the data, since the median is just 20 branches. Banks’ earned 1.4% on their assets, on
average, with a standard deviation of 0.7%. On average banks held 14.8% of their assets as
cash, or cash equivalents, 18.5% was held as marketable securities, and 62.4% was extended
as loans. The average level of assets, across all bank-years, is 16.5 million. There is a lot of
13These data include all public banks that reported their balance sheets (a handful of small public banks did
not report balance sheet data). The data exclude private banks and all other non-bank financial institutions.14Neither our figures nor the figures presented by Berger et al. take into account off balance sheets items.
21
skewness in assets both across time and across banks, and the median level of assets is £3.4
million. Banks had authorization to issue capital up to 34.3% of their assets, on average,
although roughly half of this was unpaid. The average level of issued capital, plus retained
earnings, was 17.5%. The average bank had a market capitalization to assets ratio of 25.9%,
with the median roughly the same. We calculate Bank HHI, which is the Herfindahl index
of county-level bank concentration in the county in which the bank had its largest number
of branches in that year. The mean figure of this across bank-years was 0.135. The mean
bank had taken over 0.44 banks within the previous five years, with a standard deviation of
1.33.
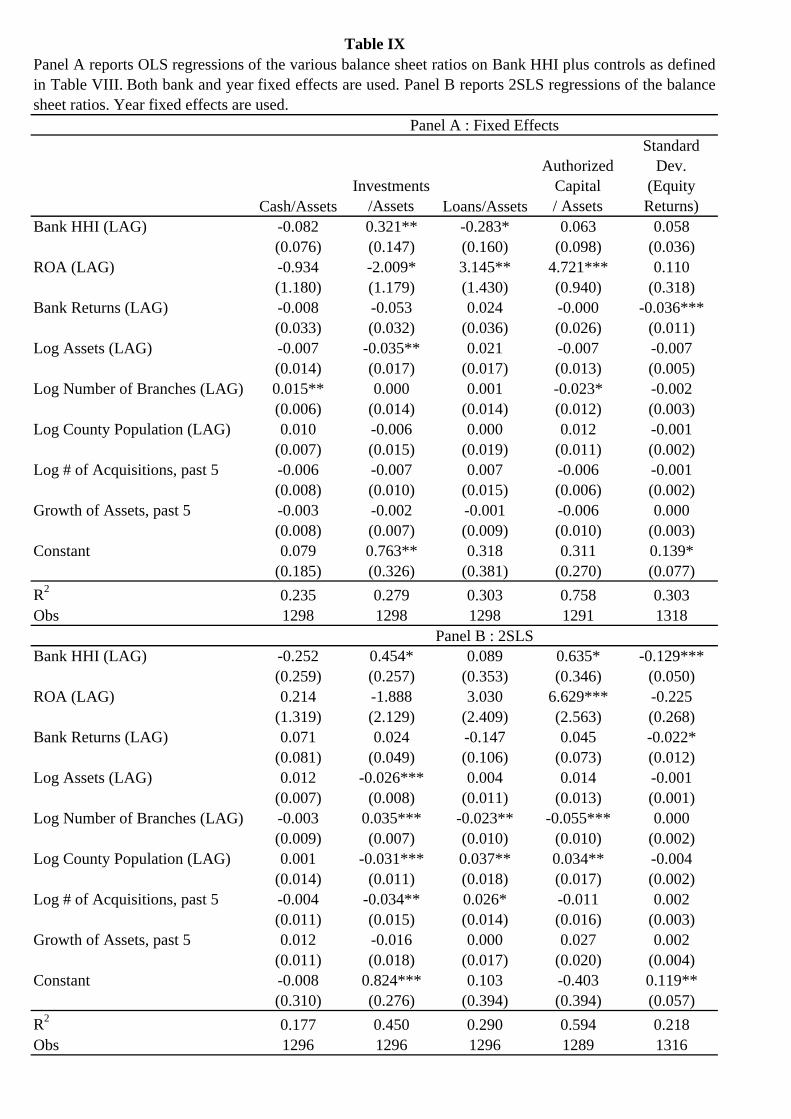
In Table IX, panel A, we show the OLS results (which include year and bank fixed
effects) and in panel B we present two stage least squares (2SLS) estimates, where we use
Land Gini and the number of POSBs in 1885 as instruments for Bank HHI. The results
indicate that banks in more concentrated markets tended to reduce their cash holdings,
although the estimates are not statistically significant. Concentration acted to increase
the share of safe, marketable investments (often government bonds and blue-chip railroad
bonds) in a bank’s balance sheet, and the effect is statistically significant in both the OLS
and 2SLS regressions. In more concentrated markets loans decrease as a share of assets in
the OLS (fixed effects) regression, although the result disappears once we instrument for
concentration. The economic effects are sizeable; the fixed effects results indicate that a
one standard deviation increase in Bank HHI results in a 2 percentage point (11%) increase
in the investments ratio, and a 2 percentage point (3%) decrease in the loans ratio. Given
that investment portfolios were heavily weighted towards (low risk) government bonds, the
dominating effect of more concentration seems to be less risk taking, since less credit was
extended via loans. The control variables for the 2SLS results indicate that a one standard
deviation increase in the log of the number of branches where the bank had branches is
associated with roughly a 8 percentage point decrease (25%) in the authorized capital ratio.
In the last column of panels A and B we regress the standard deviation of monthly equity
returns in years t, t+1, and t+2 on lagged Bank HHI and some controls. The 2SLS results
suggest that as Bank HHI increased the standard deviation of that bank’s returns decreased.
22
A standard deviation increase of Bank HHI reduces the standard deviation of returns by
about 37%. We obtain similar results for capital ratios. A standard deviation increase of
Bank HHI leads to an increase of 4 percentage points (12%) in the authorized capital ratio.
In conclusion, increased bank concentration was associated with fewer loans and increased
holdings of government debt, which was likely to have had a net effect of lowering bank risk
taking. No major British banks failed during the period of our study (or indeed during
the twentieth century), and although the merger wave and the development of a national
branching system resulted in lower capital ratios, it also influenced banks to hold fewer risky
assets. There is also some evidence that banks that operated in more concentrated markets
had less risky equity.
5.3 Economic Effects
We now turn to the economic effects of the large increase in bank concentration. We regress
employment to population ratios in 1891, 1901, 1911, and 1921 on our measure of bank-
ing concentration, County HHI, and controls for county land area, rainfall in the county,
population, and whether or not the county is in England or Wales in Table X. The OLS
regressions, with county fixed effects, show that counties with a more concentrated banking
market have lower employment to population ratios. This negative effect remains once we
instrument for County HHI, although it loses statistical significance. We then investigate
whether banks economized on customer service, which we proxy by the average number of
people in a county served per branch. Counties that have a more concentrated banking sector
are less well served by the banking sector (more people per branch) in the OLS regressions,
although again the effect loses statistical significance once we instrument for County HHI.
We then measure county economic performance according to the income tax revenue that
was collected by the government. Income was generally taxed at a flat rate, roughly 5%,
and there was a threshold (quite high) below which no tax was paid. We interpret higher
tax revenues as indicating a stronger economic performance in that county in a particular
year. Data on income taxes are somewhat sporadically available, with all counties and all
23
schedules being reported from 1884-85 until 1894-95. Thereafter, schedules A and B were
reported for all counties from 1895-96 until 1899-1900 and again in 1910-11. Schedule D is
reported only for 14 or 15 counties per year from 1895-96 until 1910-11. Counties with the
largest absolute tax changes were reported, which in practice means that it is typically the
largest counties for which we have data on a fairly comprehensive basis.
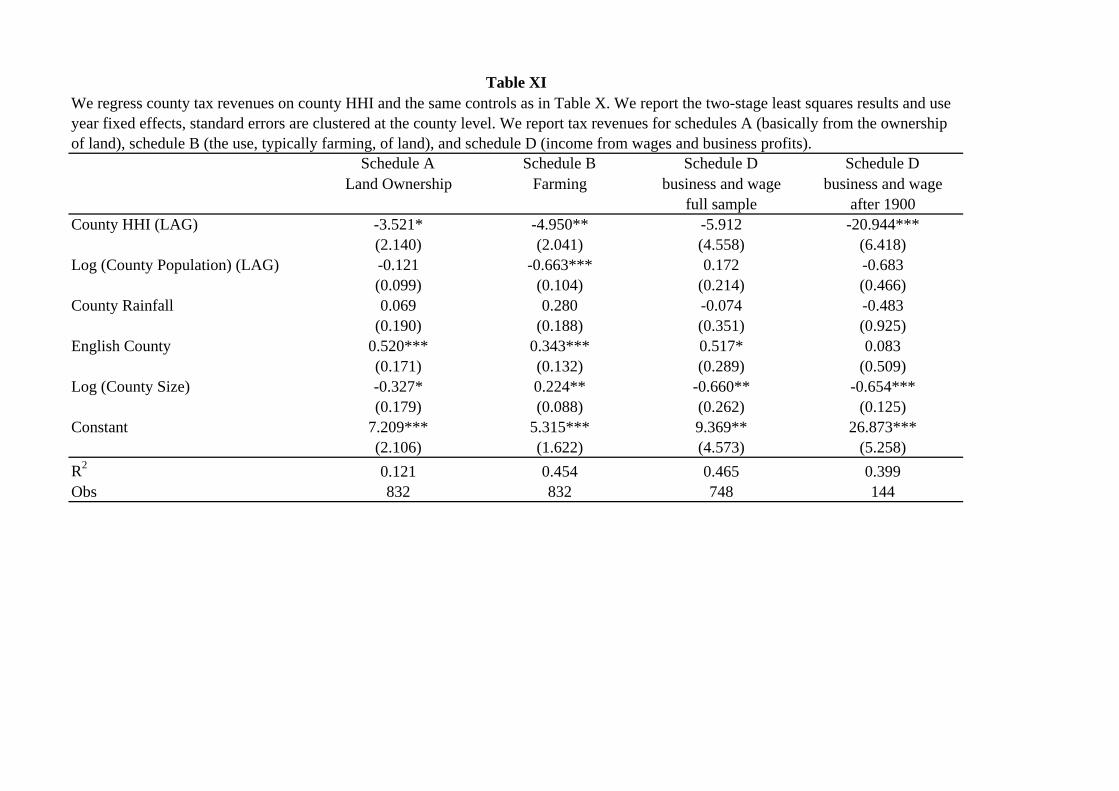
In Table XI we run two-stage least squares of tax revenue on County HHI and various
controls. We see statistically significant negative effects of bank concentration on the rural
economy (both schedules A and B). It appears that in counties with high levels of bank
concentration credit was not given as freely to farmers (Tables V and VII) and that this
curtailment of credit was harmful to the rural economy. A possible counter argument could be
that banks were redirecting their lending away from the traditional rural sector towards the
industrial sector as the second industrial revolution technologies of chemicals, automobiles,
and electricity took off. We find no evidence in support of stronger growth in wages and
business tax revenue in counties with high bank concentration (Schedule D), and after 1900
some evidence that Schedule D tax revenue fell in highly concentrated banking markets.
This lends some support to the claim of Kennedy (1987) that the financial sector ‘failed’
Victorian-era Britain.
6 Conclusion
We present a suite of results that strongly support the idea that a more concentrated banking
sector is bad for borrowers, and bad for the economy in which the bank operates. Counties
that experience higher bank concentration tend to be those with lower loan sizes granted,
alongside higher interest rates and more demands for collateral. The duration of loans in
those counties is also typically shorter. Banks respond to increasing concentration by holding
more marketable securities, which are typically low risk government bonds, and holding less
of their assets as loans. The effect in the local county is also generally negative. Increasing
concentration is weakly associated with declining employment to population ratios, lower
tax revenues, and fewer branches per head of population. In the low regulation environment
24
of turn of the twentieth century England and Wales the merger wave, which drove banking
concentration substantially higher, resulted in bad outcomes for the clients of banks and the
local economy.
25
References
[1] Akhavien, Jalal, Allen Berger, and David Humphrey, The Effects of Megamergers on
Efficiency and Prices: Evidence from a Bank Profit Function, Review of Industrial
Organization, 12, pp. 95139, 1997
[2] Agarwal, Sumit, Efraim Benmelech, Nittai Bergman, and Amit Seru, Did the Commu-
nity Reinvestment Act (CRA) lead to Risky Lending?, NBER Working Paper 18609,
2012.
[3] Barth, James, Gerard Caprio, Jnr., and Ross Levine, Rethinking Bank Regulation: Till
Angels Govern, Cambridge University Press, New York, 2006.
[4] Bateman, John, The Great Landowners of Great Britain and Ireland, Harrison, London,
1883.
[5] Beck, Thorsten, Asli Demirguc-Kunt, and Vojislav Maksimovic, Bank Competition and
Access to Finance: International Evidence, Journal of Money, Credit, and Banking,
36(3), pp. 627–648, 2004.
[6] Benmelech, Efraim and Tobias Moskovitz, The Political Economy of Financial Reg-
ulation: Evidence from U.S. State Usury Laws in the 19th Century, The Journal of
Finance, 65(3), pp. 1029-1073, 2010.
[7] Becker, Bo, Geographical segmentation of U.S. capital markets, Journal of Financial
Economics, 85, pp. 151178, 2007.
[8] Bekaert, Geert, Campbell Harvey, and Christian Lundblad, Does financial liberalization
spur growth?, Journal of Financial Economics, 77, pp. 355, 2005.
[9] Berger, Allen and Timothy Hannan, The Price-Concentration Relationship in Banking,
The Review of Economics and Statistics, 71(2), 291-99, 1989.
26
[10] Berger, Allen, Anthony Saunders, Joseph Scalise, Gregory Udell, The eects of bank
mergers and acquisitions on small business lending, Journal of Financial Economics,
50, pp. 187-229, 2005.
[11] Black, Sandra, and Philip Strahan, Entrepreneurship and Bank Credit Availability, The
Journal of Finance, 57(6), pp. 2807-33, 2002.
[12] Bonaccorsi Di Patti, Emilia and Giorgio Gobbi, Winners or Losers? The Effects of
Banking Consolidation on Corporate Borrowers, The Journal of Finance, 62(2), pp.
669-695, 2007.
[13] Boyd, John, and Gianni de Nicolo, The Theory of Bank Risk Taking and Competition
Revisited, The Journal of Finance, 60(3), pp. 1329-43, 2005.
[14] Capie, Forrest and Ghila Rodrik-Bali, Concentration in British Banking, 1870-1920,
Business History, Vol. 24, pp. 280-292, 1982.
[15] Cannadine, David, Aristocratic Indebtedness in the Nineteenth Century: The Case
Re-opened, The Economic History Review, Vol. 30(4), pp. 624-50, 1977.
[16] Capie, Forrest and Mark Billings, Evidence on Competition in English commercial bank-
ing, 1920-1970, Financial History Review, Vol. 11(1), pp. 69-103, 2004.
[17] Cassis, Youssef, City Bankers: 1890-1914, University Press, Cambridge, 1994.
[18] Cetorelli, Nicola, Real Effects of Bank Competition, Journal of Money, Credit, and
Banking, 36(3), pp. 543-58, 2004.
[19] Cetorelli, Nicola, and Philip Strahan, Finance as a Barrier to Entry: Bank Competition
and Industry Structure in Local U.S. Markets, The Journal of Finance, 61(1), pp. 437-
Sum of squared market shares. Market share of a bank is equal to its deposits divided by aggregate deposits. Source: Capie and Rodrik-Bali (1982) Table 4.
Table IBritish Bank Deposit Concentration, 1870-1920
Sum of the largest banks’ deposits divided by the sum of all banks’ deposits.Source: Capie and Rodrik-Bali (1982) Table 3.
Table IVWe present the number (obs), mean, standard deviation, minimum and maximum of the loan-level characterisitcs in our dataset. Loan Amount isthe loan size in thousands of pounds. Loan Spread, is the loan interest rate (if reported) less the Bank of England rate. Loan Duration is in days.Loan Unsecured equals one if no collateral was required and one if collateral was required. Loan Collateral / Loan Amount is the collateraldemanded divided by the loan amount granted. Borrower Company/Textile/No Occupation/Farmer/Woman equals one if the borrower was alimited liability company/engaged in the textile trade/had no occupation listed/was a farmer/was a woman and zero otherwise. Bank branches isthe number of branches of the bank at which the loan was made. Bank branch taken over equals one if the branch at which the loan was approvedused to belong to a bank that had been taken over within the previous 6 years. Bank ROA equals profits/assets for the bank at which the loan wasmade. Bank Deposits / Assets equals the desposits at the bank at which the loan was approved divided by the assets. County Population is thepopulation in the county where the loan was made. County Gini is the gini coefficient of land inequality in the county in which the loan was made.County POSB is the number of postal savings bank branches in the county in which the loan was approved in 1885. County HHI is the Herfindahlconcentration index in the county in which the loan was made.
Table VWe regress Loan Amount, Loan Spread, Loan Unsecured and Loan Duration on the control variables. Bank ROA (LAG) is Bank ROA in theyear before the loan application was made. Log (County Population) is the natural logarithm of County Population. All regressions have bankand year fixed effects. Standard errors are clustered at the bank level.
All Loans Business Loans
County HHI Bank branch taken overLand Gini 0.988*** 0.306
(0.117) (0.299)County POSB -0.012 0.275***
(0.013) (0.059)Borrower Company -0.002 0.032
(0.002) (0.052)Borrower Textile -0.011 0.031***
(0.008) (0.010)Borrower No Occupation 0.009*** -0.189
Table VIWe regress our two, potentially endogenous, explanatory variables County HHI and Bank branchtaken over on our instruments, Land HHI and County Post Office Savings Bank branches(POSB), as well as controls. Land HHI is a Herfindahl Index of land concentration in 1873 at thecounty level, calculated from the data in Bateman (1883).
Table VIIWe regress Loan Amount, Loan Spread, Loan Unsecured and Loan Duration on the fitted values of County HHI and Bank branch taken over aswell as controls. All regressions have bank and year fixed effects. Standard errors are clustered at the bank level.
All Loans Business Loans
Obs Mean Median s.d.Equity Returns 1,717 0.0124 0.00524 0.035Number of Branches 2,163 87.56 20 206ROA 2,070 0.0137 0.013 0.007Cash to Assets 2,330 0.148 0.134 0.082Investment to Assets 2,330 0.185 0.166 0.127Loans to Assets 2,330 0.624 0.632 0.146Assets (£ '000) 2,330 16525 3421 48018Authorized Capital to Assets 1,979 0.343 0.335 0.130Issued Capital to Assets 2,330 0.175 0.156 0.104Market Capital to Assets 1,814 0.259 0.262 0.084Bank HHI 2,163 0.135 0.120 0.064County Population 2,151 1743 1000 1475# of Acquisitions, past 5 1,844 0.443 0 1.333Growth of Assets, past 5 1,629 0.235 0.146 0.349
Table VIIIWe present summary statistics of our bank-year balance sheet data. We calculate the return on the bank's shares from the start of the year until theend of the year in Equity Returns. Number of branches is the number of branches of that bank, in any county, in that year. ROA is the return onassets of the bank in that year. Cash to Assets equals cash, plus cash equivalents, divided by the book value of assets. Investment to Assets equalsthe book value of marketable securities divided by the book value of assets. Loan to Assets is the book value of loans divided by the book value ofassets. Assets is the book value of assets, in thousands of pounds. Authorized capital is the book value of capital that the bank is authorized toissue, Issued capital is the amount the bank has actually issued plus retained earnings. Market capital is the market value of issued capital. BankHHI is the Herfindahl index of the county is which that particular bank had the most branches in that year. County Population is the population ofthe county in which the bank had the most branches in that year. # of Acquisitions, past 5, is the number of banks taken over during the previous 5years. Growth of Assets, past 5, equals the percentage increase in the book value of assets over the previous 5 years.
Table IXPanel A reports OLS regressions of the various balance sheet ratios on Bank HHI plus controls as definedin Table VIII. Both bank and year fixed effects are used. Panel B reports 2SLS regressions of the balancesheet ratios. Year fixed effects are used.
Table XWe regress county employment to population ratios on County HHI (lagged), the log of County Population (lagged), as well as controls for the annual rainfall in that year, an indicator variable of whether the county is in England (1) or in Wales (0), and the log of county size (in acres). The OLS regressions use county fixed effects, both regressions use year fixed effects. In both regressions the standard errors are clustered at the county level.
Employment to Population Ratio Population to Branches Ratio
Schedule A Schedule B Schedule D Schedule DLand Ownership Farming business and wage business and wage
full sample after 1900County HHI (LAG) -3.521* -4.950** -5.912 -20.944***
Table XIWe regress county tax revenues on county HHI and the same controls as in Table X. We report the two-stage least squares results and use year fixed effects, standard errors are clustered at the county level. We report tax revenues for schedules A (basically from the ownership of land), schedule B (the use, typically farming, of land), and schedule D (income from wages and business profits).


![Building brand awareness in dynamic oligopoly marketsheuristic.kaist.ac.kr/cylee/xpolicy/termproject/08/[4]brand awareness.… · Oligopoly market Characteristic of Oligopoly market](https://static.documents.pub/doc/80x56/5ebda2b9fa9af9629303f297/building-brand-awareness-in-dynamic-oligopoly-4brand-awareness-oligopoly-market.jpg)


