16
Child Care Industry in South Dakota The Economic Impact of the

Child Care Industryin South Dakota
The Economic Impact of the
The Economic Impact of theCHILD CARE INDUSTRY IN SOUTH DAKOTA
A study funded by The Annie E. Casey Foundationand prepared by
Carole Cochran, SD KIDS COUNTThe University of South Dakota
Randy Stuefen, Research Director, Business Research BureauThe University of South Dakota
Kari Sandberg, SD KIDS COUNT InternThe University of South Dakota
November 2004
BUSINESS ADVISORY GROUP
Arnold Brown South Dakota State Senator
Suzy Braun Director, Early Childhood Partners
Vicki Byrne Professional Development Coordinator, New Horizons Consulting
Mary Cerney Director of Research and Marketing,Governor’s Office of Economic Development
Wade Druin Director, Business Research BureauThe University of South Dakota
Marlys Engebretson Director, Sioux Valley Child Care CenterPresident, South Dakota Association of Child Care Directors
Autumn Gregory Director, Early Childhood Connections
Francis Jack Child Care Coordinator, Oglala Sioux Tribe
Mike Keller Dean,The University of South Dakota School of Business
Darla Mayer Director, South Dakota Department of Social ServicesOffice of Management Services
Pat Monson Program Administrator South Dakota Department of Social ServicesOffice of Child Care Services
Susan Randall Executive DirectorSouth Dakota Coalition for Children
Kathrine Schnabel CRA Officer, CitiBank (South Dakota), N.A.
Gwen Simmons Chair, South Dakota Alliance for Children
TABLE OF CONTENTS
Section 1 Introduction . . . . . . . . . . . . . . . . . . . . . . . . . . . . . . . . . . . . . . . . . . . . . . . . .1
Section 2 Why Early Education Matters . . . . . . . . . . . . . . . . . . . . . . . . . . . . . . . . . .1
Section 3 Trends Affecting Child Care in South Dakota . . . . . . . . . . . . . . . . . . . . .2
Section 4 The Economic Impact of the Child Care Industry . . . . . . . . . . . . . . . . .7
Section 5 Conclusion . . . . . . . . . . . . . . . . . . . . . . . . . . . . . . . . . . . . . . . . . . . . . . . . . .9
Appendix A South Dakota’s Child Care Industry . . . . . . . . . . . . . . . . . . . . . . . . . . . .10
Appendix B Explanation of IMPLAN Input-Output Model . . . . . . . . . . . . . . . . . . . .10
Appendix C Assumptions to the South Dakota Estimates . . . . . . . . . . . . . . . . . . . .10
Thanks to the South Dakota Alliance for Children, whose vision is “to create a seamless, unified, high qualitychild care and early education system.”Thanks, also to Joy Smolnisky and Betsy Rice of the South DakotaCoalition for Children, and Nancy Nelson, South Dakota State Data Center, The University of South Dakota,who contributed to this report, and to Jane Page, Assistant Director, South Dakota Department of Revenue andRegulation who helped to clarify the South Dakota Sales and Use Tax Report for CY 2003, and to the Annie E.Casey Foundation for funding support.

1
SECTION 1
IntroductionLike agriculture, tourism and health
care, South Dakota’s child care industryis vital to the state’s economy. Child careproviders purchase services from otherindustries and many have significantinvestments in buildings. Child careworkers earn wages and pay taxes.
Perhaps most significantly, the childcare industry makes it possible forparents to work in agriculture, tourism,health care — and every other sector ofthe economy. It also prepares childrenfor future success in schools and theworkforce.
Common sense tells us the effects ofthe child care industry in South Dakotaare widespread. But common sensedoesn’t assess and quantify measurablepublic revenues of the industry.
With funding from the Annie E.Casey Foundation, the South DakotaKIDS COUNT project aims to do thathere. This document includes statisticaldata that quantifies the direct andindirect economic impact of the childcare industry in South Dakota.
It is the hope of all those associatedwith the project that this report will be afirst step in integrating child-careplanning into local, regional and stateeconomic development plans.Thoughtful collaboration among childcare specialists, economic developers,businesses, planners and public officialscan strengthen South Dakota’s economyand ensure the well-being of children.
SECTION 2
Why Early Education Matters1
In terms of brain development, thefirst three years of life are critical.Recent research shows that 85 percentof brain development takes placebetween birth and 3. That hasprofound implications for parents andchild-care providers.
How the brain develops Brain development is greatly
influenced by what the childexperiences. Environment affects how
large and how fast a child’s braingrows, and it helps direct the actual“wiring”of the brain’s circuitry.
The brain develops from the leastcomplex part — the brainstem, whichcontrols basic involuntary life functionslike heart rate and body temperature —to the most complex, the cortex, whichcontrols reasoning and abstractthought. The brain is made up ofneurons and neuron pathways.Neurons are long, wiry cells that carryelectrical messages through the nervoussystem. They are responsible for mostbrain functions, such as seeing, hearing,speaking, learning and experiencingemotions. Neurons connect with eachother across tiny spaces called synapses,which are formed when stimulated byexperiences. The connected neurons arethen joined to form the permanentpathways through which we learn andprocess information throughout ourlives (see page 8).
Timing matters Specific parts of the brain must be
stimulated within a specific time todevelop normally. If crucialenvironmental cues are not presentduring these periods, the parts of thebrain that regulate those functions maynot develop appropriately.
The brain systems that control visionand language begin forming early. Thewindow of opportunity for vision isbirth to about 6 months. Children whoare deprived of visual stimulationduring this time will not develop thenecessary neural connections, and maybecome visually impaired. For speech
1 Sources used for this information: National Research Council and Institute of Medicine (2000) From Neurons to Neighborhoods: The Science of Early ChildhoodDevelopment. Committee on Integrating the Science of Early Childhood Development. Jack P. Shonkoff and Deborah A. Phillips, eds. Board on Children,Youth, andFamilies, Commission on Behavioral and Social Sciences and Education. Washington, D.C.: National Academy Press.Arkansas Advocates for Children and Families (2000). Brain Development & Early Childhood. An Arkansas KIDS COUNT Special Report. Little Rock, AK.: Author
2 Early Learning Left Out: An Examination of Public Investments in Education and Development by Child Age. A report by: Voices for America’s Children and the Childand Family Policy Center in partnership with: Voices for Alabama's Children, Children's Action Alliance of Arizona, Colorado Children's Campaign, Connecticut Voicesfor Children, Kansas Action for Children, Michigan's Children, Citizens for Missouri's Children, South Dakota Coalition for Children, Vermont Children's Forum, TheChildren's Alliance of Washington, Wisconsin Council on Children and Families
3 IBID. p.4.
and vocabulary development, thecritical window is birth to 3 years. Thesounds a child hears in those yearslargely determine the size of her/hisadult vocabulary.
Growing emotionallyA great deal of emotional
development takes place during the first18 months. There is no substitute for anurturing environment from a loving,consistent caregiver. Without it, a childis unlikely to be emotionally stable.
Without nurturing human interaction,the cortex and limbic system--the toplayers of the brain that control higherlevels of thought and help regulateimpulsive emotional response — do notgrow and organize normally. Researchclearly shows that excess stress early inlife can be damaging. Chaotic,traumatic, unpredictable experiencescause the release of a brain chemicalcalled cortisol. When this hormonewashes over the brain in high amounts,it can cause certain regions of the brainthat regulate emotional response andattachment to be 20 to 30 percentsmaller than normal. The continuedrelease of this hormone can cause achild to become "stuck" in a "highalert" or "fight or flight”state evenwhen there is no danger. This stressresponse state can lead to aggression,emotional and behavioral problems and undermine the ability of children to develop critical cognitive and social skills.
Given the importance of braindevelopment in children, the child careindustry has an extraordinary
How the brain developsThe brain has about 100 billion neurons at birth. During the first eight months of life,neurons link up at an amazing pace. By the end of that period, a baby can have asmany as 1,000 trillion synapses. These synapses, however, operate on a “use it or lose it”principle. To become permanent, the connections must be reinforced through everydayexperience and stimulation.Throughout childhood and up to about age 11, the brain goes through a process oforganizing itself by shedding electrical connections that have not been repeated oftenenough to form permanent pathways. Around age 11, early connections end up in thediscard pile and a child retains half as many (500 trillion) synapses — roughly the sameas an adult. A child’s brain is 70 percent developed by age 1. Once a child reaches age 3, 85to 90 percent of the core brain structure has been formed.
2
undertaking. Quality care can putchildren on a positive path for life thatbenefits them and society.
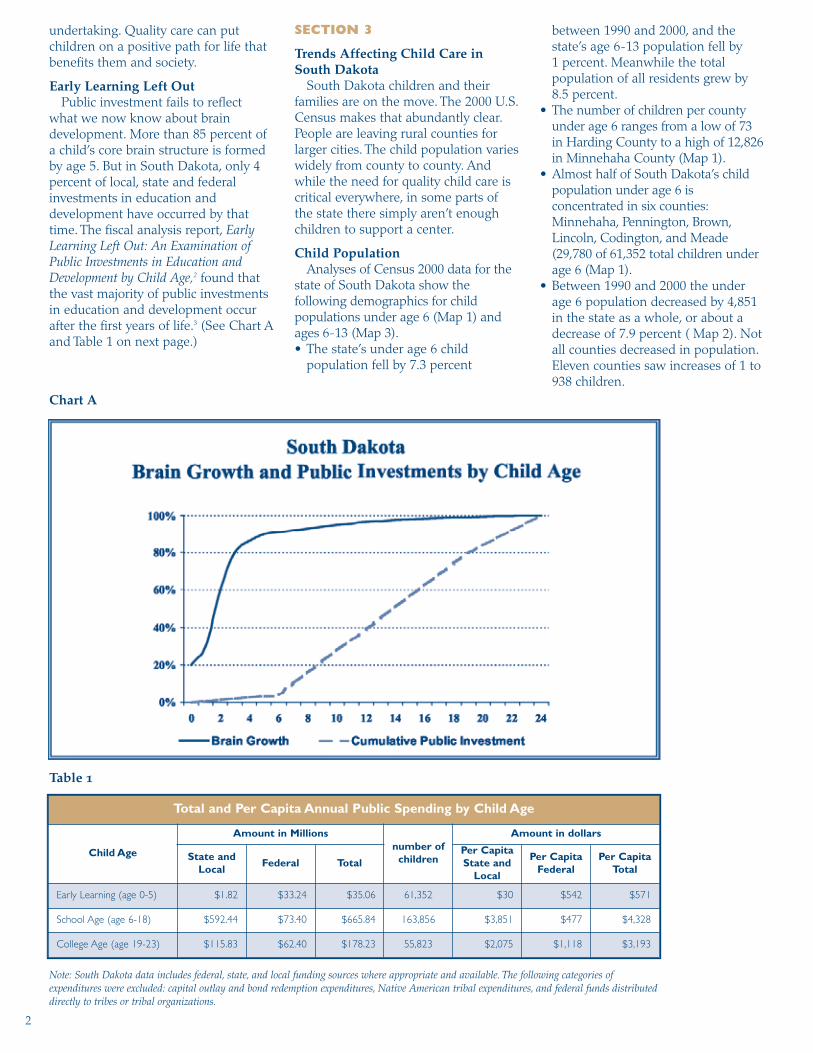
Early Learning Left OutPublic investment fails to reflect
what we now know about braindevelopment. More than 85 percent ofa child’s core brain structure is formedby age 5. But in South Dakota, only 4percent of local, state and federalinvestments in education anddevelopment have occurred by thattime. The fiscal analysis report, EarlyLearning Left Out: An Examination ofPublic Investments in Education andDevelopment by Child Age,2 found thatthe vast majority of public investmentsin education and development occurafter the first years of life.3 (See Chart Aand Table 1 on next page.)
Note: South Dakota data includes federal, state, and local funding sources where appropriate and available. The following categories ofexpenditures were excluded: capital outlay and bond redemption expenditures, Native American tribal expenditures, and federal funds distributeddirectly to tribes or tribal organizations.
Chart A
Table 1
SECTION 3
Trends Affecting Child Care inSouth Dakota
South Dakota children and theirfamilies are on the move. The 2000 U.S.Census makes that abundantly clear.People are leaving rural counties forlarger cities. The child population varieswidely from county to county. Andwhile the need for quality child care iscritical everywhere, in some parts ofthe state there simply aren’t enoughchildren to support a center.
Child PopulationAnalyses of Census 2000 data for the
state of South Dakota show thefollowing demographics for childpopulations under age 6 (Map 1) andages 6-13 (Map 3).• The state’s under age 6 child
population fell by 7.3 percent
between 1990 and 2000, and thestate’s age 6-13 population fell by1 percent. Meanwhile the totalpopulation of all residents grew by8.5 percent.
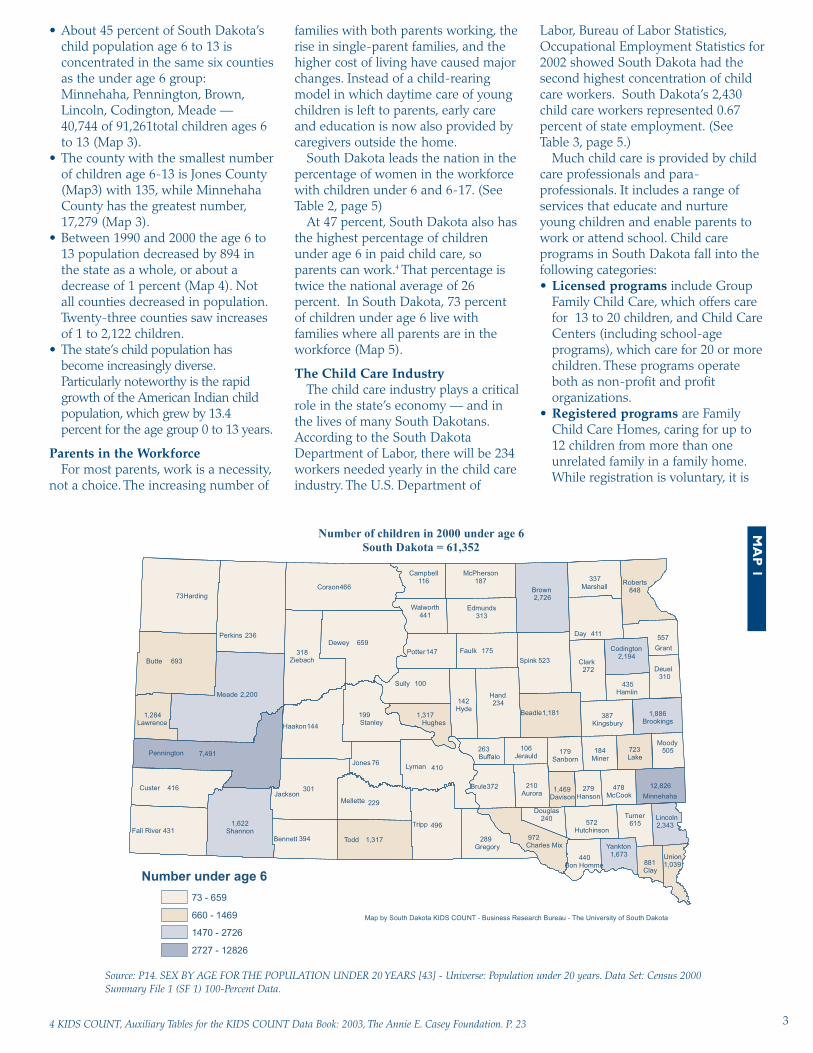
• The number of children per countyunder age 6 ranges from a low of 73in Harding County to a high of 12,826in Minnehaha County (Map 1).
• Almost half of South Dakota’s childpopulation under age 6 isconcentrated in six counties:Minnehaha, Pennington, Brown,Lincoln, Codington, and Meade(29,780 of 61,352 total children underage 6 (Map 1).
• Between 1990 and 2000 the underage 6 population decreased by 4,851in the state as a whole, or about adecrease of 7.9 percent ( Map 2). Notall counties decreased in population.Eleven counties saw increases of 1 to938 children.
Total and Per Capita Annual Public Spending by Child Age
Child Age
Amount in Millionsnumber of
children
Amount in dollars
State andLocal
Federal TotalPer CapitaState and
Local
Per CapitaFederal
Per CapitaTotal
Early Learning (age 0-5) $1.82 $33.24 $35.06 61,352 $30 $542 $571
School Age (age 6-18) $592.44 $73.40 $665.84 163,856 $3,851 $477 $4,328
College Age (age 19-23) $115.83 $62.40 $178.23 55,823 $2,075 $1,118 $3,193
3
• About 45 percent of South Dakota’schild population age 6 to 13 isconcentrated in the same six countiesas the under age 6 group:Minnehaha, Pennington, Brown,Lincoln, Codington, Meade —40,744 of 91,261total children ages 6to 13 (Map 3).
• The county with the smallest numberof children age 6-13 is Jones County(Map3) with 135, while MinnehahaCounty has the greatest number,17,279 (Map 3).
• Between 1990 and 2000 the age 6 to13 population decreased by 894 inthe state as a whole, or about adecrease of 1 percent (Map 4). Notall counties decreased in population.Twenty-three counties saw increasesof 1 to 2,122 children.
• The state’s child population hasbecome increasingly diverse.Particularly noteworthy is the rapidgrowth of the American Indian childpopulation, which grew by 13.4percent for the age group 0 to 13 years.
Parents in the WorkforceFor most parents, work is a necessity,
not a choice. The increasing number of
families with both parents working, therise in single-parent families, and thehigher cost of living have caused majorchanges. Instead of a child-rearingmodel in which daytime care of youngchildren is left to parents, early careand education is now also provided bycaregivers outside the home.
South Dakota leads the nation in thepercentage of women in the workforcewith children under 6 and 6-17. (SeeTable 2, page 5)
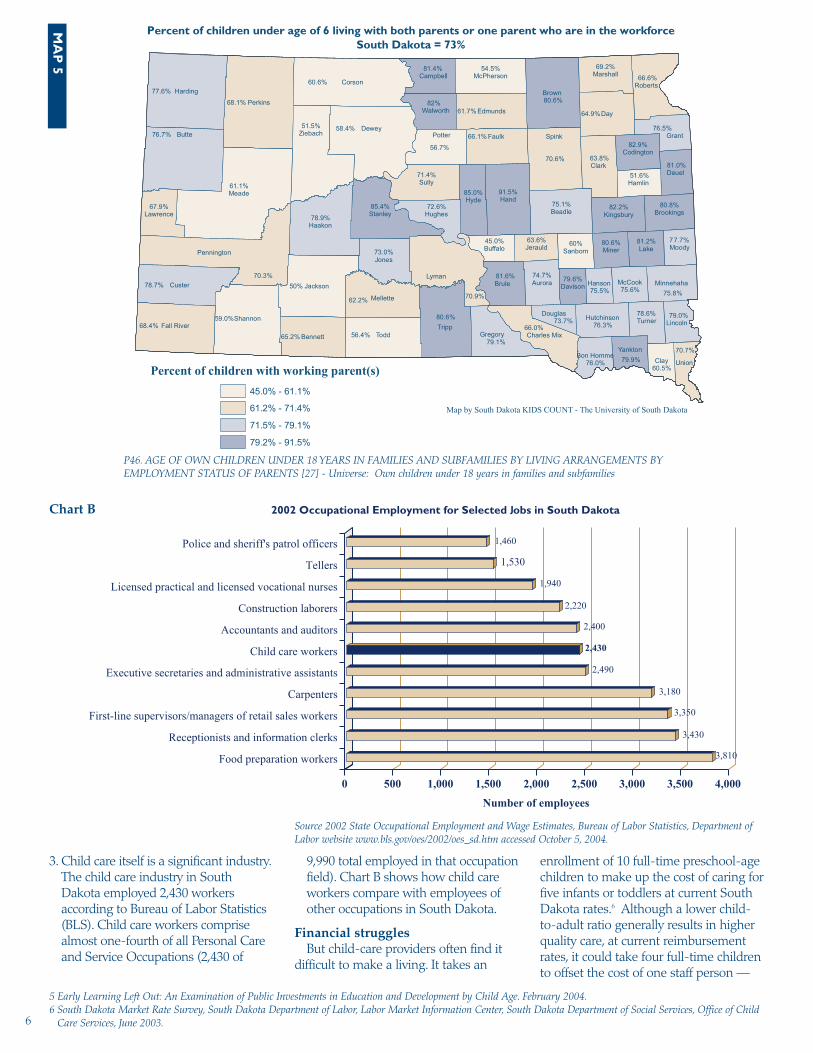
At 47 percent, South Dakota also hasthe highest percentage of childrenunder age 6 in paid child care, soparents can work.4 That percentage istwice the national average of 26percent. In South Dakota, 73 percentof children under age 6 live withfamilies where all parents are in theworkforce (Map 5).
The Child Care Industry The child care industry plays a critical
role in the state’s economy — and inthe lives of many South Dakotans.According to the South DakotaDepartment of Labor, there will be 234workers needed yearly in the child careindustry. The U.S. Department of
Labor, Bureau of Labor Statistics,Occupational Employment Statistics for2002 showed South Dakota had thesecond highest concentration of childcare workers. South Dakota’s 2,430child care workers represented 0.67percent of state employment. (SeeTable 3, page 5.)
Much child care is provided by childcare professionals and para-professionals. It includes a range ofservices that educate and nurtureyoung children and enable parents towork or attend school. Child careprograms in South Dakota fall into thefollowing categories: • Licensed programs include Group
Family Child Care, which offers carefor 13 to 20 children, and Child CareCenters (including school-ageprograms), which care for 20 or morechildren. These programs operateboth as non-profit and profitorganizations.
• Registered programs are FamilyChild Care Homes, caring for up to12 children from more than oneunrelated family in a family home.While registration is voluntary, it is
Source: P14. SEX BY AGE FOR THE POPULATION UNDER 20 YEARS [43] - Universe: Population under 20 years. Data Set: Census 2000Summary File 1 (SF 1) 100-Percent Data.
4 KIDS COUNT, Auxiliary Tables for the KIDS COUNT Data Book: 2003, The Annie E. Casey Foundation. P. 23
MA
P 1

4
Source: P011. AGE - Universe: Persons. Data Set: 1990 Summary Tape File 1 (STF 1) - 100-Percent data. U.S. Bureau of the Census 1990 Censusof Population and HousingAndSource: P14. SEX BY AGE FOR THE POPULATION UNDER 20 YEARS [43] - Universe: Population under 20 years. Data Set: Census 2000Summary File 1 (SF 1) 100-Percent Data.
Source: P14. SEX BY AGE FOR THE POPULATION UNDER 20 YEARS [43] - Universe: Population under 20 years. Data Set: Census 2000Summary File 1 (SF 1) 100-Percent Data.
MA
P 2
MA
P 3

5
required for caregivers who receivepublic funding.
• Unregistered programs are FamilyChild Care Homes operating andcaring for up to 12 children frommore than one unrelated family.Exempt from regulatory standards,
they are not part of a formal systemand are not represented in this study.
• Head Start, Early Head Start Bothare comprehensive childdevelopment programs that servechildren from birth to age 5. They arechild-focused programs with an
Source: P011. AGE - Universe: Persons. Data Set: 1990 Summary Tape File 1 (STF 1) - 100-Percent data. U.S. Bureau of the Census 1990Census of Population and Housing
Source: P14. SEX BY AGE FOR THE POPULATION UNDER 20 YEARS [43] - Universe: Population under 20 years. Data Set: Census 2000Summary File 1 (SF 1) 100-Percent Data.
Source: U.S. Census Bureau. Census 2000.
overall goal of increasing socialcompetence and school readiness forlow-income families.
All these programs are distinct partsof a system of care on which parentsrely during working and/or schoolhours. See Appendix A for a moredetailed explanation of the varioustypes of formal care that make up thechild care industry in South Dakota.
The child care industry benefitsSouth Dakota as follows: 1. It enables businesses to hire workers,
decrease absenteeism and turnoverand increase productivity. Withquality, dependable child care, parentsin the workforce are more productiveand more likely to continue in theircurrent positions. Reducing turnoversaves businesses money, whichbolsters the state’s economy as well.
2. It ensures a strong future economyby preparing children for academicsuccess (See Section 2). Thefoundation for learning, includingsocial and emotional well-being,develops very early.5
Women in the Workforce with Minor ChildrenSouth Dakota United States
Total 81.7% 69.0%With children under 6 only 77.5% 63.5%
With children under 6 and 6-17 75.4% 60.0%With children 6-17 only 85.8% 75.0%
State Employment Percent of State EmploymentVermont 2,280 0.78%South Dakota 2,430 0.67%Arkansas 7,300 0.65%New York 50,450 0.61%New Jersey 22,930 0.60%
Source: U.S. Department of Labor website www.bls.gov/oes/2002/oes399011.htm andaccessed October 5, 2004.
MA
P 4
Table 2
States with the Highest Concentration of Child Care Workers
Table 3
6
P46. AGE OF OWN CHILDREN UNDER 18 YEARS IN FAMILIES AND SUBFAMILIES BY LIVING ARRANGEMENTS BYEMPLOYMENT STATUS OF PARENTS [27] - Universe: Own children under 18 years in families and subfamilies
Source 2002 State Occupational Employment and Wage Estimates, Bureau of Labor Statistics, Department ofLabor website www.bls.gov/oes/2002/oes_sd.htm accessed October 5, 2004.
3. Child care itself is a significant industry.The child care industry in SouthDakota employed 2,430 workersaccording to Bureau of Labor Statistics(BLS). Child care workers comprisealmost one-fourth of all Personal Careand Service Occupations (2,430 of
9,990 total employed in that occupationfield). Chart B shows how child careworkers compare with employees ofother occupations in South Dakota.
Financial strugglesBut child-care providers often find it
difficult to make a living. It takes an
enrollment of 10 full-time preschool-agechildren to make up the cost of caring forfive infants or toddlers at current SouthDakota rates.6 Although a lower child-to-adult ratio generally results in higherquality care, at current reimbursementrates, it could take four full-time childrento offset the cost of one staff person —
5 Early Learning Left Out: An Examination of Public Investments in Education and Development by Child Age. February 2004.6 South Dakota Market Rate Survey, South Dakota Department of Labor, Labor Market Information Center, South Dakota Department of Social Services, Office of Child
Care Services, June 2003.
MA
P 5
Chart B

7
Source 2002 State Occupational Employment and Wage Estimates, Bureau of Labor Statistics, Department of Labor website www.bls.gov/oes/2002/oes_sd.htm accessedOctober 5, 2004.
and that doesn’t factor in facility, supply,food and administrative costs.7
Child care programs spend nearly 70percent of their operating budgets onsalaries and are hard-pressed to offerbenefits. With staff turnover averaging44 percent, the cost to hire and retrainstaff can be financially devastating. Themajority of child-care programs inSouth Dakota do not operate solely onparent fees because parents, whotypically have not reached their peakearning power, cannot afford the fullcost of quality child care. Ongoingfederal, state and local support enableschild care operators to offer servicesbeyond the very basic health, safetyand educational needs of children.
Occupational and wage estimatesshow that annual earnings for workersin the child-care industry averaged$15,120 in 2002, less than constructionlaborers ($21,840), executivesecretaries/administrative assistants($27,210) and well below the averageof $27,680 for all occupations.
SECTION 4
The Economic Impact of the ChildCare Industry
The purpose of this research is todetermine the economic impact of thechild care industry in South Dakota.What might appear to be a relativelystraightforward endeavor — determiningthe number of children being served andthe fees paid for that service — is elusive.The child care industry is difficult toquantify because it encompasses largelicensed centers serving communities tosmall unregistered family day cares. Inaddition, many licensed centers aresubsidized by employers, churches andnonprofits. And to further obscure thepicture, it is impossible to tabulateunregulated providers, hence they arenot included.
Chart D shows the direct effects, theindirect effects, and induced effects ofSouth Dakota’s child care industry. Themultiplier analysis that followsintroduces two types of multipliers.There are expenditures whose impactsare best described by Type I multipliersand there are expenditures whose
impacts are best described by Type IImultipliers. Type I multipliers include“Direct”and “Indirect”spending, whileType II multipliers include “Direct,”“Indirect”and “Induced”spending. Thetwo types of multipliers aredistinguished by how far a dollar’sworth of business activity is followedthrough the economy.
MultipliersType I multipliers address the
purchase of daycare services from aprovider and the purchase of materialsand services from other businesses bythe child-care providers in the courseof accomplishing their work. That iswhere the tracking of the money stopswhen a Type I multiplier is used.
Type II multipliers go one step furtherto track the money as it circulatesthrough the economy.The Type IImultiplier includes the direct and indirectbusiness activity described in the Type Idefinition but adds householdexpenditures.The Type II multiplier tracksthe money paid to the workers by thechild care provider and the businessesfrom which they purchase services and
7 Child Care Market Rate Survey, South Dakota Department of Labor, Labor Market Information Center, South Dakota Department of Social Services, Office of ChildCare Services. June 2003.
Chart C

8
products.The induced spending ismoney spent by the workers’householdsas a result of their earnings in the childcare and supporting industry.
The assumption is that moneyoriginating in South Dakota or“existing”money would have beenspent in the state’s economy one way oranother. The choice was made to spendthe money on child care that wouldhave been spent on other goods andservices. This means that householdspending, the induced spending, wouldhave taken place one way or anotherand the industry should not receivecredit for those expenditures.
Federal money and foundationmoney is “new”to the South Dakotaeconomy. It would not have beenspent by households in South Dakotahad it not been brought to the state bythis program. The impact of this newmoney is measured as directexpenditures, indirect expenditures andinduced expenditures, with the inducedexpenditures being the distinguishingcharacteristic for Type II multipliers.
Within these definitions, the impactof out-of-pocket money spent on childcare by South Dakotans is estimated(as are state tax dollars) using a Type Imultiplier. Federal money andfoundation money is new to the stateand its impact is estimated using theType II multiplier. Because the Type IImultiplier includes household spendingthat Type I expenditures do not, theType II impacts are larger.
Type I multipliers for the SouthDakota child care industry show thatevery dollar ($1) spent on child careresults in $1.31 dollars of businessactivity. This measure accounts for thedollar ($1) spent from South Dakotasources and thirty-one cents (31 cents)spent by the child care industry atother South Dakota businesses.
Federal fund and foundationexpenditures qualify for impactestimation using the Type II multiplier.The dollar ($1) spent on child care willresult in the purchases of 31 cents fromother businesses , plus 12 centsinduced expenditures, at the householdlevel for a total impact of $1.43 asmeasured by the Type II multiplier.There is an additional 43 cents ofbusiness activity that results from eachnew dollar to the South Dakotaeconomy spent on child care.
The difference in job creationresulting from Type I and Type IImultipliers are substantial. For every jobcreated in the child care industry usingexisting South Dakota money (Type Iimpact) there is sufficient businessactivity created to justify 1.09 workers.That means it takes approximatelyeleven (11.1) people working in thechild care industry paid with SouthDakota money to create an additionaljob. It takes less than half (1.14) that,using money new to the state with aType II impact. It takes a little morethan seven jobs (7.14) funded from out-of-state resources to create oneadditional job within the state.
How these numbers were determinedEconomists use a number of
methods to analyze the impact of abusiness sector on an economy at thelocal, state, or national level. Theeconomic estimates for this report arebased on the IMPLAN Input-OutputModel (I-O Model). See Appendix Bfor an explanation of this model.
Data for the IMPLAN Model camefrom the Office of Child Care Services,South Dakota Department of SocialServices and from the Head Start federaloffice in Denver, Colorado. The Office ofChild Care Services reports the numberof establishments that are licensed orregistered and how the money flows tothem. There is no requirement that allfamily child care homes be registered.Qualification for government assistancemay be the only incentive for beinglicensed with the state. Limiting ananalysis to those providers that arelicensed and registered is consistent withthe analysis from other states.
See Appendix C for the specificcalculations.
Comparisons to other industriesComparing the child care industry
gross receipts with other serviceindustries in the state puts the size ofthat industry into context. The childcare industry is larger than the serviceindustries of advertising andarchitectural services combined andabout half the size of engineeringservices (See Chart E.)
Leveraging Federal FundsLeveraging of money is an additional
concept that relates to the economicimpact of governmental expenditurechoices. It is a measure of financialimpact that is separate and distinct fromthe multiplier estimate of economicactivity as a dollar makes its waythrough an economy. This is a measureof money that brings external funds tothe economy on a match basis or as aresult of satisfying a requirement.
The method that follows shows amethod similar to that developed byKansas to describe the leveraging ofstate and other discretionary money.State funds are those moniesoriginating from a state’s tax system.These funds are commonly from thestate’s general fund but can bededicated money in addition — forexample, Kansas uses its tobaccosettlement money for child care.
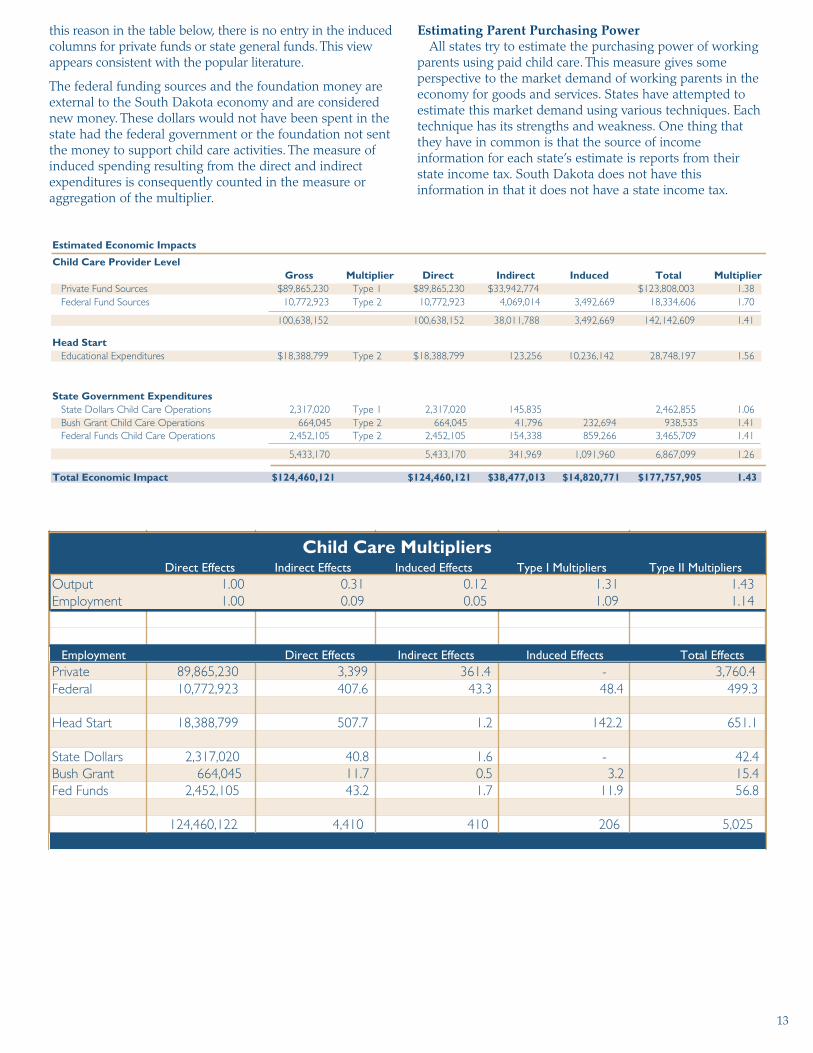
Chart D: Direct and Multiplier Effects

9
At the state’s discretion, South Dakota spends TANF money and BushFoundation grant money on child care in addition to the state’s general fundexpenditures. The fact that this money could be spent on goods and services otherthan child care qualifies it for consideration as local effort in the Kansasmethodology and is quoted in other child care literature.
Leveraging is the acquisition of federal funds using state funds for match. Notebelow in item three that Head Start funds are not included in the measure of federalfunds. This money is not included because the amount that a state receives is notdependent upon the state matching the money. Head Start money is awardedindependent of any state effort.1. South Dakota funding in calendar year 2003 includes the following categories:
a. State General Funds $2,317,020b. TANF (Federal funds that could have been spent elsewhere.) $1,748,738
$4,065,7582. Federal funding includes monies that could only be used for early care and
education services in South Dakota. This item includes Child Care Discretionarymoney, Child Care Development Mandatory funds and Child Care DevelopmentFund Matching funds. It does not include Head Start funding.a. Federal Funds $11,476,289
3. The Leverage of Federal Funds to South Dakota Investment is the ratio:$11,476,289/$4,065,758 = 2.82
4. By measure using the above definition, every dollar that South Dakota choosesto invest in child care leverages $2.82 in federal funds. That is not to suggestadditional state expenditures will increase the federal match. The state iscurrently leveraging child care money to the maximum possible.
SECTION 5
ConclusionChild care is fundamental to a strong South Dakota economy. Without it, the
labor supply would diminish, putting many businesses at risk.Parents whose youngsters are in high-quality child care can concentrate on the
job, knowing that their daughters and sons are safe in an environment thatsupports crucial early brain development.
Children — and society — benefit from high quality child care. Eighty-five percentof a child’s core brain structure is formed by age 3. What happens in the first fewyears of life can determine the likelihood of a child staying in school. It can alsoaffect future earning power. And that’s just part of the picture. Studies show thatyoungsters who miss out on the basic pre-reading and language skills that developfrom birth to age 5 may require special education or remedial classes later. They aremore likely to drop out of school, receive welfare benefits and commit crime. Thecost to society is great.
Child care also is an economic forcethat creates jobs and generates localincome:• Licensed and registered child care
creates 4,410 jobs in South Dakota.That’s more than telecommunications,clothing stores, health and personalcare stores, publishing and utilities.
• Licensed or registered child care inSouth Dakota generates over $100.6million in gross annual receipts.
• By investing in child care, SouthDakota leverages more than $11.4million in federal funds at a $2.82 to$1 ratio.
• Yields $124.5 million in directeconomic activity.
• Produces $177.6 million in economicactivity, with multiplier effects.High-quality child care is critical to
meeting two of South Dakota’s greatestneeds: making it possible for parents towork and ensuring that every childenters school ready to learn. It benefitseveryone when children get a strongstart. They become productive learners,workers and citizens. That’s asfundamental an investment in the state’sinfrastructure as roads and buildings.
High-quality care connects child well-being, education and the present andfuture workforce.8 Child care affects everySouth Dakotan. A vital, $100.6 millionindustry with multiple benefits, it spurseconomic growth and development —now and into the future. Investments inquality child care yield high publicreturns.The child care industry is anintegral part of this state’s economicdevelopment strategy. Integrating child-care planning into local, regional andstate economic development plansmakes good business sense.
When our kids thrive, we all benefit.
8 Child Care and Utah’s Economy…Making the Connection. A Special Utah KID’S COUNT Report, April 2002
Licensed and registered child caregenerates over $100.6 million in gross
receipts in South Dakota.
Chart E
10
APPENDIX A
South Dakota’s Child Care Industry
• Family Child Care Home -Registered: South Dakota law definesa Family Child Care Home as one inwhich care is given on a regular basisfor any part of a 24 hour day to 12 orless children from more than oneunrelated family. This includes anychildren under the age of 6 who areliving in the home. Family child care isa service provided in the provider'shome. Family child care providers areregistered rather than licensed.Registration is a voluntary processwhereby the applicants declare theirintent to provide family child care andagree to comply with standards thathave been established by theDepartment of Social Services. Aregistration certificate is in effect fortwo years. Registration is legallymandated when a provider receivescompensation from public funds.Providers who are not receivingreimbursement from public funds andcaring for 12 or fewer children areexempt from registration. A registeredfamily child care provider must be atleast 18 years old.
• Group Family Child Care Home -Licensed: South Dakota law defines aGroup Family Child Care Home as afacility that provides child care for apart of a day as a supplement to regularparental care for 13 to 20 children frommore than one family, including theprovider's own children who are underthe age of 6 years. A group family childcare home may be located in theprovider's own home or in a separatefacility. Group family child care homesare mandated by law to be licensedregardless of the funding source.
• Child Care Center - Licensed:South Dakota law defines a Child CareCenter as a facility that provides childcare for a part of a 24-hour day to 21 ormore children from one or moreunrelated families, including theprovider's own children under the ageof 6 years, regardless of the source ofincome. A child care center may belocated in the provider's own home orin a separate facility. Child care centersare mandated by law to be licensedregardless of the funding source. Achild care center may be operated as anonprofit organization or as anindependent, proprietary facility.
• Before- & After-School CareCenter, Licensed: Before & AfterSchool Care Centers provide care andsupervision before and after schoolhours for 13 or more children who arefive years of age or older and enrolledin school. Before & After School CareCenter providers serve only school-agechildren and may be providing care foreither part of a day or full-time duringschool breaks. Before- & After-SchoolCare Centers are mandated by law tobe licensed regardless of the fundingsource or location of the program.Centers are inspected each year.
• Head Start: Head Start is designed tofoster healthy development in childrenfrom low income families. Programsdeliver a range of services that areresponsive and appropriate to eachchild's and each family's heritage andexperience, encompassing all aspects ofa child's development and learning.
Head Start began in 1965 as a summerprogram by the federal Office ofEconomic Opportunity. Designed tohelp break the poverty cycle, it provideda comprehensive program to meetemotional, social, health, nutritional andpsychological needs of preschoolchildren from low-income families.Educators, child development specialists,community leaders and parentsrecognized the value of the program.Head Start operates in all fifty states, theDistrict of Columbia, Puerto Rico, andthe U.S. Territories. Presently, Head Startis a program within the Administrationon Children,Youth and Families in theDepartment of Health and HumanServices. The program is locallyadministered by community-based non-profit organizations and school systems.There are 16 regional and Tribal HeadStart sites in South Dakota.
APPENDIX B
IMPLAN Input-Output Model
Estimates for the impact of child careservices on indirect and inducedearnings and other productivity effectsare based on the application of the 2003South Dakota Module of the IMPLANInput-Output model. Initially developedfor use by the U.S. Forest Service,IMPLAN is now used in many fields.
Input-Output models use area-specificdata on industrial and commercialactivity to trace the linkages between
industries. IMPLAN is based on a tableof direct requirement coefficients whichindicate the inputs of goods andservices from various industriesrequired to produce a dollar’s worth ofoutput in another, single industry.Standard economic “productionfunctions”— the capital, labor andtechnology needed to produce a givenset of goods — determine howchanges occur in one industry.
IMPLAN contains more than fivehundred economic sectors, andeconomic census data to compileregional economic information.National data are adjusted for theindustrial and trading patterns for thesubject region. Based on this structure,IMPLAN estimates the regionaleconomic impact that would resultfrom a dollar change in demand of aparticular industry.
The multiplier effect estimates the linksbetween an industry and other areas ofthe economy. For this report, Type IImultipliers, which exclude governmentspending, are used. Estimates for theimpact of child care on the economyare based on three primary types ofmultipliers:• Direct effects: Effects introduced into
the state’s economy as a result ofspending on child care services.
• Indirect effects: Effects reflectingspending by the child care industry
• Induced effects: Effects on goods andservices consumed by householdswith direct and indirect incomesupport from an industry. These effectsreflect changes in the state’s economycaused by changes (for instance,increases) in spending patterns as aresult of the direct and indirect activity.
APPENDIX C
Assumptions to the South DakotaEstimate• The number of child care hours
provided by licensed or registeredservice providers. This informationhas its roots in the Social Services“Child Care Market Rate Study”.
The data suggests that split betweenfull-time and part-time care isapproximately two-thirds and one-third respectively. Two-thirds are fulltime and one-third is part time.The average number of hours fordelivery of full-time child care isassumed as follows:
11
• Family – 45.0 hours• Center – 44.0 hours• Group – 43.8 hours• School Age – 18.9 hoursThe part-time number of hours is assumed to be 50percent of full time short of any source of data to refinethe estimate.• Family – 22.5 hours• Center – 22.0 hours• Group – 21.9 hours• School Age – 9.5 hours
• The number of children served part-time and full-time bylicensed or registered providers is estimated to be 34,345(23,429 x 1,334/910 or survey child numbers timespop/responses) (Please note that any differences are due torounding.)
• The number of child care service hours provided bylicensed or registered providers is estimated to beapproximately 58.4 million hours a year. (39.9 million x1,334/910)
• The revenues to the licensed and registered providers areestimated to be $100.6 million a year. ($68.7 million x1,334/910). (Please note that figures may be different due torounding.)
The state has $13.3 million in federal, 2.3 state and 0.7other funds a year to spend on child care in calendaryear 2003. It spends that amount on commercialprovider services, administration of the program, qualityimprovement, and licensing activities and relative/familyservice providers.Individuals paid an estimated $91.8 million for child careservices in CY 2003.During that year an additional $18.4 million was spenton Head Start, an early education program.
• What is the importance in an economic impact study ofidentifying where the state’s funds are spent? It relatesprimarily to labor issues. Fewer state workers can be hired fora given amount of money than child care service providers.State workers salaries are higher on average. IMPLAN willallow our analysis to take this into consideration if the relativeexpenditure amounts are determined.
• Secondly, there is the issue of double counting of subsidydollars. The subsidy dollars are being counted in the $100.6million revenues of the child care service providers. It isestimated that $10.8 million of federal funds are passedthrough to service providers.
• While it is recognized that federal money flowing to thetribes is important, the point of this paper is to describethe non-tribal industry as best we can. More than $5 million of federal money flows to the tribal Head Start programs in addition to child care money consideredin this paper. There is also more than $5 million flowing tothe tribes as Child Care Development funds notconsidered here. While money invested by the tribes inchild care is very important to development of childrenliving in South Dakota, its impact lies outside the scope ofthis analysis and is presented as a footnote.
• The Head Start program is considered as an educationalcomponent and is treated as such in the economic impactestimate. Again, these programs require employees withhigher average educational attainment and represent on
average a better paid group. As with state workers versushands on child care service providers, this group makesmore money on average and the number of people thatcan be hired for a given amount of funding will bedifferent as will their spending patterns.
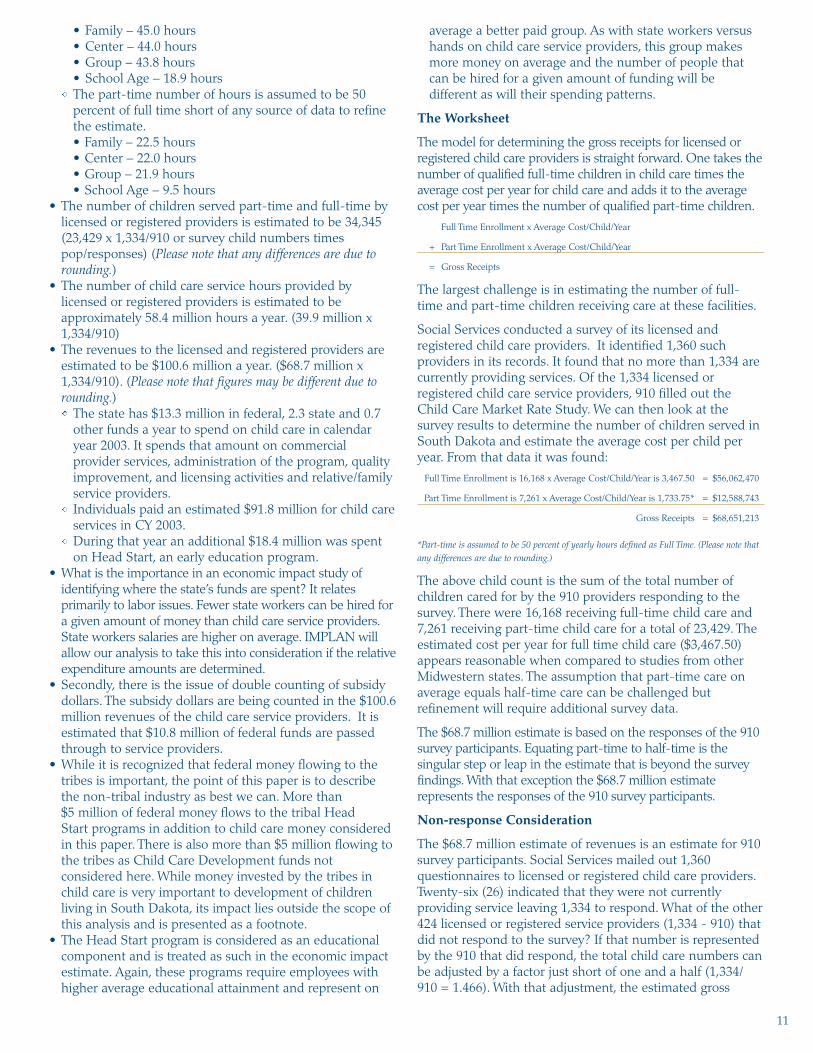
The Worksheet
The model for determining the gross receipts for licensed orregistered child care providers is straight forward. One takes thenumber of qualified full-time children in child care times theaverage cost per year for child care and adds it to the averagecost per year times the number of qualified part-time children.
Full Time Enrollment x Average Cost/Child/Year
+ Part Time Enrollment x Average Cost/Child/Year
= Gross Receipts
The largest challenge is in estimating the number of full-time and part-time children receiving care at these facilities.
Social Services conducted a survey of its licensed andregistered child care providers. It identified 1,360 suchproviders in its records. It found that no more than 1,334 arecurrently providing services. Of the 1,334 licensed orregistered child care service providers, 910 filled out theChild Care Market Rate Study. We can then look at thesurvey results to determine the number of children served inSouth Dakota and estimate the average cost per child peryear. From that data it was found:
Full Time Enrollment is 16,168 x Average Cost/Child/Year is 3,467.50 = $56,062,470
Part Time Enrollment is 7,261 x Average Cost/Child/Year is 1,733.75* = $12,588,743
Gross Receipts = $68,651,213
*Part-time is assumed to be 50 percent of yearly hours defined as Full Time. (Please note thatany differences are due to rounding.)
The above child count is the sum of the total number ofchildren cared for by the 910 providers responding to thesurvey. There were 16,168 receiving full-time child care and7,261 receiving part-time child care for a total of 23,429. Theestimated cost per year for full time child care ($3,467.50)appears reasonable when compared to studies from otherMidwestern states. The assumption that part-time care onaverage equals half-time care can be challenged butrefinement will require additional survey data.
The $68.7 million estimate is based on the responses of the 910survey participants. Equating part-time to half-time is thesingular step or leap in the estimate that is beyond the surveyfindings. With that exception the $68.7 million estimaterepresents the responses of the 910 survey participants.
Non-response Consideration
The $68.7 million estimate of revenues is an estimate for 910survey participants. Social Services mailed out 1,360questionnaires to licensed or registered child care providers.Twenty-six (26) indicated that they were not currentlyproviding service leaving 1,334 to respond. What of the other424 licensed or registered service providers (1,334 - 910) thatdid not respond to the survey? If that number is representedby the 910 that did respond, the total child care numbers canbe adjusted by a factor just short of one and a half (1,334/910 = 1.466). With that adjustment, the estimated gross

12
*In addition to the non-tribal expenditures, South Dakota tribal governments invest over five million federal dollars in Head Start programming and an additional fivemillion of Child Care Development Funds. This investment of more than ten million dollars does not include any additional money expended for capital projects,administration or any other subsidies received by the tribal governments or their tribal members.
receipts for the licensed or registered child care increases to$100.6 million. The estimate:
Full Time Enrollment is 23,701 x Average Cost/Child/Year is 3,467.50 = $83,183,885
Part Time Enrollment is 10,644 x Average Cost/Child/Year is 1,733.75* = $18,454,267
Gross Receipts = $100,638,152
*Part Time is assumed to be 50 percent of yearly hours defined as Full Time. (please note thatany differences are due to rounding)
Government expenditures for child care and Head Start areestimated to have been $34.6 million in CY 2003. That amountdouble counts $10.8 million already included in the$100,638,152 provider gross receipts number. With that amountnetted out, the additional amount invested by government thatis not accounted for in the $100,638,152 is $23,821,969.
Multiplier Estimation
The magnitude of economic activity resulting fromexpenditures in an economy is affected by both the source ofthe funds and how the funds are spent. Families with childrenthat decide to purchase child care make that choice at theexclusion of some other use for that money. Money taxed frompeople in South Dakota communities and returned to SouthDakota communities to support child care isn’t new moneybut rather money to be redistributed. In both cases, thesemonies are not new to the state’s economy and would havebeen spent albeit differently if child care wasn’t purchased. For
13
this reason in the table below, there is no entry in the inducedcolumns for private funds or state general funds. This viewappears consistent with the popular literature.
The federal funding sources and the foundation money areexternal to the South Dakota economy and are considerednew money. These dollars would not have been spent in thestate had the federal government or the foundation not sentthe money to support child care activities. The measure ofinduced spending resulting from the direct and indirectexpenditures is consequently counted in the measure oraggregation of the multiplier.
Estimating Parent Purchasing PowerAll states try to estimate the purchasing power of working
parents using paid child care. This measure gives someperspective to the market demand of working parents in theeconomy for goods and services. States have attempted toestimate this market demand using various techniques. Eachtechnique has its strengths and weakness. One thing thatthey have in common is that the source of incomeinformation for each state’s estimate is reports from theirstate income tax. South Dakota does not have thisinformation in that it does not have a state income tax.