EUROPEAN ECONOMY Economic Papers 456 | June 2012 The economic impact of the Services Directive: A first assessment following implementation Josefa Monteagudo, Aleksander Rutkowski and Dimitri Lorenzani Economic and Financial Affairs
Transcript
EUROPEAN ECONOMY
Economic Papers 456 | June 2012
The economic impact of the Services Directive: A fi rst assessment following implementation
Josefa Monteagudo, Aleksander Rutkowski and Dimitri Lorenzani
THE ECONOMIC IMPACT OF THE SERVICES DIRECTIVE: A FIRST ASSESSMENT FOLLOWING IMPLEMENTATION
Josefina Monteagudo Aleksander Rutkowski
Dimitri Lorenzani
European Commission DG ECFIN, Product Market Reforms Unit
Acknowledgements
This analysis is the result of an extensive collaboration with DG MARKT where Martin Frohn, Steve Fritz and Daniel Kramer provided information on restrictions and good advice on the interpretation of legal provisions under the Directive. We are very grateful to Janos Varga for his essential QUEST simulations. The paper has benefited from fruitful discussions with and valuable comments from Isabel Grilo. We also thank Henk Kox for sharing his time and his thoughts on our methodological approach. Finally, we also acknowledge valuable suggestions made by Member States following the presentation at the EU Economic Policy Committee.
2
Summary and conclusions
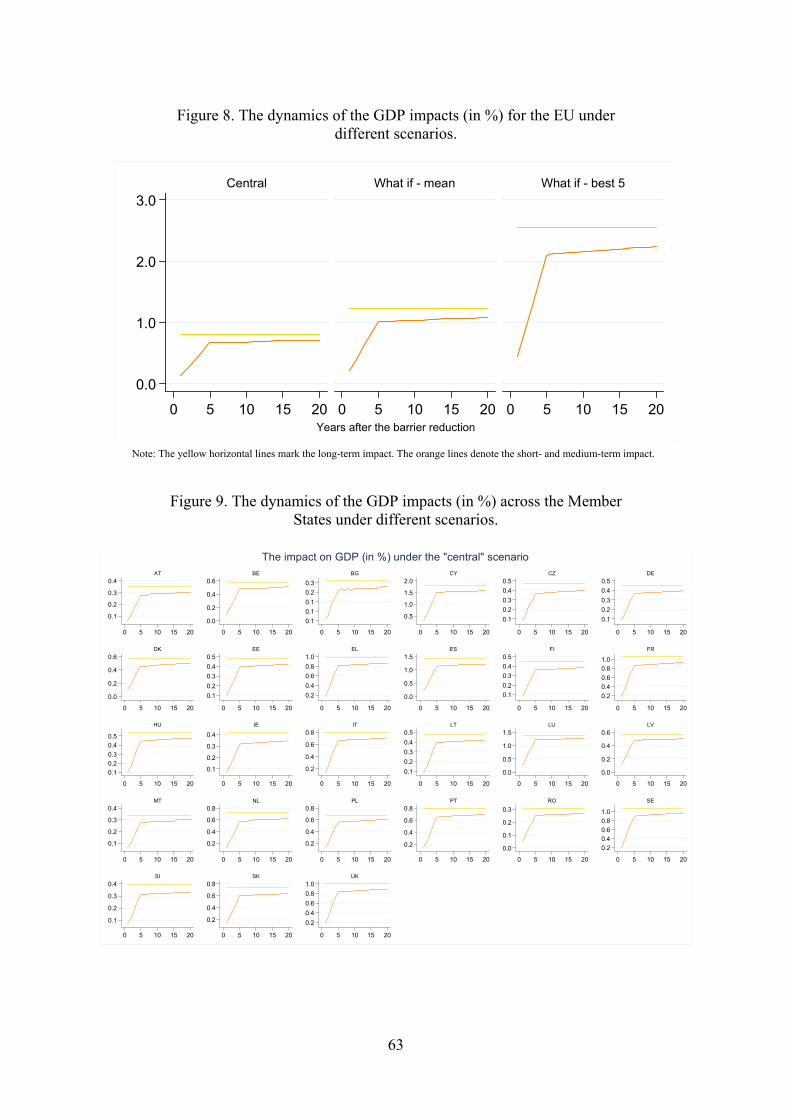
Since its launch in the mid-1980's the Single Market Programme has contributed to promote integration and competition within the EU and has resulted in real benefits in terms of growth and jobs. However, while the internal market for goods has been functioning reasonably well, the Single Market for services is not equally developed and is still far from a reality. By further liberalising cross-border provision of services and the free establishment within the EU, the Services Directive has become the largest recent reform effort in an area relatively protected and sheltered from international competition. The Directive was adopted in 2006 and its implementation deadline was December 2009. Although the majority of Member States have transposed the Directive, its full transposition is not yet completed. In addition, its mere legal transposition does not ensure that the full potential offered by the Directive would be materialised, the reason being that the Directive left some room to Member States when deciding which existing regulation was incompatible with the provisions of the Directive. Thus, from the onset a large degree of heterogeneity of implementation was expected across Member States, thus also implying remaining heterogeneity for the functioning of the internal market. This note presents work done by the Commission services to estimate the economic impact of the actual implementation of the Services Directive across Member States (in contrast to impacts of identical and complete elimination of restrictions estimated by previous studies). The analysis is possible thanks to available information on barriers to cross-border provision and to establishment for the period before and after the Directive. The barriers dataset has been compiled by the Commission Services to a large extent on the basis of the outcomes of the “mutual evaluation” done by the Member States and of experts' knowledge. It should be acknowledge though that the analysis is still an updated prediction or extrapolation exercise, rather than a fully-blown ex-post evaluation, because the period following the implementation of the Directive is too short to yield statistically sufficient data. In addition to the dataset used, a main characteristic of the study is the adopted analytical framework where different channels of the impact of barrier reductions are captured and consistently combined: i) impact on services sectors trade and FDI, thus the international channel of transmission; and ii) direct impact on sectoral labour productivity, which captures the domestic channel of transmission of the effects of the Directive. The estimated sectoral impacts are then translated into GDP effects for the whole economies of the Member States based on general equilibrium simulations from the QUEST model. Although the estimates do not cover all sectors under the provisions of the Services Directive, but a selection of them, its economic significance is still considerable. The conservative estimated EU-level impact on GDP is 0.8%, with the impact varying considerably across Member States (ranging from below 0.3% to more than 1.5%) and mainly determined by the combination of the undertaken barrier reduction and the share of the covered sectors in their economies. Although the results materialize over time, close to 80% of the gains are reaped within the first 5 years following the policy shock (barrier reduction from implementation). An important finding of the analysis refers to the importance of the domestic channel of transmission, neglected in previous studies and that however turns out to yield very significant productivity results. The GDP and productivity effects reported are a lower bound as they do not incorporate the long-term effects that the estimate increased in trade and FDI
3
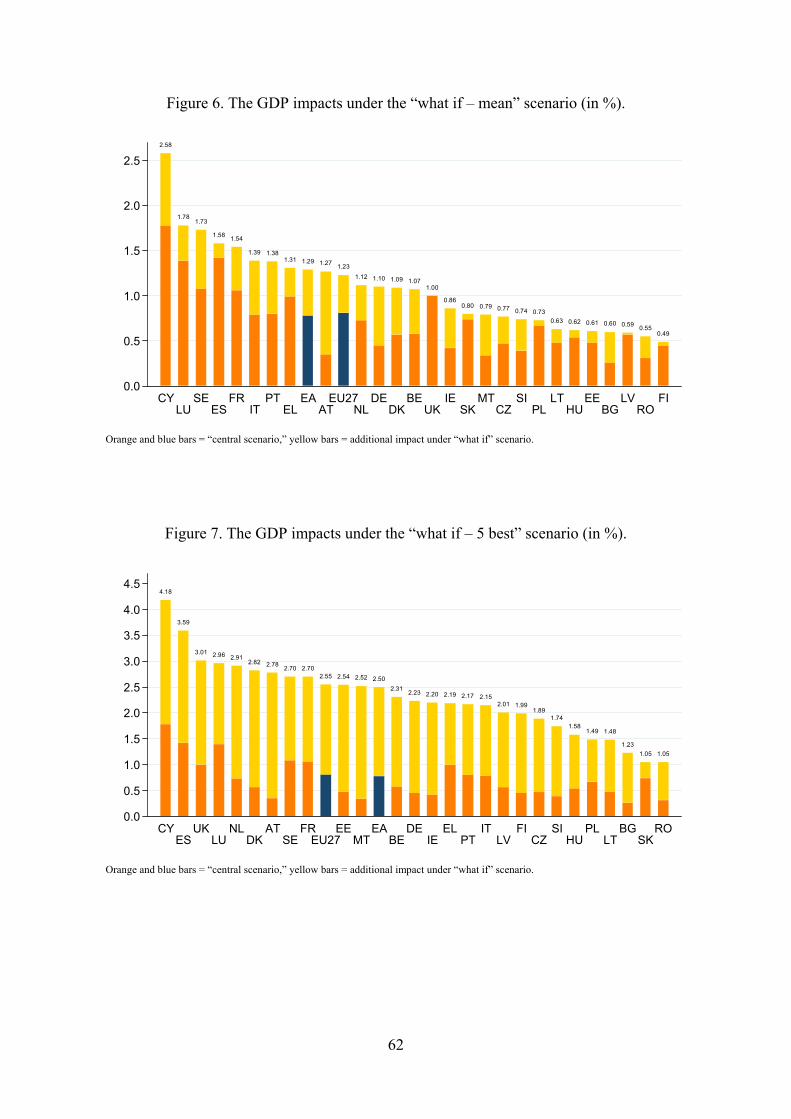
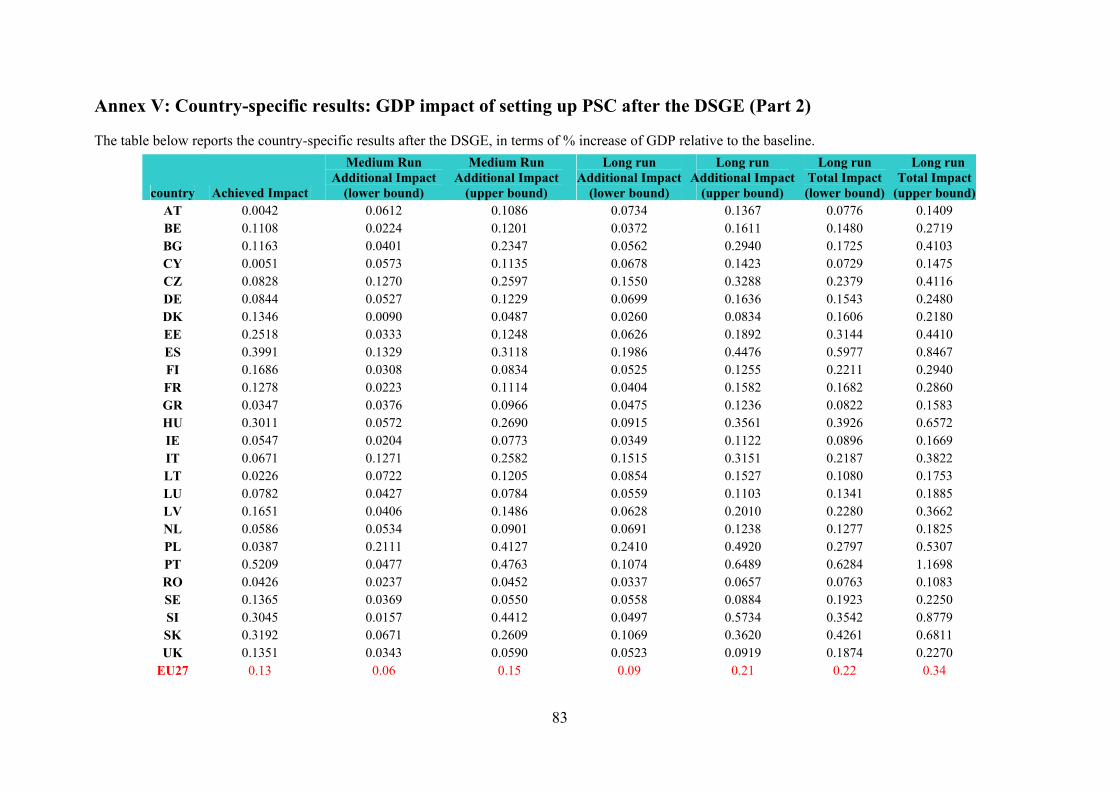
(around 7% and 4% for EU, respectively) would have on economic activity through their impact on productivity. Given the observed heterogeneity in barriers reduction across sectors and Member States, the note also quantifies the impacts under "what-if" hypothetical scenarios of further barrier reduction. Member States may reap yet additional benefits from the Directive if they continue their reform efforts, further reducing those numerous restrictions which have been only partially reduced and a non-negligible number of those which have been kept unchanged. Under an ambitious scenario where Member States move to the level of restrictions of the five best countries in the EU per sector, which is de facto close to a full elimination of barriers, will bring additional gains amounting to 1.6% of GDP, on top of the 0.8% under the current level of implementation. Even under a moderately ambitious scenario – where each country would become an “ideal country” composed of sectors with an EU average level of barriers – the further additional gain reaches 0.4% of GDP on top of the 0.8%. An important element to highlight from this exercise is that further gains could be obtained still within the scope of the Directive both in terms of requirements and sectoral coverage. Besides the reduction of sectoral barriers, the Directive also seeks administrative simplification through the setting up of national "Points of Single Contact" (PSC). The PSC would allow services providers to get all relevant information and to complete all procedures and formalities relating to the establishment and cross-border provision for service activities. Their creation has proven an ambitious project in terms of the innovation required to bring paper-based systems and a number of authorities and procedures under online portals. The Commission Services have thus carried out work, presented in the second part of this note, to estimate a proxy of the potential economic impact of setting up national PSC in what concerns the establishment of service activities. The approximation is based upon the World Bank’s Doing Business 2012 Database to compute procedural streamlining efforts in setting up a service provider activity. In spite of the caveats behind this approach, the current analysis can provide a comparable quantitative estimation of the potential economic impact of the MS' current development and further improvements in establishment-related conditions affected by the Services Directive's PSC. The findings indicate that, on average, the already achieved economy-wide impact is 0.13% of GDP, and the predicted additional impact from further streamlining could reach 0.15% of GDP in the medium run and 0.21% of GDP in the long run. This suggests that the Member States could reap significant additional gains by pursuing tangible improvements in the PSC implementation, first and foremost its effective capability to benefit all the involved businesses. This note demonstrates the importance of a swift and more ambitious implementation of the Services Directive by the Member States accompanied by enhanced governance and enforcement mechanisms at the EU level, both commensurate with the estimated high potential gains.
4
Contents General introduction.............................................................................................................. 10
Part 1: Effects of sectoral barriers reduction ...................................................................... 12
5.1. Explaining sectoral trade and FDI: gravity models....................................................... 25
5.2. Explaining sectoral labour productivity: bringing together international and domestic channels ................................................................................................................ 28
6.3.1. Sensitivity to the “partial reduction” parameter..................................................... 34
6.3.2. Sensitivity to unequal weights of different requirements....................................... 35
6.4. “What if” scenarios: beyond the current barrier reduction ........................................... 36
7. Conclusions to Part 1........................................................................................................ 37
Part 2: Assessing the economic impact of setting up Points of Single Contact: an approximation based on the Doing Business ....................................................................... 39
Annex III: Country and sector level data on barriers (Part 1) .............................................. 93
Annex IV: Country-specific results: GDP impact of setting-up PSC before the DSGE (Part 2) .................................................................................................................... 104
Annex V: Country-specific results: GDP impact of setting up PSC after the DSGE (Part 2)................................................................................................................................ 105
6
General introduction
Services constitute a large and increasing part of the EU economies and are important determinants of competitiveness (as “inputs” in exports or as export facilitators) and growth. However, while the internal market for goods has been functioning reasonably well, the Single Market for services is not equally developed. Due mainly to the specific characteristics of services (e.g. traditionally non tradable, asymmetric information between provider and consumer) services have been highly protected and sheltered from international competition. The Services Directive has significantly challenged this situation and it represents a major effort towards the creation of a truly integrated internal market for services. An internal market for services activities means that services should be able to move across national borders as easily as within a single national market. This implies guarantying the freedom of establishment of nationals/companies of a Member State in the territory of another Member State and the freedom to provide services within the EU across borders without the need for an establishment in the Member State where the service is provided. By removing unnecessary barriers which hamper both international trade and investment and domestic production in the services sectors covered, the Directive is expected to significantly stimulate growth. The Directive has a horizontal nature and a broad scope in terms of sectors and requirements covered. A large variety of services sectors are covered (represents more than 40% of GDP in the EU) such as retail and wholesale trade, construction and crafts, professional services, tourism, leisure sectors, etc.1 Together with the freedom of establishment and the freedom to provide services, a main pillar of the Directive is the administration simplification it requires from Member States. This is guaranteed via: i) a general obligation to review and simplify procedures and formalities; ii) the requirement to set up "Points of Single Contact" through which service providers have to be able to get all relevant information and to complete all procedures and formalities relating to the cross-border access to and exercise of a service activity; iii) the obligation by Member States to make possible the completion of all formalities and procedures by electronic means, including for service providers from other MS. The Services Directive was adopted in December 2006 and its transposition period ended in December 2009. Over two years after the transposition deadline, the full implementation of the Directive is not yet completed despite considerable progress by a large majority of Member States, some of them opting for an ambitious implementation. In the current crisis circumstances however, the untapped growth potential still offered by the liberalisation effort of the Directive cannot be dismissed. This note presents work done by the Commission Services aiming at quantifying the benefits from the implementation of the Directive across all Member States. This is the first attempt to assess its economic impact taking into account the actual way it has been implemented across Member States. This is an important consideration that somehow limits the insights from previous estimates that assumed a homogeneous implementation across countries and sectors (sometimes full elimination of barriers), while the reality shows a considerable heterogeneity in the degree of implementation across countries. The note is divided in two parts, the first
1 Important sectors excluded are financial, telecommunications, transport services and healthcare, most of them covered by other EU internal market legislation.
7
one estimates the economic effects of the reduction or elimination of a number of important existing requirements across specific services sectors and countries; the second one approximates the economic effects of setting up Points of Single Contact, by estimating the impact of the reduction in the procedural requirements related to setting up the affected service providers, and thus in the cost and time to deal with them.
8
Part 1: Effects of sectoral barriers reduction
1. Introduction
A true European internal market for services needs to guarantee freedom of establishment and freedom to provide services across borders. This part of the note deals with the estimation of the economic impact from the reduction of sectoral barriers that obstruct the two fundamental freedoms of the Single Market in the context of the implementation of the Services Directive by Member States. Thanks to the new information gathered in particular during the process of “mutual evaluation” carried out by Member States and the Commission throughout 20102 as well as to other sources of information including experts knowledge, it has become possible to use data on the actual implementation of the Directive (the picture on barriers obtained dates back from end 2011). However, previous studies had to assume a homogeneous implementation across Member States and sectors. Given the observed heterogeneity of implementation, the estimates presented results in significant improvements on the usefulness of the insights from the exercise.
This economic evaluation also looks at different transmission channels through which the sector-specific reform effort affects the economy and it combines, into a single conceptual framework, international and domestic channels of transmission of the barriers reduction. It is important to emphasise that previous studies did not take into consideration the domestic channel, thus very likely underestimating the impact of the Directive (although on the other hand, they were overestimating it by assuming a full and homogeneous implementation across countries).
In a note presented to the EPC in 2009 at discussed at LIME,3 the Commission proposed a methodology to assess the economic impact of the Directive based on the actual way Member States would implement the Services Directive. With the information on actual implementation now available, Part 1 of this note further develops the original methodology and presents the main findings. The conservative estimated impact of the actual implementation of the Directive on GDP is a 0.8% increase at EU level, with a large dispersion across countries whose GDP impact ranges from below 0.3% to more than 1.5%. Additional gains could be reaped, still within the scope of the Directive, if Member States reduced their remaining sectoral barriers to the average level of sectoral barriers in the EU after implementation. Under this not very demanding scenario the EU-level GDP effect would amount to a 1.2% increase in total (i.e. additional 0.4 percentage points of GDP relative to the impact of already achieved barrier reduction). A more ambitious effort under which Member States move towards the level of restrictions of the five best countries per sector would bring additional gains of up to 1.6% of GDP (on top of the 0.8%). This scenario is close to the full elimination of barriers across most sectors. Although most of effect on GDP comes through
2 The mutual evaluation, a process foreseen by the Services Directive, was an innovative, co-operative and flexible approach, which fully involved Member States. They had the opportunity to analyse each other’s legislation and bring it in conformity with EU law. See more at http://ec.europa.eu/internal_market/services/services-dir/mutual_evaluation_en.htm 3 ECFIN B2 D(2009) 409221 on “Challenges for deepening the Single Market”.
9
the domestic channel, thus through the direct impact of barrier reduction on labour productivity in services sectors, this is due to the way it is modelled in the analysis which reflects only short-term impacts on productivity.4
These GDP effects are however an underestimation of the total effects on GDP for several reasons. First, the estimates do not take into account all changes brought about by the implementation of the Directive across Member States. This is so because not all the requirements and sectors covered by the Directive were assessed, only those selected by experts at the Commission Services. The sectors included in the assessment account for about 20% of GDP and the reported impacts are thus triggered by barriers changes only in those sectors. Services activities covered by the Directive but where barrier changes are not included in the analysis account for approximately an additional 20% of GDP. Given the linear characteristic of the model used to translate the sector-specific impacts into overall GDP impacts, the effect on GDP will double under the assumption that the barriers' change of the sectors not-covered by the estimations is on average identical to that of the sectors covered. This is not however necessarily the case as one of the criteria used for the selection of sectors was the fact that they seemed to be more affected by the provisions of the Directive across a larger number of countries. In any case the results reported in the study refer only to the sectors covered by the analysis and thus not extrapolation to the rest of the sectors under the Directive is done.
Second, trade and FDI flows in services sectors should significantly increase as a result of barrier reduction (7% for trade and 4% for FDI, both at EU level) reflecting the effects on cross-border provision and on foreign establishment of the barriers reduction. In the estimates, labour productivity does not significantly react to trade and FDI increases in the short term, which is not surprising given that the main effects are expected in a longer term. This implies that in the longer term, the GDP impact of the implementation of the Directive would be larger and thus that the GDP effects reported can be considered a lower bound of the total effects of the Service Directive.
The subsequent sections present the conceptual framework followed in the analysis (Section 2); summarise some of the key references in the literature on the impact of the Services Directive and motivate the conceptual framework adopted (Section 3); describe the data used for the estimations, both the novel dataset on barriers and data on other key variables (Section 4); describe the econometric methodology (Section 5); discuss the estimation results for the reform effort so far as well as for possible further barrier reductions, including sensitivity analysis to the main assumptions (Section 6); and conclude with some policy implications (Section 7).
2. Analytical framework
The proposed analytical framework includes four steps:
1. measurement of barriers before and after the Directive for the services sectors covered by the Directive and included in the analysis
4 This study does not assume that all regulation in services is bad for the economy: on the contrary this is the empirical question it addresses. It is not the aim or the role of this analysis to assess whether some of the remaining regulations may be justified and proportional.
10
2. estimation of the intermediate impact of barrier reductions in those sectors through: 5
a. international channel that includes:
i. impact on foreign direct investment (FDI) of reduction of barriers affecting establishment, and
ii. impact on trade of reduction of barriers affecting cross-border provision of services
b. domestic channel, measured as the direct impact on labour productivity of reduction of barriers affecting domestic establishment.
3. estimation of the total term impact on labour productivity in the selected sectors affected by the Directive; that is both the indirect impact through the international channel (effect on productivity of trade and FDI) and the direct impact through the domestic channel.
4. finally, estimation of the impact on GDP as determined by the link between labour productivity and GDP. Practically, due to data limitations, the estimated impact on labour productivity from step 3 is only a short-term impact from the domestic and international channel, and the GDP effect are likely to be a lower-bound, particularly regarding long-term effects from trade and FDI. For this final step, a general equilibrium model that includes inter-sectoral links and international spillovers is used.
Figure 1 below, which illustrates the transmission channels of the effects of the Directive, is also a reflection of the econometric approach followed in steps 2 and 3. The top half of the figure reflects step 2a, where trade and capital flows are the dependent variables, rather than exports, imports, inward and outward foreign direct investment (FDI). This is because exports of one country are at the same time imports of another country and, similarly, inward FDI is outward FDI, considering all flows inside an economic area such as the Single Market. It also means that exports share common determinants with imports (and the same for inward and outward FDI).
5 Only the levels of barriers across countries and sectors are assumed to affect economy activity. Thus heterogeneity of barriers is not considered. There are both conceptual and empirical reasons for this choice: on the conceptual front it is far from clear how heterogeneity should be defined (bilaterally as in the CPB studies, see Section 3, or multilaterally) or whether heterogeneity of the number of barriers is indeed a good proxy for the heterogeneity firms are facing as the exact content of the requirement matters more than its mere existence; on the empirical front the data used did not show enough variability across restrictions within sectors and countries.
11
Figure 1: The conceptual framework used in the econometric analysis (Steps 2 and 3)
Note: For transparency, the chart does not include co-determinants of trade, FDI, and productivity (i.e. control variables). They are included in Figures 4 and 5.
On the contrary, the bottom half of Figure 1 shows that the flow directions are distinguished when addressing Steps 2b and 3, since the impact of exports on productivity can be different from the impact of imports and the same for inward and outward FDI. Once the effects on sectoral trade and FDI are estimated in Step 2a, a model is estimated which explains sectoral productivity with barriers for domestic firms (the direct, domestic channel) as well as inward and outward flows of services and capital (the indirect, international channel) in the same sectors.
3. Literature review
3.1. Previous estimates of the economic impact of the Services Directive6
These studies generally followed a two-step approach: (i) identification of existing barriers to services provision, (ii) assessment of the economic impact of the elimination of these obstacles. Before turning to an overview of the main aggregate results from the existing studies which are listed in Table 1 in Annex II, the following caveats should be stressed: • A main shortcoming of many of these studies is that they are based on the initial
Commission proposal (the "Bolkestein" directive) and do not take into account changes introduced during the legislative process (for example, the country of origin principle, CoOP). A few, relevant exceptions are mentioned in Annex II.
6 This section presents only a selection of existing studies whose coverage is the EU (aggregate and country level). Existing country-specific estimates of the effect of the Directive are not discussed here.
12
• Most studies do not deal with the impact of the Directive from reduction of barriers to foreign establishment, thus no impact on FDI flows is estimated, although there are some exceptions as indicated in Annex II.
• None of the previous studies takes into account the effect that barriers to establishment could have on domestic activity.
• Most studies present conservative estimates, because the dynamic effects of competition on productivity and innovation are not considered. This criticism applies particularly to the Copenhagen Economics and CPB studies (see below) as both focus on the static gains from opening up European services markets (see Vogt, 2005).
• Some studies use OECD indicators on product market regulation in services as a proxy of the barriers affected by the Directive. However, the scope of the Directive in terms of requirements (barriers reduction) does not necessarily overlap with the restrictions covered by OECD indicators. This applies particularly to the CPB studies.
• Building up on work done on the measurement of the degree of product market regulation by OECD researches, an index (and sub-indices) of policy-heterogeneity in services was developed based on a bilateral comparison of some 200 aspects of regulation grouped into five policy regulation domains
• All studies assume the homogeneous implementation of the Directive. However, the Directive leaves some room to Member States when deciding which existing regulation is not in conformity with the criteria set out in the Directive and hence needs to be lightened or abolished. Given the broad sectoral scope of the Directive and the room for assessment left to the Member States, a heterogeneous implementation degree has been expected across the countries.
A review of the main studies at EU level is presented next with a focus on the empirical approach followed and main aggregate results. Given the heterogeneity across studies in terms of methodology, coverage and data it is not easy to come up with a single figure summarising the economic effects of the Directive. Still, a GDP increase in the range of 0.5-1.5% is expected in the literature.
3.1.1. "Copenhagen Economics" approach
Copenhagen Economics (2005a) study suggested an economy-wide increase in employment by around 600,000 (0.3%) and in GDP by 0.6%. The study included the country of origin principle (CoOP).
The starting point of the study (done at the request of the European Commission) was to construct indices for barriers in services industries (indexes of market restrictiveness assigning different weights to different categories according to their economic relevance). In a second step the direct effect of the existing barriers on firms' prices and costs was econometrically estimated. These effects were then converted into tariff equivalents (thus tariffs that would have the same effect on prices and costs as the barriers). In a final step, the
13
effects of a reduction of the barriers in services (the elimination of the tariffs equivalent) were simulated using a computable general equilibrium model covering 25 Member States is done.7
A main shortcoming of the study is the assumption of the country of origin principle. The effects of the elimination of the CoOP were estimated in a special study for the UK government (Copenhagen Economics, 2005b). According to the study the provisions relating to the CoOP account for around 7-9% (€2-4 billion p.a. across the EU) of the welfare gains for the EU.
3.1.2. "CPB" approach
Studies by researchers at the CPB (Netherlands Bureau for Economic Policy Analysis) suggested an increase of GDP of 0.4% to 1.5% in the long run (by 2040). These estimates however included the CoOP.
Several CPB studies have analysed the impact of existing barriers to the cross-border provision of services. The core argument (and what makes the approach different from the Copenhagen approach), is that it is not only the degree of regulation that matter, but also the heterogeneity of regulations across EU countries. Building up on work done on the measurement of the degree of product market regulation by OECD researches, an index (and sub-indices) of policy-heterogeneity in services was developed based on a bilateral comparison of some 200 aspects of regulation grouped into five policy regulation domains.
Using a gravity model, Kox et al. (2004) estimated the effects of heterogeneity on bilateral intra-EU trade and intra-EU FDI in services. The effect of the Directive on intra-EU trade and FDI was then simulated using the estimated elasticities and the expected reduction in the heterogeneity index. The sample covered 14 "old" EU countries8 and focused on an aggregated "commercial services" sector. The main finding of the study was that commercial services trade in the EU (intra-EU flows) could increase by 30 to 60% while the foreign direct investment stock in services might rise by 20 to 35%.
Gelauff and Lejour (2006), De Bruijn et al. (2006, 2008) used a computable general equilibrium model (WorldScan) covering 19 EU countries to translate the effects of a reduction in regulation heterogeneity into economy-wide effects. The 30% intra-EU trade in commercial services (lower bound of the Kox et al. 2004 estimates) translated into a modest increase at macroeconomic level given the low share of commercial services in total EU trade. As a consequence the estimated total intra-EU trade increase was of 2 to 5%. GDP could rise by 0.3 to 0.7% according to the estimations. The results of these studies were considered as a lower bound given that the model used did not include FDI flows and lacked economies of scale. In a latter study Lejour et al. (2007, 2008) focused on the effect of the Directive via FDI flows and found that FDI in services could increase by 20 to 35%. GDP in the EU25 could increase by 0.4 to 0.8%. Combining the FDI and trade effects gives a total GDP effect ranging between 0.4-1.5%.
De Bruijn et al. (2006, 2008) also calculated the impact of excluding the CoOP, which accounted for about a third of the trade-effects of the directive: intra-EU services trade could increase by 20 to 40%. Without the principle, the welfare effects on the induced trade growth were lower: GDP could rise by 0.2 to 0.4% (as opposed to 0.3 to 0.7). As mentioned above, 7 BG and RO excluded. 8 Belgium and Luxembourg are aggregated.
14
the model used did not include FDI and lacked economies of scale so the impact was considered as an underestimation.
3.1.3. "Partial equilibrium approach"
The aggregate GDP effect of the Directive is an increase of 0.7%. Employment will increase by 515,000 persons (EU-15) and by 612,000 persons (EU-25).
Breuss and Badinger (2006) used a partial equilibrium, econometric approach to estimate the effects of the Services Directive. The study estimates in a first step the effects of the Directive on productivity and competition (mark-ups) and in a second step the derive effect on employment and value added. The findings suggested that competition would be the main transmission channel. In particular the Directive would decrease the EU mark-up by 3.75% (or 0.127 percentage point for each 1% increase in imports). The aggregate GDP effect was an increase of 0.7%. The sample mainly contained 11 "old" Member States.9
Badinger et al. (2008) extended the previous study and estimated the effects of the reduction of the barriers to FDI in services industries. The results were an 18.9% increase in FDI inward stocks in the four selected services industries (construction, distribution, hotels and restaurants and business services). The gains in terms of total value added were around 0.8% (via the FDI channel). Combining the results with the effects via the trade channel (0.7%) gave a total GDP growth of 1.5%. Badinger et al. (2008) also estimated the effects of eliminating the CoOP. Under the assumption that the watering down of the original SD would reduce liberalisation effects by one-third, the proportionate reduction of the macroeconomics effects was expected, accordingly the increase of GDP would go down to 1%.
3.2. Other studies behind the conceptual framework
3.2.1. The role of the quality of human resources and ICT infrastructure
Besides the regulatory barriers, quality of information and communication technology (ICT) infrastructure and quality of available human capital (human resources) seem to be two important factors which are expected to influence the ability to produce competitive services. Thus it should also determine the export capacity in these sectors and the attractiveness of the services production locations to foreign direct investment (FDI) – both export-oriented and market-seeking. Actually, the two factors may be intertwined because more advanced technologies require more skilled users able to exploit new opportunities (Autor et al., 2003). In a longer term, the services providers with more skilled human resources are expected to be more innovative (Vinding, 2006; Consoli, 2007), thus becoming even more productive as well as exporting more and attracting more FDI too. Finally, there may be positive feedback loops and virtuous cycles as proposed by Pugno (2006): many types of services, such as education and cultural services, contribute to human capital formation, thus further enhancing growth. Consequently, the quality of human resources and the quality of ICT infrastructure are included in our conceptual framework as potentially important control variables.
9 DK, LU, IE, PT were excluded due to missing data.
15
These ideas seem to be supported by the research related to 6th and 7th Framework Programmes’ EU KLEMS project10 and the series of research papers produced within the two projects under the 7th Framework Programme (SERVICEGAP and INDICSER),11 which focus on the measurement and explanation of drivers of the performance (mainly in terms of productivity) of services, as well as by the academic research on trade and FDI in services. In particular, Inklaar et al. (2008) found that increased accumulation of (i.e. more investment in) ICT capital and in human capital contributed substantially to labour productivity growth in market services across all European countries and the US, Bertschek et al. (2010) highlighted the role of ICT as a productivity driver in services and a facilitator of outsourcing, while O’Mahony and Peng (2010) demonstrated the significance of accumulative effects of employee training for productivity.
As regards the trade literature with a focus on services, Freund and Weinhold (2002) found out that internet development in the exporting country stimulated export in selected services sectors to the US in 1990s. Using an augmented trade equation and a more extensive country-level dataset, Choi (2010) showed that increase in internet access facilitated international service trade. Head et al. (2009) looked at the large sample of countries and different categories of service trade and revealed a downward trend in “distance costs” over time which they attributed to advances in ICT. Similarly, Kandilov and Grennes (2012) argued that – while distance remained an important determinant of the magnitude of trade in services in the gravity models – innovations in ICT significantly reduced the costs of offshore outsourcing of services. They demonstrated that that the impact of the distance almost disappeared if the influence of ICT was controlled for.
Concerning the research on FDI in services, Davies (2005) presented an interesting theoretical model, in which the horizontally differentiated skilled labour endowments of different countries are imperfect substitutes for one another. Multinational firms undertake FDI to combine these endowments, resulting in the fragmentation of the production of skill-intensive services across borders. As a result, FDI is stimulated by the supply of skilled labour of each partner country. The model has been supported by the data on US outward FDI.
3.2.2. The role of trade and FDI as productivity drivers
The literature on the effects of trade and FDI specifically in services seems to be at a relatively initial stage of development, not least due to the difficulty in obtaining reliable data, especially across countries, sectors and time. Moreover, the tradability of many services and an increase in FDI in services is a relatively recent phenomenon related to the globalization and reduction of protectionism in services, which lags behind the liberalization of trade in goods. Nevertheless, by some analogy to trade and FDI in sectors producing goods, one can expect that openness to flows of services and capital in services sectors can have implications for productivity via multiple channels: competition, scale effects, imitation, technology/organization spillovers etc.
10 EU KLEMS (Productivity in the European Union: A Comparative Industry Approach / Growth and Productivity Accounts, http://www.euklems.net). 11 SERVICEGAP (Impact of Service Sector Innovation and Internationalisation on Growth and Productivity, http://servicegap.org/publications/) and INDICSER (Indicators for Evaluating International Performance in Service Sectors, http://indicser.com/publications.html).
16
As far as the role of FDI is concerned, Rivera-Batiz and Rivera-Batiz (1990) proposed a model in which foreign capital inflows stimulate specialization in producer services, enhancing their productivity and that of firms using services as inputs. The impact occurs through in two steps: a relative factor price effect in a first round and a market size effect in a second round. First, foreign investment reduces the fixed costs of setting-up and operating new services, thus stimulating entry of new services firms. Subsequently, capital inflows induce entry into the service sector by augmenting industrial output and increasing the demand for services. Doytch and Uctum (2011), employing a comprehensive cross-country time-series (panel) dataset, appear to have confirmed the growth-enhancing effect of inward non-financial FDI within the receiving services sectors but also to have rejected the overall positive effect for manufacturing, mainly explained by the shift of capital from manufacturing to services (de-industrialization).
Moving to trade and looking only at the correlations, Breinlich and Criscuolo (2011) showed that services firms in the UK were quite similar to manufacturing firms as both groups exhibited a strong association between international trading and productivity. They concluded that heterogeneous firm models could be useful for explaining trade both in goods and in services. As regards the possible causality, Love and Mansury (2009) modelled a simultaneous relationship between export intensity and productivity considering a selection bias, i.e. a higher likelihood of more productive firms becoming exporters, for a sample of firms in US business services. They observed that productivity was positively linked both to exporting and to increased exposure to international markets. In an international perspective, Miroudot et al. (2012) found strong evidence that services sectors which face lower trade costs tend to be more productive. They explained it with the restructuring or exit of less productive firms and the transfer of resources to larger, more productive ones. They estimated that a 10% reduction in trade costs was associated with a TFP increase by about 0.5%.
Blind and Jungmittag (2004) presented a comprehensive study for Germany which looked at the effects of all the four international flows (exports, imports, outwards and inward FDI) in services firms. They focused on the innovation effects, but it can be assumed that more innovation usually leads to higher productivity. The authors showed that both inward FDI and imports had highly significant positive effects on product and process innovations. Vice versa, the export and foreign production activities of domestic firms supported innovations too. They attributed these effects mainly to pressure from foreign competitors and a build-up of firm-specific asset needed to overcome entry barriers to foreign markets.
4. Data
4.1. Data on barriers
4.1.1. Definition of barrier variables
The data on barriers before and after the implementation of the Services Directive has been prepared by the Commission Services on the basis of the information collected in particular during the process of mutual evaluation of the EU Member States as well as other sources that
17
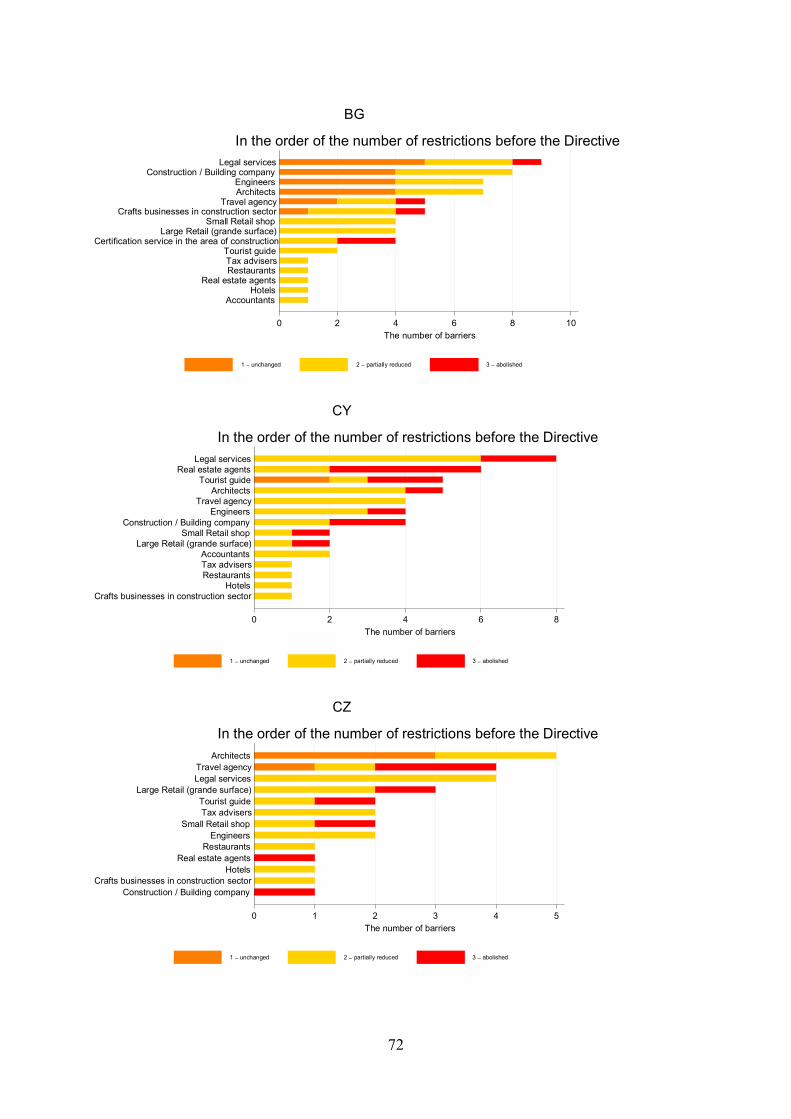
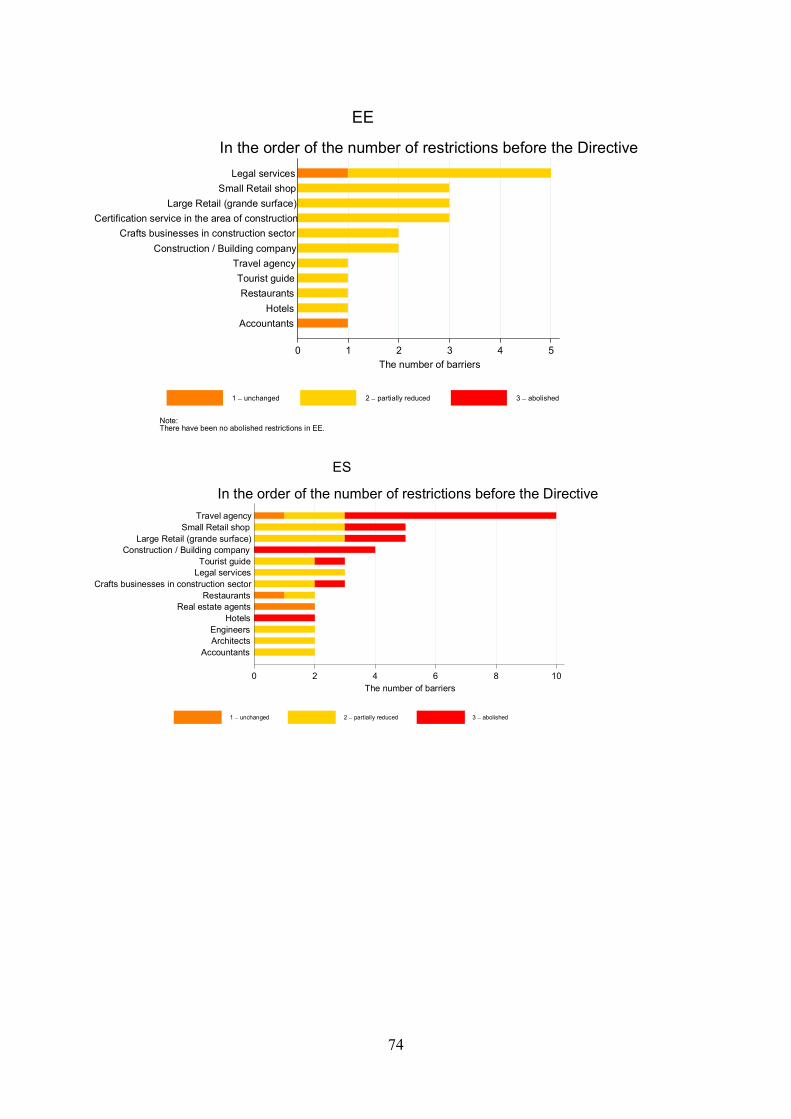
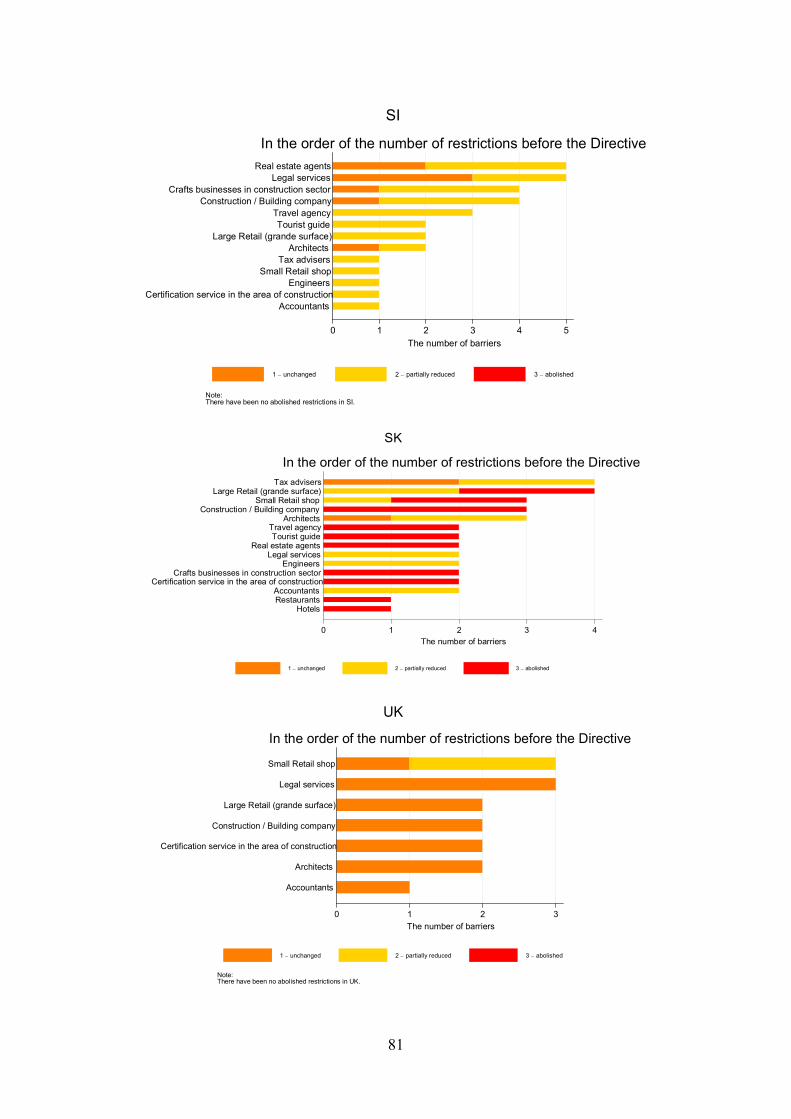
include experts' knowledge.12 The data on barriers before the Directive reflects the situation in the period before the implementation deadline of the Services Directive (2009). The picture on barriers after the Services Directive – which are not used in the regressions, but are used to calculate the change in barriers, as explained below in more detail – dates from end of 2011.13 The data covers 20 specific authorisations or requirements, each of them before and after the implementation of the Directive, for 15 selected services sectors in the 27 EU Member States (see Table 2 in Annex II). The requirements included in the analysis are considered the most relevant for the cross-border provision and establishment of services activities and were declared by a large number of countries. Similarly, not all sectors affected by the Directive are included in the analysis and some relatively large sectors are left out, notably wholesale; the activities selected represent however those sectors which seem to be more affected across a large number of Member States by the Directive's provisions.14 The sectors covered represent approximately 20% of EU GDP. Country and sector level data on barriers is presented graphically in Annex III.15
Since the data on barriers stemming from the mutual evaluation is qualitative, a barrier indicator is constructed – aggregated at the sector level for each country – as a simple mean across restrictions translated into 0 (non-existent barrier) or 1 (existing barrier) for the period before the Directive and as 0 (non-existent), 0.8 (reduced), or 1 (fully maintained) for the period after.16 The value 0.8 implies that in case a restriction was not abolished but reduced, it amounted to a reduction of a barrier by 20%; this is a key assumption of the analysis based on the judgement of experts dealing with the Services Directive in the Commission Services.17 Another important assumption is the equal weights given to restrictions when averaged to the
12 COMMISSION STAFF WORKING PAPER (SEC/2011/0102 final) “On the process of mutual evaluation of the Services Directive” accompanying document to the COMMUNICATION FROM THE COMMISSION TO THE EUROPEAN PARLIAMENT, THE COUNCIL, THE EUROPEAN ECONOMIC AND SOCIAL COMMITTEE AND THE COMMITTEE OF THE REGIONS “Towards a better functioning Single Market for services – building on the results of the mutual evaluation process of the Services Directive” (COM(2011)20 final). See also http://ec.europa.eu/internal _market/services/services-dir/mutual_evaluation_en.htm. In addition, external studies were used; they will be published on the Commission's website. The Commission services were also becoming aware of restrictions through citizen complaints. 13 It could be questioned whether the observed barrier reduction was due to the Services Directive as Member States could have decided to open up their services sectors at the same time as the Directive implementation but with independence of the Directive. Even if that was the case, the economic effects of barrier reduction would remain the same as well as estimated effects. Moreover, although theoretically deregulation in the concerned sectors could have resulted from other causes than the implementation of the Services Directive, in practice this seems highly unlikely. Under the Directive, the reduction of barriers has become an obligation; it does not seem likely such reduction would have happened without the Directive (as an equilibrium of a non-cooperative game in a game-theory and political-economy sense). Also note that the Commission Services have not encountered any barrier increases. 14 Figure 3 in Annex II contains information on the approximate GDP shares of the services covered by the analysis. Other sectors excluded from this analysis but covered by the Directive are: training and private education services, rentals and leasing services (including car rental), information society services (e.g. publishing for print and web, news agencies, computer programming), many business-related services (e.g. advertising, office maintenance, management consultancy, event organisation, debt recovery, and recruitment services), and leisure services other than travel agencies (e.g. sports centres and amusement parks). 15 It was not possible to fill in the dataset for all the restriction-sector-country combinations – about 16% of 8100 (20×15×27) combinations had to be finally left blank. Lack of information and the fact that some restrictions are sector-specific are the main reason. 16 This translation is summarised in Table 3 in Annex II. 17 In fact, the degree of partial reductions could vary across different requirements, sectors and countries. According to the Commission experts, 20% captures the most realistic average barrier reduction value.
18
country-sector level mean (i.e. simple mean). The sensitivity of the results to these parameters, the 20% partial reduction and the equal weights of restrictions, is analysed in Sections 6.3.1 and 6.3.2.
As depicted in Figure 1 above, trade is influenced by restrictions affecting the cross-border provision of services, while FDI and domestic activity are affected by restrictions that restrict the establishment of (foreign and domestic) services providers. Of the 20 restrictions, 12 affect trade and 16 FDI and domestic activity; some of the restrictions are common to both cross-border provision and establishment. The two barrier indicators constructed are presented in Table 2 in Annex II. This barrier-level indicator per sector and country is the key explanatory variable used in the regressions below.
4.1.2. Stylised facts on barriers
The data shows both the decline in the level of barriers and the overall decline in their heterogeneity (dispersion) across all countries and sectors (see Figure 1 in Annex I). The Commission Services have not encountered any barrier increases across sectors or countries. As shown in Figure 2 below, the barrier reduction varies significantly between the Member States: from below 10% in Austria and Malta in both types of barriers – to establishment and cross-border provision – to more than 50% in Spain or Slovakia, again for both barrier types, with half of the countries above about 30–35%. It should be stressed that low barrier reduction does not necessarily imply high barriers after the Directive as it may well reflect a relatively good starting point in the form of low barriers already before the Directive. Indeed, there is a negative correlation across the Member States between the initial level of barriers and the magnitude of barrier reduction – see Figure 2 of Annex I.
Figure 2. Average barrier changes
-60
-40
-20
0
%
SESK
ESLU
CYGR
CZPL
PTDE
LVIT
UKFR
HURO
LTBG
BEFI
EEIE
SIDK
MTAT
NL
Barriers to cross-border provision (trade)
-60
-40
-20
0
%
SKES
GRLU
SEPL
CYIT
LVPT
HUFR
LTUK
RONL
BEEE
FIIE
BGCZ
DKSI
DEAT
MT
Barriers to establishement (FDI and domestic activity)
In addition, the following patterns are also detected at country level and graphically summarised in Figure 2 of Annex I: (i) partial reductions and full abolishment of restrictions as two alternatives for barrier reduction; (ii) higher initial number of restrictions associated with a higher share of abolishment in all restrictions.
19
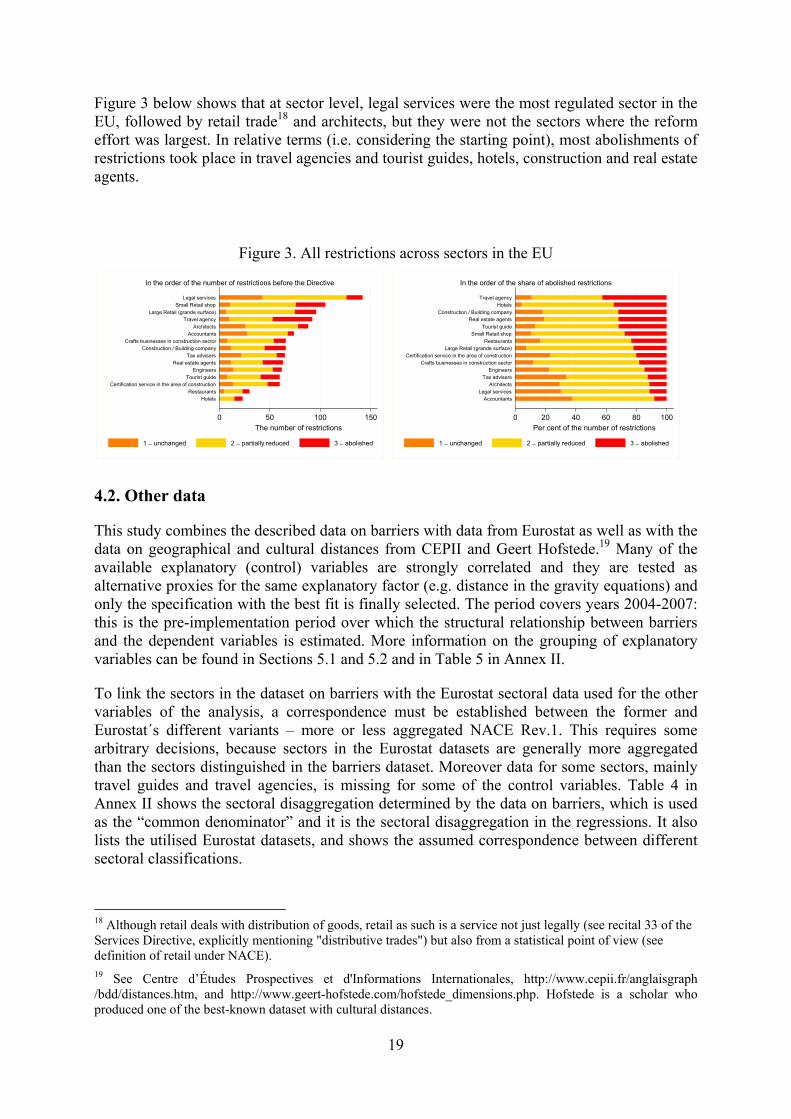
Figure 3 below shows that at sector level, legal services were the most regulated sector in the EU, followed by retail trade18 and architects, but they were not the sectors where the reform effort was largest. In relative terms (i.e. considering the starting point), most abolishments of restrictions took place in travel agencies and tourist guides, hotels, construction and real estate agents.
Figure 3. All restrictions across sectors in the EU
0 50 100 150The number of restrictions
Legal servicesSmall Retail shop
Large Retail (grande surface)Travel agency
ArchitectsAccountants
Crafts businesses in construction sectorConstruction / Building company
Tax advisersReal estate agents
EngineersTourist guide
Certification service in the area of constructionRestaurants
Hotels
In the order of the number of restrictions before the Directive
1 − unchanged 2 − partially reduced 3 − abolished
0 20 40 60 80 100Per cent of the number of restrictions
Travel agencyHotels
Construction / Building companyReal estate agents
Tourist guideSmall Retail shop
RestaurantsLarge Retail (grande surface)
Certification service in the area of constructionCrafts businesses in construction sector
EngineersTax advisers
ArchitectsLegal services
Accountants
In the order of the share of abolished restrictions
1 − unchanged 2 − partially reduced 3 − abolished
4.2. Other data
This study combines the described data on barriers with data from Eurostat as well as with the data on geographical and cultural distances from CEPII and Geert Hofstede.19 Many of the available explanatory (control) variables are strongly correlated and they are tested as alternative proxies for the same explanatory factor (e.g. distance in the gravity equations) and only the specification with the best fit is finally selected. The period covers years 2004-2007: this is the pre-implementation period over which the structural relationship between barriers and the dependent variables is estimated. More information on the grouping of explanatory variables can be found in Sections 5.1 and 5.2 and in Table 5 in Annex II.
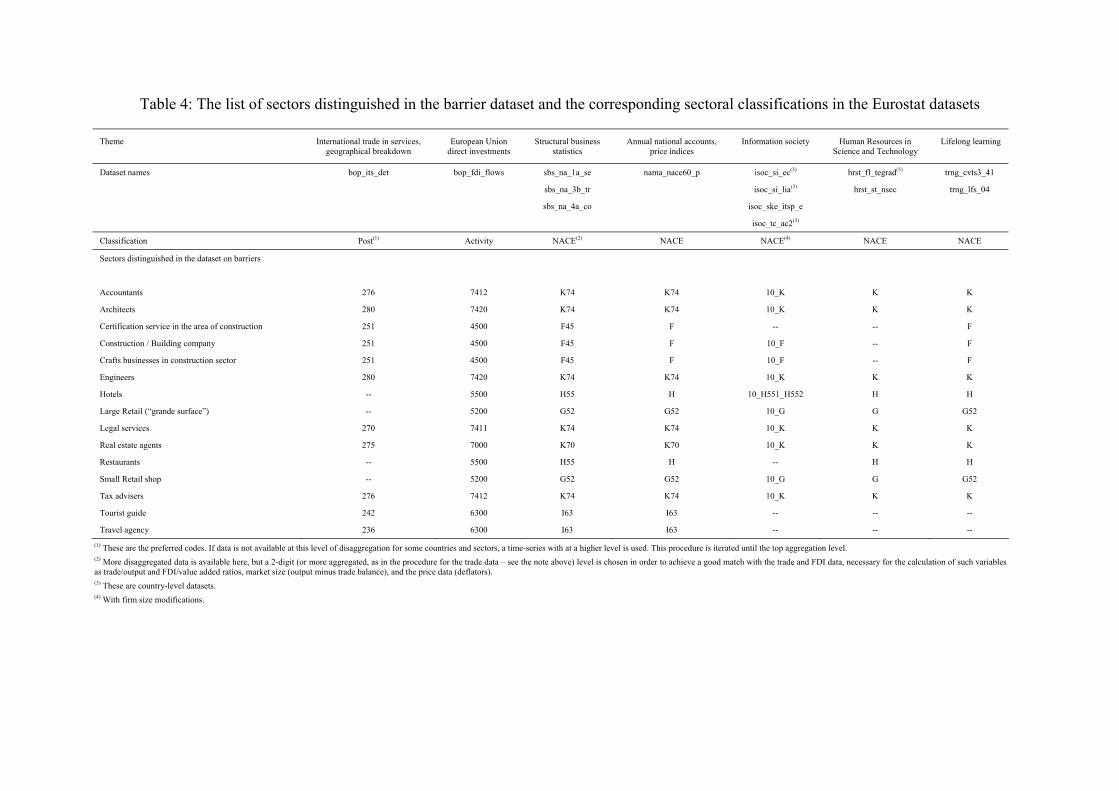
To link the sectors in the dataset on barriers with the Eurostat sectoral data used for the other variables of the analysis, a correspondence must be established between the former and Eurostat´s different variants – more or less aggregated NACE Rev.1. This requires some arbitrary decisions, because sectors in the Eurostat datasets are generally more aggregated than the sectors distinguished in the barriers dataset. Moreover data for some sectors, mainly travel guides and travel agencies, is missing for some of the control variables. Table 4 in Annex II shows the sectoral disaggregation determined by the data on barriers, which is used as the “common denominator” and it is the sectoral disaggregation in the regressions. It also lists the utilised Eurostat datasets, and shows the assumed correspondence between different sectoral classifications.
18 Although retail deals with distribution of goods, retail as such is a service not just legally (see recital 33 of the Services Directive, explicitly mentioning "distributive trades") but also from a statistical point of view (see definition of retail under NACE). 19 See Centre d’Études Prospectives et d'Informations Internationales, http://www.cepii.fr/anglaisgraph /bdd/distances.htm, and http://www.geert-hofstede.com/hofstede_dimensions.php. Hofstede is a scholar who produced one of the best-known dataset with cultural distances.
20
Bilateral sector-level FDI and trade flows are the dependent variables in the estimation of the effects of the Directive through the international channel (Step 2a of the analytical framework). Only intra-EU trade and investment flows are considered, because the Services Directive is expected to influence predominantly these flows. FDI is a financial concept from a balance of payments statistics, broader than capital expenditure on fixed assets. In the Eurostat dataset, as in other statistical sources, it is measured in net terms, i.e. gross investment minus disinvestment. Hence, some flows (3.6% of all data on FDI in the matched services sectors, in terms of the number of observations) are negative. These observations are dropped, since the dependent variables enter the equation in logs. Also, a few observations for trade are negative and dropped,20 which, in contrast to FDI, seems to result from measurement errors rather than the definition. To minimise the effect of these errors, import flows rather than export flows of services are used, because the proportion of negative observations (in terms of value) is larger for exports.
Labour productivity, which is the dependent variable in Steps 2b and 3 of the analytical framework, is measured as sectoral gross value added per employee21 and comes from Eurostat´s Structural Business Statistics. The nominal productivity indicator is deflated with gross value added price indexes from Eurostat's National Accounts by 60 branches.
Because all the dependent variables are log-transformed, zero flows of trade and FDI – that is observations for those partner countries in those sectors where there is no bilateral trade or no investment – are not considered. Such observations constitute a large fraction of the data (46% for trade and 88% for FDI) since trade and particularly FDI in services seem to be highly concentrated among few partners and in some sectors only. The zero flows at the level of the whole sector (in contrast to the firm-level data) seem to reflect non-tradability or lack of data rather than impact of extremely high barriers deterring entry completely. However, the sensitivity of the estimations to the inclusion of observations with zero flows is tested with Poisson regressions (where elasticities can be estimated without the log-transformation of dependent variables).22
5. Econometric methodology
The estimation of a systematic, structural relationship between barriers and the dependent variables in services sectors, i.e. estimation of elasticities of FDI, trade, and productivity to barriers, is done for the pre-Directive period only. The period following the implementation of the Directive is still too short to see its impact fully materialised and to have enough data. Therefore, the analysis is not an ex-post evaluation of the effects of the Directive and the
20 Only 0.03% of all trade data for the sectors in the analysis. 21 Sectoral gross value added per hour worked would be a more precise indicator of labour productivity, especially for those sectors which are characterized by a high share of part time employment. However, such indicator is not available. 22 It is not obvious if the observations where the dependent variable in the gravity models equals zero (i.e. zero bilateral flows of trade or FDI) are meaningful data or represent missing relevant information. If the former is the case, Santos Silva and Tenreyro (2006, 2011) recommend using the Poisson estimator in the gravity setting where the equation is log-linearized.
21
calculation of its impact is an extrapolation or a prediction exercise.23 But although the analysis is based on the pre-Directive statistical relationships between the level of barriers across countries and sectors and their FDI, trade, and productivity, it builds upon the actual reduction of barriers, rather than full elimination.
The choice of the period is shaped by a trade-off. On the one hand, the selected period used for the estimation could not be too short so that structural rather than cyclical relationships could be captured. On the other hand, it could not be too long, so that the pre-Directive level of barriers –which is just one time point in our dataset–, can be matched with the other data on trade, FDI, productivity and control variables. In practice, the starting date for the period has been determined to large extent by the data availability (see Section 4.2).
The impact of the Directive is calculated as the estimated elasticities of FDI, trade, and productivity to barriers multiplied by barrier change before and after the Directive.24 In line with the conceptual framework presented in Section 2, the total impact of barriers is measured in terms of productivity and consists of the direct impact (domestic channel) and the indirect impact (international channel) from trade and FDI increases.25 Although different countries/sectors may react differently to restrictions (e.g. business services, being relatively mobile across borders, are expected to be more reactive to cross-border barriers than construction), the short time dimension of the dataset makes it impossible to have separate coefficients for sectors and countries. Therefore, as usual in panel data estimation techniques where the time dimension is very small, the estimated elasticities are common to all countries and sectors, i.e. there are no specific elasticities for countries or sectors, and can be interpreted as the EU-level benchmark or averaged elasticities.
5.1. Explaining sectoral trade and FDI: gravity models
Impact on trade and FDI flows is estimated in a bilateral setup – each observation is a flow from country of origin to country of destination in a specific sector and year – using gravity models, where the impact of the economic sizes of origin output and destination market as well as the distance between them are taken into account. Since the trade and investment flows are expected to be influenced by the destination country barriers, exports and outward FDI of a given country are supposed to be influenced by its partner’s barriers, while its imports and inward FDI are influenced by its own barriers.
23 Moreover even if enough time had elapsed, an ex-post evaluation would require a counterfactual which is itself a difficult exercise. 24 This barrier change is negative since barriers after the Directive are lower than the barriers before. In combination with negative elasticities, this produces positive impacts. 25 More specifically, the total impact on labour productivity is a total of: (i) the elasticity of labour productivity to the barriers to establishment × weighted average growth of barriers to establishment, plus (ii) the elasticity of trade (FDI) to barriers to cross-border provision (barriers to establishment) × weighted average growth of barriers to cross-border provision (barriers to establishment) × elasticity of labour productivity to export (FDI) ratio. In brief, the total impact can be summarised as
( ) ( )3214444444 34444444 21
()()οο
channelDomesticchannelForeign
βββαββα •••• ++++ bbb BPFPFPBFTPTPBT
where α1/2 and β1/2 are the elasticities of variable 1 to variable 2 in the relevant regression equations presented in sections 5.1 and 5.2, b•
is the weighted average growth rate of barriers to establishment (B•), and b◦ is the weighted average growth rate of barriers to cross-border provision (B◦).
22
The gravity model is a standard “workhorse” tool in empirical international economics. The equation and Figure 4 below present the general model for the gravity regressions employed. G in the equation represents the “gravity force” reflected in trade flows or in FDI from an exporting country e to an importing country i in a services sector s in year t. Here, “exporting” and “importing” countries denotes either partners in trade or in FDI, i.e. origin and destination of FDI respectively.
eistst
eieiei
isicsesteist
tHRICTLanguageProximityDistance
BCYG
ε+++++++++
++=
αα9
87654
321
αααααlnα
lnαlnαlnαln
Figure 4. The gravity models for trade and FDI
As far as the explanatory variables in the equation are concerned, Y denotes the sectoral production (output) in an exporting country e, C represents the market size (“consumption,” i.e. total production minus trade balance) of the same sector in an importing country i. B is the sectoral level of barriers in the importing country, i.e. barriers to establishment in the equation explaining FDI and barriers to cross-border provision in the equation explaining trade.26 The sectoral output in the exporting country and the sectoral market size in the importing country 26 To avoid losing many observations under logs, zeros for barriers are replaced by very small positive values before taking logs, which is a standard procedure in the empirical literature. An alternative would have been to drop them which would have implied losing meaningful information and thus biasing the results.
23
are the usual types of variables in the gravity models for bilateral flows. Together with the barrier indicators, these two variables are the core explanatory variables in the gravity regressions. The coefficient of barriers (α3) is expected to be negative, meaning a negative impact of barriers on trade and FDI.
In addition, five groups of control variables are distinguished in the gravity models (Table 5 in Annex II). Among them, geographical and cultural distances and “proximity” may be considered standard gravity model variables, while other variables extend the standard model with approximations of factors which are expected to influence trade and FDI in services according to the literature. In general, they represent the quality of human capital (or human resources, HR) and the utilisation of information and communication technology (ICT) infrastructure, both of which may determine the export competitiveness or even the ability to export (for example lack of broadband internet connection may impede exports of services) of country e or the attractiveness to FDI of country i.27
While the equation shows only the general model common to FDI and trade, the exact specification for FDI and trade can be different; i.e. including different proxies for the available measures of distance, proximity, languages, ICT, and HR. Since the goal of the study is to estimate as precisely as possible the impact of barriers (rather than to verify if barriers affect trade and FDI), the final specifications kept are those where barriers perform best statistically as explanatory variables. This allows us to minimize the measurement error of the impact. Finally, it should be mentioned that, among the control variables in Table 5 of the Annex, only the distance variables are log-transformed in the regression and the other are not because of their nature (shares) and/or empirical distribution (close to normal).
Finally, the regressions also include a common time trend t, a set of time dummies (vector of coefficients αt) capturing the common cycles, and a set of sectoral dummies (vector αs) which controls for the technological nature of services – some of them may be more tradeable than others and may have different FDI intensities due to diverging international transferability of know-how, resulting from lower or higher need of customisation of specific services for local markets. ε represents an error term.
The gravity regressions are estimated for a very “long panel”, with a large cross sectional dimension (exporting countries × importing countries × sectors) and a small time dimension (4 years: 2004–2007). The time period is determined by the availability of data for trade28 but also by the need to make the data for the dependent variable match the time period covered by the data for barriers, as mentioned in the introduction of Section 5. The estimator used is ordinary least squares (OLS) with cluster-robust standard errors29 to overcome the possible heteroskedasticity in a panel setting.
Last but not least, the estimations in all regressions are weighted, so that the estimated coefficients are representative for the whole EU. Each observation – in the gravity regressions 27 This is why variables HR and ICT actually become HRe and ICTe in the trade regressions and HRi and ICTi in FDI regressions. 28 The dataset on recent trade in services from Eurostat covers the period only from 2004. There is a dataset for an earlier period but its country and sectoral coverage is much worse, especially for the countries which joined the EU in 2004 or later. 29 Generalised Huber-White “sandwich” estimator for each exporter-importer-sector “clusters” (time series). The observations within each cluster may not be treated as independent, but the clusters themselves are independent. See: Huber (1967), White (1980), Froot (1989), Rogers (1993), Williams (2000), and Wooldridge (2002).
24
each country pair in each sector and year – influences the results commensurately with its economic size. In the gravity models, the size of the investment or trade flow is used as a weight.30
5.2. Explaining sectoral labour productivity: bringing together international and domestic channels
The equation and Figure 5 below depict the general model used to explain productivity P in country c in sector s in year t. The equation features a dynamic relationship, where there is some path-dependency or persistence and the current levels of productivity depend on its previous level. The level of barriers to establishment B is specified as another determinant of productivity and represents, ceteris paribus, the impact on domestic firms since the impact of barriers via trade and FDI is controlled for. This relationship between time-invariant barriers and productivity captures structural rather than cyclical determinants. Four other explanatory variables capture how the international channel influences productivity through outward and inward FDI ( F
)and F
() as well as exports and imports (T
) and T
().31 Since it is expected that
the impact from trade and FDI mainly materialises over the long-term, the estimated coefficients would only partially capture the effect of the increase in international flows. This is an important consideration to bear in mind when interpreting the results.
cstcsttcs
tcstcstcstcscstcscst
IHRICTTTFFBPP
ε++++++
+++++=
−
−−−−−
υβ1,987
1,61,51,41,321,1
βββlnβlnβlnβlnβlnβlnβln
()()
30 Mathematically, such weighting means multiplying by G the left and the right hand side of the equation, where G , a weight variable, represents average value of the dependent variable across time, so that observations for different years receive equal weights within the same exporter-importer-sector cross-sectional unit. In the Poisson regressions, weights must be different; otherwise, the observations with zero trade or zero FDI flows would have no relevance for the estimations again. Therefore, Poisson regressions use the geometric average of sectoral outputs (again, average across time) of exporter and importer,
eiYY , as a weight variable. 31 Similarly to the gravity estimations, to avoid losing many observations under logs, zeros for domestic barriers, FDI variables and trade variables are replaced by very small positive values before taking logs. See footnote 26 for further explanation.
25
Figure 5. The model explaining productivity
Similarly to the gravity regressions, different alternatives of the control variables for Information and Communication Technologies (ICT) and Human Resources (HR) are tested. In addition, the productivity regression includes a proxy capturing the characteristics of sectoral investment other than the relative size of FDI (lagged variable I): either total domestic investment in a sector or total intangible investment enters the regression as a possible co-determinant of productivity.32 All of these control variables (ICT, HR, and domestic or intangible investment) are potentially important factors driving productivity in services according to the literature. βt are year effects (dummies) capturing the common cycle. Finally the error term is composed of υ, unobserved effects for each country and sector combination, and ε, the observation-specific error.
The trade variables (T)
and T(
) and the investment variables ( F)
, F(
and I) can be endogenous, i.e. driven by productivity developments. To reduce the impact of that possible endogeneity, two measures are adopted: first, all these variables enter the regression with one-year lag; second, an appropriate estimator is employed that addresses the possible problems due to the inclusion of the lag dependent variable: the Arellano-Bover-Blundell-Bond Generalised Method of Moments system.33 The productivity regression is estimated for a “long panel”, where each observation represents a country, sector, and year from the same period as in the gravity regressions (2004–2007). Again, the estimation is weighted to produce
32 Domestic investment is approximated as total investment minus FDI. Intangible investment is calculated as total investment minus investment in tangible goods. The data on total investment and total investment in tangible goods is sourced from the Eurostat. The importance of intangible capital for services productivity is discussed in Roth et al. (2010) and O’Mahony and Fei Peng (2010). 33 This estimator allows for endogeneity, using the lags of endogenous variables as “GMM-style” instruments plus strictly exogenous regressors such as time dummies as standard “IV-style” instruments. See: Arellano and Bover (1995), Blundell and Bond (1998), and Roodman (2009a). Hansen test of over-identifying restrictions does not reject the exogeneity of instruments with a standard confidence level, though the p-value is not very high.
26
correct EU-wide coefficients, with output used as weight.34 The specification where domestic barriers and foreign channel variables perform best is finally selected.
6. Estimation results
The results of the estimations are not directly comparable to previous estimates in the literature due to a different estimation methodology, the inclusion of the domestic channel, a different measure of existing barriers, the inclusion of the actual reduction of barriers (instead of theoretical), etc. For example, the trade and FDI results (7%) are lower than the effects obtained by the latest CPB estimates (20%), and this difference is very likely driven by the different barrier indicator (heterogeneity of regulation in CPB studies, where regulation has a broader meaning than covered in the directive35) and by the fact that the actual change in barriers across sectors and countries following the implementation of the Directive has been far from a total elimination of barriers.
6.1. Elasticities
6.1.1. Gravity
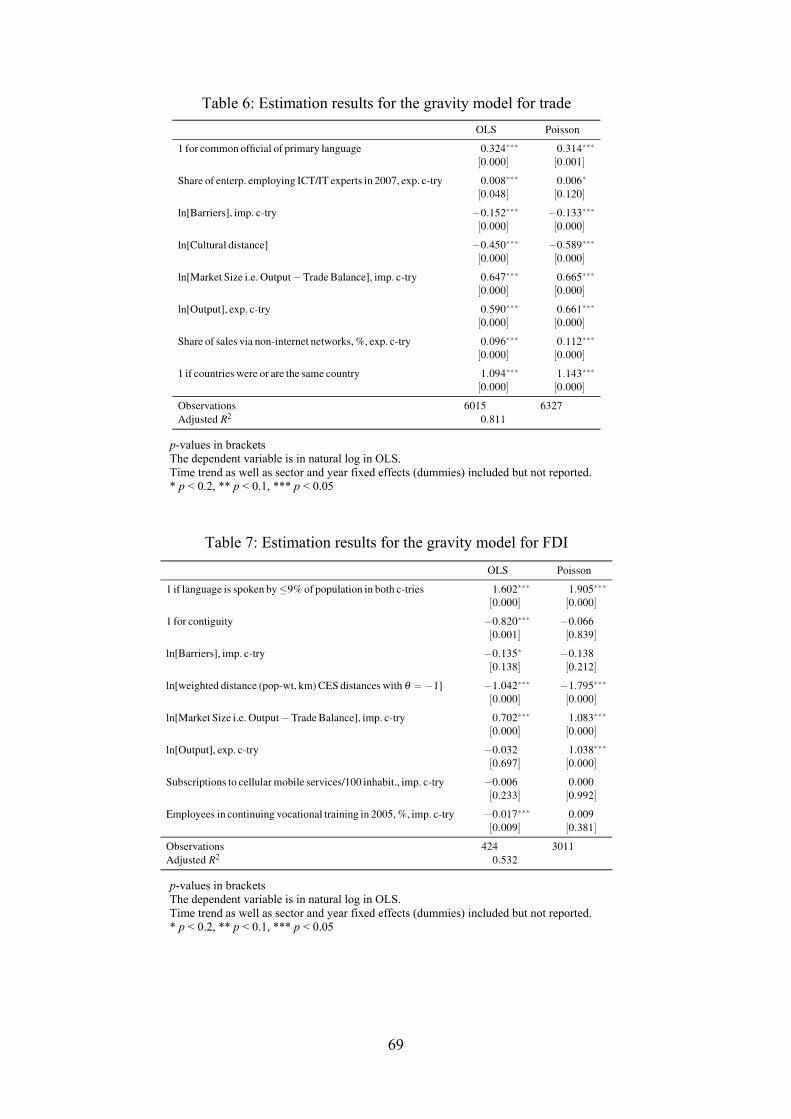
The estimation results are presented in Tables 6 and 7 in Annex II. The estimated elasticities of trade to cross-border provision barriers in the importing country and of FDI to establishment barriers in the destination country, show that a 10% reduction of barriers increases trade by 1.5% and FDI by 1.35%.36
The sizes of elasticities are broadly unchanged in the Poisson regressions, which serve as robustness checks against the inclusion of zero flows in trade or FDI, as explained in Section 4.2. The statistical significance of barriers in the FDI model deteriorates, but it is not surprising in view of extremely high proportion of the observations with zeros. In general, the FDI estimation appears to be based on more noisy data and exhibits lower statistical significance of barriers and lower overall explanatory power; the adjusted R2 is 0.53 compared to 0.81 in the trade regression.
6.1.2. Productivity
The estimation results are presented in Table 8 in Annex II. The direct impact of barriers reduction in domestic activity, captured by the elasticity of labour productivity to reduction of
34 As in the gravity model, the weight variable is an average across time, so that each year receives equal weight for each country and sector 35 We have tested different heterogeneity measures and they were too correlated with the levels of barriers due to insufficient variance across restrictions within a sector in a country. To properly measure the qualitative heterogeneity of barriers rather than just heterogeneity of the level of barriers (e.g. differences in the characteristics of barriers), one would need a much richer dataset on barriers, implying more administrative burden for Member States to collect that data. Finally, conceptually, it is uncertain how heterogeneity should be measured (bilaterally or multilaterally i.e. vis-à-vis all other countries). 36 The impact of barriers reduction on trade represents about 1/3 of the impact of distance between the importer and the exporter. The impact of barriers reduction on FDI represents about 1/7 of the impact of the distance between the origin and the destination of investment.
27
barriers to establishment, proves to be much stronger than the short-term indirect impact on productivity via the international channel; thus stronger than the impact on productivity of trade and FDI resulting from the implementation of the Directive. A 10% reduction of barriers to establishment brings a 1.6% increase in labour productivity in services. The low impact from FDI and non-significant impact from trade is likely due to the short time span covered by the exercise, since effects of trade and FDI on productivity are expected to materialise rather in the long term. Consequently, the estimated effects on productivity cover only short-term effects of the barrier reduction.
6.2. The “central scenario” impacts
The estimated “central scenario” impact of barrier reductions from the implementation of the Services Directive – i.e. the effect of actually observed barrier reduction37 – for the whole EU reaches 3.8% of additional FDI, 7.2% more trade,38 and productivity higher by 4.7%, for those sectors which are covered by the analysis. As shown in Figure 6, the impacts for single Member States vary significantly:
• for exports, from less than 3% (Germany, Sweden Cyprus) to more than 7% (Austria, Poland, Czech Republic, Bulgaria, Denmark),
• for imports, from below 1% (the Netherlands, Malta, Austria, Estonia, the UK) to above 9% (Italy, the Czech Republic, Slovakia, Sweden, Greece),
• for inward FDI, from no effect to about 5%, with a notable exception of Slovakia (12%),
• for outward FDI, from below 1% (Slovakia, Bulgaria) to more than 4% (Italy, Portugal),
• and, for labour productivity, from 2% and below (Malta, Austria) to more than 6% (Slovakia, Luxembourg, Greece, Cyprus).
It should be noted that a larger percentage impact on imports than on exports of a country does not necessarily imply a negative impact on its trade balance, as long as exports are sufficiently larger than imports.39 For instance, exports of the analysed services sectors in Portugal are expected to increase by 5% and imports by 6.4% but, since the level of exports in those sectors are much larger than imports, the 5% increase of exports turns out to be be much larger in absolute terms than the 6.4% increase of imports, resulting in an improvement of trade balance.
The differences in impacts across countries mainly reflect:
• own barrier reduction (countries with larger barrier reductions import more, attract more inward FDI, and have a larger boost in productivity) and/or
37 Assuming that “partial reduction” was a 20% reduction of restrictions and assuming equal weights of specific restriction as explained in Section 4.1. 38 At the EU level, intra-EU exports and outward FDI equals intra-EU imports and inward FDI. 39 The following condition must be satisfied: X / M > (1 + m) / (1 + x), where X is the pre-impact level of exports, M is the pre-impact level of imports, m is the estimated impact on imports i.e. the growth rate of imports resulting from barrier reduction, and similarly x is the estimated growth rate of exports.
28
• for exports and outward FDI, the geographical composition of destinations and the barrier reductions in those destinations (more exports to or investment in those countries which had larger barrier reductions)
• the sectoral composition (weights of different sectors measured with FDI flows, trade flows, or value added).
Another factor which can have an effect on the differences between the countries in terms of impact is the data availability, especially FDI but also some trade and productivity data is not available for all sectors in all countries.
Figure 6. Impacts of barrier reductions within the analysed sectors in the EU
Impact = elasticity × average barrier change. The graphs are based on sector-level weighted average barrier changes. Some countries in the FDI graphs missing due to missing data. The impact only refers to those services sectors which are covered by the study.
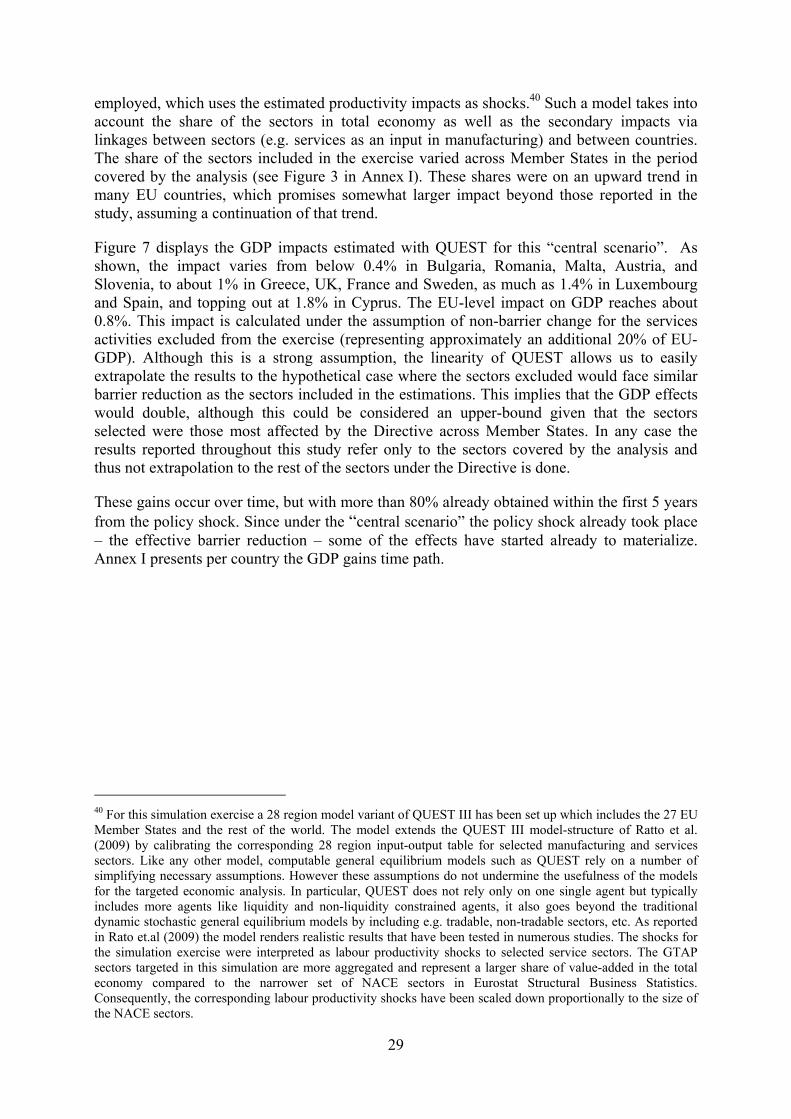
It should be stressed that these impact figures concern only the sectors covered by the study, i.e. a sub-set of the sectors covered by the Directive, that represent around 20% of EU-GDP. To carefully translate it into the impact for the whole economy and for the whole EU, a Computable General Equilibrium (CGE) model, such as DG ECFIN’s QUEST, can be
29
employed, which uses the estimated productivity impacts as shocks.40 Such a model takes into account the share of the sectors in total economy as well as the secondary impacts via linkages between sectors (e.g. services as an input in manufacturing) and between countries. The share of the sectors included in the exercise varied across Member States in the period covered by the analysis (see Figure 3 in Annex I). These shares were on an upward trend in many EU countries, which promises somewhat larger impact beyond those reported in the study, assuming a continuation of that trend.
Figure 7 displays the GDP impacts estimated with QUEST for this “central scenario”. As shown, the impact varies from below 0.4% in Bulgaria, Romania, Malta, Austria, and Slovenia, to about 1% in Greece, UK, France and Sweden, as much as 1.4% in Luxembourg and Spain, and topping out at 1.8% in Cyprus. The EU-level impact on GDP reaches about 0.8%. This impact is calculated under the assumption of non-barrier change for the services activities excluded from the exercise (representing approximately an additional 20% of EU-GDP). Although this is a strong assumption, the linearity of QUEST allows us to easily extrapolate the results to the hypothetical case where the sectors excluded would face similar barrier reduction as the sectors included in the estimations. This implies that the GDP effects would double, although this could be considered an upper-bound given that the sectors selected were those most affected by the Directive across Member States. In any case the results reported throughout this study refer only to the sectors covered by the analysis and thus not extrapolation to the rest of the sectors under the Directive is done.
These gains occur over time, but with more than 80% already obtained within the first 5 years from the policy shock. Since under the “central scenario” the policy shock already took place – the effective barrier reduction – some of the effects have started already to materialize. Annex I presents per country the GDP gains time path.
40 For this simulation exercise a 28 region model variant of QUEST III has been set up which includes the 27 EU Member States and the rest of the world. The model extends the QUEST III model-structure of Ratto et al. (2009) by calibrating the corresponding 28 region input-output table for selected manufacturing and services sectors. Like any other model, computable general equilibrium models such as QUEST rely on a number of simplifying necessary assumptions. However these assumptions do not undermine the usefulness of the models for the targeted economic analysis. In particular, QUEST does not rely only on one single agent but typically includes more agents like liquidity and non-liquidity constrained agents, it also goes beyond the traditional dynamic stochastic general equilibrium models by including e.g. tradable, non-tradable sectors, etc. As reported in Rato et.al (2009) the model renders realistic results that have been tested in numerous studies. The shocks for the simulation exercise were interpreted as labour productivity shocks to selected service sectors. The GTAP sectors targeted in this simulation are more aggregated and represent a larger share of value-added in the total economy compared to the narrower set of NACE sectors in Eurostat Structural Business Statistics. Consequently, the corresponding labour productivity shocks have been scaled down proportionally to the size of the NACE sectors.
30
Figure 7. The GDP impacts across countries (in %)
0.260.310.340.35
0.390.420.450.450.470.480.480.540.570.570.58
0.670.730.74
0.780.790.800.81
0.991.001.061.08
1.391.42
1.78
0.0
0.2
0.4
0.6
0.8
1.0
1.2
1.4
1.6
1.8
BGRO
MTAT
SIIE
DEFI
CZEE
LTHU
DKLV
BEPL
NLSK
EAIT
PTEU27
ELUK
FRSE
LUES
CY
6.3. Sensitivity checks
6.3.1. Sensitivity to the “partial reduction” parameter
The barrier indicators used in the estimations so far were constructed under the assumption that partial elimination of a barrier as reported by Member States meant a 20% reduction of such barrier. This is a rather conservative choice based on the judgement of experts from the Commission Services. A sensitivity check could however show how the results would change depending on how ambitious Member States are when partially reducing barriers. A re-calculation of the impacts on FDI, trade, and productivity for the EU is shown in Figure 8 for a wide range of alternative levels of the “partial reduction” parameter. A 10 percentage point higher partial reduction implies an impact higher by ½ percentage point for trade and by 1 percentage point for FDI and productivity. For example, if “partial reduction” means reduction by 40% (thus the parameter is set to a value equal to 0.6) instead of 20% assumed until now (a 0.8 value), the increase in FDI in affected services sectors in the EU is estimated at 5.8%, increase in trade by 8.1%, and in productivity by 6.8%.
Figure 8. The GDP impacts for the EU (in %) under different levels of “partially reduced restrictions”
31
6.3.2. Sensitivity to unequal weights of different requirements
So far it was assumed that all the 20 restrictions considered have equal weights; i.e. equal importance or burdensomeness for enterprises. The reality may be however quite different. In order to assess the importance of this assumption, and based on the Commission Services' legal expertise, the restrictions have been classified in three groups: those with low, medium, or high weight. See Table 9 in Annex II for details.41
Instead of attributing some arbitrary weights to these qualitative information, a sensitivity check is done by assigning random numbers and re-running the regressions and the impact calculations (elasticities × average barrier change)42 1000 times. In this way, empirical distributions of the results for the impact on FDI, trade, and productivity are obtained. The low weight (wL) is fixed as benchmark at 100%. The medium weight (wM) is assumed to be up to 100 percentage points larger than the low weight (thus up to twice as large) and, similarly, the high weight (wH) is assumed to be up to 100 percentage points larger than the medium weight (thus up to three times larger than the low weight). The country-sector level barrier indicator is then re-calculated as a weighted rather than a simple mean, with wL, wM, and wH as weights. In each of the 1000 runs, the exact sizes of wL, wM, and wH are determined by random numbers (rM and rH) each drawn independently from a uniform distribution ( )43 covering the range 0–100 percentage points. All these assumptions are summarised in the formulas below.
It turns out that, with unequal weights of restrictions, the uncertainty due to different requirement weights is small as the difference between the largest and the smallest values reaches only 0.2 percentage point. The “most likely” impacts (the modes of the distributions) are marginally larger than in the “central scenario” for the EU: 4% compared to 3.8% for FDI, 7⅓% compared to 7.2% for trade, and 4.8–4.9% compared to 4.7% for productivity (see Figure 9).
Figure 9. The distribution of GDP impacts for the EU (in %) under unequal weights of requirements
41 The allocation of qualitative weights across restrictions was value judgement, similar to the 20% assumption for the impact of partial reductions, and as such can be disputed. 42 For this sensitivity check exercise, the level of “partially reduced” restrictions is again fixed at 0.8. This allows isolating only the influence of re-weighting of restrictions on the final results. 43 In a uniform distribution, all numbers from the selected range (0–1 in this case) are equally probable.
32
6.4. “What if” scenarios: beyond the current barrier reduction
The last part of this note is devoted to reporting the results of simulations showing the possible additional gains from further reduction of barriers, beyond that observed actually (i.e. beyond our “central scenarios”). It should be stressed that this exercise does not imply broadening the sectoral scope of the Directive or the restrictions covered; it only assumes deeper barrier reductions in the same sectors as in the “central scenario”. Two “what if” scenarios are proposed assuming that every country moves to an “ideal” country barrier profile where sectors have barriers after the implementation of the Directive equal to:
• simple mean across the EU countries in that sector or lower (the level the country actually has reached if lower than the EU mean) or
• simple mean of best 5 countries in that sector or lower (if already achieved).
It turns out that the effort under the second scenario is close to the full elimination of barriers for most sectors. Interesting exceptions are legal services and large retailers where barriers remain also across the best countries. The “ideal” country approach means that the benchmark –EU mean or the mean for 5 best countries– is specific for each sector; specifically, for the second scenario it means that the group of 5 best countries may very likely differ for each sector. The “ideal” country approach also implies that barriers after the Directive remain unchanged in those sectors where each country has already achieved the levels below the benchmark: that is a no-deterioration scenario is assumed.
Overall, at the EU level, the impacts under the first scenario (“what if – mean”) for all variables (trade, FDI, and productivity) are about one and a half times those in the “central scenario”, that is about 3 additional percentage points more for trade, 1.8 percentage point more for FDI, almost 2.3 percentage points more for productivity, and the GDP impact higher by about 0.4 percentage point. Concerning the second scenario (“what if – 5 best”, more demanding than the "what if – mean"), the increase is from 2 times of the results under the “central scenario” for trade, to almost 3 times for productivity, and more than 3 times for FDI, while GDP impact would gain an extra 1.4 percentage points. By design, the “what if” scenarios also entail a lower dispersion of the country-level impacts, since countries become more similar in terms of the change in barriers, as the level of barriers after the Directive becomes very similar (they all move towards the EU mean or towards the mean of the best-five) and they differ mainly by the starting points. Moreover, as the barrier level after the Directive approaches zero, the barrier change is getting closer to 100% reduction (i.e. complete elimination of barriers). The table below compares the results of the “central scenario” with the “what if” scenarios. As mentioned above, the GDP impact would almost double if the same change in barriers were assumed in the services sectors excluded in the analysis (but covered by the Directive) as in the sectors included. Annex I contains the detailed country results (Figures 4–7).
33
The EU-level impacts (in %)
Scenario Trade(1) FDI(1) Productivity(1) GDP(2) Central 7.2 3.8 4.7 0.8 What if – mean 10.1 5.6 7.0 1.2 What if – 5 best 14.7 12.6 13.6 2.6
(1) Impact within the sectors included in the econometric analysis. (2) This impact on the whole EU Member States economies results from the impact of barriers on labour productivity (a “shock”) only in the sectors included in the analysis and impact materialises gradually over the long term.
Figures 8 and 9 in Annex I present the dynamics of the GDP impact as simulated with QUEST. Most of the effect materialises within the first few years from the moment of barrier reduction, then gradually approaching the long-term level. This pattern is very similar for single Member States. The almost instant EU-level impact under the “central scenario” reaches 0.14% (ranging from zero to 0.3% across the Member States). The nearly immediate effect under the “what if – mean” scenario for the EU amounts to 0.2% of GDP (and between 0.1% and 0.4% across countries) and 0.4% under the “what if – 5 best” (and between 0.2% and ¾% across countries). Within the first 5 years, more than 80% of the long-term impact is expected to materialise according to the QUEST simulations.
7. Conclusions to Part 1
Given the importance of the internal market for services as a key element for enhancing competitiveness and potential growth in Europe, a complete and ambitious transposition of the Services Directive represents a major step forward towards the completion of the Single Market. The legal transposition of the directive does not ensure however that the full potential offered by the Directive is reaped. The broad sectoral scope of the Directive and the room it leaves to Member States when screening their legislation and deciding which existing regulation is not in conformity with the criteria set out in the Directive, justified carrying out an assessment of its effective implementation and on the economic impact of remaining heterogeneity for the functioning of the Internal Market. This part has presented the work done by the Commission to estimate the economic impact of the Services Directive on the basis of the information on actual barriers reduction. The information on effective barriers reduction shows that many Member States have opted to partially reduce or even kept specific requirements (this allowed by the Directive if duly justified). Thought the focus of the analysis presented is on EU level, detailed country-specific information on barriers and on the economic effects of their reduction is available and could help improving quality implementation across Member States.
Despite the fact that the analysis discussed here does not include all sectors covered by the Services Directive, the estimated economic impact of barriers reduction in the sectors covered appears to be considerable. The EU-level impact on GDP under the current status of implementation44 (the “central scenario”) is estimated to be a 0.8% increase. However, the impact varies between the Member States, from below 0.3% to more than 1.5%, and is 44 Implementation status in terms of the reduction of barriers end of 2011.
34
determined mainly by the specific country and sector barrier reduction and by the share in Member States' economies of the sectors covered by the analysis. The fact that only selected sectors are covered by the analytical exercise implies that the GDP effects have been obtained under the assumption of no-barrier change in the services sectors excluded from the estimations (but covered by the provisions of the Directive, which economic weight is around 20% of GDP similar to the weights of sectors included). A back of the envelope calculations suggest that the GDP effect could up to double to a 1.6% increase at EU level if all sectors directly affected by the Directive are included and if the barrier reduction was equally high there as in the covered sectors. This can be considered however an upper bound as the sectors not included were, based on expert judgement by the responsible Commission Services, relatively less affected by the Directive across Member States (in terms of the barriers changes).
The analysis shows a significant impact of barriers reduction on trade flows and FDI, which measure the impact on cross-border provision and on foreign establishment respectively. The impact exceeds 7% for trade and reaches almost 4% for FDI in the EU. The lack of a statistically significant effect of trade and FDI on labour productivity reflects the fact that the model specification only captures short-term effects, while the impact of trade and FDI on productivity would take some time to fully materialise. Since this long-term impact on labour productivity from the international flows is not captured by the model, the 0.8% increase in EU GDP reported is a lower bound of the overall economic impact of the implementation of the Directive.
The domestic transmission channel, i.e. the direct impact of barriers reduction on labour productivity, turns out to be very significant and it is indeed the main driver of the estimated overall GDP effect. This is an important finding given that the traditional approach to the estimation of the effects of the Service Directive has focused on its effects on trade and FDI and has somehow overlooked the direct impact on domestic activity of the large simplification effort undertaken by Member States.
The analysis has also shown the large untapped potential that further reform efforts could bring, still within the scope of the Services Directive both in terms of requirements and sectors covered. Two hypothetical scenarios have been simulated: even under a moderately ambitious scenario, where each country becomes an “ideal country” composed of sectors with at least an EU average level of barriers, the further additional gain (when compared with the central scenario) reaches 0.4% of GDP; this would be a 1.2% GDP increase in total as a result of the Directive. Under a more ambitious scenario close to the abolishment of almost all restrictions, the additional gain could reach 1.8% of GDP, representing a total gain from the baseline no-additional policy action scenario of 2.6% of GDP.
35
Part 2: Assessing the economic impact of setting up Points of Single Contact: an approximation based on the Doing Business
1. Introduction
By the end of 2009, the Services Directive (SD) committed the Member States to set up Points of Single Contact (PSC), operating as "gateways" or "one-stop shops" for service providers. PSC aim to give entrepreneurs access to clear, up to date information, together with an easy means, both at home and abroad, of completing administrative procedures, including formalities needed to access and exercise service activities. Recent assessments of the state of play of the implementation process indicate that most MS comply with the minimum mandatory legal requirements set out in the SD. Therefore, more than just the compliance with the SD, it is becoming of great interest to understand to what extent the existing PSC are close to becoming fully transactional and interactive eGov portals, and, above all, what benefits could be expected by the countries involved in such process. On this, the latest evidence only suggests that the gap between good bad performers among the MS in terms of PSC remains considerable, and that there is still quite a long way to go. Nonetheless, no quantitative results are currently available for all MS, based on a homogenous approach, as for the likely benefits they could reap from setting up fully operational PSC. In fact, the few studies on the topic have so far either focussed on qualitative aspects of the implementation or adopted country-specific approaches to quantifying its likely benefits. The purpose of this second part of the study is thus to describe and implement a methodology aimed at approximately estimating the potential economic impact of the MS' current progress and further improvements in setting up national PSC. To overcome the mentioned lack of comparable quantitative information on the PSC implementation across the EU27, the present analysis is based on the World Bank's Doing Business 2012 Database (DB): in fact, this database can be readily used as a reliable and, above all, homogeneous source of information about the MS’ procedural burdensomeness of starting up a service provider. In particular, it is thoroughly discussed why, and under which conditions, the simplification effort expressed by the progressive reduction in the relevant DB variables with respect to the establishment of service providers, hereby called "procedural streamlining effort" (PSE), should be considered a likely “tangible” outcome -i.e. materialized in economic terms- of setting up national PSC. This observation justifies the computation, for all MS, of their currently achieved and ideally further achievable gains from the PSE: starting from these gains, an economy-wide impact on each MS’s GDP is subsequently simulated by a dynamic stochastic general equilibrium model (DSGE). Nonetheless, as this is a crucial aspect of the proposed analysis, particular attention is devoted throughout Part 2 to the discussion of the caveats entailed by this choice. The main one is that the economic impact related to the mentioned PSE is bound to be an approximation of the actual benefits of setting up national PSC. For instance, the impossibility, due to data limitations, to take into account in the analysis the cross-border provision of services as a pivotal focus of the SD other than the freedom of establishment, constitutes a major reason for the conservative nature of the obtained results.
36
The main findings of the analysis show that at the EU level, the so far achieved economy-wide impact of the PSE is estimated to amount to 0.133% of GDP, while the additional gain to be reaped from further developments could reach 0.06%-0.15% in the medium run and 0.09%-0.21% in the long run in an ideal scenario taking into account only the providers in the scope of the SD. In light also of this conservative assumption, the conclusions point to the significant benefits that the MS could reap from improving their PSC by focussing on the most tangible aspects not only of their “usability” but of their effective and widespread use by all involved service providers. The structure of this Part of the study is the following: Section 2 outlines the overall methodological approach underlying the DB-based estimation exercise; Section 3 discusses the previous studies on the effects of setting-up PSC; Section 4 presents in detail the analytical framework allowing the estimation of the economic impact of the MS' currently achieved and further achievable gains from their PSE in setting-up service providers. Section 5 presents and discusses the final results of the estimation, while Section 6 concludes.
2. Methodological Overview
This Section aims to provide a brief overview of the overall methodology adopted in this study, which will be dealt with in greater analytical detail in Section 4. The current approach to approximately estimating the economic impact of setting up national PSC is based on the World Bank's DB Database (see Box 1). In fact, this constitutes a major data source on quantitative “dimensions”, like the time and cost to deal with establishment-related procedural requirements, which are likely to be affected by the implementation process. Specifically, the DB allows a univocal and reliable quantification for each EU27 MS of the procedural burdensomeness of setting up a service provider45 in the scope of the SD, as explained in Section 4.1. Such quantitative indication of the easiness of establishment can be used to compute for all MS a "procedural streamlining effort" (PSE, hereafter), tangibly expressed by the gradual reduction in their start-ups’ establishment-related information obligations. This PSE is subsequently used as a starting point to approximate the potential economic impact of setting up PSC in the EU27, by focussing on one of its likely outcomes. Namely, for each MS it is obtained: i) a point estimation of a so-called achieved gain, defined as the PSE pursued so far in terms of starting up a business; ii) an interval estimation of a so-called additional gain, defined as the still potentially achievable effort in an ideal "what-if" scenario: each MS is, in fact, assumed to close its gap in terms of procedural easiness of establishment with a benchmark, represented by the best performances in the DB dimensions across the EU27. As for the interval estimation of the additional gain, its lower and upper bound are computed, respectively, in the absence of, and taking into account competition-enhancing effects. In fact, the lower bound is obtained under the assumption that moving to the benchmark does not affect the flow of new service providers benefitting from the PSE, as if they were exogenous.
45 It is worth mentioning that the expression "setting-up a service provider" is used throughout Part 2 with the exact meaning assigned to it by the World Bank, i.e. to start up and formally operate a business, which is much more than the mere creation of a company and far closer to what the PSC should cover.
37
The upper bound, instead, incorporates an econometrically predicted upward impact of this procedural streamlining on the entry rates. It is also worth noticing that the computation of both the achieved and the additional gain make use of the further source of information provided by a set of completion scores, assigned by the Commission Services to the national PSC in light of their maturity in terms of specific qualitative features. These MS’ achieved and additional gains are then translated into economy-wide effects thanks to the Commission Services' QUEST III DSGE model46. Summing up, the approach to estimating the economic impact of the current progress and the expected developments in the MS’ PSEs in starting up a business includes 3 steps:
1. resorting to the DB to obtain cross-country homogenous information on the procedural burdensomeness of starting up a business;
2. estimating the benefits implied by the hereby observed streamlining in terms of: a. each MS's achieved gain, i.e. the PSE pursued between an average pre-SD
situation and the current one; b. each MS's additional gain, i.e. the PSE achievable in an ideal situation where
each MS closes the gap in terms of the relevant DB dimensions with the best performances across the EU27, with and without competition-related effects47;
3. simulating, with a DSGE model, the overall economic impact on each MS’s GDP of the achieved and additional gain from the PSE.
Throughout the overall study it is thoroughly discussed why this PSE should be considered related, at least in the medium run, to the MS’ implementation process of national PSC.
3. Review of previous studies
The availability of results in the existing literature on the MS' current progress and expected developments in terms of setting up national PSC is far from satisfactory. On the one hand, this is due to the scant number of studies focussing on the PSC in quantitative terms, i.e. trying to estimate the economic impact of their setting up. On the other hand, this relates to the anyway scarce replicability of the findings therein presented across the countries involved in the implementation process. In fact, most quantitative studies on the PSC rely on country-specific assumptions, generally supported by the use of surveys: thus, the hard replicability of their findings in different contexts, first and foremost in other MS, impairs in turn their verifiable reliability and usefulness for the broader aims of cross-country comparison. Among these, it is worth mentioning a BERR Impact Assessment48 on the United Kingdom and a Zwischenbericht study49 on Germany. The former presents a cost-benefit analysis of the PSC implementation in the UK in different policy scenarios, including that to adapt the already existing governmental website Business Link to host it. This option is estimated to bring a net present value benefit of 69mn £ over a decade. Still, country-specific assumptions and data sources underlie the estimation of the 46 The simulation is carried out by interpreting them as positive policy shocks represented by a reduction in fixed costs to establish service providers. 47 As said, this means accounting for the positive impact on the entry rates of the decrease in the barriers to entry. 48 Impact Assessment of the Implementation of the Services Directive, BERR, May 2009 49 Ermittlung von Entlastungspotentialen der EU-Dienstleistungsrichtlinie gemäß SKM, Zwischenbericht, 2008.
38
costs, based on a national survey50 of the existing contact points eligible to host the PSC, and, above all, of the benefits. Here, the standard workhorse tool for administrative burden measurement, i.e. a Standard Cost Model51 (SCM, hereafter), is used to assign a value, based
50 EU Services Directive: Evaluation of Administrative Costs (Detica, 2006). 51 See, for instance, http://ec.europa.eu/dgs/secretariat_general/admin_burden/eu_scm/eu_scm_en.htm. Another methodologically comparable study, employing the same tool to assess the administrative burden reduction in the Netherlands is the CPB Memorandum Intra-EU Differences in Regulation-Caused Administrative Burden for Companies (H. Kox, 2005).
Box 1: The World Bank’s Doing Business 2012 Database As specified in detail in “Doing Business 2012: Doing Business in a more Transparent World” (World Bank, 2011), the section Starting a Business of the Doing Business 2012 Database (DB) reports, for a set of World countries including the EU27 MS except Malta: i) the average number of procedures officially required for an entrepreneur to start up and formally operate a firm, defined as any interaction with third parties; ii) the median time in days required to deal with each of these setting-up procedures, excluded, however, the retrieval of information; iii) the external costs associated to starting up a firm, like professional fees for consulting services, stamps, and photocopies, each expressed in percentage of the national GDP/capita. Let us call these DB dimensions hereafter. For all countries, the DB dimensions refer to an "average" service provider or producer of goods, i.e. a limited liability company (LLC) with start-up capital and turnover, respectively, of 10 and 100 times the national income/capita, between 10 and 50 employees, and 100% domestically owned (note that this hypothesis does not make any difference when accounting also for foreign establishments, as, by definition, the considered setting-up procedures are those required of all businesses, which may a have a downward effect on the level of the setting-up cost, but unclearly affects its change, i.e. the MS' procedural streamlining effort). As for the observation period, the DB dimensions are collected from 2003 to 2011, with the notable exception of shorter series for Luxembourg (2006-2011) and Cyprus (2008-2011), where, to have sufficient observations, the 2006 and 2007 levels are equaled to the 2008 one. The interpretation of the Doing Business database requires caution, given the limitations of its underlying methodology, starting from the issues entailed by the need to focus on a standardized case to get a homogeneous objective metric for a comparable assessment of world-wide business and regulatory environments. Namely: i) the reference of the collected data to businesses in the country’s most populous city may impair their representativeness of regulatory practices in other parts of it: however, this responds not only to the general economic relevance of a country's largest business city, but also to a common practice for the collection of macroeconomic data like inflation; ii) the focus on a specific business form –a LLC of specified size- may not be representative of the regulation on other firms, like sole proprietorships: however, this is chosen as the globally most relevant type of business providing entrepreneurs with some protection; iii) the inclusion only of a specific set of transactions needs not encompass the full set of issues encountered by a real business, and the assumption of full information on regulatory requirements implies an underestimation of the time whenever limited information prevents prompt follow-up. A second set of issues relates to the World Bank's approach to data collection, i.e. the choice to involve exclusively private pro-bono contributors (around 8,000 in 183 global economies), spontaneously agreeing to take part in the process, in order to base it on factual on-the-ground-practices rather than mere legal provisions. Namely, this could entail the risk of: i) a limited number of respondents for certain topics or countries, to the detriment of the reliability of the findings; ii) biased replies due to governmental pressures driven by the attempt to improve the national ranking; iii) the existence of some elements of judgment, e.g. on the measured time, whenever different estimates by the available sources urge to take their median value. In spite of the mentioned limitations, it seems that these are part and parcel of the overall World Bank's methodology, and are thus fully justified by its underlying objective of a homogenous world-wide metric of the regulatory environment, once both the transparency of the methodology and the consistency between this and the findings are ensured. In other words, discrepancies between the DB indicators and alternative sources, if any, are perfectly understandable in light of lack of direct comparability between the underlying approaches, with no possibility to infer one's superiority over the other. Besides, this issue is amply tempered on the one hand by the high level of correlation of the DB indicators with other measures of the business environment like the OECD’s product market regulation index (0.75) and the WEF Competitiveness Index (0.79), and, on the other hand, by a clear attempt at full transparency of the reported data, e.g. by publishing details on the number of contributors by topic, on data changes and correction rates, and by adopting a strategic contributor recruitment. For all these reasons, the present study, though acknowledging the limits of the Doing Business, resorts to it as a reliable tool for benchmarking regulation and catalyzing reforms, in particular because, in light of their definition by the World Bank, the DB dimensions can be considered affected by the PSC implementation process: in fact, they include not only legally required operations to set up a firm but, more broadly, "any interactions of the company founders with external parties". The existence of a certain (negative) correlation between the burdensomeness of setting up a firm expressed by the DB and the implementation of the PSC is thus clear: in fact, the very Doing Business Report points out that "single interfaces for businesses not only save time and money: they can also make procedural requirements more transparent and easier to access. While some one-stop shops are solely for business registrations, others carry out many integrating functions, including post-registration formalities [..] and are single electronic interfaces for entrepreneurs. Today, in the economies [..] that have one-stop shops [..], start-up is more than twice as fast as in those without such services [..] to reduce procedures, time, and cost for business registration as well as to improve access for smaller firms operating at a distance from the registrar's offices. [..] Experience shows that establishing a virtual one-stop shop that collects all required information through a single online interface and shares it within government can reduce registration cost and time and eliminate redundant requirements for information".
39
on a specific time-tariff52, to the expected time saved by all UK businesses benefitting from PSC-related reduced uncertainty; nonetheless, the entire analysis rests on the assumption, indeed hardly verifiable or replicable elsewhere, that each national and foreign service providers in the UK will save, respectively, 1 hour and 9 hours thanks to the English PSC. In addition, this is assumed to induce a 10% increase in foreign service providers, without deeper insight in its reasons. The second study tries to quantify the potential savings from setting up an ideal PSC in Germany. Here too, the estimation is based on a SCM, applied to the cost of setting up a business. Namely, the gain from implementing an ideal German PSC is quantified as the difference between the actual overall cost of setting up all service providers in the scope of the SD and the ideal estimated one in the presence of an ideal PSC. Still, the mentioned estimates are based on a national survey on the information obligations faced by a sample of firms in the Brandenburg region, i.e. time and costs to deal with all setting-up procedures. Assuming a fixed time-tariff of 28.10 €, the figure obtained is a saving around 276mn €. These examples clarify the existence of a trade-off between the depth of the PSC-related analyses and the applicability of their findings. In fact, the considerable insight of the two studies contrasts with their scope, irremediably narrowed by the impossibility to carry out similar analyses in different contexts. Put differently, the methodological heterogeneity and the underlying assumptions make the obtained gains for UK and DE not comparable. Therefore, a few more recent works after the implementation deadline of the SD, aim de facto at wider analyses of the PSC, allowing also cross-country comparisons in light of more homogenous approaches to their evaluation. E.g., a Deloitte study53 focuses on a detailed assessment, from an end-user perspective and identifying good practices, on the impact of setting up PSC on the provision of eGov services to businesses and in general on facilitating doing business in Europe. Still, the assessment does not lead to figures of reference as for the entity of the benefits of a full implementation, yet provides only cross-country comparisons of qualitative dimensions of the national PSC, like its technical accessibility, quality, user-friendliness, and back office enablers. In other words, the possibility to end up with reliable and comparable estimates of the impact of setting up PSC is considerably impaired by the scarce availability of quantitative data on the implementation. These limits may be justified in part by both the intrinsically qualitative features of the PSC, which remain of crucial importance, and the still too short time after the implementation to overcome this by the collection of statistically sufficient quantitative data. Such lack of viable alternatives would per se justify the solution proposed in Section 2 of a DB-based methodological approach, in spite of the awareness that PSC affect more than the procedural burdensomeness of setting up service providers. Besides, this is supported on the one hand by a substantial consistency with previous studies, in spite of a dialectic attempt to improve them analytically: e.g. as in the Zwischenbericht study, each MS's PSE is computed in Section 4 by multiplying a SCM-based gain per firm, inclusive also of the opportunity cost of time, by the national flow of new service providers in the scope of the SD.
52 The adopted time tariff is here 20.23£, based on the cost of an average UK business and public service professional, according to the UK SCM Manual supplied by the Better Regulation Executive (BRE). 53 The functioning and usability of the Points of Single Contacts under the Services Directive – State of Play and Way Forward (Deloitte, 2012), commissioned by DG MARKT.
40
On the other hand, although the exact causality between the maturity of implementation of a MS’s PSC and the easiness of starting a business therein is all but clearly explored, there is little doubt, and the World Bank54 confirms it (see Box 1), that a strong link exists between the two. Also the Deloitte study confirms that the easiness of establishment is an expected outcome of the implementation process, when pointing out that “although sound progress is reported in the area of simplification of procedures [..] the creation of PSC has in many cases not yet led to a simplification in administration in terms of business establishment”. In other words, gradual improvements in the national PSC towards fully transactional eGov portals may have failed to provide a tangible benefit, starting from easier establishments. This remark highlights further value added brought by the hereby adopted approach compared to previous ones: in fact, it explores an admittedly significant yet so far essentially overlooked aspect of the implementation process, i.e., a homogeneously carried out evaluation across all MS of the tangible economic benefits, in terms of PSE, somehow related to setting up PSC.
4. Analytical framework
4.1 The data
The two major data sources used in the present analysis are the World Bank's Doing Business 2012 Database (DB, hereafter), and a set of completion scores of the national PSC prepared by the Commission Services (DG MARKT), based also upon information collected in the mentioned Deloitte study. Let us analyse them in turn. The DB dimensions, as defined in Box 1 above, are collected by the World Bank with a transparent, reliable, and replicable method across countries, and can be readily translated in a monetary indicator of the EU27 MS’ procedural burdensomeness of starting up a service provider in each year of the observation period 2003-2011. This is allowed by resorting to a Standard Cost Model (SCM, hereafter) to compute, in each MS and year of interest, the absolute cost to start up a business, inclusive of both the external expenses implied by the procedural requirements and the opportunity cost of the time to deal with them all. Since the World Bank takes a “representative” start-up, the computation of this average setting-up cost per firm times the national annual flow of new service providers in the scope of the SD should provide a reliable indication of the country's overall cost related to such establishments For instance, to calculate this cost for the last year of the observation period, i.e. 2011: I) For each MS, a SCM allows calculating the absolute cost faced by a representative entrant therein in 2011, starting from the correspondent DB levels of the external setting-up costs, in % of GDP/capita, and of the total days required to deal with the setting-up procedures, given by their average number times the duration in days of each procedure. The simple equation applied to this aim is reported in equation 1 below:
Equation 1: The SCM-based equation for the absolute cost per firm
ci2011,ii2011,2011, IWH ii
fi ExtDC += (1)
54 See www.doingbusiness.org/data/exploretopics/~/media/FPDKM/Doing%20Business/Documents/Annual-Reports/English/DB12-Chapters/starting-a-business.pdf.
41
Here, fiC 2011, indicates the absolute monetary cost (in €) per firm f in the country i and in year
2011, 2011,iD and 2011,iExt are the country's DB dimensions in 2011, i.e., the total days and
external costs for setting up a firm f therein, and iH, iW, and ciI are, respectively, the country's
average number of working hours per day, the country's average national hourly wage55, and the country's average GDP capita56 over the observation period 2003-2011. This way, not only the external costs are translated in monetary terms but the average national hourly wage allows also associating an opportunity cost to the time devoted to the information obligations. This already represents an improvement over the past studies that took into account country-specific and fixed time tariffs57, to the detriment of the cross-country replicability of the methodology. Instead, this approach leads to an absolute and comparable monetary cost per start-up in 2011 for all MS of interest, while accounting also for the national differences in wages levels and working time. Let us now suppose to compare, for each MS, the 2011 cost level obtained by equation 1 with its highest level over the years 2003-2009, hereafter termed the pre-SD period58. Analytically, this means to replace the levels of the DB dimensions in 2011 with their respective maxima over the pre-SD period59, e.g., Exti,max=max{Exti, j} j∈[2003,2009]. The comparison between the two costs reasonably reflects, without overestimations, the simplification effort pursued by the MS over the analyzed period, in that the maxima of the DB dimensions typically60correspond to their levels in either 2003 or 2004. Figure 2 below reports each MS’s absolute cost per start-up, respectively, in 2011 and for the worst setting-up conditions over the pre-SD period: the countries are in descending order based on their absolute setting up cost in 2011. This provides a straightforward graphical hint at: i) the significant simplification effort, hereafter indicated as PSE, already achieved by some MS in the cost of establishing a firm, which, in fact, decreased from more than 5000 € to about 2000 € on EU average; ii) the still considerable gap between the most and the least burdensome business environments, as the overall costs per start-up, obtained by means of the
55 The average hourly wage is calculated as the ratio of the yearly net labour compensation drawn from EUROSTAT (one-earner with 100% of AW) to the yearly working hours, reported by the OECD.StatExtracts. It is worth noticing that a correction was required for some missing values for the yearly working hours of Cyprus, Latvia, Lithuania, and Romania, replaced by the corresponding yearly average in the EU27. 56 Data on working hours and GDP/capita are drawn from OECD.StatExtracts and EUROSTAT, respectively. 57 Refer to Section 3: for instance, the BERR study takes an hourly value of time of 20.23£, stemming from a previous survey-based study, while the Zwischenbericht an average tariff of 28.10€. It is worth noticing that the average hourly wage tends to be lower than these time tariffs, amounting on average to about 17.5€ and 16€, respectively in the UK and in DE. As a sensitivity check, one could thus explore the impact of this time-tariff option against alternative ones, like the GDP per working hour used in the CPB study Intra-EU Differences in Regulation-Caused Administrative Burden for Companies (H. Kox, 2005). 58 It is reasonable to consider the years 2003-2009 as a pre-Services Directive period, in that Directive 2006/123/EC, approved on December 12th 2006 by the European Parliament and Council, had already been in the pipeline since 2004, when the first draft was devised by the Commission with an eye on introducing important changes in the EU services market. Moreover, the final version set the end of the 2009 as the deadline for its complete implementation by the MSs, coming into force on December 28th 2009. 59 The “worst pre-SD year for setting up” is thus that characterized, respectively, by most days or the highest external costs for setting up a firm over 2003-2009. Taking the maximum of the time and cost over the pre-SD period as a starting point has, in fact, the advantage to remove the problems entailed by possible yearly fluctuations in the levels of the World Bank's collected values, including due to missing data or measurement errors, and to capture the full extent of the MSs' simplification effort, irrespective of when it actually started. 60 The only exceptions are BG and PL, for instance, in the former case, for a rather outlying value for the total days in 2008
42
aforementioned approach encompassing the opportunity cost of time, ranges from 250 € in BG to 5500 € in AT in 2011. Figure 2: MS' absolute monetary costs per start up in the worst pre-SD year for setting up and
in 2011
II) The second step of the computation procedure requires multiplying the monetary cost per start-up obtained in I by the average annual flow of new service providers in the scope of the SD61, approximating each MS’s aggregate monetary cost for the establishment of service providers. E.g., the ith MS's overall absolute cost related to all establishments affected by the SD in 2011 is given analytically by: i
fii FCC 2011,2011, = . Here, iF indicates the ith MS's average
flow of new entrants over the observation period, used in lieu of the yearly figures in light of their frequent missing values and significant fluctuations over time. This absolute cost can be subsequently expressed as a percentage of each MS's average GDP over 2003-2011: Figure 3 reports these relative costs, respectively in 2011 and for the worst pre-SD setting-up conditions. The graph broadly confirms the already drawn conclusions: the results per MS are, in fact, characterized by marked heterogeneity, and the aggregate cost decreases from 0.14% to 0.05% of GDP at the average EU level.
61 The yearly flows of new entrants are drawn from the Business Demography Statistics of EUROSTAT: the NACE Rev. 1.1 sectors F, G, H, I63, K, and O93 are considered as those covered by the SD. Minor corrections are required for the missing values of all flows in GR (approximated by the difference in the yearly sectoral stocks) and for some yearly levels of O93 in IE, PL, and PT (usually ignored in the forthcoming computations).
43
Figure 3: MS' costs for service providers' establishments in the worst pre-SD year and in 2011
The second major source of information used in the study is constituted by a set of percentage maturity scores, assigned to each national PSC within the EU27 by the Commission Services (DG MARKT). These are based upon a number of considerations, ranging from the findings presented in a Deloitte study62 to the evaluation of a series of qualitative features of the PSC, based on expert judgement. In particular, a percentage score is assigned to each national PSC in terms of seven qualitative dimensions, including availability and quality of information, availability of transactional eGov, technical accessibility, clarity of information for foreign users, language availability, ease of use and user-friendliness: the overall MS' scores are thus obtained as weighted averages of the partial scores, with weights given by the relative importance assigned by the Commission Services to each dimension. The scores range from 25% in BG to 81.3% in SE, and a missing value corresponds to RO as the only MS where a PSC was not yet online nor a pilot was available at the time of the evaluation. Figure 4 below shows by appropriate scatter-plots the correlation existing between the MS’ completion scores and, respectively, the relative aggregate setting-up cost therein in 2011 (left) and its change between the worst pre-SD situation and 2011 (right).
62 Ibidem.
44
Figure 4: Correlation between MS's maturity score of national PSC and level/change in start-up cost
The figure clearly hints at a very weak correlation in both cases: on the left, this means that, in a certain year (2011), the best performing MS in terms of the qualitative dimensions of a PSC summarized by the maturity scores need not correspond to those with the lowest DB-based aggregate setting-up cost for service providers. E.g., only a few MS, like DK, FI, SE, and UK, have both a top completion score and a lower-than-average setting-up regulatory cost. Instead, other good performers in terms of PSC, like ES and SK, have two among the highest aggregate costs for the establishment of their service providers in the EU27. Nevertheless, looking at the scatter-plot on the right, ES and SK are among the countries that reduced the most the burdensomeness of their setting-up related procedures. It thus seems that a MS’s good completion score may coexist with either good entry conditions or a significant improvement in them, but with no clear pattern and a weak correlation with both. As for the latter case, this may be justified by the observation that the scores, being static variables assessing each MS’s level of implementation in 2011 irrespective of its starting level, are inadequate to capture the dynamic information conveyed by the change in their aggregate setting-up cost, i.e. what has been defined the PSE. In the former case, the explanation is that the methodology underlying the computation of the scores focuses on qualitative information that is rather orthogonal to that conveyed by the DB dimension: in fact, as already highlighted in Section 3, having set up a national PSC does not mean having achieved procedural simplification (yet). This may entail in the short run the analytic risks posed by the use of heterogeneous data within the same estimation methodology, including less clearness on how to make the best use of the available information. Nevertheless, this is considerably tempered by: i) on the one hand, the reasonable expectation that the two variables will exhibit stronger correlation in the medium run; ii) on the other, the awareness that the possibility to resort to data on disparate aspects of the implementation process may bring clear advantages in terms of the informative content of the obtained findings. Therefore, the methodology described in the rest of the Section constantly tries to exploit the highest amount of information from both data sources, i.e. the DB and the Commission Services’ completion scores, in order to end up with the most informative approximation of
45
the economic impact of setting up national PSC, based on the MS’ currently achieved and further achievable gains in terms of PSE. The entire computation rests on the assumption that fully mature PSC should also imply "tangible" aspects of procedural simplification, starting from easier establishment of the service providers affected by them.
4.2 The achieved gain: computation methodology
Starting from the World Bank’s DB, simple changes to the approach adopted in Section 4.1 to compute the absolute setting-up costs allow obtaining a distribution per MS of the achieved benefit, expressed in monetary terms, from the current progress in the PSE between the worst pre-SD situation and 2011. Let us call this hereafter the achieved gain. In order to compute each MS's achieved gain in 2011, the salient points of the quantification are hereafter described, the definitions introduced in Section 4.1 still holding, wherever not else specified. I) For each MS, the achieved gain is computed starting from the reduction in total days and extra costs of setting-up per service provider: in other words, the gains per firm are defined as the difference in the two DB dimensions between the worst pre-SD year and 201163. The SCM-based equation 1 subsequently allows translating them in a monetary benefit per start-up64, inclusive of the opportunity cost of the saved time. II) For each MS, the multiplication of the marginal saving per setting-up firm computed in I by the average national annual flow of new service providers in the scope of the SD leads to an overall monetary achieved gain in 2011 as far as establishments are concerned. III) Each MS's achieved gain computed in II in absolute terms can be expressed as a percentage of its average national GDP over the observation period: this will correspond, by definition, to the difference between the two relative setting-up costs represented in Figure 3. IV) A possible problem of the methodology adopted so far is that some MS, like DK and the UK are likely to be characterized by very low achieved gains that, however, need not reflect the scarce PSE therein pursued. Instead, this may be due to the "persistently light" regulatory environment in such countries: in other words, these are likely to be characterized by lower than average setting-up time and costs that, in addition, have only slightly changed from the pre-SD period to 2011. On the other hand, these low achieved gains may well signal some MS' tendency to pursue a PSE well before the SD, following the general trend towards administrative simplification in which it was naturally introduced. As specified in Section 3, one of the best-known examples is the UK, where the governmental website Business Link was de facto an operational PSC for the English service providers even before the first version of the SD, and where already in 2006 Detica surveyed the existing English websites looking for an eligible one to host the forthcoming PSC. Summing up, it seems plausible to believe that for a set of "best-performers" across the EU27 in terms of DB dimensions the PSE started before 2003, i.e. the first year of the DB 63 For instance, one gets that, on average, a firm in Italy has “gained” 17 days and 983€ (corresponding to 3.9% of the average Italian GDP/capita) to be set up with respect to 2003, which had, in fact, the worst setting up conditions over 2003-2009 (23 days and costs amounting to 22.1% of the national GDP/capita). 64 In other words, the benefit per firm is given analytically by: (gain in working hours to complete all setting-up procedures)*(average national hourly wage)+(gain in external costs)*(average national GDP/capita).
46
observation period, implying an underestimation of the achieved gain stemming from it (as the DB poorly captures the change in time and cost of setting-up over the observation period): since the approximation of the economic impact of setting up national PSC is based also on such achieved gain, a correction is in order especially for those, among these top performing MS, whose completion scores indicate a significant maturity of implementation. Put differently, the achieved gains to be corrected belong to the MS in the intersection of the sets of half best performers across EU27, respectively, in each DB dimension65 and in terms of the completion scores of their PSC: these are DK, FI, SE, UK, and LV. In the absence of more country-specific fine-tuning information, the hereby assumed correction is to impute to these MS an additional (relative) achieved gain, equal to the EU average, as if it had been achieved before 2003: let us call the result adjusted achieved gain.
4.3 The additional gain: computation methodology
The rather low average of the Commission Services' completion scores across the EU27, around 54%, indicates that there still exists significant scope for improvement of the national PSC. Based on this consideration, one may be interested in using the information provided by the DB dimensions to compute also each MS's further benefit to be reaped by pursuing an ideally full progress in their PSE. To this aim, a “benchmark approach” is hereby adopted: it consists of computing, for all countries, an interval estimation of the potential monetary gain stemming from the progress in their PSE between the current situation and an ideal benchmark, represented by the best practices across the EU27 in terms of each DB dimension. Let us call this hereafter the additional gain of moving to the benchmark: this is univocally defined as the set of the minimum levels across EU27 of the two DB dimensions related to setting up a firm. Namely, such ideal country is identified by 4 days, as in BE, and no external costs, i.e. 0% of per capita GDP as in DK and SI, to start up a business. The approach to computing the additional gain (actually its lower bound, as explained now) is analogous to that used for the achieved gain in Section 4.2. In fact, the additional gain per service provider in each MS is obtained by resorting to a SCM to monetize the saved time and external costs of starting up a firm therein between 2011 and the ideally reached benchmark66; by multiplying such average saving per service provider by the average national annual flow of new service providers in the scope of the SD, one obtains then the desired additional gain from moving to the benchmark setting up conditions, everything else being equal. Namely, the underlying assumption is that the flow of new service providers be exogenous, as if the PSE did not affect the entry rates: let us thus call this gain the lower bound additional gain. As an improvement over such hypothesis, assumed by most previous studies in the literature, the present analysis calculates also an upper bound additional gain, obtained under the
65 The best performers in time are DK, CY, NL, UK, SE, LV, IE (1st quartile), IT, LT, LU, AT, RO, FI (2nd qrt.); those in costs are DK, SE, UK, FI, FR, LT, DE (1st qrt.), AT, EE, SK, CZ, LV, BG (2nd qrt.). 66 For instance, one gets that the average Italian service provider moving to the benchmark would "gain" 2 days and an external cost of 18.2% of GDP/capita for setting up, which, according to the employed SCM, amounts to a saving of 4587.7€ per service provider affected by the SD.
47
assumption that the MS' flows of new service providers be not exogenous, but affected by the PSE-related improvements in their entry conditions. This impact is predicted by a semi-logarithmic time and country fixed-effect panel regression model for the flow of new service providers in the scope of the SD, as shown in figure 5. As illustrated, this takes into account, among the explanatory variables, the DB dimensions67, yearly dummies capturing a 5% significant time effect, and, inspired by a similar regression analysis carried out by the OECD68, the smoothed growth rate of the value added in the services sector, as a proxy for market profitability. A specification including also the smoothed capital intensity, i.e. the ratio of capital stock to value added as a proxy for fixed entry costs, had been considered: however, the coefficient on the additional explanatory variable, though presenting the expected negative sign, was not 5% significant, and was thus dropped. Instead, in the reported specification, all the coefficients on the relevant regressors carry the expected sign, positive on profitability and negative on the lagged number of setting up procedures and on the entity of external costs, and the latter are also 5% significant. An exception is, instead, represented by the lagged average duration in days to deal with each setting-up procedure, which is not statistically significant at a standard 95% confidence level.
Figure 5: time and entity fixed effects panel regression model for the entry rates of new service providers.
As expected, the model predicts an upward adjustment of the MS' flows of new service providers in light of further PSE, i.e. reduction in both the procedures and the magnitude of external costs for setting up a business, entailed by moving to the benchmark. Each country's average additional flow with respect to the baseline is predicted to be around 40.000 new entrants in the scope of the SD, although the figure varies considerably across MS. 67 In particular, the days per procedure and the number of procedures are taken with a lag, as not immediately identifiable by the start-ups except on the basis of the previous year records. This rules out also any problem of reverse causality for these regressors. Instead, the external cost is taken without lag, as a more easily quantifiable variable by the setting up businesses: in this case, the exogeneity is ensured by the variable definition. 68 The sources of economic growth in the OECD countries, OCED 2003.
48
Now, by multiplying the marginal saving per service provider by the average national flow of new service providers in the scope of the SD, adjusted to take into account its predicted increase due the additional entry rates induced by an ideal PSE, one gets the DB-based upper bound additional gain from moving to the ideal country. Also in this case, in order to exploit the maximum degree of information from both the DB and the qualitative aspects summarized by the Commission Services' completion scores, a further adjustment is applied to such upper bound, based upon equation 6 below: Equation 6: The equation for the adjusted additional gain, based on the “completion scores” w
}2
1~;max{~ w
wcaaa
iui
ui
ui
−+
= (6)
The idea underlying equation 6, where uia and ic~ are, respectively, the ith MS's upper bound
additional gain and adjusted achieved gain, and ]1,0[∈w is the maturity score of its PSC, is to apply an upward adjustment to a country's additional gain only if the need of it is clearly indicated by a weakly correlated variable to it, like the completion scores. As discussed in Section 4.1, in fact, these scores should capture a series of additional features, other than the mere easiness of setting up, whose economic impact is likely to materialize at least in the long term. Overlooking these aspects may thus lead to underestimating the further potential benefit to be reaped in light of a due implementation. In practice, an alternative additional gain is obtained by multiplying the adjusted achieved gains by the complement to unity of the current completion scores, in order to approximate the value of filling the gap with an ideal full completion in qualitative terms. The mentioned heterogeneity between the two variables is partly controlled for by averaging out the alternative additional gain and the original one (thus sticking to a more homogeneous DB-based computation) before taking the maximum between the two. Let us call the result of the correction the adjusted additional gain.
4.4 The DSGE-based simulation
The final step of the adopted analytical framework outlined in Section 2 is the estimation of the overall economic impact on the MS' GDP of their duly computed PSEs. This is accomplished through a simulation based on the Commission Services (DG ECFIN)' QUEST III dynamic stochastic general equilibrium model69. In fact, this allows simulating the overall economy-wide effects of the computed achieved and additional gains in Sections 4.2 and 4.3. In other words, the MS' absolute gains, stemming from the PSE, respectively pursued so far and ideally pursuable in a "what-if" scenario, are interpreted as positive policy shocks to be fed into the model. Namely, as discussed in
69 This is based on the work "Simulation scenarios on economic impact of the Point of Single Contact for Unit B.2." by Roeger W. and Varga J. In particular, the employed variant of QUEST III is an extension of that based on the DSGE described in Fiscal Policy in an Estimated Open-Economy Model for the Euro Area (Ratto M., W. Roeger and J. in ’t Veld, 2006), which already incorporated improvements on the production side, in particular a clear distinction between variable and fixed costs. Among the additional features it is worth mentioning a higher degree of disaggregation, including among MSs and between two sectors (services and non-services).
49
Sections 4.1 and 4.2 and elsewhere in the literature70, they can straightforwardly be interpreted as reductions in fixed costs, given by each MS’s absolute monetary burden related to the establishment of all service providers in the scope of the SD. In the case of the adjusted achieved gain and of the lower bound additional gain, only the direct macroeconomic effects of the regulatory streamlining are taken into account, under the assumption that no entry takes place. De facto, this ceteris paribus assumption, whereby the flow of new service providers is kept constant, equals to assuming that imperfect products markets impair indirect competition-related effects. Instead, as for the upper bound (adjusted) additional gain, a competition-enhancing effect is accounted for in the simulation. In fact, the fixed costs associated with the regulation can be regarded as entry barriers, imposing a lower bound to the mark-ups charged by the existing firms to cover them: well functioning product markets should thus entail that a policy shock reducing such costs leads to more entry and an erosion of mark ups, so as to re-establish the previous level of economic rents. In practice, the simulation is carried out by assuming a one-shot shock at the beginning of the observation period (2003), whose entity corresponds to the impact of the achieved gain in terms of fixed entry costs71. After roughly a decade (2012), a further shock is added, having a magnitude corresponding to that MS’s additional gain under the two explored scenarios of, respectively, exogeneity (lower bound) and endogeneity (upper bound) of the flows. The economic impact of these shocks on the MS’ GDP is reported in detail in Annex V, in the case of the additional gain only in the medium term, i.e. after 5 years, and in the long run for the sake of readability. In the following Section, the results of the mentioned simulations are presented, also graphically, and discussed in turn.
5. Estimation Results
As discussed so far, the magnitude of the economic impact on the MS’ GDP of their already pursued and further achievable PSE will depend on: i) the savings per start-up, achieved in light of the simplification in terms of setting-up procedures and thus of time and costs to deal with them; ii) the market share of the sectors in the scope of the SD in the national economy, and thus the absolute entry rates of the firms affected by its implementation; iii) the predicted econometric impact of the PSE on such entry rates; iv) the results of the DSGE-based simulations to translate the computed MS’ direct gains from PSE in economy-wide effects. The first three aspects are graphically summarized in Figure 7 and 8, which report the crude results before the DSGE-based simulations of the quantification methodology outlined in Section 2 and discussed in Section 4, respectively, at the firm and country-level. Country-specific results for such direct gains are reported in Annex IV. Namely, at the EU-level, the estimated direct gain from the PSE is close to 0.1% of GDP, while the additional gain range between 0.04%and 0.09% of GDP, the former being its lower bound and the latter its adjusted upper bound (in Figure 8 the difference of the two is labelled "extra additional gain"). 70 Refer, for instance, to Quantitative Assessment of Structural Reforms: Modelling the Lisbon Strategy (A. Arpaia, I. Grilo, W. Roeger, J. Varga, J. in 't Veld, and P. Wobst, 2007) 71 It has already been observed that each MS’s achieved gain (before adjustment) corresponds de facto to the entity of the change in its aggregate relative cost for the establishment of all services providers in the scope of the SD between the worst pre-SD period and 2011.
50
Figure 7: achieved and lower bound additional gains (point estimations) from PSE at firm level
Figure 8: achieved (point estimation) and additional (interval estimation) gains from PSE at country level
Figure 7 shows significant variations among MS even in terms of achieved savings per firm from the current PSE. These vary from about 10,000€ in ES and BE to less than 1000€, e.g.,
51
in DK, SE, and UK72: nevertheless, as said, these results should be taken with the benefit of inventory. In fact, the awareness that the simplification effort is likely to have started for some top-performing countries before the observation period covered by the DB was at the basis of the adjustment introduced for the achieved effort73 in Section 4.1. Instead, it seems more interesting to observe how, even in these “top performing” MS, characterized by a persistently light regulatory environment, the estimated additional gain can be rather considerable: in a “what-if” scenario of closing the gap with a benchmark country, the further saving per start-up amounts, in fact, to about 2000€ in UK and SE, only slightly below the EU average of around 2500€. These should be compared with the start-up capital of the average World Bank’s firm, amounting by definition to 10 times the national GDP/capita. Figure 8 shows each MS’s achieved gain (point estimation) and additional gain (interval estimation) in terms of % of its average national GDP, as far as all service providers in the scope of the SD are concerned: it is worth recalling that this operational hypothesis is rather conservative with respect to some previous studies that computed the economic impact of the implementation by extending it to all service providers or even to all national firms. Also in Figure 8, there are significant differences among MS, even after the mentioned correction for the best performers. The case of PT is emblematic, as it appears quite an outlier with respect to other MS. Indeed, its significant achieved gain is the outcome of both a slightly higher than average entry rate of SD-affected service providers and, above all, an outstanding simplification effort in setting-up procedures. In fact, their completion required 78 days and 13.5% of the GDP/capita in 2004, and only 5 days and 2.3% of GDP/capita in 2011, as recorded by the DB dimensions, and the country’s global ranking in starting up a business has increased by 30 positions only in the last year. Even if one may argue that such PSE may only partly be imputed to the setting up of the Portuguese PSC, it is true that the case of Portugal is explicitly mentioned by both the methodological note of the World Bank’s section “Starting a Business”, and the Deloitte study74. Namely, the latter highlights how at the beginning of 2012 the completion score assigned to the Portuguese PSC in June 2011 was already likely to be out-dated, in light of the considerable on-going simplification process undertaken by the country. Annex V reports the country-specific and EU-level results of the DSGE-based simulations in terms of economy-wide GDP impact from the PSC-related PSE. These are referred to both a medium-run five-year horizon and to the long-run steady state. Namely, at EU level, the already achieved economy-wide impact of the pursued PSE is estimated around 0.13% of GDP. On top of this, as far as the EU-wide impact of pursuing further PSE is concerned, the additional gains are predicted to range between 0.06% and 0.15% over a five-year horizon and between 0.09% and 0.21% in the long-run. Even if these results should be read bearing in mind all the discussed caveats, they indicate that up to 2pp of growth could be expected at the EU level only by taking into account an ambitious "what-if" scenario of procedural streamlining in establishing service activities induced by setting up national PSCs. Besides, most of these gains (some 75%) would already materialize in a 5-year horizon. 72 The case of CY, instead, is less controversial, as the mentioned availability of DB data only from 2008 may well explain a slight underestimation of the gain from the currently achieved PSE (but not for the additional). 73 This correction is, clearly, not yet taken into account at the firm level in figure 7. 74 Ibidem.
52
6. Conclusions to Part 2
This part of the study describes and implements a homogenous approach across the EU27 Member States aiming at a reasonable approximation, at least over the long-run, of the potential economic impact of setting up national Points of Single Contact (PSC). The need to resort to a proxy for the actual benefit is closely interwoven with the necessity to fill a gap left by the previous studies on the topic, in either dealing with merely qualitative aspects of the implementation or in providing very country-specific, thus not replicable, estimations. In the absence of viable alternatives in terms of quantitative data, the approximation is based upon the World Bank’s Doing Business 2012 Database, in that it readily allows obtaining, by means of a Standard Cost Model, a quantitative indicator of each country’s burdensomeness of starting up and initially operating a service provider in the scope of the Services Directive (SD). Its change over time provides thus an idea of the “procedural streamlining effort” (PSE) pursued by each Member State, also in light of the requirements set out by the SD. The adopted analytical framework allows computing, and then translating into economy-wide effects through the Commission Services’ QUEST III model, the benefit from, respectively, the currently pursued PSE and the further achievable one in a “what-if” scenario: in this case, the MS are supposed to close their gap in terms of DB dimensions with a benchmark country sharing their best performances across EU27. This methodology is substantially in line with previous approaches in the literature, although it improves them analytically and in terms of starting data and country-specific fine-tuning. It is also supported, throughout the analysis, by a thorough discussion on the existing correlation between the currently pursued and further pursuable PSE and, respectively, the tangible effects of the present state and expected developments of the implementation of PSC. Namely, the findings indicate that the correlation between the two variables may be weak in the short term, especially in light of the evidence that setting up PSC has only rarely implied already streamlined procedures to start up service providers. In addition, the DB-based approach is bound to be a conservative approximation, in that it overlooks the crucial SD-related aspect of the cross-border provision of services, as well as other phases of each service provider's lifecycle likely affected by the PSC. Nevertheless, this approach is supported by the reasonable expectation that the two variables will likely exhibit stronger correlation over the medium run, when not only the mere usability, but the effective and widespread use of the PSC should indeed entail a series of tangible outcomes, like, in the first place, administrative simplification in setting up and formally operating service providers. In addition, even in the short run, possible discrepancies are tempered by an attempt in the estimation methodology to make the best possible use of additional information other than the DB, namely a set of maturity scores assigned by the Commission Services to the national PSC in terms of qualitative features. The estimated economy-wide impact of the already pursued PSE is 0.133% of GDP on EU average, and the predicted additional impact of a benchmark level of procedural streamlining is 0.06% - 0.15% of GDP in the medium run and 0.09% - 0.21% of GDP in the long run.
53
In conclusion, in spite of the caveats entailed by some underlying assumptions, it seems that indeed the current analysis brings value added compared to previous ones, first of all in that it provides a comparable quantitative reference as for the potential economic impact of the MS' current development and further improvements in terms of procedural streamlining efforts that are assumed to be related to the SD implementation. Moreover, among the operative policy implications, the findings suggest that the MS could reap significant gains, up to 0.21% of GDP on average, by closing their current gap with a benchmark level of implementation, as well as pursuing improvements in its tangible economic outcomes, first and foremost its effective capability to benefit all the involved businesses.
54
References
Arellano, M. and O. Bover (1995): "Another look at the instrumental variable estimation of error-components models". Journal of Econometrics 68(1), 29-51.
Arpaia A., I. Grilo, W. Roeger, J. Varga, J. in 't Veld, and P. Wobst (2007), "Quantitative Assessment
of Structural Reforms: Modelling the Lisbon Strategy".
Autor, D.H., Levy, F. and R.J. Murnane (2003): "The skill content of recent technological change: an empirical exploration". Quarterly Journal of Economics, 118(4), 1279-1333.
Badinger, H., F. Breuss, P. Schuster and R. Sellner (2008): "Macroeconomic effects of the Services Directive," Published in "Services Liberalisation in the Internal Market", F.Breuss, G. Fink, St. Griller (eds.), ECSA Austria Publication Series, Vol. 6. Springer.
BERR (2009): "Impact Assessment of the Implementation of the Services Directive"
Bertschek, I., B. Engelstätter, and K. Szczygielski (2010): "The Role of Information Technology For Service Sector Performance". SERVICEGAP Review Paper 3, http://servicegap.org/app/download/4097262102/RP3+Bertschek+et+al.pdf
Blind, K. and A. Jungmittag (2004): "Foreign Direct Investment, Imports and Innovations in the Service Industry". Review of Industrial Organization 25(2), 205-222.
Blundell, R. and S. Bond (1998): 'Initial conditions and moment restrictions in dynamic panel data models'. Journal of Econometrics 87(1), 115-143.
Breinlich, H. and C. Criscuolo (2011): "International trade in services: A portrait of importers and exporters". Journal of International Economics 84(2), 188-206.
Breuss, F. and H. Badinger (2006): "The European single market for services in the context of the Lisbon agenda: macroeconomic effects of the Services Directive". In Deepening the Lisbon Agenda, Studies on Productivity, Services and Technologies, Federal Ministry of Labour of the Republic of Austria (BMWA), Vienna.
Choi, C. (2010): "The effect of the Internet on service trade". Economics Letters 109(2), 102-104.
Consoli, D. (2007): "Services and systemic innovation: a cross-sectoral perspective". Journal of Institutional Economics 3(1), 71-89.
Copenhagen Economics (2005a): "Economic assessment of the barriers to the internal market for services", Final report.
Copenhagen Economics (2005b): "The Economic importance of the country of origin principle in the proposed Services Directive". Report for the UK Department of Trade and Industry: http://www.berr.gov.uk/files/file22901.pdf
Davies, R.B. (2005): "Fragmentation of headquarter services and FDI". North American Journal of Economics and Finance 16(1), 61-79.
De Brujin, R., H. Kox and A. Lejour (2006): "The trade induced effects of the Services Directive and the country of origin principle", CPB Document 108.
55
De Brujin, R., H. Kox and A. Lejour (2008): "Economic benefits of an Integrated European Market for Services". Journal of Policy Modeling 30(2), 301-319.
Deloitte (2012): "The functioning and usability of the Points of Single Contacts under the Services
Directive – State of Play and Way Forward" (pre-print)
Detica (2006): "EU Services Directive: Evaluation of Administrative Costs".
Doytch, N. and M. Uctum (2011): "Does the worldwide shift of FDI from manufacturing to services accelerate economic growth? A GMM estimation study". Journal of International Money and Finance 30(3), 410-427.
Freund, C. and Weinhold, D. (2002): "The Internet and international trade in services". American Economic Review 92(2), pp. 236-240.
Froot, K. A. (1989): 'Consistent Covariance Matrix Estimation with Cross-Sectional Dependence and Heteroskedasticity in Financial Data'. The Journal of Financial and Quantitative Analysis 24(3), 333-355.
Gelouff, G., and A. Lejour (2006): “The new Lisbon Strategy: An estimation of the impact of reaching five Lisbon targets”. Industrial Policy and Economic Reform Papers 1, DG ENTR.
Greene W. (2011): "Econometric Analysis", 7th edition.
Head, K., Mayer, T. and Ries, J. (2009): "How remote is the offshoring threat?". European Economic Review 53(4), 429-444.
Huber, P. J. (1967): 'The behavior of maximum likelihood estimates under nonstandard conditions'. Proceedings of the 5th Berkeley Symposium on Mathematical Statistics and Probability pp. 221-233.
Inklaar, R., M.P. Timmer, and B. van Ark (2008): "Market services productivity across Europe and the US." Economic Policy 23(53), 139-194.
Kandilov, I.T. and T. Grennes (2012): "The determinants of service offshoring: Does distance matter?" Japan and the World Economy 24(1), 36-43.
Kox, H. (2005): "Intra-EU Differences in Regulation-Caused Administrative Burden for Companies"
Kox, H., A. Lejour and R. Montizaan (2004): "The free movement of services within the EU," CPB Document 69.
Lejour, A., H. Rojas-Romagosa and G. Verweij (2007): "Opening services markets within Europe: modelling foreign establishments in a CGE framework", CPB Discussion Paper 80.
Lejour, A., H. Rojas-Romagosa and G. Verweij (2008): "Opening services markets within Europe: Modelling foreign establishments in a CGE framework", Economic Modelling 25(5), 1022-1039.
Love, J.H and M.A. Mansury (2009): "Exporting and productivity in business services: Evidence from the United States". International Business Review 18(6), 630-642.
Miroudot, S., J. Sauvage, and B. Shepherd (2012): "Trade costs and productivity in services sectors". Economics Letters 114(1), 36-38.
OECD (2003): "The sources of economic growth in the OECD countries".
56
O'Mahony, M. and F. Peng (2010): "Workforce Training, Intangible Investments and Productivity in Europe: Evidence from EU KLEMS and the EU LFS". SERVICEGAP Discussion Paper 1, http://servicegap.org/app/download/3882271702/DP1_Training_and _ICT_2011.pdf
Pugno, M. (2006): "The service paradox and endogenous economic growth". Structural Change and Economic Dynamics 17(1), 99-115.
Ratto, M., Roeger, W., and in 't Veld, J. (2009). "QUEST III: An estimated DSGE model of the euro area with fiscal and monetary policy." Economic Modelling 26(1), 222-233.
Rivera-Batiz, F.L. and L.A. Rivera-Batiz (1990): "The effects of direct foreign investment in the presence of increasing returns due to specialization". Journal of Development Economics 34(1-2), 287-307.
Rogers, W. H. (1993): 'Regression standard errors in clustered samples'. Stata Technical Bulletin 13, 19-23.
Roodman, D. (2009a): "How to do xtabond2: An introduction to difference and system GMM in Stata." Stata Journal 9(1), 86-136.
Roodman, D. (2009b): "A Note on the Theme of Too Many Instruments." Oxford Bulletin of Economics and Statistics 71(1): 135-158.
Roth, F., A. Thum, and M. O'Mahony (2010): "Intangible Capital and Productivity Growth: A Literature Review with a Special Focus on the Service Industry". SERVICEGAP Review Paper 2, http://servicegap.org/app/download/4097255602/RP2+Roth+et+al.pdf
Santos Silva, J.M.C. and Tenreyro S. (2006): "The log of gravity". The Review of Economics and Statistics 88(4), 641-658.
Santos Silva, J.M.C. and Tenreyro S. (2011): "Further simulation evidence on the performance of the Poisson pseudo-maximum likelihood estimator". Economics Letters 112(2), 220-222.
Vinding, A.L. (2006): "Absorptive capacity and innovative performance: A human capital approach." Economics of Innovation & New Technology 15(4/5), 507-517.
Vogt, L. (2005): “The EU´s Single Market: at your service”, Economic Department Working Paper, ECO/WKP(2005)36, OECD.
White, H. (1980): 'A Heteroskedasticity-Consistent Covariance Matrix Estimator and a Direct Test for Heteroskedasticity'. Econometrica 48(4), 817-838.
Williams, R. L. (2000): 'A Note on Robust Variance Estimation for Cluster-Correlated Data'. Biometrics 56(2), 645-646. Wooldridge, J.: 2002, Econometric analysis of cross section and panel data. Cambridge, Mass: MIT Press.
World Bank (2011): "Doing Business 2012: Doing Business in a more Transparent World".
Zwischenbericht (2008): "Ermittlung von Entlastungspotentialen der EU Dienstleistungsrichtlinie gemäß SKM".
57
Annex I: Figures (Part 1)
Figure 1. The distribution of the levels of barriers (in all sectors and countries) before and after the Directive
Median level changed by -38.8%Heterog. changed by -25.1%
Ker
nel d
ensi
ty e
stim
ates
0 20 40 60 80Level of barriers (%)
Before the DirectiveMedian: 15.4%Std. dev.: 14.3 %-points
After the DirectiveMedian: 9.4%Std. dev.: 10.7 %-points
58
Figure 2. Patterns in barriers across countries
AT
BEBG
CY
CZ
DE
DK
ES
∗
FR
GR
HU
IT
LT
LU
LV
MT
NL
PL
PT
RO
SE
SI
SK
UK
R = 0.85
-20
-15
-10
-5
0
Cha
nge
of b
arrie
rs (p
erce
ntag
e po
ints
)
5 10 15 20 25 30Level of barriers before the Directive (%)
∗ denotes EE, FI, and IE.
AT
BE
BG
CY
CZDE
DK
ES
∗
FR
GR
HU
IE
IT
LT
LU
LV
MT
NL
PL
PT
RO
SE
SI
SK
UK
Pearson: -0.51Spearman: -0.49
Kendall: -0.36
0
20
40
60
Sha
re o
f abo
lishe
d re
stric
tions
in th
e to
tal n
umbe
r of r
estri
ctio
ns (%
)
40 60 80 100Share of partially reduced restrictionsin the total number of restrictions (%)
∗ denotes EE and FI.
AT
BE
BG
CY
CZ
DE
DK
ES
∗
FR
GR
HU
IE
IT
LT
LU
LV
MT
NL
PL
PT
RO
SE
SI
SK
UK
Pearson: 0.59Spearman: 0.63
Kendall: 0.47
0
20
40
60
Sha
re o
f abo
lishe
d re
stric
tions
in th
e to
tal n
umbe
r of r
estri
ctio
ns (%
)
20 40 60 80Total number of restrictions before the Directive
Figure 3. The total shares of the sectors covered by the analysis in GDP
0
10
20
30
%
MT1,2
SKRO
GRHU
CZ2PL
BGFI
ITIE1
SIDE
LTBE
PTLU1,2
SE1FR
NLAT
DKEE
LVUK
ESCY
Approximated by total shares (Value Added in factor cost / GDP) of the following NACE Rev.1 sectorsin Structural Business Statistics: K74, F45, H55, G52, K70, I63. No data for Malta. 1,2 Data for some sector(s) missing for 2004 or 2007 respectively.
2004 2007
Note: This figure covers the pre-crisis period which is used for the regression estimations in this study.
60
Figure 4. The impacts under the “what if – mean” scenario.
Impact = elasticity × average barrier change. The graphs are based on sector-level weighted average barrier changes. Some countries in the FDI graphs missing due to missing data. Orange bars = “central scenario,” yellow bars = additional impact under “what if” scenario.
61
Figure 5. The impacts under the “what if – 5 best” scenario.
Impact = elasticity × average barrier change. The graphs are based on sector-level weighted average barrier changes. Some countries in the FDI graphs missing due to missing data. Yellow bars = additional impact under “what if” scenario (net of the impact under the “central scenario”).
62
Figure 6. The GDP impacts under the “what if – mean” scenario (in %).
0.490.550.590.600.610.620.63
0.730.740.770.790.800.86
1.001.071.091.101.12
1.231.271.291.311.381.39
1.541.58
1.731.78
2.58
0.0
0.5
1.0
1.5
2.0
2.5
FIRO
LVBG
EEHU
LTPL
SICZ
MTSK
IEUK
BEDK
DENL
EU27AT
EAEL
PTIT
FRES
SELU
CY
Orange and blue bars = “central scenario,” yellow bars = additional impact under “what if” scenario.
Figure 7. The GDP impacts under the “what if – 5 best” scenario (in %).
1.051.051.23
1.481.491.58
1.741.89
1.992.012.152.172.192.202.232.31
2.502.522.542.552.702.702.782.82
2.912.963.01
3.59
4.18
0.0
0.5
1.0
1.5
2.0
2.5
3.0
3.5
4.0
4.5
ROSK
BGLT
PLHU
SICZ
FILV
ITPT
ELIE
DEBE
EAMT
EEEU27
FRSE
ATDK
NLLU
UKES
CY
Orange and blue bars = “central scenario,” yellow bars = additional impact under “what if” scenario.
63
Figure 8. The dynamics of the GDP impacts (in %) for the EU under
different scenarios.
0.0
1.0
2.0
3.0
0 5 10 15 20 0 5 10 15 20 0 5 10 15 20
Central What if - mean What if - best 5
Years after the barrier reduction
Note: The yellow horizontal lines mark the long-term impact. The orange lines denote the short- and medium-term impact.
Figure 9. The dynamics of the GDP impacts (in %) across the Member States under different scenarios.
The impact on GDP (in %) under the "what if - best 5" scenario
65
Annex II: Tables (Part 1)
Table 1: Theoretical macroeconomic effects of the Services Directive estimated in the previous studies
Reference Methodology Coverage Aggregate effects
Copenhagen Economics (2005a)
CGE model (CETM)
EU25
Intra-EU trade in services increases by 5% Total employment increases by 0.3% Employment in services increases by 0.5% Value added in services increases by 1.1% GDP increases by 0.6%
Copenhagen Economics (2005b)
CGE model (CETM) CoOP excl.
EU25
GDP gains are 7-9% lower than with CoOP
Kox et al. (2004) Gravity equation
EU14 (BE, LU together)
Intra-EU trade increases by 30-60% Intra-EU FDI increases by 20-40%
Gelauff and Lejour (2006) De Bruijn et al. (2006)
CGE model (WorldScan) FDI excl.
19 (BE, LU together. LT, LV, EE, CY, MT combined)
Intra-EU trade increases by 30-60% Total trade increase by 2-5% Economy-wide GDP increases by 0.3-0.7% Consumption increases by 0.5-1.2%
Lejour et al. (2007) Lejour et al. (2008)
CGE model (WorldScan) FDI incl.
19 (BE, LU together. LT, LV, EE, CY, MT combined)
FDI in services could increase by 20-35% GDP due to FDI could increase by 0.4% (0.1-0.8%)
De Bruijn et al. (2006) De Bruijn et al. (2008)
CGE model (WorldScan) FDI excl. CoOP excl.
19 (BE, LU together. LT, LV, EE, CY, MT combined)
Intra-EU trade increases by 20-40% Total trade increase by 1.0-2.2% Economy-wide GDP increases by 0.2-0.4% Consumption increases by 0.3-0.7%
Breuss and Badinger (2006)
Econometric partial equilibrium FDI excl.
EU11 (DK, LU, IE, PT excluded)
EU mark-up decreases by 3.75% (range -2.5, -5) Value added in services increases by 1.65% (range 1.10, 2.20) Total value added increases by 0.7%. Employment in services increases by 0.85% (range 0.56, 1.13)
Badinger et al. (2008)
Econometric partial equilibrium FDI incl.
EU11 (DK, LU, IE, PT excluded)
FDI flows inward flows increase by almost 20% Total GDP increases by 1.5% (0.8% via FDI channel and 0.7% via trade channel).
66
Table 2: The list of detailed restrictions later aggregated to the sector and country specific barrier indicators
Relevant for (yes/no)
Trade (cross-
border provision)
FDI (establishment)
Domestic labour productivity
(establishment)
1) Article 9 authorisations
a) Prior authorisation to access the activity no yes yes
b) Relevant for retail only: licences relating to outlet siting no yes yes
c) Relevant for retail only: specific authorisations linked to the sale of certain products no yes yes
d) Relevant for retail only: economic needs test no yes yes
2) Article 14 requirements
a) Discriminatory or nationality/residence requirements (Art. 14.1) no yes yes
b) Prohibition on having an establishment in more than one member state (Art. 14.2) no yes yes
c) Involvement of competitors in granting of authorisations (Art. 14.6) yes yes yes
d) Obligation to provide or participate in a financial guarantee or to take out local insurance (Art. 14.7) yes yes yes
3) Article 15 requirements
a) Quantitative or territorial restrictions (Art. 15.2a) yes yes yes
b) Legal form requirement (Art. 15.2b) yes yes yes
c) Shareholding requirements (Art. 15.2c) yes yes yes
d) Ban on having more than one establishment? (Art. .15.2e) no yes yes
e) Requirements on minimum number of employees (Art. 15.2f) yes yes yes
f) Minimum and/or maximum tariffs (Art. 15.2g) no yes yes
4) Article 16 requirements
a) Establishment requirement? (Art. 16.2a) yes no no
b) Prior authorisation? (Art. 16.2b) yes no no
c) Notification/registration obligations* yes no no
d) Insurance requirements* yes yes yes
e) Minimum and/or maximum tariffs* yes no no
5) Article 25 requirements
Restrictions on multidisciplinary activities yes yes yes
* Not mentioned explicitly in Article 16 but a very common type of restriction. Article 16 provides for an indicative list only (not a closed one).
Table 3: The encoding of restrictions before and after the Directive
Restriction before Restriction after
Meaning Value Meaning Value
Existed 1 Existed 1
Partially reduced 0.8
Not existed 0 Not existed 0
Table 4: The list of sectors distinguished in the barrier dataset and the corresponding sectoral classifications in the Eurostat datasets
Theme International trade in services, European Union Structural business Annual national accounts, Information society Human Resources in Lifelong learning geographical breakdown direct investments statistics price indices Science and Technology
Certification service in the area of construction 251 4500 F45 F -- -- F
Construction / Building company 251 4500 F45 F 10_F -- F
Crafts businesses in construction sector 251 4500 F45 F 10_F -- F
Engineers 280 7420 K74 K74 10_K K K
Hotels -- 5500 H55 H 10_H551_H552 H H
Large Retail (“grande surface”) -- 5200 G52 G52 10_G G G52
Legal services 270 7411 K74 K74 10_K K K
Real estate agents 275 7000 K70 K70 10_K K K
Restaurants -- 5500 H55 H -- H H
Small Retail shop -- 5200 G52 G52 10_G G G52
Tax advisers 276 7412 K74 K74 10_K K K
Tourist guide 242 6300 I63 I63 -- -- --
Travel agency 236 6300 I63 I63 -- -- -- (1) These are the preferred codes. If data is not available at this level of disaggregation for some countries and sectors, a time-series with at a higher level is used. This procedure is iterated until the top aggregation level. (2) More disaggregated data is available here, but a 2-digit (or more aggregated, as in the procedure for the trade data – see the note above) level is chosen in order to achieve a good match with the trade and FDI data, necessary for the calculation of such variables as trade/output and FDI/value added ratios, market size (output minus trade balance), and the price data (deflators). (3) These are country-level datasets. (4) With firm size modifications.
Table 5: Groups of alternative control variables
Group and variables Data source
Distance
Simple distance (most populated cities, km) CEPII
Simple distance between capitals (capitals, km) CEPII
Weighted distance (pop-wt, km) CEPII
Weighted distance (pop-wt, km) CES distances with θ = –1 CEPII
Cultural distance Hofstede(1)
Proximity
Dummy, 1 for contiguity CEPII
Dummy, 1 if countries were the same country CEPII
Language
Dummy, 1 for common official of primary language CEPII
Dummy, 1 if a language is spoken by at least 9% of population in both countries CEPII
Information and Communication Technology, ICT(2)
Number of main telephone lines per 100 inhabitants Eurostat, isoc_tc_ac2
Subscriptions to cellular mobile services per 100 inhabitants Eurostat, isoc_tc_ac2
Share of households with an internet access, % Eurostat, isoc_si_lia
Share of internet sales share, % Eurostat, isoc_si_ec
Share of sales via non-internet networks, % Eurostat, isoc_si_ec
Human Resources, HR(2)
Share of enterprises employing ICT/IT experts in 2007, % Eurostat, isoc_ske_itsp_e
Tertiary education graduates, % of aged 20-29 Eurostat, hrst_fl_tegrad
Human resources in science and technology, % of employment Eurostat, hrst_st_nsec
Share of employees in continuing vocational training in 2005, % Eurostat, trng_cvts3_41
Share of employed in lifelong education and training, % Eurostat, trng_lfs_04
(1) The cultural distance is calculated as an Euclidean distance from Hofstede’s “coordinates” (http://www.geert-hofstede.com/hofstede_dimensions.php) in a 4-dimensional space (the 5th dimension – “long-term orientation” – is ignored due to its limited availability across countries).
(2) In these groups, each variable enters the regression twice: for exporter and for importer.
69
Table 6: Estimation results for the gravity model for trade
p-values in brackets The dependent variable is in natural log in OLS. Time trend as well as sector and year fixed effects (dummies) included but not reported. * p < 0.2, ** p < 0.1, *** p < 0.05
Table 7: Estimation results for the gravity model for FDI
p-values in brackets The dependent variable is in natural log in OLS. Time trend as well as sector and year fixed effects (dummies) included but not reported. * p < 0.2, ** p < 0.1, *** p < 0.05
70
Table 8: Estimation results for the productivity model: Arellano-
Bover-Blundell-Bond GMM system estimator with cluster-robust standard errors
Table 9: The allocation of qualitative weights across restrictions
Weight Low Medium High Total number Article of requirements
9 a, b, c d -- 4
14 c a, d b 4
15 e, f a, b, c, d -- 6
16 c, d, e b a 5
25 Art. 25* -- -- 1
Total number of requirements
10 8 2 20
Note: The letters in the columns correspond to those used in Table 1 (in this Annex). * Article 25 includes just one restriction.
71
Annex III: Country and sector level data on barriers (Part 1)
0 1 2 3 4 5The number of barriers
Small Retail shopTax advisers
Legal servicesAccountants
Large Retail (grande surface)Architects
Tourist guideRestaurants
Real estate agentsEngineers
Certification service in the area of constructionHotels
Crafts businesses in construction sectorConstruction / Building company
In the order of the number of restrictions before the Directive
Note:There have been no abolished restrictions in AT.
AT
1 − unchanged 2 − partially reduced 3 − abolished
0 2 4 6The number of barriers
Travel agencyTax advisers
Small Retail shopLegal services
Large Retail (grande surface)Architects
AccountantsReal estate agents
Certification service in the area of constructionTourist guide
HotelsEngineers
Crafts businesses in construction sectorConstruction / Building company
Restaurants
In the order of the number of restrictions before the Directive
BE
1 − unchanged 2 − partially reduced 3 − abolished
72
0 2 4 6 8 10The number of barriers
Legal servicesConstruction / Building company
EngineersArchitects
Travel agencyCrafts businesses in construction sector
Small Retail shopLarge Retail (grande surface)
Certification service in the area of constructionTourist guideTax advisersRestaurants
Real estate agentsHotels
Accountants
In the order of the number of restrictions before the Directive
BG
1 − unchanged 2 − partially reduced 3 − abolished
0 2 4 6 8The number of barriers
Legal servicesReal estate agents
Tourist guideArchitects
Travel agencyEngineers
Construction / Building companySmall Retail shop
Large Retail (grande surface)AccountantsTax advisersRestaurants
HotelsCrafts businesses in construction sector
In the order of the number of restrictions before the Directive
CY
1 − unchanged 2 − partially reduced 3 − abolished
0 1 2 3 4 5The number of barriers
ArchitectsTravel agencyLegal services
Large Retail (grande surface)Tourist guideTax advisers
Small Retail shopEngineers
RestaurantsReal estate agents
HotelsCrafts businesses in construction sector
Construction / Building company
In the order of the number of restrictions before the Directive
CZ
1 − unchanged 2 − partially reduced 3 − abolished
73
0 2 4 6 8 10The number of barriers
Certification service in the area of constructionTax advisers
ArchitectsLegal services
EngineersAccountants
Real estate agentsSmall Retail shop
Large Retail (grande surface)Crafts businesses in construction sector
Construction / Building companyTravel agencyTourist guideRestaurants
In the order of the number of restrictions before the Directive
DE
1 − unchanged 2 − partially reduced 3 − abolished
0 1 2 3 4 5The number of barriers
Real estate agents
Legal services
Large Retail (grande surface)
Crafts businesses in construction sector
Accountants
Small Retail shop
Certification service in the area of construction
Travel agency
Construction / Building company
In the order of the number of restrictions before the Directive
DK
1 − unchanged 2 − partially reduced 3 − abolished
74
0 1 2 3 4 5The number of barriers
Legal servicesSmall Retail shop
Large Retail (grande surface)Certification service in the area of construction
Crafts businesses in construction sectorConstruction / Building company
Travel agencyTourist guideRestaurants
HotelsAccountants
In the order of the number of restrictions before the Directive
Note:There have been no abolished restrictions in EE.
EE
1 − unchanged 2 − partially reduced 3 − abolished
0 2 4 6 8 10The number of barriers
Travel agencySmall Retail shop
Large Retail (grande surface)Construction / Building company
Tourist guideLegal services
Crafts businesses in construction sectorRestaurants
Real estate agentsHotels
EngineersArchitects
Accountants
In the order of the number of restrictions before the Directive
ES
1 − unchanged 2 − partially reduced 3 − abolished
75
0 1 2 3 4The number of barriers
Small Retail shop
Large Retail (grande surface)
Travel agency
Tourist guide
Real estate agents
Legal services
Crafts businesses in construction sector
Construction / Building company
Accountants
In the order of the number of restrictions before the Directive
Note:There have been no abolished restrictions in FI.
FI
1 − unchanged 2 − partially reduced 3 − abolished
0 2 4 6The number of barriers
Legal servicesTax advisers
Large Retail (grande surface)Architects
AccountantsTravel agency
Real estate agentsSmall Retail shop
Crafts businesses in construction sectorCertification service in the area of construction
Construction / Building companyTourist guideRestaurants
Hotels
In the order of the number of restrictions before the Directive
FR
1 − unchanged 2 − partially reduced 3 − abolished
76
0 2 4 6 8 10The number of barriers
Small Retail shopLegal servicesTravel agency
Large Retail (grande surface)Tourist guideAccountants
HotelsEngineersArchitects
Tax advisersCrafts businesses in construction sector
Construction / Building companyRestaurants
Real estate agents
In the order of the number of restrictions before the Directive
GR
1 − unchanged 2 − partially reduced 3 − abolished
0 2 4 6 8The number of barriers
Legal servicesSmall Retail shop
Large Retail (grande surface)Tax advisers
Travel agencyTourist guideRestaurants
Real estate agentsEngineers
Construction / Building companyCertification service in the area of construction
ArchitectsAccountants
HotelsCrafts businesses in construction sector
In the order of the number of restrictions before the Directive
HU
1 − unchanged 2 − partially reduced 3 − abolished
0 1 2 3 4 5The number of barriers
Legal services
Travel agency
Tourist guide
Small Retail shop
Large Retail (grande surface)
Restaurants
Architects
In the order of the number of restrictions before the Directive
Note:There have been no abolished restrictions in IE.
IE
1 − unchanged 2 − partially reduced 3 − abolished
77
0 2 4 6 8The number of barriers
Small Retail shopLegal services
Tax advisersLarge Retail (grande surface)
EngineersArchitects
AccountantsTravel agencyTourist guideRestaurants
Real estate agentsCrafts businesses in construction sector
HotelsConstruction / Building company
In the order of the number of restrictions before the Directive
IT
1 − unchanged 2 − partially reduced 3 − abolished
0 2 4 6The number of barriers
Small Retail shopLegal servicesTravel agencyTourist guide
Large Retail (grande surface)Construction / Building company
EngineersCrafts businesses in construction sector
Certification service in the area of constructionArchitects
Tax advisers
In the order of the number of restrictions before the Directive
LT
1 − unchanged 2 − partially reduced 3 − abolished
0 2 4 6 8The number of barriers
Certification service in the area of constructionCrafts businesses in construction sector
Construction / Building companyLegal services
Large Retail (grande surface)Architects
Tax advisersSmall Retail shop
Travel agencyRestaurants
Real estate agentsEngineers
AccountantsHotels
In the order of the number of restrictions before the Directive
LU
1 − unchanged 2 − partially reduced 3 − abolished
78
0 1 2 3 4The number of barriers
Legal servicesTourist guide
Travel agencySmall Retail shop
Large Retail (grande surface)Engineers
Crafts businesses in construction sectorConstruction / Building company
Certification service in the area of constructionArchitects
Tax advisersReal estate agents
Accountants
In the order of the number of restrictions before the Directive
LV
1 − unchanged 2 − partially reduced 3 − abolished
0 1 2 3 4The number of barriers
Small Retail shopLegal services
EngineersArchitects
Large Retail (grande surface)Crafts businesses in construction sector
AccountantsTravel agency
RestaurantsHotels
Construction / Building company
In the order of the number of restrictions before the Directive
Note:There have been no abolished restrictions in MT.
MT
1 − unchanged 2 − partially reduced 3 − abolished
79
0 1 2 3 4 5The number of barriers
Certification service in the area of constructionSmall Retail shop
Large Retail (grande surface)Legal services
Crafts businesses in construction sectorAccountants
Travel agencyTourist guideTax advisersRestaurants
Real estate agentsHotels
EngineersConstruction / Building company
Architects
In the order of the number of restrictions before the Directive
NL
1 − unchanged 2 − partially reduced 3 − abolished
0 2 4 6The number of barriers
Tax advisersLegal servicesTravel agency
Real estate agentsEngineers
Certification service in the area of constructionArchitects
AccountantsTourist guide
Small Retail shopLarge Retail (grande surface)
Crafts businesses in construction sectorRestaurants
Hotels
In the order of the number of restrictions before the Directive
PL
1 − unchanged 2 − partially reduced 3 − abolished
0 2 4 6 8The number of barriers
Travel agencyCrafts businesses in construction sector
Construction / Building companyReal estate agentsSmall Retail shop
Legal servicesAccountantsTourist guideRestaurants
Large Retail (grande surface)Hotels
EngineersArchitects
In the order of the number of restrictions before the Directive
PT
1 − unchanged 2 − partially reduced 3 − abolished
80
0 2 4 6The number of barriers
Legal servicesArchitects
Tax advisersLarge Retail (grande surface)
AccountantsTravel agencyTourist guide
Crafts businesses in construction sectorCertification service in the area of construction
Small Retail shopEngineers
Construction / Building company
In the order of the number of restrictions before the Directive
Note:There have been no abolished restrictions in RO.
RO
1 − unchanged 2 − partially reduced 3 − abolished
0 2 4 6 8The number of barriers
Legal servicesAccountants
Travel agencyReal estate agentsSmall Retail shop
Tourist guideTax advisers
Certification service in the area of constructionEngineersArchitects
Large Retail (grande surface)Crafts businesses in construction sector
Construction / Building companyRestaurants
Hotels
In the order of the number of restrictions before the Directive
SE
1 − unchanged 2 − partially reduced 3 − abolished
81
0 1 2 3 4 5The number of barriers
Real estate agentsLegal services
Crafts businesses in construction sectorConstruction / Building company
Travel agencyTourist guide
Large Retail (grande surface)Architects
Tax advisersSmall Retail shop
EngineersCertification service in the area of construction
Accountants
In the order of the number of restrictions before the Directive
Note:There have been no abolished restrictions in SI.
SI
1 − unchanged 2 − partially reduced 3 − abolished
0 1 2 3 4The number of barriers
Tax advisersLarge Retail (grande surface)
Small Retail shopConstruction / Building company
ArchitectsTravel agencyTourist guide
Real estate agentsLegal services
EngineersCrafts businesses in construction sector
Certification service in the area of constructionAccountantsRestaurants
Hotels
In the order of the number of restrictions before the Directive
SK
1 − unchanged 2 − partially reduced 3 − abolished
0 1 2 3The number of barriers
Small Retail shop
Legal services
Large Retail (grande surface)
Construction / Building company
Certification service in the area of construction
Architects
Accountants
In the order of the number of restrictions before the Directive
Note:There have been no abolished restrictions in UK.
UK
1 − unchanged 2 − partially reduced 3 − abolished
Annex IV: Country-specific results: GDP impact of setting-up PSC before the DSGE (Part 2)
The table below reports the country-specific results before the DSGE, in € or in % of the average national GDP over 2003-2011.