102
August 2021 The economic impact of the University of Oxford Final Report for the University of Oxford

March 2021
August 2021
The economic impact of the University of Oxford Final Report for the University of Oxford

Wherever possible London Economics uses paper sourced from sustainably managed forests using production processes that meet the EU Ecolabel requirements.
Copyright © 2021 London Economics. Except for the quotation of short passages for the purposes of criticism or review, no part of this document may be reproduced without permission.
London Economics Ltd is a Limited Company registered in England and Wales with registered number 04083204 and registered offices at Somerset House, New Wing, Strand, London WC2R 1LA. London Economics Ltd's registration number for Value Added Tax in the United Kingdom is GB769529863.
About London Economics
London Economics is one of Europe's leading specialist economics and policy consultancies. Based in London and with offices and associate offices in five other European capitals, we advise an international client base throughout Europe and beyond on economic and financial analysis, litigation support, policy development and evaluation, business strategy, and regulatory and competition policy.
Our consultants are highly-qualified economists who apply a wide range of analytical tools to tackle complex problems across the business and policy spheres. Our approach combines the use of economic theory and sophisticated quantitative methods, including the latest insights from behavioural economics, with practical know-how ranging from commonly used market research tools to advanced experimental methods at the frontier of applied social science.
We are committed to providing customer service to world-class standards and take pride in our clients’ success. For more information, please visit www.londoneconomics.co.uk.
Head Office: Somerset House, New Wing, Strand, London, WC2R 1LA, United Kingdom.
w: londoneconomics.co.uk e: [email protected] : @LE_Education t: +44 (0)20 3701 7700 f: +44 (0)20 3701 7701 @LondonEconomics
Acknowledgements We would like to acknowledge the useful data, guidance and feedback provided by the University of Oxford throughout the research, with particular thanks to Dr Helen Carstairs (Senior Knowledge Exchange Officer, Knowledge Exchange and Impact Team); Patrick Grant FREng (Pro-Vice Chancellor (Research)); Dr Phil Clare (Deputy Director, Research Services (Knowledge Exchange and Engagement)); Dr Adam Stoten RTTP (Chief Operating Office, Oxford University Innovation); Simon Gray (Head of Marketing, Oxford University Innovation); Lucy Shaw (Head of Programmes and Partnerships, Gardens, Libraries and Museums); Martin Edmunds (Strategic Research Manager, Mathematical, Physical & Life Sciences Division); and Elizabeth McCarthy (Head of Campaigns and Digital Communications, Public Affairs Directorate). Despite the assistance, responsibility for the contents of this report remains with London Economics.
Authors Dr Gavan Conlon, Partner, +44 (0) 20 3701 7703; [email protected]
Ms Maike Halterbeck, Divisional Director, +44 (0) 20 3701 7724; [email protected]
Mr Rhys Williams, Economic Consultant, +44 (0) 20 3701 7712; [email protected]
Ms Lucy Manly, Economic Analyst, +44 (0) 20 3701 7729; [email protected]
Cover picture credit: The University of Oxford; Source of icons: Palsur / Shutterstock.com; Microsoft PowerPoint

Table of Contents Page
London Economics The economic impact of the University of Oxford i
Executive Summary iii The aggregate economic impact of the University of Oxford iii The impact of the University of Oxford’s research and knowledge exchange activities iv The impact of the University’s teaching and learning activities v The impact of the University’s educational exports vi The impact of the University’s expenditure vii The impact of the University of Oxford’s contribution to tourism viii
1 Introduction and overview 10
2 The impact of the University of Oxford’s research and knowledge exchange activities 12 2.1 Impact of the University’s research 13 2.2 Impact of the University’s knowledge exchange activities 16 2.3 Total impact of the University of Oxford’s research and knowledge exchange
activities 25 2.4 Change in impacts over time 26
3 The impact of the University of Oxford’s teaching and learning activities 30 3.1 The 2018-19 cohort of UK domiciled students studying at the University of Oxford 30 3.2 Adjusting for completion rates 33 3.3 Defining the returns to higher education qualifications 34 3.4 Estimating the returns to higher education qualifications 35 3.5 Estimated net graduate premium and public purse benefit 39 3.6 Total impact of the University’s teaching and learning activities 40
4 The impact of the University of Oxford’s educational exports 43 4.1 The 2018-19 cohort of non-UK domiciled students studying at the University of
Oxford 44 4.2 Direct economic impact 45 4.3 Total economic impact associated with the University of Oxford’s educational
exports 49
5 The impact of the University of Oxford’s expenditures 54 5.1 Direct impact of the University’s and its colleges’ expenditures 55 5.2 Indirect and induced impacts of the University’s and its colleges’ expenditures 59 5.3 Adjustments for double-counting and transfers 59 5.4 Aggregate impact of the University of Oxford’s and its colleges’ spending 60
6 The University of Oxford’s contribution to tourism 63 6.1 Estimating the number of visitors associated with the University’s activities 63 6.2 Direct impact associated with visitor expenditure 67 6.3 Indirect and induced impacts associated with visitor expenditure 67 6.4 Total impact associated with visitor expenditure 68

Table of Contents Page
ii London Economics
The economic impact of the University of Oxford
7 Total economic impact of the University of Oxford 70
Index of Tables, Figures, and Boxes 71
ANNEXES 75
Annex 1 References 76
Annex 2 Technical Annex 79 A2.1 Impact of the University’s knowledge exchange activities 79 A2.2 Impact of the University’s teaching and learning activities 80 A2.3 Impact on educational exports 95
Annex 3 Total impact by region and sector (where available) 98

London Economics The economic impact of the University of Oxford iii
Executive Summary
Executive Summary
London Economics were commissioned to analyse the economic impact of the University of Oxford on the UK economy, focusing on the 2018-19 academic year. Specifically, the analysis captures the economic impact generated by the University’s teaching and learning activity associated with the 2018-19 cohort of UK domiciled University of Oxford students; the impact of the University’s extensive research and knowledge exchange activities; the impact of educational exports generated by the international students in the 2018-19 cohort of University of Oxford students; the impact associated with the University’s and its colleges’ operating and capital expenditures; and the impact generated by the University’s contribution to tourism.
The aggregate economic impact of the University of Oxford
The total economic impact on the UK economy associated with the University of Oxford’s activities in 2018-19 was estimated at approximately £15.7 billion (see Table 1)1. In terms of the components of this impact, the value of the University’s research and knowledge exchange activities stood at £7.9 billion (50% of total), while the impact generated by the spending of the University and its colleges stood at £6.0 billion (38%). The impact of the University’s educational exports was estimated at £732 million (5%), while the University’s teaching and learning activities accounted for £422 million (3%). The remaining 4% of economic impact (£611 million) was associated with the University’s contribution to tourism.
Total economic impact of the University of Oxford’s activities in the UK in 2018-19 (£m and % of total)
Type of impact £m %
Impact of research and knowledge exchange £7,909m 50% Research activities £4,496m 29% Knowledge exchange activities £3,413m 22%
Impact of teaching and learning £422m 3% Students £213m 1% Exchequer £209m 1%
Impact of exports £732m 5% Tuition fee income £393m 3% Non-tuition fee income £340m 2%
Impact of the University's spending £6,032m 38% University expenditure £4,472m 28% College expenditure £1,561m 10%
Impact of tourism £611m 4% Direct impact £221m 1% Indirect and induced impact £390m 2%
Total economic impact £15,706m 100% Note: All estimates are presented in 2018-19 prices, and rounded to the nearest £1m. Totals may not add up precisely due to rounding. Source: London Economics' analysis
1 All estimates here are presented in terms of economic output (equivalent to income/turnover). The impact of the University’s knowledge exchange activities, educational exports, the University’s and its colleges’ expenditures, and the University’s contribution to tourism can also be converted into gross value added (GVA) and full-time (FTE) employment, and these additional findings are provided within the relevant sections throughout this report.
The total economic impact associated with
the University of Oxford’s activities in 2018-19
stood at £15.7 billion.

iv London Economics
The economic impact of the University of Oxford
Executive Summary
Compared to the University’s total operational costs of approximately £2.6 billion in 2018-192, the total economic contribution of the University of Oxford’s activities to the UK was estimated at £15.7 billon, which corresponds to a benefit to cost ratio of 6.1:1.
The impact of the University of Oxford’s research and knowledge exchange activities
The first element of the analysis involved estimating the impact of the University of Oxford’s research activities. To estimate the direct economic impact associated with the University’s research, we used information on the total research-related income accrued by the University in 2018-19 (including income from research grants and contracts, as well as quality related recurrent research grant funding provided by Research England). The total research-related income accrued by the University in 2018-19 stood at £771 million, which was the largest amount of research income received by any UK university in that year. To arrive at the net impact of the University’s research activities, we deducted the public costs of funding the University’s research (including funding from the UK Research Councils, Research England recurrent research grants, and from UK central government bodies, Local Authorities, and health and hospital authorities). Together, these public costs amounted to £386 million in 2018-19, resulting in a net direct research impact of £385 million.
Existing academic literature3 suggests that there is strong evidence of the existence of productivity spillovers from public investment in university research. Applying estimates from the literature, our analysis implies a spillover multiplier of approximately 5.3 associated with the University of Oxford’s research income in 2018-19. In other words, every £1 million invested in research at the University results in an additional economic output of £5.3 million across the UK economy. Combining the net direct impact of the University’s research activities (£385 million) with the resulting productivity spillovers accrued by other organisations across the UK (£4,111 million), the total impact of research conducted by the University in 2018-19 was estimated at £4,496 million.
In addition to the University’s research, the analysis estimated the impact associated with the University’s knowledge exchange activities (including the University’s licensing of its intellectual property (IP) to other organisations, the activities of the University’s spinout companies, and the activities of companies located at the Begbroke and Oxford Science Parks). The analysis considers the direct, indirect, and induced economic impacts associated with each of these activities. The direct impact of these activities was based on the IP income received by the University of Oxford in 2018-19 and the turnover (where available) of the University’s 168 active spinout companies4 and 32 active companies resident at the University’s Begbroke and Oxford Science Parks in 2018-195. The total direct, indirect, and induced impacts of these knowledge exchange activities were then estimated using relevant economic multipliers derived from a (multi-regional) Input-Output model.
Using this approach, the analysis estimates that the University’s knowledge exchange activities generated a total of £3,413 million of economic impact across the UK economy in 2018-19, of which £216 million was associated with the University’s IP licensing activities, £2,701 million was
2 This relates to the total operating expenditure of the University of Oxford in 2018-19, excluding any University capital expenditure as well as any operating or capital expenditures of the University’s colleges, but including any depreciation costs or movements in pension provisions. 3 See Haskel and Wallis (2010), and Haskel et al. (2014). 4 The analysis includes spinoffs with some University of Oxford ownership, but excludes a total of 116 startups and social enterprises that were based on the University's IP and were active in 2018-19. 5 This analysis excludes 27 University spinout companies that were located at the Science Parks in 2018-19 (to avoid double-counting with the analysis of the economic impact associated with the University’s spinouts).
London Economics The economic impact of the University of Oxford v
Executive Summary
generated through the activities of the University’s spinouts, and the remaining £496 million was associated with companies located at the University’s Science Parks.
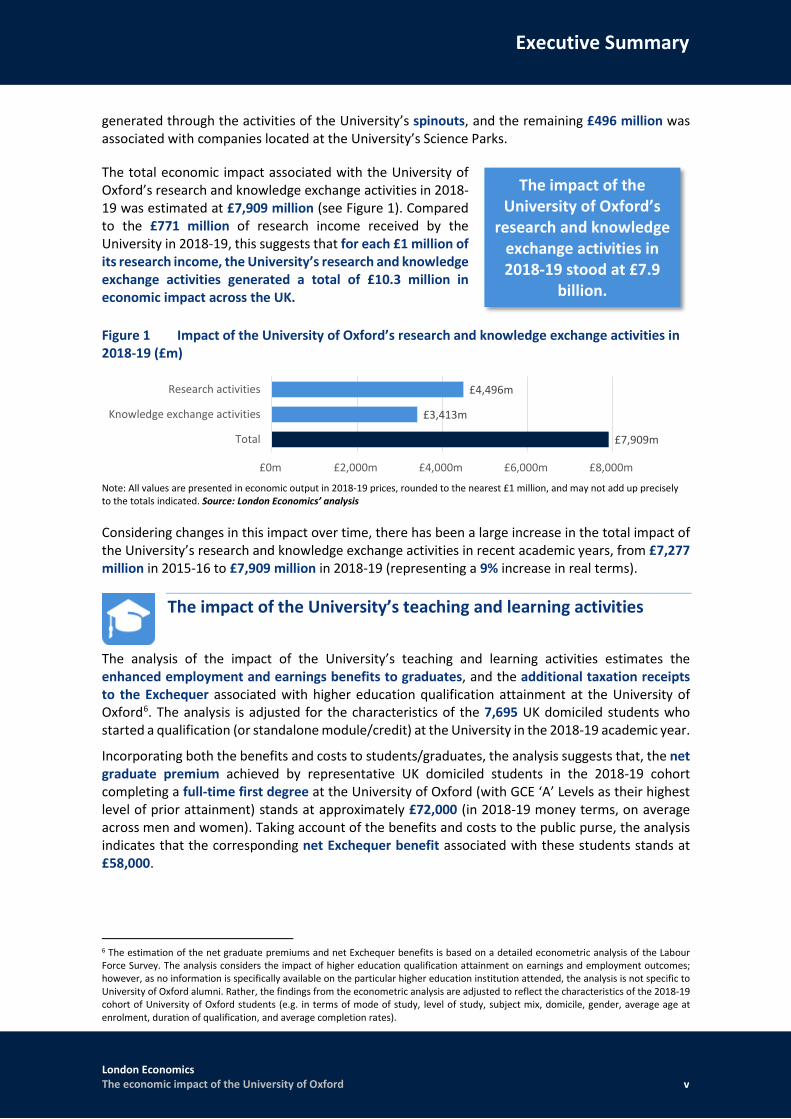
The total economic impact associated with the University of Oxford’s research and knowledge exchange activities in 2018-19 was estimated at £7,909 million (see Figure 1). Compared to the £771 million of research income received by the University in 2018-19, this suggests that for each £1 million of its research income, the University’s research and knowledge exchange activities generated a total of £10.3 million in economic impact across the UK.
Figure 1 Impact of the University of Oxford’s research and knowledge exchange activities in 2018-19 (£m)
Note: All values are presented in economic output in 2018-19 prices, rounded to the nearest £1 million, and may not add up precisely to the totals indicated. Source: London Economics’ analysis
Considering changes in this impact over time, there has been a large increase in the total impact of the University’s research and knowledge exchange activities in recent academic years, from £7,277 million in 2015-16 to £7,909 million in 2018-19 (representing a 9% increase in real terms).
The impact of the University’s teaching and learning activities
The analysis of the impact of the University’s teaching and learning activities estimates the enhanced employment and earnings benefits to graduates, and the additional taxation receipts to the Exchequer associated with higher education qualification attainment at the University of Oxford6. The analysis is adjusted for the characteristics of the 7,695 UK domiciled students who started a qualification (or standalone module/credit) at the University in the 2018-19 academic year.
Incorporating both the benefits and costs to students/graduates, the analysis suggests that, the net graduate premium achieved by representative UK domiciled students in the 2018-19 cohort completing a full-time first degree at the University of Oxford (with GCE ‘A’ Levels as their highest level of prior attainment) stands at approximately £72,000 (in 2018-19 money terms, on average across men and women). Taking account of the benefits and costs to the public purse, the analysis indicates that the corresponding net Exchequer benefit associated with these students stands at £58,000.
6 The estimation of the net graduate premiums and net Exchequer benefits is based on a detailed econometric analysis of the Labour Force Survey. The analysis considers the impact of higher education qualification attainment on earnings and employment outcomes; however, as no information is specifically available on the particular higher education institution attended, the analysis is not specific to University of Oxford alumni. Rather, the findings from the econometric analysis are adjusted to reflect the characteristics of the 2018-19 cohort of University of Oxford students (e.g. in terms of mode of study, level of study, subject mix, domicile, gender, average age at enrolment, duration of qualification, and average completion rates).
£4,496m
£3,413m
£7,909m
£0m £2,000m £4,000m £6,000m £8,000m
Research activities
Knowledge exchange activities
Total
The impact of the University of Oxford’s
research and knowledge exchange activities in 2018-19 stood at £7.9
billion.

vi London Economics
The economic impact of the University of Oxford
Executive Summary
The net graduate premiums and net Exchequer benefits (by gender, study mode, study level, domicile, and prior attainment, and adjusted for the subject mix of the cohort) were combined with information on the number of students starting qualifications at the University in 2018-19 and expected completion rates. The aggregate economic impact generated by the University of Oxford’s teaching and learning activities associated with the 2018-19 cohort stood at approximately £422 million (see Table 2). This is split
approximately equally between students and the Exchequer, with £213 million (51%) of the economic benefit accrued by students undertaking qualifications at the University of Oxford, and the remaining £209 million (49%) accrued by the Exchequer.
Impact of the University of Oxford’s teaching and learning activities associated with the 2018-19 cohort (£m), by type of impact, domicile, and level of study
Beneficiary and study level
Domicile
England Wales Scotland Northern Ireland Total
Students £201m £6m £4m £2m £213m Undergraduate £178m £5m £3m £1m £188m Postgraduate £23m £0m £1m £1m £25m Exchequer £196m £4m £6m £2m £209m Undergraduate £123m £3m £3m £1m £131m Postgraduate £73m £1m £3m £1m £78m Total £397m £10m £10m £4m £422m Undergraduate £301m £8m £7m £3m £319m Postgraduate £96m £2m £4m £2m £103m
Note: All estimates are presented in 2018-19 prices, discounted to reflect net present values, rounded to the nearest £1m, and may not add up precisely to the totals indicated. Source: London Economics’ analysis
The impact of the University’s educational exports
With the University of Oxford attracting many international students, the University’s higher education offer represents a tradeable activity with imports and exports like any other tradeable sector. The economic impact of the University of Oxford’s contribution to educational exports is based on the direct injection of tuition fee and non-tuition fee income from the University’s international students. As with the University’s knowledge exchange activities, this income generates indirect and induced impacts throughout the UK economy, through supply chain and wage income effects. The analysis focuses on the cohort of 4,345 non-UK domiciled students who started qualifications (or modules/credits) at the University of Oxford in the 2018-19 academic year. Of these students, 1,145 (26%) were EU domiciled, and 3,200 (74%) were from non-EU countries.
Combining the estimates of tuition fee income (net of any Exchequer cost/University cost of funding international students) and non-tuition fee income associated with international students in the 2018-19 cohort, the total export income (i.e. direct impact) generated by this cohort stood at £248
The total economic impact of teaching and learning
generated by the 2018-19 cohort of University of
Oxford students stands at £422 million.

London Economics The economic impact of the University of Oxford vii
Executive Summary
million7. Approximately half of this income (£125 million) was generated from international students’ non-tuition fee spending, while the other half (£123 million) was generated from international students’ (net) tuition fees accrued by the University of Oxford.
The total (direct, indirect, and induced) economic impact associated with this export income was again estimated using relevant economic multipliers, estimating the extent to which the direct export income generates additional activity throughout the UK economy. We thus estimate that the total economic impact on the UK generated by the (net) tuition fee income and non-tuition fee income associated with international students in the 2018-19 University of Oxford cohort amounts to £732 million. Of this total, £393 million was associated with international students’ (net) tuition fees, and £340 million was associated with these students’ non-tuition fee expenditures over the duration of their studies at the University of Oxford.
Figure 2 Impact of the University’s educational exports associated with international students in the 2018-19 cohort (£m), by domicile and type of income
Note: All estimates are presented in 2018-19 prices, discounted to reflect net present values, rounded to the nearest £1m, and may not add up precisely to the totals indicated. Source: London Economics’ analysis
The impact of the University’s expenditure
The University of Oxford’s physical footprint supports jobs and promotes economic growth throughout the UK economy. This is captured by the direct, indirect, and induced impact associated with the expenditures of the University itself, as well as the expenditures incurred by the University’s 39 colleges and 6 permanent Private Halls.8
The direct impact of the University’s physical footprint was based on the operating and capital expenditures of the University and its colleges. In 2018-19, the University of Oxford incurred a total of £2,178 million of expenditure (including £2,094 million of operating expenses9 and £84 million
7 As we focus specifically on the contribution of the University of Oxford to the UK economy, this estimate does not include the economic benefits associated with learning and qualification attainment that might be accrued by international students in their own countries. 8 The accounts of 3 of the University’s colleges (Kellogg College, St Cross College, and Parks College) as well as the 6 permanent Private Halls are consolidated into the University’s finances as reported in the 2018/19 Annual Report and Accounts (i.e. are included in the overall level of expenditure of the University, as they are considered departments of the University). In contrast, the University's financial statements exclude the accounts of 36 colleges that are separate and independent legal entities. 9 The total operating expenditure of the University of Oxford in 2018-19 stood at £2,582 million. From this total, we excluded £145 million in depreciation costs and £286 million in movements in pension provisions, as it is assumed that these are not relevant from a
£51m
£94m
£145m
£342m
£246m
£588m
£393m
£340m
£732m
£0m £200m £400m £600m £800m
Fee income
Non-fee income
Total
Economic output, £m
EU Non-EU
The impact of the export income generated by the
2018-19 University of Oxford cohort stood at
£732 million.

viii London Economics
The economic impact of the University of Oxford
Executive Summary
of capital expenditure). The corresponding spending of the University’s colleges stood at £567 million (comprised of £455 million of operating expenses10 and £121 million of capital spending). Hence, the total direct impact of the expenditures of the University and its colleges was estimated at £2,754 million.
Again, the direct increase in economic activity resulting from the expenditures of the University and its colleges generates additional rounds of spending throughout the economy (through the University’s and colleges’ supply chains, and the spending of staff). Applying the relevant economic multipliers, the total direct, indirect, and induced impact associated with the expenditures of the University of Oxford and its colleges in 2018-19 was
estimated at £6,032 million (see Figure 3). £4,472 million of this total was associated with the spending of the University of Oxford itself, and £1,561 million was generated as a result of the expenditures of the University’s colleges.
Figure 3 Impact associated with the University’s and its colleges’ expenditure in 2018-19 (£m)
Note: All estimates are presented in 2018-19 prices, rounded to the nearest £1m, and may not add up precisely to the totals indicated. Source: London Economics’ analysis
The impact of the University of Oxford’s contribution to tourism
As a final strand of impact, the University attracts a range of visitors to Oxford, including tourists visiting the University’s unique cultural and heritage sites, business visitors, friends and family visiting the University’s staff and students, or participants in study trips to the University.
To understand the economic impact associated with the University’s contribution to tourism through the attraction of these visitors, we estimate the number of visitors to Oxford in 2018-19 that were associated with the University’s presence. The analysis focuses only on visits to Oxford that involved overnight stays by visitors from overseas, as it is assumed that any domestic (day or overnight) visits to Oxford would have displaced activity from other regions of the UK (and should not be considered ‘additional’ to the UK economy). Out of a total of 577,000 overnight visits from overseas visitors to Oxford in 2018-19, we estimate that 407,000 resulted from the University’s
procurement perspective (i.e. these costs are not accounted for as income by other organisations). In addition, to avoid double-counting, we excluded £57 million in payments to the University’s colleges, as this would be accrued as income (and subsequently spent on goods and services) by the colleges. 10 From the total operational expenditures of the University’s colleges (£512 million), we excluded £35 million in depreciation costs and £21 million in movements in pension provisions.
£4,472m
£1,561m
£6,032m
£0m £1,000m £2,000m £3,000m £4,000m £5,000m £6,000m £7,000m
University
Colleges
Total
Economic output, £m
The impact of the University’s and its colleges’
expenditure on the UK economy in 2018-19 stood
at £6.0 billion.

London Economics The economic impact of the University of Oxford ix
Executive Summary
activities. Combined with information on the average trip expenditure per visitor, the direct impact of the University’s contribution to tourism in 2018-19 was estimated at £221 million.
As with the University’s knowledge exchange activities, educational exports, and the spending of the University and its colleges, this visitor expenditure results in subsequent rounds of expenditure throughout the UK economy. Again, this is measured by the indirect, and induced impacts associated with these expenditures, estimated by applying relevant economic multipliers. Using this approach, the analysis indicates that the total direct, indirect, and induced impact of the visitor expenditure generated by the University of Oxford in 2018-19 stood at approximately £611 million (see Table 3).
Impact associated with the University’s contribution to tourism in 2018-19 (£m)
Type of impact £m Direct impact £221m Indirect and induced impacts £390m Total impact £611m
Note: All estimates are presented in 2018-19 prices, rounded to the nearest £1m, and may not add up precisely to the totals indicated. Source: London Economics’ analysis
The impact of the University’s
contribution to tourism in 2018-19
stood at £611 million.

10 London Economics
The economic impact of the University of Oxford
1 | Introduction and overview
1 Introduction and overview
The University of Oxford has been at the forefront of research and teaching activity for more than 900 years. Permanently at the boundary of academic endeavour, the activities of its students, staff, and alumni have had a transformative impact on every aspect of peoples’ lives, both in the UK and across the globe. Research and teaching activity – through the deepening and broadening of the UK’s human capital and knowledge base – is one of the key determinants of the country’s long-run economic growth, and the economic and societal benefits are accrued in every region and throughout wider society.
London Economics were commissioned to assess the economic impact of the University of Oxford in the United Kingdom, focusing on the 2018-19 academic year. The University contributes to the UK’s national prosperity through a range of activities and channels, and the analysis is split into:
The impact of the University’s research and knowledge exchange activities11; The economic contribution of the University’s provision of teaching and learning; The impact of the University’s contribution to educational exports; The impact of the operating and capital expenditures of the University and its colleges; and The impact of the University’s contribution to tourism.
Reflecting these channels of impact, the remainder of this report is structured as follows.
In Section 2, we outline our estimates of the impact of the University’s research and knowledge exchange activities. To estimate the impact of the world-leading research undertaken at the University of Oxford, we combine information on the research-related income accrued by the University in 2018-19 with estimates from the wider economic literature on the extent to which public investment in research activity results in additional private sector productivity (i.e. positive 'productivity spillovers'). In addition, in terms of knowledge exchange activities, the analysis estimates the direct, indirect, and induced economic impacts associated with the licensing of the University’s intellectual property to other organisations, the activities of the University’s existing spinout companies, and the activities of companies located at the Begbroke and Oxford Science Parks not already included in the prior analysis of spinouts.
In Section 3, we assess the improved labour market earnings and employment outcomes associated with higher education attainment at the University of Oxford. Through an assessment of the lifetime benefits and costs associated with educational attainment, we estimate the net economic benefits of the University’s teaching and learning activity to the University’s students and the public purse (through enhanced taxation receipts), focusing on the cohort of 7,695 UK domiciled students who started higher education qualifications at the University in 2018-19.
In addition to these UK domiciled students, there were a further 4,345 international students in the 2018-19 cohort of University of Oxford students, contributing to the value of UK educational exports through their tuition fees as well as their non-fee (i.e. living cost) expenditures during their studies. Section 4 assesses the direct, indirect, and induced economic impacts generated by this fee and non-fee income associated with the University’s 2018-19 cohort of international students.
Given that the University is a major employer and supports its core activities through significant expenditures, the University of Oxford’s substantial physical footprint also supports jobs and promotes economic growth throughout the UK economy. Section 5 presents our estimates of the direct, indirect,
11 In addition to the 2018-19 academic year, to assess changes over time, these impacts were also estimated for the 2015-16, 2016-17, and 2017-18 academic years. For more information, see Section 2.4.

London Economics The economic impact of the University of Oxford 11
1 | Introduction and overview
and induced economic impacts associated with the operating and capital expenditures incurred by the University and its colleges in 2018-19.
In addition to domestic and international students and staff, the University attracts a range of visitors to Oxford, including tourists visiting the University’s unique cultural and heritage sites, business visitors, friends and family visiting the University’s staff and students, or participants in study trips to the University. In Section 6, we estimate the number of (overseas overnight12) visitors to Oxford in 2018-19 that resulted from the University of Oxford’s activities, and assess the direct, indirect, and induced economic impacts generated by the associated tourism expenditure.
Finally, Section 7 of this report summarises our main findings.
12 The analysis of the University’s contribution to tourism only focuses on visits to Oxford that involved overnight stays by visitors from overseas, as it is assumed that any domestic (day or overnight) visits to Oxford would have displaced activity from other regions of the UK (and should not be considered ‘additional’ to the UK economy).

12 London Economics
The economic impact of the University of Oxford
2 | The impact of the University of Oxford’s research and knowledge exchange activities
2 The impact of the University of Oxford’s research and knowledge exchange activities
Box 1 Key findings: Research and knowledge exchange
The total research-related income accrued by the University stood at £771 million, which was the largest amount of research income received by any UK university in 2018-19. After deducting the public costs of funding the University’s research activities (£386 million), the estimate of net direct research impact was estimated to be £385 million.
There is extensive evidence from the wider academic literature of the existence of productivity spillovers from public investment in university research. Our analysis estimates a spillover multiplier of approximately 5.3 associated with the University of Oxford’s research income in 2018-19. In other words, every £1 million invested in research at the University results in an additional economic output of £5.3 million across the UK economy. Using the total research-related income accrued by the University and the research spillover estimate, the productivity spillovers accrued by other organisations across the UK was estimated to be £4,111 million.
Combining the net direct impact of the University’s research activities (£385 million) with the resulting productivity spillovers (£4,111 million), the total impact of research conducted by the University in 2018-19 was estimated at £4,496 million.
In addition to the University’s research, the analysis estimated the impact associated with the University’s knowledge exchange activities (including the University’s licensing of its intellectual property (IP) to other organisations, the activities of the University’s 168 active spinout companies, and of the activities of the 32 companies located at the Begbroke and Oxford Science Parks not already included in the analysis of spinouts). The total direct, indirect, and induced impacts of these knowledge exchange activities were then estimated using relevant economic multipliers derived from a (multi-regional) Input-Output model.
The analysis estimates that the University’s knowledge exchange activities generated a total of £3,413 million of economic impact across the UK economy in 2018-19, of which £216 million was associated with the University’s IP licensing activities, £2,701 million was generated through the activities of the University’s spinouts, and the remaining £496 million was associated with companies located at the University’s Science Parks.
The total economic impact associated with the University of Oxford’s research and knowledge exchange activities in 2018-19 was estimated at £7,909 million. Compared to the £771 million of research income received by the University in 2018-19, this suggests that for each £1 million of its research income, the University’s research and knowledge exchange activities generated a total of £10.3 million in economic impact across the UK.
In this section, we outline our analysis of the economic impact of the University of Oxford’s research and knowledge exchange activities. The impact of the University’s research accounts for both the direct effects as well as productivity spillover effects from these research activities to the rest of the UK economy. The analysis of the University’s knowledge exchange activities then estimates the economic impacts associated with the licensing of the University’s intellectual property (IP) to other organisations, the activities of the

London Economics The economic impact of the University of Oxford 13
2 | The impact of the University of Oxford’s research and knowledge exchange activities
University’s existing spinout companies, and the activities of companies located at the Begbroke and Oxford Science Parks13.
In terms of timeframe, in addition to the 2018-19 academic year as the core year considered, the impacts of the University’s research and knowledge exchange activities were also estimated for the three previous academic years (i.e. 2015-16, 2016-17, and 2017-18). This allows for an assessment of the changes in these impacts over time and is presented in Section 2.4.
2.1 Impact of the University’s research
2.1.1 Direct research impact
The analysis of the direct economic impact of the research activities undertaken at the University of Oxford was based on the total research-related income accrued by the University in the 2018-19 academic year, including income generated from:
Research grants and contracts from: UK sources, including the UK Research Councils; UK-based charities; government bodies,
Local Authorities, health and hospital authorities; industry and commerce; and other UK sources;
EU sources, including government bodies, charities, industry and commerce, and other sources; and
Non-EU sources, including charities, industry and commerce, and other sources; and Recurrent research funding allocated to the University by Research England14.
Aggregating across these sources, the total research-related income accrued by the University of Oxford in the 2018-19 academic year amounted to £771 million (see Figure 4). Approximately 20% of this income was received from the UK Research Councils (£162 million, 21%), UK charities (£155 million, 20%), and through recurrent research grant funding from Research England (£146 million, 19%), respectively. In addition to £27 million (4%) accrued from UK industry and £82 million (11%) from other UK sources15, the University also received substantial amounts of research income from EU (£95 million, 12%) and non-EU sources (£104 million, 14%).
To arrive at the net direct impact of the University’s research activities on the UK economy, we deducted the costs to the public purse of funding the University’s research activities from the above total research income in 2018-19. These public costs include the funding provided by the UK Research Councils (£162 million), recurrent research grants provided by Research England (£146 million), and other research income from UK central government bodies, Local Authorities, and health and hospital authorities (£78 million). Deducting these total public purse costs (£386 million) from the above total research-related income (£771 million), we thus estimated that the net direct impact associated with the University of Oxford’s research activity in the 2018-19 academic year stands at £385 million.
13 In 2018/19, Oxford Science Park was 100% owned and managed by Magdalen College Oxford, while Begbroke Science Park was owned by the University of Oxford itself. At the time of undertaking this analysis, Magdalen College was in the process of offering a 40% equity share of the Science park to prospective partners in a joint venture. 14 Prior to 2018-19, recurrent research grants were instead funded by the Higher Education Funding Council for England, before being replaced by Research England in 2018. 15 This includes £78 million in other research income from UK central government bodies, Local Authorities, and health and hospital authorities. As discussed in further detail below, to arrive at the net direct impact of the University’s research activities, this funding is deducted from the University’s total research income, as it represents a cost to the public purse.

14 London Economics
The economic impact of the University of Oxford
2 | The impact of the University of Oxford’s research and knowledge exchange activities
Research income received by the University of Oxford in 2018-19, £m by source of income
Note: All values are presented in 2018-19 prices and rounded to the nearest £1 million. Source: London Economics’ analysis based on data provided by the Higher Education Statistics Agency (HESA, 2020a)
2.1.2 Productivity spillovers
In addition to the direct impact of research, the wider academic literature indicates that investments in Research & Development (R&D) and other intangible assets may induce positive externalities. Economists refer to the term ‘externality’ to describe situations in which the activities of one ‘agent’ in the market induces (positive or negative) external effects on other agents in that market (which are not reflected in the price mechanism). In the context of the economic impact of research activities, existing academic literature assesses the existence and size of positive productivity and knowledge spillovers, where knowledge generated through the research activities of one agent enhances the productivity of other organisations.
There are many ways in which research generated at universities can induce such positive spillover effects to the private sector16. For example, spillovers are enabled through direct R&D collaborations between universities and firms (such as Knowledge Transfer Partnerships), the publication and dissemination of research findings, or through university graduates entering the labour market and passing on their knowledge to their employers.
Of particular interest in the context of research conducted by universities, a study by Haskel and Wallis (2010)17 investigates evidence of spillovers from publicly funded Research & Development activities. The authors analyse productivity spillovers to the private sector from public spending on R&D by the UK Research Councils and public spending on civil and defence-related R&D18, 19, and the relative effectiveness of these channels of public spending in terms of their impact on the ‘market sector’. They find strong evidence of the existence of market sector productivity spillovers from public R&D expenditure originating from the UK Research Councils20. Their findings imply that, while there is no spillover effect associated
16 Note that there are also clearly significant economic and social spillovers to the public sector associated with university research. However, despite their obvious importance, these have been much more difficult to estimate robustly, and are not included in this analysis. 17 Also see Imperial College London (2010) for a summary of Haskel and Wallis’s findings. 18 The authors use data on government expenditure published by the Department for Business, Innovation and Skills for the financial years between 1986-87 and 2005-06. 19 This is undertaken by regressing total factor productivity growth in the UK on various measures of public sector R&D spending. 20 Note that the authors’ regressions only test for correlation, so that their results could be subject to the problem of reverse causation (i.e. it might be the case that increased market sector productivity induced the government to raise public sector spending on R&D). To address this issue, the authors not only test for 1-year lags, but for lags of 2 and 3 years respectively, and produce similar estimates. These time lags imply that
£146m 19%
£162m 21%
£155m 20%
£27m 4%
£82m 11%
£95m 12%
£104m 13% Research England research grant
UK Research Councils
UK charities
UK Industry
Other UK research grants and contracts
EU research grants and contracts
Non-EU research grants and contracts

London Economics The economic impact of the University of Oxford 15
2 | The impact of the University of Oxford’s research and knowledge exchange activities
with publicly funded civil and defence R&D, the marginal spillover effect of public spending on research through the Research Councils stands at 12.7 (i.e. every £1 spent on research through the Research Councils results in an additional annual output of £12.70 within the UK private sector).
Another study by Haskel et al. (2014) provides additional insight into the size of potential productivity spillovers from university research. Rather than estimating effects on the UK economy as a whole, the authors analyse the size of spillover effects from public research across different UK industries21. The authors investigate the correlation between the combined research conducted by the Research Councils, the higher education sector, and central government itself (e.g. through public research laboratories)22, interacted with measures of industry research activity, and total factor productivity within the different market sectors23. Their findings imply a total rate of return on public sector research of 0.2 (i.e. every £1 spent on public R&D results in an additional annual output of £0.20 within the UK private sector).
In order to estimate the productivity spillovers associated with the University of Oxford’s research activities, we apply these productivity spillover multipliers from the existing literature to the different types of research-related income received by the University in 2018-19 (again see Figure 4). Specifically, assigning the multiplier of 12.7 to the research funding that the University received from UK Research Councils and UK charities24 in 2018-19 (amounting to £317 million), and assigning the multiplier of 0.2 to all other research funding received by the University in that academic year (amounting to £454 million)25, we estimate that the research conducted by the University of Oxford in 2018-19 resulted in total market sector productivity spillovers of £4,111 million.
In other words, we infer a weighted average spillover multiplier associated with the University of Oxford’s research activities of approximately 5.33 – i.e. every £1 invested in the University’s research activities generates an additional annual economic output of £5.33 across the UK economy.
2.1.3 Aggregate impact of the University’s research
Combining the direct economic impact of the University’s research (£385 million) with the estimated productivity spillovers associated with this research (£4,111 million), we estimate that the total economic impact associated with the University of Oxford’s research activities in 2018-19 stands at approximately £4,496 million (see Figure 5).
if there was a reverse causation issue, it would have to be the government’s anticipation of increased total factor productivity growth in 2 or 3 years which would induce the government to raise its spending on research; as this seems an unlikely relationship, Haskel and Wallis argue that their results appear robust in relation to reverse causation. 21 Haskel et al. (2014) use data on 7 industries in the United Kingdom for the years 1995 to 2007. 22 A key difference to the multiplier for Research Council spending provided by Haskel and Wallis (2010) lies in the distinction between performed and funded research, as outlined by Haskel et al. (2014). In particular, whereas Haskel and Wallis estimated the impact of research funding by the Research Councils on private sector productivity, Haskel et al. instead focus on the performance of R&D. Hence, they use measures of the research undertaken by the Research Councils and the government, rather than the research funding which they provide for external research, e.g. by higher education institutions. The distinction is less relevant in the higher education sector. To measure the research performed in higher education, the authors use Higher Education Funding Council funding where research is both funded by and performed in higher education. 23 In particular, the authors regress the three-year natural log difference of total factor productivity on the three-year and six-year lagged ratio of total research performed by the Research Councils, government, and the Higher Education Funding Councils over real gross output per industry. To arrive at the relevant multiplier, this ratio is then interacted with a measure of co-operation of private sector firms with universities and public research institutes, capturing the fraction of firms in each industry co-operating with government or universities. The lagged independent variables are adjusted to ensure that the resulting coefficients can be interpreted as annual elasticities and rates of return. 24 Where the vast majority of funding provided by UK charities relates to projects commissioned through an open competitive process. 25 In terms of the large difference in magnitude between these multipliers, explaining the size of the 12.7 multiplier in particular, Haskel and Wallis (2010) argue that they would expect the productivity spillovers from Research Council funding to be large, ‘given that the support provided by Research Councils is freely available and likely to be basic science’. To the best knowledge of the authors, there exists no further and recent empirical evidence to support this. As a result, we apply the separate multipliers to the different income strands.

16 London Economics
The economic impact of the University of Oxford
2 | The impact of the University of Oxford’s research and knowledge exchange activities
Figure 5 Total impact of the University of Oxford’s research activities in 2018-19, £m
Note: All values are presented in 2018-19 prices, rounded to the nearest £1 million, and may not add up precisely to the totals indicated. Source: London Economics’ analysis
2.2 Impact of the University’s knowledge exchange activities
In addition to its research activities, the University of Oxford generates significant economic impacts through a range of knowledge exchange activities. Here, we assess the impacts associated with the University’s licensing of its IP to other organisations; the operations of spinout companies whose activities are based on the University’s intellectual property; and the activities of companies located at the Begbroke and Oxford Science Parks26.
Specifically, the analysis captures the direct, indirect, and induced economic impacts associated with each of these knowledge exchange activities, defined as follows:
Direct effect: This measures the direct economic activity generated by each of these activities, captured by the IP licensing income received by the University, as well as the turnover of the University’s spinout companies and of companies located at the Science Parks.
Indirect effect (‘supply chain impacts’): The University, its spinout companies, and the companies located at its Science Parks spend their income on purchases of goods and services from their suppliers, which in turn spend this revenue to purchase inputs to meet the Universities’ or companies’ demands. This results in a chain reaction of subsequent rounds of spending across industries, often referred to as a ‘ripple effect’.
Induced effect (‘wage spending impacts’): The employees of the University (supported by its IP income), its spinouts, and of companies located at the Science Parks use their wages to buy consumer goods and services within the economy. This in turn generates wage income for employees within the industries producing these goods and services, again leading to subsequent rounds of spending, i.e. a ‘ripple effect’ throughout the economy as a whole.
The total of the direct, indirect, and induced effects constitutes the gross economic impact of the University’s knowledge exchange activities. An analysis of the net economic impact ideally needs to account of two additional factors potentially reducing the size of any of the above effects:
Leakage into other geographical areas, by taking account of how much of the additional economic activity actually occurs in the area of consideration; and
26 In terms of other types of knowledge exchange activities, note that the impact associated with the University of Oxford’s academic consultancy services (including personal and departmental consultancy services) is not included in this part of the analysis. The University’s income from these activities stood at approximately £8.4 million in 2018-19, and the impact associated with this income is implicitly included in the direct, indirect, and induced economic impacts generated by the University of Oxford’s expenditures in that academic year (see Section 5).
£385m
£4,111m
£4,496m
£0m £1,000m £2,000m £3,000m £4,000m £5,000m
Net direct research impact
Spillover impact
Total impact

London Economics The economic impact of the University of Oxford 17
2 | The impact of the University of Oxford’s research and knowledge exchange activities
Displacement of economic activity within the region of analysis, i.e. taking account of the possibility that the economic activity generated might result in the reduction of activity elsewhere within the region27.
The direct, indirect, and induced impacts are measured in terms of monetary economic output28, gross value added (GVA)29, and full-time equivalent (FTE) employment supported. In addition to measuring these impacts on the UK economy as a whole, the analysis is broken down by geographic region and sector.
These impacts of the University’s knowledge exchange activities were estimated using economic multipliers derived from Input-Output tables, which measure the total production output of each industry in the UK economy, and the inter-industry (and intra-industry) flows of goods and services consumed and produced by each sector30. In other words, these tables capture the degree to which different sectors within the UK economy are connected, i.e. the extent to which changes in the demand for the output of any one sector impact on all other sectors of the economy. To be able to achieve a breakdown of the analysis by region, we developed a multi-regional Input-Output model, combining UK-level Input-Output tables (for 201631) with a range of regional-level data32 to achieve a granular breakdown by sector33 and region34.
In addition to the impacts associated with the University’s knowledge exchange activities described in the following sections, a similar methodology is applied to estimate the direct, indirect, and induced economic effects arising from the tuition fee and non-tuition fee income associated with the University of Oxford’s international students (see Section 4), from the operational and capital expenditures of the University and its colleges (see Section 5), and from the tourism expenditure associated with the University’s activities (see Section 6).
Before presenting our estimates, the following provides an overview of the scale of some of the University of Oxford’s wider knowledge exchange activities (based on information from the Higher Education Business and Community Interaction Survey (HE-BCI)).
27 It is important to note that, while the analysis takes account of leakage (e.g. adjusting for the extent to which any additional income for supplying industries might be spent on imports of goods and services from outside the UK), the estimated impacts here are not adjusted for displacement or additionality (e.g. the extent to which the IP income received by the University of Oxford might otherwise have been used for other purposes by the organisations from which the income is received). Hence, our analysis effectively estimates the direct, indirect, and induced impacts associated with the University of Oxford’s knowledge exchange activities in gross terms. 28 Here, economic output is equivalent to income/turnover (e.g. the direct economic output associated with the University’s spinout companies is captured by the turnover of these firms in 2018-19). 29 Gross value added is used in National Accounting to measure the economic contribution of different industries or sectors, and is defined as economic output minus intermediate consumption (i.e. the cost of goods and services used in the production process). 30 Specifically, the analysis makes use of Type II multipliers, defined as [Direct + indirect + induced impact]/[Direct impact]. 31 See Office for National Statistics (2020a). 2016 was the most recent year for which this information was available at the time the analysis was undertaken. 32 The fundamental idea of the multi-regional Input-Output analysis is that region i’s demand for region j’s output is related to the friction involved in shipments from one region to another (which we proxy by the distance between the two regions), and that cross-regional trade can be explained by the relative gross value added of the sector in all regions. The multi-regional Input-Output model was derived by combining UK-level Input-Output tables with data on geographical distances between regions; GVA and compensation of employees by sector and region (Office for National Statistics, 2019); employment by sector and region (Office for National Statistics, 2020b); gross disposable household income by region (Office for National Statistics, 2020c); population by region (Office for National Statistics, 2020d); and UK imports into each region and exports by each region, by commodity (Office for National Statistics, 2018). 33 In terms of sector breakdown, the original UK Input-Output tables are broken down into 64 (relatively granular) sectors. However, the (wide range of) regional-level data required to generate the multi-regional Input-Output model is not available for such a granular sector breakdown. Instead, the multi-regional Input-Output model is broken down into 10 more high-level sector groups (see Table 20 in Annex A2.1 for more information). 34 While Input-Output analyses are a useful tool to assess the total economic impacts generated by a wide range of activities, it is important to note several key limitations associated with this type of analysis. Input-Output analyses assume that inputs are complements, and that there are constant returns to scale in the production function (i.e. that there are no economies of scale). The interpretation of these assumptions is that the prevailing breakdown of inputs from all sectors (employees, and imports) in 2016 is a good approximation of the breakdown that would prevail if total demand (and therefore output) were marginally different. In addition, Input-Output analyses do not account for any price effects resulting from a change in demand for a given industry/output.

18 London Economics
The economic impact of the University of Oxford
The University of Oxford’s wider knowledge exchange activities
In addition to the economic impacts associated with the University of Oxford’s IP licensing, its spinout companies, and organisations located at the Oxford and Begbroke Science Parks, information from the Higher Education Business and Community Interaction Survey provides additional valuable insights into the University’s wider knowledge dissemination activities. Table 4 presents a ranking of the number of disclosures and patents filed by different UK higher education institutions in 2018-19 (focusing on the top 15 universities in terms of the number of disclosures or patents filed). The table shows that the University of Oxford far exceeds other institutions in terms of the number of disclosures (367) and new patent applications (217) filed, the number of patents granted (434), and the cumulative number of patents held (3,941) in the 2018-19 academic year. In other words, the University is the highest-ranking UK higher education institution in terms of generating intellectual property from research.
Disclosures and patents filed in 2018-19, by university (top 15)
Rank # of disclosures filed in year
# of new patent applications filed in year
# of patents granted in year
Cumulative patent portfolio
1 The University of Oxford: 367 The University of
Oxford: 217 The University of Oxford: 434 The University of
Oxford: 3,941
2 The University of Birmingham: 239 The University of
Cambridge: 214 University College London: 198 University College
London: 2,396
3 Imperial College: 233 Imperial College: 153 The University of Glasgow: 94 Imperial College: 1,512
4 The University of Cambridge: 194 The University of
Edinburgh: 121 The University of Cambridge: 85 The University of
Cambridge: 993
5 Coventry University: 171 The University of Birmingham: 103 Newcastle University: 73 The University of St
Andrews: 849
6 The University of Manchester: 156 The University of Leeds: 78 The University of Leeds: 71 The University of
Leicester: 767
7 Royal College of Art: 123 University College London: 75 The University of
Birmingham: 65 The University of Dundee: 638
8 The University of Liverpool: 112 Queen's University
Belfast: 62 The University of Edinburgh: 64 Queen's University
Belfast: 606
9 Swansea University: 102 The University of Sheffield: 56 Imperial College: 63 The University of
Birmingham: 576
10 The University of Warwick: 99 The University of
Southampton: 56 The University of Manchester: 61 Institute of Cancer
Research: 570
11 University of Nottingham: 94 Cardiff University: 50 University of
Nottingham: 57 The University of Manchester: 569
12 Queen Mary University London: 94 Queen Mary University
London: 49 The University of St Andrews: 57 King's College London: 558
13 King's College London: 87 The University of Manchester: 48 King's College London: 49 The University of
Leeds: 494
14 The University of Sheffield: 86 King's College London: 40 The University of
Liverpool: 48 Queen Mary University London: 487
15 University College London: 84 The University of
Leicester: 40 The University of Southampton: 48 The University of
Edinburgh: 478
Source: London Economics’ analysis of HE-BCI data (see Higher Education Statistics Agency, 2020b)
Figure 6 and Figure 7 present similar ranked information on the income from IP licensing and income from contract research services accrued by different UK higher education institutions in 2018-19 (respectively). Again, the University of Oxford is at the forefront of these activities within the UK higher education sector (with roughly double the income received from these activities compared to the second-ranked institution), with £80 million accrued in income from IP licensing, and £184 million in income from contract research services. Figure 8 illustrates that the University also accounts for (by far) the largest number of active spinout companies in 2018-19 across the entire UK higher education sector, with 145 active University of Oxford spinout companies operating in 2018-1935.
35 This relates to the number of spinouts with some ownership by the University considered. Note that the number here differs from the number of active spinout companies included throughout the analysis of the impact of the University’s knowledge exchange activities (see Section 2.2.2), due to differences in the underlying data sources used.

London Economics The economic impact of the University of Oxford 19
Income from IP licensing in 2018-19, by university (top 15)
Income from contract research services in 2018-19, by university (top 15)
Active spinout companies (with some university ownership) in 2018-19, by university (top 15)
Source: London Economics’ analysis of HE-BCI data (Higher Education Statistics Agency, 2020b)
Source: London Economics’ analysis of HE-BCI data (Higher Education Statistics Agency, 2020b)
Source: London Economics’ analysis of HE-BCI data (Higher Education Statistics Agency, 2020b)
£80m
£38m
£27m
£26m
£17m
£13m
£6m
£5m
£5m
£4m
£3m
£3m
£3m
£2m
£2m
£0m £40m £80m
The University of Oxford
Institute of Cancer Research
The University of Cambridge
Newcastle University
The University of Sheffield
University College London
Imperial College
Queen's University Belfast
The University of Bristol
Oxford Brookes University
The Open University
The University of Liverpool
Cardiff University
The University of Manchester
The University of Aberdeen
Income, £m
£184m
£99m
£71m
£65m
£64m
£57m
£54m
£44m
£43m
£40m
£36m
£33m
£31m
£30m
£26m
£0m £100m £200m
The University of Oxford
Imperial College
University College London
The University of Birmingham
The University of Manchester
The University of Leeds
The University of Sheffield
The University of Bristol
King's College London
University of Nottingham
The University of Cambridge
The University of Glasgow
Queen's University Belfast
The University of Southampton
The University of Warwick
Income, £m
145
95
72
72
51
45
37
36
35
33
32
32
31
30
29
0 50 100 150 200
The University of Oxford
The University of Cambridge
Imperial College
University College London
The University of Edinburgh
The University of Manchester
Queen's University Belfast
The University of Bristol
The University of Warwick
Ulster University
The University of St Andrews
Swansea University
Royal College of Art
University of Durham
The University of Leeds
Number of active firms

20 London Economics
The economic impact of the University of Oxford
2 | The impact of the University of Oxford’s research and knowledge exchange activities
2.2.1 Impact of the University’s IP licensing
To measure the direct impact associated with the University of Oxford’s IP licensing activities, we made use of data from the Higher Education Business and Community Interaction Survey (HE-BCI)36 on the total IP licensing income received by the University in the 2018-19 academic year. This stood at £80 million37, including £38 million in UK IP income, £19 million in IP income from overseas, and £24 million of income from sales of shares in spinout companies. While this provides an estimate of the direct impact in economic output terms, to arrive at comparable estimates in GVA and employment terms, we multiplied this direct output by the average ratios of GVA to output and of FTE employees to output among organisations within the government, health, and education sector located in the South East38. Applying these assumptions, we estimate that the University of Oxford’s IP income in 2018-19 directly generates £48 million in GVA, and supports 960 full-time equivalent jobs39.
To estimate the total direct, indirect, and induced impacts associated with the University’s IP licensing, we then multiplied these direct impacts by the estimated average economic multipliers associated with organisations in the government, health, and education sector in the South East40. These multipliers (for the impact on the South East and the UK economy as a whole) are presented in Table 541. Based on these estimates, in terms of economic output, we assume that every £1 million of IP income accrued by the University of Oxford generates an additional £1.71 million of impact throughout the UK economy, of which £0.71 million is generated in the South East. In terms of employment, we assume that, for every 1,000 (FTE) staff employed directly by the University (supported by its IP income), an additional 1,060 staff are supported throughout the UK, of which 400 are supported within the South East.
Economic multipliers associated with the University’s IP licensing income
Location of impact Output GVA FTE employment South East 1.71 1.61 1.40 Total UK 2.71 2.51 2.06
Note: All multipliers constitute Type II multipliers, defined as [Direct + indirect + induced impact]/[Direct impact]. Source: London Economics’ analysis
Applying these multipliers to the above direct impacts, the analysis indicates that the total economic impact associated with the University of Oxford’s IP licensing activities in the 2018-19 academic year stood at approximately £216 million across the UK economy, of which £137 million (63%) was generated in the South East (see Table 6). The estimated total number of jobs supported (in FTE) stood at 1,980 (of which 1,350 were located in the South East), while the corresponding estimate in terms of GVA stood at £119 million (of which £77 million occurred in the South East)42.
36 See Higher Education Statistics Agency (2020b). 37 This is also presented in Figure 6 above (alongside the IP income accrued by other UK higher education institutions). This includes any IP income generated through the publishing activities of Oxford University Press. 38 This approach is based on the fact that the IP income is generated by the University of Oxford itself. In other words, we assume that the income accrued by the University of Oxford supports the same levels of GVA and employment (in relative/proportionate terms) as the income accrued by other institutions operating in the South East’s government, health, and education sector. The ratios of GVA to output and employment to output were derived from the above-described multi-regional Input-Output model. 39 All employment estimates have been rounded to the nearest 5. 40 i.e. we assume that the expenditure patterns of the University are the same as for other institutions operating in the South East’s government, health and education sector. 41 A full breakdown of impacts by regions (as well as sector) - across all the University’s knowledge exchange activities – is provided in Section 2.2.4. 42 Again, a full breakdown of the total impact of the University’s knowledge exchange activities is provided in Section 2.2.4.

London Economics The economic impact of the University of Oxford 21
2 | The impact of the University of Oxford’s research and knowledge exchange activities
Economic impact associated with the University’s IP licensing in 2018-19
Location of impact Output, £m GVA, £m # of FTE employees South East £137m £77m 1,350 Total UK £216m £119m 1,980
Note: All monetary values are presented in 2018-19 prices and rounded to the nearest £1 million. The employment figures are rounded to the nearest 5. Source: London Economics’ analysis
2.2.2 Impact of the University’s spinout companies
To assess the direct impact associated with the University’s spinout companies, we made use of information on the turnover (as a measure of economic output), FTE employment, and GVA associated with a total of 168 UK-based University of Oxford spinout companies that were active in 2018-19 (where available)43. The information on each company’s turnover and employment was based on data provided by the University of Oxford, supplemented with information from Bureau van Dijk’s FAME database (based on Companies House information) to fill any gaps where possible44. The direct gross value added generated was estimated by multiplying the turnover of each firm by the average ratio of GVA to output among organisations within the given company's industry and region45, 46. Based on this approach, the direct impact associated with the activities of the University’s spinout activities in 2018-19 was thus estimated at £1,038 million in economic output (i.e. turnover) terms, 9,240 FTE staff, and £486 million of gross value added.
Again, we then applied relevant economic multipliers (derived from our above-described Input-Output analysis) to estimate the total direct, indirect, and induced economic impacts associated with the University’s spinout companies. Specifically, we assigned relevant economic multipliers to each active spinout company in 2018-19, based on each firm’s industry classification and the region of its main registered office address. Table 7 presents the resulting average multipliers across all spinout companies (weighted by the underlying (direct) turnover, employment, and GVA associated with each firm)47. Based on these estimates, in terms of economic output, we assume that every £1 million of turnover directly accrued by the University’s spinout companies generates an additional £1.60 million of impact throughout the UK economy, of which £0.56 million is generated in the South East. In terms of employment, we assume that, for every 1,000 (FTE) staff employed by these spinout companies, an additional 1,660 staff are supported throughout the UK, of which 530 are supported within the South East.
43 The analysis includes spinoffs with some University of Oxford ownership, but excludes a total of 116 startups and social enterprises that are based on the University's IP and that were active in 2018-19. We also exclude companies that were dissolved prior to 2018-19, or those that are primarily non-UK based. Further note that the information is based on each company’s 2018-19 financial year, which does not necessarily coincide with the 2018-19 academic year, and varies across companies. 44 Note that, in spite of using FAME data to fill gaps, it is likely that the combined Oxford/FAME data still provide an incomplete estimate of the total turnover, GVA, or employment of the University’s spinout companies. This particularly applies to relatively small companies falling below the reporting thresholds required by Companies House (implying that their financials would not be included in the FAME data). 45 Again, these ratios were derived based on the above-described multi-regional Input-Output model. Each firm’s main industry classification was based on information provided by the University of Oxford, with any gaps again filled using information from FAME. Each firm’s main regional location was based on the region of the main registered address of the company recorded in FAME. 46 The analysis made use of any resulting turnover, employment, or GVA information available for a given company, irrespective of whether complete data (i.e. in terms of turnover, GVA and employment) was available for that firm. The direct impact is therefore based on a total of 73 firms (out of the 168 active companies) for which turnover information was available, and 137 firms for which employment information was available. 47 Again, the table provides multipliers for the impact on the South East and the UK economy as a whole. A full breakdown of impacts by regions (as well as sector) - across all of the University’s knowledge exchange activities – is provided in Section 2.2.4.

22 London Economics
The economic impact of the University of Oxford
2 | The impact of the University of Oxford’s research and knowledge exchange activities
Economic multipliers associated with the activities of the University’s spinout companies
Location of impact Output GVA FTE employment South East 1.56 1.58 1.53 Total UK 2.60 2.75 2.66
Note: All multipliers constitute Type II multipliers, defined as [Direct + indirect + induced impact]/[Direct impact]. Source: London Economics’ analysis
Applying these multipliers to the above direct impacts, the total economic impact associated with the activities of the University of Oxford’s spinout companies in the 2018-19 academic year was estimated to be £2,701 million across the UK economy, of which £1,615 million (60%) was generated in the South East (see Table 8). The estimated total number of FTE jobs supported stood at 24,605 (of which 14,090 were located in the South East). The corresponding estimate in terms of GVA stood at £1,338 million (of which £771 million occurred in the South East)48.
Economic impact associated with the University’s spinout companies in 2018-19
Location of impact Output, £m GVA, £m # of FTE employees South East £1,615m £771m 14,090 Total UK £2,701m £1,338m 24,605
Note: All monetary values are presented in 2018-19 prices and rounded to the nearest £1 million. The employment figures are rounded to the nearest 5. Source: London Economics’ analysis
2.2.3 Impact of the University’s Science Parks
As a final type of knowledge exchange activity, we considered the direct, indirect and induced economic impacts associated with the activities of firms located at the University of Oxford’s Science Parks.
To assess the direct impacts generated by these firms, similar to the approach to estimating impacts for the University’s spinouts (see Section 2.2.2), we made use of data on the turnover and FTE employment (where available) associated with a total of 32 active companies that were resident at the Oxford or Begbroke Science Park in 2018-1949:
For companies located at Begbroke Science Park, the University of Oxford provided us with information on each firm’s employment, which we again supplemented with FAME data to fill any gaps. The information on turnover instead relied entirely on FAME data (where available). Similar to the approach for spinout companies, direct GVA was then estimated by multiplying each firm’s turnover by the average ratio of GVA to output within the given company's industry in the South East50.
For firms located at Oxford Science Park, both turnover and employment information for each company was based on FAME data51. Again, the level of direct GVA generated by each firm was then estimated by multiplying company-level turnover by the average ratio of GVA to output amongst organisations within the company’s main industry located in the South East.
48 Again, a full breakdown of the total impact of all of the University’s knowledge exchange activities is provided in Section 2.2.4. 49 This excludes 27 University spinout companies that were located at the Science Parks in 2018-19 (to avoid double-counting with the above impacts associated with the University’s spinouts; see Section 2.2.2). Again, note that we also exclude companies that were dissolved prior to 2018-19 or those that are primarily non-UK based. This information is also based on each company’s 2018-19 financial year, which does not necessarily coincide with the 2018-19 academic year and varies across companies. 50 All companies located at the Science Parks were assigned to the South East region, i.e. each company was assigned a GVA conversion ratio (and economic multiplier) for the relevant industry based in the South East region. 51 This is because the University of Oxford holds only relatively limited information on companies located at the Oxford Science Park, so the analysis relies exclusively on FAME data.

London Economics The economic impact of the University of Oxford 23
2 | The impact of the University of Oxford’s research and knowledge exchange activities
Using this methodology, the analysis indicates that the direct impact associated with the activities of companies located at the University’s Science Parks52 stood at £187 million in output (i.e. turnover) terms, 420 FTE staff, and £103 million in GVA terms53.
Again, we then assigned relevant economic multipliers (based on the relevant industry’s multiplier in the South East region54) to estimate the total direct, indirect, and induced economic impacts associated with each firm’s activities. The resulting average multipliers across all Science Park companies (weighted by the underlying (direct) turnover, employment, and GVA associated with each firm) are presented in Table 9. Based on these multipliers, we assume that every £1 million of output (i.e. turnover) directly accrued by these companies results in an additional £1.65 million of impact throughout the UK economy, of which £0.68 million is generated in the South East. In terms of employment, we assume that, for every 1,000 FTE staff employed by these spinout companies, an additional 1,420 staff are supported throughout the UK, of which 550 are located in the South East.
Economic multipliers associated with the activities of companies located at the University’s Science Parks
Location of impact Output GVA FTE employment South East 1.68 1.64 1.55 Total UK 2.65 2.58 2.42
Note: All multipliers constitute Type II multipliers, defined as [Direct + indirect + induced impact]/[Direct impact]. Source: London Economics’ analysis
Applying these multipliers to the above direct impacts, the estimated total economic impact associated with companies located at the Begbroke and Oxford Science Parks in 2018-19 stood at £496 million across the UK, of which £315 million (63%) was generated in the South East (Table 10). The estimated total number of FTE jobs supported stood at 1,010 (of which 640 were located in the South East), and the corresponding estimate in GVA terms stood at £267 million (of which £169 million was generated in the South East).
Economic impact associated with companies located at the University’s Science Parks in 2018-19
Location of impact Output, £m GVA, £m # of FTE employees South East £315m £169m 640 Total UK £496m £267m 1,010
Note: All monetary values are presented in 2018-19 prices and rounded to the nearest £1 million. The employment figures are rounded to the nearest 5. Source: London Economics’ analysis
2.2.4 Aggregate impact of the University’s knowledge exchange activities
Combining the economic impacts generated by the University’s IP licensing, its spinout companies, and organisations located at the University’s Science Parks, Figure 9 presents the aggregate impact associated with the University’s knowledge exchange impacts in the 2018-19 academic year (across all regions, as well as by sector).
52 Again, excluding any spinout companies. 53 This is based on 7 firms (out of the 32 active companies) for which turnover and GVA information was available, and 29 firms for which employment information was available. As with the approach for spinout companies, we made use of any information available for a given firm, irrespective of whether complete data (i.e. in terms of turnover, GVA and employment) was available for that firm. 54 i.e. again, all Science Park companies were assigned as located in the South East region, based on their residency at the Science Parks.

24 London Economics
The economic impact of the University of Oxford
2 | The impact of the University of Oxford’s research and knowledge exchange activities
Total economic impact associated with the University’s knowledge exchange activities in 2018-19, by region and sector By region By sector
Note: Monetary estimates are presented in 2018-19 prices, rounded to the nearest £1 million, and may not add up precisely to the totals indicated. Employment estimates are rounded to the nearest 5, and again may not add up precisely to the totals indicated. Source: London Economics’ analysis
£44m £110m £98m £96m £106m £134m
£482m £2,066m
£103m £59m £82m
£33m £3,413m
£0m £1,000m £2,000m £3,000m £4,000m
North EastNorth West
Yorkshire & the HumberEast Midlands
West MidlandsEast of England
LondonSouth East
South WestWales
ScotlandNorthern Ireland
Total
Economic output, £m
Output, £m £25m £790m
£77m £452m
£219m £167m
£261m £782m
£567m £74m
£3,413m
£0m £1,000m £2,000m £3,000m £4,000m
AgricultureProduction
ConstructionDistr., transport, hotels & restaurants
Information & communicationFinancial & insurance
Real estateProfessional & support activitiesGovernment, health & education
Other servicesTotal
Economic output, £m
Output, £m
£29m £57m £55m £54m £58m £75m
£209m £1,017m
£61m £38m £47m
£23m £1,724m
£0m £500m £1,000m £1,500m £2,000m
North EastNorth West
Yorkshire & the HumberEast Midlands
West MidlandsEast of England
LondonSouth East
South WestWales
ScotlandNorthern Ireland
Total
GVA, £m
GVA, £m £10m £247m
£29m £234m
£113m £69m
£199m £437m
£340m £45m
£1,724m
£0m £500m £1,000m £1,500m £2,000m
AgricultureProduction
ConstructionDistr., transport, hotels & restaurants
Information & communicationFinancial & insurance
Real estateProfessional & support activitiesGovernment, health & education
Other servicesTotal
GVA, £m
GVA, £m
5301,0351,0901,0201,0551,270
2,46016,080
1,095720790
45027,595
0 5,000 10,000 15,000 20,000 25,000 30,000
North EastNorth West
Yorkshire & the HumberEast Midlands
West MidlandsEast of England
LondonSouth East
South WestWales
ScotlandNorthern Ireland
Total
# of full-time equivalent employees
FTE employment 5053,885
3955,550
1,355715
3958,705
5,435665
27,595
0 5,000 10,000 15,000 20,000 25,000 30,000
AgricultureProduction
ConstructionDistr., transport, hotels & restaurants
Information & communicationFinancial & insurance
Real estateProfessional & support activitiesGovernment, health & education
Other servicesTotal
# of full-time equivalent employees
FTE employment

London Economics The economic impact of the University of Oxford 25
2 | The impact of the University of Oxford’s research and knowledge exchange activities
In terms of economic output (top panel), the analysis estimates that, in 2018-19, these knowledge exchange activities generated a total of £3,413 million of economic output across the UK economy:
In terms of the breakdown by type of activity, £216 million of this impact was associated with the University’s IP licensing activities, £2,701 million was generated through the activities of the University’s spinouts, and the remaining £496 million was associated with the activities of companies located at the University’s Science Parks.
Considering the breakdown by region, while the majority of this impact (£2,066 million, 61%) was generated in the South East, there were also significant impacts occurring in other regions across the UK, particularly in London (£482 million, 14%) as well as the East of England (£134 million, 4%), the North West (£110 million, 3%), the West Midlands (£106 million, 3%), and the South West (£103 million, 3%).
In terms of sector, the University’s research and knowledge exchange activities resulted in particularly large impacts within the production sector (£790 million, 23%), professional and support activities sector (£782 million, 23%), the government, health, and education sector (£567 million, 17%), and the distribution, transport, hotel, and restaurant sector (£452 million, 13%)55.
In terms of gross value added (middle panel), the impact was estimated to be approximately £1,724 million across the UK economy as a whole, of which £1,017 million was accrued within the South East56. Finally, the University’s knowledge exchange activities supported an estimated 27,595 full-time equivalent jobs across the UK as a whole, of which approximately 16,080 were located within the South East.
2.3 Total impact of the University of Oxford’s research and knowledge exchange activities
Finally, as presented in Figure 10, the total economic impact associated with the University of Oxford’s research and knowledge exchange activities in 2018-19 was estimated at £7,909 million. £4,496 million was associated with the University’s research and productivity spillovers to the rest of the UK economy, while the remaining £3,413 million was associated with the University’s knowledge exchange activities.
55 For more detail on what industries are included in this high-level sector classification, please refer to Table 20 in Annex A2.1. 56 Note that there are some differences in the sector distribution of the impact estimates in terms of GVA (and employment) as compared to economic output. For example, the analysis indicates that the production sector accrued 23% of the total impact in economic output terms, but only 14% in GVA terms. These differences arise from differences in the ratios of GVA per economic output generated across different sectors; in this instance, the production sector is associated with a relatively low ratio of GVA to output (likely driven by a relatively high cost of goods and services used in the production process as compared to other sectors (in percentage terms)).
The impact of the University of Oxford’s research and
knowledge exchange activities in 2018-19 stood at
£7.9 billion.

26 London Economics
The economic impact of the University of Oxford
2 | The impact of the University of Oxford’s research and knowledge exchange activities
Figure 10 Total impact of the University of Oxford’s research and knowledge exchange activities in 2018-19, £m
Note: All values are presented in economic output in 2018-19 prices, rounded to the nearest £1 million, and may not add up precisely to the totals indicated. Source: London Economics’ analysis
Comparing the £771 million of research income received by the University in 2018-19 to the £7,909 million impact from research and knowledge exchange activities, this suggests that for each £1 million of its research income, the University’s research and knowledge exchange activities generated a total of £10.3 million in economic impact across the UK.
2.4 Change in impacts over time
In addition to the above estimates for the 2018-19 academic year, to examine changes in impacts over time, we applied similar methodologies to estimate the economic impact associated with the University of Oxford’s research and knowledge exchange in previous academic years (including 2015-16, 2016-17, and 2017-18). The resulting estimates – all in (constant) 2018-19 prices57 – are presented in Figure 11.
Total impact of the University of Oxford’s research and knowledge exchange activities, 2015-16 to 2018-19, £m
Note: All values (for all years) are presented in 2018-19 prices, rounded to the nearest £1 million, and may not add up precisely to the totals indicated. Source: London Economics’ analysis
Overall, there has been a large increase in the total impact of the University’s research and knowledge exchange activities in the timeframe considered, from £7,277 million in 2015-16 to £7,909 million in 2018-19 (representing a 9% increase (in real terms)). While the impact of the University’s research activity has
57 To uprate previous years’ estimates to 2018-19 prices, we used quarterly Consumer Price Index (CPI) inflation data published by the Office for National Statistics (2021).
£4,496m
£3,413m
£7,909m
£0m £2,000m £4,000m £6,000m £8,000m
Research activities
Knowledge exchange activities
Total
£4,4
95m
£4,4
60m
£4,4
01m
£4,4
96m
£2,7
81m
£3,0
03m
£3,2
77m
£3,4
13m
£7,2
77m
£7,4
63m
£7,6
78m
£7,9
09m
£0m
£1,000m
£2,000m
£3,000m
£4,000m
£5,000m
£6,000m
£7,000m
£8,000m
£9,000m
2015-16 2016-17 2017-18 2018-19
Research activities Knowledge exchange activities Total

London Economics The economic impact of the University of Oxford 27
2 | The impact of the University of Oxford’s research and knowledge exchange activities
remained relatively unchanged58, the overall increase was driven by a rise in the impacts generated by the University’s knowledge exchange activities, from £2,781 million in 2015-16 to £3,413 million in 2018-19 (i.e. a 23% increase). In turn, this increase was driven by a large increase in the impact associated with companies resident at the University’s Science Parks (particularly at Oxford Science Park59), as well as additional (though smaller) increases in the impacts generated by the University’s IP licensing activities and spinout companies.
58 There was an increase in the net direct impact associated with the University’s research over the period (driven particularly by an increase in income from EU and non-EU research grants and contracts). However, this increase was outweighed by an (almost) equivalent decline in the estimated productivity spillovers associated with the University’s research (given a decline in the income received from the Research Councils and UK charities (which we assume attract a higher spillover multiplier than other types of research income; see Section 2.1.2)). 59 Due to an increase in the number of firms resident at the Science Park over time, as well as an increase over time in the turnover accrued by firms already located at the Science Park in 2015-16.

28 London Economics
The economic impact of the University of Oxford
From the lab to the bedside: Translating healthcare research into clinical patient benefit
Since its establishment in 2007, the Oxford Biomedical Research Centre (OxBRC) has made major contributions to the UK Government’s initiative to improve the translation of basic scientific developments into clinical benefits for patients, thus reinforcing the UK’s position as a global leader in healthcare related research. Established as one of the five original Biomedical Research Centres by the National Institute for Health Research (NIHR) through a competitively awarded grant, the Oxford BRC is a partnership between the Oxford University Hospitals NHS Foundation Trust and the University of Oxford, combining the University’s research expertise with the clinical skills of the Trust’s staff. The Centre’s research is fully integrated with Oxford’s major hospitals - with many of the BRC’s research facilities situated on the hospital sites. This co-location of world-class clinical and research facilities ensures that medical innovations can be quickly moved out of laboratories into clinical trials and NHS care settings.
The research undertaken at the Oxford BRC is divided into 4 Clusters (including Precision Medicine; Technology and Big Data; Immunity and Infection; and Chronic Diseases), with a total of 20 underlying Themes (see Figure 12). Since the Centre’s establishment, the Oxford BRC has completed more than 4,600 research projects under these Clusters and Themes; produced more than 6,900 peer-reviewed publications; generated more than £1.6 billion in external funding; filed more than 600 patents; and established 27 spinout companies.
To illustrate the types of research undertaken, currently, the Oxford BRC is heavily involved in the global fight against the Covid-19 pandemic. For example:
The Oxford BRC played a key role in the development of the world’s first approved Covid-19 vaccine, developed by the University of Oxford in collaboration with Astra Zeneca plc. The Oxford BRC provided crucial funding for the trialling of the vaccine, and subsequent funding for an evaluation of the vaccine’s safety. Prof Andrew Pollard and Prof Sarah Gilbert – both leading members of the Oxford BRC’s Vaccines Theme – were academic leads of the vaccine drive from the University’s side.
The Oxford BRC recently supported the development of QCovid, a Covid-19 risk prediction model validated by the Office for National Statistics. Commissioned by England’s Chief Medical Officer (Prof Chris Whitty), the model helps identify those who may be most vulnerable to the virus, based on individual characteristics such as age, ethnicity, BMI, as well as certain medical conditions and treatments. The model is now helping the NHS prioritise patients with a combination of identified risk factors for the vaccine.
Researchers at the Oxford BRC are currently involved in a national study investigating the long-term effects of lung inflammation and scarring resulting from Covid-19. The study, launched with £2 million of funding from UK Research and Innovation, aims to investigate whether post-Covid-19 lung damage will improve or worsen over time; the duration of the damage; and the best strategies for developing treatments.
Using a similar approach as applied to estimating the economic impact associated with the University of Oxford’s research activities (see Section 2.1), it was possible to assess the (net) direct and spillover
Overview of the Oxford BRC’s research clusters and themes
Source: Oxford Biomedical Research Centre

London Economics The economic impact of the University of Oxford 29
impacts associated with the research undertaken by the Oxford BRC. Based on information provided by the Centre, the analysis focuses on the 2019-20 academic year.
Specifically, to assess the direct economic impact associated with the Oxford BRC’s research, we made use of information on a total of approximately £221 million of external funding received by the Centre in 2019-20 (see Figure 13). This includes £23 million of funding from the NIHR, £37 million from the UK Research Councils, £53 million from charities, £43 million from other non-commercial sources, and £64 million from industry contracts and collaborations. Compared to the £23 million in funding received from the NIHR itself, this represents a leverage ratio of 8.5 : 160.
To arrive at the net direct impact of the Oxford BRC’s research activities on the UK economy, we again deducted any public purse funding provided to the Centre, including the funding provided by the NIHR (£23
million) and the UK Research Councils (£37 million). Deducting these total public purse costs (£61 million) from the total external funding received (£221 million), the net direct impact of the Oxford BRC’s research activities in 2019-20 was thus estimated at £160 million.
Again, these research activities are expected to generate positive productivity and knowledge spillovers throughout the economy, estimated by applying the relevant productivity spillovers from the existing literature to the different types of external funding received by the Oxford BRC. As for the impact of the research of the University of Oxford as a whole, we assigned the multiplier of 12.7 to the Oxford BRC’s funding received from the UK Research Councils and charities, and the multiplier of 0.2 to all other funding received by the Centre. Using this approach, we thus estimate that the research conducted by the Oxford BRC in 2019-20 resulted in total productivity spillovers of approximately £1.177 billion. This implies a weighted average spillover multiplier associated with the Oxford BRC’s research of approximately 5.33 – i.e. every £1 invested in the Centre’s research generates an additional annual output of £5.33 across the UK economy61.
Combining these (net) direct and productivity spillover impacts, the total economic impact associated with the Oxford BRC’s research in 2019-20 was estimated at £1.337 billion (see Figure 14).
Figure 14 Total impact of the Oxford BRC’s research activities in 2019-20, £m
All values are presented in 2019-20 prices, rounded to the nearest £1 million, and may not add up precisely to the totals indicated. Source: London Economics’ analysis
60 Calculated by dividing the external funding received by the Oxford BRC (£198 million, excluding NIHR funding) by the £23 million of NIHR funding. 61 Note that this average multiplier is close to (but not exactly equal to) the weighted average multiplier associated with the University of Oxford’s research activities as a whole (see Section 2.1.2).
£160m
£1,177m
£1,337m
£0m £500m £1,000m £1,500m
Net direct research impact
Spillover impact
Total impact
Total funding received by the Oxford BRC in 2019-20
All values are presented in 2019-20 prices, rounded to the nearest £1 million, and may not add up precisely to the totals indicated. Source: Oxford Biomedical Research Centre
£23m 11%
£37m 17%
£53m 24%
£43m 19%
£64m 29%
NIHR
UK ResearchCouncilsCharities
Other non-commercial sourcesIndustry

30 London Economics
The economic impact of the University of Oxford
3 | The impact of the University of Oxford’s teaching and learning activities
3 The impact of the University of Oxford’s teaching and learning activities
Box 2 Key findings: Teaching and learning
The analysis of the impact of the University’s teaching and learning activities estimates the enhanced employment and earnings benefits to graduates and the additional taxation receipts accrued by the Exchequer associated with the 7,695 UK domiciled students commencing a higher education qualification or stand-alone module at the University in the 2018-19 academic year.
Incorporating both the benefits and costs to students/graduates, the analysis suggests that the net graduate premium achieved by representative English domiciled students in the 2018-19 cohort completing a full-time first degree at the University of Oxford stands at approximately £72,000 on average (in 2018-19 money terms). Taking account of the benefits and costs to the public purse, the analysis indicates that the corresponding net Exchequer benefit associated with these students stands at £58,000. At postgraduate level, the net (post)graduate premiums for a representative student completing a full-time postgraduate taught degree at the University of Oxford stand at approximately £23,000 while the net Exchequer benefit stands at £40,000.
Combining information on the net graduate premiums and net Exchequer benefits (by gender, study mode, study level, domicile, and prior attainment, and adjusted for the subject mix of the cohort) with information on the number of students starting qualifications at the University in 2018-19, the aggregate economic impact generated by the University of Oxford’s teaching and learning activities associated with the 2018-19 cohort stood at approximately £422 million. This is split approximately equally between students and the Exchequer, with £213 million (51%) of the economic benefit accrued by students, and the remaining £209 million (49%) accrued by the Exchequer.
Traditional economic impact analyses of higher education institutions typically only consider the direct, indirect, and induced economic effects of a university’s expenditures (through the institution’s extensive supply chains, and the expenditures on its staff), as well as the economic impacts associated with the expenditures of domestic and international students attending the institution. However, given that universities’ primary ‘products’ include the provision of teaching and learning, a simple study of this nature would significantly underestimate the impact of the University of Oxford’s activities on the UK economy.
In terms of measuring the impact of universities’ teaching and learning activities, Atkinson’s (2005) report to the Office for National Statistics asserted that the economic value of education and training is essentially the value placed on that qualification as determined by the labour market. Based on this approach, in this section of the report, we detail our estimates of the economic impact of the teaching and learning activities undertaken at the University of Oxford, by considering the labour market benefits associated with enhanced qualification attainment and skills acquisition – to both the individual and the public purse.
3.1 The 2018-19 cohort of UK domiciled students studying at the University of Oxford
The analysis of the economic impact of the University of Oxford’s teaching and learning activities is based on the 2018-19 cohort of UK domiciled students. In other words, instead of considering the University’s entire student body of 25,390 students in 2018-19 (irrespective of when these individuals may have

London Economics The economic impact of the University of Oxford 31
3 | The impact of the University of Oxford’s teaching and learning activities
commenced their studies), the analysis in this section focuses on the 7,695 UK domiciled62 students starting higher education qualifications (or standalone modules/credits) in the 2018-19 academic year63.
In terms of level of study (Figure 15), approximately 34% (2,580 students) of the UK domiciled students in the 2018-19 cohort were undertaking first degrees, with a further 1,020 students (13%) undertaking postgraduate taught degrees, and 715 students (9%) undertaking postgraduate research degrees. An additional 2,835 students (37%) were enrolled in other undergraduate qualifications, and 545 (7%) were undertaking other postgraduate qualifications64.
Figure 15 UK domiciled students in the 2018-19 cohort of University of Oxford students, by level of study
Note: All numbers are rounded to the nearest 5, and the total values may not add up due to this rounding. ‘Other undergraduate’ learning includes Certificates of Higher Education, Diplomas of Higher Education, other undergraduate-level diplomas, and undergraduate-level credits. ‘Other postgraduate learning’ includes Postgraduate Certificates or Professional Graduate Diplomas in Education, other certificates and diplomas at postgraduate level, taught work for credit at postgraduate level, and research-based postgraduate degrees below Master’s or Doctorate level. Source: London Economics’ analysis based on University of Oxford HESA data
In relation to the composition by mode of study (Figure 16), 4,110 (53%) of students in the cohort were undertaking their studies with the University of Oxford on a full-time basis, with 3,585 (47%) students enrolled on a part-time basis. As shown in Table 11, the majority of full-time students were undertaking first degrees (63%) or postgraduate degrees (both taught (17%) and research (16%)). In contrast, the majority of part-time students in the cohort were undertaking other undergraduate (79%) or other postgraduate (10%) learning65 . In terms of domicile (Figure 17), the majority of UK domiciled students in
62 It is likely that a proportion of EU and non-EU domiciled students undertaking their studies at the University will remain in the UK to work following completion of their studies; similarly, UK domiciled students might decide to leave the UK to pursue their careers in other countries. Given the uncertainty in predicting the extent to which this is the case, and the difficulty in assessing the net labour market returns for students not resident in the UK post-graduation, the analysis of teaching and learning focuses on UK domiciled students only. In other words, we assume that all UK domiciled students will enter the UK labour market upon graduation, and that non-UK students will leave the UK upon completing their qualifications at the University of Oxford. 63 We received HESA data on a total of 12,100 first-year students from the University of Oxford. Of these, we excluded 50 students with an unknown enrolment age, 10 students whose gender was indicated as ‘other’ (based on HESA variable definitions), and 4,345 non-UK domicile students. The economic impacts associated with these 4,345 non-UK domiciled students in the 2018-19 cohort are instead considered as part of the analysis of educational exports (Section 4). 64 ‘Other undergraduate’ learning includes Certificates of Higher Education, Diplomas of Higher Education, other undergraduate-level diplomas, and undergraduate-level credits. ‘Other postgraduate learning’ includes Postgraduate Certificates or Professional Graduate Diplomas in Education, other certificates and diplomas at postgraduate level, taught work for credit at postgraduate level, and research-based postgraduate degrees below Master’s or Doctorate level. 65 Note that there were no part-time first degree students in the 2018-19 cohort of University of Oxford students. Of those students undertaking other undergraduate qualifications, these include approximately 45 students undertaking Diplomas in Higher Education (DipHE) and 105 students undertaking Certificates in Higher Education (CertHE) and 50 students undertaking other undergraduate level Diplomas (at Level H). In addition, there were approximately 2,635 students undertaking stand-alone credit bearing modules (Credits at Level C) at undergraduate level.
2,83537%
2,58034%
5457%
1,02013%
7159%
Other undergraduate
First degree
Other postgraduate
Higher degree (taught)
Higher degree (research)

32 London Economics
The economic impact of the University of Oxford
3 | The impact of the University of Oxford’s teaching and learning activities
the cohort (7,280, 95%) were from England, with a further 150 students (2%) from Wales, 200 (3%) from Scotland, and 65 (1%) from Northern Ireland.
Figure 16 UK domiciled students in the 2018-19 cohort of University of Oxford students, by mode of study
Figure 17 UK domiciled students in the 2018-19 cohort of University of Oxford students, by domicile
Note: All numbers are rounded to the nearest 5, and the total values may not add up due to this rounding. Source: London Economics’ analysis based on University of Oxford HESA data
Note: All numbers are rounded to the nearest 5, and the total values may not add up due to this rounding. Source: London Economics’ analysis based on University of Oxford HESA data
UK domiciled students in the 2018-19 cohort of University of Oxford students, by level of study, mode of study and domicile
Level and mode of study Domicile
England Wales Scotland Nth. Ireland Total Full-time Other undergraduate 10 0 0 0 10 First degree 2,440 65 55 20 2,580 Other postgraduate 165 0 0 5 170 Higher degree (taught) 620 15 30 15 680 Higher degree (research) 630 10 25 5 670 Total 3,865 90 110 45 4,110 Part-time Other undergraduate 2,680 45 80 20 2,825 First degree 0 0 0 0 0 Other postgraduate 365 5 5 0 375 Higher degree (taught) 330 5 5 0 340 Higher degree (research) 40 5 0 0 45 Total 3,415 60 90 20 3,585 Total Other undergraduate 2,690 45 80 20 2,835 First degree 2,440 65 55 20 2,580 Other postgraduate 530 5 5 5 545 Higher degree (taught) 950 20 35 15 1,020 Higher degree (research) 670 15 25 5 715 Total 7,280 150 200 65 7,695
Note: All numbers are rounded to the nearest 5, and the total values may not add up due to this rounding. ‘Other undergraduate’ learning includes Certificates of Higher Education, Diplomas of Higher Education, other undergraduate-level diplomas, and undergraduate-level credits. ‘Other postgraduate learning’ includes Postgraduate Certificates or Professional Graduate Diplomas in Education, other certificates and diplomas at postgraduate level, taught work for credit at postgraduate level, and research-based postgraduate degrees below Master’s or Doctorate level. Source: London Economics’ analysis based on University of Oxford HESA data
4,1103,585
7,695
0
1,000
2,000
3,000
4,000
5,000
6,000
7,000
8,000
9,000
Full-time Part-time Total
# of
firs
t-ye
ar st
uden
ts, 2
018-
19 7,280
150 200 65
7,695
0
1,000
2,000
3,000
4,000
5,000
6,000
7,000
8,000
9,000
England Wales Scotland NorthernIreland
Total#
of fi
rst-
year
stud
ents
, 201
8-19

London Economics The economic impact of the University of Oxford 33
3 | The impact of the University of Oxford’s teaching and learning activities
3.2 Adjusting for completion rates
The above information provided an overview of the number of students starting qualifications or modules at the University of Oxford in the 2018-19 academic year. However, to aggregate individual-level impacts of the University’s teaching and learning activity, it is necessary to adjust the number of ‘starters’ to account for completion rates.
To achieve this, we made use of information provided by the Higher Education Statistics Agency66 on students’ non-continuation rates one year after entry, for UK domiciled full-time first degree students studying at the University of Oxford (on average, and broken down by young and mature entrants)67:
For students undertaking qualifications other than full-time first degrees, we combined this information on annual continuation rates68 with assumptions on the average study duration amongst students at the University of Oxford by qualification level69. This allowed us to calculate the proportion of students expected to continue their intended studies each year, and the proportion of students expected to complete their intended qualification in their final year of study (by qualification level and study mode)70.
For students undertaking full-time first degrees, we instead made use of separate HESA data on these students’ projected final learning outcomes (in terms of the proportion of students expected to achieve their degree71, available for full-time first degree students only).
In addition, we assume that students who do not complete their intended qualification instead only complete one or several credits/modules associated with their qualification before discontinuing their studies; this is modelled as completion at ‘other undergraduate’ level (for students who originally enrolled in first degrees or other undergraduate qualifications) and ‘other postgraduate’ level (for students who originally intended to complete higher degrees or other postgraduate qualifications).
66 See Higher Education Statistics Agency (2021). 67 The non-continuation rates are based on the proportion of students who started first degrees at the University of Oxford in 2018-19 who did not leave within 50 days of commencement and who were no longer enrolled in higher education one year after study. Hence, they implicitly take account of students who ‘switch’ between qualifications or transfer to a different institution as ‘continuing’ students. The HESA data do not provide information for part-time first degree students at the University of Oxford (since there were no students in the 2018-19 cohort undertaking first degrees on a part-time basis). Further note that comparable information on students starting other undergraduate courses at the University of Oxford was not available within the HESA data (as the information was suppressed due to small sample sizes). We therefore assume that students undertaking full-time other undergraduate qualifications have the same annual continuation rate as full-time first degree students (99%, on average, across young and mature entrants), and that students undertaking part-time other undergraduate qualifications have the same annual continuation rate as mature full-time first degree students (95%). In addition, the HESA data do not provide any information on postgraduate students’ non-continuation rates. We thus assume that students undertaking higher research or taught degrees (on a full-time or part-time basis) have the same annual non-continuation rate as mature full-time first-degree students (95%). 68 We assume that the annual continuation rates are constant over time, i.e. we assume that the same proportion of students continue their studies each year (separately by qualification level and mode), based on the proportion of students that continue after their first year of study. 69 Based on information on average study duration (by study level and mode) provided by the University of Oxford (see Table 24 in Annex A2.2.3 for more information). 70 Where we assume that students continuing their studies through the final year complete their studies with their intended qualification. 71 Again, see Higher Education Statistics Agency (2021).

34 London Economics
The economic impact of the University of Oxford
3 | The impact of the University of Oxford’s teaching and learning activities
Assumed completion rates of University of Oxford students
Completion outcome Study intention
Other undergraduate First degree Other
postgraduate Higher degree
(taught) Higher degree
(research) Full-time students Other undergraduate 100% 2% - - - First degree - 98% - - - Other postgraduate - - 100% 5% 18% Higher degree (taught) - - - 95% - Higher degree (research) - - - - 82% Total 100% 100% 100% 100% 100% Part-time students Other undergraduate 100% - - - - First degree - - - - - Other postgraduate - - 100% 10% 26% Higher degree (taught) - - - 90% - Higher degree (research) - - - - 74% Total 100% - 100% 100% 100%
Note: There were no students in the 2018-19 cohort of University of Oxford students undertaking first degrees on a part-time basis. Source: London Economics’ analysis based on Higher Education Statistics Agency (2021) and information on average study durations provided by the University of Oxford
Table 12 presents the resulting completion rates assumed throughout the analysis. We assume that of those students starting a full-time first degree at the University of Oxford in 2018-19, 98% complete the first degree as intended, while the remaining 2% only undertake one or more of the credits/modules associated with their degree before discontinuing their studies (modelled as completion at ‘other undergraduate’ level). At postgraduate level, we assume that of those individuals starting a full-time postgraduate taught degree, 95% complete the qualification as intended, while the remaining 5% only undertake one or more of the credits/modules associated with the degree before dropping out (in this case, modelled as completion at ‘other postgraduate’ level). In all of these cases, the analysis of the impact of teaching and learning calculates the estimated returns associated with the completed qualification/learning.
3.3 Defining the returns to higher education qualifications
The fundamental objective of the analysis of the impact of the University of Oxford’s teaching and learning activities is to estimate the net graduate premium to the individual and the net public purse benefit to the Exchequer associated with higher education qualification attainment, defined as follows:
The gross graduate premium associated with qualification attainment is defined as the present value of enhanced after-tax earnings (i.e. after income tax, National Insurance and VAT are removed, and following the deduction of any foregone earnings) relative to an individual in possession of the counterfactual qualification.
The gross benefit to the public purse is defined as the present value of enhanced taxation (i.e. income tax, National Insurance and VAT, following the deduction of the costs of foregone tax earnings) relative to an individual in possession of the counterfactual qualification.
The net graduate premium is defined as the gross graduate premium minus the present value of the direct costs associated with qualification attainment.
Similarly, the net benefit to the public purse is defined as the gross public purse benefit minus the direct Exchequer costs of provision during the period of attainment.

London Economics The economic impact of the University of Oxford 35
3 | The impact of the University of Oxford’s teaching and learning activities
The specific components of the analysis are presented in Figure 18.
Figure 18 Overview of gross and net graduate premium, and gross and net Exchequer benefit
Source: London Economics’ analysis based on Department for Business, Innovation and Skills (2011a)
3.4 Estimating the returns to higher education qualifications
3.4.1 Estimating the gross graduate premium and gross public purse benefit
To measure the economic benefits to higher education qualifications, we estimate the labour market value associated with particular education qualifications, rather than simply assessing the labour market outcomes achieved by individuals in possession of a higher education qualification. The standard approach to estimating this labour market value is to undertake an econometric analysis where the ‘treatment’ group consists of those individuals in possession of the qualification of interest, and the ‘counterfactual’ group consists of those individuals with comparable personal and socioeconomic characteristics but with the next highest level of qualification. The rationale for adopting this approach is that the comparison of the earnings and employment outcomes of the treatment group and the counterfactual group ‘strips away’ those other personal and socioeconomic characteristics that might affect labour market earnings and employment (such as gender, age, or sector of employment), leaving just the labour market gains attributable to the qualification itself (see Figure 19 for an illustration of this). The treatment and counterfactual groups, and details of the econometric approach, are presented in Annex A2.2.1 and A2.2.2, respectively.
Gross lifetime benefit
Age-earnings profile of
counterfactual
Earnings premium
Employment premium
Real earnings growth
minus
Indirect costs
Income tax, national insurance and VAT
equals Gross graduate premium
minusTuition fees
Foregone net earnings
equals
Net graduate premium
Income tax, national insurance and VAT
minus
Loan subsidies
Teaching grant fundingForegone tax
equalsNet public
benefitGross public
benefit
equals
Direct costs
Indirect costs
Direct costs
minus
Loan subsidies
Scholarships/bursaries
Grant subsidies
Grant subsidies

36 London Economics
The economic impact of the University of Oxford
3 | The impact of the University of Oxford’s teaching and learning activities
Estimating the gross graduate premium and gross Exchequer benefit
Note: The analysis assumes that the opportunity costs of foregone earnings associated with higher qualification attainment are applicable to full-time students only. For part-time students, we have assumed that these students are able to combine work with their academic studies and as such, do not incur any opportunity costs in the form of foregone earnings. This illustration is based on an analysis of the University of Oxford’s student cohort data for 2018-19, where the mean age at enrolment for full-time first degree students stands at 18, and we have assumed that a full-time first degree requires 3 years to complete. Source: London Economics
Throughout the analysis, the assessment of earnings and employment outcomes associated with higher education qualification attainment (at all levels) is undertaken separately by gender, reflecting the different labour market outcomes between men and women. Further, the analysis is undertaken by subject to illustrate the fact that there is significant variation in post-graduation labour market outcomes depending on the subject of study, but also to reflect the specific subject composition of students studying at the University of Oxford. In addition, given the fact that part-time students generally undertake and complete higher education qualifications later in life than full-time students, the analysis for part-time students applies a ‘decay function’ to the returns associated with qualification attainment, to reflect the shorter period of time in the labour market72.
To estimate the gross graduate premium, based on the econometric results, we then estimate the present value of the enhanced post-tax earnings of individuals in possession of different higher education qualifications (i.e. after income tax, National Insurance and VAT are removed, and following the deduction
72 See Annex A2.2.3 for more information.
Age
Direct costs (tuition fee minus student support and bursaries)
Indirect costs (foregone earnings)
After-tax earnings associated with a first
degree
Annual earnings premium
Costs/Earnings
21
Before-tax earnings associated with a first
degree
Annual enhanced
tax
Gross graduate premium
Gross Exchequer benefit
Age earnings associated with counterfactual level of of qualification (e.g. 2 or more GCE ‘A’ Levels)
Econometric analysis to generate earnings and
employment boosts
18

London Economics The economic impact of the University of Oxford 37
3 | The impact of the University of Oxford’s teaching and learning activities
of foregone earnings) relative to an individual in possession of the counterfactual qualification (see Annex A2.2.4 for more detail73).
The gross benefits to the Exchequer from the provision of higher education are derived from the enhanced taxation receipts that are associated with a higher likelihood of being employed, as well as the enhanced earnings associated with more highly skilled and productive employees. Based on the analysis of the lifetime earnings and employment benefits associated with higher education qualification attainment, and combined with administrative information on the relevant taxation rates and bands (from HM Revenue and Customs), we estimated the present value of additional income tax, National Insurance and VAT associated with higher education qualification attainment (by gender, level of study, mode of study, and prior attainment). Again, please refer to Annex A2.2.4 for more detailed information on the calculation of the gross Exchequer benefit.
3.4.2 Estimating the net graduate premium and net public purse benefit
The difference between the gross and net graduate premium relates to students’ direct costs of qualification acquisition74. These direct costs refer to the proportion of the tuition fee paid by the student75 net of any tuition fee support or maintenance support provided by the Student Loans Company (SLC, for students from England and Wales and Northern Ireland) or the Students Awards Agency for Scotland (SAAS, for students from Scotland)76 and minus any fee waivers or bursaries provided by the University of Oxford itself77. In this respect, the student benefit associated with tuition fee loan or
73 In terms of prior attainment, for 150 students in the 2018-19 cohort of UK domiciled students, previous attainment levels were specified as either ‘Mature student admitted on basis of previous experience and/or admissions test ‘, ‘Other qualification level not known’, or ‘Not known’. For these students, we imputed their prior attainment level using a group-wise imputation approach based on the most common prior attainment among students undertaking qualifications at the same level, separately by study mode. 74 Note again that the indirect costs associated with qualification attainment, in terms of the foregone earnings during the period of study (for full-time students only), are already deducted from the gross graduate premium. 75 We made use of information provided by the University of Oxford on the average tuition fees charged to students at the University in the 2018-19 academic year, separately by domicile, study mode, and study level (with data provided for all undergraduate students combined, postgraduate (taught) students, and postgraduate (research) students (and we assume that students undertaking learning at ‘other postgraduate’ level are included in the postgraduate (taught) category)). To ensure that the estimated fees for part-time students accurately reflect the average study intensity amongst part-time students in the 2018-19 cohort, the fees per part-time student were calculated by multiplying the respective full-time rates by the ratio of the average study intensity amongst part-time students relative to full-time students in the cohort. The average study intensity was calculated based on HESA data provided by the University of Oxford relating to its 2018-19 cohort of students, where we divided the number of students in the cohort (in FTE terms) by the corresponding number of students (headcount terms), separately by study mode, study level (undergraduate (combined), higher degree (taught), higher degree (research), and students at ‘other postgraduate level’). 76 The analysis makes use of average levels of support paid per student, separately by study mode, study level (i.e. undergraduate, higher degree (taught) and higher degree (research) (and we assume that no funding is available for students undertaking qualifications at ‘other postgraduate’ level)), and domicile. Our estimates are based on publications by the SLC on student support for higher education in England, Wales, and Northern Ireland in 2018-19 (see Student Loans Company 2019a, 2019b and 2019c, respectively) and a publication by the Student Awards Agency for Scotland on student support for higher education in Scotland (see Student Awards Agency for Scotland, 2019). To ensure comparability across the different Home Nations, we focus only on core student support in terms of tuition fee grants, tuition fee loans, maintenance grants and maintenance loans (where applicable), but exclude any Disabled Students’ Allowance and other targeted support. Wherever possible, we focus on the average level of support for students in public providers only, for the most recent cohorts possible, split by domicile (i.e. ‘Home’ vs. EU). Furthermore, and again wherever possible, we adjusted the average levels of fee and maintenance loans for average loan take-up rates available from the same sources. In addition, the assumed average fee loan per student has been capped at the level of tuition fee charged per University of Oxford student in 2018-19 (see Footnote 75). 77 Average fee waivers and other bursaries per student were calculated based on information provided by the University of Oxford on the total amount of scholarships, fee waivers and other bursaries provided to students by the University in 2018-19, by domicile (i.e. UK, EU and non-EU students) and level of study. The majority of the information was not split out by study mode; therefore, for simplicity, any funding that was not split by study mode was assumed to apply to full-time students only, and any (relatively small) amounts of funding explicitly associated with part-time students was excluded from the analysis. The information on total funding was then combined with HESA data provided by the University of Oxford in terms of the total number of full-time students enrolled with the University in 2018-19 (again by domicile and level), to arrive at an estimate of the average fee waiver/bursary funding per (full-time) student per year, by level and domicile. Note that, due to the devolved nature of the University, it was not possible to include bursary information from the University’s divisions, departments, colleges, or other external funding partners. As a result, the estimates are based exclusively on centrally available data within the University of Oxford.

38 London Economics
The economic impact of the University of Oxford
3 | The impact of the University of Oxford’s teaching and learning activities
maintenance loan support equals the Resource Accounting and Budgeting charge (RAB charge)78, capturing the proportion of the loan that is not repaid. Given the differing approach to public support funding for students from each of the UK Home Nations, the direct costs incurred by students were assessed separately for students from England, Wales, Scotland, and Northern Ireland 79.
The direct costs80 to the public purse include the teaching grant funding administered by the Office for Students (OfS)81, the student support provided in the form of maintenance/fee grants (where applicable), and the interest rate or write-off subsidies that are associated with maintenance and tuition fee loans (i.e. the RAB charge). Again, the analysis tailors the cost of student support to the student’s specific Home Nation of domicile.
These direct costs associated with qualification attainment to both students and the Exchequer (by qualification level, study mode and Home Nation domicile) are calculated from start to completion of a student’s learning aim. Throughout the analysis, to ensure that the economic impacts are computed in present value terms (i.e. in 2018-19 money terms), all benefits and costs occurring at points in the future were discounted using the standard HM Treasury Green Book real discount rate of 3.5% (see HM Treasury, 2018).
Deducting the resulting individual and Exchequer costs from the estimated gross graduate premium and gross public purse benefit, respectively, we arrive at the estimated net graduate premium and net public purse benefit per student.
78 For undergraduate full-time students, we have assumed a RAB charge of 53% associated with tuition fee and maintenance loans for English domiciled students (based on data published by the Department for Education (2020)), approximately 40% for Welsh domiciled students (based on information provided by the Welsh Government), 31% for Scottish domiciled students (see Audit Scotland (2020)), 31% for Northern Irish students (assumed to be the same as for Scotland given the similar loan balance) and 53% for EU students (assumed to be the same as for English domiciled students). For undergraduate part-time students, based on the same sources, we have assumed a RAB charge of 45% for English domiciled students, approximately 35-40% for Welsh domiciled students, 0% for Northern Irish domiciled students (given that these students have a very small loan balance) and 45% for EU domiciled students (again, assumed to be the same as for English domiciled students). There is currently no student loan funding provided to Scottish domiciled undergraduate part-time students (so no RAB charge assumptions are required). For the (relatively recently introduced) loans for postgraduate taught students from England and Northern Ireland (and for EU students studying in England), we have assumed a RAB charge of 0% for both full-time and part-time students (based on the Department for Education’s (2020) student loan forecasts for Master’s loans for English students). For Welsh students, we have assumed a RAB charge of approximately 10-15%. There were no postgraduate loans available for Scottish students studying outside Scotland. Finally, for (full-time and part-time) postgraduate research students from England and the EU, we assumed a RAB charge of 42% (again based on based on Department for Education (2020)). For Welsh postgraduate research students, we assumed a RAB charge of between 40-45% across both full-time and part-time students. There were no Doctorate loans available for Scottish domiciled or Northern Irish domiciled students. 79 Note that, in some instances, the total financial support provided to students (through tuition fee loans and grants, maintenance loans and grants, and fee waivers/other bursaries (where applicable)) exceeds the costs of their University of Oxford tuition fees – i.e. the net graduate premium exceeds the gross graduate premium per student. For example, this is the case for English and Welsh domiciled students undertaking part-time other undergraduate qualifications at the University of Oxford in 2018-19, which is driven by the maintenance funding received by these students (in terms of loans for English domiciled students, and grants for Welsh domiciled students). This results in the net graduate premium being (slightly) higher than the gross graduate premium (see the results presented in Table 26 and Table 27 in Annex A2.2.5). 80 Again, any indirect costs to the public purse in terms of foregone income tax, National Insurance and VAT receipts foregone during the period of qualification attainment (applicable to full-time students only) are already incorporated in the gross public purse benefits as described above. 81 This is based on published HESA financial information on the total OfS recurrent teaching grant received by the University of Oxford in 2018-19 (see HESA, 2020a), divided by the total number of students enrolled with the University in 2018-19 (excluding any non-EU-domiciled students and higher degree (research) students (i.e. it is assumed that there is no teaching funding associated with these students). We again adjusted for the average assumed study intensity among full-time and part-time students, to arrive at separate rates of teaching grant funding by study mode.

London Economics The economic impact of the University of Oxford 39
3 | The impact of the University of Oxford’s teaching and learning activities
3.5 Estimated net graduate premium and public purse benefit
Table 13 presents the net graduate premiums and net Exchequer benefits achieved by English domiciled students82 undertaking qualifications at the University of Oxford in the 2018-19 cohort (by study mode, on average across men and women83).
The analysis indicates that the net graduate premium achieved by a representative84 student from England in the 2018-19 cohort completing a full-time first degree at the University of Oxford (with GCE ‘A’ Levels as their highest level of prior attainment) is approximately £72,000 in today’s money terms.85 At postgraduate level, the net (post)graduate premiums for a representative86 student completing a full-time postgraduate taught or postgraduate research degree at the University of Oxford (relative to a first degree) stand at approximately £23,000 and £35,000, respectively87.
Net graduate premium and net Exchequer benefit per English domiciled student at the University of Oxford, by study level and mode
Level of study Net graduate premium Net public purse benefit
Full-time students Part-time students Full-time students Part-time students Other undergraduate1 -£10,000 £7,000 -£10,000 -£2,000 First degree1 £72,000 £58,000 Other postgraduate2 £34,000 £25,000 £50,000 £29,000 Higher degree (taught)2 £23,000 £29,000 £40,000 £38,000 Higher degree (research)2 £35,000 £16,000 £92,000 £38,000
Note: All estimates constitute weighted averages across men and women (weighted by the estimated number of student completers in the 2018-19 cohort) and are presented in 2018-19 prices, discounted to reflect net present values and rounded to the nearest £1,000. Gaps may arise where there are no students in the 2018-19 University of Oxford cohort expected to complete the given qualification (of the given characteristics). 1 Net graduate premiums and net public purse benefits associated with qualifications at ‘other undergraduate’ and first degree level are estimated relative to possession of GCE ‘A’ Levels. 2 Net graduate premiums and net public purse benefits associated with qualifications at ‘other postgraduate’, higher degree (taught) and higher degree (research) level are estimated relative to the possession of first degrees. Source: London Economics’ analysis
82 The full set of net graduate premiums and net Exchequer benefits for all domiciles (as well as study levels, study modes, and prior attainment levels) is presented in Annex A2.2.5. 83 For a breakdown of the results by gender, again see Annex A2.2.5. 84 The analysis is based on an average age at graduation of 21 for students undertaking full-time first degrees at the University of Oxford in the 2018-19 cohort (also see Annex A2.2.3 for further information). 85 Despite the significant differences in higher education fees and funding arrangements across the four Home Nations of the United Kingdom, the weighted UK-wide average of the net graduate premium of graduates in possession of first degrees also stands at £72,000. 86 This is based on an average age at graduation in the 2018-19 cohort of 25 for full-time higher degree (taught) students and 29 for full-time higher degree (research) students. 87 Note that the negative estimates of the net graduate premium for full-time ‘other undergraduate’ students (relative to GCE ‘A’ Levels as their highest level of prior attainment) is driven by the fact that the estimated marginal earnings and employment returns to these qualifications – particularly for relatively young age groups - were either relatively close to or below zero (see Annex A2.2.2), and would have resulted in negative lifetime returns to achieving these qualifications. As outlined in Annex A2.2.2, these negative returns were instead set to zero, since we implicitly assume that all calculated gross returns (before the deduction of any foregone earnings or other costs) can only be greater than or equal to zero (so that there can be no wage or employment penalty associated with any higher education qualification attainment). Therefore, the negative returns to full-time ‘other undergraduate’ qualifications effectively capture only the direct and indirect costs associated with the attainment of these qualifications. Note that this only applies to relatively few students, as there is only a very small proportion of students (less than 1%) in the 2018-19 University of Oxford cohort expected to complete full-time ‘other undergraduate’ learning.
The net graduate premium for a representative full-time first degree student from England stands at
£72,000.

40 London Economics
The economic impact of the University of Oxford
3 | The impact of the University of Oxford’s teaching and learning activities
There are also substantial net graduate premiums for part-time students. For instance, the estimate for a representative student completing a part-time postgraduate taught degree (again relative to a first degree) stands at approximately £29,000 (compared to £23,000 for full-time students), while the estimate for part-time postgraduate research degrees stands at £16,000 (compared to £35,000 for full-time students). The fact that part-time students tend to complete their studies later in life88 (resulting in fewer years spent in the labour market post-graduation) results in a reduction in the net graduate premiums for part-time students
compared to full-time students. However, it is assumed that part-time students are able to combine work with their academic studies and thus do not incur any opportunity costs in the form of foregone earnings, which results in increased net graduate premiums relative to full-time students. Depending on which of these effects dominates, the net graduate premiums for part-time students can be either lower or higher than the net graduate premiums achieved by full-time students.
In terms of the benefits to the public purse, the net Exchequer benefit for a representative full-time first degree student from England (again with GCE ‘A’ levels as their highest level of prior attainment) stands at approximately £58,000 in 2018-19 money terms.89 At postgraduate level, the net Exchequer benefits for a representative student completing a full-time postgraduate taught or postgraduate research degree (relative to a first degree) were estimated at approximately £40,000 and £92,00090, respectively.
Again, there are also substantial net Exchequer benefits associated with part-time students. For instance, the net Exchequer benefits for a representative part-time student from England undertaking a postgraduate taught degree or postgraduate research degree (relative to a first degree) stand at approximately £38,000 (respectively).
3.6 Total impact of the University’s teaching and learning activities
Combining the information on the number of UK domiciled students in the 2018-19 University of Oxford cohort, expected completion rates, and the net graduate and public purse benefits associated with the different qualification levels (relative to students’ specific prior attainment), the analysis estimates that the aggregate economic benefit of the University of Oxford’s teaching and learning activities associated with the 2018-19 cohort in the UK stands at approximately £422 million.
This total impact is split approximately equally between students and the Exchequer, with £213 million (51%) of the economic benefit accrued by students undertaking qualifications at the University of Oxford, and the remaining £209 million (49%) accrued by the Exchequer. In terms of study level, 76% (£319 million) of the estimated economic impact is generated by the University’s undergraduate students, with the remaining 24% (£103 million) generated by the University’s postgraduate students. In terms of domicile, 94% (£397 million) of the
88 Again, see Annex A2.2.3 for more information. 89 For information, the weighted average of the net Exchequer benefit across both male and female first degree holders also stands at £58,000. 90 Compared to corresponding net graduate premium for postgraduate research degree students (£35,000), the relatively large net Exchequer benefit (£92,000) reflects the limited direct costs (in terms of public funding) and low indirect costs (in terms of foregone taxation during study) associated with these qualifications.
The total economic impact of teaching and learning
generated by the 2018-19 cohort of University of
Oxford students stands at £422 million.
The net public purse benefit associated with a representative full-time
first degree student from England stands at
£58,000.

London Economics The economic impact of the University of Oxford 41
3 | The impact of the University of Oxford’s teaching and learning activities
estimated economic benefit is associated with students from England, while the remaining 6% (£25 million) is generated by students from other Home Nations.
Aggregate impact of the University of Oxford’s teaching and learning activities associated with the 2018-19 cohort (£m), by type of impact, domicile, and level of study
Beneficiary and study level
Domicile
England Wales Scotland Northern Ireland Total
Students £201m £6m £4m £2m £213m Undergraduate £178m £5m £3m £1m £188m Postgraduate £23m £0m £1m £1m £25m Exchequer £196m £4m £6m £2m £209m Undergraduate £123m £3m £3m £1m £131m Postgraduate £73m £1m £3m £1m £78m Total £397m £10m £10m £4m £422m Undergraduate £301m £8m £7m £3m £319m Postgraduate £96m £2m £4m £2m £103m
Note: All estimates are presented in 2018-19 prices, discounted to reflect net present values, rounded to the nearest £1m, and may not add up precisely to the totals indicated. Source: London Economics’ analysis
It is important to emphasise that these impacts are associated with the 2018-19 cohort of students only. Depending on the size and composition of subsequent cohorts of University of Oxford students, a comparable estimate of the economic impact associated with teaching and learning activities would be associated with each successive cohort of starters (depending on the prevailing labour market conditions at the time).

42 London Economics
The economic impact of the University of Oxford
Tackling climate change by researching routes to greenhouse gas removal
The 2015 Paris Agreement of the UN Framework Convention on Climate Change aims to pursue efforts to keep temperatures at no more than 1.5°C above pre-industrial times. Meeting these ambitions will require not just extensive cuts to emissions, but also the active removal of greenhouse gases from the atmosphere, and their storage. This process is called greenhouse gas removal (GGR).
Since 2003, researchers at the University of Oxford have been conducting research on approaches to greenhouse gas removal from the atmosphere. The research, led by Professor Gideon Henderson and involving a number of other researchers, included a (2018) Royal Society publication91 which analysed the potential risks of a suite of GGR approaches (including methods such as enhancing mineral weathering, growing forests, and direct capture of CO2 from the air - all aimed at counteracting hard-to-cut emissions from heavy industry, agriculture, and aviation). The study developed the first quantitative assessment of the GGR potential for the United Kingdom and demonstrated that there was potential to balance residual mid-century emissions and therefore achieve net zero greenhouse gas emissions in the UK.
The research also directly informed the consideration of GGR and emission targets by the UK Committee on Climate Change. As part of its Net Zero – The UKs contribution to stopping global warming report (published in May 2019)92, the Committee recommended a 2050 net zero target to the UK Government, which was accepted and signed into law in June 2019. The University’s research has also led to the development of government work on GGR policy, governmental funding of significant further GGR research to inform that policy, and an increased public and international recognition of the necessity of GGR to achieve net zero emissions and avoid dangerous climate change.
More recently, in May 2021, the Royal Society report’s recommendations led UK Research and Innovation (UKRI) to invest £31.5 million in five interdisciplinary demonstrator projects across the country and a central hub located at the University of Oxford to investigate the viability of five innovative methods of large-scale GGR. To help the UK achieve its net zero target by 2050, the demonstrator projects aim to better understand the effectiveness, cost, and limitations of each method of large-scale GGR. Encompassing a dozen universities and with funding for nearly five years, this is the UK Government’s largest-ever research programme to understand and scale-up GGR techniques. The programme is part of the second wave of the Government’s Strategic Priorities Fund, which invests in high quality multi and interdisciplinary research. The central directorate hub, located at the University of Oxford and led by Professor Cameron Hepburn, will coordinate the national programme, undertake critical research, and liaise with demonstrators, business, and policymakers to evaluate different approaches to GGR.
91 See The Royal Society (2018). 92 See Committee on Climate Change (2019).
© 135pixels/Shutterstock.com

London Economics The economic impact of the University of Oxford 43
4 | The impact of the University of Oxford’s educational exports
4 The impact of the University of Oxford’s educational exports
Box 3 Key findings: Educational exports
With the University of Oxford attracting many international students, the University’s higher education offer represents a tradeable activity with imports and exports like any other tradeable sector. In particular, there were 4,345 non-UK domiciled students who started qualifications (or modules/stand-alone credits) at the University of Oxford in the 2018-19 academic year. Of these students, 1,145 (26%) were EU domiciled, and 3,200 (74%) were from non-EU countries.
The economic impact of the University of Oxford’s contribution to educational exports is based on the direct injection of tuition fee and non-tuition fee income from the University’s international students. This income generates indirect and induced impacts throughout the UK economy, through supply chain and wage income effects.
Combining the estimates of tuition fee income (net of any Exchequer or University costs) and non-tuition fee income associated with international students in the 2018-19 cohort, the total direct impact on the UK economy generated by this cohort stood at £248 million. Approximately half of this income (£125 million) was generated from international students’ non-tuition fee spending, while the other half (£123 million) was generated from international students’ (net) tuition fees accrued by the University of Oxford.
Using relevant economic multipliers, the total direct, indirect, and induced economic impact was estimated to be £732 million. Of this total, £393 million was associated with international students’ (net) tuition fees, and £340 million was associated with these students’ non-tuition fee expenditures over the duration of their studies at the University of Oxford.
With the United Kingdom being an attractive destination for many overseas students, the higher education sector is a tradeable industry with imports and exports like any other tradeable sector.
In this part of the analysis, we focus on the impact of educational exports and the associated injection of overseas funding into the UK generated by the University of Oxford. In particular, we analyse overseas income in the form of tuition fee spending (net of any Exchequer costs) and non-tuition fee (off-campus) expenditures by international (EU and non-EU domiciled) students in the 2018-19 cohort of University of Oxford students, over the entire course of their studies93. In addition to generating direct revenues for the University and local businesses supplying consumer goods and services, as with the impact of the University’s knowledge exchange activities (Section 2.2), the expenditures of the University itself (Section 5), and the tourism expenditure associated with the University’s activities (Section 6), international students’ spending generates indirect and induced impacts throughout the UK economy, through supply chain effects and by generating wage income within the supplying industries. For example, the non-tuition fee (i.e. living cost) expenditures of international students studying at the University of Oxford on consumer goods and services generate revenues for local businesses producing these goods and services, which these businesses in turn spend on inputs (including labour) to meet students’ demands. Again, this
93 Note that other types of export income accrued directly by the University (such as research income from international sources, or any other income received from non-UK sources) are taken account of in our analysis of the impact of the University’s research activity (Section 2) and the impact of the expenditures of the University and its colleges (Section 5), and are thus excluded from the analysis of exports to avoid double-counting.

44 London Economics
The economic impact of the University of Oxford
4 | The impact of the University of Oxford’s educational exports
leads to subsequent rounds of wage income spending, i.e. a ‘ripple effect’ throughout the economy as a whole94.
4.1 The 2018-19 cohort of non-UK domiciled students studying at the University of Oxford
Figure 20, Figure 21 and Figure 22 present information on the number of non-UK domiciled students included in the 2018-19 cohort of University of Oxford students (by domicile, mode of study, and level of study, respectively).
In terms of domicile (Figure 20), of the total of 4,345 international students starting higher education qualifications at the University of Oxford in 2018-19, 1,145 (26%) were domiciled within the European Union, while 3,200 (74%) were from non-EU countries. In terms of study mode, the majority of international students in the cohort (3,500, 81%) were undertaking their qualifications on a full-time basis (see Figure 21), with the remaining 845 (19%) studying on a part-time basis.
In terms of study level (Figure 22), in contrast to UK domiciled students (see Section 3.1), the majority of non-UK domiciled students in the cohort were undertaking postgraduate qualifications (3,375, 78%), including 2,135 (49%) enrolled in postgraduate taught degrees, 905 students (21%) undertaking postgraduate research degrees, and 335 (8%) undertaking other postgraduate learning. At undergraduate level, there were 745 (17%) students undertaking first degrees, while the remaining 225 (5%) students were enrolled in other undergraduate learning95.
Non-UK domiciled students in the 2018-19 cohort of University of Oxford students, by domicile
Non-UK domiciled students in the 2018-19 cohort of University of Oxford students, by study mode
Note: All numbers are rounded to the nearest 5, and the total values may not add up precisely due to this rounding. Source: London Economics’ analysis based on the University of Oxford’s HESA data
Note: All numbers are rounded to the nearest 5, and the total values may not add up precisely due to this rounding. Source: London Economics’ analysis based on the University of Oxford’s HESA data
94 Our analysis excludes any similar direct, indirect, and induced effects associated with the non-fee expenditures of UK domiciled students. In this respect, we (conservatively) assume that these expenditures are not additional to the UK economy (i.e. that they would likely have occurred even if these students had not enrolled with the University of Oxford). The economic impact associated with UK students’ tuition fee expenditures is instead (implicitly) included in the estimated direct, indirect, and induced impacts associated with the University of Oxford’s own expenditures (see Section 5). 95 For more detailed information on the University’s 2018-19 cohort of non-UK domiciled students, please refer to Annex A2.3.1.
1,145
3,200
4,345
0500
1,0001,5002,0002,5003,0003,5004,0004,5005,000
EU Non-EU Total
# of
firs
t-ye
ar st
uden
ts, 2
018-
19
3,500
845
4,345
0500
1,0001,5002,0002,5003,0003,5004,0004,5005,000
Full-time Part-time Total
# of
firs
t-ye
ar st
uden
ts, 2
018-
19

London Economics The economic impact of the University of Oxford 45
4 | The impact of the University of Oxford’s educational exports
Non-UK domiciled students in the 2018-19 cohort of University of Oxford students, by level of study
Note: All numbers are rounded to the nearest 5, and the total values may not add up precisely due to this rounding. Source: London Economics’ analysis based on the University of Oxford’s HESA data
4.2 Direct economic impact
4.2.1 Net tuition fee income
To assess the level of gross tuition fee income associated with international students in the 2018-19 cohort, we made use of data on average tuition fees charged by the University of Oxford in 2018-19 (by qualification level, study mode and domicile96). Assuming the same average study durations as in the analysis of the impact of the University’s teaching and learning activities (Section 3), we calculated the resulting tuition fee income per international student in the cohort from the start of a student’s learning aim until completion. Expressing the total income until completion in 2018-19 prices, and using the HM Treasury Green Book real discount rate of 3.5% (see HM Treasury, 2018), we arrived at an estimate of the gross tuition fee income per student (in present value terms over the total study duration).
To calculate the net tuition fee income per student, we then deducted the costs to the UK Exchequer associated with funding higher education for EU domiciled students studying in England97. These Exchequer costs include the subsidies associated with the tuition fee support provided by the Student Loans Company, in terms of:
The RAB charge on tuition fee loans provided to eligible EU domiciled full-time and part-time undergraduate students;
96 As in the analysis of the University’s teaching and learning activities (see Section 3), we used information provided by the University of Oxford on average gross tuition fees (before any discounts or fee waivers) charged to students studying at the University in 2018-19, separately by domicile (i.e. UK, EU, and non-EU students), study mode, and study level (with data provided for all undergraduate students combined, as well as for postgraduate taught and postgraduate research students (where we assume that students undertaking learning at ‘other postgraduate’ level are included in the higher degree (taught) category)). In particular, to arrive at the fees per part-time student (ensuring that the estimated fees for part-time students accurately reflect the average study intensity amongst part-time students in the 2018-19 cohort), we multiplied the respective full-time rates by the average study intensity amongst part-time students in the cohort. The average study intensity was estimated separately by qualification level, split into undergraduate students, higher degree (taught) students, higher degree (research) students, and students undertaking learning at ‘other postgraduate’ level (again based on HESA data provided by the University of Oxford). 97 Note that there is no such Exchequer funding associated with non-EU students.
225 5%
745 17%
335 8%
2,135 49%
905 21%
Other undergraduate
First degree
Other postgraduate
Higher degree (taught)
Higher degree (research)

46 London Economics
The economic impact of the University of Oxford
4 | The impact of the University of Oxford’s educational exports
The RAB charge on Master’s and Doctorate loans provided to eligible EU full-time and part-time postgraduate students; and
The recurrent teaching grant funding paid to the University in relation to the provision of teaching to EU domiciled students (by the Office for Students)98.
In addition to these public purse costs, we also deducted any fee waivers and bursaries paid to international students by the University of Oxford itself99. Again, all of these costs were calculated over students’ total study duration and estimated in present value terms100.
Combining the estimates per student with information on the number of non-UK students in the 2018-19 cohort, and using the same assumptions on completion rates as for UK domiciled students (as part of the analysis of the impact of formal teaching and learning (see Section 3)), we arrived at estimates of the total net tuition fee income generated from EU and non-EU students in the 2018-19 cohort of University of Oxford students. As presented in Figure 23, the total net tuition fee income generated by international students in the cohort was estimated at £123 million, of which £11 million was generated by EU students, and £111 million was generated by non-EU students.
Aggregate net tuition fee income associated with international students in the 2018-19 cohort, by domicile (£m)
Note: All estimates are presented in 2018-19 prices, discounted to reflect net present values, and rounded to the nearest £1m. Values may not add up precisely to the totals due to rounding. Source: London Economics’ analysis
4.2.2 Non-tuition fee income
In addition to tuition fees, the UK economy benefits from export income from overseas students’ non-tuition fee (i.e. personal living cost) expenditures incurred during their studies at the University of Oxford, including:
Accommodation costs (e.g. rent costs, council tax, household bills etc.); Subsistence costs (e.g. food, entertainment, personal items, non-course travel etc.); Direct course costs (e.g. course-related books, subscriptions, computers etc.); Facilitation costs (e.g. course-related travel costs); and Spending on children (including childcare that is not related to students’ course participation).
98 For more information on our assumptions in relation to public student support and recurrent teaching grants, please refer to Section 3.4.2. 99 Again, see Section 3.4.2 for more information on our assumptions in relation to fee waivers and bursaries. 100 For information on the estimated levels of net fee income per student, please refer to Annex A2.3.2.
£11m
£111m
£123m
£0m £20m £40m £60m £80m £100m £120m £140m
EU
Non-EU
Total
£m, 2018-19 prices

London Economics The economic impact of the University of Oxford 47
4 | The impact of the University of Oxford’s educational exports
The level of non-tuition fee expenditure by overseas students is often found to be greater than the direct tuition fee expenditure101, making these living cost expenditures a significant component of the UK’s export income from international students coming to study at UK higher education institutions.
To analyse the level of non-tuition fee expenditure associated with the 2018-19 cohort of international students studying at the University of Oxford, we used estimates from the 2014-15 Student Income and Expenditure Survey (SIES)102. The survey provides estimates of the average expenditure by English domiciled undergraduate students (studying in England or Wales) on living costs, housing costs, participation costs (including tuition fees) and spending on children – separately for full-time and part-time students. For the purpose of this analysis, we made the following adjustments to the 2014-15 SIES estimates:
We excluded estimates of tuition fee expenditure (to avoid double-counting with the analysis presented in Section 4.2.1);
We deducted any on-campus expenditure that students might incur, to avoid double-counting with the analysis of the impacts of the expenditure of the University itself (see Section 5)103;
Since the SIES results do not provide expenditure estimates for non-UK domiciled students, our analysis implicitly assumes that non-tuition fee expenditure levels do not vary significantly between UK and international students. We do however adjust the SIES estimates for the longer average stay durations in the UK of non-EU students compared to EU students104;
We further adjusted the estimates for any foregone subsistence cost expenditures in the UK due to international students returning to their home countries during the Covid-19 pandemic (and the suspension of in-person teaching across UK universities). Specifically, we assume that 50% of full-time students in the 2018-19 cohort returned home during the third (i.e. final) term of the 2019-20 academic year, and that 50% of full-time students in the cohort returned home during the second and third terms of the 2020-21 academic year105, 106. We assume that, during this time, these students did not incur any subsistence expenditure in the UK (e.g. food, entertainment, etc.), but still incurred all other types of non-fee spending in the UK listed above (e.g. we assume that these students were still liable to pay any accommodation costs in the UK); and
Finally, we inflated the estimates to 2018-19 prices107.
Similar to the estimates relating to tuition fee expenditure, we then calculated the non-tuition fee expenditure over the entire duration of students’ higher education courses (and discounted to reflect present values). The resulting estimates provide the total average (off-campus) non-tuition fee expenditure per student in 2018-19 prices, by level of study, mode, and domicile108.
101 See Department for Business, Innovation and Skills (2011b). 102 See Institute for Employment Studies & National Centre for Social Research (2018). Note that, at the time of writing, estimates for a more recent academic year were not available. 103 Specifically, following the approach undertaken by Oxford Economics (2017) in analysing the collective economic impact of all UK higher education institutions in 2014-15, we assume that 10% of students’ non-tuition fee expenditures are spent on campus (i.e. are accrued as income by the University of Oxford itself). 104 These adjustments are based on the approach outlined by the Department for Business, Innovation and Skills (2011b) in estimating the value of educational exports to the UK economy. For more information, please refer to Annex A2.3.3. 105 In other words, we assume that due to the Covid-19 pandemic, the subsistence expenditures of full-time international students in the 2018-19 cohort were 17% lower in 2019-20 (i.e. 50% x 33%), and 33% lower in 2020-21 (i.e. 50% x 67%) than would otherwise have been the case. 106 We assume that international part-time students in the cohort did not leave the UK due to the pandemic, given that part-time students typically combine their studies with work in the labour market. In addition, any full-time students with an assumed one-year study duration (including postgraduate taught degrees, ‘other postgraduate’ qualifications, and ‘other undergraduate’ qualifications) are not affected by these assumptions (since they are assumed to have completed their studies in the 2018-19 academic year). As a result, the majority of students in the 2018-19 cohort of University of Oxford students are not impacted by these Covid-19 adjustments. 107 Inflation estimates are based on Consumer Price Index inflation estimates provided by the Office for National Statistics (2021). 108 For information on the estimated levels of non-tuition fee income per student, please refer to Annex A2.3.4.

48 London Economics
The economic impact of the University of Oxford
4 | The impact of the University of Oxford’s educational exports
Again combining the estimated non-tuition fee income per student with the number of international students in the 2018-19 cohort expected to complete qualifications (or achieve credits) at the University of Oxford, the total (off-campus) non-tuition fee expenditure associated with international students in the 2018-19 cohort was estimated at £125 million (Figure 24). £35 million of this income was associated with EU students and the remaining £90 million was generated by non-EU students in the cohort.
Aggregate non- fee income associated with international students in the 2018-19 cohort, by domicile (£m)
Note: All estimates are presented in 2018-19 prices, discounted to reflect net present values, and rounded to the nearest £1m. Values may not add up precisely to the totals due to rounding. Source: London Economics’ analysis
4.2.3 Total direct impact
Combining the above estimates of (net) fee and non-fee income, the total direct economic impact of the expenditure of international students in the 2018-19 University of Oxford cohort (in economic output terms) was estimated at £248 million (Figure 25). Approximately half of this total (£125 million) was generated from international students’ non-tuition fee spending, while the other half (£123 million) was generated from international students’ tuition fees accrued by the University of Oxford (net of any public costs of provision, or fee waivers/bursaries provided by the University). In terms of student domicile, the majority of this impact (£202 million, 81%) was generated by non-EU domiciled students, while the remaining £46 million (19%) was associated with EU domiciled students.
In addition to economic output (i.e. export income), it was possible to convert the above estimates into gross value added and the number of full-time equivalent jobs supported109. We thus estimate that the export income generated by international students in the 2018-19 University of Oxford cohort directly generates £145 million in GVA (£73 million from international (net) tuition fee income and £72 million from non-tuition fee income), and supports 2,305 full-time equivalent jobs (1,480 from (net) tuition fee income and 825 from non-tuition fee income110).
109 To estimate the direct GVA and employment associated with the (net) tuition fee income generated by the University’s international students, we multiplied this income by the average ratio of GVA to output and FTE employees to output within the South East’s government, health, and education sector as a whole (again based on the above-described multi-regional Input-Output model). This is the same approach that was applied to identify the impacts associated with the University’s IP income (see Section 2.2.1). To estimate the direct GVA and employment associated with the non-tuition fee income generated by the University’s international students, we instead multiplied this income by the average ratio of GVA to output and FTE employees to output associated with the expenditure of households located in the South East (again based on the Input-Output model). In other words, we assume that the non-tuition fee expenditures of the University’s international students support the same levels of GVA and employment (in relative/proportionate terms) as the expenditure of households located in the South East more generally. 110 The difference in direct employment supported by international students’ tuition fee vs. non-tuition fee income is driven by the fact that the underlying ratio of FTE employees to output within the South East’s government, health, and education sector is considerably larger than the corresponding ratio for sectors producing consumer goods and services purchased by households located in the South East (e.g. including the real estate or production sectors).
£35m
£90m
£125m
£0m £20m £40m £60m £80m £100m £120m £140m
EU
Non-EU
Total
£m, 2018-19 prices

London Economics The economic impact of the University of Oxford 49
4 | The impact of the University of Oxford’s educational exports
Total direct impact associated with non-UK students in the 2018-19 University of Oxford cohort, by type of impact Output, £m
GVA, £m
FTE employment
Note: All monetary estimates are presented in 2018-19 prices, discounted to reflect net present values, and rounded to the nearest £1m. All Values may not add up precisely to the totals due to rounding. The employment figures are rounded to the nearest 5. Source: London Economics’ analysis
4.3 Total economic impact associated with the University of Oxford’s educational exports
As with the impact of knowledge exchange activities, to estimate the total (direct, indirect, and induced) economic impact associated with the export income generated by international students studying at the University of Oxford, we made use of economic multipliers derived from the above-described multi-regional Input-Output model (see Section 2.2), estimating the extent to which the direct export income generates additional activity throughout the UK economy.
Specifically, we applied two types of multipliers to the above-described tuition fee and non-tuition fee income associated with international students in the 2018-19 cohort, including:
Multipliers relating to international tuition fee income (accrued by the University itself): As with the impact of the University’s IP income (see Section 2.2.1), the multipliers used to estimate the impact of the University’s international tuition fee income were calculated based on the inter-
£123m
£125m
£248m
£0m £50m £100m £150m £200m £250m £300m
Net tuition fee income
Non-tuition fee income
Total
Economic output, £m in 2018-19 prices
£73m
£72m
£145m
£0m £20m £40m £60m £80m £100m £120m £140m £160m
Net tuition fee income
Non-tuition fee income
Total
GVA, £m in 2018-19 prices
1,480
825
2,305
0 500 1,000 1,500 2,000 2,500
Net tuition fee income
Non-tuition fee income
Total
Employment, FTE

50 London Economics
The economic impact of the University of Oxford
4 | The impact of the University of Oxford’s educational exports
and intra-industry flows of goods and services for the South East’s government, health, and education sector as a whole111.
Multipliers relating to income from international students’ (off-campus) non-tuition fee expenditures: These were calculated based on the final consumption expenditure patterns of households located in the South East112, and subsequently applied to the estimated off-campus non-tuition fee expenditures of overseas students in the 2018-19 cohort of University of Oxford students.
Again, these multipliers are expressed in terms of economic output, gross value added, and (full-time equivalent) employment, and are calculated as total multipliers, capturing the aggregate impact on all industries in the UK economy arising from an initial injection relative to that initial injection.
Table 15 presents the economic multipliers applied to the income generated by international students at the University of Oxford (in terms of the impact on the South East and the UK economy as a whole)113. In terms of economic output, the analysis assumes that every £1 million of tuition fee expenditure incurred by international students generates an additional £1.71 million of impact throughout the UK economy, of which £0.71 million is generated in the South East114. In addition, we assume that every £1 million of non-fee expenditure incurred by international students generates an additional £1.72 million of impact throughout the UK, of which £0.77 million is located within the South East.
Economic multipliers associated with the income from international students in the 2018-19 cohort of University of Oxford students
Location of impact and type of income Output GVA FTE employment Tuition fee income South East 1.71 1.61 1.40 Total UK 2.71 2.51 2.06 Non- fee income South East 1.77 1.72 1.74 Total UK 2.72 2.62 2.85
Note: All multipliers constitute Type II multipliers, defined as [Direct + indirect + induced impact]/[Direct impact]. The economic multipliers associated with tuition fee income match the multipliers applied to the University’s IP income (see Table 5 in Section 2.2.1). Source: London Economics’ analysis
111 Hence, we again assume that the expenditure patterns of the University are the same as for other institutions operating in the South East’s government, health, and education sector. Specifically, we apply these multipliers to the gross tuition fee income generated by international students in the 2018-19 University of Oxford cohort, and then deduct the Exchequer/University cost of provision (i.e. public teaching grants, public student support, and University of Oxford fee waivers and bursaries) to arrive at the net direct, indirect and induced impact associated with this income. 112 In other words, for the purpose of calculating economic multipliers, we assume that international students studying at the University of Oxford have similar expenditure patterns as South East households more generally. To estimate these multipliers, we inserted a separate vector into the multi-regional Input-Output model, capturing the estimated final demand (again by industry and region) of households located in each region. 113 While the table presents the multipliers for the impacts on the South East and the UK as a whole, a full breakdown of the total impacts across all regions (as well as by sector) is provided in Figure 26. 114 Again, these are the same multipliers that are used to estimate the total impacts of the University’s IP income (see Table 5 in Section 2.2.1) (as well as the University’s and its colleges’ operational and capital expenditures (see Section 5)).

London Economics The economic impact of the University of Oxford 51
4 | The impact of the University of Oxford’s educational exports
Applying these multipliers to the above direct economic impacts115, we estimate that the total economic impact on the UK generated by the (net) tuition fee income and non-tuition fee income associated with international students in the 2018-19 University of Oxford cohort amounts to £732 million of economic output (see top panel of Figure 26):
In terms of the breakdown by type of income from international sources, £393 million of this impact was associated with international students’ (net) tuition fees, and the remaining £340 million was associated with these students’ non-tuition fee expenditures over the duration of their studies at the University of Oxford.
In terms of the breakdown by region, the majority of this impact (£470 million, 64%) was generated in the South East, with the remaining £263 million (36%) occurring in other regions across the UK.
In terms of sector, the tuition fee and non-tuition fee income generated from the University’s international students generated particularly large impacts within the government, health, and education sector (£193 million, 26%) given that the cohort’s tuition fee income is accrued as income by the University itself. In addition, there are also relatively large impacts felt within the distribution, transport, hotel, and restaurant sector (£134 million, 18%), the production sector (£102 million, 14%), and the real estate industry (£100 million, 14%)116.
The impact in terms of gross value added was estimated at £404 million across the UK economy as a whole (with £262 million generated within the South East), while the corresponding estimates in terms of employment stood at 5,850 full-time equivalent jobs across the UK as a whole, with 3,820 jobs supported across the South East.
115 Again, in terms of tuition fee income, note that we apply the relevant multipliers to the gross tuition fee income generated by international students in the 2018-19 University of Oxford cohort, and then deduct the Exchequer/University cost of provision (i.e. public teaching grants, public student support, and University of Oxford fee waivers and bursaries) to arrive at the net direct, indirect and induced impact associated with this income. 116 Again, for more detail on what industries are included in this high-level sector classification, please refer to Table 20 in Annex A2.1.
The impact of the export income generated by the
2018-19 University of Oxford cohort stood at
£732 million.

52 London Economics
The economic impact of the University of Oxford
4 | The impact of the University of Oxford’s educational exports
Total economic impact associated with international students in the 2018-19 University of Oxford cohort, by region and sector By region By sector
Note: Monetary estimates are presented in 2018-19 prices, discounted to reflect net present values, rounded to the nearest £1 million, and may not add up precisely to the totals indicated. Employment estimates are rounded to the nearest 5, and again may not add up precisely to the totals indicated. Source: London Economics’ analysis
£9m £24m £20m £20m £23m £28m
£80m £470m
£22m £11m £18m
£7m £732m
£0m £200m £400m £600m £800m
North EastNorth West
Yorkshire & the HumberEast Midlands
West MidlandsEast of England
LondonSouth East
South WestWales
ScotlandNorthern Ireland
Total
Economic output, £m
Output, £m £5m £102m
£22m £134m
£32m £50m
£100m £65m
£193m £28m
£732m
£0m £200m £400m £600m £800m
AgricultureProduction
ConstructionDistr., transport, hotels & restaurants
Information & communicationFinancial & insurance
Real estateProfessional & support activitiesGovernment, health & education
Other servicesTotal
Economic output, £m
Output, £m
£6m £13m £11m £12m £13m £16m
£35m £262m
£13m £7m £10m
£5m £404m
£0m £100m £200m £300m £400m £500m
North EastNorth West
Yorkshire & the HumberEast Midlands
West MidlandsEast of England
LondonSouth East
South WestWales
ScotlandNorthern Ireland
Total
GVA, £m
GVA, £m £2m £36m
£8m £70m
£18m £21m
£78m £37m
£115m £17m
£404m
£0m £100m £200m £300m £400m £500m
AgricultureProduction
ConstructionDistr., transport, hotels & restaurants
Information & communicationFinancial & insurance
Real estateProfessional & support activitiesGovernment, health & education
Other servicesTotal
GVA, £m
GVA, £m
100195180195200235
3603,820
200130150
855,850
0 1,000 2,000 3,000 4,000 5,000 6,000
North EastNorth West
Yorkshire & the HumberEast Midlands
West MidlandsEast of England
LondonSouth East
South WestWales
ScotlandNorthern Ireland
Total
# of full-time equivalent employees
FTE employment 85405
1001,450
190195
145765
2,285240
5,850
0 1,000 2,000 3,000 4,000 5,000 6,000
AgricultureProduction
ConstructionDistr., transport, hotels & restaurants
Information & communicationFinancial & insurance
Real estateProfessional & support activitiesGovernment, health & education
Other servicesTotal
# of full-time equivalent employees
FTE employment

London Economics The economic impact of the University of Oxford 53
Revolutionising solar power technology: Oxford PV
The market for solar photovoltaics (PV) has greatly expanded in recent years, but its contribution to world energy is still small, and the technology remains more expensive than fossil fuels. Silicon, used in the vast majority of commercial solar cells, is cheap and abundant, but it is costly and energy-intensive to produce it in the pure crystalline form required for PV. For solar power to rival fossil fuels globally, the technology needs to become even cheaper and more efficient.
Since 2009, cutting-edge research led by Professor Henry Snaith at the University of Oxford has been aiming at delivering low-cost, high-efficiency PV technology. Based on his research, in 2010, Professor Snaith co-founded Oxford PV as a spinout from the University of Oxford (and the University still holds an ownership stake in the company today). Professor Snaith’s previous academic work had already been extensively supported by the Engineering and Physical Sciences Research Council (EPSRC), and Oxford PV received early financial backing from Innovate UK to explore the commercial possibilities of low-cost and transparent solar cells.
The company uses a crystalline material called perovskite. Oxford PV initially investigated perovskite as a potential replacement for the dye in ‘dye-sensitized’ solar cells, however, in 2012, Professor Snaith and his colleagues demonstrated that perovskite was, by itself, an excellent semiconductor. This breakthrough meant that PV cells could be built with a simple stack of thin layers, with the potential to simplify the manufacturing process and increase the efficiency of solar PV cells.
Applied as a thin film layer in tandem with an active silicon cell, perovskite can boost cell output power and reach efficiency levels in excess of 30%. Typical silicon solar cells convert around 20-22% of the available solar energy into electricity. But in June 2018, Oxford PV’s perovskite-on-silicon solar cell set a world record – 27.3% certified efficiency – exceeding the highest ever performing single-junction silicon solar cell. In December 2020, the technology set another new world record, this time of 29.5% certified efficiency. In the future, perovskite could become even more efficient, as it can be ‘tuned’ to different parts of the solar spectrum. Given these improvements in efficiency and the relative abundance and low cost of the constituent materials in perovskite, these solar cells could provide a rival energy source to fossil fuels.
Originally based at Begbroke Science Park, Oxford PV is now based at Oxford Industrial Park with industrial capabilities in Brandenburg an der Havel, Germany. Having grown its team from 5 staff in 2011 to 95 in 2019, the company is the technology leader in the field of perovskite solar cells, and has the largest global team exclusively focused on developing and commercialising a perovskite-based solar technology. More importantly, having recently built the world’s first volume manufacturing line for perovskite-on-silicon tandem solar cells, in 2022, Oxford PV will be the first company to sell these next-generation solar cells to the public. These initial products, designed for residential roofs, will generate 20% more power from the same number of cells. With further development, Oxford PV believes future solar cells will be improved significantly, generating more affordable clean energy, accelerating the adoption of solar power, and addressing climate change.
©Oxford PV

54 London Economics
The economic impact of the University of Oxford
5 | The impact of the University of Oxford’s expenditures
5 The impact of the University of Oxford’s expenditures
Box 4 Key findings: Expenditure by the University and its colleges
The University of Oxford’s physical footprint supports jobs and promotes economic growth throughout the UK economy. This is captured by the direct, indirect, and induced impact associated with the expenditures of the University itself, as well as the expenditures incurred by the University’s 39 colleges and 6 permanent Private Halls.
The direct impact of the University’s physical footprint was based on the operating and capital expenditures of the University and its colleges. In 2018-19, the University of Oxford incurred a total of £2,178 million of expenditure, while the corresponding spending of the University’s colleges stood at £567 million. Hence, the total direct impact of the expenditures of the University and its colleges was estimated at £2,754 million.
The direct increase in economic activity resulting from the expenditures of the University and its colleges generates additional rounds of spending throughout the economy (through the University’s and colleges’ supply chains, and the spending of staff). Applying relevant economic multipliers, the total direct, indirect, and induced impact associated with the expenditures of the University of Oxford and its colleges in 2018-19 was estimated at £6,032 million. Of this total, £4,472 million was associated with the spending of the University of Oxford itself, while £1,561 million was generated as a result of the expenditures of the University’s colleges.
Much of the existing literature on the economic impact of higher education institutions focuses (almost exclusively) on the direct, indirect, and induced impact of universities on their local, regional, or national economies. Assessments of these impacts consider universities as economic units creating output within their local economies by purchasing products and services from their suppliers, and hiring employees. Similar to the impacts associated with the University’s knowledge exchange activities, the direct, indirect, and induced economic impacts of a university’s expenditures are defined as follows:
Direct effect: This considers the economic output generated by the university itself, by purchasing goods and services (including labour) from the economy in which it operates.
Indirect effect: The university’s purchases generate income for the supplying industries, which they in turn spend on their own purchases from suppliers to meet the university’s demands. This again results in a chain reaction of subsequent rounds of spending across industries, i.e. a ‘ripple effect’.
Induced effect: The employees of the university and of businesses operating in the university’s supply chain use their wages to buy consumer goods and services within the economy. This in turn generates wage income for employees within the industries producing these goods and services, who then spend their own income on goods and services – leading to a further ‘ripple effect’ throughout the economy as a whole.
In this section, we outline our estimates of the direct, indirect, and induced impacts associated with the operational and capital expenditures of the University of Oxford itself, as well as the expenditures

London Economics The economic impact of the University of Oxford 55
5 | The impact of the University of Oxford’s expenditures
incurred by the University’s 39 colleges and 6 permanent Private Halls117. In accordance with the other strands of impact, the analysis focuses on the 2018-19 academic year. Again, these impacts can be measured in terms of economic output, gross value added, and (full-time equivalent) employment.
5.1 Direct impact of the University’s and its colleges’ expenditures
To measure the direct economic impact of the purchases of goods, services, and labour by the University of Oxford and its colleges, we used information on the University’s operational expenditures (including total staff and non-staff spending), capital expenditures, as well as the number of staff employed (in terms of full-time equivalent employees), for the 2018-19 academic year118. This was combined with separate financial and staff data for the University’s colleges119.
Based on this, in terms of monetary economic output (measured in terms of expenditure), the direct economic impact associated with the expenditures of the University of Oxford itself stood at approximately £2,178 million in 2018-19 (see Figure 27). This includes £1,051 million of staff costs, £1,043 million of other (non-staff) operating expenses120, and £84 million of capital expenditure incurred in that academic year. The corresponding direct impact associated with colleges’ expenditures stood at £567 million, comprised of £233 million of staff expenditure, £222 million of other operating expenses, and £121 million of capital expenditure121. Hence, the total direct impact of the expenditures of the University and its colleges was estimated at £2,754 million.
117 The accounts of 3 of the University’s colleges (including Kellogg College, St Cross College, and Parks College) and 6 permanent Private Halls are consolidated into the University’s finances (i.e. are included in the level of expenditure of the University itself), as they are departments of the University. In contrast, the University's financial statements exclude the accounts of 36 colleges that are separate and independent legal entities. 118 Based on staff and financial data published by the Higher Education Statistics Agency (see HESA (2020a) and HESA (2020c)). 119 The University provided us with information on the operational (i.e. staff and non-staff) expenditures of each college. The information on colleges’ capital expenditures and staff (including employed college trustees as well as other college employees) was extracted from each of the colleges’ published financial accounts. In this respect, note that for all colleges, the number of college trustees was only available in headcount terms (rather than FTE employees). The same applies to the information on other college employees included in several colleges’ financial statements. In all of these instances, the number of FTE staff was estimated by multiplying the corresponding headcount number by the ratio of FTE to headcount staff among the University of Oxford’s own employees (0.93, excluding atypical staff employed by the University). 120 The total operational expenditure (excluding capital expenditure) of the University of Oxford in 2018-19 stood at £2,582 million. From this, for the purposes of the analysis, we excluded £145 million in depreciation costs and £286 million in movements in pension provisions, as it is assumed that these are not relevant from a procurement perspective (i.e. these costs are not accounted for as income by other organisations). In addition, to avoid double-counting, we excluded £57 million in payments to the University’s colleges, as this would be accrued as income (and subsequently spent on goods and services) by the colleges. In total, the analysis thus excludes £488 million of operational expenditure of the University of Oxford. 121 Again, from the total operational expenditures of the University’s colleges (£512 million), we excluded £35 million in depreciation costs and £21 million in movements in pension provisions. Hence, we excluded a total of £57 million of operational expenditure incurred by the University’s colleges.

56 London Economics
The economic impact of the University of Oxford
5 | The impact of the University of Oxford’s expenditures
Figure 27 Direct economic impact (in terms of output) of the University’s and its colleges’ expenditure in 2018-19, by type of expenditure
Note: We exclude (from non-staff costs) a total of £145 million of University and £35 million of college costs associated with deprecation, and £286 million of University and £21 million of college costs associated with movements in pension provisions, as it is assumed that these are not relevant from a procurement perspective (i.e. these costs are not accounted for as income by other organisations). In addition, the University’s non-staff costs exclude £57 million in payments to colleges, to avoid double-counting. All estimates are presented in 2018-19 prices, and rounded to the nearest £1m. Source: London Economics’ analysis based on HESA (2020a) and data provided by the University of Oxford
In terms of employment, the University of Oxford directly employed 12,455 FTE staff122 in 2018-19, while the number of staff employed by its colleges stood at 6,515 FTE staff (see Figure 28). In total, there were 18,970 FTE staff employed by the University and its colleges in 2018-19.
In terms of gross value added (see Figure 29), the University’s operations direct contribution to GVA stood at £1,383 million in 2018-19, with a further £317 million generated by its colleges123. In aggregate, the University and its colleges directly contributed £1,700 million of gross value added to the UK economy in 2018-19.
Figure 28 Direct employment (in FTE) of the University and its colleges in 2018-19
Note: Staff figures for the University exclude staff on atypical contracts, and 595 staff who were jointly appointed by the University and its colleges (to avoid double-counting). Figures are rounded to the nearest 5. Source: London Economics’ analysis based on HESA (2020c) and colleges’ financial statements
122 This excludes any staff on atypical contracts employed by the University of Oxford. In addition, to again avoid double-counting, the number of staff employed by the University excludes 595 staff who were jointly appointed by the University and its colleges (as college trustees) in 2018-19. 123 The level of direct GVA generated by the University and its colleges was calculated as the sum of staff costs, surplus on operations, interest and other finance costs, and depreciation.
£1,051m
£233m
£1,284m
£1,043m
£222m
£1,265m
£84m
£121m
£205m
£2,178m
£576m
£2,754m
£0m £500m £1,000m £1,500m £2,000m £2,500m £3,000m
University
Colleges
Total
Staff costs Non-staff costs Capital expenditure Total
12,455
6,515
18,970
0 2,000 4,000 6,000 8,000 10,000 12,000 14,000 16,000 18,000 20,000
University
Colleges
Total
# of full-time equivalent employees

London Economics The economic impact of the University of Oxford 57
5 | The impact of the University of Oxford’s expenditures
Figure 29 Direct GVA generated by the University’s and its colleges’ expenditure in 2018-19
Note: All estimates are presented in 2018-19 prices, and rounded to the nearest £1m. Source: London Economics’ analysis based on HESA (2020c) and colleges’ financial statements
In addition to the above total expenditures, it is useful to investigate the geographical breakdown of the University’s procurement expenditures and staff numbers, to demonstrate the breadth of the institution’s impact across the UK124.
Figure 30 presents the distribution of the University’s procurement expenditures (based on invoice data for 2018-19) by Local Authority. The map illustrates a clear concentration of procurement expenditure in the South East (41%, particularly in Oxford itself and the Vale of White Horse) and London (12%)125. However, the University also spends significant amounts on goods and services from suppliers in other regions, including the East of England (11%, particularly South Cambridgeshire and Cambridge), the North West (10%, particularly Manchester and Stockport) and the South West (8%, particularly Bristol). Despite the concentration of expenditure in and around Oxford, this illustrates the wider geographical reach of the University’s activities, with significant levels of expenditure occurring throughout the rest of the UK.
In addition to the analysis of the University’s procurement expenditure, Figure 31 illustrates the distribution of the University’s staff (in the 2014 calendar year) by Local Authority (based on employees’ home address)126. The map shows that while the University’s staff are concentrated in areas surrounding the University (including Oxford (20%), South Oxfordshire (19%), Cherwell (16%), the Vale of the White Horse (13%), and West Oxfordshire (7%)), around 25% of the University’s staff are dispersed more widely throughout the United Kingdom.
124 Note that the analysis of the geographical breakdown of procurement expenditures and staff focuses only on the activities of the University of Oxford itself, since comparable information for its colleges was not available. 125 It is likely that the data overestimates the level of procurement expenditure occurring in London as compared to other regions, since the invoice data would reflect suppliers’ head office locations, rather than necessarily reflecting the location where these activities took place. 126 i.e. rather than the 2018-19 academic year, the detailed geographical breakdown of staff’s home addresses was provided for the 2014 calendar year instead.
£1,383m
£317m
£1,700m
£0m £500m £1,000m £1,500m £2,000m
University
Colleges
Total
GVA, £m

58 London Economics
The economic impact of the University of Oxford
5 | The impact of the University of Oxford’s expenditures
Figure 30 Distribution of the University of Oxford’s procurement expenditure in 2018-19, by Local Authority (of invoice address)
Figure 31 Distribution of the University of Oxford’s staff in 2014, by Local Authority (of home address)
Note: We received data on the invoice postcodes associated with £332 million of procurement expenditure by the University of Oxford in 2018-19. This constitutes a subset of the University’s total non-staff spend, as it excludes a range of expenditure on different activities and suppliers such as banking, insurance, taxes, and utilities. Of this total, we excluded expenditure records with missing postcodes (3 records), non-UK postcodes (2,450 records), invalid postcodes (27 records) and records with zero or negative expenditure (65 records). As a result of these exclusions, the figure is based on a total of £273 million of procurement expenditure. We used the August 2019 ONS Postcode Directory to determine the Local Authority for each postcode included in the dataset. The data was then matched with the ONS digital vector boundaries for Local Authorities as of April 2019 to generate the map. Source: London Economics’ analysis based on University of Oxford data and Office for National Statistics data. Contains National Statistics data, OS data, Royal Mail, Gridlink, LPS (Northern Ireland), ONS, NISRA data, NRS data and Ordnance Survey data © Crown copyright and database right 2021.
Note: We received data on home address postcode districts for a total of 10,407 staff (in headcount) from the University of Oxford for the 2014 calendar year. Of this total, we excluded staff records with missing postcode districts (619 records) and invalid postcode districts (11 records). The figure is thus based on the home addresses of 9,777 staff. We used the August 2019 ONS Postcode Directory to determine the Local Authority for each postcode district included in the dataset. Staff associated with postcode districts that are spread across multiple Local Authorities have been apportioned equally across them, and the data by Local Authority was then matched with the ONS digital vector boundaries for Local Authority Districts as of April 2019 to generate the map. Source: London Economics’ analysis based on University of Oxford data and Office for National Statistics data. Contains National Statistics data, OS data, Royal Mail, Gridlink, LPS (Northern Ireland), ONS, NISRA data, NRS data and Ordnance Survey data © Crown copyright and database right 2021.

London Economics The economic impact of the University of Oxford 59
5 | The impact of the University of Oxford’s expenditures
5.2 Indirect and induced impacts of the University’s and its colleges’ expenditures
As with the impact of the University’s knowledge exchange activities (Section 2.2) and the impact of the expenditures of its international students (Section 4), the assessment of the indirect and induced economic impacts associated with the operational and capital expenditures of the University of Oxford and its colleges is again based on economic multipliers derived from the multi-regional Input-Output model127. In particular, we applied the estimated average economic multipliers associated with organisations in the South East’s government, health, and education sector. This mirrors the approach used to assess the impact of the University’s IP licensing income (Section 2.2.1) and international fee income (Section 4.3), since these types of income were accrued (and subsequently spent) by the University itself. Again, this approach asserts that the spending patterns of the University of Oxford – as well as its colleges – reflect the average spending patterns across organisations operating in the South East’s government, health, and education sector.
These multipliers (for the South East and the UK as a whole128) are presented in Table 16, indicating that every £1 million of operational or capital expenditure incurred by the University of Oxford or its colleges generates an additional £1.71 million of impact throughout the UK economy, of which £0.71 million is generated in the South East129. In terms of employment, we assume that, for every 1,000 (FTE) staff employed directly by the University or its colleges, an additional 1,060 staff are supported throughout the UK, of which 400 are located in the South East.
Economic multipliers associated with the expenditures of the University and its colleges
Location of impact Output GVA FTE employment South East 1.71 1.61 1.40 Total UK 2.71 2.51 2.06
Note: All multipliers constitute Type II multipliers, defined as [Direct + indirect + induced impact]/[Direct impact]. The figures match the assumed multipliers associated with the University’s international tuition fee income (see Table 15 in Section 4.3) as well as the multipliers applied to the University’s IP income (see Table 5 in Section 2.2.1). Source: London Economics’ analysis
5.3 Adjustments for double-counting and transfers
Before arriving at the total direct, indirect, and induced impact associated with the University of Oxford’s institutional expenditure and the spending of its colleges, it is necessary to deduct a number of income and expenditure items to avoid double-counting, and to take account of the ‘netting out’ of the costs and benefits associated with the University of Oxford between different agents in the UK economy. Specifically, we deducted:
The total research income received by the University in 2018-19 (£771 million), to avoid double-counting with the estimated impact of the University’s research activities (Section 2.1);
The direct, indirect, and induced impacts associated with the University’s IP income (£216 million in economic output terms), to avoid double-counting with the impact of the University’s knowledge exchange activities (Section 2.2);
127 See Section 2.2 for more information. 128 Again, in addition to the impacts on the South East and the UK as whole, the analysis estimates a full breakdown across all regions, as well as by sector. These detailed results are presented in Section 5.4. 129 This exactly matches the assumed multipliers associated with the University’s international tuition fee (see Table 15 in Section 4.3) as well as the multipliers applied to the University’s IP income (see Table 5 in Section 2.2.1).

60 London Economics
The economic impact of the University of Oxford
5 | The impact of the University of Oxford’s expenditures
£13 million in University of Oxford fee waivers and other bursary spending for UK domiciled students130, as this was included (as a benefit) in the analysis of the University’s teaching and learning activities (Section 3); and
The direct, indirect, and induced impacts generated by the University’s (gross) international fee income associated with the 2018-19 cohort of non-UK students (£428 million131), to avoid double-counting with the impact of the University’s educational exports (Section 4).
5.4 Aggregate impact of the University of Oxford’s and its colleges’ spending
Figure 32 presents the estimated total direct, indirect, and induced impacts associated with expenditures incurred by the University and its colleges in 2018-19 (after the above-described adjustments have been made). The analysis indicates that the aggregate impact of these expenditures stood at approximately £6,032 million in economic output terms (see top panel of Figure 32):
In terms of the source of expenditure, £4,472 million of this impact was associated with the spending of the University of Oxford itself, while the remaining £1,561 million was associated with the expenditures of the University’s colleges.
In terms of region, again, the majority of this impact (£3,809 million, 63%) was generated in the South East, with £2,223 million (37%) occurring in other regions across the UK.
In terms of sector, in addition to the impacts occurring in the government, health, and education sector itself (£2,574 million, 43%132), there are also large impacts felt within other sectors, e.g. including the distribution, transport, hotel, and restaurant sector (£828 million, 14%), and the production sector (£718 million, 12%)133.
In terms of the number of jobs supported (in FTE), the results indicate that the University’s and its colleges’ spending supported a total of 32,880 FTE jobs across the UK economy in 2018-19 (of which 22,405 are located in the South East). In addition, the impact in terms of gross value added was estimated at £3,425 million across the UK economy as a whole (with £2,201 million generated within the South East).
130 The University’s bursary support to UK domiciled students is considered as a benefit to the student in the analysis of the impact of teaching and learning activities (see Section 3). It was therefore necessary to deduct these bursaries from the direct impact of the University’s spending to correctly take account of the fact that these bursaries are a transfer from the University to its students, and not an additional benefit to the UK economy. 131 This is slightly larger than the above impact of the net tuition fee income associated with international students in the 2018-19 cohort (£393 million; see Section 4.3), as the value deducted here relates to the impact of the University’s gross international fee income before the deduction of the Exchequer/University funding costs associated with these students (since these costs are already deducted when estimating the impact of the University’s educational exports). 132 The size of this impact is driven by the fact that, along with the indirect and induced impacts, it includes the direct level of expenditure of the University and its colleges (net of the above adjustments to avoid any double-counting). 133 Again, for more detail on what industries are included in this high-level sector classification, please refer to Table 20 in Annex A2.1.
The impact of the University’s and its colleges’
expenditure on the UK economy in 2018-19 stood
at £6.0 billion.

London Economics The economic impact of the University of Oxford 61
5 | The impact of the University of Oxford’s expenditures
Total economic impact associated with of University’s and its colleges’ expenditure in 2018-19, by region and sector By region By sector
Note: Monetary estimates are presented in 2018-19 prices, rounded to the nearest £1 million, and may not add up precisely to the totals indicated. Employment estimates are rounded to the nearest 5, and again may not add up precisely to the totals indicated. Source: London Economics’ analysis
£79m £197m £163m £171m £190m £240m
£694m £3,809m
£187m £93m £148m
£60m £6,032m
£0m £1,000m £2,000m £3,000m £4,000m £5,000m £6,000m £7,000m
North EastNorth West
Yorkshire & the HumberEast Midlands
West MidlandsEast of England
LondonSouth East
South WestWales
ScotlandNorthern Ireland
Total
Economic output, £m
Output, £m £32m £718m
£155m £828m
£228m £302m
£538m £498m
£2,574m £160m
£6,032m
£0m £1,000m £2,000m £3,000m £4,000m £5,000m £6,000m £7,000m
AgricultureProduction
ConstructionDistr., transport, hotels & restaurants
Information & communicationFinancial & insurance
Real estateProfessional & support activitiesGovernment, health & education
Other servicesTotal
Economic output, £m
Output, £m
£55m £107m £94m £101m £109m £140m
£308m £2,201m
£115m £63m £88m
£44m £3,425m
£0m £1,000m £2,000m £3,000m £4,000m
North EastNorth West
Yorkshire & the HumberEast Midlands
West MidlandsEast of England
LondonSouth East
South WestWales
ScotlandNorthern Ireland
Total
GVA, £m
GVA, £m £14m £254m
£60m £441m
£129m £130m
£424m £289m
£1,584m £99m
£3,425m
£0m £1,000m £2,000m £3,000m £4,000m
AgricultureProduction
ConstructionDistr., transport, hotels & restaurants
Information & communicationFinancial & insurance
Real estateProfessional & support activitiesGovernment, health & education
Other servicesTotal
GVA, £m
GVA, £m
5259959209951,0151,210
1,93022,405
1,045650760
43032,880
0 5,000 10,000 15,000 20,000 25,000 30,000 35,000
North EastNorth West
Yorkshire & the HumberEast Midlands
West MidlandsEast of England
LondonSouth East
South WestWales
ScotlandNorthern Ireland
Total
# of full-time equivalent employees
FTE employment 3051,720
4455,485
810700
4753,550
18,565835
32,880
0 5,000 10,000 15,000 20,000 25,000 30,000 35,000
AgricultureProduction
ConstructionDistr., transport, hotels & restaurants
Information & communicationFinancial & insurance
Real estateProfessional & support activitiesGovernment, health & education
Other servicesTotal
# of full-time equivalent employees
FTE employment

62 London Economics
The economic impact of the University of Oxford
SOPHIA: Helping private companies reduce poverty
In 2019, researchers from the Oxford Poverty and Human Development Initiative (OPHI) launched SOPHIA Oxford, the University’s first social enterprise spinout. For over a decade, OPHI has developed tools to identify and tackle ‘multidimensional’ poverty – i.e. deprivations experienced at the individual and household levels, including health, education, and living standards. Established as a not-for-profit partner of OPHI, SOPHIA aims to bring the methods created by OPHI and make them available to businesses who want to positively impact the wellbeing of their employees and help efforts to tackle
poverty. SOPHIA’s goal is to provide these businesses with tools to measure and respond to poverty amongst their employees and their families, contractors, and in their supply chain.
SOPHIA has an exclusive worldwide licence to OPHI’s Business Multidimensional Poverty Index (bMPI). Drawing on research on multidimensional poverty led by Professor Sabina Alkire at the University of Oxford, the bMPI measures poverty in its many dimensions, analysing not just who is poor in a given business but how poor they are, and the multitude of factors keeping them in poverty. The bMPI uses a survey approach that enables companies to see what issues need to be addressed, how to prioritise a response, redirect resources for larger impact, and verify change in people’s lives. The approach is based on OPHI’s National Multidimensional Poverty Index (MPI), which has been adopted by the United Nations Development Programme, the World Bank, and as an official measure of poverty by more than 30 countries in Africa, Asia, and Latin America. Both the National MPI and the Business MPI use the same indicators of poverty, thus facilitating coordination between businesses and governments to end poverty.
The bMPI was developed in partnership with Horizonte Positivo, a private non-profit association in Costa Rica. Since 2017, Horizonte Positivo has been working to launch the bMPI across Costa Rica, and to date, it has assisted more than 45 companies and surveyed around 34,000 households, meaning more than 3,900 households have benefited from the solutions developed using the bMPI. SOPHIA has learned from this successful work, and has begun trials in Guatemala and Chile, with its products being primed for roll-out across Latin America.
Based on the bMPI method, SOPHIA’s new Wise Responder Action Kit - which provides companies with the ability to understand their employees’ living situations and manage programmes to improve their quality of life – is available to companies in Latin America and the Caribbean. The Wise Responder Action Kit includes a survey for the whole of Latin America and the Caribbean that provides companies with knowledge of employees’ lives and how to respond to create wellbeing; an information management platform that prioritises, tracks and integrates solution reporting; and training and support to implement surveys and solutions.
The creation of SOPHIA and its licence from the University of Oxford were supported by the Oxford Department of International Development and the University’s innovation arm, Oxford University Innovation (OUI). OUI launched the social enterprise arm in September 2018, offering the University’s academics the opportunity to create companies which put people before profit, and has since built up a pipeline of 30 social enterprises.
©The University of Oxford

London Economics The economic impact of the University of Oxford 63
6 | The University of Oxford’s contribution to tourism
6 The University of Oxford’s contribution to tourism
Box 5 Key findings: Contribution to tourism
In 2018-19, there were more than 7.8 million tourists and visitors to Oxford involving almost £775 million of related expenditure. These visitors included those experiencing the University’s unique cultural and heritage sites, business visitors, friends and family visiting the University’s staff and students, or participants in study trips to the University.
To understand the economic impact associated with the University’s contribution to tourism through the attraction of these visitors, we estimated the number of visitors to Oxford in 2018-19 that were associated with the University’s presence. The analysis focuses only on visits to Oxford that involved overnight stays by visitors from overseas, as it is assumed that any domestic (day or overnight) visits to Oxford would have displaced activity from other regions of the UK (and should not be considered ‘additional’ to the UK economy). Out of a total of 577,000 overnight visits from overseas visitors to Oxford in 2018-19, we estimate that 407,000 resulted directly from the University’s activities. Combined with information on the average trip expenditure per visitor, the direct impact of the University’s contribution to tourism in 2018-19 was estimated to be £221 million.
As with many of the University’s other activities, this visitor expenditure results in subsequent rounds of expenditure throughout the UK economy. Applying the relevant multipliers to the estimate of direct expenditure, the analysis indicates that the total direct, indirect, and induced impact of the visitor expenditure generated by the University of Oxford in 2018-19 stood at approximately £611 million.
As a final strand of economic contribution, the University attracts a range of visitors to Oxford, including tourists visiting the University’s unique cultural and heritage sites (such as the Ashmolean Museum, the Bodleian Libraries, or the Oxford Botanic Garden), business visitors, friends and family visiting the University’s staff and students, or visitors participating in study trips to the University. To understand the economic impact associated with the University’s contribution to tourism through the attraction of these visitors, we combine information on the number of visitors to Oxford that are associated with the University’s presence with information on the average trip expenditure per visitor. As with the University’s knowledge exchange activities (Section 2.2), the expenditures of its international students (Section 4), and the spending of the University and its colleges (Section 5), these visitors’ expenditures result in subsequent rounds of spending and economic activity within the local economy, captured by the direct, indirect, and induced impacts associated with these expenditures. Again, these impacts are estimated using economic multipliers, and are measured in terms of the contribution to economic output, gross value added, and (full-time equivalent) employment in 2018-19.
6.1 Estimating the number of visitors associated with the University’s activities
A study by Destination Research (2019) estimated that, in 2019, there were a total of approximately 7.8 million visitor trips to Oxford. Of these visits, 639,000 involved domestic overnight stays from within the United Kingdom, 577,000 involved overnight stays by overseas visitors, and approximately 6.6 million were day trips to Oxford. These trips to Oxford were associated with almost £775 million of expenditure.
Of the 7.8 million visits to Oxford, only a proportion contribute to the UK economy (i.e. these trips are ‘additional’ to the UK economy) and therefore only a subset of these trips can be included in the analysis.

64 London Economics
The economic impact of the University of Oxford
6 | The University of Oxford’s contribution to tourism
More specifically, it is likely that any domestic (day or overnight) visits to Oxford would have displaced activity from other regions of the United Kingdom. Therefore, following standard evaluation guidance (HM Treasury (2018)), all visitor trips and associated expenditure originating from elsewhere in the United Kingdom - i.e. domestic day trips and domestic overnight trips - are excluded from the analysis. As a result, the remainder of this analysis focuses only on the 577,000 trips to Oxford involving overnight stays by visitors from overseas.
In addition to the total number of these overseas overnight visits, a key element of the analysis involves understanding the specific reason for these visits. Using information from Destination Research (2017)134, of the total of 577,000 overnight trips to Oxford by overseas visitors, approximately 57% (329,000) were for the purposes of holidays, 27% (156,000) were business trips, 9% (52,000) were undertaken for the purposes of visiting friends and family, and the remaining 7% (58,000) were study trips to Oxford or trips for other purposes. Using this breakdown by purpose of visit, to estimate the impact of the University of Oxford’s contribution to tourism in the 2018-19 academic year135, we made the following assumptions in relation to the number of overseas overnight visits to Oxford that resulted from the University’s presence:
We assumed that all of the visits for the purposes of holidays (329,000) or study trips (35,000) were directly as a result of the University (i.e. that all visitors on holiday were attracted by the University’s campus and its heritage and cultural assets, and that all visitors on study trips were undertaking study trips to the University itself);
In relation to business trips, the University and its colleges employed approximately 20,395 staff in 2018-19 (in headcount terms, equivalent to 18,970 FTE employees (see Section 5))136,
accounting for approximately 23% of the total employed population of Oxford in 2018-19137. Based on this, we assumed that 23% of business trips to Oxford in 2019 were related to the University (corresponding to approximately 35,000 visits/trips).
We adopted a similar approach with respect to trips to visit family and friends. Specifically, the total population of Oxford in 2019 was estimated to be 152,500138. According to information from the University of Oxford and HESA, there were approximately 7,870 non-UK nationals employed by the University and its colleges139 (representing 5% of the resident population of Oxford), as well as 8,500 non-UK-domiciled students attending the University140 (representing 6% of the resident population). Based on a previous analysis assessing the economic impact of international students on the UK economy141, we assumed that, on average, there were 1.5 visits from overseas per non-UK-domiciled student or non-UK member of staff in 2018-19142. As a result, we assumed
134 Since the 2019 study by Destination Research did not include specific breakdowns of the number of visits to Oxford by purpose, this breakdown was instead estimated using information provided in an earlier iteration of the same study (see Destination Research, 2017). 135 The analysis (for the 2018-19 academic year) is based on visits to Oxford in the 2019 calendar year (i.e. we assume that there were the same number of overseas visitors to Oxford in the 2018-19 academic year as in the 2019 calendar year). 136 In 2018-19, there were 18,970 FTE staff employed by the University of Oxford and its colleges. Using the same assumption as in Section 5 relating to the number of FTE employees as a proportion of headcount employees (93%), we thus estimate that there were approximately 20,395 staff employed by the University and its colleges in headcount terms. 137 Using official labour market statistics data (Nomis, 2021), there were approximately 90,400 individuals employed (or self-employed) in Oxford between July 2018 and August 2019. 138 See Nomis (2021). 139 This was estimated based on the distribution of the University of Oxford’s staff in 2018-19 by nationality (see HESA, 2020c), the number of total FTE staff employed across the University and its colleges in 2018-19, and the number of FTE employees as a proportion of headcount employees (93%) at the University of Oxford (same assumption as used in Section 5 and Footnote 136). 140 Note that this includes all students enrolled with the University in 2018-19, i.e. including both first-year and continuing students. 141 See London Economics (2018). 142 The previous analysis (London Economics, 2018) estimated that there are 3.0 visits from overseas per EU student per year, and 0.9 visits per non-EU student per year. Here, we calculated a weighted average across EU and non-EU students (weighted by the number of total (first-year and continuing) EU and non-EU students enrolled at the University of Oxford in 2018-19. We then used the same average (1.5) as the assumed number of overseas visits per non-UK staff employed by the University and its colleges in 2018-19.

London Economics The economic impact of the University of Oxford 65
6 | The University of Oxford’s contribution to tourism
that approximately 17% of all overseas visits to Oxford to visit family or friends were visits to the University’s students and staff (equivalent to approximately 9,000 trips in 2018-19).
Finally, we assumed that none of the remaining trips to Oxford for other purposes were as a result of the University.
Table 17 presents the resulting estimated number of trips to Oxford by overseas visitors in 2018-19 that were due to the University of Oxford’s activities, estimated at a total of 407,000 (or 71% of total overseas trips to Oxford).
Total number of visits to Oxford and University-related visits by overseas overnight visitors in 2018-19
Type of trip Total visits Visits associated with
the University % associated with the
University Holidays 329,000 329,000 100% Study trips 35,000 35,000 100% Business trips 156,000 35,000 23% Trips to visit friends and family 52,000 9,000 17% Other trips 6,000 - - Total visits 577,000 407,000 71%
Note: All numbers are rounded to the nearest 1,000, and the total values may not add up due to this rounding. Source: London Economics’ analysis

66 London Economics
The economic impact of the University of Oxford
The National Trust Partnership: Connecting cutting-edge Oxford University research with the National Trust’s places and collections
Launched in 2018, the National Trust Partnership is a collaboration between the University of Oxford and the National Trust, aimed at creating new opportunities for interdisciplinary research, knowledge exchange, public engagement with research, and training at both institutions and beyond. The partnership is founded upon mutual benefit and two-way knowledge exchange. It facilitates new research into the National Trust’s rich portfolio of places and collections, which in turn is embedded into public-facing programmes and initiatives. Meanwhile, researchers benefit from access to the National Trust’s buildings, collections, and landscapes, alongside opportunities to learn from the organisation’s staff, engage with its vast public audiences, and develop further research projects.
The partnership’s activities include research placements and consultancy, conferences, workshops, public lectures and events, PhD projects, student internships, and staff training. One example of these activities is the research undertaken at Powis Castle in Wales into the property’s ‘Clive Museum,’ the largest private collection of Indian artefacts in the United Kingdom, amassed during the British colonisation of India and housed in the castle in the early 19th century. Beginning with a commissioned consultancy role undertaken by Dr Kieran Hazzard to research the collection, including its provenance and wider global connections, the collaboration expanded to include a Knowledge Exchange Fellowship in partnership with the Ashmolean Museum, a new Collaborative Doctoral Award funded by the Arts and Humanities Research Council (AHRC), nineteen Oxford student intern placements, National Trust staff training, volunteer talks and new property-based interpretation, alongside academic publications and conference papers. Combining archival research with a wider range of knowledge-exchange activities, the collaboration has deepened understanding of the collection and its context while widening engagement with a broad range of audiences.
The partnership grew out of the Trusted Source Knowledge Transfer Partnership (KTP), which ran from 2016 to 2018. Funded by the National Trust, the Arts and Humanities Research Council (AHRC), and Innovate UK, the Trusted Source KTP was piloted as a means to bring academic research into the National Trust by connecting heritage professionals and university academics. The KTP resulted in the creation of new public web content and training opportunities for students and staff at both institutions, was featured as a case study in a UK Government Select Committee and the Mendoza Review of Museums in England, and was graded ‘A: Outstanding’ by Innovate UK.
Now in its third year, the National Trust Partnership continues to develop and test new methods for successful, sustained, and mutually beneficial collaboration between academia and the heritage sector. To highlight only some of the partnership’s achievements, to date143:
More than 1,100 people have engaged with the partnership’s activities and events; The partnership has engaged with 25 academic institutions, 28 heritage, cultural and
conservation institutions, and 19 industry consultants and independent practitioners; More than 200 National Trust staff have received training, through 7 different research training
sessions; and 112 students have undertaken week-long internships, contributing almost 4,000 hours of new
research.
143 As of May 2021.

London Economics The economic impact of the University of Oxford 67
6 | The University of Oxford’s contribution to tourism
6.2 Direct impact associated with visitor expenditure
The analysis by Destination Research (2019) suggests that amongst the 577,000 overnight visits to Oxford from overseas visitors in 2019, the average expenditure per trip was £542. Combining this expenditure per visit with the estimated number of visits directly associated with the University’s activities (407,000), the direct impact associated with the University’s contribution to tourism in 2018-19 stood at approximately £221 million. In terms of the nature of this visitor expenditure, the analysis suggests that approximately £73 million (33%) of this total was spent on accommodation, an estimated £53 million (24%) was associated with general shopping activities, £44 million (20%) was spent on food and drink, £24 million (11%) was spent on attractions, with the remaining £26 million (12%) spent on travel144. In terms of sector, this suggests that approximately £196 million (89%) of visitor spending occurred in the distribution, transport, hotels, and restaurants sector, while the remaining £24 million (11%) was spent on ‘other’ services (i.e. expenditure on attractions).
In addition to economic output (i.e. visitor expenditure), we converted the above estimates into gross value added and the number of full-time equivalent jobs supported by this expenditure145. We thus estimated that the visitor expenditure associated with the University’s activities directly generated £110 million in GVA and supported 2,085 FTE jobs.
6.3 Indirect and induced impacts associated with visitor expenditure
As with the impacts of the University’s knowledge exchange activities (Section 2.2), the expenditures of its international students (Section 4), and the expenditure of the University and its colleges (Section 5), the assessment of the indirect and induced economic impacts associated with visitor expenditure is again based on economic multipliers derived from the above-described multi-regional Input-Output model146. In particular, given the concentration of visitor expenditure in the distribution, transport, hotels, and restaurants sector and the ‘other’ services sector, we applied the estimated average economic multipliers associated with organisations in these sectors located in the South East.
These multipliers (for the South East and the UK as a whole; presented in Table 18) indicate that every £1 million of (overseas overnight) visitor expenditure associated with the University of Oxford generates an additional £1.77 million of impact throughout the UK economy, of which £0.75 million is generated in the South East. In terms of employment, for every 1,000 (FTE) staff directly supported by this visitor expenditure, an additional 1,410 staff are supported throughout the United Kingdom, of which 540 are located in the South East.
Economic multipliers associated with tourism expenditures related to the University
Location of impact Output GVA FTE employment South East 1.75 1.76 1.54 Total UK 2.77 2.85 2.41
Note: All multipliers constitute Type II multipliers, defined as [Direct + indirect + induced impact]/[Direct impact]. Source: London Economics’ analysis
144 This breakdown was estimated using a breakdown of expenditure by type provided by Destination Research (2017). 145 To estimate the direct GVA and employment associated overseas visitor expenditure, we multiplied this expenditure by the average ratio of GVA to output and FTE employees to output within the South East’s distribution, transport, hotels and restaurants sector and the ‘other’ services sector. 146 See Section 2.2 for more information.

68 London Economics
The economic impact of the University of Oxford
6 | The University of Oxford’s contribution to tourism
6.4 Total impact associated with visitor expenditure
Figure 33 presents the estimated total direct, indirect, and induced impacts associated with the above visitor expenditures generated by the University’s activities in 2018-19. The analysis indicates that the aggregate impact of these expenditures stood at approximately £611 million in economic output terms (see top panel of Figure 33). In terms of region, the majority of this impact (£386 million, 63%) was generated in the South East, with £224 million (37%) occurring in other regions across the UK.
In terms of sector of impact, in addition to the impacts occurring in the distribution, transport, hotels and restaurants sector (£300 million, 49%), there were also large impacts within other sectors, such as the professional and support activities sector (£53 million, 9%), the real estate sector (£52 million, 8%), and the production sector (£77 million, 13%)147.
In terms of the number of FTE jobs supported, the results indicate that the visitor spending generated by the University’s activities supported a total of 5,015 FTE jobs across the UK economy in 2018-19, of which 3,045 are located in the South East (presented in the bottom panel of Figure 33). In addition, the impact in terms of gross value added was estimated at £312 million across the UK economy as a whole, of which £149 million was generated within the South East (see the middle panel of Figure 33).
147 Again, for more detail on what industries are included in this high-level sector classification, please refer to Table 20 in Annex A2.1.
The impact of the University’s
contribution to tourism in 2018-19 stood at
£611 million.

London Economics The economic impact of the University of Oxford 69
6 | The University of Oxford’s contribution to tourism
Total economic impact associated with the University’s contribution to tourism in 2018-19, by region and sector By region By sector
Note: Monetary estimates are presented in 2018-19 prices, rounded to the nearest £1 million, and may not add up precisely to the totals indicated. Employment estimates are rounded to the nearest 5, and again may not add up precisely to the totals indicated. Source: London Economics’ analysis
£8m £20m £17m £18m £20m £25m
£69m £386m
£19m £9m £15m
£6m £611m
£0m £100m £200m £300m £400m £500m £600m £700m
North EastNorth West
Yorkshire & the HumberEast Midlands
West MidlandsEast of England
LondonSouth East
South WestWales
ScotlandNorthern Ireland
Total
Economic output, £m
Output, £m £3m £77m
£14m £300m
£23m £30m
£52m £53m
£20m £39m
£611m
£0m £100m £200m £300m £400m £500m £600m £700m
AgricultureProduction
ConstructionDistr., transport, hotels & restaurants
Information & communicationFinancial & insurance
Real estateProfessional & support activitiesGovernment, health & education
Other servicesTotal
Economic output, £m
Output, £m
£5m £11m £9m £10m £11m £14m
£30m £193m
£11m £6m £9m
£4m £312m
£0m £50m £100m £150m £200m £250m £300m £350m
North EastNorth West
Yorkshire & the HumberEast Midlands
West MidlandsEast of England
LondonSouth East
South WestWales
ScotlandNorthern Ireland
Total
GVA, £m
GVA, £m £1m £26m
£5m £149m
£13m £12m
£40m £30m
£12m £23m
£312m
£0m £50m £100m £150m £200m £250m £300m £350m
AgricultureProduction
ConstructionDistr., transport, hotels & restaurants
Information & communicationFinancial & insurance
Real estateProfessional & support activitiesGovernment, health & education
Other servicesTotal
GVA, £m
GVA, £m
90175155175175210
3253,215
180110130
755,015
0 1,000 2,000 3,000 4,000 5,000
North EastNorth West
Yorkshire & the HumberEast Midlands
West MidlandsEast of England
LondonSouth East
South WestWales
ScotlandNorthern Ireland
Total
# of full-time equivalent employees
FTE employment 50310
653,045
140120
80640
255310
5,015
0 1,000 2,000 3,000 4,000 5,000
AgricultureProduction
ConstructionDistr., transport, hotels & restaurants
Information & communicationFinancial & insurance
Real estateProfessional & support activitiesGovernment, health & education
Other servicesTotal
# of full-time equivalent employees
FTE employment

70 London Economics
The economic impact of the University of Oxford
7 | Total economic impact of the University of Oxford
7 Total economic impact of the University of Oxford
The total economic impact on the UK economy associated with the University of Oxford’s activities in 2018-19 was estimated at approximately £15.7 billion (Table 19). In terms of the components of this impact:
The University’s research and knowledge exchange activities accounted for £7.9 billion (50%) of this impact;
The value of the University’s teaching and learning activities stood at £422 million (3%);
The impact of the University’s educational exports was estimated at £732 million (5%);
The impact generated by the spending of the University and its colleges stood at £6.0 billion (38%); and
The remaining £611 million (4%) was associated with the University’s contribution to tourism.
Total economic impact of the University of Oxford’s activities in the UK in 2018-19 (£m and % of total)
Type of impact £m %
Impact of research and knowledge exchange £7,909m 50% Research activities £4,496m 29% Knowledge exchange activities £3,413m 22%
Impact of teaching and learning £422m 3% Students £213m 1% Exchequer £209m 1%
Impact of exports £732m 5% Tuition fee income £393m 3% Non-tuition fee income £340m 2%
Impact of the University's spending £6,032m 38% University expenditure £4,472m 28% College expenditure £1,561m 10%
Impact of tourism £611m 4% Direct impact £221m 1% Indirect and induced impact £390m 2%
Total economic impact £15,706m 100% Note: All estimates are presented in 2018-19 prices, and rounded to the nearest £1m. Totals may not add up precisely due to rounding. Source: London Economics' analysis
Compared to the University’s total operational costs of approximately £2,582 million in 2018-19148, the total economic contribution of the University of Oxford’s activities to the UK was estimated at £15.7 billon149, which corresponds to a benefit to cost ratio of 6.1:1.
Using a previous analysis of the economic contribution of the Russell Group of Universities to the UK economy150, on a like-for-like basis, the economic impact of the University of Oxford has increased by 34% between 2015-16 and 2018-19.
148 This relates to the total operating expenditure of the University of Oxford in 2018-19, excluding any University capital expenditure as well as any operating or capital expenditures of the University’s colleges, but including any depreciation costs or movements in pension provisions. 149 In addition to this total impact on the UK economy as a whole, some of the strands of impact considered in the analysis can be disaggregated by sector and region (and can be measured in economic output as well as GVA and (FTE) employment). In aggregate, approximately £10.8 billion (69%) of the University’s total impact can be disaggregated in this way. 150 See London Economics (2017)
The total economic impact associated with
the University of Oxford’s activities in
2018-19 stood at £15.7 billion.

London Economics The economic impact of the University of Oxford 71
Index of Tables, Figures, and Boxes
Index of Tables, Figures, and Boxes
Tables
Total economic impact of the University of Oxford’s activities in the UK in 2018-19 (£m and % of total) iii
Impact of the University of Oxford’s teaching and learning activities associated with the 2018-19 cohort (£m), by type of impact, domicile, and level of study vi
Impact associated with the University’s contribution to tourism in 2018-19 (£m) ix
Disclosures and patents filed in 2018-19, by university (top 15) 18
Economic multipliers associated with the University’s IP licensing income 20
Economic impact associated with the University’s IP licensing in 2018-19 21
Economic multipliers associated with the activities of the University’s spinout companies 22
Economic impact associated with the University’s spinout companies in 2018-19 22
Economic multipliers associated with the activities of companies located at the University’s Science Parks 23
Economic impact associated with companies located at the University’s Science Parks in 2018-19 23
UK domiciled students in the 2018-19 cohort of University of Oxford students, by level of study, mode of study and domicile 32
Assumed completion rates of University of Oxford students 34
Net graduate premium and net Exchequer benefit per English domiciled student at the University of Oxford, by study level and mode 39
Aggregate impact of the University of Oxford’s teaching and learning activities associated with the 2018-19 cohort (£m), by type of impact, domicile, and level of study 41
Economic multipliers associated with the income from international students in the 2018-19 cohort of University of Oxford students 50
Economic multipliers associated with the expenditures of the University and its colleges 59
Total number of visits to Oxford and University-related visits by overseas overnight visitors in 2018-19 65
Economic multipliers associated with tourism expenditures related to the University67
Total economic impact of the University of Oxford’s activities in the UK in 2018-19 (£m and % of total) 70
Industry grouping used as part of the multi-regional Input-Output analysis 79

72 London Economics
The economic impact of the University of Oxford
Index of Tables, Figures, and Boxes
Treatment and comparison groups used to assess the marginal earnings and employment returns to higher education qualifications 81
Marginal earnings returns to higher education qualifications (in all subjects), in % (following exponentiation), by gender and age band 83
Marginal employment returns to higher education qualifications (in all subjects), in percentage points, by gender and age band 85
Average age at enrolment, study duration, and age at completion for students in the 2018-19 University of Oxford cohort 86
Assumed age decay adjustment factors for students in the 2018-19 University of Oxford cohort 87
Gross graduate premiums and Exchequer benefits per student associated with HE qualification attainment at the University of Oxford, by study mode, level, gender, and prior attainment 90
Net graduate premiums per student associated with HE qualification attainment at the University of Oxford, by study mode, level, gender, prior attainment, and domicile 91
Net Exchequer benefits per student associated with HE qualification attainment at the University of Oxford, by study mode, level, gender, prior attainment, and domicile 93
Non-UK domiciled students in the 2018-19 cohort of University of Oxford students, by level of study, mode of study and domicile 95
Net tuition fee income per international student in the 2018-19 cohort of University of Oxford students, by level of study, mode, and domicile 96
Assumed average stay durations (in years) for non-UK domiciled students, by study level and study mode 96
Non-fee fee income per international student in the 2018-19 cohort of University of Oxford students, by level of study, mode, and domicile 97
Figures
Figure 1 Impact of the University of Oxford’s research and knowledge exchange activities in 2018-19 (£m) v
Figure 2 Impact of the University’s educational exports associated with international students in the 2018-19 cohort (£m), by domicile and type of income vii
Figure 3 Impact associated with the University’s and its colleges’ expenditure in 2018-19 (£m) viii
Research income received by the University of Oxford in 2018-19, £m by source of income 14
Figure 5 Total impact of the University of Oxford’s research activities in 2018-19, £m 16

London Economics The economic impact of the University of Oxford 73
Index of Tables, Figures, and Boxes
Income from IP licensing in 2018-19, by university (top 15) 19
Income from contract research services in 2018-19, by university (top 15) 19
Active spinout companies (with some university ownership) in 2018-19, by university (top 15) 19
Total economic impact associated with the University’s knowledge exchange activities in 2018-19, by region and sector 24
Figure 10 Total impact of the University of Oxford’s research and knowledge exchange activities in 2018-19, £m 26
Total impact of the University of Oxford’s research and knowledge exchange activities, 2015-16 to 2018-19, £m 26
Overview of the Oxford BRC’s research clusters and themes 28
Total funding received by the Oxford BRC in 2019-20 29
Figure 14 Total impact of the Oxford BRC’s research activities in 2019-20, £m 29
Figure 15 UK domiciled students in the 2018-19 cohort of University of Oxford students, by level of study 31
Figure 16 UK domiciled students in the 2018-19 cohort of University of Oxford students, by mode of study 32
Figure 17 UK domiciled students in the 2018-19 cohort of University of Oxford students, by domicile 32
Figure 18 Overview of gross and net graduate premium, and gross and net Exchequer benefit 35
Estimating the gross graduate premium and gross Exchequer benefit 36
Non-UK domiciled students in the 2018-19 cohort of University of Oxford students, by domicile 44
Non-UK domiciled students in the 2018-19 cohort of University of Oxford students, by study mode 44
Non-UK domiciled students in the 2018-19 cohort of University of Oxford students, by level of study 45
Aggregate net tuition fee income associated with international students in the 2018-19 cohort, by domicile (£m) 46
Aggregate non- fee income associated with international students in the 2018-19 cohort, by domicile (£m) 48
Total direct impact associated with non-UK students in the 2018-19 University of Oxford cohort, by type of impact 49
Total economic impact associated with international students in the 2018-19 University of Oxford cohort, by region and sector 52
Figure 27 Direct economic impact (in terms of output) of the University’s and its colleges’ expenditure in 2018-19, by type of expenditure 56

74 London Economics
The economic impact of the University of Oxford
Index of Tables, Figures, and Boxes
Figure 28 Direct employment (in FTE) of the University and its colleges in 2018-19 56
Figure 29 Direct GVA generated by the University’s and its colleges’ expenditure in 2018-19 57
Figure 30 Distribution of the University of Oxford’s procurement expenditure in 2018-19, by Local Authority (of invoice address) 58
Figure 31 Distribution of the University of Oxford’s staff in 2014, by Local Authority (of home address) 58
Total economic impact associated with of University’s and its colleges’ expenditure in 2018-19, by region and sector 61
Total economic impact associated with the University’s contribution to tourism in 2018-19, by region and sector 69
Total economic impact of the University’s activities in 2018-19, by region and sector (where possible) 99
Boxes
Box 1 Key findings: Research and knowledge exchange 12
Box 2 Key findings: Teaching and learning 30
Box 3 Key findings: Educational exports 43
Box 4 Key findings: Expenditure by the University and its colleges 54
Box 5 Key findings: Contribution to tourism 63

ANNEXES

76 London Economics
The economic impact of the University of Oxford
Annex 1 | References
Annex 1 References
Atkinson, B. (2005). ‘Atkinson Review: Final Report. Measurement of Government output and productivity for national accounts’. http://eprints.lse.ac.uk/33553/
Audit Scotland (2020). 'Briefing: Student loans'. https://www.audit-scotland.gov.uk/report/student-loans
Callender, C., Wilkinson, D., Gibson, A., and Perkins, C. (2011). ‘The impact of higher education for part-time students’. http://webarchive.nationalarchives.gov.uk/20140108090250/http://www.ukces.org.uk/assets/ukces/docs/publications/evidence-report-36-impact-of-he-for-pt-students.pdf
Committee on Climate Change (2019). ‘Net Zero – The UK’s contribution to stopping global warming’. https://www.theccc.org.uk/publication/net-zero-the-uks-contribution-to-stopping-global-warming/
Department for Business, Innovation and Skills (2011a). ‘The returns to Higher Education Qualifications’. https://www.gov.uk/government/uploads/system/uploads/attachment_data/file/32419/11-973-returns-to-higher-education-qualifications.pdf
Department for Business, Innovation and Skills (2011b). ‘Estimating the value to the United Kingdom of Education Exports’. http://www.bis.gov.uk/assets/biscore/higher-education/docs/e/11-980-estimating-value-of-education-exports.pdf
Department for Education (2020). ‘Student loan forecasts, England: 2019 to 2020’. https://explore-education-statistics.service.gov.uk/find-statistics/student-loan-forecasts-for-england/2019-20
Destination Research (2017). ‘Economic Impact of Tourism - Results - Oxford – 2017’. https://www.experienceoxfordshire.org/wp-content/uploads/2018/11/Economic-Impact-of-Tourism-Oxford-2017_FINAL.pdf
Destination Research (2019). ‘Economic Impact of Tourism - Headline Figures - Oxford – 2019’. https://www.experienceoxfordshire.org/wp-content/uploads/2020/10/Economic-Impact-of-Tourism-Oxford-2019.pdf
Haskel, J., & Wallis, G. (2010). 'Public support for innovation, intangible investment and productivity growth in the UK market sector'. http://ftp.iza.org/dp4772.pdf
Haskel, J., Hughes, A., and Bascavusoglu-Moreau, E. (2014). 'The economic significance of the UK science base: a report for the Campaign for Science and Engineering'. http://sciencecampaign.org.uk/UKScienceBase.pdf
Higher Education Statistics Agency (2020a). ‘Higher Education Provider Data: Finance’. https://www.hesa.ac.uk/data-and-analysis/finances
Higher Education Statistics Agency (2020b). ‘Higher Education Provider Data: Business and Community Interaction’.

London Economics The economic impact of the University of Oxford 77
Annex 1 | References
https://www.hesa.ac.uk/data-and-analysis/business-community
Higher Education Statistics Agency (2020c). ‘Higher Education Staff Data’. https://www.hesa.ac.uk/data-and-analysis/staff
Higher Education Statistics Agency (2021). ‘Non-continuation: UK Performance Indicators’. https://www.hesa.ac.uk/data-and-analysis/performance-indicators/non-continuation
HM Treasury (2018). ‘The Green Book. Central Government Guidance on Appraisal and Evaluation’. https://assets.publishing.service.gov.uk/government/uploads/system/uploads/attachment_data/file/685903/The_Green_Book.pdf
Imperial College London (2010). ‘University research contributes £45 billion a year to the UK economy, according to new impact study’. http://www3.imperial.ac.uk/newsandeventspggrp/imperialcollege/newssummary/news_16-3-2010-13-6-57
Institute for Employment Studies & National Centre for Social Research (2018). ‘Student income and expenditure survey 2014 to 2015.’ https://www.gov.uk/government/publications/student-income-and-expenditure-survey-2014-to-2015
London Economics (2017). ‘The economic impact of Russell Group Universities’, https://drive.google.com/file/d/0BwTqm7qeqGZNdTc0WHN3V1p0Rlk/view?resourcekey=0-7z-bpTzhmf34lSPlcHaONg
London Economics (2018). ‘The costs and benefits of international students by parliamentary constituency’. https://www.hepi.ac.uk/wp-content/uploads/2018/01/Economic-benefits-of-international-students-by-constituency-Final-11-01-2018.pdf
London Economics (2019). ‘Impact of the Augar review: an independent assessment’. https://www.universitiesuk.ac.uk/policy-and-analysis/reports/Pages/impact-of-augar-review.aspx
Nomis (2021). ‘Labour Market Profile – Oxford’. https://www.nomisweb.co.uk/reports/lmp/la/1946157324/report.aspx#tabempunemp
Office for Budget Responsibility (2020). ‘Economic and fiscal outlook – March 2020’. https://obr.uk/efo/economic-and-fiscal-outlook-march-2020/
Office for Budget Responsibility (2021). ‘Economic and fiscal outlook – March 2021’. https://obr.uk/efo/economic-and-fiscal-outlook-march-2021/
Office for Budget Responsibility (no date). ‘Tax by tax, spend by spend. VAT’. http://obr.uk/forecasts-in-depth/tax-by-tax-spend-by-spend/vat/
Office for National Statistics (2016). ‘UK SIC 2007’. https://www.ons.gov.uk/methodology/classificationsandstandards/ukstandardindustrialclassificationofeconomicactivities/uksic2007
Office for National Statistics (2018). ‘UK regional trade statistics: Fourth quarter 2017’. https://www.gov.uk/government/statistics/uk-regional-trade-in-goods-statistics-fourth-quarter-2017

78 London Economics
The economic impact of the University of Oxford
Annex 1 | References
Office for National Statistics (2019). ‘Regional gross value added (income approach)’. https://www.ons.gov.uk/economy/grossvalueaddedgva/datasets/regionalgrossvalueaddedincomeapproach
Office for National Statistics (2020a). ‘UK input-output analytical tables’. https://www.ons.gov.uk/economy/nationalaccounts/supplyandusetables/datasets/ukinputoutputanalyticaltablesdetailed
Office for National Statistics (2020b). ‘Region by broad industry group (SIC) - Business Register and Employment Survey (BRES): Table 4’. https://www.ons.gov.uk/employmentandlabourmarket/peopleinwork/employmentandemployeetypes/datasets/regionbybroadindustrygroupsicbusinessregisterandemploymentsurveybrestable4
Office for National Statistics (2020c). ‘Regional gross disposable household income, UK: 1997 to 2018’. https://www.ons.gov.uk/economy/regionalaccounts/grossdisposablehouseholdincome/bulletins/regionalgrossdisposablehouseholdincomegdhi/1997to2018#:~:text=UK%20total%20gross%20disposable%20household,GDHI%20in%202018%20at%202.3%25.
Office for National Statistics (2020d). ‘Estimates of the population for the UK, England and Wales, Scotland and Northern Ireland’. https://www.ons.gov.uk/peoplepopulationandcommunity/populationandmigration/populationestimates/datasets/populationestimatesforukenglandandwalesscotlandandnorthernireland
Office for National Statistics (2021). ‘CPI Index 00: All items, 2015=100’. https://www.ons.gov.uk/economy/inflationandpriceindices/timeseries/d7bt/mm23
Oxford Economics (2017). ‘The economic impact of universities in 2014-15’. https://www.universitiesuk.ac.uk/policy-and-analysis/reports/Documents/2017/the-economic-impact-of-universities.pdf
Student Awards Agency for Scotland (2019). ‘Higher Education support in Scotland in 2018-19’. https://www.saas.gov.uk/files/400/saas-statistics-2018-19.pdf
Student Loans Company (2019a). ‘Student support for Higher Education in England 2019’. https://www.gov.uk/government/statistics/student-support-for-higher-education-in-england-2019
Student Loans Company (2019b). ‘Student support for Higher Education in Wales 2019’. https://www.gov.uk/government/statistics/student-support-for-higher-education-in-wales-2019
Student Loans Company (2019c). ‘Student support for Higher Education in Northern Ireland 2019’. https://www.gov.uk/government/statistics/student-support-for-higher-education-in-northern-ireland-2019
The Royal Society (2018). ‘Greenhouse gas removal’. https://royalsociety.org/-/media/policy/projects/greenhouse-gas-removal/royal-society-greenhouse-gas-removal-report-2018.pdf
Walker, I., & Zhu, Y. (2013), ‘The impact of university degrees on the lifecycle of earnings: Some further analysis’’. Department for Business Innovation and Skills Research Report 112. https://www.gov.uk/government/uploads/system/uploads/attachment_data/file/229498/bis-13-899-the-impact-of-university-degrees-on-the-lifecycle-of-earnings-further-analysis.pdf

London Economics The economic impact of the University of Oxford 79
Annex 2 | Technical Annex
Annex 2 Technical Annex
A2.1 Impact of the University’s knowledge exchange activities
Table 20 provides an overview of the high-level industry classifications used throughout the multi-regional Input-Output analysis (described in greater detail in Section 2.2).
Industry grouping used as part of the multi-regional Input-Output analysis
Industries included in original UK Input-Output table High-level industry group [and UK SIC Codes]
Crop and animal production, hunting and related service activities Agriculture [1-3] Forestry and logging
Fishing and aquaculture Mining and quarrying
Production [5-39]
Manufacture of food products, beverages, and tobacco products Manufacture of textiles, wearing apparel and leather products Manufacture of wood and of products of wood and cork, except furniture; manufacture of articles of straw and plaiting materials Manufacture of paper and paper products Printing and reproduction of recorded media Manufacture of coke and refined petroleum products Manufacture of chemicals and chemical products Manufacture of basic pharmaceutical products and pharmaceutical preparations Manufacture of rubber and plastic products Manufacture of other non-metallic mineral products Manufacture of basic metals Manufacture of fabricated metal products, except machinery and equipment Manufacture of computer, electronic and optical products Manufacture of electrical equipment Manufacture of machinery and equipment n.e.c. Manufacture of motor vehicles, trailers and semi-trailers Manufacture of other transport equipment Manufacture of furniture; other manufacturing Repair and installation of machinery and equipment Electricity, gas, steam, and air conditioning supply Water collection, treatment and supply Sewerage; waste collection, treatment, and disposal activities; materials recovery; remediation activities and other waste management services Construction Construction [41-43] Wholesale and retail trade and repair of motor vehicles and motorcycles
Distribution, transport, hotels, and restaurants [45-
56]
Wholesale trade, except of motor vehicles and motorcycles Retail trade, except of motor vehicles and motorcycles Land transport and transport via pipelines Water transport Air transport Warehousing and support activities for transportation Postal and courier activities Accommodation and food service activities Publishing activities
Information and communication [58-63]
Motion picture, video and television programme production, sound recording and music publishing activities; programming and broadcasting activities Telecommunications Computer programming, consultancy and related activities; information service activities Financial service activities, except insurance and pension funding
Financial and insurance [64-66] Insurance, reinsurance and pension funding, except compulsory social security
Activities auxiliary to financial services and insurance activities Real estate activities excluding imputed rents
Real estate [68.1-2-68.3] Imputed rents of owner-occupied dwellings Legal and accounting activities; activities of head offices; management consultancy activities
Professional and support activities [69.1-82] Architectural and engineering activities; technical testing and analysis
Scientific research and development

80 London Economics
The economic impact of the University of Oxford
Annex 2 | Technical Annex
Advertising and market research Other professional, scientific, and technical activities; veterinary activities Rental and leasing activities Employment activities Travel agency, tour operator reservation service and related activities Security and investigation activities; services to buildings and landscape activities; office administrative, office support and other business support activities Public administration and defence; compulsory social security
Government, health & education [84-88]
Education Human health activities Social work activities Creative, arts and entertainment activities; libraries, archives, museums, and other cultural activities; gambling and betting activities
Other services [90-97]
Sports activities and amusement and recreation activities Activities of membership organisations Repair of computers and personal and household goods Other personal service activities Activities of households as employers; undifferentiated goods- and services-producing activities of households for own use
Note: ‘n.e.c.’ = not elsewhere classified Source: London Economics’ analysis, based on Office for National Statistics (2020a) and UK SIC Codes (see Office for National Statistics, 2016)
A2.2 Impact of the University’s teaching and learning activities
A2.2.1 Qualifications and counterfactuals considered in the econometric analysis
Our econometric analysis of the earnings and employment returns to higher education qualifications (described in more detail in Annex A2.2.2) considered five different higher education qualification groups (i.e. five ‘treatment’ groups) within the National Qualifications Framework: three at postgraduate level (higher degree (research), higher degree (taught) and ‘other’ postgraduate qualifications151) and two at undergraduate level (first degrees and ‘other’ undergraduate qualifications152).
Table 21 presents these different postgraduate and undergraduate level qualifications (i.e. treatment groups) considered in the analysis, along with the associated counterfactual group used for the marginal returns analysis in each case. As outlined in Section 3.4.1, we compare the earnings of the group of individuals in possession of the higher education qualification to the relevant counterfactual group, to ensure that we assess the economic benefit associated with the qualification itself (rather than the economic returns generated by the specific characteristics of the individual in possession of the qualification). This is a common approach in the literature and allows for the removal of other personal, regional, or socioeconomic characteristics that might influence both the determinants of qualification attainment as well as earnings/employment.
For the analysis of marginal returns, postgraduate degree holders are compared to first degree holders, while for individuals holding first degrees or ‘other undergraduate’ level qualifications, the counterfactual group consists of individuals holding 2 or more GCE ‘A’ Levels as their highest qualification. For the purposes of estimating the returns to all higher education qualifications, the highest level of professional or vocational qualification that an individual may be in possession of is Level 3 (for both those in possession
151 This relates to Labour Force Survey variables a) HIQUAL11 and HIQUAL15 value labels ‘Level 7 Diploma’ and ‘Level 7 Certificate’ and b) HIQUAL4, HIQUAL5, HIQUAL8, HIQUAL11 and HIQUAL15 value labels ‘Higher degree’ (other than Masters or Doctorate degree). 152 This relates to Labour Force Survey variables HIQUAL4, HIQUAL5, HIQUAL8, HIQUAL11 and HIQUAL15 value label ‘other higher education below degree’. Additionally, Diplomas of Higher Education are included. Interviewers are instructed to use ‘other higher education below degree’ only if the respondent states that they have ‘something from higher education but they do not know what it is’. It is therefore not possible to provide examples of typical qualifications that would normally fall under this category. The response option serves the purpose of confirming that higher education qualifications have been achieved but that the respondent is unaware of the actual qualification title itself.

London Economics The economic impact of the University of Oxford 81
Annex 2 | Technical Annex
of higher education qualifications (the treatment group) and those individuals not in possession of higher education qualifications (the control group)).
Treatment and comparison groups used to assess the marginal earnings and employment returns to higher education qualifications
Treatment group – highest academic qualification
Comparison group - highest academic qualification
Treatment and comparison groups – highest possible
vocational/professional qualification Higher degree (research) First degree Level 3 vocational Higher degree (taught) First degree Level 3 vocational Other postgraduate First degree Level 3 vocational First degree 2 or more GCE ‘A’ Levels Level 3 vocational Other undergraduate 2 or more GCE ‘A’ Levels Level 3 vocational 2 or more GCE ‘A’ Levels 5 or more GCSEs at A*-C Level 3 vocational
Source: London Economics
In addition to the analysis of higher education qualifications, we also included a separate specification comparing the earnings associated with GCE 'A' Levels to possession of 5 or more GCSEs at grades A*-C. This additional analysis was undertaken to provide an indication of the fact that the academic ‘distance travelled’ by a (small) proportion of students in the 2018-19 University of Oxford cohort is greater than might be the case compared to those in possession of levels of prior attainment ‘traditionally’ associated with higher education entry. Similarly, for other students within the cohort, the academic ‘distance travelled’ is lower than the traditional prior attainment level (e.g. a small proportion of students intending to undertake a first degree had previously already completed a sub-degree level (i.e. ‘other undergraduate’) qualification).
In instances where the level of prior attainment for students at the University of Oxford was higher or lower than the ‘traditional’ counterfactual qualifications outlined in Table 21, the analysis used a ‘stepwise’ calculation of additional lifetime earnings. For example, to calculate the earnings and employment returns for a student in possession of an ‘other undergraduate’ qualification undertaking a first degree at the University of Oxford, we deducted the returns to undertaking an ‘other undergraduate’ qualification (relative to the possession of 2 or more GCE ‘A’ Levels) from the returns to undertaking a first degree (again relative to the possession of 2 or more GCE ‘A’ Levels). Similarly, to calculate the returns for a student in possession of 5 or more GCSEs at grades A*-C undertaking a first degree at the University of Oxford, we added the returns to achieving 2 or more GCE ‘A’ Levels (relative to the possession of 5 or more GCSEs at grades A*-C) to the returns to undertaking a first degree (relative to the possession of 2 or more GCE ‘A’ Levels)153.
A2.2.2 Marginal earnings and employment returns to higher education qualifications
Marginal earnings returns
To estimate the impact of qualification attainment on earnings, using information from the Labour Force Survey, we estimated a standard Ordinary Least Squares linear regression model, where the dependent variable is the natural logarithm of hourly earnings, and the independent variables include the full range
153 In some instances, this stepwise calculation would result in negative lifetime returns to achieving higher education qualifications. As this seems illogical and unlikely in reality, any negative returns in these instances were set to zero. Hence, the analysis implicitly assumes that all calculated gross returns (before the deduction of any foregone earnings or other costs) can only be greater than or equal to zero (i.e. there can be no wage or employment penalty associated with any higher education qualification attainment, irrespective of the level of prior education attainment).

82 London Economics
The economic impact of the University of Oxford
Annex 2 | Technical Annex
of qualifications held alongside a range of personal, regional, and job-related characteristics that might be expected to influence earnings. In this model specification, we included individuals who were employed on either a full-time or a part-time basis. This approach has been used widely in the academic literature.
The basic specification of the model was as follows:
𝑙𝑙𝑙𝑙 (𝜔𝜔𝑖𝑖) = 𝛼𝛼 + 𝛽𝛽𝑋𝑋𝑖𝑖 + 𝜖𝜖𝑖𝑖 for i = 1 to n154
where ln(𝜔𝜔𝑖𝑖) represents the natural logarithm of hourly earnings, 𝜖𝜖𝑖𝑖represents an error term, 𝛼𝛼 represents a constant term, and 𝑋𝑋𝑖𝑖 provides the independent variables included in the analysis, as follows:
Gender; Age; Age squared; Ethnic origin; Region of usual residence; Qualifications held; Marital status; Number of dependent children under the age of 16; Full-time / part-time employment; Temporary or permanent contract; Public or private sector employment; Workplace size; Interaction terms; and Yearly Dummies.
Using the above specification, we estimated earnings returns in aggregate and for men and women separately. Further, to analyse the benefits associated with different education qualifications over the lifetime of individuals holding these qualifications, the regressions were estimated separately across a range of specific age bands for the working age population, depending on the qualification considered. Further note that the analysis of earnings premiums was undertaken at a national (UK-wide) level. However, to adjust for differences across the Home Nations, these UK-wide earnings premiums were then combined with the relevant differential direct costs facing the individual and/or the public purse for students domiciled in the different Home Nations.
To estimate the impact of higher education qualifications on labour market outcomes using this methodology, we used information from pooled Quarterly UK Labour Force Surveys between 2004 and 2020155. The selection of information over this period is the longest time for which information on education and earnings is available on a relatively consistent basis.
The resulting estimates of the marginal wage returns to higher education qualifications are presented in Table 22. In the earnings regressions, the coefficients relating to the different higher education qualifications provide an indication of the additional effect on hourly earnings associated with possession of the respective higher education qualification relative to the counterfactual level of qualification. To take an example, the analysis suggests that men aged between 31 and 35 in possession of a first degree achieve a 22.3% hourly earnings premium compared to comparable men holding only 2 or more GCE ‘A’ levels as
154 Where i is an individual LFS respondent. 155 2020 Q3 is the most recently released LFS dataset available for use.

London Economics The economic impact of the University of Oxford 83
Annex 2 | Technical Annex
their highest level of attainment. The comparable estimate for women aged between 31 and 35 stands at 26.1%.
In addition to estimating marginal earnings returns on average across all subjects of study, we repeated the econometric analysis to estimate these returns separately by subject156. Combining these subject-level returns with the number of students in the 2018-19 cohort of University of Oxford students by subject, we then calculated subject mix adjustment factors (separately by gender and qualification level). These adjustment factors were then applied to the above average marginal wage returns (across all subjects) to adjust for the specific subject composition of the University’s student cohort.
Marginal earnings returns to higher education qualifications (in all subjects), in % (following exponentiation), by gender and age band
Qualification level Age band
16-20 21-25 26-30 31-35 36-40 41-45 46-50 51-55 56-60 61-65 Men 2 or more GCE A-levels1 8.8% 4.9% 10.0% 18.3% 24.9% 18.1% 26.0% 17.0% 19.2% 11.4% Other undergraduate2 -5.1% -4.9% 8.0% 7.7% 8.3% 11.9% First degree2 10.1% 16.0% 22.3% 20.7% 26.7% 17.8% 24.6% 23.6% 26.6% Other postgraduate3 10.5% 11.1% 8.1% 3.7% 4.6% Higher degree (taught)3 10.3% 11.5% 7.9% 10.2% 12.5% 12.4% 13.4% 12.3% 13.5% Higher degree (research)3 18.3% 19.0% 20.6% 19.7% 25.1% 27.0% 27.4% 47.7% Women 2 or more GCE A-levels1 8.5% 5.5% 10.0% 12.4% 17.9% 19.4% 14.1% 14.8% 13.4% 10.1% Other undergraduate2 3.0% 7.6% 10.3% 12.6% 17.6% 17.8% 20.9% First degree2 10.2% 17.4% 26.1% 33.4% 30.9% 31.9% 33.1% 27.6% 26.0% Other postgraduate3 9.1% 6.5% 9.1% 4.8% 7.0% 10.6% 13.9% 10.0% 12.5% Higher degree (taught)3 7.8% 6.3% 9.6% 12.4% 17.4% 22.1% 15.6% 27.8% 20.8% Higher degree (research)3 16.9% 20.0% 21.4% 31.1% 28.1% 38.4% 40.6% 34.0% 39.5%
Note: Regression coefficients have been exponentiated to reflect percentage wage returns. In cases where the estimated coefficients are not statistically significantly different from zero (at the 10% level), the coefficient is assumed to be zero; these are displayed as gaps in the table. 1 Returns to holding 2 or more GCE ‘A’ levels compared to 5 or more GCSEs at A*-C. 2 Returns to first degrees and ‘other’ undergraduate qualifications are estimated relative to individuals holding 2 or more GCE ‘A’ levels as their highest qualification. 3 Returns to higher degree (taught), higher degree (research), and ‘other’ postgraduate qualifications are estimated relative to undergraduate degrees. Source: London Economics' analysis of pooled Quarterly Labour Force Survey data for 2004-2020Q3
Marginal employment returns
To estimate the impact of qualification attainment on employment, we adopted a probit model to assess the likelihood of different qualification holders being in employment or otherwise. The basic specification defines an individual’s labour market outcome to be either in employment (working for payment or profit for more than 1 hour in the reference week (using the standard International Labour Organisation
156 The HESA Joint Academic Coding System (JACS) was used to classify subject areas. The following subject groups were distinguished: (1) Medicine & dentistry, (2) Subjects allied to medicine, (3) Biological sciences, (4) Veterinary science, (5) Agriculture & related subjects, (6) Physical sciences, (7) Mathematical sciences, (8) Computer science, (9) Engineering & technology, (A) Architecture, building & planning, (B) Social studies, (C) Law, (D) Business & administrative studies, (E) Mass communications & documentation, (F) Languages, (G) Historical & philosophical studies, (H) Creative arts & design, (I) Education, and (J) Combined.

84 London Economics
The economic impact of the University of Oxford
Annex 2 | Technical Annex
definition) or not in employment (being either unemployed or economically inactive)). The specification of the probit model was as follows:
𝑃𝑃𝑃𝑃𝑃𝑃𝑃𝑃𝑃𝑃𝑃𝑃(𝐸𝐸𝐸𝐸𝑃𝑃𝐸𝐸𝐸𝐸𝑇𝑇𝑖𝑖) = 𝛼𝛼 + 𝛾𝛾𝑍𝑍𝑖𝑖 + 𝜖𝜖𝑖𝑖 for i = 1 to n157
The dependent variable adopted represents the binary variable 𝐸𝐸𝐸𝐸𝑃𝑃𝐸𝐸𝐸𝐸𝑇𝑇𝑖𝑖, which is coded 1 if the individual is in employment and 0 otherwise158. We specified the model to contain a constant term (𝛼𝛼) as well as a number of standard independent variables including the qualifications held by an individual (represented by 𝑍𝑍𝑖𝑖 in the above equation) as follows:
Gender; Age; Age squared; Ethnic origin; Region of usual residence; Qualifications held; Marital status; Number of dependent children under the age of 16; and Yearly Dummies.
Again, 𝜖𝜖𝑖𝑖 represents an error term. Similar to the methodology for estimating earnings returns, the described probit model was estimated in aggregate and separately for men and women, with the analysis further split by respective age bands, and adjusted for the specific subject mix of students in the 2018-19 cohort of UK domiciled students attending the University of Oxford. Further, and again similar to the analysis of earnings returns, employment returns were estimated at the national (i.e. UK-wide) level.
The resulting estimated marginal employment returns to higher education qualifications (again on average across all subjects of study (i.e. before adjusting for the University’s specific subject mix)) are presented in Table 23. In the employment regressions, the relevant coefficients provide estimates of the impact of the qualification on the probability of being in employment (expressed in percentage points). Again, to take an example, the analysis estimates that a man aged between 31 and 35 in possession of a first degree is 2.5 percentage points more likely to be in employment than a man of similar age holding only 2 or more GCE ‘A’ levels as his highest level of education. The corresponding estimate for women stands at 4.4 percentage points.
157 Where i is an individual LFS respondent. 158 The probit function reflects the cumulative distribution function of the standard normal distribution.

London Economics The economic impact of the University of Oxford 85
Annex 2 | Technical Annex
Marginal employment returns to higher education qualifications (in all subjects), in percentage points, by gender and age band
Qualification level Age band
16-20 21-25 26-30 31-35 36-40 41-45 46-50 51-55 56-60 61-65 Men 2 or more GCE A-levels1 -2.1 3.0 1.4 1.9 1.4 1.6 Other undergraduate2 -2.9 -2.9 -2.0 First degree2 1.3 2.5 2.0 1.9 1.7 3.9 2.2 Other postgraduate3 5.1 1.0 1.9 1.5 2.5 Higher degree (taught)3 -1.0 2.3 3.1 Higher degree (research)3 1.9 3.8 7.4 9.7 Women 2 or more GCE A-levels1 3.8 3.2 2.2 1.9 3.2 3.6 Other undergraduate2 -3.4 First degree2 2.5 3.9 4.4 6.4 4.8 4.2 2.8 2.9 Other postgraduate3 3.8 3.6 4.0 3.5 Higher degree (taught)3 -1.8 3.6 2.6 2.9 5.5 Higher degree (research)3 -3.1 3.6 5.7 6.7 5.4 11.0 16.8
Note: In cases where the estimated coefficients are not statistically significantly different from zero (at the 10% level), the coefficient is assumed to be zero; these are displayed as gaps in the table. 1 Returns to holding 2 or more GCE ‘A’ levels compared to 5 or more GCSEs at A*-C. 2 Returns to first degrees and ‘other’ undergraduate qualifications are estimated relative to individuals holding 2 or more GCE ‘A’ levels as their highest qualification. 3 Returns to higher degree (taught), higher degree (research) and ‘other’ postgraduate qualifications are estimated relative to undergraduate degrees. Source: London Economics' analysis of pooled Quarterly Labour Force Survey data for 2004-2020Q3
A2.2.3 ‘Age-decay’ function
Many existing economic analyses considering the lifetime benefits associated with higher education qualifications to date (e.g. Walker and Zhu, 2013) have focused on the returns associated with the ‘traditional path’ of higher education qualification attainment – i.e. progression directly from secondary level education and completion of a three or four year undergraduate degree from the age of 19 onwards (completing by the age of 21 or 22). These analyses assume that there are direct costs (tuition fees etc.), as well as an opportunity cost (the foregone earnings whilst undertaking the qualification full-time) associated with qualification attainment. More importantly, these analyses make the implicit assumption that any and all of the estimated earnings and/or employment benefit achieved accrues to the individual.
However, the labour market outcomes associated with the attainment of higher education qualifications on a part-time basis are fundamentally different than those achieved by full-time students. In particular, part-time students typically undertake higher education qualifications several years later than the ‘standard’ full-time undergraduate (e.g. the estimated average age at enrolment amongst students in the 2018-19 cohort completing postgraduate taught degrees with the University of Oxford on a part-time basis is 35, compared to 24 for corresponding full-time students); generally undertake their studies over an extended period of time; and often combine their studies with full-time employment. Table 24 presents

86 London Economics
The economic impact of the University of Oxford
Annex 2 | Technical Annex
the assumed average age at enrolment, study duration, and age at completion for students in the 2018-19 University of Oxford cohort159.
Average age at enrolment, study duration, and age at completion for students in the 2018-19 University of Oxford cohort
Qualification level Full-time students Part-time students
Age at enrolment
Duration (years)
Age at completion
Age at enrolment
Duration (years)
Age at completion
Other undergraduate 20 1 21 47 2 49 First degree 18 3 21 - - - Other postgraduate 25 1 26 37 2 39 Higher degree (taught) 24 1 25 35 2 37 Higher degree (research) 25 4 29 43 6 49
Note: All values have been rounded to the nearest integer. There were no students in the 2018-19 cohort of University of Oxford students undertaking first degrees on a part-time basis. Source: London Economics' analysis based on University of Oxford HESA data
Given these characteristics, we adjust the methodology when estimating the returns to part-time (and later full-time) education attainment at the University, namely through the use of an ‘age-decay’ function. This approach assumes that possession of a particular higher education qualification is associated with a certain earnings or employment premium, and that this entire labour market benefit accrues to the individual if the qualification is attained before the age of 24 (for undergraduate qualifications) or 29 (for postgraduate qualifications).
However, as the age of attainment increases, it is expected that a declining proportion of the potential value of the estimated earnings and employment benefit accrues to the individual160. This calibration ensures that those individuals completing qualifications at a relatively older age will see relatively lower earnings and employment benefits associated with higher education qualification attainment (and perhaps reflect potentially different motivations amongst this group of learners). In contrast, those individuals attaining qualifications earlier in their working life will see a greater economic benefit (potentially reflecting the investment nature of qualification acquisition).
Table 25 presents the assumed age-decay adjustment factors which we apply to the marginal earnings and employment returns to full-time and part-time students undertaking qualifications at the University of Oxford in the 2018-19 cohort. To take an example, we have assumed that a student undertaking a postgraduate taught degree on a full-time basis achieves the full earnings and employment premium identified in the econometric analysis (for their entire working life). However, for a part-time postgraduate taught degree student, we assume that because of the late attainment (at age 37 (on average)), these students recoup only 74% of the corresponding full-time earnings and employment premiums from that age (of attainment).
159 The assumed average age at enrolment is based on the number of individuals in the cohort assumed to complete a given qualification at the University of Oxford (based on the assumption that some students might complete a different qualification than initially intended, or instead only complete several standalone credits/modules associated with the intended qualification (see Section 3.2 for more information)). In particular, the age at enrolment per qualification (based on the HESA data provided by the University of Oxford) is calculated as the weighted average age at enrolment across students in the 2018-19 cohort expected to complete the given qualification (weighted by the number of students starting different qualification aims and completing each given qualification, separately by study mode). The assumed average duration of study for both full-time and part-time students (by qualification level) is based on separate information provided by the University of Oxford. 160 E.g. Callender et al. (2011) suggest that the evidence points to decreasing employment returns with age at qualification: older graduates are less likely to be employed than younger graduates three and a half years after graduation; however, there are no differences in the likelihood of graduates undertaking part-time and full-time study being employed according to their age or motivations to study.
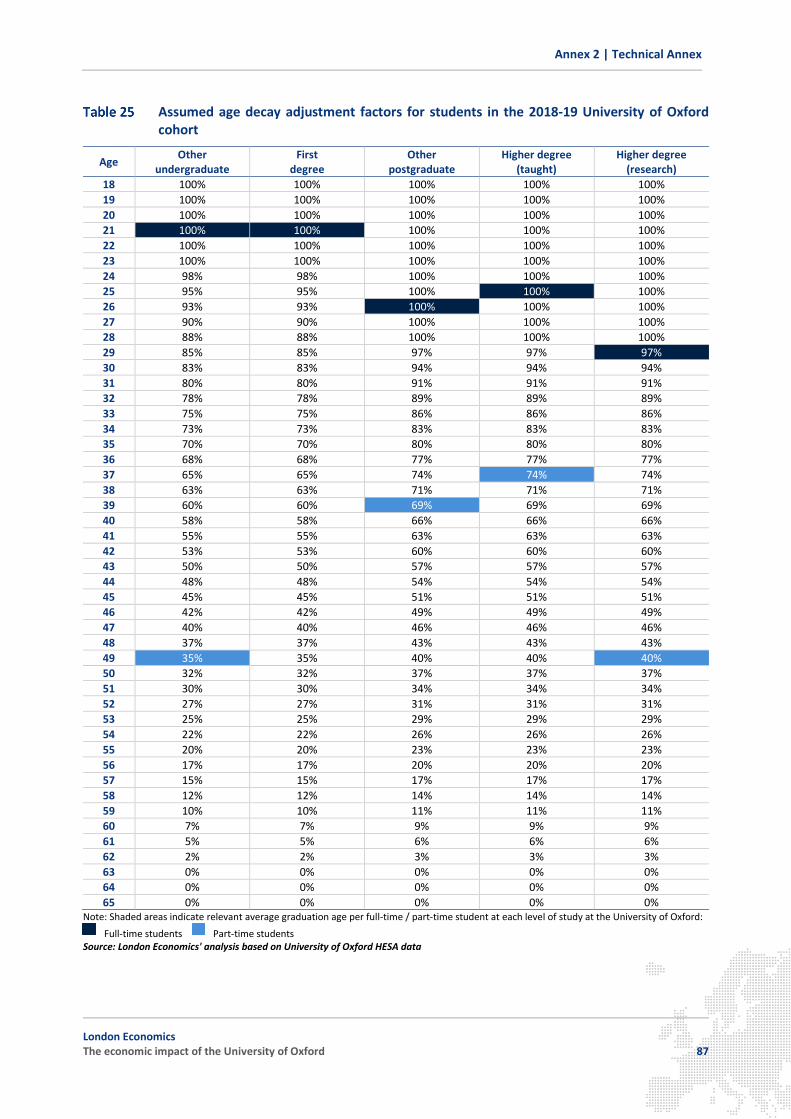
London Economics The economic impact of the University of Oxford 87
Annex 2 | Technical Annex
Assumed age decay adjustment factors for students in the 2018-19 University of Oxford cohort
Age Other undergraduate
First degree
Other postgraduate
Higher degree (taught)
Higher degree (research)
18 100% 100% 100% 100% 100% 19 100% 100% 100% 100% 100% 20 100% 100% 100% 100% 100% 21 100% 100% 100% 100% 100% 22 100% 100% 100% 100% 100% 23 100% 100% 100% 100% 100% 24 98% 98% 100% 100% 100% 25 95% 95% 100% 100% 100% 26 93% 93% 100% 100% 100% 27 90% 90% 100% 100% 100% 28 88% 88% 100% 100% 100% 29 85% 85% 97% 97% 97% 30 83% 83% 94% 94% 94% 31 80% 80% 91% 91% 91% 32 78% 78% 89% 89% 89% 33 75% 75% 86% 86% 86% 34 73% 73% 83% 83% 83% 35 70% 70% 80% 80% 80% 36 68% 68% 77% 77% 77% 37 65% 65% 74% 74% 74% 38 63% 63% 71% 71% 71% 39 60% 60% 69% 69% 69% 40 58% 58% 66% 66% 66% 41 55% 55% 63% 63% 63% 42 53% 53% 60% 60% 60% 43 50% 50% 57% 57% 57% 44 48% 48% 54% 54% 54% 45 45% 45% 51% 51% 51% 46 42% 42% 49% 49% 49% 47 40% 40% 46% 46% 46% 48 37% 37% 43% 43% 43% 49 35% 35% 40% 40% 40% 50 32% 32% 37% 37% 37% 51 30% 30% 34% 34% 34% 52 27% 27% 31% 31% 31% 53 25% 25% 29% 29% 29% 54 22% 22% 26% 26% 26% 55 20% 20% 23% 23% 23% 56 17% 17% 20% 20% 20% 57 15% 15% 17% 17% 17% 58 12% 12% 14% 14% 14% 59 10% 10% 11% 11% 11% 60 7% 7% 9% 9% 9% 61 5% 5% 6% 6% 6% 62 2% 2% 3% 3% 3% 63 0% 0% 0% 0% 0% 64 0% 0% 0% 0% 0% 65 0% 0% 0% 0% 0%
Note: Shaded areas indicate relevant average graduation age per full-time / part-time student at each level of study at the University of Oxford:
Full-time students Part-time students Source: London Economics' analysis based on University of Oxford HESA data

88 London Economics
The economic impact of the University of Oxford
Annex 2 | Technical Annex
Note that the application of the ‘age-decay’ function implies that, for all qualification levels at the University, the estimated employment and earnings returns for part-time students are lower than the returns for comparable full-time students. These differences reflect the (relatively limited) wider economic literature on the returns to part-time study161.
A2.2.4 Estimating the gross graduate premium and gross public purse benefit
The gross graduate premium associated with qualification attainment is defined as the present value of enhanced post-tax earnings (i.e. after income tax, National Insurance and VAT are removed, and following the deduction of foregone earnings) relative to an individual in possession of the counterfactual qualification. To estimate the value of the gross graduate premium, it is necessary to extend the econometric analysis (presented above; see Annex A2.2.2) by undertaking the following elements of analysis (separately by qualification level, gender, and study mode):
1. We estimated the employment-adjusted annual earnings achieved by individuals in the counterfactual groups (i.e. 2 or more GCE ‘A’ Levels or a first degree).
2. We inflated these baseline or counterfactual earnings using the marginal earnings premiums and employment premiums (presented in Table 22 and Table 23 in Annex A2.2.2), adjusted to reflect late attainment (as outlined in Annex A2.2.3), to produce annual age-earnings profiles associated with the possession of each particular qualification.
3. We adjusted these age-earnings profiles to account for the fact that earnings would be expected to increase in real terms over time (at an assumed rate of 0.8% per annum (based on average earnings growth rate forecasts estimated by the Office for Budget Responsibility (2020 and 2021)162).
4. Based on the earnings profiles generated by qualification holders, and income tax and National Insurance rates and allowances for the relevant academic year163, we computed the future stream of net earnings (i.e. post-tax)164. Using similar assumptions, we further calculated the stream of (employment-adjusted) foregone earnings (based on earnings in the relevant counterfactual group165) during the period of study, again net of tax, for full-time students only.
161 In general, these studies suggest that the economic returns to studying part-time are lower than the economic returns associated with studying full-time. This is in part because part-time students are often already employed when undertaking their studies, so the marginal (or additional) impact of the higher education qualification is lower. For instance, six months after graduation, graduates undertaking part-time study were three percentage points more likely to be employed than graduates undertaking full-time study, and less than half as likely (3% compared to 7%) to be unemployed. See Callender et al. (2011). According to the same study, the salaries of graduates from part-time study grow at a slower pace compared with their full-time peers. Part-time graduates are less likely to see their salaries increase and are more likely to see their salaries stagnate between 6 months and 42 months after graduation: specifically, during this period, 78% of part-time graduates and 88% of full-time graduates saw their salaries rise, while 16% of part-time and 8% of full-time graduates experienced no change in salaries, and 6% of part-time and only 2% of former full-time students saw a drop in their salaries. 162 Specifically, we make use of the Office for Budget Responsibility’s most recent short-term forecasts (for 2019 to 2025; see Office for Budget Responsibility (2021)) as well as their most recent long-term forecasts (for 2026 to 2069; see Office for Budget Responsibility (2020)) of nominal average earnings growth. The assumed 0.8% rate captures the average annual real earnings growth rate over the total period (adjusted from nominal to real terms based on projected (Retail Price Index) inflation over the same period (and based on the same sources). 163 i.e. 2018-19. Note that the analysis assumes fiscal neutrality, i.e. it is asserted that, in subsequent years, the earnings tax and National Insurance income bands grow at the same rate of annual earnings growth of 0.8%. 164 The tax adjustment also takes account of increased VAT revenues for HMG, by assuming that individuals consume 91.5% of their annual income, and that 50% of their consumption is subject to VAT at a rate of 20%. The assumed proportion of income consumed is based on forecasts of the household savings rate published by the Office for Budget Responsibility (2021), while the proportion of consumption subject to VAT is based on VAT estimates provided by the Office for Budget Responsibility (no date). 165 The foregone earnings calculations are based on the baseline or counterfactual earnings associated with either 2 or more GCE ‘A’ Levels or first degrees. Specifically, as outlined in Annex A2.2.1, some students in the 2018-19 University of Oxford cohort were in possession of other levels of prior attainment. To accommodate this, as a simplifying assumption, the foregone earnings for students previously in possession of other undergraduate qualifications (other than first degrees) are based on the earnings associated with possession of 2 or more GCE ‘A’ Levels as the highest qualification (adjusted for the age at enrolment and completion associated with the relevant qualification obtained). In addition, the

London Economics The economic impact of the University of Oxford 89
Annex 2 | Technical Annex
5. We calculated the discounted stream of additional (employment-adjusted) future earnings compared to the relevant counterfactual group (using a standard discount rate of 3.5% as presented in HM Treasury Green Book (HM Treasury, 2018)), and the discounted stream of foregone earnings during qualification attainment (for full-time students), to generate a present value figure. We thus arrive at the gross graduate premium (or equivalent for other qualifications).
6. The discounted stream of enhanced taxation revenues minus the tax income foregone during students’ qualification attainment (where relevant) derived in element 4 provides an estimate of the gross public benefit associated with higher education qualification attainment.
Note that the gross graduate premium and gross public benefit for students undertaking qualifications at a level equivalent to or lower than the highest qualification that they are already in possession of was assumed to be zero. For example, it is assumed that a student in possession of a taught postgraduate degree undertaking an additional postgraduate qualification at the University of Oxford will not accrue any wage or employment benefits from this additional qualification attainment (while still incurring the costs of foregone earnings during the period of study, if they studied on a full-time basis).
Further note that the analysis of gross graduate premiums and public purse benefits was undertaken at a national (UK-wide) level. To adjust for differences across the Home Nations, these UK-wide premiums were then combined with the relevant differential student support costs facing the individual and/or the Exchequer for students domiciled in the different Home Nations and studying in England.
The resulting gross graduate premiums and gross public purse benefits per student (by study mode, level of study, gender, and prior attainment) are presented in Table 26.
A2.2.5 Net graduate premium and net public benefit
Table 27 and Table 28 provide detailed information on the net graduate premiums and net public benefits for students associated with all higher education qualifications offered by the University of Oxford (respectively), based on the 2018-19 cohort. Each table provides detailed information on the net graduate premiums/net Exchequer benefits by student domicile, study mode, study level, prior attainment, and gender166.
estimated foregone earnings for students previously in possession of postgraduate qualifications are based on the level of earnings associated with first degrees. 166 In terms of gender, it is important to note that the economic benefits associated with higher education qualifications - expressed in monetary terms - are generally lower for women than men, predominantly as a result of the increased likelihood of spending time out of the active labour force. However, as with the majority of the wider economic literature, the marginal benefits associated with higher education qualifications - expressed as either the percentage increase in hourly earnings or enhanced probability of employment - are often greater for women than for men (see Annex A2.2.2).

90 London Economics
The economic impact of the University of Oxford
Annex 2 | Technical Annex
Gross graduate premiums and Exchequer benefits per student associated with HE qualification attainment at the University of Oxford, by study mode, level, gender, and prior attainment
Level of study
Previous qualification and gender
GCSE A-level Other undergraduate First degree Other
postgraduate Higher degree
(taught) Higher degree
(research) Men Women Men Women Men Women Men Women Men Women Men Women Men Women
Gross graduate premiums Full-time students Other undergraduate £62,000 -£10,000 -£9,000 -£10,000 -£10,000 -£8,000 First degree £81,000 £66,000 £87,000 £71,000 -£21,000 -£16,000 -£21,000 -£21,000 -£16,000 -£21,000 -£16,000 Other postgraduate £35,000 £57,000 -£19,000 -£17,000 -£19,000 -£17,000 -£19,000 -£17,000 Higher degree (taught) £227,000 £149,000 £136,000 £31,000 £39,000 -£17,000 -£16,000 -£17,000 -£16,000 -£17,000 -£16,000 Higher degree (research) £162,000 £148,000 £57,000 £56,000 £11,000 -£10,000 £14,000 £2,000 -£81,000 -£71,000 Part-time students Other undergraduate £19,000 £10,000 £5,000 £4,000 £0 £0 £0 £0 £0 £0 £0 £0 £0 £0 First degree Other postgraduate £128,000 £109,000 £91,000 £73,000 £85,000 £22,000 £43,000 £0 £0 £0 £0 £0 £0 Higher degree (taught) £157,000 £95,000 £95,000 £35,000 £46,000 £9,000 £0 £0 £0 £0 £0 Higher degree (research) £40,000 £35,000 £19,000 £28,000 £19,000 £0 £0 Gross Exchequer benefits Full-time students Other undergraduate £60,000 -£2,000 -£1,000 -£2,000 -£2,000 -£1,000 First degree £94,000 £70,000 £99,000 £74,000 -£5,000 -£2,000 -£5,000 -£5,000 -£2,000 -£5,000 -£2,000 Other postgraduate £47,000 £54,000 -£10,000 -£7,000 -£10,000 -£7,000 -£10,000 -£7,000 Higher degree (taught) £219,000 £152,000 £120,000 £43,000 £39,000 -£7,000 -£7,000 -£7,000 -£7,000 -£7,000 -£7,000 Higher degree (research) £203,000 £149,000 £106,000 £71,000 £58,000 £17,000 £61,000 £27,000 -£42,000 -£33,000 Part-time students Other undergraduate £16,000 £8,000 £4,000 £3,000 £0 £0 £0 £0 £0 £0 £0 £0 £0 £0 First degree Other postgraduate £121,000 £89,000 £74,000 £73,000 £70,000 £25,000 £35,000 £0 £0 £0 £0 £0 £0 Higher degree (taught) £148,000 £95,000 £79,000 £38,000 £38,000 £9,000 £0 £0 £0 £0 £0 Higher degree (research) £41,000 £35,000 £15,000 £29,000 £15,000 £0 £0 Note: All values are rounded to the nearest £1,000. Gaps may arise where there are no students in the 2018-19 University of Oxford cohort expected to complete the given qualification (with the given characteristics). Grey shading indicates instances where the level of study at the University of Oxford is equal to or lower than the level of previous attainment. In these instances, the analysis implicitly assumes that all calculated gross returns (before the deduction of any foregone earnings or other costs) can only be larger or equal to zero (i.e. there can be no wage or employment penalty associated with any higher education qualification attainment). Hence, each grey-shaded cell displays only the assumed underlying foregone earnings. Source: London Economics' analysis

London Economics The economic impact of the University of Oxford 91
Annex 2 | Technical Annex
Net graduate premiums per student associated with HE qualification attainment at the University of Oxford, by study mode, level, gender, prior attainment, and domicile
Level of study
Previous qualification and gender
GCSE A-level Other undergraduate First degree Other
postgraduate Higher degree
(taught) Higher degree
(research) Men Women Men Women Men Women Men Women Men Women Men Women Men Women
Students from England Full-time students Other undergraduate £62,000 -£11,000 -£9,000 -£11,000 -£11,000 -£9,000 First degree £79,000 £65,000 £86,000 £69,000 -£22,000 -£17,000 -£22,000 -£22,000 -£17,000 -£22,000 -£17,000 Other postgraduate £23,000 £45,000 -£32,000 -£29,000 -£32,000 -£29,000 -£32,000 -£29,000 Higher degree (taught) £215,000 £137,000 £124,000 £19,000 £27,000 -£29,000 -£28,000 -£29,000 -£28,000 -£29,000 -£28,000 Higher degree (research) £141,000 £126,000 £35,000 £34,000 -£10,000 -£32,000 -£8,000 -£19,000 -£103,000 -£92,000 Part-time students Other undergraduate £22,000 £13,000 £8,000 £7,000 £3,000 £3,000 £3,000 £3,000 £3,000 £3,000 £3,000 £3,000 £3,000 £3,000 First degree Other postgraduate £122,000 £103,000 £85,000 £66,000 £78,000 £16,000 £37,000 -£7,000 -£7,000 -£7,000 -£7,000 -£7,000 -£7,000 Higher degree (taught) £146,000 £84,000 £84,000 £24,000 £35,000 -£1,000 -£11,000 -£11,000 -£11,000 -£11,000 -£11,000 Higher degree (research) £16,000 £10,000 -£6,000 £4,000 -£6,000 -£25,000 -£25,000 Students from Wales Full-time students Other undergraduate -£8,000 -£7,000 First degree £86,000 £72,000 Other postgraduate £23,000 £45,000 -£32,000 -£29,000 Higher degree (taught) £21,000 £28,000 -£27,000 Higher degree (research) £35,000 £34,000 -£8,000 -£19,000 Part-time students Other undergraduate £24,000 £9,000 £8,000 £4,000 £4,000 £4,000 £4,000 £4,000 £4,000 £4,000 £4,000 £4,000 £4,000 First degree Other postgraduate £16,000 £37,000 -£7,000 -£7,000 -£7,000 Higher degree (taught) £26,000 £37,000 -£9,000 -£9,000 Higher degree (research) £4,000 -£6,000

92 London Economics
The economic impact of the University of Oxford
Annex 2 | Technical Annex
Level of study
Previous qualification and gender
GCSE A-level Other undergraduate First degree Other
postgraduate Higher degree
(taught) Higher degree
(research) Men Women Men Women Men Women Men Women Men Women Men Women Men Women
Students from Scotland Full-time students Other undergraduate -£13,000 First degree £74,000 £60,000 £81,000 -£27,000 -£22,000 Other postgraduate £23,000 £45,000 -£32,000 -£29,000 Higher degree (taught) £19,000 £27,000 -£29,000 -£28,000 -£29,000 Higher degree (research) £33,000 £32,000 -£10,000 -£22,000 Part-time students Other undergraduate £3,000 £2,000 -£2,000 -£2,000 -£2,000 -£2,000 -£2,000 -£2,000 -£2,000 -£2,000 -£2,000 First degree Other postgraduate £16,000 £37,000 -£7,000 -£7,000 Higher degree (taught) £24,000 £35,000 -£11,000 -£11,000 Higher degree (research) Students from Northern Ireland Full-time students Other undergraduate First degree £73,000 £58,000 Other postgraduate £23,000 £45,000 Higher degree (taught) £19,000 £27,000 -£29,000 Higher degree (research) £33,000 £32,000 -£10,000 -£22,000 Part-time students Other undergraduate £4,000 £0 £0 £0 £0 £0 £0 First degree Other postgraduate £37,000 -£7,000 Higher degree (taught) Higher degree (research) Note: All values are rounded to the nearest £1,000. Gaps may arise where there are no students in the 2018-19 University of Oxford cohort expected to complete the given qualification (with the given characteristics). Grey shading indicates instances where the level of study at the University of Oxford is equal to or lower than the level of previous attainment. In these instances, the analysis implicitly assumes that all calculated gross returns (before the deduction of any foregone earnings or other costs) can only be larger or equal to zero (i.e. there can be no wage or employment penalty associated with any higher education qualification attainment). Hence, each grey-shaded cell displays only the assumed underlying direct or indirect costs associated with qualification attainment. Source: London Economics' analysis

London Economics The economic impact of the University of Oxford 93
Annex 2 | Technical Annex
Net Exchequer benefits per student associated with HE qualification attainment at the University of Oxford, by study mode, level, gender, prior attainment, and domicile
Level of study
Previous qualification and gender
GCSE A-level Other undergraduate First degree Other
postgraduate Higher degree
(taught) Higher degree
(research) Men Women Men Women Men Women Men Women Men Women Men Women Men Women
Students from England Full-time students Other undergraduate £52,000 -£10,000 -£10,000 -£10,000 -£10,000 -£9,000 First degree £70,000 £46,000 £75,000 £51,000 -£28,000 -£25,000 -£28,000 -£28,000 -£25,000 -£28,000 -£25,000 Other postgraduate £46,000 £53,000 -£11,000 -£9,000 -£11,000 -£9,000 -£11,000 -£9,000 Higher degree (taught) £218,000 £151,000 £119,000 £42,000 £38,000 -£8,000 -£8,000 -£8,000 -£8,000 -£8,000 -£8,000 Higher degree (research) £201,000 £146,000 £104,000 £69,000 £55,000 £15,000 £58,000 £25,000 -£45,000 -£36,000 Part-time students Other undergraduate £11,000 £2,000 -£1,000 -£2,000 -£5,000 -£5,000 -£5,000 -£5,000 -£5,000 -£5,000 -£5,000 -£5,000 -£5,000 -£5,000 First degree Other postgraduate £120,000 £89,000 £74,000 £73,000 £69,000 £25,000 £35,000 £0 £0 £0 £0 £0 £0 Higher degree (taught) £147,000 £94,000 £78,000 £38,000 £38,000 £9,000 £0 £0 £0 £0 £0 Higher degree (research) £38,000 £33,000 £12,000 £26,000 £12,000 -£2,000 -£2,000 Students from Wales Full-time students Other undergraduate -£13,000 -£12,000 First degree £63,000 £39,000 Other postgraduate £46,000 £53,000 -£11,000 -£9,000 Higher degree (taught) £40,000 £37,000 -£9,000 Higher degree (research) £104,000 £69,000 £58,000 £25,000 Part-time students Other undergraduate £10,000 -£2,000 -£4,000 -£7,000 -£7,000 -£7,000 -£7,000 -£7,000 -£7,000 -£7,000 -£7,000 -£7,000 -£7,000 First degree Other postgraduate £25,000 £35,000 £0 £0 £0 Higher degree (taught) £36,000 £36,000 -£2,000 -£2,000 Higher degree (research) £26,000 £12,000

94 London Economics
The economic impact of the University of Oxford
Annex 2 | Technical Annex
Level of study
Previous qualification and gender
GCSE A-level Other undergraduate First degree Other
postgraduate Higher degree
(taught) Higher degree
(research) Men Women Men Women Men Women Men Women Men Women Men Women Men Women
Students from Scotland Full-time students Other undergraduate -£8,000 First degree £75,000 £51,000 £80,000 -£23,000 -£21,000 Other postgraduate £46,000 £53,000 -£11,000 -£9,000 Higher degree (taught) £42,000 £38,000 -£8,000 -£8,000 -£8,000 Higher degree (research) £106,000 £71,000 £61,000 £27,000 Part-time students Other undergraduate £4,000 £2,000 £0 £0 £0 £0 £0 £0 £0 £0 £0 First degree Other postgraduate £25,000 £35,000 £0 £0 Higher degree (taught) £38,000 £38,000 £0 £0 Higher degree (research) Students from Northern Ireland Full-time students Other undergraduate First degree £77,000 £52,000 Other postgraduate £46,000 £53,000 Higher degree (taught) £42,000 £38,000 -£8,000 Higher degree (research) £106,000 £71,000 £61,000 £27,000 Part-time students Other undergraduate £0 -£2,000 -£2,000 -£2,000 -£2,000 -£2,000 -£2,000 First degree Other postgraduate £35,000 £0 Higher degree (taught) Higher degree (research) Note: All values are rounded to the nearest £1,000. Gaps may arise where there are no students in the 2018-19 University of Oxford cohort expected to complete the given qualification (with the given characteristics). Grey shading indicates instances where the level of study at the University of Oxford is equal to or lower than the level of previous attainment. In these instances, the analysis implicitly assumes that all calculated gross returns (before the deduction of any foregone earnings or other costs) can only be larger or equal to zero (i.e. there can be no wage or employment penalty associated with any higher education qualification attainment). Hence, each grey-shaded cell displays only the assumed underlying direct or indirect costs associated with qualification attainment. Source: London Economics' analysis

London Economics The economic impact of the University of Oxford 95
Annex 2 | Technical Annex
A2.3 Impact on educational exports
A2.3.1 Additional information on the 2018-19 cohort of non-UK domiciled students studying at the University of Oxford
Table 29 presents a detailed breakdown of the 2018-19 non-UK domiciled University of Oxford cohort, by domicile, level, and mode of study.
Non-UK domiciled students in the 2018-19 cohort of University of Oxford students, by level of study, mode of study and domicile
Level and mode of study Domicile
EU Non-EU Total Full-time Other undergraduate 10 20 30 First degree 275 470 745 Other postgraduate 10 15 25 Higher degree (taught) 365 1,450 1,815 Higher degree (research) 275 610 885 Total 935 2,565 3,500 Part-time Other undergraduate 50 145 195 First degree 0 0 0 Other postgraduate 70 240 310 Higher degree (taught) 90 230 320 Higher degree (research) 0 20 20 Total 210 635 845 Total Other undergraduate 60 165 225 First degree 275 470 745 Other postgraduate 80 255 335 Higher degree (taught) 455 1,680 2,135 Higher degree (research) 275 630 905 Total 1,145 3,200 4,345
Note: All numbers are rounded to the nearest 5, and the total values may not add up precisely due to this rounding. ‘Other undergraduate’ learning includes Certificates of Higher Education, Diplomas of Higher Education, other undergraduate-level diplomas, and undergraduate-level credits. ‘Other postgraduate learning’ includes Postgraduate Certificates or Professional Graduate Diplomas in Education, other certificates and diplomas at postgraduate level, taught work for credit at postgraduate level, and research-based postgraduate degrees below Master’s or Doctorate level. Source: London Economics' analysis based on the University of Oxford’s HESA data
A2.3.2 Net tuition fee income per international student
Table 30 presents estimates of the net tuition fee income per international student in the 2018-19 University of Oxford cohort (over the entire study duration), by domicile, level of study, and mode of study.

96 London Economics
The economic impact of the University of Oxford
Annex 2 | Technical Annex
Net tuition fee income per international student in the 2018-19 cohort of University of Oxford students, by level of study, mode, and domicile
Level EU domiciled students Non-EU domiciled students
Full-time Part-time Full-time Part-time Other undergraduate £3,000 £1,000 £26,000 £6,000 First degree £9,000 £73,000 Other postgraduate £13,000 £8,000 £24,000 £15,000 Higher degree (taught) £13,000 £14,000 £24,000 £24,000 Higher degree (research) £7,000 £14,000 £57,000 £77,000
Note: Gaps may arise where there are no students in the 2018-19 University of Oxford cohort expected to complete the given qualification (of the given characteristics). All estimates are presented in 2018-19, discounted to reflect net present values, and rounded to the nearest £1,000. Source: London Economics' analysis
A2.3.3 Assumed average stay durations among international students
As outlined in Section 4.2.2, to estimate the non-tuition fee income associated with EU and non-EU students in the 2018-19 cohort of University of Oxford students, we adjusted the estimates of non-tuition fee expenditure per academic year from the Student Income and Expenditure Survey (based on English-domiciled students) to reflect longer stay durations in the UK for EU and non-EU students.
In particular, following a similar approach as outlined by the Department for Business, Innovation and Skills (2011b), we assume that EU-domiciled postgraduate and non-EU undergraduate and postgraduate students spend a larger amount of time in the UK than prescribed by the duration of the academic year (39 weeks), on average167. Hence, we assume that all international postgraduate students (both EU and non-EU domiciled) spend 52 weeks per year in the UK, as they write their dissertations during the summer. Further, we assume that non-EU domiciled and EU domiciled undergraduate students spend an average of 42 and 39 weeks per year in the UK (respectively). The lower stay duration for EU undergraduate students reflects the expectation that these students, given the relative geographical proximity to their home countries and the resulting relative ease and low cost of transport, are more likely to return home during holidays. These assumptions are summarised in Table 31.
Assumed average stay durations (in years) for non-UK domiciled students, by study level and study mode
Level of study Domicile
EU (outside UK) Non-EU Undergraduate 39 weeks 42 weeks Postgraduate 52 weeks 52 weeks
Source: London Economics’ analysis based on Department for Business, Innovation and Skills (2011b)
A2.3.4 Non-fee income per international student
Table 32 presents estimates of the non-tuition fee income per international student in the 2018-19 University of Oxford cohort (over the entire study duration), by domicile, level of study, and mode of study.
167 There may be significant variation around these assumed average stay durations depending on individual students’ circumstances, such as country of origin, parental income etc. Further note that we have made separate adjustments to the non-tuition fee expenditures of international students in the cohort during the 2019-20 and 2020-21 academic years to account for the increased likelihood of students returning to their home countries during the Covid-19 pandemic (see Section 4.2.2).

London Economics The economic impact of the University of Oxford 97
Annex 2 | Technical Annex
Non-fee fee income per international student in the 2018-19 cohort of University of Oxford students, by level of study, mode, and domicile
Level EU domiciled students Non-EU domiciled students
Full-time Part-time Full-time Part-time Other undergraduate £11,000 £28,000 £12,000 £30,000 First degree £30,000 £33,000 Other postgraduate £15,000 £37,000 £15,000 £37,000 Higher degree (taught) £15,000 £37,000 £15,000 £37,000 Higher degree (research) £55,000 £105,000 £55,000 £105,000
Note: Gaps may arise where there are no students in the 2018-19 University of Oxford cohort expected to complete the given qualification (for the given characteristics). All estimates are presented in 2018-19 prices, discounted to reflect net present values, and rounded to the nearest £1,000. Source: London Economics' analysis

98 London Economics
The economic impact of the University of Oxford
Annex 3 | Total impact by region and sector (where available)
Annex 3 Total impact by region and sector (where available)
In addition to the total impact on the UK economy as a whole (presented in Section 7), it was possible to disaggregate some strands of the University’s economic impact by sector and region (and estimate the impacts in terms of economic output as well as GVA and FTE employment). The strands of impact for which this disaggregation was achievable include:
The impact of the University’s knowledge exchange activities (estimated at £3,413 million, see Section 2.2);
The impact of the University’s educational exports (£732 million, see Section 4); The impact associated with the operating and capital expenditure of the University and its
colleges (£6,032 million, see Section 5); and The impact of the University’s contribution to tourism (£611 million, see Section 6).
Hence, approximately £10,788 million (69%) of the University of Oxford’s total impact of £15,706 million can be disaggregated in this way168 (see Figure 34).
In terms of the breakdown by region, the analysis indicates that of this total of £10,788 million, £6,732 million (62%) was generated in the South East, with £4,057 million (38%) occurring in other regions across the UK (with impacts in excess of £100 million occurring in each region outside of the South East).
In terms of sector, the University’s activities resulted in particularly large impacts within the government, health, and education sector (£3,354 million, 31%), the distribution, transport, hotel, and restaurant sector (£1,715 million, 16%), the production sector (£1,687 million, 16%), and the professional and support activities sector (£1,399 million, 13%).
168 The remaining £4.9 billion of impact includes the impact of the University’s research activities (£4.5 billion, where a breakdown by region or sector is not available as it was not possible to assign the geographic location or sectors of businesses benefiting from productivity spillovers generated by the University’s research); and the impact of teaching and learning activities (£422 million, where a breakdown by region or sector is not available due to graduate mobility (i.e. it is very difficult to determine the region/sector of employment that graduates end up in).

London Economics The economic impact of the University of Oxford 99
Annex 3 | Total impact by region and sector (where available)
Total economic impact of the University’s activities in 2018-19, by region and sector (where possible) By region By sector
Note: Monetary estimates are presented in 2018-19 prices, discounted to reflect net present values (where applicable), rounded to the nearest £1 million, and may not add up precisely to the totals indicated. Employment estimates are rounded to the nearest 5, and again may not add up precisely to the totals indicated. Source: London Economics’ analysis
£141m £350m £298m £305m £338m £426m
£1,325m £6,732m
£332m £172m £263m
£107m £10,788m
£0m £2,000m £4,000m £6,000m £8,000m £10,000m £12,000m
North EastNorth West
Yorkshire & the HumberEast Midlands
West MidlandsEast of England
LondonSouth East
South WestWales
ScotlandNorthern Ireland
Total
Economic output, £m
Output, £m £65m £1,687m
£267m £1,715m
£502m £549m
£951m £1,399m
£3,354m £301m
£10,788m
£0m £2,000m £4,000m £6,000m £8,000m £10,000m £12,000m
AgricultureProduction
ConstructionDistr., transport, hotels & restaurants
Information & communicationFinancial & insurance
Real estateProfessional & support activitiesGovernment, health & education
Other servicesTotal
Economic output, £m
Output, £m
£95m £188m £170m £176m £192m £245m
£582m £3,673m
£200m £114m £154m
£76m £5,865m
£0m £1,000m £2,000m £3,000m £4,000m £5,000m £6,000m
North EastNorth West
Yorkshire & the HumberEast Midlands
West MidlandsEast of England
LondonSouth East
South WestWales
ScotlandNorthern Ireland
Total
GVA, £m
GVA, £m £28m £562m
£103m £895m
£274m £233m
£742m £793m
£2,051m £184m
£5,865m
£0m £1,000m £2,000m £3,000m £4,000m £5,000m £6,000m
AgricultureProduction
ConstructionDistr., transport, hotels & restaurants
Information & communicationFinancial & insurance
Real estateProfessional & support activitiesGovernment, health & education
Other servicesTotal
GVA, £m
GVA, £m
1,2452,4002,3452,3852,4452,925
5,07545,520
2,5201,6101,830
1,04071,340
0 10,000 20,000 30,000 40,000 50,000 60,000 70,000
North EastNorth West
Yorkshire & the HumberEast Midlands
West MidlandsEast of England
LondonSouth East
South WestWales
ScotlandNorthern Ireland
Total
# of full-time equivalent employees
FTE employment 9456,320
1,00515,530
2,4951,730
1,09513,660
26,5402,050
71,340
0 10,000 20,000 30,000 40,000 50,000 60,000 70,000
AgricultureProduction
ConstructionDistr., transport, hotels & restaurants
Information & communicationFinancial & insurance
Real estateProfessional & support activitiesGovernment, health & education
Other servicesTotal
# of full-time equivalent employees
FTE employment

Somerset House, New Wing, Strand London, WC2R 1LA, United Kingdom [email protected] londoneconomics.co.uk
: @LE_Education @LondonEconomics +44 (0)20 3701 7700


