The Economic Impacts of the Atlantic Coast Pipeline Prepared for Dominion Transmission, Inc. Prepared by ICF International 9300 Lee Highway Fairfax, VA 22031 1331 Lamar, Suite 660 Houston, TX 77010 February 9, 2015
Transcript
The Economic Impacts of the Atlantic Coast Pipeline
Prepared for
Dominion Transmission, Inc.
Prepared by
ICF International 9300 Lee Highway Fairfax, VA 22031 1331 Lamar, Suite 660 Houston, TX 77010
This report reflects ICF’s opinion and best judgment based upon the information available to it at the time of its preparation. ICF’s opinions are based upon historical relationships and expectations that ICF believes are reasonable. Some of the underlying assumptions, including those detailed explicitly or implicitly in this report, may not materialize because of unanticipated events and circumstances. ICF’s opinions could, and would, vary materially, should any of the above assumptions prove to be inaccurate.
Energy Cost Savings ..................................................................................................................................... 9
Natural Gas Market Impact ....................................................................................................................... 9
Residential, Commercial and Industrial Market Impacts .................................................................... 10
Electric Market Impact ............................................................................................................................. 11
Total Consumer Cost Savings ............................................................................................................... 11
Market Area Economic Impacts ................................................................................................................. 12
Dominion Transmission, Inc. (Dominion) engaged ICF International (ICF) to provide an independent assessment of the Atlantic Coast Pipeline (ACP)’s impacts on market area natural gas and electric prices, as well as the impacts on regional economies.
Dominion and its partners1 have proposed ACP to serve the growing need for natural gas in Virginia and North Carolina, enhance the reliable delivery of natural gas supplies, and expand consumer access to supplies from the neighboring states where the
burgeoning Marcellus and Utica shale plays are located.2 ACP will also provide connections with other supply sources, both shale and non-shale, transiting its Appalachian origin. These multiple supply sources, in the aggregate, have the potential to lower supply costs for ACP market area shippers and their customers. The pipeline will also deliver natural gas to serve consumers in regions of Virginia and North Carolina that are, at present, remote from existing infrastructure. 3 As shown in Exhibit 1, ACP is planned as a 1.5 billion cubic feet per day (Bcf/d) pipeline4 that will significantly expand access to gas supplies from the Appalachian Basin in West Virginia, southwest Pennsylvania, and eastern Ohio to natural gas utilities and power plants in Virginia and North Carolina.5 Virginia and North Carolina have historically been supplied by gas supplies delivered on pipelines originating in the US Gulf Coast, augmented by pipelines transporting supplies produced in the Appalachian Basin, which now includes the additional sources produced from the Marcellus and Utica shale plays. Power plant operators and gas utilities serving Virginia and North Carolina have already subscribed to nearly 91 percent of ACP’s capacity.
1 The announced partners include Duke Energy, Piedmont Natural Gas and AGL Resources. 2 https://www.dom.com/corporate/what-we-do/natural-gas/atlantic-coast-pipeline 3 Ibid. 4 For context, a 1000 megawatt (MW) natural gas-fired power plant can consume about .2 Bcf/d of natural gas in full operation. 1000 MW is a common size capacity for such power plants, although plants can be larger or smaller. In gas heating, .1 Bcf/d would heat approximately 400,000 average-size homes. 5 https://www.dom.com/corporate/what-we-do/natural-gas/atlantic-coast-pipeline
Exhibit 1: Atlantic Coast Pipeline and Other Natural Gas Infrastructure Serving Virginia and North Carolina
Source: ICF, Ventyx
Economic Assessment Overview
This report summarizes ICF’s analysis of ACP’s potential energy cost savings to natural gas and electricity consumers in Virginia and North Carolina and the related economic impacts to the state economies. ICF’s analysis focuses on the 20-year period (2019 – 2038) following the proposed ACP in-service date in November 2018.
ICF’s analyses and findings draw from years of experience consulting on North American natural gas and electric markets, and proprietary software tools and databases developed for that purpose. For this study, ICF utilized its Gas Market Model (“GMM”) and Integrated Planning Model (“IPM”) to model the North American gas and electric markets with and without ACP. ACP’s market impacts and consumer cost savings are estimated based on the projected changes in natural gas and wholesale electric prices and electric production costs that result from adding the pipeline to the interstate transportation grid.
The market area’s consumer cost savings are inputs to the IMPLAN model. IMPLAN is a sophisticated modeling software that estimates economic activity resulting from various stimuli. It is widely used to understand the impact of energy infrastructure investments on market area economies. ICF’s general analysis process is illustrated in Exhibit 2.
ACP provides significant financial and economic benefits to the North Carolina and Virginia markets.
Between 2019 and 2038, ICF estimates a net annual average energy cost savings of over $377 million dollars - $243 million in Virginia, and $134 million in North Carolina. These benefits accrue to both natural gas and electric consumers and add to the construction and local tax benefits identified in other studies.6
These consumer cost savings to households and businesses in Virginia and North Carolina will also trigger stimulus effects that create jobs, boost labor income, and grow the state economies. On average, ICF estimates that economic activity related to ACP enabled energy cost savings will contribute more than 2,200 permanent full-time jobs, $131 million in annual labor income, and $218 million in annual gross state product (GSP) to the two states over the 20-year period.
In addition to these measurable financial benefits, ACP creates significant value by enhancing gas supply security, increasing gas supply flexibility and optionality, improving electric reliability, and supporting renewable generation in its market areas. Exhibit 3 summarizes ACP’s economic impacts to Virginia and North Carolina markets.
Exhibit 3: Projected Average Annual Economic Impacts of the ACP to the Market Areas (Million $) and Permanent Jobs
ACP is driven by rapid demand growth in Virginia and North Carolina Over the next 20 years, Virginia and North Carolina electric power generation will increasingly rely on natural gas as the primary fuel source, as the states move away from coal and nuclear energy. During this period, ICF projects that 9,900 MW of coal and nuclear-based capacity – nearly 18 percent of the regional fleet – will be retired, while 20,200 MW of natural gas-fired combined cycle capacity will be constructed.7 Power sector demand for natural gas is expected to grow at a rapid rate of 6.3 percent annually between 2014 and 2035, nearly quadrupling from the current level of 1 Bcf/d to 3.7 Bcf/d.
Exhibit 4: ACP Market Area Natural Gas Demand Forecast
Source: ICF
The winter of 2013-2014 highlights a need for infrastructure development to support the growth from the electric sector Located in the middle of the natural gas transportation system, with no regional underground storage facilities, Virginia and North Carolina rely on natural gas delivered on long-haul interstate pipelines such as TransContinental Gas Pipeline (Transco), Columbia Gas Transmission (TCO), and Dominion Transmission (Dominion). The primary supply source to the Virginia and North Carolina markets is the Gulf Coast, with Dominion and TCO providing limited access to the Marcellus/Utica supply.
During the severe cold-weather of the 2013-2014 “Polar Vortex” winter, power generation and heating demand for natural gas soared in the Midwest, Northeast, and Mid-Atlantic. Extreme electricity price spikes and volatility, caused by tight natural gas supplies and heavy pipeline utilization, imposed significant economic costs to electric consumers in Virginia and North Carolina. Regional natural gas prices soared to unprecedented levels, exceeding $120/MMBtu on January 22, while wholesale power prices in
7 The construction of ACP actually accelerates the migration from coal/nuclear to natural gas because of the cost reductions it drives in natural gas fuel costs.
the Dominion Service territory (driven by surging gas prices) reached $364/MWh on the same day. Power prices, at one point, exceeded $650/MWh, on a day with gas price over $80/MMbtu.8
Exhibit 5 illustrates the close historical relationship between delivered natural gas and power prices in Virginia from December 2013 through March 2014. During this time, the wholesale power costs for the Dominion Service territory totaled over $3.3 billion, $2.1 billion higher than the same period in the previous year, when gas prices were much lower. By providing increased capacity and greater supply access to these markets, ICF expects that ACP will help reduce the region’s susceptibility to such gas and electric spikes.
Exhibit 5: Winter 2013-2014 Gas and Power Price Relationship
Source: ICF, SNL
ACP provides access to a robust and economic supply source The Appalachian Basin was one of the first US oil and gas producing regions, and it continues to provide a significant share of natural gas consumed in east coast and Appalachian states. ICF expects that the Appalachian Basin’s role as a major supply source will continue to grow as Marcellus/Utica production increases from its current output of 17 Bcf/d to a projected 38 Bcf/d by 2035, as shown on the left axis of Exhibit 6.
The dramatic increase in low-cost Appalachian Basin gas production has materially altered the relationship of the region’s gas prices to other trading points across the North American market. As shown in the right axis of Exhibit 6, the price of natural gas in the Appalachian Basin (represented by the “Dominion South” pricing point) relative to the North American benchmark Henry Hub (Louisiana) price has plummeted nearly $1.50/MMbtu from a premium to a discount of $1.00/MMBtu. ICF projections show the discounted spread to widen further, to more than $1.50/MMBtu. At these prices, the Appalachian Basin is among the lowest gas supply sources on the continent.
8 Regional spot gas prices for North Carolina and Virginia are reported in industry trade publications as “Transco Zone 5.”
Exhibit 6: Historical and Projected Marcellus/Utica Production and Dominion South Point to Henry Hub Basis9
Source: ICF
ACP greatly enhances supply security to Virginia and North Carolina consumers The three large interstate pipelines that serve the ACP market are becoming increasingly congested as demand in the region grows. Firm transportation capacity on each pipeline is near fully contracted and heavily utilized, particularly during peak winter conditions. This means that there is little redundancy in the grid for supply or operating disruptions. Although extremely rare, degradations in service capabilities are events that utilities and their suppliers strive diligently to prevent. ACP introduces new capacity and access to supply that diversifies utilities’ natural gas supply portfolio which, in turn, contributes to supply security. Consequently, if supply from one source becomes disrupted, regional needs can still be met with alternative supply sources. The ACP route also provides utilities with valuable geographic operating benefits. Much of the ACP rights-of-way traverse areas of Virginia and North Carolina that do not have high pressure interstate pipelines; instead, they rely on a network of delivery laterals and local distribution company systems. For gas-fired power plant operators in particular, it is imperative that gas pipelines deliver at high pressures to enable gas turbines to run efficiently. ACP’s large-diameter, high-pressure system could enhance the service quality and operational flexibility required by end users. By adding new gas delivery capacity into the region, ICF has found that ACP helps mitigate the competition and price pressure that market conditions in other areas of the country impose on gas supplies serving Virginia and North Carolina consumers. As shown in Exhibit 7, moderately colder-than-normal weather conditions in the ACP markets, represented by the blue line of 2013-2014 heating degree days10 (HDDs) positioned mostly in the middle of the blue historical range in the left chart, caused prices in the region to reach unprecedented highs of $80-$120/MMBtu. This was due, in part, to the strong demand-pull and price spikes in the New York City market, reflected in the right chart by the blue HDD line reaching the maximum of the historical range periodically.
9 Basis presented here is Dominion South Point price minus Henry Hub price. 10 HDD is calculated as 65 minus the average daily temperature.
Exhibit 7: Weather Conditions and Daily Gas Prices in New York and ACP Market Area
Source: ICF, SNL, NOAA
In addition, ACP allows Virginia and North Carolina customers to benefit from access to the abundant natural gas storage fields located in West Virginia, Ohio, and Pennsylvania. The added supply flexibility that these storage assets provide may also help Virginia and North Carolina avoid costly energy market spikes, like those seen last winter.
Energy Cost Savings
Natural Gas Market Impact ACP allows Virginia and North Carolina gas buyers (and their customers) to acquire supplies at Appalachian Basin trading points and transport those supplies to market, rather than purchasing supplies at delivered market pricing points. The cost savings to ACP shippers could be substantial. As seen in Exhibit 8, ICF estimates that, as compared to purchasing gas supplies delivered into the market, ACP gas buyers could save $1.61/MMBtu on average by transporting Appalachian Basin gas on ACP - far exceeding the proposed transportation rate on the pipeline. The cost savings enabled by the ACP occur early in the life of the project and grow steadily over time.
Exhibit 8: Historical and Projected Price Spread between Transco Z5 and Dominion South Point
Source: ICF
Once ACP is placed in service, ICF projects that the market will quickly absorb ACP capacity, as shown on Exhibit 9, with annual average utilization rising to upwards of 80 percent within five years. This is an indication that ACP is an economic and competitive supply source to serve Virginia and North Carolina.
Exhibit 9: Projected ACP Utilization Factor
Source: ICF
Residential, Commercial and Industrial Market Impacts A small percentage of residential, commercial and industrial (RCI) gas users that purchase gas directly from the regional delivered market will save money with ACP.11 Exhibit 10 summarizes ICF’s estimate of annual savings for these customer classes for the analysis period. The cost savings shown in Exhibit 10 reflect only the benefits of reduced local prices resulting from ACP, and do not include potential cost savings that could result from LDCs re-aligning their supply portfolios to the more economic Appalachian Basin supplies, which will be delivered by ACP, as noted in Exhibit 8.
11 These are typically larger industrial gas customers that purchase large volumes of gas directly in the local wholesale market, then arrange to have the gas delivered using LDC transportation services.
Exhibit 10: Projected Average Annual Natural Gas RCI Savings from ACP ($Million/Year)
Average Residential Cost
Savings
Average Commercial Cost
Savings
Average Industrial Cost
Savings
Total Across Sectors
VA 1.3 0.9 4.8 7.0
NC 1.6 1.0 18.8 21.4
Total 2.9 1.9 23.6 28.4
Source: ICF
Electric Market Impact Virginia and North Carolina electricity consumers benefit from ACP because the lower cost of natural gas to fuel power generation will, in turn, result in lower electricity bills for consumers. Owing to differences in electric market structures and operations in Virginia and North Carolina, ICF adopted distinct approaches for estimating the electricity cost savings in each state.
For purposes of this analysis, cost savings to Virginia consumers were calculated assuming that Virginia operates as a competitive market, given that the majority of the generators in the state are participants in PJM. This assumes unregulated utilities base retail rates on the costs of purchasing energy at wholesale prices and other firm/bilateral contractual arrangements. The power generators who bid into the wholesale energy market do not take into account any fixed costs.
Under this type of market structure, each MWh of electricity consumed in Virginia will benefit from a lower Virginia natural gas price because it translates into lower wholesale power prices. ICF estimated consumer cost savings as the retail rate impact based on the projected reduction ACP triggered in wholesale electric market prices and the overall expected retail load.
ICF estimates that ACP will lower annual average wholesale electricity prices by $0.94/MWh, a 1.4 percent reduction for the analysis period. This reduction translates into an annual savings of $236 million a year for Virginia consumers.
In contrast to Virginia, North Carolina is expected to continue operating as a regulated market through the analysis period, whereby customer bills are closely related to the production costs of energy. The total production costs are calculated based on the future total expenditures needed to meet load, which include variable and fixed O&M costs, fuel costs, capital expenditures, and costs of imports.
ICF has determined that ACP makes it possible for electric utilities to acquire and transport lower cost Appalachian Basin supplies on ACP, rather than purchase gas in the regional market. Utilities could pass along the cost savings (net of the pipeline transportation costs) directly to the consumers. This fuel cost reduction results in significant consumer savings. In all, based on ICF’s study, ACP could yield net annual cost savings of $113 million for North Carolina electric customers.
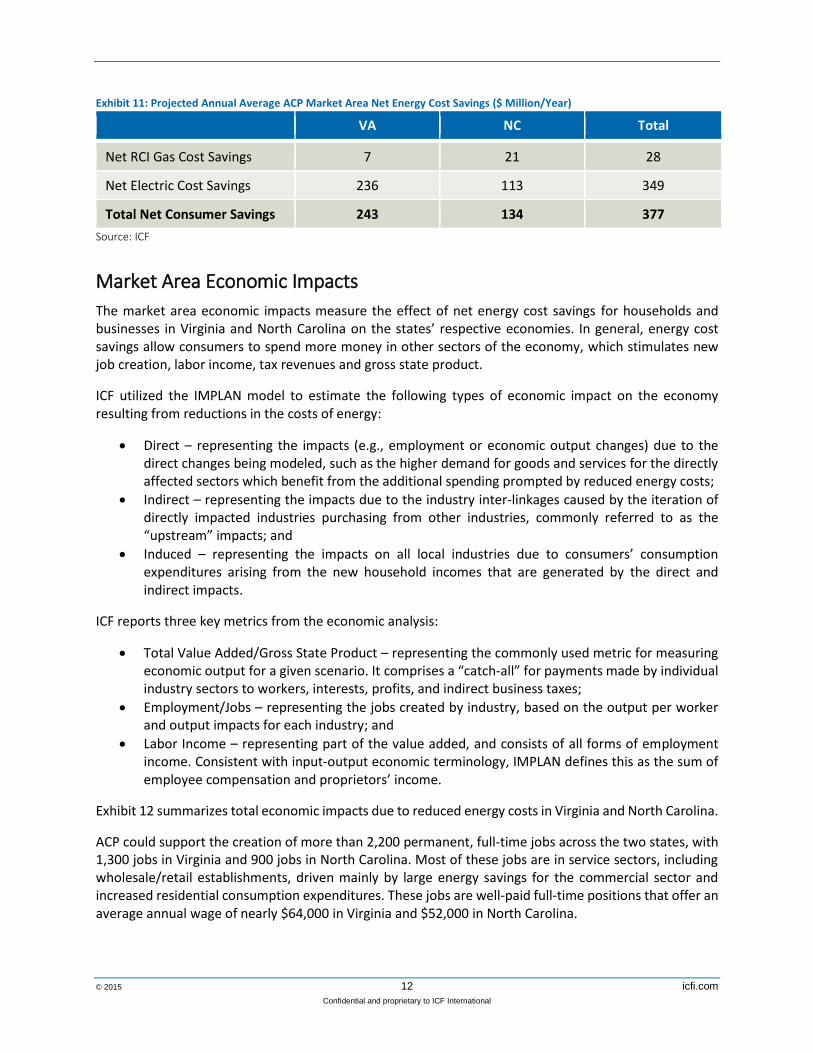
Total Consumer Cost Savings ACP can produce significant energy cost savings to consumers in Virginia and North Carolina. As summarized in Exhibit 11, ICF estimates that ACP will produce an average of $377 million in annual consumer cost savings for the 20-year analysis period. These sums are net of the cost of constructing and operating the pipeline.
Exhibit 11: Projected Annual Average ACP Market Area Net Energy Cost Savings ($ Million/Year)
VA NC Total
Net RCI Gas Cost Savings 7 21 28
Net Electric Cost Savings 236 113 349
Total Net Consumer Savings 243 134 377
Source: ICF
Market Area Economic Impacts
The market area economic impacts measure the effect of net energy cost savings for households and businesses in Virginia and North Carolina on the states’ respective economies. In general, energy cost savings allow consumers to spend more money in other sectors of the economy, which stimulates new job creation, labor income, tax revenues and gross state product.
ICF utilized the IMPLAN model to estimate the following types of economic impact on the economy resulting from reductions in the costs of energy:
Direct – representing the impacts (e.g., employment or economic output changes) due to the direct changes being modeled, such as the higher demand for goods and services for the directly affected sectors which benefit from the additional spending prompted by reduced energy costs;
Indirect – representing the impacts due to the industry inter-linkages caused by the iteration of directly impacted industries purchasing from other industries, commonly referred to as the “upstream” impacts; and
Induced – representing the impacts on all local industries due to consumers’ consumption expenditures arising from the new household incomes that are generated by the direct and indirect impacts.
ICF reports three key metrics from the economic analysis:
Total Value Added/Gross State Product – representing the commonly used metric for measuring economic output for a given scenario. It comprises a “catch-all” for payments made by individual industry sectors to workers, interests, profits, and indirect business taxes;
Employment/Jobs – representing the jobs created by industry, based on the output per worker and output impacts for each industry; and
Labor Income – representing part of the value added, and consists of all forms of employment income. Consistent with input-output economic terminology, IMPLAN defines this as the sum of employee compensation and proprietors’ income.
Exhibit 12 summarizes total economic impacts due to reduced energy costs in Virginia and North Carolina.
ACP could support the creation of more than 2,200 permanent, full-time jobs across the two states, with 1,300 jobs in Virginia and 900 jobs in North Carolina. Most of these jobs are in service sectors, including wholesale/retail establishments, driven mainly by large energy savings for the commercial sector and increased residential consumption expenditures. These jobs are well-paid full-time positions that offer an average annual wage of nearly $64,000 in Virginia and $52,000 in North Carolina.
Over the entire 20-year modeling period, ACP could support close to 45,000 job-years12 paying Virginia and North Carolina workers over $2.6 billion in wages and salaries. ACP adds $130 million per year and $80 million per year to the VA and NC economies, respectively, yielding incremental tax revenues of $14 million and $9 million per year. Of this, roughly 30 to 40 percent is from property taxes, and 45 to 55 percent is from sales and state income taxes.
Exhibit 12: Projected Market Area Economic Impact Due to Reduced Energy Costs
Average Annual Impact 20-year Cumulative Impact
Jobs Tax
Revenue ($ million)
Labor Income ($
million)
Gross State Product ($
million)
Job-years
Tax Revenue ($
million)
Labor Income ($
million)
Gross State Product ($
million)
North Carolina
925 $9 $48 $82 18,565 $180 $968 $1,648
Virginia 1,300 $14 $83 $136 26,033 $280 $1,664 $2,720
Total 2,225 $23 $131 $218 44,600 $460 $2,632 $4,368
Source: ICF
The economic impacts that ICF presented above do not include any secondary impacts from other industrial expansions that ACP facilitates. For example, ICF evaluated the impacts related to the incremental gas generation capacity additions in the two states enabled by ACP. This alone could add approximately 1,000 jobs across the two states, 70 percent in NC and 30 percent in VA. More than 95 percent of these positions are estimated to be temporary construction related jobs, with a small fraction of permanent operational jobs. Exhibit 13 shows the detailed breakdown of this impact.
Exhibit 13: Projected Market Area Economic Impact Due to New Natural Gas-Fired Electric Generation Capacity
Construction Labor
Equipment and Material
Operation and Maintenance
Total
Temporary
Jobs Value Added
($ million) Permanent
Jobs
Value Added ($ million)
Permanent Jobs
Value Added ($ million)
Jobs Value
Added ($ million)
Direct 565 $36.9 14 $6.9 21 $2.1 601 $45.9
Indirect 180 $20.5 13 $1.2 3 $0.4 196 $22.1
Induced 223 $23.0 15 $1.5 9 $0.9 247 $25.4
Total 970 $80 42 $10 33 $3 1,045 $93
Source: ICF
Additional Benefits
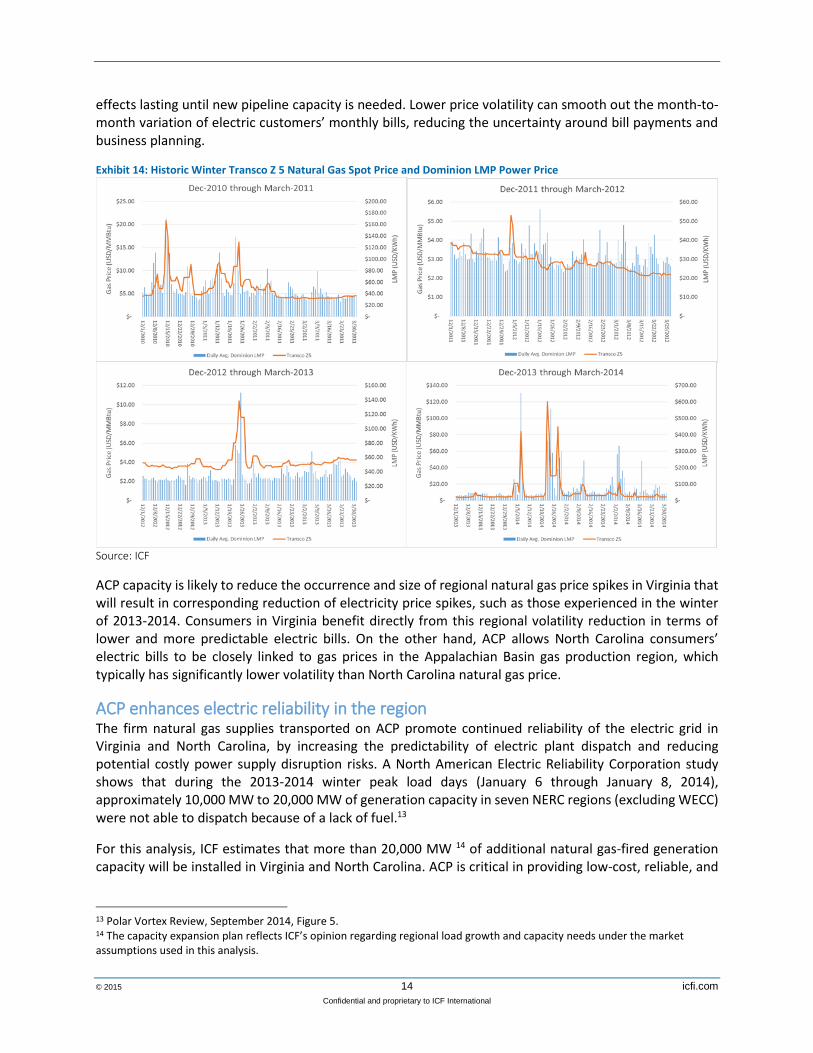
ACP will reduce electric and gas price volatility in the market area As an incremental supply source, ACP can lower natural gas price volatility in the Virginia and North Carolina markets which, in turn, would reduce the frequency and magnitude of potential power market price spikes. ICF analysis suggests that with ACP, price volatility could be reduced to the relatively moderate levels experienced in the 2011-2012 and 2012-2013 winters, as shown in Exhibit 14, with the
12 Job-years are the number of jobs multiplied by a number of years.
effects lasting until new pipeline capacity is needed. Lower price volatility can smooth out the month-to-month variation of electric customers’ monthly bills, reducing the uncertainty around bill payments and business planning.
Exhibit 14: Historic Winter Transco Z 5 Natural Gas Spot Price and Dominion LMP Power Price
Source: ICF
ACP capacity is likely to reduce the occurrence and size of regional natural gas price spikes in Virginia that will result in corresponding reduction of electricity price spikes, such as those experienced in the winter of 2013-2014. Consumers in Virginia benefit directly from this regional volatility reduction in terms of lower and more predictable electric bills. On the other hand, ACP allows North Carolina consumers’ electric bills to be closely linked to gas prices in the Appalachian Basin gas production region, which typically has significantly lower volatility than North Carolina natural gas price.
ACP enhances electric reliability in the region The firm natural gas supplies transported on ACP promote continued reliability of the electric grid in Virginia and North Carolina, by increasing the predictability of electric plant dispatch and reducing potential costly power supply disruption risks. A North American Electric Reliability Corporation study shows that during the 2013-2014 winter peak load days (January 6 through January 8, 2014), approximately 10,000 MW to 20,000 MW of generation capacity in seven NERC regions (excluding WECC) were not able to dispatch because of a lack of fuel.13
For this analysis, ICF estimates that more than 20,000 MW 14 of additional natural gas-fired generation capacity will be installed in Virginia and North Carolina. ACP is critical in providing low-cost, reliable, and
13 Polar Vortex Review, September 2014, Figure 5. 14 The capacity expansion plan reflects ICF’s opinion regarding regional load growth and capacity needs under the market assumptions used in this analysis.
firm fuel supply to these generators, thereby reducing the possibility of generator outages due to lack of fuel, even under the most adverse weather conditions.
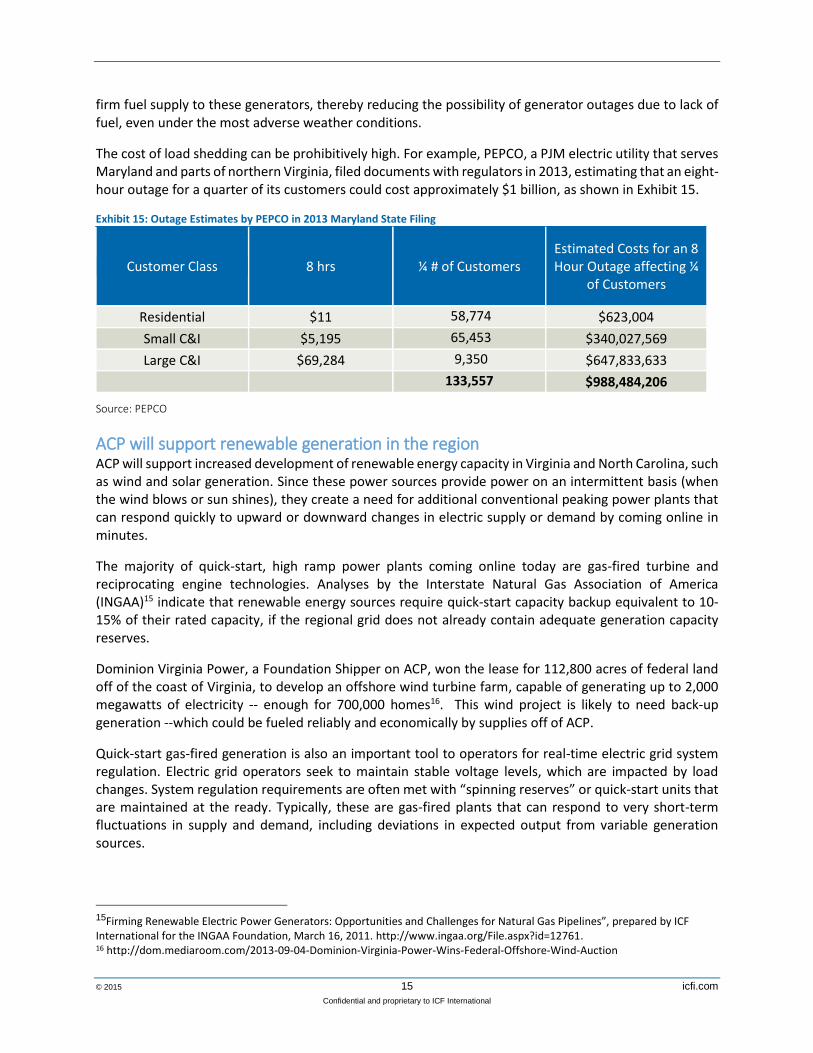
The cost of load shedding can be prohibitively high. For example, PEPCO, a PJM electric utility that serves Maryland and parts of northern Virginia, filed documents with regulators in 2013, estimating that an eight-hour outage for a quarter of its customers could cost approximately $1 billion, as shown in Exhibit 15.
Exhibit 15: Outage Estimates by PEPCO in 2013 Maryland State Filing
Customer Class 8 hrs ¼ # of Customers Estimated Costs for an 8 Hour Outage affecting ¼
of Customers
Residential $11 58,774 $623,004
Small C&I $5,195 65,453 $340,027,569
Large C&I $69,284 9,350 $647,833,633
133,557 $988,484,206
Source: PEPCO
ACP will support renewable generation in the region ACP will support increased development of renewable energy capacity in Virginia and North Carolina, such as wind and solar generation. Since these power sources provide power on an intermittent basis (when the wind blows or sun shines), they create a need for additional conventional peaking power plants that can respond quickly to upward or downward changes in electric supply or demand by coming online in minutes.
The majority of quick-start, high ramp power plants coming online today are gas-fired turbine and reciprocating engine technologies. Analyses by the Interstate Natural Gas Association of America (INGAA)15 indicate that renewable energy sources require quick-start capacity backup equivalent to 10-15% of their rated capacity, if the regional grid does not already contain adequate generation capacity reserves.
Dominion Virginia Power, a Foundation Shipper on ACP, won the lease for 112,800 acres of federal land off of the coast of Virginia, to develop an offshore wind turbine farm, capable of generating up to 2,000 megawatts of electricity -- enough for 700,000 homes16. This wind project is likely to need back-up generation --which could be fueled reliably and economically by supplies off of ACP.
Quick-start gas-fired generation is also an important tool to operators for real-time electric grid system regulation. Electric grid operators seek to maintain stable voltage levels, which are impacted by load changes. System regulation requirements are often met with “spinning reserves” or quick-start units that are maintained at the ready. Typically, these are gas-fired plants that can respond to very short-term fluctuations in supply and demand, including deviations in expected output from variable generation sources.
15Firming Renewable Electric Power Generators: Opportunities and Challenges for Natural Gas Pipelines”, prepared by ICF International for the INGAA Foundation, March 16, 2011. http://www.ingaa.org/File.aspx?id=12761. 16 http://dom.mediaroom.com/2013-09-04-Dominion-Virginia-Power-Wins-Federal-Offshore-Wind-Auction
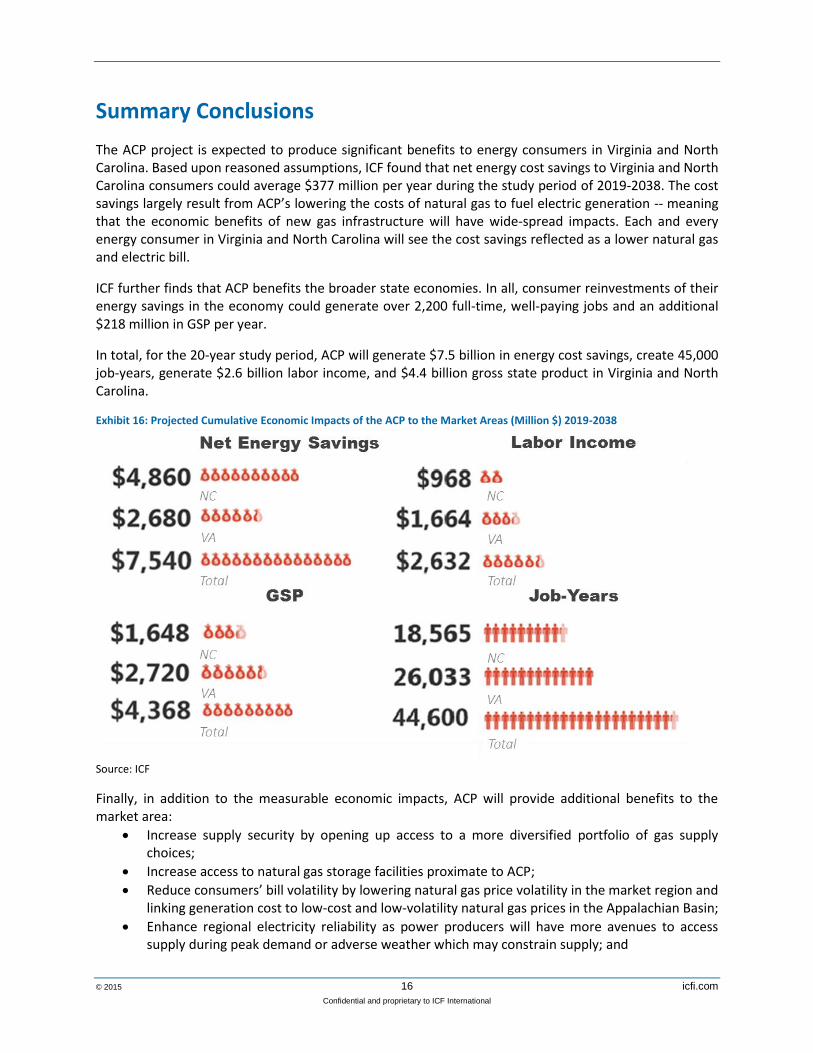
The ACP project is expected to produce significant benefits to energy consumers in Virginia and North Carolina. Based upon reasoned assumptions, ICF found that net energy cost savings to Virginia and North Carolina consumers could average $377 million per year during the study period of 2019-2038. The cost savings largely result from ACP’s lowering the costs of natural gas to fuel electric generation -- meaning that the economic benefits of new gas infrastructure will have wide-spread impacts. Each and every energy consumer in Virginia and North Carolina will see the cost savings reflected as a lower natural gas and electric bill.
ICF further finds that ACP benefits the broader state economies. In all, consumer reinvestments of their energy savings in the economy could generate over 2,200 full-time, well-paying jobs and an additional $218 million in GSP per year.
In total, for the 20-year study period, ACP will generate $7.5 billion in energy cost savings, create 45,000 job-years, generate $2.6 billion labor income, and $4.4 billion gross state product in Virginia and North Carolina.
Exhibit 16: Projected Cumulative Economic Impacts of the ACP to the Market Areas (Million $) 2019-2038
Source: ICF
Finally, in addition to the measurable economic impacts, ACP will provide additional benefits to the market area:
Increase supply security by opening up access to a more diversified portfolio of gas supply choices;
Increase access to natural gas storage facilities proximate to ACP;
Reduce consumers’ bill volatility by lowering natural gas price volatility in the market region and linking generation cost to low-cost and low-volatility natural gas prices in the Appalachian Basin;
Enhance regional electricity reliability as power producers will have more avenues to access supply during peak demand or adverse weather which may constrain supply; and
Support renewable generation as ACP and the associated gas powered generation assets serve to balance the intermittency of wind and solar generation output.