48
The Economic Importance of the Forestry Industry to Papua New Guinea Report for Rimbunan Hijau (PNG) Group July 2006

The Economic Importanceof the Forestry Industry to
Papua New Guinea
Report forRimbunan Hijau
(PNG) Group
July 2006

2
ITS Global – Consultants on Global Issues
International Trade Strategies Pty Ltd, trading as ITS Global Asia Pacific
Level 26, 35 Collins Street, Melbourne 3000 Victoria, Australia
Telephone: +61 3 9654 8323
Facsimile: +61 3 9654 4922
www.itsglobal.net
The views expressed in this publication are those of its authors. The consultant takes no liability forcommercial decisions taken on the basis of information in this report. The information is accurate to thebest of the consultant’s knowledge, however the consultant advises that no decision with commercialimplications which depends upon government law or regulation or executive discretion should be takenby any person or entity without that party’s having secured direct advice from the government agencyconcerned in writing.

Contents
Acronyms 4
Notes 5
Executive summary 6
Chapter 1. Introduction 8
Chapter 2. An important natural resource 9
A. Global demand for forest products 9
B. PNG’s development needs 9
C. The value and potential value of PNG’s forestry resources 10
Chapter 3. Economic significance of forestry to PNG 12
A. Contribution of forestry to the national economy 12
Chapter 4. The IRT case against the forest industry 15
Chapter 5. Regional impact of the forest industry 17
A. Infrastructure investments 17
B. Flow-on effects 18
C. Omissions by the IRT 19
Chapter 6. Regional impacts of forest industry – a case study 20
A. Impacts in the Western Province 20
B. Forestry industry expenditure compared 21to provincial government expenditure
Chapter 7. What constrains forestry in PNG? 23
A. Potential contribution 25
Chapter 8. Conclusions 27
References 28
Appendices 30
I. Data sources and reliability 30
II. Critique of the Independent Review Team report 30
III. Case study on impacts in the Western Province 37
IV. Potential revenue implications of non-optimal sustainable 44forestry production
T H E E C O N O M I C I M P O R TA N C E O F T H E F O R E S T I N D U S T RY T O PA P U A N E W G U I N E A
3
T H E E C O N O M I C I M P O R TA N C E O F T H E F O R E S T I N D U S T RY T O PA P U A N E W G U I N E A

Acronyms
ADB Asian Development Bank
ANU Australian National University
BPNG Bank of Papua New Guinea
CIA Central Intelligence Agency
CIF Cost Insurance and Freight
DFAT Department of Foreign Affairs and Trade
DFID Department for International Development (United Kingdom)
FAO Food and Agriculture Organization of the United Nations
FOB Free on board
GDP Gross domestic product
GST Goods and Services Tax
IMF International Monetary Fund
ITTO International Tropical Timber Organization
IRT Independent Review Team
IUCN International Union for the Conservation of Nature (World Conservation Union)
K Kina
NEFC National Economic and Fiscal Commission (PNG)
NGO Nongovernmental organisation
PDL Project Development Levy
PNG Papua New Guinea
PNGFA Papua New Guinea Forest Authority
PNGFIA Papua New Guinea Forest Industries Association
UNECE United Nations Economic Commission for Europe
WTO World Trade Organization
WWF World Wide Fund for Nature
4

Notes
Data and statistics
The quality and coverage of statistics in Papua New Guinea has important implications for anassessment of the actual and potential importance of the industry, nationally and regionally. Dataproblems have been a regular feature in International Monetary Fund, World Bank and AsianDevelopment Bank reports on PNG. In its Statistical Capacity Indicator, the World Bank givesPNG statistics a ranking of 50 out of 100 for statistical practice but only 30 out of 100 for datacollection.1 This issue is addressed in Appendix I.
Terminology
The authors of this report use the term “Green” to describe philosophies and groups which putprotection or preservation of the environment ahead of all other policy objectives, includingeconomic development and eradication of poverty. ITS Global does not consider the terms“environmentalists” and “Greens” to be synonymous.
The formal meaning of “sustainable development” is balancing protection of the environmentwith measures to secure growth and improve social conditions. Green groups do not mean thiswhen they use the term.
5
T H E E C O N O M I C I M P O R TA N C E O F T H E F O R E S T I N D U S T RY T O PA P U A N E W G U I N E A
1 The World Bank’s Statistical Capacity Indicator gives PNG a mark of 50 out of 100 for statistical practice, butonly 30 out of 100 for data collection.See http://ddp-ext.worldbank.org/ext/CSIDB/getCountryStatInfoXML?id=PNG&format=CSIDB.

Executive summary
Forestry’s contribution to the economy of Papua New Guinea (PNG) is significant. Export taxeson logs account for 3 to 6 percent of all tax. Between 1990 and 2005 such taxes represented
an average of around 30 percent of all development expenditure by the national government.
World Bank figures suggest the forest industry has contributed up to 8.6 percent of PNG grossdomestic product in the past. Food and Agriculture Organization (FAO) figures today suggest 5.1percent. If world timber prices rise (they appear to be recovering following the Asian currencycrisis) and prices of minerals fall (that is likely at some time in the future) forestry’s contributionto gross domestic product (GDP) will increase.
PNG needs development and growth. Per capita GDP has fallen from US$676 in 2000 to anestimated US$585 in 2005. The share of population falling below the World Bank’s poverty linehas risen from 37.5 percent to 53.5 percent over the last decade. In rural areas only one child infive attends school. The finances of the Government are dire.
The global demand for timber (paper, softwood and hardwood) is strong. Like otherdeveloping countries, these are resources in which Papua New Guinea has a comparativeadvantage and can benefit from trading into the global economy. It has large reserves. Mostremain unallocated and claims by Greenpeace that PNG is about lose its forestry andenvironmental heritage are baseless.
Nevertheless, the forest industry, a consistent contributor to growth, is under attack. In the lasttwo years Greenpeace has spearheaded a campaign against commercial forestry in PNG. There areclaims the industry devastates the environment, is illegal and practices human rights abuse. As acompanion report shows, most of the assertions are exaggerated or baseless. Many also exploitweak governance which is, regrettably, a feature of the current stage of development in PNG.
There are claims as well that PNG’s forestry industry is economically unsustainable and notdelivering benefits to PNG. These claims rest heavily on a draft report prepared by an“Independent Review Team” (IRT) which the PNG Government established in 2003 at the behestof the World Bank to review PNG’s logging industry. It produced a draft report which concludedthat the commercial forestry industry in PNG was uneconomic. It also argued for greateremphasis on eco-forestry.
This supported Greenpeace’s calls to replace commercial forestry in PNG with eco-forestry andsubsistence forestry. The IRT drew its conclusions from a study it commissioned on thecommercial viability of the forest industry. The study was prepared by an expert who hadpreviously jointly authored a report with Greenpeace arguing that eco-forestry was superior tocommercial forestry in the Solomon Islands. The economic viability of eco-forestry in PNG wasnot properly assessed. Even WWF concedes that eco-forestry is commercially unviable in PNG.
The Review was not completed. It lapsed when the PNG government decided the conditionsrequired by the World Bank to support a loan to improve management forestry wereunacceptable. (As well as the review of logging, the conditions included a moratorium on loggingand institutionalization of NGOs in the administration of forestry in PNG).
Sustainable development requires a balance between protecting the environment andsupporting growth. Environmental policies which stifle growth are of little value to countrieswhere social indicators are worsening. It will not eradicate poverty or generate the wealthnecessary to implement effective environmental policies.
This report examines the economic contribution of the forest industry to PNG, both direct andindirect. The report includes a case study of one region, which shows the extent and value ofinfrastructure and social services provided the forestry industry. It considerably exceeds thatsupplied by the provincial government.
This report also shows how the PNG forestry industry can contribute more to economic
6

growth. It canvasses the issues which constrain growth, and postulates scenarios whichdemonstrate how the industry could contribute more.
It was disappointing to find in preparing this report that the World Bank and Department forInternational Development (DFID, the UK aid agency) have not supported work or producedassessments of how forestry might contribute more to solving PNG’s deep-seated developmentproblems.
Instead they have supported research by Green NGOs which emphasise the non economicproblems in the industry. If the Green goals of replacing commercial forestry with eco-forestry andsubsistence policy were achieved, growth would fall and unemployment would increase. This isnot the time for development agencies to contribute to efforts to undermine a key contributor tothe PNG economy.
7
T H E E C O N O M I C I M P O R TA N C E O F T H E F O R E S T I N D U S T RY T O PA P U A N E W G U I N E A

Chapter 1. Introduction
ITS Global was commissioned by Rimbunan Hijau (PNG) Group (hereafter, Rimbunan Hijau)to prepare a report on the economic significance of the forestry industry in Papua New Guinea
(PNG). The objective of this report was to assess the actual and potential economic significanceof the forestry industry to PNG, and to assess some assertions on the industry that have beenadvanced by Green groups over recent years.
Over the last five years, at least six reports criticizing forest practices in Papua New Guineahave been published. In addition, a formal review of the industry by the “Independent ReviewTeam” (IRT) has been undertaken. Its report has not been adopted by the PNG Government, butmuch of the material it gathered has been widely circulated.
A leading claim in that report is that the industry is not economically sustainable andcontributes little to the economic development of Papua New Guinea. This contention continuesto be given currency.
It was also striking that research supported by international and national developmentagencies paid little attention to the economic significance and potential of the industry to PapuaNew Guinea.
This report aims to assess the actual and potential economic significance of Papua NewGuinea’s forest industries. It has some notable findings. It also demonstrates that there is a seriousshortage of objective economic assessment of the importance of the sector for PNG’s development.
ITS Global visited PNG to consult with key industry players and undertook site visits toRimbunan Hijau’s operations in Gulf and Western Provinces. The report draws on publishedinformation and information provided by Rimbunan Hijau and the PNG Forest IndustriesAssociation (PNGFIA).
The conclusions are those of the authors.
8
Chapter 2. An important natural resource
Worldwide experience has demonstrated how sustainable utilisation of timber resources cancontribute to national economic growth and prosperity. The forestry industry has been the
subject of contention in both industrialised and developing countries.
Forestry is a classic renewable resource. In a number of industrialised economies, sustainableforestry is practiced. In those countries, the debate is about whether there should be any forestryat all. Not having a forest industry is a luxury some industrialised economies can afford if theychoose to. Few developing countries have that option.
Global demand for timber products is strong. Developing countries endowed with forest resourceshave a comparative advantage and can achieve economic development by meeting that demand.
A. Global demand for forest products
Global demand for forest products is expected to remain strong. The United Nations EconomicCommission for Europe (UNECE) and the Food and Agriculture Organization (FAO) report thatdemand in forest product markets in 2004 reached record levels, and that the engine of growth in 2005was the United States (US) housing market. China dominates the tropical timber trade and has movedincreasingly to production of primary and secondary processed products, based on imported logs.2
PriceWaterhouseCoopers, quoting from the 2005 Global Forest and Paper Industry Survey,concluded that total global industry sales increased by 11.8 percent in 2004 (to US$340 billion).The survey summarises the 2004 financial information of the 100 largest forest and papercompanies in the world.3
A 2005 report by the US National Commission on Science for Sustainable Forestry identifiedglobal trends in the industry: ‘...global market cost competitiveness is increasingly being shapedby the low production costs of subtropical tree plantations in the Southern Hemisphere’; ‘...Chinawill continue to be a major importer of market pulp and wood from the Asia Pacific Region andSouth America’; ‘...demand growth for paper and paper-board is largest in the emerging marketsof Eastern Europe, China, Asia and Latin America, in the order of 3.5-4.5 percent annually’.4
The forest products market is, and will remain, a very significant global industry. PNG is wellplaced to supply this market, especially China (which will exert an increasingly significant impacton global demand).
B. PNG’s development needs
After being in recession between 1996 and 2002, real growth in PNG is estimated by the WorldBank to have increased by 2.8 percent in 2003 and 2004. This has been attributed to favourablecommodity prices, better economic management and the removal of supply constraints.
But the overall picture is poor:• GDP per capita has declined from US$676 in 2000 to an estimated US$585 in 2005, with a
wide gap between rural and urban incomes;• 70 percent of the population live on less than US$2 per day. The number of people in this
category rose from 3.8 million in 2002, to an estimated 4.1 million in 2005;5
9
T H E E C O N O M I C I M P O R TA N C E O F T H E F O R E S T I N D U S T RY T O PA P U A N E W G U I N E A
2 UNECE/FAO (2005). Forest Products Annual Market Review, 2004-2005, pages 20, 22 and 30, athttp://www.unece.org/trade/timber/docs/fpama/2005/fpama2005a.htm.
3 PriceWaterhouseCoopers, at http://www.pwc.com/extweb/ncpressrelease.nsf/docid/8e2b24eab4372b8f8525703c005ad30c
4 National Commission on Science for Sustainable Forestry (2005). Global Markets Forum Summary Report ofthe National Commission on Science for Sustainable Forestry, pages 7 and 8, athttp://ncseonline.org/ewebeditpro/items/O62F6140.pdf.
5 World Bank (2005). Papua New Guinea – Interim Strategy Note, Report 31790-PG, 18 March 2005, Table 1, page 6.

• the proportion of poor people living below the World Bank’s estimated national poverty lineincreased from 37.5 percent in 1996, to 53.5 percent in 2003;6
• average life expectancy is less than 60 years, infant mortality rates range from 50-110 deathsper 1000 live births, and nearly 75 percent of the rural population has no formal schooling;7
• there are serious health problems, especially HIV-AIDS, and poor access to medical services inrural areas;
• population growth is at least 2.3 percent per annum. The United Nations (UN) has noted that‘The high population momentum implies that in the future PNG will have to continue toearmark a large proportion of its resources for demographic investment in areas like health,education and employment creation’ and ‘...national targets can only be achieved withproportionately higher increased benefits for those areas/subgroups of the population that arelagging behind in the development process’;8 and
• the national government deficit is unsustainable and the PNG government is reducing nationalsavings to fund it.9
PNG can ill afford to pass up any opportunity to build sustainable growth. This is the onlyway it can lift living standards. Without growth, it will not be able to afford to implement theenvironmental policies that are necessary to underpin sustainable development.
C. The value and potential value of PNG’s forestry resources
PNG has an estimated 29.6 million hectares of forest, covering 64 percent of the country’s landarea.10 World Bank estimates suggest that the industry has contributed up to 8.6 percent of PNG’sGDP.11 Australia’s Department of Foreign Affairs and Trade (DFAT) notes that forestry’s share ofGDP has declined since the Asian Financial Crisis in the late 1990s. Its share of GDP has beenrelatively constant since 1999, accounting for between 3 and 5 percent of GDP.12 The industrygenerates around 5 percent of PNG’s exports. For over a decade it has contributed an average of30 percent of PNG’s expenditure on development.
Putting PNG’s forest resources into global context, Brazil has around 412 million hectares oftropical hardwood, representing 20 percent of the world’s total stock.13 New Zealand has 6.4million hectares of indigenous forests and 1.7 million hectares of planted production forests.14
Sweden, Finland, New Zealand and Chile are examples of countries that have successfully andsustainably developed their forestry endowments. New Zealand’s experience demonstrates that,with the right resource endowment and appropriate policies, land previously earning a loweconomic return from farming can be converted into a profitable and sustainable log exportindustry. Sweden has shown how to develop plantation forestry.
As this report will show, PNG already derives important benefits from its forestry industry.Examining forestry development in other countries illustrates the potential of forestry resources.
This is further discussed in Chapter 6 and Appendix IV. Two examples illustrate the range ofwhat might be achieved in PNG. Tim Curtin, a former Advisor to the PNG Department of the
C H A P T E R 2 . A N I M P O R TA N T N AT U R A L R E S O U R C E
10
6 Asian Development Bank (2006). Papua New Guinea Country Information, page 3, athttp://www.adb.org/papuanewguinea/country-info.asp.
7 World Bank (2005). World Development Indicators Database, 2005, at www.worldbank.org.8 See United Nations Development Program (2004). Papua New Guinea Millennium Development Goals: Progress
Report for Papua New Guinea 2004, pages 14 and 51, athttp://www.undp.org.pg/documents/National%20MDG%20Progress%20Report%202004.pdf
9 Chand, Satish (2003). PNG Economic survey: some weak signs of recovery, December 2003, athttp://peb.anu.edu.au/pdf/chand2003.doc.
10 FAO (2005). Global Forest Resources Assessment 2005: Papua New Guinea Country Report, Country Report 097.11 World Bank (1999) Papua New Guinea Forestry and Conservation Project, Report PID8284, 1999, page 1.12 Department of Foreign Affairs and Trade (2004), Papua New Guinea: the Road Ahead, DFAT, Canberra,
page 127.13 See http://www.nationsencyclopedia.com/Americas/Brazil-FORESTRY.html.14 See http://www.maf.govt.nz/forestry/resources.

Treasury, looks at development of extensive plantation forestry, supposing PNG might ultimatelyattain Sweden’s level of output, arguing, ‘...there is no reason why it could not, given its equal –possibly superior – suitability for softwood pine forestry’.15 To double forestry exports fromplantation forestry in PNG would double average incomes to US$1,400, and this ‘could beachieved within 10-15 years if plantations were developed on the rotation basis that the WorldBank’s first forestry report (1990) considered feasible’.16
The second example is an estimation of what PNG is losing by not producing at the level ofthe sustainable potential of its natural forests. Calculations set out in Appendix IV demonstratethat PNG is only producing at around 70 percent of what the International Tropical TimberOrganisation (ITTO) estimates could be produced on an annual sustainable basis from its naturalforests.
In addition to lower levels of exports, landowner benefits and employment, these calculationssuggest that production at this level implies that Government revenue from the industry wasaround US$20 million lower in 2004 than it could have been.
It is notable that much recent discussion about PNG’s forest industry has not focused on thebenefits of the industry or its potential. It has been dominated by negativism. There is a widelyheld view that commercial forestry in PNG is not economically viable. This has been fostered bymaterial prepared for the “Independent Review Team” (IRT) which examined logging in PNG in200317 and groups like Forest Trends (a research organisation involving Green NGOs, which issupported by the World Bank).18
As noted in following sections of this report, the IRT does not demonstrate that thecommercial forestry is economically unviable. Furthermore, it is noted that the potential economiccontribution of PNG’s forestry resources is not assessed in recent World Bank reports.
Tim Curtin, has commented that the potential contribution of PNG’s forestry resource‘...seems to be so politically incorrect that the income generating potential of plantation forestrycould not be mentioned either in the World Bank’s loan appraisal or in the AusAID/ANU RuralDevelopment Handbook’.19
11
T H E E C O N O M I C I M P O R TA N C E O F T H E F O R E S T I N D U S T RY T O PA P U A N E W G U I N E A
15 Curtin, T. (2005). Forestry and Economic Development in Papua New Guinea, page 3.16 Ibid., page 11. 17 Independent Forest Review Team. (2004). Towards Sustainable Timber Production – A Review of Existing
Logging Projects, Draft Observations and Recommendations Report, report for the Government of Papua NewGuinea, Volume 1 – Main Report, and Volume 2 – Appendices. Draft Report of the Independent Review Team.This Review was required by the World Bank as a condition for provision of a US$40 million loan to improveforestry. The report was never completed. The PNG Government withdrew from the project and the Bankcancelled the loan facility because other conditions required by the World Bank, including a moratorium onlogging, were unacceptable. We use the acronym IRT to refer to this report.
18 Forest Trends (2006). Logging, Legality, and Livelihoods in Papua New Guinea: Synthesis of OfficialAssessments of the Large-Scale Logging Industry, Volume 1. Further comments on this and the report of theIndependent Review Team, are at Appendix 3. Neither of these reports acknowledges, let alone assesses, thepotential economic value of PNG’s forestry resource.
19 Curtin, T. (2005) Forestry and Economic Development in Papua New Guinea, athttp://archives.pireport.org/archive/2006/April/Forestry_development_PNG.pdf A more extensive analysis ofCurtin’s thesis is set out in his article How Poor is Papua New Guinea? How Rich Could it Be?, ResourceManagement in Asia-Pacific, Working Paper No.56, ANU, Research School of Pacific Studies, 2004, (available at http://rspas.anu.edu.au/papers/rmap/Wpapers/rmap_wp56.pdf.
Chapter 3. Economic significance of forestry to PNG
A. Contribution of forestry to the national economy
Key social and economic indicators in PNG are in decline. DFAT notes that ‘Falling real outputcombined with a high population growth rate has led to a rapid decline in Papua New
Guinea’s per capita GDP. In purchasing power parity ... terms the country’s per capita GDPdeclined from a peak of US$2,641 in 1994 to US$2,165 by the end of 2002’.20
PNG needs growth and its forestry resources are making a major contribution to exports andgovernment revenue for funding social and infrastructure investment. They are generatingeconomic activity and employment, particularly in rural areas.
According to World Bank numbers, forestry in PNG contributed around 8.6 percent of GDPin 1998,21 about US$270 million. (The World Bank also observed then that the industry wascapable of contributing US$300 million22.) This translates into revenues to government andlandowners in the order of US$100 million.23
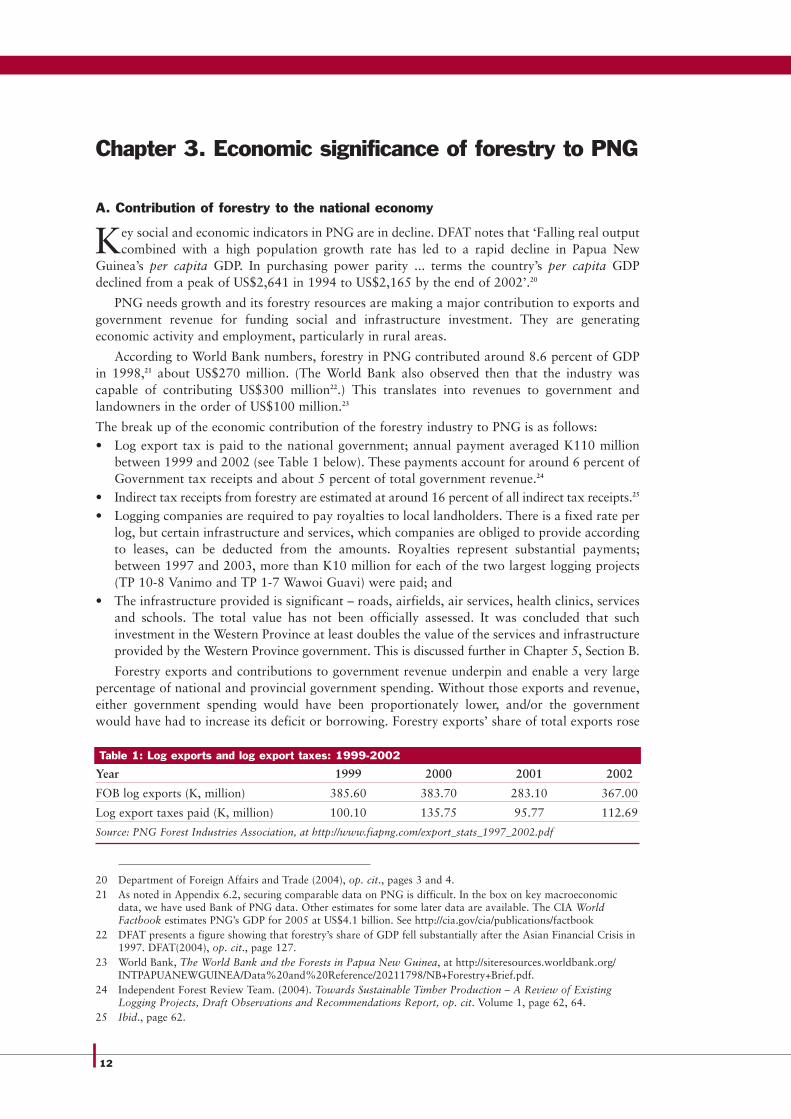
The break up of the economic contribution of the forestry industry to PNG is as follows:• Log export tax is paid to the national government; annual payment averaged K110 million
between 1999 and 2002 (see Table 1 below). These payments account for around 6 percent ofGovernment tax receipts and about 5 percent of total government revenue.24
• Indirect tax receipts from forestry are estimated at around 16 percent of all indirect tax receipts.25
• Logging companies are required to pay royalties to local landholders. There is a fixed rate perlog, but certain infrastructure and services, which companies are obliged to provide accordingto leases, can be deducted from the amounts. Royalties represent substantial payments;between 1997 and 2003, more than K10 million for each of the two largest logging projects(TP 10-8 Vanimo and TP 1-7 Wawoi Guavi) were paid; and
• The infrastructure provided is significant – roads, airfields, air services, health clinics, servicesand schools. The total value has not been officially assessed. It was concluded that suchinvestment in the Western Province at least doubles the value of the services and infrastructureprovided by the Western Province government. This is discussed further in Chapter 5, Section B.
Forestry exports and contributions to government revenue underpin and enable a very largepercentage of national and provincial government spending. Without those exports and revenue,either government spending would have been proportionately lower, and/or the governmentwould have had to increase its deficit or borrowing. Forestry exports’ share of total exports rose
12
20 Department of Foreign Affairs and Trade (2004), op. cit., pages 3 and 4. 21 As noted in Appendix 6.2, securing comparable data on PNG is difficult. In the box on key macroeconomic
data, we have used Bank of PNG data. Other estimates for some later data are available. The CIA WorldFactbook estimates PNG’s GDP for 2005 at US$4.1 billion. See http://cia.gov/cia/publications/factbook
22 DFAT presents a figure showing that forestry’s share of GDP fell substantially after the Asian Financial Crisis in1997. DFAT(2004), op. cit., page 127.
23 World Bank, The World Bank and the Forests in Papua New Guinea, at http://siteresources.worldbank.org/INTPAPUANEWGUINEA/Data%20and%20Reference/20211798/NB+Forestry+Brief.pdf.
24 Independent Forest Review Team. (2004). Towards Sustainable Timber Production – A Review of ExistingLogging Projects, Draft Observations and Recommendations Report, op. cit. Volume 1, page 62, 64.
25 Ibid., page 62.
Table 1: Log exports and log export taxes: 1999-2002
Year 1999 2000 2001 2002
FOB log exports (K, million) 385.60 383.70 283.10 367.00
Log export taxes paid (K, million) 100.10 135.75 95.77 112.69
Source: PNG Forest Industries Association, at http://www.fiapng.com/export_stats_1997_2002.pdf

from around 7-8 percent in the early 1990s to around 20 percent at the end of the decade. Theirshare of revenue rose from around 1-3 percent to around 12-13 percent over the same period.
The share fell after 1998, when prices and demand for logs decreased following the Asiancurrency crisis, and increases in taxation collections from rising prices for minerals increased totalgovernment revenue.
Details are provided in Table 2.
Between 1990 and 1998, forestry played a major role in underpinning the PNG economy. Thiscan be confirmed by an examination of the contribution of taxes to development expenditure.
Table 3 shows that forestry export taxes financed an average of around 30 percent ofdevelopment expenditure between 1990 and 2005. Green NGOs which seek to constrain theindustry should be made to explain how such a large proportion of development expenditureunderpinned by the forestry industry could be undertaken without such taxes.26
13
T H E E C O N O M I C I M P O R TA N C E O F T H E F O R E S T I N D U S T RY T O PA P U A N E W G U I N E A
Key macroeconomic figures for PNG
• GDP in 2002, the latest year for which data is available on the Bank of PNG website, was K11.163billion;
• Exports were estimated at US$2.833 billion in 2005;• Imports were estimated at US$1.651 billion in 2005;• Recurrent expenditure in 2005 (on a preliminary basis), was K3.42 billion, of which K2.22 billion was
by the National Government;• Public debt is estimated to be 47 percent of GDP in 2005.
Table 2: Tax Receipts and Export Taxes: Values and percentages: 1990-2005, Kina, and percentages
Year Tax receipts Export taxes Export taxes as a percentage(K, billion) (K, million) of tax receipts
1990 0.60 12.7 2.1
1991 0.62 18.4 2.9
1992 0.76 26.1 3.4
1993 0.98 73.9 7.5
1994 1.12 138.8 12.3
1995 1.21 132.9 11.10
1996 1.53 157.2 10.30
1997 1.69 148.4 8.74
1998 1.59 40.1 2.5
1999 1.92 78.9 4.1
2000 2.13 133.9 5.78*
2001 2.29 98.1 4.27*
2002 2.37 106.7 4.5
2003 2.67 111.8 4.17
2004 3.25 101.5 3.11
2005 3.77 136.3 3.61
Source: Bank of PNG, at http://www.bankpng.gov.pg/publications/qeb/dec05/qbdec05_8-1.pdf,Table 8.1, Fiscal Operations of the Central Government, and ITS Global.
* The PNG Forest Industry Association considers logging taxes contributed over 7 percent of government revenue in these years.
26 It is argued in Chapter 7 that progressive export taxes are one of the issues that constrain the industry. Theeconomic issues are not straightforward. At one level, forestry export taxes are clearly very important in enablingaround a third of development expenditure. But at another level they are constraining the industry.

Forestry’s contribution to the economy is less significant now than in the past, due to both thevagaries of the international economy and policies that constrain the industry. Demand for timberslumped after the Asian currency crisis. However, growth is recovering and demand for timberproducts is increasing. High commodity prices have increased earning from minerals, but no oneknows how long this situation will last.
Recent data on the forestry industry published by the Bank of PNG in its March 2006Quarterly Economic Report is as follows:• Forestry product exports in the March quarter accounted for 3.6 percent of total merchandise
exports, compared to 5.3 percent in the March quarter of 2005;27
• the average log export price was K180 per cubic meter, an increase of 4 percent over the sameperiod in 2005 ‘attributed to higher international prices, reflecting lower supply of tropicalhardwoods in the world market’;28 but
• the volume of logs exported, at 472,000 m3 was 22.4 percent lower than the correspondingquarter of 2005, ‘mainly due to lower production and shipment of logs from the major loggingprojects as a result of unfavourable weather conditions’.29
Economic sustainability in any economy is strengthened if the economic base of the economy is broad. The foregoing indicates how forestry has a continuing role in the growth of the PNGeconomy.
C H A P T E R 3 . E C O N O M I C S I G N I F I C A N C E O F F O R E S T RY T O P N G
14
27 Bank of Papua New Guinea (2006). Quarterly Economic Bulletin, March 2006, page 12, athttp://www.bankpng.gov.pg/publications/Mar06qebdoc.pdf.
28 Ibid., page 14.29 Ibid., page 15.
Table 3: Export taxes and Development Expenditure: Values and percentages: 1990-2005
Year Export Taxes Development Expenditure Export taxes as a percentage(K, million) (K, million) of development expenditure
1990 12.7 108.9 11.66
1991 18.4 152 12.10
1992 26.1 108.1 24.1
1993 73.9 198.5 37.2
1994 138.8 117.6 118.02
1995 132.9 219.5 60.54
1996 157.2 252.8 62.18
1997 148.4 191.9 77.33
1998 40.1 177.9 22.54
1999 78.9 737.7 10.69
2000 133.9 848.8 15.77
2001 98.1 1119.3 8.76
2002 106.7 1139.8 9.36
2003 111.8 1039 10.76
2004 101.5 1329.2 5.47
2005 136.3 1849.4 7.36
Source: Bank of PNG, Table 8.1, Fiscal Operations of the Central Government, athttp://www.bankpng.gov.pg/publications/qeb/dec05/qbdec05_8-1.pdf
Chapter 4. The IRT case against the forest industry
As noted, there is a popular myth that commercial forestry in PNG is not economically viable.The strongest support for this was provided in the draft report of the “Independent Review
Team” (IRT) set up in 2003 to review logging in PNG. This review was mandated by the WorldBank as one of the conditions for providing a US$40 million loan to improve management offorestry.
The IRT produced a draft report for review by stakeholders, including Government agencies.That did not occur. The report was never finalized. The PNG Government withdrew from theproject because it objected to the conditions required by the World Bank for the loan. Theseincluded a moratorium on new logging, and institutionalization of NGOs in management offorestry and biodiversity.
The IRT draft report gave currency to a wide variety of complaints about commercialforestry.30 These are not considered here. On the economics and financial state of the forestryindustry, the IRT concluded that forestry in PNG was neither profitable nor environmentallysustainable. It reported:
‘...logging was found to have little long term beneficial impact on landowners, although they bear theenvironmental cost’;
‘...the level of income under current arrangements is generally too small to impact significantly onrural living standards’;
‘...the logging industry ... is not profitable and the logging companies are not replacing their fieldequipment. This is not sustainable and unless the situation changes for the better it is estimated thatPNG’s current logging capacity will cease to exist within 10 years.’31
The IRT nominated eight ‘...necessary inputs: all of which had to be satisfied to demonstratethat forestry in PNG was sustainable’. They require, for example, “political will” by thegovernment to support forestry, “appropriate prices” for logs and “profitability”. This set ofinputs reality. It was a test that even a forest industry in a developed country could fail at any time.The inputs also required a level of governance most low-income developing countries could notmeet. The inputs are set out and discussed in Appendix II.
Appendix 8 (Socio-Economic and Financial Impacts Report) in Volume 2 of the IRT draftreport was the source of the IRT conclusions. The IRT commissioned Christopher LaFranchi, whois described as a natural resource economist, to prepare this Appendix. This was an odd selection.He was clearly disposed to Greenpeace’s bias against commercial forestry.32 It would be surprisingif this were not known to the IRT when they commissioned him.
To measure possible benefits in regional areas, LaFranchi’s analysis sets nine indicators. Anumber of these reflect philosophical bias. For example, the value of infrastructure is lowered ifthere is no public control and private consumption is rated lower than public investmentexpenditure. The case is analysed in detail in Appendix II.
15
T H E E C O N O M I C I M P O R TA N C E O F T H E F O R E S T I N D U S T RY T O PA P U A N E W G U I N E A
30 This included those made by Green NGOs about corruption, poor work practices, disregard of environmentalstandards and poor and inefficient administration by the Government of both forestry and environmentalpolicies. They are reviewed in detail in ITS Global (2006) Whatever it takes: Greenpeace’s anti-forestrycampaign in Papua New Guinea.
31 Independent Forest Review Team (2004). Towards Sustainable Timber Production – A Review of ExistingLogging Projects, Draft Observations and Recommendations Report op. cit., Volume 1, page viii.
32 IUCN refers to Mr. Lafranchi as being part of Greenpeace Pacific. Seehttp://www.iucn.org/themes/fcp/publications/arborvitae/avnewsletter/arborvitae11.pdf. IUCN has a close workingrelationship with Greenpeace Pacific. He appears to have a few previously published studies. He authored onejointly with Greenpeace Pacific in 1999 – Islands Adrift – Comparing Industrial and Small-Scale EconomicOptions for Marovo Lagoon Region of the Solomon Islands. It reveals LaFranchi as an ecological economistwith a strong romantic and pre-industrial bent. His perspectives are also redistributive and anti-private sector.

LaFranchi draws conclusions that are not justified. Some require detailed economic analysis,and no appropriate or convincing evidence is presented. The methodology employs accountingconcepts to draw economic conclusions. Fieldwork draws quantified conclusions fromimpressions by villagers. Overall, the IRT draft report lacks economic credibility.
Ordinarily this type of analysis would be marginalized by comparison with more mainstreamanalysis on the economic value and importance of the industry. There has, however, been littlerecent comment by official development agencies about the economic significance of the industry.This has allowed the report to acquire an authority it does not warrant.
Official development agencies use the classical definition of sustainable development. Insatisfying environmental objectives, development strategies must also ensure that goals to achievegrowth are maintained. As the LaFranchi/Greenpeace Pacific work on the Solomon Islandsdemonstrates, Greens give priority to ecological considerations. It is clear that the IRT review bentits perspective in this direction. It is disquieting that the World Bank and Department forInternational Development (DFID) appear to have countenanced this.
In 2005, the World Bank produced an Interim Strategy Note for Papua New Guinea.33 Itidentified industries as growth opportunities. It cited ‘food production for the domestic market;cash crops such as oil palm, vanilla and other spices; and in downstream agro-forestry’.34 It doesnot cite the timber industry. Yet in 1998 the World Bank pointed out the industry wascontributing US$270 million per year to PNG (8.6 percent of GDP) and was capable of improvingthat performance by another 10 percent.35
Colin Filer, an academic at the Australian National University (ANU), argued in his 2004paper A Serious Case of Conditionality: The World Bank Gets Stuck in the Forests of PNG thatthere was a conscious policy by the World Bank to stifle the log export industry in PNG.36 Thisconsultant also noted that since 1998, the World Bank has had a formal “partnership” with theWWF, with whom it has collaborated closely on forestry policy.37 WWF is closely allied withGreenpeace on forestry issues, and only supports forestry if it follows the principles laid down bythe Forest Stewardship Council (which is controlled by WWF).38
If development strategies do not encourage economic development of resources that cancontribute to growth in developing countries, the capacity to eradicate poverty, improve socialindicators, and improve management of the environment will be perpetually impeded.
Whatever the intent of the World Bank in forming the Forestry Alliance with WWF, the effectis represented in what happened in PNG. The research programs on forestry resulted in materialwhich sought to discredit commercial forestry.
C H A P T E R 4 . T H E I R T C A S E A G A I N S T T H E F O R E S T I N D U S T RY
16
33 World Bank (2005). Papua New Guinea – Interim Strategy Note, Report No.:31790-PG.34 Ibid., page 5.35 The World Bank has been quiet before[0]. In 1998, together with PNGFIA, it funded an independent study by
reputable forestry consultants (Groome Poyry Pty Ltd) on the benefits to landholders from forestryarrangements. The study showed the gains were significant. The Bank never released the study. It was availablefrom the PNGFIA but was not used by the IRT or its consultants who undertook the impact study. GroomePoyry Ltd (1998) Audit of Landowner Benefits Received from Harvesting Operations under Timber Permit,Final Report, Volume 1, April 1998.
36 Colin Filer (2004). “A Serious Case of Conditionality: The World Bank Gets Stuck in the Forests of PNG”,Development Bulletin 65, pages 95-99, 2004. In the paper Filer asks: ‘If Bank staff are innocent of my previoussuggestion that they always intended to stifle the log export industry in a mountain of red tape, should weconsider an alternative explanation of what has happened as a form of ‘analysis by paralysis’, in which eachsuccessive study generates more problems than it solves, because the implementation of its recommendationsonly serves to increase the complexity of the problem to which they are addressed?’
37 See http://www.forest-alliance.org. 38 Greenpeace is running a campaign against PNG forestry companies, claiming they practice illegal logging. It is
lobbying companies in Europe, and running public relations campaigns against some, for purchasing timberproducts if they might contain timber from PNG. It is urging them to subscribe to the certification system of theForest Stewardship Council. WWF is lobbying Government procurement agencies in Europe only to purchasetimber and paper products from businesses which are certified by the Forest Stewardship Council. See separatereport by ITS Global – Whatever it takes: Greenpeace’s anti-forestry campaign in Papua New Guinea.
Chapter 5. Regional impact of the forest industry
Green critics of forestry in PNG also claim that forestry does not deliver results to benefitpeople in the provinces. For example, the IRT reported that of the proceeds of the sales from
logs, only 7 percent went to the people; the lion’s share went to the owners of the logging companyand the rest to the national government.
This analysis is based on the direct distribution of taxes paid by the forestry companies on theproceeds of their sales. However, tax revenue cannot be considered as the whole economic impactof any productive activity. First, there are other economic benefits, like provision of infrastructureand other benefits flowing from the provision of hard infrastructure to support new industry (suchas construction of roads and airports) and soft infrastructure (such as provision of medicalfacilities and schools) and payments to local labour.
Then, there is the well-known flow-on, or “multiplier”, effect. This arises from the additionaleconomic activity that is created by follow-on spending by second parties on goods and servicesand employment of local people. Further, these are important ways benefits are delivered topeople in the regions. The IRT ignored the direct benefits to the region and, while it formallyrecognised the multiplier effect, it tended to discount its potential benefits.
A. Infrastructure investments
Infrastructure spending, especially road investments, is central to an assessment of the potentialeconomic impact of the industry.
ACIL Tasman quotes Pradham as having estimated ‘...an average economic rate of return forWorld Bank maintenance works of 45 percent and 24 percent for new construction projects.Based on the analysis for representative road maintenance options in PNG reported by AusAID(Australian aid agency), a 45 percent rate of return is equivalent to a benefit to cost ratio ofapproximately 3’.39
Hughes notes that ‘...targeted rural road development projects have been found to have hadvery positive poverty reduction benefits, especially in remote villages whose road access has beenimproved’, but that ‘...the level of development agency investment in most rural road projects ...is very small compared with that in the rehabilitation of main trunk roads and highways deemedto be of strategic importance in the national, provincial or regional level’.40
Hughes cites four benefits for rural communities from road rehabilitation:• more frequent and reliable services;• improved access by rural people to markets and suppliers in larger villages and towns;• improved access to health, education and agricultural extension services; and• long term increases in cash incomes because of improved access to markets and suppliers.41
The state of PNG roads suggests that the economic benefits flowing from new logging roadsmay be even more important than has been estimated. Hughes, for example, observes that: ‘Manyroads are now virtually impassable and in the highlands, for example, entire communities haveagain become largely isolated from the outside world, with drastic economic and social effects’.42
The World Bank has noted ‘...the overall inability to make sustainable progress in roads in the1990s in PNG had significant negative implications for the non-mining economy and access to
17
T H E E C O N O M I C I M P O R TA N C E O F T H E F O R E S T I N D U S T RY T O PA P U A N E W G U I N E A
39 ACIL Tasman (2005). Op. cit., page 70. 40 Philip Hughes (2005) The Difficult Problem of Measuring the Village-Level Socio-Economic Benefits of Road
Rehabilitation Projects in Rural Asia and Papua New Guinea, Working Paper No. 62, Resource Management inAsia-Pacific, 2005, at http://rspas.anu.edu.au.
41 Ibid., Box 1, page 4.42 Ibid., page 7.
social services’.43 The Asian Development Bank (ADB) observed, ‘...the survey data provides thathalf of the national roads are in poor or fair condition. ... Poor roads constrict mobility andeconomic growth. ... Enhanced mobility can yield significant economic benefits’.44
Anecdotal evidence supports this. Development Options Study For The Commercial ForestResource In the Kamula Doso Forest Area, Western Province, prepared by the ResourceManagement Division of the PNG Forest Authority (PNGFA), noted that ‘The majority of thelandowners welcome the proposed project and insists that it commence as soon as possible. Mostof the old people raised concerns that they want to benefit from this project before their times areup and demanded that project negotiations to accelerate’; and ‘Most of the villages within theproject area are only accessible by bush tracks’, and the road should link a number of areas.45
The IRT reports simply discounted the benefit of forestry from infrastructure expenditure inrural areas.
B. Flow-on effects
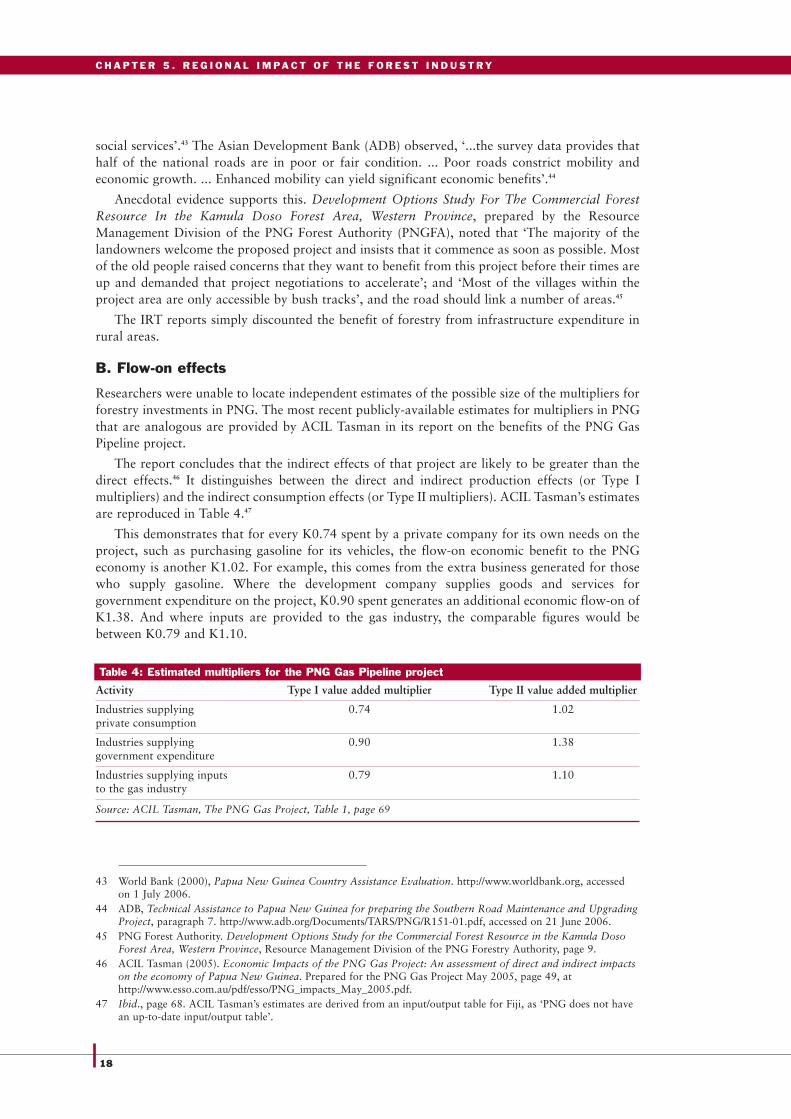
Researchers were unable to locate independent estimates of the possible size of the multipliers forforestry investments in PNG. The most recent publicly-available estimates for multipliers in PNGthat are analogous are provided by ACIL Tasman in its report on the benefits of the PNG GasPipeline project.
The report concludes that the indirect effects of that project are likely to be greater than thedirect effects.46 It distinguishes between the direct and indirect production effects (or Type Imultipliers) and the indirect consumption effects (or Type II multipliers). ACIL Tasman’s estimatesare reproduced in Table 4.47
This demonstrates that for every K0.74 spent by a private company for its own needs on theproject, such as purchasing gasoline for its vehicles, the flow-on economic benefit to the PNGeconomy is another K1.02. For example, this comes from the extra business generated for thosewho supply gasoline. Where the development company supplies goods and services forgovernment expenditure on the project, K0.90 spent generates an additional economic flow-on ofK1.38. And where inputs are provided to the gas industry, the comparable figures would bebetween K0.79 and K1.10.
C H A P T E R 5 . R E G I O N A L I M PA C T O F T H E F O R E S T I N D U S T RY
18
43 World Bank (2000), Papua New Guinea Country Assistance Evaluation. http://www.worldbank.org, accessedon 1 July 2006.
44 ADB, Technical Assistance to Papua New Guinea for preparing the Southern Road Maintenance and UpgradingProject, paragraph 7. http://www.adb.org/Documents/TARS/PNG/R151-01.pdf, accessed on 21 June 2006.
45 PNG Forest Authority. Development Options Study for the Commercial Forest Resource in the Kamula DosoForest Area, Western Province, Resource Management Division of the PNG Forestry Authority, page 9.
46 ACIL Tasman (2005). Economic Impacts of the PNG Gas Project: An assessment of direct and indirect impactson the economy of Papua New Guinea. Prepared for the PNG Gas Project May 2005, page 49, athttp://www.esso.com.au/pdf/esso/PNG_impacts_May_2005.pdf.
47 Ibid., page 68. ACIL Tasman’s estimates are derived from an input/output table for Fiji, as ‘PNG does not havean up-to-date input/output table’.
Table 4: Estimated multipliers for the PNG Gas Pipeline project
Activity Type I value added multiplier Type II value added multiplier
Industries supplying 0.74 1.02private consumption
Industries supplying 0.90 1.38government expenditure
Industries supplying inputs 0.79 1.10to the gas industry
Source: ACIL Tasman, The PNG Gas Project, Table 1, page 69

C. Omissions by the IRT
The IRT did not to seek to establish multipliers for the forestry industry. It is highly likely theywould be similar to those for the PNG Gas Pipeline project. The IRT report concedes theimportance of multiplier effects but argues that they are dampened ‘...to the extent that goods andservices procured with logging returns are imported or sold by foreign-owned and operatedentities’.48 The point is correct in principle, but no effort is made to quantify this; it is simplyasserted that such effects may be “non-existent”.49 This is highly unlikely. For it to be the case, nofurther investment would be made in PNG (all profits just repatriated); no local labour would beemployed; and no goods and services would be locally procured. This is clearly not the case.
The IRT concluded, ‘...the main economic impact at the local level is due to the direct financialpayments by landholders...’.50 In making such statement, it did not even take into account thewages paid to those working in regional areas.
The IRT also argued that, ‘...lasting infrastructure that does not accrue (schools, roads, healthfacilities, increased access to political processes, etc) is off-set by social and environmental costsborne primarily at the local level’.51 This assessment is based on impression, by the IRT’s ownadmission. In Volume 2 of its draft report, the IRT notes that, ‘...rigorous treatment of these costsand benefits would require collection of scientifically credible and empirical data, something thatis beyond the scope of this work’.52 This did not lead the review to be judicious about itsconclusions of the industry’s regional impact, or to qualify them.
The IRT draft report also contends that logging roads are not maintained and ‘thereforeprovide little positive impact after logging ceases’.53 Whether or not these roads are maintainedafter logging ceases does not, as the IRT implies, mean that they deliver no economic value afterthey have been constructed. Such a claim is inconsistent with observed fact: local people bothvalue and use logging roads and airstrips for commercial gain, as well as to access health andeducation services.
The IRT would seem to have either not been aware of, or chose to ignore, the solid body ofresearch demonstrating the socio-economic benefits of road investments in rural areas indeveloping countries. Rural people in PNG clearly appreciate this point.
The socio-economic impact of the forestry industry at the regional and local level is significant.For the purposes of this report a case study was made of the regional impact. The objectives weretwofold: first, to assess the size and comparative socio-economic significance of the forestryindustry at the regional and local level (this is discussed in the next chapter and Appendix III); andsecond, to use some of the data to reach broad conclusions about the potential of the industry forPNG (discussed in Chapter 7 and Appendix IV).
19
T H E E C O N O M I C I M P O R TA N C E O F T H E F O R E S T I N D U S T RY T O PA P U A N E W G U I N E A
48 Independent Forest Review Team (2004). Towards Sustainable Timber Production – A Review of ExistingLogging Projects, Draft Observations and Recommendations Report, Volume 2, Appendix 8, page 11.
49 Ibid., Appendix 7.2 contains more detail.50 Ibid., Volume 1, page 62.51 Ibid., Volume 1, page 63. 52 Ibid., Volume 2, page 12.53 Ibid., Volume 2, page 25.

Chapter 6. Regional impacts of forest industry – a case study
A. Impacts in the Western Province
The Rimbunan Hijau project at Wawoi Guavi in the Western Province was selected as a casestudy of the regional socio-economic significance of the forestry industry. The full case study
is set out in Appendix III.
In addition to presenting data on the regional socio-economic significance of the project, theintention was to compare expenditure on infrastructure, health and education by the Fly RiverProvincial (Western Province) Government, with that by Rimbunan Hijau at Wawoi Guavi. Itwould have been preferable to present comparable figures for both current and capitalexpenditure, but such data is not available. Therefore publicly-available material has beenaugmented with a considerable amount of information and advice provided by Rimbunan Hijau.This information has not been published before. It has facilitated an assessment (for the first time,as far as is known) of the regional socio-economic significance of the forestry industry in PNG.
The socio-economic importance of the Wawoi Guavi project can only be assessed in relationto conditions in Western Province, and the expenditure on health, education and transport by theWestern Province Government.54 Income levels are low, infrastructure is underdeveloped, andthere are major challenges in meeting health and education needs. Only 22 percent of childrenattend school.55 The Provincial Development Plan for the Fly River Provincial Government(Western Province) demonstrates that there is concern about what might replace mining when itscales down. Forestry is regarded as a key resource.
The Western Province 2006 Budget speech revealed that:• The development budget was K14.8 million, including K1.2 million for the District Road
Improvement Program, K0.3 million for the District Health Improvement Program, and K0.3million for the District Education Improvement Program.56
• In the South Fly District K0.4 million is ‘...for the upgrading of Binaturi/Oriomo Road’.Unconditional grants are provided to the district for health (K0.58 million), education (K0.78million) and infrastructure maintenance (K0.78 million).57
• K500,000 is provided as an air subsidy, ‘...so that government and other essential services tovery remote locations are conducted’.58 People in some regions can take ‘...four to eight hoursto reach service centres’.59
• ‘Subsidies in some schools are not more than K5,000’.60
How much of this allocated expenditure was actually spent by the government is, however,unclear. The amounts spent may be substantially less than those allocated in the budget.
The Wawoi Guavi project includes two processing plants: Panakawa and Kamusie. The projectis a substantial provider of employment, infrastructure and services in the Western Province:• There are 900 employees at the Wavoi Guavi Timber Company Limited and 600 at the
Panakawa Veneer Mill. Rimbunan Hijau has advised that there are also 300 contract workersemployed for exclusive contract work for Wavoi Guavi Timber Company Limited.
20
54 For the purposes of this case study we have not included direct spending on health, education and transport bythe national government.
55 Western Province 2010, the Provincial Development Plan of the Fly River Provincial Government for the PlanPeriod 2006-2110, page 17.
56 Ibid., page 78.57 Ibid., page 79.58 Ibid., page 86.59 Ibid., page 16. Map 3 in the Plan reveals, however, a paucity of major and minor roads in the Province.60 Ibid., page 86.

• Some of these employees are locals but many are from other regions. Skilled workers earnK2.00 per hour. Most stay 3-5 months and aim to earn a target level of income. Many returnwithin 12 months.
• Accommodation and free medical, water and electricity services are provided. Local produceis purchased.
• Around 3000 people live in the area, a high proportion of whom use the services provided forthe project, including roads, schools, the airstrip and the medical facilities.
• The air services are available to, and used by, local people.61
• More than 100 children attend the school at Kamusie.62
• The medical aid posts have qualified doctors and serve both employees and local people.
The PNG Forest Authority’s Draft Individual Project Report No. 14 on Wawoi Guavi,63
‘...carried out under the auspices of the Department of National Planning and Monitoring’, notesthat:• ‘...landowners expressed support for the company to continue logging as there was no other
form of development for them’;64 and• ‘landowners welcomed the construction of roads and bridges’ and made a strong plea to the
National Government to contribute part of the export tax money into developing sustainableinfrastructures and social development in the project area’.65
Advice was sought from Rimbunan Hijau on its capital and recurrent spending oninfrastructure, health and education for the Wawoi Guavi project. Tables 5, 6, 7 and 8 inAppendix III contain details on infrastructure development projects delivered; infrastructure,health and education spending; the cost of roads constructed; and the value of roads constructed.The tables also contain a breakdown provided by Tropic Air (which operates the air service to theproject) on use of the service to Wawoi Guavi in March 2006 by employees, landowners and thirdparties. Table 5 in Appendix III contains a summary prepared by ITS Global from advice providedby Rimbunan Hijau, on premiums and levies, royalties, export duty, infrastructure and totalspending – which is also an approximate measure of the contribution of the project to GDP.
B. Forestry industry expenditure compared to provincial government expenditure
Expenditure by Rimbunan Hijau is set out in the Case Study in the Appendix III; Table 5 specifiesexpenditures on the Wawoi Guavi. Key data shows that:
21
T H E E C O N O M I C I M P O R TA N C E O F T H E F O R E S T I N D U S T RY T O PA P U A N E W G U I N E A
61 During the visit to Kamusie by ITS Global the aircraft flew to an adjacent town, collected a severely injuredperson and transported him and a carer to Port Moresby. We were advised that such events are common andthat land/river transport to a hospital would have taken days rather than hours. Based on the subsidy for airtravel in the 2006 Western Province budget reported above, the value of the air services associated with theWawoi Guavi operation would appear to be more widely understood and appreciated by the Western ProvinceGovernment and local people than by those who wrote the IRT report. Air services benefits are not included inthe IRT report’s list of potential benefits from forestry. (See for example the list presented in Volume 2, page 26of the IRT report.)
62 The head teacher of the school at Kamusie told ITS Global that he had been educated at the school, but therewere problems in attracting teachers to isolated schools such as this. He said there was a strong demand foreducation in the area but that without the present school, the prospect of the provincial governmentestablishing, staffing or funding a school was remote. The PNG Forest Authority report (page 22, see followingfootnote reference) noted that the (then 2004) intake consisted of 75 percent employee’s children and 25 percentfrom surrounding villages.
63 PNG Forest Authority (2004) Review of Current Logging Projects, Draft Individual Review Report No 14,based on a Field Review in April 2004.
64 Ibid., pages 12 and 13.65 Ibid., page 12. While this draft review was written at the same time as the draft IRT report (May 2004), the
IRT authors, who reviewed the Wawoi Guavi project, have reached radically different conclusions from thoseexpressed by landowners as quoted by the PNG Forestry Authority report. There is, for example, nothing in thelatter to justify the IRT conclusion that: ‘A relatively small percentage of the total direct payments (andassociated infrastructure benefits) reach the poorest and most remotely located communities’, and ‘Lastinginfrastructure that does accrue (schools, roads, health facilities, increased access to political processes etc) areoff-set by social and environmental costs borne primarily at the local level’ (IRT, Volume 1, page 63).

• national wages paid have grown very substantially, from K1.03 million in 1993 to K7.15million in 2005;
• export duty (K147.11 million) comprises 55.4 percent of the total contribution to GDP fromthe project. It is not credible to argue that the project is not making a major contribution toGDP;
• royalty and wages paid to nationals together comprise K80.1 between 1993 and 2005 – oraround 30 percent of total project contributions to GDP. Local people and landowners arereceiving very substantial benefits from the project – a point that they clearly understand.
• the figures for any one year are a very close approximation to the contribution from the projectto GDP. This contribution had been rising steadily since 1993 and represented around K27.6million in 2005 – compared with Unconditional Grants to the Western Government in the2006 national budget of K34.47 million. The total contribution to GDP since 1993 wouldhave been around K265 million.
In 2006, the Western Provincial Government’s expenditure on infrastructure and services inthe Fly River District was around K12 million. The total budget for expenditure on roads in theWestern Province for 2006 was K1.2 million. Rimbunan Hijau spent K27.25 million at WawoiGuavi in 2005. Average annual expenditure on roads by Rimbunan Hijau is K16 million. For therecord, Rimbunan Hijau has spent K92.86 million over 12 years, with annual average expenditurebeing K7.74 million per annum.66 Those are direct expenditures.
Total expenditure by the Provincial Government in the Fly River District for 2006 is likely tobe K12 million. The economic welfare impact of these expenditures, if the multipliers used toassess the PNG Gas Pipeline project are applied, would be more than double the initial amount.
Based on the information provided above and in Appendix III, the following broad conclusionsare warranted:• The transport infrastructure (roads, wharf, and airstrips) installed by Rimbunan Hijau
represents a very substantial investment. The figures for the value of these investments are notdirectly comparable with figures on similar investments by the Western Province government.However, it is clear from the Western Province 2006 budget, that the government’s spendingon similar transport infrastructure in the region in which the Wawoi Guavi project isconsiderably less than the investment by Rimbunan Hijau.
• There is no data collected on how much locals use logging roads, but some locals report thatthe roads are considered valuable and used extensively.
• Figures on the usage of the air strip and the air service to Wawoi Guavi demonstrate that theexternal benefits of this service are very significant for local people.
• The spending by Rimbunan Hijau on health and education infrastructure at Wawoi Guavi isvery significant in terms of providing these services to local people. The size of the WesternProvince budget would not allow for provision of comparable services if Rimbunan Hijau’scontributions were to cease.
When considering the multiplier effects from the infrastructure, health and educationexpenditure by Rimbunan Hijau in the Western Province, it is also reasonable to conclude that inaddition to its overall contribution to the national economy of around 5 to 10 percent, the forestrysector is having a very significant socio-economic impact at the regional and local levels.
C h a p t e r 6 . R e g i o n a l i m p a c t s o f f o r e s t i n d u s t r y – a c a s e s t u d y
22
66 Advice to ITS Global by Rimbunan Hijau.

Chapter 7. What constrains forestry in PNG?
The forestry industry is not only significantly more important than is commonly understood,but it also has the potential to generate much more income and employment than it is doing
at present. By operating at around 30 percent below the sustainable potential of PNG’s naturalforests (as estimated by ITTO), the government may have foregone revenue of around US$20million in 2004. To this loss would need to be added lower levels of exports, employment andlandowner benefits.67
Some analysts argue that property rights are a major constraint on the forestry industryachieving its potential, as almost all land is communally owned. There is an extensive literatureon this subject. It suggests that communal ownership of land, particularly securing agreement onarrangements for an equitable share of royalties among those who claim a right to them, willremain a challenge. The literature reviewed and consultations undertaken for this report suggestthat, while important, this property rights are neither an insurmountable problem nor among themajor issues constraining the industry.
Taxation arrangements are a major, if not the main, constraint. There is a respectable body ofresearch demonstrating that taxation arrangements for the industry are deficient. PNGFIA arguesthat: ‘...the industry is financially unsustainable because the government, including previousgovernment(s), chooses to make it so by not reviewing the forest revenue system’.68
It should be noted that this contention does not support the Green case that commerciallogging is not economically viable. The point here is that government’s financial regulations areinhibiting the natural economic viability of the industry.
Curtin argues that ‘the effective marginal rate of the log export tax is easily as much as 110percent of normal profits, for a normal gross profit margin on sales of K100 per cubic metrewould be 30 percent, but the log tax rises to 30 percent of sales value when prices rise ... betweenK110 and K130 per cubic metre, 50 percent between K130 and K150, and finally 70 percent onthe excess of prices above K200 (as of 2000; there have been slight adjustments since then)’.69
Curtin argues that an export tax is not an effective way to encourage exports, and believes thatthe World Bank recognised that most Goods and Services Tax (GST) systems exempt exports byproviding refunds of GST paid on exporters inputs ‘but excused its progressive export tax on thegrounds that the country’s Internal Revenue Commission was not capable of collecting corporatetaxes from the log exporters’.70
A high marginal export tax rate (which can amount to 61.75 percent when applying to FOBprices exceeding US$50.20/m3) constitutes a major disincentive for exporters. This disincentive iscompounded by the requirement to contribute additional landowner payments of 10-15 percent.
A progressive export tax is bad enough. But its impact on the economics of the industry isexacerbated by this progressivity being based on FOB prices determined in US Dollars at a fixedexchange rate. The forest revenue system was introduced in 1995 when the Kina/US Dollarexchange rate was around US$0.76 and export taxes were in the range of 15-17 percent for FOBvalues between US$55/m3 and US$75/m3. Following the subsequent depreciation of the Kina, theincidence of export taxes increased substantially – from around 15 percent in 1995 to around 33percent in 2003 for FOB prices of US$55/m3.
A taxation system that penalises exports as they become more valuable will not provide the
23
T H E E C O N O M I C I M P O R TA N C E O F T H E F O R E S T I N D U S T RY T O PA P U A N E W G U I N E A
67 The calculations by which this estimate is reached are in Appendix IV.68 Papua New Guinea Forest Industries Association, Submission, page 10.69 Curtin, T. (2004). How Poor is Papua New Guinea? How Rich Could it be? pages 11 and 12. 70 Ibid., page 12. Curtin describes the World Bank as being ‘both cynical and dishonest’, in arguing that ‘the fall in
log exports in 1998 and 1999 was not due to its tax but to the regional economic crisis of 1997-98. ButMalaysia’s strong forest product exports in those years give the lie to the World Bank’s assertion’.

incentives for forestry companies to invest in and maximise the industry’s potential economiccontribution – bearing in mind the risk premium required to attract and retain foreign investment.71
To mitigate the depreciation in the Kina and its impact on export tax rates, a new export taxscale was introduced in 2003. The new scale applied the existing tax rate and used a fixedexchange rate of US$0.251. There was no allowance for the impact of changes in the Kina/US$exchange rate. With the appreciation of the Kina from 2003 (to US$0.345 in 2005), the exporttax payable has increased from K62/m3 a year in 2002 to K77m3 a year in 2005 based on anequivalent FOB value of K203/m3. At those levels, only around 25 percent of revenue (orK35.75/m3) is available to the exporter to cover operating expenses and overheads.
There is clearly a risk that these taxation arrangements may prevent companies fromgenerating sufficient profits to remain in the industry over the longer term. Rimbunan Hijauestimates that the export tax payable has increased from K62 per cubic metre of timber exportedto K77 per cubic metre.
The long term economic viability was at the heart of the IRT analysis which assumed that theexport tax regime ... ‘would remain static’.72
An issue for further analysis is the extent to which the current taxation arrangements or otherpolicy and institutional arrangements explain why PNG is foregoing a significant amount ofgovernment revenue and landowner benefits by not using its native forests at the maximumsustainable level.73 There is a very strong case for the taxation arrangements for the forestryindustry to be reconsidered.
The second constraint is a set of economic policies and institutional arrangements that are eithernot conducive to the industry achieving its potential or which actively inhibit it. The reasons arecomplex. A central theme present in the literature and the evidence obtained by ITS Global is thatGreen and anti-globalisation NGOs have succeeded in their efforts to exert direct and indirect influenceon successive PNG governments. This has resulted in the implementation of a set of policies andinstitutional arrangements for the forestry industry that are substantially less than optimum.
NGOs have argued that the industry is operating illegally and is environmentallyunsustainable. The illegality proposition is examined in detail in a separate report by ITS Global.74
It is without foundation. The proposition that the industry is currently environmentally unsustainableis inconsistent with the evidence presented in Appendix IV, which shows that: • the annual sustainable production from native forests is estimated by the ITTO to be 3.135
million m3 per annum;
C H A P T E R 7 . W H AT C O N S T R A I N S F O R E S T RY I N P N G ?
24
71 Ibid., p. 13 Curtin contrasts forestry taxation arrangements with what he describes as PNG’s sensible approachof a flat tax rate of 35 percent on foreign mining companies’ profits ‘even though it secures only aproportionately high revenue yield when profits are high’. He believes that additional profits taxes are ‘inimicalto profit maximisation (attainable only with flat rate corporate taxes) because of its progressive character’.
72 Independent Forest Review Team. (2004). Towards Sustainable Timber Production – A Review of ExistingLogging Projects, Draft Observations and Recommendations Report Volume 2, Appendix 8, page 10.
73 One of the conclusions reached by the IRT was that the industry is not financially sustainable under currentarrangements. For the reasons set out in Appendix IV, the analysis used by the IRT in reaching its keyconclusions on financial viability is defective. Key data required to determine the profitability of forestrycompanies is confidential. Evidence of short term profit performances in the industry are not, prima facie,evidence that the companies are financially unsustainable in the terms set out in the IRT report. Even if suchinformation was available publicly, determining whether any lack of profitability reflects the underlyingeconomics of the industry or whether it reflects inefficient taxation, policy and/or institutional arrangements, isa separate exercise. In focusing on the depreciation in the Kina/US Dollar exchange rate and the impact onlandholder payments the IRT does not give sufficient attention to the impact on profitability of a progressiveexport taxation system combined with a fixed exchange rate conversion factor. It purports to demonstrate thatthe industry is financially unsustainable and is therefore operating in an environmentally unsustainable way. Itdraws the wrong conclusion from the fact that taxation arrangements are sub-optimal and constraining profits:rather than the IRT argument that lack of profitability is driving companies to operate in an environmentallyunsustainable way, the evidence presented in Appendix IV (using ITTO and FAO figures) is that the forestryindustry is using only around 70 percent of PNG’s annual sustainable production from native forests.
74 ITS Global (2006). Whatever it takes: Greenpeace’s anti-forestry campaign in Papua New Guinea. Report forRimbunan Hijau, Melbourne.

• in 2004 the volume harvested from natural forests was 2.171 million m3; and• FAO data indicates that the total area under forest (excluding plantations) has been relatively
stable for 30 years.
The policy and institutional reasons for this underperformance need to be understood andaddressed.
A policy issue that warrants attention is how silvicultural investments should be undertaken.An objective of silvicultural investments is to ensure that, over PNG’s 35 year cutting cycle, thelarger trees that are harvested are replaced. It was put to us during research for this report thatthe Papua New Guinea Forest Authority (PNGFA) uses too much of the levies designed to fundsilvicultural investments for administrative expenditure.
An alternative would be to require the forestry companies to undertake an account to aresponsible entity for silvicultural investments – which could be specified by the PNGFA. Thiscould be achieved by requiring the companies to satisfy either the PNGFA or a reputableinternational forestry entity that such investments had been made. In return, the forestrycompanies could be exempt from all or a significant proportion of their current or prospectivelevy obligations.
The focus should be on which option is most likely to ensure that the largest trees areregenerated over PNG’s 35 year cutting cycle.
A. Potential contribution
Curtin considers the development of extensive plantation forestry. He asks whether PNG mightultimately attain Sweden’s level of output, and concludes ‘...there is no reason why it could not,given its equal – possibly superior – suitability for softwood pine forestry’. The potential value ofproduction ‘...could be worth K13 billion, nearly double total exports in 2003, which wouldtherefore much more than compensate for the projected decline in mineral exports after 2010’.75
Curtin argues that, based on the experiences of New Zealand (NZ) and the Solomon Islandswith plantation forestry, PNG has the potential to double its total exports and thereby ‘generateat least a proportionate increase in national income and GDP and thereby a doubling of averageincomes from the present (2003) US$673-760 ... to about US$1,400’.76 Curtin concludes that his‘...could be achieved within 10-15 years if plantations were developed on the rotation basis thatthe World Bank’s first forestry report (1990) considered feasible’.77
Curtin argues persuasively that it is a realistic option for PNG to develop its forest industriesand increase the benefits from it, as others have:• New Zealand produced nearly ten times as much as PNG in the 1990s, ‘...but from a forested
area that is only seven percent of NZ’s, smaller, total land area’.78
• ‘If PNG produced as much pro rata (as a New Zealand project) from only 5 million hectaresof its total forest area of well over 30 million hectares, its log exports would be worth US$4billion, or K13.5 billion, more than double its actual mineral exports in 2003.79
• ‘In 1993, 26,750 persons were engaged in timber related industries – about three times morethan in the whole of PNG’s mining industry’.80
• Unlike in New Zealand, which has a vibrant log export industry, PNG forestry licences areonly issued for a short periods, and so ‘...there has been little incentive for licencees either toundertake sustainable logging of natural forest or to replant on a plantation basis’.81
25
T H E E C O N O M I C I M P O R TA N C E O F T H E F O R E S T I N D U S T RY T O PA P U A N E W G U I N E A
75 Curtin, T. (2005) op. cit., page 3.76 Ibid., page 11.77 Ibid.78 Ibid., page 3.79 Ibid., page 4.80 Ibid., page 3.81 Ibid., page 8.

• Drawing on Fiji’s experience with plantation forestry, he concludes that ‘...the potential formuch larger areas to be planted in PNG, along with better soils and higher rainfall, wouldsuggest that the Fijian model of direct landholder participation in ownership and managementcould be successfully transplanted’.82
Capitalising on its plantation forestry potential options therefore appears a sensible option forPNG. But it is not the only one.
In principle, using more of its native forestry resources for value adding should deliver it morebenefits than exporting logs – although, as Australia’s experience with minerals and New Zealand’sexperience with log exports demonstrate, moving further up the value adding chain is notnecessarily the best option. In other words, whether to seek to move up the native forestry valueadding chain is an empirical rather than a theoretical issue.
Researchers considered whether to use data from the Wavoi Guavi project to estimate thepotential benefits from replicating that value adding experience at that project elsewhere in PNG.It was concluded that, in addition to methodological issues, the data was not good enough toundertake such an exercise. The reasons for this conclusion are set out in Appendix IV.
Data of sufficient quality is, however, available to estimate how much PNG is losing by notusing the full sustainable potential of its natural forest endowment. Appendix IV demonstratesthat in addition to lower levels of exports, employment and landowner benefits, PNG lost aroundUS$20 million in government revenue in 2004 by using substantially less than the annualsustainable production from its native forests.
The constraints preventing the forestry industry from maximising its potential contribution toeconomic growth in PNG therefore reflect both policy and institutional arrangements. Taxationand other policies, which are based on the unjustified premise that the industry is notenvironmentally sustainable, need to be addressed if that potential is to be realised.
C H A P T E R 7 . W H AT C O N S T R A I N S F O R E S T RY I N P N G ?
26
82 Ibid., page 5.
Chapter 8. Conclusions
PNG’s forestry endowment constitutes one of its major assets. Notwithstanding attempts byGreen and development NGOs to argue that this asset is being squandered, there is no
convincing evidence that the industry is operating unsustainably. Indeed, the evidence points tothe opposite conclusion.
Those arguing that the industry is either unsustainable or not delivering real benefits for PNG,landowners or rural people, have been allowed to make allegations that are not backed up byevidence. The claims put forward in the IRT report should be regarded as unjustified on the basisof the methodology and the evidence offered in the report.
There is no economic case against fostering a vibrant and productive forestry industry in PNG.The fiscal and economic policy challenges that PNG confronts are well known. It is enough tonote that life expectancy in PNG is unacceptably low and infant mortality unacceptably high (asshown above). Yet there has been a persistent and continuous challenge to the forestry industryin PNG. The case is ostensibly based on environmental values and opposition to corruption. Thisdissension appears to have engendered analysis purporting to demonstrate that the social andeconomic value of the forest industry to PNG is low.
The regional socio-economic impact of the industry is significant. There is scope to use PNG’sforestry resource endowment in a more ambitious way, to satisfy the interests of national andprovincial governments, landowners and regional people. The first step is to understand thenational and regional socio-economic importance of the industry. Hopefully this report willcontribute to that understanding. The second step is to base policy on the premise that thecompanies involved in the industry have just as much interest in seeing it develop in a sustainableway as do landowners, rural people and the governments. The third step would be to put thearguments advanced by Green and development NGOs into some perspective, as reports by thesegroups are deeply flawed and should not be allowed to influence policy.
The result has been that one of PNG’s primary sources of wealth has been either ignored, orsubject to policies that inhibit its socio-economic potential and actively undermine the industry.The costs are not been paid in Port Moresby. They are paid by rural people, who cannot getemployment, cannot connect with the market, and cannot get access to health and educationservices (whether provided directly by the companies or indirectly by their exports whichunderpin government spending). Also affected are the urban poor who have come to the cities dueto the lack of access to those services in regional centres.
By not capitalising on one of its main natural resources, PNG is failing to generate the wealthand employment that are on offer. This failure to capitalise appears very substantial. In additionto exports, employment and landowner benefits being substantially less than they could havebeen, the failure to use the annual sustainable production from its forestry endowment is thatgovernment revenue was around US$20 million lower in 2004 than it could have been.
The lessons learnt in New Zealand, Sweden, Finland and Chile should be studied and appliedin PNG: encourage the industry, don’t constrain it. If not, the chances are that an industry whichhas made a real and sustained contribution to wealth will continue to underperform.Development agencies need to return to their core goal of fostering development, rather thansupporting the activities of those whose primary motive is not to improve the economic and socialcondition of the people of Papua New Guinea, but rather to denigrate the forestry industry.
27
T H E E C O N O M I C I M P O R TA N C E O F T H E F O R E S T I N D U S T RY T O PA P U A N E W G U I N E A

References
ACIL Tasman (2005). Economic Impacts of the PNG Gas Project: An assessment of direct andindirect impacts on the economy of Papua New Guinea. Prepared for the PNG Gas Project, 15May 2005, in conjunction with Focus Economics, ACIL Tasman, Melbourne.
Arentz, F., Brunton, Carothers, A., Cortesi, L., Holzknecht, H., and LaFranchi, C. (1998).Sustaining Papua New Guinea’s National Heritage: An analysis of Papua New Guinea’s nationalforest plan. Boroko and Gerehu, Papua New Guinea, World Wide Fund for Nature and Greenpeace.
Asian Development Bank (2006). Papua New Guinea: Country Information, ADB, Manila.Available at: www.adb.org/papuanewguinea/country-info.asp
Asian Development Bank (2001). Technical Assistance to Papua New Guinea for preparing theSouthern Road Maintenance and Upgrading Project, ADB, Manila. Available at:http://www.adb.org/Documents/TARS/PNG/R151-01.pdf
Bank of Papua New Guinea, various publications.
Central Intelligence Agency (2006). The World Factbook 2006. CIA, Washington, DC.Available at: http://cia.gov/cia/publication/factbook
Chand, S. (2003). PNG Economic survey: some weak signs of recovery, PNG Update Series,ANU Asia Pacific School of Economics and Government, Canberra.
Curtin, T. (2005). Forestry and Economic Development in Papua New Guinea, Paper based onseminar presentation for ANU Research School of Pacific and Asian Studies, 28 October 2004,Canberra. Available athttp://archives.pireport.org/archive/2006/April/Forestry_development_PNG.pdf
Curtin, T. (2004). How Poor is Papua New Guinea? How Rich could it be? ResourceManagement in Asia-Pacific Working Paper No. 56. ANU Research School of Pacific and AsianStudies, Canberra. Available at: http://rspas.anu.edu.au/papers/rmap/Wpapers/rmap_wp56.pdf
Department of Foreign Affairs and Trade (2004). Papua New Guinea: the Road Ahead, DFAT,Canberra.
Filer, C. (2005). “A Serious Case of Conditionality: The World Bank gets stuck in the forests ofPNG”, Development Bulletin 65, ANU Development Studies Network, Canberra.
Filer, C. (1996). The Social Context of Renewable Resource Depletion in Papua New Guinea,Unpublished paper.
Fly River Provincial Government (2006). Western Province 2010: the Provincial DevelopmentPlan of the Fly River Provincial Government for the Plan Period 2006-2110. Fly RiverProvincial Government.
Food and Agriculture Organization of the United Nations (2005). Global Forest ResourcesAssessment 2005: Papua New Guinea Country Report, FAO, Rome.
Forest Trends (2006). Logging, Legality, and Livelihoods in Papua New Guinea: Synthesis ofthe Large-Scale Logging Industry, Forest Trends, Jakarta.
Groome Poyry Ltd (1998). Audit Of Landowner Benefits Received From HarvestingOperations Under Timber Permit, Final Report, Volume 1.
Hughes, P. (2005). The Difficult Problem of Measuring the Village-Level Socio-EconomicBenefits of Road Rehabilitation Projects in Rural Asia and Papua New Guinea, ResourceManagement in Asia-Pacific Working Paper No. 62, ANU Research School of Pacific and AsianStudies, Canberra.
28

Independent Forest Review Team (2004). Towards Sustainable Timber Production – A Reviewof Existing Logging Projects (2004). Draft observations and recommendations report, preparedfor the Government of Papua New Guinea. Prepared by the 2003/2004 Review Team. March 2004.
International Tropical Timber Organization (2004). Annual Review and Assessment of theWorld Timber Situation 2005. Available at www.itto.or.jp
ITS Global (2006). Whatever it takes: Greenpeace’s anti-forestry campaign in Papua NewGuinea. Report for Rimbunan Hijau, Melbourne.
LaFranchi, C. and Greenpeace Pacific (1999). Islands Adrift – Comparing industrial and small-scale economic options for Marovo Lagoon Region of the Solomon Islands, Greenpeace Pacific,Suva, Fiji.
National Commission on Science for Sustainable Forestry (2005). Global Markets ForumSummary Report of the National Commission on Science for Sustainable Forestry. NCSSF,Washington, DC.
National Economic and Fiscal Commission (2005). Information Paper: 2005 Derivation Grant.NEFC, Port Moresby. Available at: www.nefc.gov.pg
National Statistical Office of Papua New Guinea, various publications.
PNG Department of National Planning and Monitoring. Review of Current LoggingOperations, Draft Individual Project Review Report No 14, TP 1-07 Wawoi Guavi.
PNG Forest Authority, Resource Management Division, Development Options Study for theCommercial Forest Resource in the Kamula Doso Forest Area, Western Province
PNG Forest Industries Association (2004). Submission, Draft Observations and RecommendationsReport, May 2004
PNG Forest Industries Association, various statistical publications.
PriceWaterhouseCoopers (2005). 2005 Global Forest and Paper Industry Survey.PriceWaterhouseCoopers, Vancouver. www.pwc.com/forestsurvey05
Rimbunan Hijau (PNG) Group of Companies (2005). Report on 2005 Chainsaw Training Program.
Rimbunan Hijau (PNG) Group of Companies (2003) Manufacturer of the Year, “ExportAward” Application.
Rimbunan Hijau, various data.
UNECE/FAO (2005). Forest Products Annual Market Review 2004-2005. Available at:http://www.unece.org/trade/timber/docs/fpama/2005/fpama2005a.htm
United Nations Development Program (2004). Papua New Guinea – Millennium DevelopmentGoals Progress Report 2004. UNDP, PNG.
World Bank (2006). Country Statistical Information Papua New Guinea. Available at:http://ddp-ext.worldbank.org/ext/CSIDB/getCountryStatInfoXML?id=PNG&format=CSIDB
World Bank (2005). Papua New Guinea Interim Strategy Note, Report no. 31790. World Bank,Washington DC.
World Bank (1998). Papua New Guinea Forestry and Conservation Project. Report PID8284,World Bank, Washington DC.
World Trade Organization (1999). Trade Policy Review of Papua New Guinea, Document No.WT/TPR/S/62, WTO, Geneva.
29
T H E E C O N O M I C I M P O R TA N C E O F T H E F O R E S T I N D U S T RY T O PA P U A N E W G U I N E A

Appendices
I. Data sources and reliability
Both published and unpublished materials have been used in the preparation of this report. Aconsistent theme in reports on PNG by the World Bank and the ADB is the quality and coverage
of the data. As noted in the Introduction, the World Bank’s Statistical Capacity Indicator gives PNGstatistics a ranking of 50 out of 100 for statistical practice but only 30 out of 100 for data collection.83
This has several implications for this report. First, when making assessments of the regionaleconomic contribution of the forestry industry, there must clearly remain significant doubt as towhether this contribution is reflected properly in national macroeconomic numbers.
Second, it is difficult to compare data on the infrastructure, health and education spending bya specific company with similar expenditure by either the national or a provincial government.Data provided by Rimbunan Hijau is detailed and reflects attention to detail in the costs incurredto establish infrastructure at the Wawoi Guavi project. With the exception of data oninfrastructure, the data from Rimbunan Hijau used in this report is from its audited financialstatements. The Western Province government data used is almost certainly less reliable. It is notknown what proportion of funds appropriated to specific projects or programs were spent. Careis therefore required in using the two data sets. Specifically, using this aggregate data to reachmore specific microeconomic conclusions than those drawn in this report should only be donewith caution. The overall conclusions as to the comparative levels of socio-economic expenditureby Rimbunan Hijau and the Western Province Government are, however, so stark that they aremost unlikely to be explained by data issues alone.
Third, apparent disparities in official and private sector figures presumably reflect theproblems with PNG data that have informed the World Bank’s data collection rating. The PNGNational Economic and Fiscal Commission (NEFC) has noted: ‘(Derivation Grant) calculationsrequire nationally consistent, comparable, accurate and reliable sources of data. The NEFC isunable to rely on data that has been provided by individual provinces, since these are typicallyassembled using different assumptions and methods and may not be comparable across allprovinces. The Organic Law on Provincial and Local Level Governments requires NEFC toinclude export commodities only where it is satisfied that all provinces’ exports of a particularcommodity have been counted and the origin determined. The NEFC prefers to use the exportdata provided by a relevant industry body to provide a consistent and comparable record of theexports of a particular commodity across Papua New Guinea’.84
II. Critique of the Independent Review Team report
Appendix 8 (Socio-Economic and Financial Impacts Report) in Volume 2 of the IRT draft reportwas central to the report’s conclusion that forestry in PNG was neither profitable nor environ-mentally sustainable. It was written by Christopher LaFranchi, who is described as a natural resourceeconomist. His qualifications and experience, particularly his economics expertise, are not statedin the report. He has jointly authored a report with Greenpeace Pacific entitled Islands Adrift?Comparing industrial and small-scale economic options for Morovo Lagoon region of theSolomon Islands.85 IUCN refer to him as being part of Greenpeace Pacific.86 The Islands Adrift
30
83 World Bank (2006). Country Statistical Information Papua New Guinea. Available at: http://ddp-ext.worldbank.org/ext/CSIDB/getCountryStatInfoXML?id=PNG&format=CSIDB.
84 National Economic and Fiscal Commission, Information Paper, 2005 Derivation Grant, page 585 Christopher LaFranchi also co-authored a report for Greenpeace and WWF in 1998, which analysed Papua New
Guinea’s National Forest Plan. This is in Arentz, F., B. Brunton, A. Carothers, L. Cortesi, H. Holzknecht and C.LaFranchi, 1998, Sustaining Papua New Guinea’s National Heritage: An analysis of Papua New Guinea’snational forest plan, Boroko and Gerehu, Papua New Guinea, World Wide Fund for Nature and Greenpeace.
86 See http://www.iucn.org/themes/fcp/publications/arborvitae/avnewsletter/arborvitae11.pdf.
report suggests that LaFranchi could be described as an ecological economist with a strongromantic and pre-industrial bent.87 His perspectives are also redistributionist and anti-private sector. It would be surprising if this were not known to the IRT when theycommissioned him.
IRT reports: mandate and approach
The IRT draft observations and recommendations (the “report”) were published in May 2004.They note that ‘...the review is a PNG Government response to its concern to: “Ensure that theforest industry is moving satisfactorily towards a sustainable harvest yield basis, environmentallyacceptable logging practices and is providing meaningful long term benefits to landowners”’.Within this framework the (Terms of Reference) specify that the overall aim of the review is to:“Assess overall compliance by existing logging projects; and to Review the standards andprocedures available for the monitoring and control of the industry”.88
The key conclusions were that:
‘...logging was found to have little long term beneficial impact on landowners, although they bear theenvironmental cost...’;
‘...the level of income under current arrangements is generally too small to impact significantly onrural living standards...’;
‘...the logging industry ... is not profitable and the logging companies are not replacing their fieldequipment. This is not sustainable and unless the situation changes for the better it is estimated thatPNG’s current logging capacity will cease to exist within 10 years’.89
The IRT identifies eight “necessary inputs” for the achievement of the Government’s sustainableforestry objective:1) political will and support;2) policies, laws and (where necessary) regulations and guidelines;3) regulatory institutions with the will, power and resources to enforce the regulations and
guidelines; 4) adequate log prices; 5) land suitable for forestry which the owners are willing to make available on a long term basis; 6) forest management; 7) a financially sustainable logging industry capable of replacing its equipment and earning
sufficient profits to keep it engaged in the sector; and 8) a sustainable supply of skilled labour willing to work for the regulatory institutions and the
logging industry.
31
T H E E C O N O M I C I M P O R TA N C E O F T H E F O R E S T I N D U S T RY T O PA P U A N E W G U I N E A
87 See http://www.greenpeace.org.nz/pdfs/marovo_report.pdf. LaFranchi purports to estimate the relative costs andbenefits of logging the forests around Marovo Lagoon in the Solomon Islands or converting it to plantations,compared with the benefits derived from continued traditional practices. Consultations were held with selectedgroups, probabilities assigned to ‘the relative impact from industrial options on the resources and enterprisesstudied’ and generalised to the rest of the study area. Data is presented but it is not clear how it was derived.The key conclusions do not appear justified by the data and assumptions involved or the methodology used.Key conclusions are assumed rather than demonstrated: ‘Arguably, non-quantifiable costs and benefits areequally or more significant than what can be derived quantitatively, because subsistence income is so significantin the region, and the characteristics of Morovo lagoon life that defy quantifications, such as degrees of localcontrol, lifestyle and social atmosphere.’ (LaFranchi (1999) op. cit., pages 8 and 9.)
88 Independent Forest Review Team (2004). Towards Sustainable Timber Production – A Review of ExistingLogging Projects, Draft Observations and Recommendations Report op. cit., Volume 1, page 2. The fourthTerm of Reference requires the IRT to ‘Conduct an assessment of environmental, social and economic impact ofsix case study logging operations in terms of the allocated forest, the local population and forest resourceowners, and also at the wider regional and national level’. Op cit, Volume 1, page 3. (While the page numbersfor Volume 1 are sequential, in Volume 2 each Appendix starts with page 1. We have therefore referencedAppendix 8 (and other Appendices in Volume 2), as follows: Volume 2, Appendix 8, page reference as listed inthat Appendix.)
89 Ibid., Volume 1, page viii.

It argues that ‘If any one of the inputs listed above is absent, or deficient, then it would bedoubtful that the PNG forestry sector can be sustained in the long term’.90 No case is made for themerit of these “necessary inputs”. They do not have much relationship to reality. Completing thefull set of conditions is a test any forestry industry in any country of the world might fail, let alonein third world economies where poor governance is typical.
The “necessary inputs” also do not rate the economic contribution of forestry to the nationaleconomy or strategies to eradicate poverty and improve social indicators. Nor is there specificreference to underpinning development expenditure by the national or provincial governments.
Apart from the conceptual problem as to how each of the “necessary inputs” can be assessedin practice, it does not follow that failure of the industry to “pass” any or all of the IRT testsdemonstrates that the industry is not sustainable. Regulatory arrangements may well be ineffectivebut that does not demonstrate that the industry is operating unsustainably. Nor does it follow thatsustainability of the industry should be assessed in terms of the supply of skilled labour willing towork for the regulatory institutions.
The eight “necessary inputs” do not include the wider economic benefits that forestrygenerates. There is an accounting concept of depreciation, but it fails to include the economicbenefits flowing from forestry as a specific “necessary input”. This suggests a failure to analysethe government’s concern that the industry provide meaningful benefits to landowners. At least inthis sense, the report does not appear to have achieved one of its key objectives.
Apart from the way these “necessary inputs” have been defined and measured, there are someunderlying assumptions in the IRT reports that inform its approach and conclusions.Unfortunately, these assumptions are not spelt out explicitly. Some of the more importantunderlying assumptions are identified below.
Some unstated assumptions – bias revealed
Appendix 8 of the IRT draft report lists nine ‘indicators that, for the purpose of this work,constitute evidence of sustainable and beneficial socioeconomic impacts’.91 These include incomegeneration, roads and other infrastructure, health and education opportunities, improved accessto markets, investment in new ventures, new public facilities, improved training, data on timbercut and payments to landowners and governments, and opportunities for remote communities toinfluence decisions.
An implicit but unstated assumption behind these “indicators” is that public investment isvalued more highly than private investment. Indicator 6, for example, refers to ‘Investment of asignificant portion of logging returns in public facilities, under the partial direction of fairlyrepresented and credibly informed local populations’. Indicator 5 is ‘Investment of a significantportion of logging returns into alternative/new economic options’.92 In other words, value flowsfrom public investment rather than private investment.
There is nothing in the nine indicators to suggest that private sector investment is valuable inits own right – or that such investment generates direct and indirect economic and social benefits.Indicator 2, for example, seems to suggest that road infrastructure is only useful if it can ‘...clearlyfacilitate affordable and long term access to goods and services that were previously in shortsupply and that have direct connections to human welfare (e.g. professional healthcare, medicines,agricultural extension support, etc)’.93 Under this definition, private sector investment in roadinfrastructure that delivers short-term access to goods and services is dismissed as irrelevant.
Five sustainable outputs are listed as flowing from the inputs: a flow of forest benefits; flow ofbenefits to landowners; the flow of logs for processing or export; a logging industry; and employment.94
A P P E N D I C E S
32
90 Ibid., Volume 1, page 5.91 Ibid., Volume 2, pages 2 and 3.92 Ibid., Volume 2, page 3.93 Ibid., Volume 2, page 2. 94 Ibid., Volume 2, page 6.

No definitions of sustainability are offered for each of these outputs. The use of the term“sustainable” for the five outputs suggests that short-term benefits from logging are to bediscounted unless they can be sustained in the longer term. This is a novel concept in naturalresource economics.
The IRT report uses an unusual definition of economic welfare: ‘For the purposes of this work, it is generally assumed that welfare is in relation primarily to local landholders, andsecondarily to PNG nationals. Welfare is maximized when sustainable forest use and resultingeconomic development is delivered in the most cost-effective, expeditious and equitable fashion’.95 The source to justify the primacy of landholders over PNG nationals is not cited. Noris a definition of sustainability provided. Under this definition, the socio-economic benefits thatflow to PNG nationals from the forestry sector’s role in exports and underpinning governmentexpenditure are discounted.
An underlying assumption is that consumption spending by poor rural people engaging withthe market is less economically “valid” or “useful” than investment spending. Payments fromforestry companies direct to landholders are “wasted” on consumption goods.96 In other words,recipients of such payments do not know how to allocate income to maximise their own utility.Economic theory and practice demonstrate that the marginal propensity to consume is higher atlow income levels. This is, however, not the same thing as implying that such expenditure iseconomically less valuable than investment spending.
The IRT argues that ‘The incidence of poverty is linked to the ability to earn cash income andpay for non-food items, to vary and improve diets, and to permit savings for time of economichardship. Income that is insecure and delivered primarily over the short term cannot adequatelyprovide opportunities to alleviate poverty in the poorest and most remote locations’.97 In otherwords, income that is variable has little or no utility. This will come as news to those who receive it.
Unsubstantiated allegations of ‘...speculation, over-reporting of production costs and transferpricing...’,98 and that ‘...recent low FOB prices critically bring into question the production costsand FOB prices reported by logging companies in PNG’,99 suggest that the IRT report containsmore than an element of bias against foreign investment.
Key IRT conclusions
Appendix 8 of the IRT draft report is central to its conclusions. The attempt to estimate whetherlogging is profitable in PNG given what is known, or can be estimated, about the costsconfronting the industry is particularly important,. It is nevertheless conceded (in a footnote inVolume 2, rather than directly in Volume 1) that ‘This finding is based on an assessment(quantitative and non-quantitative) of average costs and benefits of logging presented in AppendixC and represents the conclusion of the resource economist as an analyst, given declared FOBprices and logging costs that have not been independently verified by a third party’ (italicsadded).100 In other words, advice from independent experts on FOB prices and logging costs hasnot been obtained.
It is argued that ‘...profitable logging operations are a necessary condition for sustained use offorest assets and equitable economic growth at the local level. It is possible for logging companiesto develop operations that are financially marginal or unfavourable during all but the bestconditions – especially when minimum harvest levels stated in project agreements are not
33
T H E E C O N O M I C I M P O R TA N C E O F T H E F O R E S T I N D U S T RY T O PA P U A N E W G U I N E A
95 Ibid., Volume 2, page 17, footnote 3.96 Ibid., Volume 1, page 40 contains the following observation: ‘The flow of royalty payments in most cases
resulted in an increased dependence on shop bought foods, especially rice, tinned fish and soft drinks. There islittle evidence of expenditure on improved housing for example’.
97 Ibid., Volume 1, page 63. 98 Ibid., Volume 2, page 1799 Ibid., Volume 2, footnote 5, page 17.100 Ibid., Footnote 9, Volume 2, Appendix 8 page 22.
enforced’.101 What is described as “speculation” ‘...makes landowner returns volatile and uncertain,conditions that undermine investment of logging returns that securely render lasting socioeconomicbenefits’.102
The logic is suspect. The author would seem to believe that if figures purporting todemonstrate that forestry activities are not profitable can be derived, then the continued operationof forestry activities is therefore both environmentally destructive and confers little or no benefitfor landholders – and is, moreover, prima facie evidence of transfer pricing.103
It is questionable whether such a proposition can be tested properly without the use of keydata from firms in the industry. Such data will almost certainly be commercially sensitive andhence would not be provided. The continued presence of forestry activities if it “fails” LaFranchi’s“test” does not demonstrate that the industry is, or is likely to be, operating unsustainably.104
The long-term test of the economic viability of an industry is whether firms are willing toinvest and suffer the consequences of failure. In the short term firms can (and do) run at a lossand cover those losses from retained earnings and/or borrowings.
The PNGFIA notes, ‘The industry is financially unsustainable because the government, including[the] previous government, chooses to make it so by not reviewing the forest revenue system. Whilethe theme of the report is sustained yield management, it needs to be recognized by all stakeholdersthat a sustainable harvest level does not result in a sustainable economic/commercial environment’.105
The PNGFIA disputes key elements in Appendix 8 of the IRT report. Specifically, it argues that:• wages paid to PNG nationals are not landholder benefits;106
• the ‘amount of projected returns for landowners and Government... (has) been grossly understated;107
• ‘The figures used for 5 out of 6 projects for total Royalties paid from 1997 to 2003 are thesame as the figures used for Annual Export Duty over the same period. Therefore the annual7 year averages and the totals for 7 years for Royalty do not compute. This is an obvious errorin the presentation of key data for the report’. Royalties and export duty paid by TuramaExtension are understated;108
• failure to properly discuss landowner companies means that ‘...the information gained for themain report was not sourced from the Social Economic and Financial Impacts Study’;109
• the different types of benefit provided under the various logging projects are not included;110 and
A P P E N D I C E S
34
101 Ibid., page 17.
102 Ibid.
103 Curtin believes that transfer pricing allegations in the industry in PNG constitute a misreading of the data. Heargues that the figures used by Barnett to support the evidence of transfer pricing were false ‘mainly because he(Barnett) failed (apart from a cursory mention) to allow for freight costs when comparing CIF log import pricesin Japan with FOB export prices in Papua New Guinea. Malaysian and Papua New Guinea log export pricestracked each other very closely in the 1980s and showed the same difference from Japan’s import prices. ...Duncan also found very little evidence to support Barnett’s claims of either transfer pricing or under-reporting ofvolumes exported prior to 1994.’ See Curtin, (2005) Forestry and Economic Development in Papua NewGuinea, footnote 10, page 8. This paper was based on a seminar for the Research School of Pacific and AsianStudies at the Australian National University on 28 October 2004.See http://archives.pireport.org/archive/2006/April/Forestry_development_PNG.pdf.
104 LaFranchi’s underlying approach is apparent from his footnote 5: ‘Such unfavourable terms would eventuallydrive all companies out of business. Consequently, recent low FOB prices critically bring into question theproduction costs and FOB prices reported by logging companies in PNG.’ Towards Sustainable TimberProduction – A Review of Existing Logging Projects (2004) Op. cit., Volume 2 page 17.
105 PNGFIA Submission. Draft Observations and Recommendations Report, May 2004 (2004). Volume 2, page 10.
106 Ibid., Response: Socio-Economic and Financial Impacts Report.
107 Ibid., page 1.
108 Ibid., pages 2, 3 and 4. (Some page numbers in the PNGFIA report may be confusing. We have numbered andquoted from pages numbered sequentially from page 1 on the response to the Socio-Economic and FinancialImpacts Report.)
109 Ibid., page 4.
110 Ibid., page 5. There is, for example, no reference in LaFranchi’s report to the payments made under the WawoiGuavi project, as cited in the case study presented in Chapter 5 of this report.

• ‘It is apparent that this report was compiled with little knowledge of individual forest projects,the forest industry or PNG generally, and no true substantiative knowledge was sought’.111
The methodology and use of data in Appendix 8 give rise to the question of whether the IRTauthors are only interested in proving what they believe to be true: that the forestry industry inPNG is unsustainable, cannot deliver growth and income, and should be closed down or sooverladen with regulations as to have the same effect.
IRT economics
Appendix 8 of the IRT draft report is essentially an accounting framework purporting to reachconclusions on economic issues: it presents data that might be relevant for an assessment of theaccounting viability of forestry companies’ operations. But this information is insufficient for anassessment of the economic costs and benefits for PNG flowing from the operations of the forestryindustry. This is most evident in the calculations of the financial viability of the industry.112
The report uses an accounting definition of depreciation: a sustainable logging operation is one‘...which is able to replace its equipment over seven years’.113 No source is offered to justify thisassumption. Whether this is common practice in the forestry industry in PNG, or whether PNGlaw requires such an accounting definition to be used, is not stated. Clearly, if capital equipmentover seven years old is still in use, it continues to deliver economic benefits.
The treatment of multiplier effects gives rise to serious questions regarding the authors’understanding of key economic concepts – which, in turn, are central to the main conclusions. Thetreatment of multipliers is dealt with first, which reflect the (Keynesian) argument that, in additionto the initial impact, spending has second, and subsequent, impacts.
Leakage of spending overseas limits the extent of the multiplier effect as such income cannotbe spent in PNG. The draft report has that right. But it goes further to argue that: ‘From the PNGnational perspective, benefits are created only when they impact Nationals or the companies andentities they control, own and operate. Multiplier effects are dampened to non-existent to theextent that goods and services procured with logging returns are imported or sold by foreign-owned and operated entities’.114
For the multiplier effects to be non-existent, all income earned from the forestry sector wouldneed to be remitted overseas. Taxes and royalty payments demonstrate that this is clearly not thecase. To the extent that previously unemployed, or underemployed, labour is used in the industry,the wages paid to that labour will add to local income and expenditure. The multiplier effectsfrom such spending are unlikely to be negligible. Such payments undermine the claim that themultiplier effects from the forestry industry are minimal or non-existent.
An implicit assumption is that forestry companies do not use retained profits to fund furtherinvestment. The only condition in which forestry companies are likely to act in this way would beif they perceived all, or a large portion of, PNG’s forestry resources to be off limits. While thereis certainly room for improvement in PNG’s forestry policy, there is no suggestion that thesituation has reached a point where companies are not prepared to invest in the industry.
For there to be minimal or non-existent multiplier effects, the initial investment would have toinvolve almost no use of products from local businesses – food, transport, materials, etc. Figureswere not available on the import content of the investment used in the forestry industry, butcapital goods are clearly imported. But to assume, as the report appears to have done, that all goodsfor the initial investment in the forestry industry were imported, flies in the face of observed fact.
The IRT argues that ‘The value of infrastructure provided by the logging companies is
35
T H E E C O N O M I C I M P O R TA N C E O F T H E F O R E S T I N D U S T RY T O PA P U A N E W G U I N E A
111 Independent Forest Review Team. (2004). Towards Sustainable Timber Production – A Review of ExistingLogging Projects, Draft Observations and Recommendations Report, op. cit., page 5.
112 See especially Tables 5-8, Volume 2, pages 13-15. 113 Ibid., Volume 2, Appendix 8, page 9.114 Ibid., Volume 2, Appendix 8, page 2.

diminished due to the lack of public investment, consequently reducing the potential forsignificant multiplier effects’.115 The assumption underpinning this claim is presumably that, bynot using revenue from forestry investments, the national and provincial governments areneglecting their constituents’ interests. It would obviously be better if governments maintained theinfrastructure, where it made economic and social sense to do to. To the extent that suchmaintenance expenditure drew on previously unused labour, the multiplier effects would begreater than they would otherwise have been. The underlying premise is wrong: not maintaininginfrastructure investment does not reduce the multiplier effects from the initial investment. Itmeans that the wider socio-economic benefits from infrastructure investment by the forestryindustry are not being capitalised on for the wider benefit of PNG. But that is a separate point,and not the fault of the forestry industry.
Whether the figures quoted by ACIL Tasman based on Fijiian experiences are likely to be abroad approximation of what might prevail in the PNG forestry sector (see page 21) is beyondthe scope of this report.
Evidence and conclusions
Volume 1 of the IRT draft report presents conclusions allegedly based on evidence presented inAppendix 8. But the supporting evidence is not sufficient to warrant the key conclusions. Anexample is the claim that: ‘Benefits to landowners from logging generally last less than five years,and are too small to result in any (italics added) long term improvements in socio-economicwelfare, especially given the paucity of public services to augment or multiply their impact’.116
Nor is credible evidence presented to prove the assertion that ‘...logging projects are almostcertainly a net cost to Provincial Governments’.117 The evidence from our case study on theWestern Province supports exactly the opposite conclusion: the forestry industry is not onlygenerating a significant proportion of the revenue for the Western Province government to spendon infrastructure and social investments, but its own spending on infrastructure, health andeducation services is much more significant than comparable spending by the government.
The conclusions that little of the ‘...FOB income captured by PNG accrues to the centralgovernment...’ and ‘Little is reinvested in either community development or forestmanagement...’118 are not supported by the evidence presented in Appendix 8. This suggests eithera misunderstanding of, or neglect of, the fiscal facts of PNG life: the forestry industry enables a veryconsiderable amount of social and infrastructure spending by the national and provincial governments.
It is argued that the depreciation of the Kina has undermined the benefits to PNG from theforestry industry. PNG has no option but to adjust to fluctuating commodity prices. Changingcommodity prices do not undermine the contribution of the industry to PNG. They suggest,rather, that policies need to be in place to effectively and fairly facilitate that adjustment.
A major theme in the IRT draft report is that if infrastructure and social spending associatedwith the industry are not of a long-term nature, then somehow those benefits are to be discounted.This reflects the view, noted above, that consumption spending should be regarded as secondaryto investment spending. It is argued that ‘...livelihood and food security is enhanced by thepayments, but usually only for the period during which logging is active in a given area’,119 and‘Funds that reach local communities, especially the poorest and most remotely located, aremanaged and distributed inefficiently and non-transparently, and are primarily used forconsumption rather than investment’.120
It is equally wrong to discount the socio-economic impact of infrastructure and social
A P P E N D I C E S
36
115 Ibid., Volume 1, page 63.116 Ibid., Volume 1, page 62. 117 Ibid.118 Ibid., Volume 1, page 62.119 Ibid., Volume 1, page 63. 120 Ibid.

expenditure, just because it is not long-lasting, as it is to regard consumption spending as of lessereconomic value than investment spending.
It is argued that: ‘...relatively few opportunities are being created for PNG workers to acquireprofessional level training as a result of logging projects’.121 No evidence is offered. Figures are notavailable for the aggregate spending on training from the forestry industry122 but the use of theword “relatively” is instructive. No matter how much the industry spent on training, it would becriticised as being insufficient by those who are opposed to the industry.
The fact is that unskilled workers are acquiring skills in the logging industry, especially in theWawoi Guavi project. To discount the training opportunities that can, and do, deliver higherwages to more skilled workers is to deny reality.
Unsupportable conclusion on costs and benefits
The overall assessment of the costs and benefits of the industry are not supported by the evidence.Consider the following from the draft report:
‘The true economic impact at the national level is substantially less than the benefits identifiedabove (italics added), in real terms, after the forestry sector costs borne by central Governmentare subtracted. This includes:• K28 million per annum required to pay for the PNGFA, a portion of Department of Environment
Conservation (DEC), and the independent log export-monitoring contract. It is anticipatedthat this figure would need to rise if sustainable timber production is to be achieved; and
• the draw down on the value of the national forest asset that is not being compensated for byreinvestment in forest management, or alternative sources of wood such as forestry plantations’.123
A substantive economic analysis would be required to justify such a strong conclusion. It hasnot been done. There is no evidence to justify this assertion. The phrase “in real terms” wouldnormally imply that the author has corrected estimates for price changes but there is nothing tosuggest that this has been done.
The first dot point gives rise to the question of how sustainability is to be assessed in the PNGforestry industry. There is an active debate in the academic literature on this point – for examplethe work by Curtin and Filer cited in this report. The IRT has not presented a convincing case forits conclusion that ‘Unsustainable harvesting of the natural forest estate finances about 5 percentof the central government budget’.124
Reaching such a conclusion would have required a much more detailed economic analysis than isevident in the IRT draft report. The methodology reflects accounting, rather than economic, concepts.Conclusions are offered that are not justified by the evidence. The IRT report lacks economic credibility.It should not be allowed to influence government policy towards such an important industry.
III. Case study on impacts in the Western Province
The socio-economic importance of the Wawoi Guavi project in the Western Province of PNG canonly be assessed in relation to existent conditions in that province. Expenditure on health,education and transport by the Western Province Government is the basis for an assessment of thesocio-economic significance of the Wawoi Guavi project.125 Income levels are low, infrastructureis underdeveloped, and there are major challenges in meeting health and education needs. Only
37
T H E E C O N O M I C I M P O R TA N C E O F T H E F O R E S T I N D U S T RY T O PA P U A N E W G U I N E A
121 Ibid.122 Rimbunan Hijau has, however, provided information to ITS Global on chainsaw training for 237 participants in
its chainsaw training program for 2005.123 Independent Forest Review Team. (2004). Towards Sustainable Timber Production – A Review of Existing
Logging Projects, Draft Observations and Recommendations Report Volume 1, page 65.124 Ibid.125 Direct spending on health, education and transport by the national government have not been included in this
case study. Whether the amounts allocated in the budget to specific projects and programs were fully or partiallyspent on those projects is beyond the scope of this case study. The figures quoted are therefore maximumamounts. Actual amounts spent could be lower.

22 percent of children attend school.126 The Provincial Development Plan for the Fly RiverProvincial Government (Western Province) reflects concern about what might replace miningwhen it scales down. Forestry is regarded as a key resource.
Western Province Government
Key features of conditions in the Western Province are set out in the long-term Development Planfor the region:• land potential is ‘low to moderate in all areas of the province’;• ‘Social and economic development in the province in the areas of mining, forestry, fisheries and
agriculture sectors, and the manner in which current political and administrative functionsperform, will contribute significantly to the province’. The emphasis is ‘directed towardsincreasing the number of people participating in one of more forms of economic activities’.‘Large scale projects (for reasons of economy of scale) should take higher priority to promotevaluable taxation regimes after mine closure’;127
• the importance of roads in forest development areas are ‘...not played down’;128
• only 24 percent of males and 22 percent of females over the age of 5 are currently attending school;129
• income levels (which do not include royalty payments and wage employment) in and aroundWipim are very low;130 and
• 9 percent of males in the rural sector are in paid employment.131
The Western Province 2006 budget indicates that resources for spending on infrastructure,education and health are seriously constrained:• the recurrent and development budget appropriations from the national government comprise:
Unconditional Grants, K34.5 million; Conditional Grants, K1.2 million; Local Level Government(LLG) Grants, K1.2 million; and Conditional Development Grants, K11 million;132
• with Tax Credit Scheme funding of K25 million and Equity Grant funding of K30 million, ‘...apotential K69.8 million would be available in 2006 for development purposes’;133
• K8 million is allocated to fund seven Selected Key Projects, which includes four road projectsbut the allocations to each are not specified;134
• ‘K2 million is appropriated as Special Support Grant to the Fly River Development Trust’;135
• in recognition of the importance of forestry activities, Governor Danaya noted in his budgetspeech that the: ‘Project Fund Committee for the Wawoi Guavi Timber Company hasapproved the construction of a new health centre at Kamusie. The project will be constructedin early 2006. A service centre at Kamusi is also in the pipeline, to be implemented in 2006.The Western Provincial Administration is now working closely with this developer to furtherdevelop six projects for the landowner companies. This kind of working relationship isparamount in our collective efforts to develop key social and physical infrastructure provisionsso that goods and services are delivered to our people in the LLG areas’;136 and
• the 2006 budget allocates K8 million to four highway/road projects but does not provide adetailed breakdown by project.137
A P P E N D I C E S
38
126 Western Province 2010, the Provincial Development Plan of the Fly River Provincial Government for the PlanPeriod 2006-2010, page 17.
127 Ibid., pages 24, 46 and 52 respectively. 128 Ibid., page 54.129 Ibid., page 14.130 Ibid., page 16.131 Ibid., page 22. 132 Ibid., page 78.133 Ibid.134 Ibid., page 83.135 Ibid., page 82.136 Ibid., page 85. 137 Ibid., page 83.

Benefits to landholders
Landholders in the Western Province receive significant benefits from forestry, and they recognisethis. This is reported in a study by Groome Poyry which was prepared for the PNGFIA and theWorld Bank in 1998. The purpose of the report was to ‘...provide the PNG Forest Authority withan independent appraisal of the Landowner Benefits, that have already been delivered by loggingcompanies, or are being regularly delivered, and the fair and reasonable cost of delivery, as the basisfor PDL (Project Development Levy) credit assessments’.138 This document is important as it providesindependent verification on expenditure by the logging industry. Key points made in this report are:• ‘Of the 49 logging projects subjected to a full Landowner Benefit Audit and PDL credit
assessment, 30 had delivered infrastructure which qualified as a PDL credit, 6 were notrequired to delivery any infrastructure (either none was specified in the legal documents, or theresponsibility for delivery remained with the Landowner company), and 13 were required todeliver infrastructure but had not done so’;139
• ‘The total fair and reasonable cost of delivery is assessed to be K43 million’, made up of:airstrips, K0.6 million; bridges and culverts, K5 million; buildings, K3.2 million; public roads,K0.6 million; urban development, K5.3 million; village roads, K0.1 million; and forestryplantations, K28.1 million;140
• the total value of infrastructure and resulting PDL credit is assessed as K45.23 million;141 and• Landowner Financial Benefits from Wawoi Guavi were K23 million.142
Expenditure by Rimbunan Hijau on the Wawoi Guavi project
ITS Global sought and obtained a considerable amount of data and information from RimbunanHijau on its Wawoi Guavi project. Two ITS Global staff members visited the Wawoi Guavi project and other projects operated by Rimbunan Hijau in the Western Province. The visitinformed both this case study and the wider conclusions reached on the economic importance ofthe forestry industry to PNG.143
Some of the data was provided to ITS Global on a commercial-in-confidence basis. This datahas been drawn on in reaching key conclusions. It is believed that none of the data provided on acommercial-in-confidence basis invalidates or undermines the conclusions. Indeed, requests forclarification on data and background information to enable assessment of the data provided havebeen acted on quickly and effectively by Rimbunan Hijau. It is believed that the data provided in thisreport, much of which comes from Rimbunan’s Hijau’s audited financial reports, is at least theequal of official macroeconomic data used. It is almost certainly more reliable and comprehensivethan official Western Province data. It is not believed that the conclusions in this case study canlegitimately be questioned on the grounds of the data being provided by Rimbunan Hijau.
Rimbunan Hijau was asked to provide information over time to enable the provision of morethan a “snap shot” assessment. The information presented in tables 5, 6 and 7 has not beenreleased publicly before.
Table 5 presents key data on the Wawoi Guavi project between 1993 and 2005. The WawoiGuavi project involves three companies: Wawoi Guavi Timber Company Ltd, which undertakeslogging and sawmilling (and which employs 900 people); Rimbunan Hijau Timber Processing
39
T H E E C O N O M I C I M P O R TA N C E O F T H E F O R E S T I N D U S T RY T O PA P U A N E W G U I N E A
138 Groome Poyry Ltd (1998). Audit of Landowner Benefits Received from Harvesting Operations under TimberPermit, Final Report, Volume 1, April 1998, page 2. The Project Development Levy was imposed in 1996 andapplies to all existing log export projects, but ‘...logging company expenditure on Landowner Benefits inaccordance with the legal documents governing the project will qualify as a credit against the liability to pay PDL.Clearly the credit needs to be limited to reflect the payments and/or expenditure actually made’. Op. cit., page 1.
139 Ibid., page 21.140 Ibid., page 33.141 Ibid., Table 1, page 34. Note, however, that this is not the value of total infrastructure investment on the
projects covered by the audit. It is the total value of infrastructure that qualified for PDL credit.142 Ibid., Table 2, page 37.143 The Wawoi Guavi project

Company Ltd, which undertakes veneer processing (and which employs 600 people, in additionto 300 contract workers employed through contract work to Wavoi Guavi Timber Company Ltd):and Strait Marine Ltd, which provides shipping services.
With the exception of the figures on infrastructure, all of the data in Table 5 is from RimbunanHijau’s audited financial accounts and therefore accurately measures amounts spent each year.145
The infrastructure figures are estimates. They are the minimum amounts spent in each year oninfrastructure. They do not include the costs of materials or services which are available onsite,such as sawn timber, bulldozer hours, fuel, man-hours, food provided for the workers whoconstruct the infrastructure, etc. Such costs are accounted for as general operational costs. Theinfrastructure figures therefore substantially underestimate actual expenditure.
Key points from Table 5 are:• national wages paid have grown very substantially, from K1.03 million in 1993 to K7.15
million in 2005;• export duty (K147.11 million) comprises 55.4 percent of the total contribution to GDP from
the project. It is not credible to argue that the project is not making a major contribution to GDP;• royalty and wages paid to nationals together comprise K80.1 million between 1993 and 2005
– or around 30 percent of total project contributions to GDP. Local people and landownersare receiving very substantial benefits from the project – a point that they clearly understand;
• infrastructure investment has been at least K2.95 million since 1993; and• the figures for any one year are a very close approximation to the contribution from the project
to GDP. This contribution had been rising steadily since 1993 and represented around K2.6million in 2005 – compared with Unconditional Grants to the Western Government in the2006 national budget of K34.47 million. The total contribution to GDP since 1993 wouldhave been around K265 million.
A P P E N D I C E S
40
1993 1994 1995 1996 1997 1998 1999 2000 2001 2002 2003 2004 2005 Total
1.03 1.69 1.3 1.39 1.17 1.88 2.93 3.99 4.64 5.48 6.68 6.86 7.15 46.19
0.26 0.27 0.46 0.39 0.32 0.87 1.27 1.72 1.88 2.26 2.98 3.03 2.55 18.26
0.52 0.5 0.64 0.82 0.82 0.81 1.18 1.09 1.33 1.9 2.03 2.9 2.56 17.1
1.09 1.14 0.89 2.3 3.67 2.13 2.74 2.77 3.06 4.33 3.32 3.51 2.96 33.91
8.42 14.54 14.46 17.36 17.93 5.93 9.18 10.81 5.82 12.42 9.44 8.93 12.03 147.27
0.38 0.41 0.09 0.16 0.12 0.13 0.22 0.17 0.18 0.05 0.54 0.15 0.35 2.95
11.7 18.55 17.84 22.42 22.03 11.75 17.52 20.55 16.91 26.44 24.99 25.38 27.6 265.68
Source: ITS Global, based on information provided by Rimbunan Hijau (rounded)144
TOTAL
INFRASTRUCTURE
EXPORT DUTY
ROYALTY
PREMIUMS & LEVIES PAID
SALARY AND TAXES EXPATRIATE/NATIONALS
NATIONAL WAGES PAID
YEAR
144 Rimbunan Hijau has advised that the Wawoi Guavi project has paid taxes of K11.7 million. Total taxes paid bythe Group amount to K30 million.
145 ITS Global met with the PNGFA and sought data which we were advised it could provide to incorporate in thiscase study. This data was not forthcoming.
Table 5: Wawoi Guavi project: Key data: 1993-2005: Kina, million

The PNG Forest Authority’s Wawoi Guavi review indicated the following additional payments:• annual ex gratia payments to Waterways Landowners, K120,000;• reforestation levy of K1/m3 of logs harvested; • land lease payment for land at Panakawa, K12,600 per annum;• land lease for Panakawa airstrip, K3,000 per annum; and• land lease at Kamusie, K2,600 per annum.146
Expenditure on physical and soft infrastructure
Information relating to capital investment for the airstrip and wharf, as well as spending onhealth, education and roads was sought. Details provided by Rimbunan Hijau of its expenditureare set out below. Table 6 sets out payments for the airstrip and health and education. Table 7provides details of road expenditure. All of the expenditure was incurred between 1992 and 2004.
Based on the information in the Western Province 2006 budget, spending by Rimbunan Hijauon education and medical facilities has been very substantial, compared with spending on thesecategories over the same period by the Western Province government. For example, in the WesternProvince for 2006, the District Health Improvement Program was K0.3 million. Clearly, the twosets of figures are not directly comparable: one is a stock, the other a flow.
Health spending by Rimbunan Hijau of K0.23 million (which does not include the costs ofmedical staff at Wawoi Guavi) constitutes a very substantial proportion of health spending by theWestern Province government. Based on the size of the Western Province government’s healthbudget, it is inconceivable that these health services could be provided by the Western Provincegovernment in the absence of Rimbunan Hijau. And it is highly unlikely that they would havebeen provided by the national government.
Obviously the airstrips, wharf and roads are constructed primarily for the purposes of theproject. These facilities are, however, available for local people, who clearly use and value them.
The key message from Table 7 is that road investments for community purposes constitute asignificant proportion of the K92.9 million in road investments by Rimbunan Hijau between1992-2004 (the stock investment). In terms of government expenditure, K1.2 million wasallocated to the Western Province District Road Improvement Program in 2006.
Three issues inform drawing conclusions from this data. First, the investment by RimbunanHijau is for roads for its operational purposes. Second, figures over a 12-year period cannot becompared with figures for 2006. Third, investments in roads by the Western Province Governmentare, presumably, done with the objective of maximising welfare for its population, whereas theprimary purpose of the road investments by Rimbunan Hijau is for logging. But landownersclearly value these logging roads. They use them to access health and education services and fordeveloping closer links with the market. It would be wrong to argue that the roads do not generateany wider socio-economic benefits, just as it would be wrong to claim that all of this investmentin logging roads solely benefits Rimbunan Hijau.
There would appear not to be any credible estimates as to how these benefits might beattributed. Based on the evidence reviewed for this report, and particularly the views of
41
T H E E C O N O M I C I M P O R TA N C E O F T H E F O R E S T I N D U S T RY T O PA P U A N E W G U I N E A
146 Groome Poyry Ltd (1998) op. cit., page 2.
Table 6: Wawoi Guavi: Spending on airstrip, wharf, health, education and general infrastructure:1992-2004, K million
Medical facilities 0.23 Wharf 1.9
Education facilities 1.11 General infrastructure 2.54
Airstrip(s) 2.16 Total 7.94
Source: PNG Forest Industries Association, at http://www.fiapng.com/export_stats_1997_2002.pdf

landowners (who clearly value the construction of logging roads and want provincial governmentsto maintain them after logging has ceased), the only reasonable conclusion is that these roadsgenerate evident but unquantifiable benefits for local people.
Landholders also value the air service established by Rimbunan Hijau, Tropic Air Ltd. Table 8provides information on the usage of the service to Wawoi Guavi in March 2006.
Only one-third of the passengers carried were employees of the company. The rest werelandowners and outsiders. Rimbunan Hijau has advised that while it cannot provide data on theuse of this service for freight and fuel, it believes that the proportions are similar. In other words,
A P P E N D I C E S
42
PROJECT QUANTITY ESTIMATED YEAR RECIPIENT(km) COST (Kina) DELIVERED
Road, Main 149.4 5,976,000 1997 Community
Road, Main 84.2 3,366,000 1998 Community
Road, Main 101.6 4,062,000 1999 Community
Road, Main 80.6 3,222,000 2000 Community
Road, Main 425.0 17,000,000 1992-96 Community
Road, Main 180.2 7,127,000 2001 Community
Road, Main 218.8 8,750,000 2003 Community
Road, Main 119.4 4,776,000 2004 Community
Road, Secondary 65.9 1,779,000 1997 Community
Road, Secondary 23.4 630,000 1998 Community
Road, Secondary 149.7 4,042,000 1998 Community
Road, Secondary 26.4 713,000 1999 Community
Road, Secondary 22.6 610,000 2000 Community
Road, Secondary 447.0 12,069,000 1992-96 Community
Road, Secondary 36.4 983,000 2001 Community
Road, Secondary 36.4 2,622,000 2003 Community
Road, Secondary 48.0 983,000 2004 Community
Road, Provincial/Village 5.3 249,000 1997 Villages
Road, Provincial/Village 5.3 249,000 1998 Block 1A, Parieme Village to New Airstrip
Road, Provincial/Village 14.2 667,000 2000 To Kapolasi
Road, Provincial/Village 10.0 470,000 1992-96 Parieme to Sipoi Village
Road, Provincial/Village 95.0 7,315,000 2001 To Kapolasi
Road, Provincial/Village 2.2 101,000 2001 Kamusie Proper to Govt. Station
Road, Provincial/Village 37.0 1,739,000 2002 Provincial Boundary of Gulf Province
Road, Provincial/Village 2.4 113,000 2002 Kasigi (Wawoi Falls)
Road, Provincial/Village 1.0 47,000 2002 Kamusie Community
Road, Provincial/Village 2.4 113,000 2003 All Villages
Total Cost 92,877,000
Source: Rimbunan Hijau
Table 7: Value of roads constructed at the Wawoi Guavi project

of the K2.16 million invested by Rimbunan Hijau for the airstrip, around two thirds of thebenefits accrue to local people using this service.
Comparing expenditure by RH and the Provincial Government
Annual average total expenditure by Rimbunan Hijau at the Wawoi Guavi project is around K20million.147 Annual average expenditure on infrastructure is around K0.23 million. For the reasonsset out above, this figure does not include all costs. Rimbunan Hijau estimates that actual expenditurewould be two to three times higher than this – between K0.46 million and K0.69 million per year.
Total appropriations by the Western Province government in its 2006 budget were K36.9million.148 The budget papers do not indicate how much of this money might actually be spent inthe region in which the Wawoi Guavi project is located. Nor is it clear whether all or part of thefunds allocated to projects or regions are spent. All of the expenditure undertaken by RimbunanHijau has been spent and audited. Whether the same confidence can be applied to the WesternProvince budget allocations is beyond the scope of this report. Whatever confidence is attached tospending against allocations, not all of the money in the budget against particular categories ofexpenditure will be spent in the South Fly District. The budget papers do not indicate how muchis spent in each district. If this money is spent roughly equally between the three districts, theSouth Fly District might get around K12 million per annum.
It is therefore likely that the annual average spending by Rimbunan Hijau of around K21million is nearly double the amount spent in the region by the Western Province Government.
Health expenditure is an interesting case study. The 2006 Western Province governmentbudget allocates K100,000 for health improvements and maintenance in the South Fly District for2006.149 Yet, as indicated in Table 6, Rimbunan Hijau spent K230,000 between 1992 and 2004 –or an average of around K19,000 per year. As this figure does not include the cost of a doctor atthe Panakawa and Kamusie sites, health spending by Rimbunan Hijau at Wawoi Guavi could haveamounted to almost half of the comparable spending in that area by the Western ProvinceGovernment.150
43
T H E E C O N O M I C I M P O R TA N C E O F T H E F O R E S T I N D U S T RY T O PA P U A N E W G U I N E A
147 This figure is derived by dividing the total expenditure of K275.9 million in Table 5 by 13 to obtain an annualaverage figure.
148 Western Province 2010, the Provincial Development Plan of the Fly River Provincial Government for the PlanPeriod 2006-2010 op.cit., page 78.
149 Ibid., Schedule 4, page 71.150 The Budget specifically acknowledges the critical significance of the health facilities at the Wavoi Guavi project:
‘... (the) Project Fund Committee for the Wawoi Guavi Timber Company has approved the construction of anew health centre at Kamusie. This project will be constructed in early 2006. A service centre for Kamusie is alsoin the pipeline to be implemented in 2006. The Western Provincial Administration is now working closely withthe developer to further develop six projects for the land owner companies. This kind of working relationship isparamount in our collective efforts to develop key social and physical infrastructure provisions so that goodsand services are delivered to our people in the LLG (Local Level Governments) areas’. Ibid., page 85.
Table 8: Use of Wawoi Guavi Airstrip: March 2006
Tropic Air Ltd. Summary of WGTC March 2006 passengers & charters
Passengers WGTC Others Total Share of total passengers
employees 52 123 175 35%
landowners 79 107 186 37%
external/others 2 136 138 28%
133 366 499
Charters
internal 1 6 7 64%
external 0 4 4 36%
Source: Rimbunan Hijau

The Western Province 2006 budget contains details on proposed major road maintenanceappropriations totalling K6.3 million.151 Table 7 indicates that Rimbunan Hijau spent a total ofK92.9 million on roads between 1992 and 2004 – or an average of K16 million per year. In otherwords, spending on roads by Rimbunan Hijau is likely to have been around 2.5 times the totalroad spending by the Western Province Government.
In summary
In 2006, the Western Provincial Government’s expenditure on infrastructure and services in theFly River District was around K12 million. Expenditure on similar items by Rimbunan Hijau(PNG) Group was K16.25 million. Those were direct expenditures.
Total expenditure by the Provincial Government in the Fly River District was K12 million.Total expenditure by Rimbunan Hijau (PNG) Group was K21 million. The economic welfareimpact of these expenditures, if the multipliers used to assess the PNG Gas Pipeline project areapplied, suggest that the economic impact of this spending is likely to be more than double thisamount.
Some broad conclusions
The information presented above is the first time (as far as is known) that an assessment of theregional socio-economic impact of a major forestry project, such as Wawoi Guavi, has beenundertaken in this way. Notwithstanding the caveats noted above about the quality of the officialdata, it demonstrates some interesting points:• the transport infrastructure (roads, wharf and airstrip) represents a very substantial
investment. The figures for the value of these investments are not directly comparable withfigures on similar investments by the Western Province Government. However, it is clear fromthe Western Province 2006 budget that government spending on similar transportinfrastructure in the region of the Wawoi Guavi project is a minute proportion of theinvestment by Rimbunan Hijau;
• figures are not available on the usage of the logging roads by local people, but anecdotalevidence suggests that these roads are used quite extensively and are valued highly;
• figures on the usage of the airstrip and the air service to Wawoi Guavi demonstrate that theexternal benefits of this service are very important for local people; and
• health and education infrastructure and services at Wawoi Guavi is very significant for localpeople. If those services were not provided by Rimbunan Hijau the size of the WesternProvince budget strongly suggests that they would not be provided at all.
IV. Potential revenue implications of non-optimal sustainable forestry production
In principle, the more value adding that occurs using PNG’s forestry resources (for example, byprocessing raw logs as at Wawoi Guavi), the greater the contribution the forestry sector is likelyto make to growth, government revenue, income, landowner benefits and employment. Whethersuch outcomes are achieved in practice will depend on a range of factors. Key among these arethe underlying economics of value adding (including access to and prices paid for logs, labourcosts and reliability, infrastructure costs and their efficiency, taxation arrangements, policypredictability and export prospects) and the sustainable use of forestry resources. The WorldTrade Organization (WTO), for example, concludes that ‘Downstream processing of timber is notgenerally economically viable in PNG.’152
It is beyond the scope of this report to provide a definitive analysis of the prospects for andchallenges facing further value adding in PNG. Nevertheless, an examination was conducted as towhether anything could be inferred from publicly-available information and data on the Wavoi
A P P E N D I C E S
44
151 Ibid., Schedule 2, page 70.152 World Trade Organization, Trade Policy Review, WT/TPR/S/62, para 65.

Guavi project provided to us by Rimbunan Hijau. There was interest in determining whether itwould be possible to make some credible estimates as to how much PNG might stand to gain ifthe Wavoi Guavi value adding experience was replicated. Put in another way, how much mightPNG be “losing” by not moving up the value added chain?
Estimating the value added at Wawoi Guavi and using that as a basis to estimate what PNGmight stand to gain from replicating that experience elsewhere in PNG involves both data andmethodological considerations. Even if data of sufficient quality was available, transposing theexperience from Wavoi Guavi to other regions with different physical, social and infrastructureconditions raises some major methodological issues beyond the scope of this report. As data ofsufficient quality to undertake this task is not available, such estimates have not been made.
Credible estimates can, however, be made as to how much PNG might be losing from notmaximising the sustainable use of its forestry endowment. This can be done by applying currentexport prices to the difference between actual forestry output and the output that could beharvested sustainably from PNG’s natural forests.
The ITTO, the most credible international organisation on forestry issues along with FAO,provides an estimate of sustainable forestry production in PNG. In its 2004 report on PNG, theITTO observes that ‘Of the annual sustainable production of 3.3 million m3, plantation woodcomprises approximately 5%’.153 Deducting 5 percent for plantation forestry from 3.3 million m3
suggests that in 2004 the sustainable production from native forest was 3.135 m3.
Is there any corroboration for this figure? If PNG’s natural forests had been cut at anunsustainable rate over many years, the extent of natural forest cover should have declinedsubstantially. FAO figures demonstrate that this has not happened. Table 9 presents FAO figureson the total area of forests (excluding plantations) in PNG.154 The figure for 2005 is a projection.
Table 9 demonstrates that the area under forest (excluding plantations) in PNG has beenrelatively stable since 1990. There has been some reduction (a little over 2 million hectares, oraround 6.7 percent of 1990 levels). But this is not the sort of reduction that would be consistent withGreen NGO rhetoric. FAO figures (compiled on a slightly different basis) demonstrate that forestcover was 33.67 million hectares in 1975.155 PNG’s forest cover has therefore been comparativelystable the past 30 years.156 This suggests that the ITTO estimate is consistent with historical data.
Is PNG’s sustainable forestry production from natural forests being utilised to the full?
Round log exports in 2004, the last year for which PNGFIA figures are available, were 2.012million m3. Of this amount, 0.25 million m3 were plantation round logs.157 Processed plantation
45
T H E E C O N O M I C I M P O R TA N C E O F T H E F O R E S T I N D U S T RY T O PA P U A N E W G U I N E A
153 In the International Tropical Timber Organization, Annual Review and Assessment of the World TimberSituation, 2004, (page 7), it is noted that ‘As PNG’s third largest sector, the forestry industry under the guidanceof the NFA is exploring ways to branch out from a log producing sector to a wood processing sector...Proposals which provide incentives to investors are being planned to attract wood processing companies.’ TheITTO notes a worrying constraint: ‘Donor funded projects often insist that all timber products used in projectinfrastructure meet the donor’s respective building code specifications. This has often required the import oftimber products for use in project infrastructure to the detriment of PNG producers’.
154 FAO, Global Forest Resources Assessment 2005, Papua New Guinea, Country Report, page 12.155 Ibid., page 11. 156 The FAO figures do not necessarily imply that the nature of PNG’s forests have been static since 1975. 157 PNG Forest Industries Association (2004). Key Indicators 1992-2004, at http://www.fiapng.com
Table 9: Total area of forest (excluding plantations)
Millions of hectares
1990 2000 2005
31.46 30.05 29.35
Source: ITS Global, adapted from FAO “Global Forest Resources Assessment 2005, Papua New Guinea, CountryReport 097”, page 12. Figures are rounded and presented in millions of hectares rather than in hundreds of thousandsof hectares as in the FAO report.

exports would likely have been around 85.5 m3 in 2004.158 As demonstrated in the calculations setout in the immediately preceding footnote, total processed exports in 2004 were likely to havebeen around 162,714 m3.
To determine how many round logs were required to generate total processed exports of162,714 m3 the rate at which round logs are converted to sawn timber and veneer needed to beknown. Rimbunan Hijau has advised that 1 m3 of sawn timber requires around 2.5 m3 of round logs (the round wood equivalent). Applying a round wood equivalent rate of 2.5 to162,714 m3 of processed exports from natural forests (i.e., 162,714 multiplied by 2.5) suggeststhat the volume of processed timber from natural forests in 2004 would have been around406,785 m3.
Total round log exports in 2004 were 2,012,135 m3. Total round log exports from plantationsin 2004 were 247,214 m3.159 Deducting 247,214 m3 from 2,012,135 m3 suggests that total roundlog exports from natural forests in 2004 were 1,764,921 m3.
To obtain an estimate of how much of PNG’s sustainable forestry production has been used,an estimate of total round log volumes from natural forests was needed. Total round log exportvolumes from natural forests in 2004 can be obtained by adding 406,785 m3 (the round wood equivalent volume of exports of processed products from native forests for 2004) to1,764,921 m3 (total round log exports from natural forests in 2004). The total round log exportvolume from natural forests in 2004 was therefore 2,171,606 m3. This figure represents the totalcommercial volume of timber harvested (for round logs and processing) from natural forests in 2004.
Total annual sustainable production from natural forests was estimated by the ITTO to be3,135,000 m3 in 2004. The volume actually harvested from natural forests would, according tothe above calculations, have been 2,171,706 m3 in 2004. The “loss” to PNG from not using tothe full its sustainable annual cut is therefore around 963,295 m3.
This means that an additional volume of around 963,000 m3 could have been harvested in2004 without compromising the sustainability of natural forests. In other words, around 30percent of what could have been sustainably harvested in 2004 has been foregone. This would bea very significant loss for a country that was not confronting severe economic and socialchallenges. For PNG such a loss is even more serious. Foregone forestry exports of around 30percent in 2004 had undoubtedly resulted in lower levels of exports, employment, landownerbenefits and government revenue than otherwise achievable.
Assuming the average FOB price for round logs in 2004 was $US60 per m3, foregone exportsin 2004 can be estimated by multiplying 963,295 by US$60. This suggests that almost $US58million was foregone in export earnings in 2004.
The PNG government captures 34.13 percent of forest exports via export duty. 34.13 percentof US$58 million suggests that government revenue in 2004 was almost US$20 million less thanwhat it could have been if the full sustainable production potential of PNG’s natural forestryresources had been used.
There is another way of assessing the potential significance of this loss. As reported in Chapter 3,the World Bank has estimated that in 1998 the forestry industry generated government revenue
A P P E N D I C E S
46
158 PNG Forest Industries Association figures for processed exports were 165,471 m3 in the year to August 2004.(See http://www.fiapng.com, Key Indicators 1992-2004 and Processed Exports By Species 2004.) On a pro ratabasis exports of processed timber would have been around 248,206 m3 for the full year. The PNGFIA figuresidentify processed exports by species. Export categories for balsawood, plantation, teak and wood chipsamounted to 56,995 m3 between January and August 2004. These species come exclusively from plantations. Soplantation processed exports should have amounted to around 85.49 m3 on a pro rata basis for the full year.Deducting 85,492 m3 of plantation species exports from 248,206 m3 of processed exports in 2004 gives a figureof around 162,714 m3 in total processed exports from natural forests in 2004.
159 PNG Forest Industries Association, op. cit., Key Indicators 1992-2004.

and landowner benefits of around US$100 million. If the 30 percent “loss” in sustainableharvesting potential was approximately the same in 1998 as in 2004, and the basic relationshipsused in the calculations set out above also applied in 1998,160 government revenue and landownerbenefits from the industry could have been 30 percent higher, or US$30 million, in 1998. It isemphasised that this is an approximate calculation. It is provided for illustrative purposes.
PNG needs to maximise the economic benefits generated from the sustainable use of itsforestry endowment. It cannot afford government revenue and landowner benefits being 30percent less than the sustainable potential. The reasons for this result need to be understood andpolicies put in place to ensure that such losses are not perpetuated. To the extent that this outcomereflects Green NGO anti-growth campaigns to undermine and constrain the forestry industry,these groups should explain to the government and landowners how PNG is to make up theselosses. They should also explain to people in rural areas why they should forego economic andsocial dividends of this order from the sustainable use of their own resources.
47
T H E E C O N O M I C I M P O R TA N C E O F T H E F O R E S T I N D U S T RY T O PA P U A N E W G U I N E A
160 There is no reason to expect that the ITTO estimate of the annual sustainable cut from native forests wouldchange significantly over time. PNGFIA figures demonstrate however that after the Asian Financial Crisis in1997 log export volumes in 2004 (2 million m3) had not recovered from the levels attained in 1997 (3 millionm3). They have risen steadily since the 1.6 million m3 in 1998 but in 2004 were still 1 million m3 less than in1997. Given the expected stability in ITTO estimates of sustainable production from native forests, this suggeststhat the cumulative losses in government revenue since 1998 would have been substantial.

A P P E N D I C E S
48


