NORTH SEA STUDY OCCASIONAL PAPER
No. 129
The Economics of Enhanced Oil Recovery (EOR) in
the UKCS and the Tax Review
Professor Alexander G. Kemp
and
Linda Stephen
November, 2014
Aberdeen Centre for Research in Energy Economics and
Finance (ACREEF) © A.G. Kemp and L. Stephen
i
ISSN 0143-022X
NORTH SEA ECONOMICS
Research in North Sea Economics has been conducted in the Economics Department
since 1973. The present and likely future effects of oil and gas developments on the
Scottish economy formed the subject of a long term study undertaken for the Scottish
Office. The final report of this study, The Economic Impact of North Sea Oil on
Scotland, was published by HMSO in 1978. In more recent years further work has
been done on the impact of oil on local economies and on the barriers to entry and
characteristics of the supply companies in the offshore oil industry.
The second and longer lasting theme of research has been an analysis of licensing and
fiscal regimes applied to petroleum exploitation. Work in this field was initially
financed by a major firm of accountants, by British Petroleum, and subsequently by
the Shell Grants Committee. Much of this work has involved analysis of fiscal
systems in other oil producing countries including Australia, Canada, the United
States, Indonesia, Egypt, Nigeria and Malaysia. Because of the continuing interest in
the UK fiscal system many papers have been produced on the effects of this regime.
From 1985 to 1987 the Economic and Social Science Research Council financed
research on the relationship between oil companies and Governments in the UK,
Norway, Denmark and The Netherlands. A main part of this work involved the
construction of Monte Carlo simulation models which have been employed to
measure the extents to which fiscal systems share in exploration and development
risks.
Over the last few years the research has examined the many evolving economic issues
generally relating to petroleum investment and related fiscal and regulatory matters.
Subjects researched include the economics of incremental investments in mature oil
fields, economic aspects of the CRINE initiative, economics of gas developments and
contracts in the new market situation, economic and tax aspects of tariffing,
economics of infrastructure cost sharing, the effects of comparative petroleum fiscal
systems on incentives to develop fields and undertake new exploration, the oil price
responsiveness of the UK petroleum tax system, and the economics of
decommissioning, mothballing and re-use of facilities. This work has been financed
by a group of oil companies and Scottish Enterprise, Energy. The work on CO2
Capture, EOR and storage was financed by a grant from the Natural Environmental
Research Council (NERC) in the period 2005 – 2008.
For 2013 the programme examines the following subjects:
a) Implications of Constitutional Change for the North Sea Oil and Gas
Sector
b) Integrated Returns to Investment in CO2 Capture, Transport and Storage
c) Full Cycle Returns to Exploration in the UKCS
d) Economics of CO2 EOR Cluster Developments in the Central North Sea/
Outer Moray Firth
ii
e) The Incidence of Field Allowances for Supplementary Charge
f) Future Activity Prospects for the UKCS
g) Economics of Third Party Access to Infrastructure
h) Tax Incentives for CO2 EOR
The authors are solely responsible for the work undertaken and views expressed. The
sponsors are not committed to any of the opinions emanating from the studies.
Papers are available from:
The Secretary (NSO Papers)
University of Aberdeen Business School
Edward Wright Building
Dunbar Street
Aberdeen A24 3QY
Tel No: (01224) 273427
Fax No: (01224) 272181
Email: [email protected]
Recent papers published are:
OP 98 Prospects for Activity Levels in the UKCS to 2030: the 2005
Perspective
By A G Kemp and Linda Stephen (May 2005), pp. 52
£20.00
OP 99 A Longitudinal Study of Fallow Dynamics in the UKCS
By A G Kemp and Sola Kasim, (September 2005), pp. 42
£20.00
OP 100 Options for Exploiting Gas from West of Scotland
By A G Kemp and Linda Stephen, (December 2005), pp. 70
£20.00
OP 101 Prospects for Activity Levels in the UKCS to 2035 after the
2006 Budget
By A G Kemp and Linda Stephen, (April 2006) pp. 61
£30.00
OP 102 Developing a Supply Curve for CO2 Capture, Sequestration and
EOR in the UKCS: an Optimised Least-Cost Analytical
Framework
By A G Kemp and Sola Kasim, (May 2006) pp. 39
£20.00
OP 103 Financial Liability for Decommissioning in the UKCS: the
Comparative Effects of LOCs, Surety Bonds and Trust Funds
By A G Kemp and Linda Stephen, (October 2006) pp. 150
£25.00
OP 104 Prospects for UK Oil and Gas Import Dependence
By A G Kemp and Linda Stephen, (November 2006) pp. 38
£25.00
iii
OP 105 Long-term Option Contracts for CO2 Emissions
By A G Kemp and J Swierzbinski, (April 2007) pp. 24
£25.00
OP 106 The Prospects for Activity in the UKCS to 2035: the 2007
Perspective
By A G Kemp and Linda Stephen (July 2007) pp.56
£25.00
OP 107 A Least-cost Optimisation Model for CO2 capture
By A G Kemp and Sola Kasim (August 2007) pp.65
£25.00
OP 108 The Long Term Structure of the Taxation System for the UK
Continental Shelf
By A G Kemp and Linda Stephen (October 2007) pp.116
£25.00
OP 109 The Prospects for Activity in the UKCS to 2035: the 2008
Perspective
By A G Kemp and Linda Stephen (October 2008) pp.67
£25.00
OP 110 The Economics of PRT Redetermination for Incremental
Projects in the UKCS
By A G Kemp and Linda Stephen (November 2008) pp. 56
£25.00
OP 111 Incentivising Investment in the UKCS: a Response to
Supporting Investment: a Consultation on the North Sea Fiscal
Regime
By A G Kemp and Linda Stephen (February 2009) pp.93
£25.00
OP 112 A Futuristic Least-cost Optimisation Model of CO2
Transportation and Storage in the UK/ UK Continental Shelf
By A G Kemp and Sola Kasim (March 2009) pp.53
£25.00
OP 113 The Budget 2009 Tax Proposals and Activity in the UK
Continental Shelf (UKCS)
By A G Kemp and Linda Stephen (June 2009) pp. 48
£25.00
OP 114 The Prospects for Activity in the UK Continental Shelf to 2040:
the 2009 Perspective
By A G Kemp and Linda Stephen (October 2009) pp. 48
£25.00
OP 115 The Effects of the European Emissions Trading Scheme (EU
ETS) on Activity in the UK Continental Shelf (UKCS) and CO2
Leakage
By A G Kemp and Linda Stephen (April 2010) pp. 117
£25.00
OP 116 Economic Principles and Determination of Infrastructure Third
Party Tariffs in the UK Continental Shelf (UKCS)
By A G Kemp and Euan Phimister (July 2010) pp. 26
iv
OP 117 Taxation and Total Government Take from the UK Continental
Shelf (UKCS) Following Phase 3 of the European Emissions
Trading Scheme (EU ETS)
By A G Kemp and Linda Stephen (August 2010) pp. 168
OP 118 An Optimised Illustrative Investment Model of the Economics
of Integrated Returns from CCS Deployment in the UK/UKCS
BY A G Kemp and Sola Kasim (December 2010) pp. 67
OP 119 The Long Term Prospects for Activity in the UK Continental
Shelf
BY A G Kemp and Linda Stephen (December 2010) pp. 48
OP 120 The Effects of Budget 2011 on Activity in the UK Continental
Shelf
BY A G Kemp and Linda Stephen (April 2011) pp. 50
OP 121 The Short and Long Term Prospects for Activity in the UK
Continental Shelf: the 2011 Perspective
BY A G Kemp and Linda Stephen (August 2011) pp. 61
OP 122 Prospective Decommissioning Activity and Infrastructure
Availability in the UKCS
BY A G Kemp and Linda Stephen (October 2011) pp. 80
OP 123 The Economics of CO2-EOR Cluster Developments in the UK
Central North Sea/ Outer Moray Firth
BY A G Kemp and Sola Kasim (January 2012) pp. 64
OP 124 A Comparative Study of Tax Reliefs for New Developments in
the UK Continental Shelf after Budget 2012
BY A G Kemp and Linda Stephen (July 2012) pp.108
OP 125 Prospects for Activity in the UK Continental Shelf after Recent
Tax Changes: the 2012 Perspective
BY A G Kemp and Linda Stephen (October 2012) pp.82
OP 126 An Optimised Investment Model of the Economics of
Integrated Returns from CCS Deployment in the UK/UKCS
BY A G Kemp and Sola Kasim (May 2013) pp.33
OP 127
The Full Cycle Returns to Exploration in the UK Continental
Shelf
BY A G Kemp and Linda Stephen (July 2013) pp. 86
OP 128 Petroleum Taxation for the Maturing UK Continental Shelf
(UKCS)
BY A G Kemp, Linda Stephen, Sola Kasim (October 2014)
pp.94
OP
129 The Economics of Enhanced Oil Recovery (EOR) in the UKCS
and the Tax Review
BY A G Kemp and Linda Stephen (November 2014) pp.46
v
The Economics of Enhanced Oil Recovery (EOR)
in the UKCS and the Tax Review
Professor Alexander G. Kemp
And
Linda Stephen
Contents Page
1. Background and Context….................................………………….1
2. Key Features of the EOR Schemes………… …………………….2
(a) Low Salinity Projects…………………………………………..2
(b) Polymer Flood Schemes………………………………………..2
(c) Miscible Gas Injection…………………………………………4
3. Modelling Procedures and Assumptions….…………………….…4
4. Results……………….……..………………………………...……6
5. Oil Price Sensitivity……………………………………………...29
6. Conclusions………………………………………………………32
Appendix…………………………………………………………33
1
The Economics of Enhanced Oil Recovery (EOR)
in the UKCS and the Tax Review
Professor Alexander G. Kemp and Linda Stephen
1. Background and Context
In a mature petroleum province such as the UK Continental Shelf
(UKCS) the attainment of maximum economic recovery should clearly be
regarded as a priority. This is the overriding theme of the Wood Review.
In pursuit of this there is an obvious role for tertiary recovery or enhanced
oil recovery (EOR) schemes. Currently the oil recovery factor in the
UKCS is believed to be around 45% though comprehensive evidence is
rather elusive. EOR schemes have been common in onshore situation in
North America for many years but much less common in offshore
situations. The costs of implementing EOR schemes are clearly much
higher in the offshore environment, and this, rather than knowledge of the
technology, has been the main inhibiting factor. The inherent risks of the
schemes are also a main consideration.
The current Tax Review provides an important opportunity to consider
the incentives which are appropriate for EOR schemes. In the USA
where tertiary recovery schemes are common the challenging economic
environment is recognised through the provision of special tax incentives
restricted to genuine EOR schemes. Currently in the UKCS the
Brownfield (BF) Allowance against Supplementary Charge (SC) is
available for EOR schemes (except CO2 EOR). Whether it is appropriate
for genuine EOR schemes (as opposed to other incremental projects) is
investigated in this paper. The study examines the economics of schemes
relating to Low Salinity Waterflood, Polymer Flood (risked and unrisked),
2
and Miscible Gas Injection. CO2 EOR schemes are the subject of a
separate paper.
2. Key Features of the EOR Schemes
(a) Low Salinity Projects
From the economic perspective a Low Salinity project involves a
substantial initial investment followed by a modest annual production
spread over a very long time period. The result is that the project
payback period is also very long. In absolute terms the extra operating
costs are substantial, particularly in terms of requirements for
manpower and beds offshore. Key risks of the projects relate to (1)
the effectiveness of the waterflood technology in enhancing oil
production, (2) the commissioning of the low salinity kit, (3) the
additional complexity of managing the reservoir, and (4) the extra
problems regarding well integrity. A further feature relates to the
extra weight on the platform from the low salinity kit which reduces
the flexibility of other activities on the platform.
In the present study a project involving potential EOR of 42 mmbbls
was examined. The development cost was estimated at £338 million
at 2014 prices. The development costs per barrel are around $13.3
again at 2014 prices. Lifetime operating costs are estimated at around
£100 million and operating costs per barrel at just under $4. The
precise figure for unit costs depend on the economic cut off which in
turn depends on the oil price.
(b) Polymer Flood Schemes
Key characteristics of polymer flood schemes from an economic
perspective are (1) high initial investment, including costs of
3
modifying the FPSO/platform to equip it for receipt of polymers, and
(2) the costs of building the EOR storage facilities. Operating costs
are very high because of the need to purchase large amounts of
polymer over a long period. The costs of polymers may well
constitute 80%-90% of total operating costs. The EOR production
will generally be at modest levels but over a very long time period.
The result is that the payback period will also be very long.
There are several major risks surrounding investment in chemical
EOR projects. A key one relates to the extent of degradation of the
polymer in the reservoir. There can be degradation of polymer in the
chokes such that the full viscosity is not obtained at the other side of
the choke. This highlights the importance of the choice of detailed
technologies relating to choke solution, inversion mixer design, and
shear resistant polymer solution. In the present study two cases have
been modelled, labelled risked and unrisked. The risked case shows a
low production outcome reflecting the situation where the risks are not
mitigated. The unrisked case reflects the upside outcome if the risks
did not materialise. Other project risks relate to the availability of
polymers over a long period. Optimally at least 90% availability is
needed. Availability in practice also depends upon suitable long term
supply contracts.
In the modelling of the risked case the potential EOR (including sales
gas) was around 17.5 mmboe, depending on the economic cut-off.
The development cost was estimated at £116 million at 2014 prices.
The unit development cost was estimated at $10.67 per boe. Lifetime
operating costs were estimated at £454 million at 2014 prices and unit
operating cost at $41.9 per boe. In the unrisked case the potential
4
EOR was estimated at 38.3 mmboe. The total development cost was
estimated at £156 million at 2014 prices, and the total lifetime
operating cost at £529 million. The development cost per boe was
estimated at $6.7 and the operating cost $22.7 per boe.
(c) Miscible Gas Injection
Key features of Miscible Gas EOR schemes include substantial
investment costs and very large operating costs, due principally to the
need to purchase substantial quantities of gas over a long period. The
degree of security attached to long term gas supplies and their price
constitute the most important risks. There is likely to be a long
payback period with the production profile being at modest levels over
a long period. There should be enhanced production of NGLs, but
substantial risks relate to the extent of this. The risk relating to the
EOR itself is comparatively low.
In the modelling undertaken in this paper the potential EOR is around
53.3 mmboe depending on the economic cut-off. This includes a
worthwhile volume of NGLs. The total development costs were
estimated at £503.5 million at 2014 prices. Lifetime operating costs
including purchase of gas were estimated at £1,492 million, again at
2014 prices. The development costs per boe were estimated at $15.5
and operating costs at $46 per boe.
3. Modelling Procedures and Assumptions
The modelling procedures assume that the EOR projects are undertaken
on host or mother fields where, at the time of the investment in the EOR
scheme, the licensee is in a full tax-paying position. He is assumed to be
subject to corporation tax (CT) and Supplementary Charge (SC) but not
5
Petroleum Revenue Tax (PRT). The current Brownfield (BF) Allowance
against SC is in place, and applies to the projects where they qualify. To
qualify the incremental capital costs have to exceed £60 per tonne of
incremental reserves. The allowance increases linearly to a maximum of
£50 per tonne when capital costs reach £80 per tonne of incremental
reserves. The allowance is spread over 5 years. The maximum total
allowance is £250 million in non-PRT fields (and £500 million in PRT
fields).
Various experiments were undertaken to measure the impact of other
taxation arrangements. Thus the effects of the BF allowance at a
maximum rate of £75 per tonne without overall caps were examined.
Given the importance of operating costs the effects of the BF allowance
applied to capital plus operating costs (TC) was also examined with the
size of the allowance being kept to maxima of £50 and £75 per tonne in
the experiments.
Further experiments were conducted with the BF allowance being
replaced by an investment uplift allowance, restricted to the incremental
revenues from the EOR projects. Rates of 50%, 62.5% and 75% were
examined. Further experiments extended the eligibility of the uplift
allowance to investment plus operating costs (TC). Again rates of 50%,
62.5% and 75% were employed.
Yet further experiments were conducted on the effects of removing SC
from the tertiary recovery schemes. To enhance understanding of the
overall project economics, sensitivity analysis was undertaken to measure
the effects of increases in production of 20%, decreases in investment
costs by 20%, and decreases in operating costs of 20%.
6
Given the relatively modest returns on all the projects the results
emphasise the pre-tax and post-tax NPVs at different real rates of
discount, namely 0%, 5%, 10% and 15%.
The oil prices used in the modelling are $90 per barrel in real terms and
for gas 58 pence per therm in real terms. A sensitivity analysis with
prices of $110 per barrel and 58 pence per therm was also undertaken.
4. Results
In Charts 1-4 the NPVs are shown with the $90, 58 pence price scenarios
for the 4 projects showing pre-tax and post-tax values with the present BF
allowance at £50 per tonne, and an increased maximum allowance at £75
per tonne, based on investment costs per tonne of EOR. These charts also
show the results of modelling when the BF allowance is based on capital
plus operating costs (TC). In Chart 1 it is seen that the NPVs of the Low
Salinity Waterflood project at 10% real discount rate under all the
schemes are very low. The pre-tax NPV is negative at this discount rate.
The NPV/I ratios are also negative before tax. The value of +0.3 is
commonly employed as an investment hurdle. At 5% discount rate the
NPVs are generally healthy. The NPV/I ratios are also well in excess of
0.3, being 0.45 under the current tax system. The BF allowance at £75
per tonne based on TC gives the highest post-tax return. The NPV at
10% is £39 million and the NPV/I ratio is 0.13. Overall the project offers
very modest returns at the likely weighted average cost of capital
(WACC) of the investor in relation to the investment cost of around £338
million.
7
Chart 1
Chart 2
8
Chart 3
Chart 4
9
In Chart 2 the results are shown for the risked Polymer Flood project. As
measured by the size of the NPV this is a marginal project. The IRR does
exceed 10% under all the schemes examined, but the scales of the returns
are very modest. The NPV at 10% under the current tax system is only
£7.4 million and the NPV/I ratio is .07. The pre-tax NPV/I ratio is 0.19.
Again, the BF allowance at £75 per tonne based on TC is the most
effective of the tax schemes examined. The NPV/I ratio at 10% discount
rate becomes 0.32 which exceeds the pre-tax ratio. But at 5% discount
rate pre-tax returns are well in excess of post-tax values. At 5% real
discount rate the NPV/I ratios all comfortably exceed 0.3. With this
project there is a very big difference in the size of the post-tax NPVs
when the allowance is based on TC compared to investment cost only,
reflecting the large costs involved in purchasing the polymers. With BF
allowance of £75 per tonne based on investment costs the post-tax NPV
at 10% is £7.4 million but if the allowance were based on TC the NPV
becomes £33 million.
In Chart 3 the pre-tax and post-tax returns are shown for the unrisked
Polymer Flood project. These are substantially more attractive compared
to the risked case. The NPVs at 15% are positive both before and after
tax. At 10% discount rate the post-tax NPV under the present tax system
is £89 million. The NPV/I ratios comfortably exceed the hurdle of 0.3.
With the present tax system it is 0.69. Again, the BF allowance at £75
per tonne based on TC is the most powerful incentive scheme. The
NPV/I ratio at 10% is then 1.06.
In Chart 4 the returns to the Miscible Gas project are shown. With all tax
permutations the NPVs at 15% discount rate are positive. At 10%
discount rate the pre-tax NPV/I ratio is 0.41, but, after the present tax, it
10
is 0.22. With the BF allowance of £50 per tonne based on TC it becomes
0.3. With the BF allowance of £75 per tonne based on investment costs
the ratio is 0.26. When it is based on TC the ratio becomes 0.38.
In Charts 5-8 inclusive the results of introducing an investment uplift
allowance with rates of 50%, 62.5% and 75% are shown. In Chart 5 the
results for the Low Salinity project indicate very small post-tax NPVs at
10% discount rate. The NPV/I ratios are all far below 0.3. It will be
recalled that this project had a negative pre-tax NPV at 10% real discount
rate. At 5% real discount rates the NPV/I ratios all exceed 0.3. But this
discount rate is below the WACC for investors. In all cases post-tax
NPVs increase to a modest extent the higher the size of the uplift.
Chart 5
-£500
£0
£500
£1,000
£1,500
£2,000
0 0.05 0.1 0.15
£m
Low Salinity $90/bbl and 58p/therm
NPVs at various real discount rates
Pre-tax Post-tax 50% Uplift on Devex
Post-tax 62.5% Uplift on Devex Post-tax 75% Uplift on Devex
11
Chart 6
Chart 7
-£100
-£50
£0
£50
£100
£150
£200
£250
£300
£350
£400
0 0.05 0.1 0.15
£m
Chemical EoR (Risked)
$90/bbl and 58p/therm NPVs at various real discount rates
Pre-tax Post-tax 50% Uplift on Devex
Post-tax 62.5% Uplift on Devex Post-tax 75% Uplift on Devex
£0
£200
£400
£600
£800
£1,000
£1,200
£1,400
0 0.05 0.1 0.15
£m
Chemical EoR (Unrisked)
$90/bbl and 58p/therm NPVs at various real discount rates
Pre-tax Post-tax 50% Uplift on Devex
Post-tax 62.5% Uplift on Devex Post-tax 75% Uplift on Devex
12
Chart 8
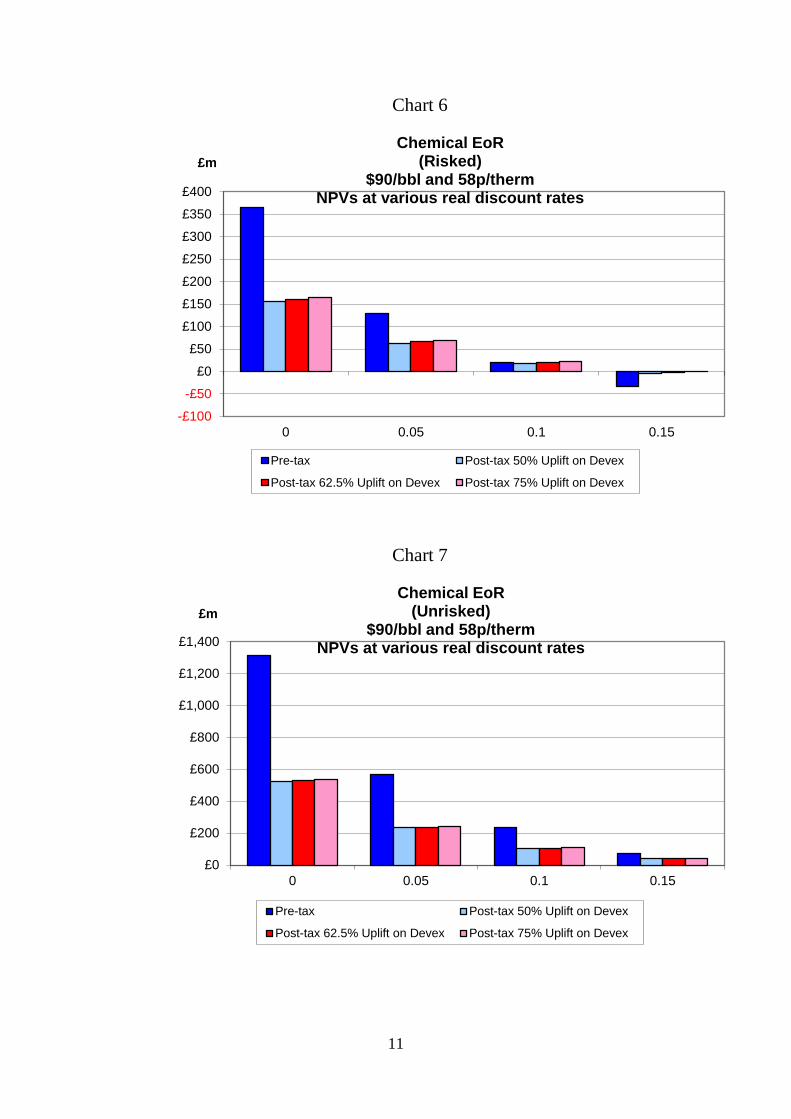
In Chart 6 the returns to the risked Polymer Flood project are shown. At
10% discount rate the NPVs are all positive, but the NPV/I ratios are
below 0.3 in all cases, being 0.18 with 50% uplift, 0.2 with 62.5% rate
and 0.23 with 75% rate. At 5% real discount rate the NPV/I ratios
comfortably exceed 0.3 in all cases, being 0.58 at 50% uplift rate. Again
the size of the NPV increases modestly the greater the size of the uplift.
In Chart 7 the returns to the unrisked Polymer Flood project are shown.
At 10% discount rate the NPVs are all significantly positive. The NPV/I
ratios are also well in excess of 0.3 in all cases. At 50% uplift the ratio is
0.79, at 62.5% it is 0.81, and at 75% it is 0.84. The returns increase to a
modest extent the higher the uplift allowance.
In Chart 8 the returns to the Miscible Gas project are shown. At 10%
discount rate the NPVs are all substantially positive. The NPV/I ratio is
£0
£100
£200
£300
£400
£500
£600
£700
£800
£900
£1,000
0 0.05 0.1 0.15
£m
Miscible Gas EoR $90/bbl and 58p/therm
NPVs at various real discount rates
Pre-tax Post-tax 50% Uplift on Devex
Post-tax 62.5% Uplift on Devex Post-tax 75% Uplift on Devex
13
0.4 before tax, but after tax with 50% uplift it is 0.28. At 62.5% uplift the
ratio is 0.31, and at 75% rate it is 0.35. At 5% real discount rate the
NPVs are all very substantially positive and the NPV/I ratios are all well
in excess of 0.3.
In Charts 9-12 the results are shown when the uplift allowance applies to
capital and operating costs (TC). In Chart 9 where the returns to the Low
Salinity project are shown, it is seen that at 10% discount rate the NPVs
after tax are modestly positive though the pre-tax value is negative. The
NPV/I ratios are all far below 0.3, being 0.08 at 50% uplift and 0.13 at
75% rate. The project is not commercially viable in this scenario. At 5%
real discount rate the NPVs are significantly positive and the NPV/I ratios
greatly exceed 0.3, being 1.2 before tax and 1.0 with 50% uplift on TC.
With respect to the effects of the different rates of uplift it is seen that the
NPVs increase modestly in relation to the rate of uplift. A comparison
with Chart 5 indicates that there is little difference in the size of the NPVs
with the uplift based on TC compared to investment cost only. This is
because the incremental operating costs per boe on this project are very
low.
14
Chart 9
Chart 10
-£500
£0
£500
£1,000
£1,500
£2,000
0 0.05 0.1 0.15
£m
Low Salinity $90/bbl and 58p/therm
NPVs at various real discount rates
Pre-tax Post-tax 50% Uplift on TC Post-tax 62.5% Uplift on TC Post-tax 75% Uplift on TC
-£100
-£50
£0
£50
£100
£150
£200
£250
£300
£350
£400
0 0.05 0.1 0.15
£m
Chemical EoR (Risked)
$90/bbl and 58p/therm NPVs at various real discount rates
Pre-tax Post-tax 50% Uplift on TC Post-tax 62.5% Uplift on TC Post-tax 75% Uplift on TC
15
Chart 11
Chart 12
£0
£200
£400
£600
£800
£1,000
£1,200
£1,400
0 0.05 0.1 0.15
£m
Chemical EoR (Unrisked)
$90/bbl and 58p/therm NPVs at various real discount rates
Pre-tax Post-tax 50% Uplift on TC Post-tax 62.5% Uplift on TC Post-tax 75% Uplift on TC
£0
£100
£200
£300
£400
£500
£600
£700
£800
£900
£1,000
0 0.05 0.1 0.15
£m
Miscible Gas EoR $90/bbl and 58p/therm
NPVs at various real discount rates
Pre-tax Post-tax 50% Uplift on TC Post-tax 62.5% Uplift on TC Post-tax 75% Uplift on TC
16
The position is quite different on the risked Polymer Flood project the
results for which are shown in Chart 10. At 10% real discount rate the
post-tax NPVs are significantly positive. The NPV/I ratios comfortably
exceed 0.3, even at the uplift rate of 50% where it is 0.46. The inclusion
of operating costs in the allowance makes a big difference to its
effectiveness. When the allowance was based on investment costs only
(see Chart 6), at 10% discount rate the NPV/I ratio at 50% uplift was only
0.18 and at 75% uplift it was 0.23.
In Chart 11 the results are shown for the unrisked Polymer Flood scheme.
At 10% discount rate the NPVs are all substantially positive. The NPV/I
ratios all exceed 0.3 by substantial margins even with the uplift at 50%
where the ratio is 1.03.
In Chart 12 the results for the Miscible Gas project are shown. At 10%
real discount rate the NPVs are all substantially positive. The NPV/I
ratio with 50% uplift is 0.36 and with 75% uplift it is 0.476. When the
uplift allowance was based on investment costs only (Chart 8) the NPV/I
ratio was 0.28 with uplift at 50% and 0.346 at 75% uplift. Thus the
allowance based on TC further incentivises the development of this
project.
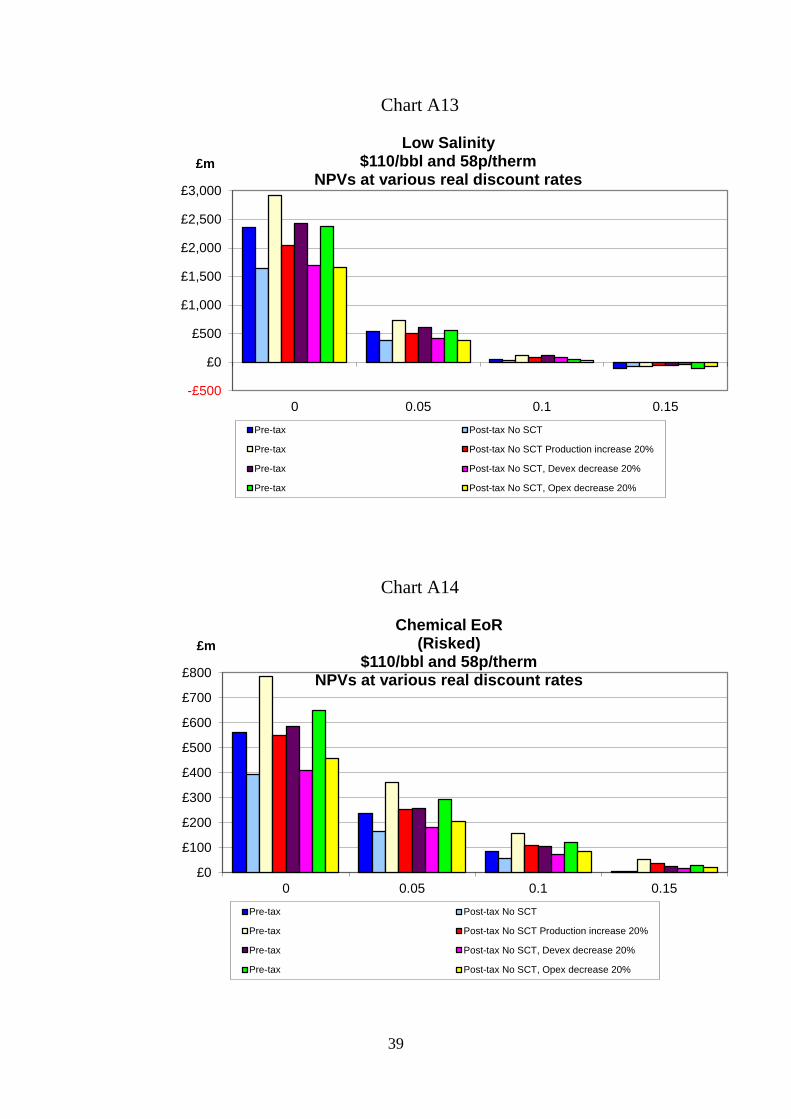
In Charts 13-16 the results of removing SC from the EOR schemes are
shown. To enhance understanding of the underlying economics of the
projects the results are also shown for (a) production increase of 20%, (b)
decrease in development costs of 20%, and (c) decrease in operating costs
of 20%.
17
Chart 13
Chart 14
-£500
£0
£500
£1,000
£1,500
£2,000
£2,500
0 0.05 0.1 0.15
£m
Low Salinity $90/bbl and 58p/therm
NPVs at various real discount rates
Pre-tax Post-tax No SCT
Pre-tax Post-tax No SCT Production increase 20%
Pre-tax Post-tax No SCT, Devex decrease 20%
Pre-tax Post-tax No SCT, Opex decrease 20%
-£100
£0
£100
£200
£300
£400
£500
£600
0 0.05 0.1 0.15
£m
Chemical EoR (Risked)
$90/bbl and 58p/therm NPVs at various real discount rates
Pre-tax Post-tax No SCT
Pre-tax Post-tax No SCT Production increase 20%
Pre-tax Post-tax No SCT, Devex decrease 20%
Pre-tax Post-tax No SCT, Opex decrease 20%
18
Chart 15
Chart 16
£0
£200
£400
£600
£800
£1,000
£1,200
£1,400
£1,600
£1,800
0 0.05 0.1 0.15
£m
Chemical EoR (Unrisked)
$90/bbl and 58p/therm NPVs at various real discount rates
Pre-tax Post-tax No SCT
Pre-tax Post-tax No SCT Production increase 20%
Pre-tax Post-tax No SCT, Devex decrease 20%
Pre-tax Post-tax No SCT, Opex decrease 20%
£0
£200
£400
£600
£800
£1,000
£1,200
£1,400
£1,600
0 0.05 0.1 0.15
£m
Miscible Gas EoR $90/bbl and 58p/therm
NPVs at various real discount rates
Pre-tax Post-tax No SCT
Pre-tax Post-tax No SCT Production increase 20%
Pre-tax Post-tax No SCT, Devex decrease 20%
Pre-tax Post-tax No SCT, Opex decrease 20%
19
In Chart 13 the results for the Low Salinity scheme indicate that at 10%
real discount rate the project has either a negative NPV or a very low
positive value under all the permutations. The NPV/I ratios are far below
the 0.3 hurdle. At 5% real discount rate the NPVs are positive under all
the scenarios, and the NPV/I ratios substantially exceed 0.3. With no SC
but no other change the project has an NPV/I ratio of 0.85. In this
scenario the return is higher compared to the effects of the other incentive
schemes discussed above. To enhance the returns it is also seen that a
production increase of 20% has a stronger effect than a reduction of 20%
in the investment costs. The effect is even stronger compared to a
reduction in operating costs of 20%.
In Chart 14 the returns are shown for the risked Polymer Flood scheme.
At 10% discount the removal of SC produces a small positive NPV. But
the NPV/I ratio is only 0.13. At 5% real discount rate the post-tax NPV
is positive to the extent that the NPV/I ratio becomes 0.84.
If production were increased by 20% there is a substantial positive effect
on returns. At 10% real discount rate the post-tax NPV is £56 million
and the NPV/I ratio is 0.56. If investment costs decreased by 20% the
resulting pre-tax NPV/I ratio comfortably exceeds 0.3 and the post-tax
ratio becomes 0.34. If operating costs were decreased by 20% the post-
tax NPV just exceeds that obtained with 20% reduction in investment
costs, but it remains less than the NPV from a 20% production increase.
In Chart 15 the results are shown for the unrisked Polymer Flood scheme.
At 10% discount rate the post-tax NPV with no other changes is
significantly positive and the NPV/I ratio becomes 1.27. It is also seen
that a 20% increase in production is the most effective means to enhance
20
the NPV. A decrease in operating costs of 20% is rather more effective
than a decrease in investment costs of 20%, reflecting the importance of
the polymer costs to the overall project.
In Chart 16 the results are shown for the Miscible Gas project. At 10%
discount rate the NPVs are generally significantly positive. The NPV/I
ratio without SC but with no other changes is 0.29. If other favourable
changes can be made to production, investment costs or operating costs
the NPV/I ratio comfortably exceeds the 0.3 hurdle. As with the other
projects increasing production by 20% has a much stronger effect on the
NPV compared to reductions in investment or operating costs by a similar
proportion. With a production increase of 20% the NPV/I ratio becomes
0.57.
To further enhance understanding of the economics of the projects with
different tax incentives in Chart 17-20 the returns to the projects are
shown with production increases of 20% along with (a) BF allowance of
£50 per tonne based on investment costs, (b) BF allowance of £50 based
on TC, and (c) no SC. In Chart 17 it is seen that, at the 10% discount rate,
the NPVs for the Low Salinity project are all positive, but the values are
so small that the NPV/I ratios are all well below 0.3. At 5% real discount
rate all the post-tax NPV/I ratios are considerably above 0.3. The largest
post-tax NPV comes when there is no SC.
In Chart 18 the returns on the risked Polymer Flood scheme are shown.
At 10% real discount rate the NPVs are all positive. The pre-tax NPV/I
ratio is very considerably in excess of 0.3, but the post-tax value with the
present BF allowance is just on 0.3. However, with the BF allowance at
21
£50 per tonne based on TC the ratio becomes 0.47, and when there is no
SC the hurdle is also substantially exceeded.
Chart 17
Chart 18
-£500
£0
£500
£1,000
£1,500
£2,000
£2,500
0 0.05 0.1 0.15
£m
Low Salinity $90/bbl and 58p/therm
NPVs at various real discount rates
Pre-tax Post-tax BF £50 on Devex Production increase 20%
Post-tax BF £50 on TC Production increase 20% Post-tax No SCT Production increase 20%
£0
£100
£200
£300
£400
£500
£600
0 0.05 0.1 0.15
£m
Chemical EoR (Risked)
$90/bbl and 58p/therm NPVs at various real discount rates
Pre-tax Post-tax BF £50 on Devex Production increase 20%
Post-tax BF £50 on TC Production increase 20% Post-tax No SCT Production increase 20%
22
Chart 19
Chart 20
£0
£200
£400
£600
£800
£1,000
£1,200
£1,400
£1,600
£1,800
0 0.05 0.1 0.15
£m
Chemical EoR (Unrisked)
$90/bbl and 58p/therm NPVs at various real discount rates
Pre-tax Post-tax BF £50 on Devex Production increase 20%
Post-tax BF £50 on TC Production increase 20% Post-tax No SCT Production increase 20%
£0
£200
£400
£600
£800
£1,000
£1,200
£1,400
£1,600
0 0.05 0.1 0.15
£m
Miscible Gas EoR $90/bbl and 58p/therm
NPVs at various real discount rates
Pre-tax Post-tax BF £50 on Devex Production increase 20%
Post-tax BF £50 on TC Production increase 20% Post-tax No SCT Production increase 20%
23
In Chart 19 the results are shown for the unrisked Polymer Flood scheme.
At 10% discount rate all the NPVs are significantly positive. The NPV/I
ratios exceed the 0.3 hurdle by very large margins in all cases.
In Chart 20 the returns to the Miscible Gas scheme are shown. At 10%
discount rate the NPVs are all significantly positive. The post-tax NPV/I
ratio is 0.38 with the present tax system. If the BF allowance at £50 per
tonne were based on TC the NPV/I ratio becomes 0.46, and if there were
no SC the ratio is even higher.
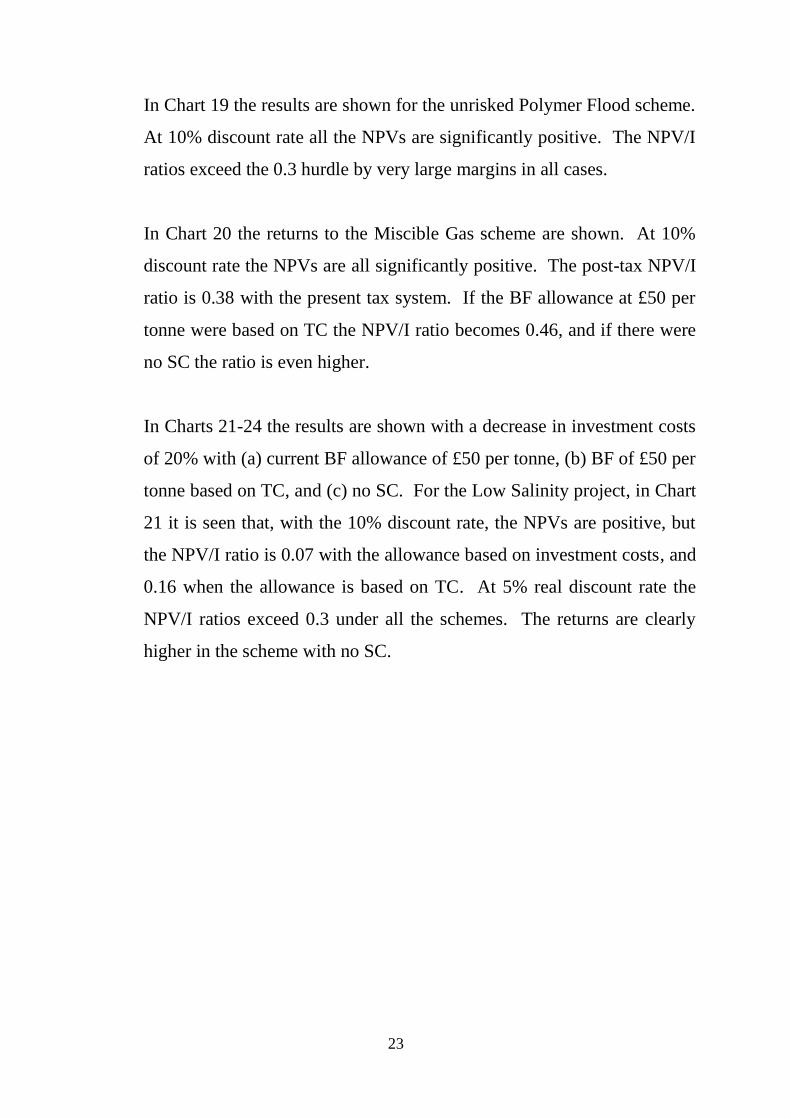
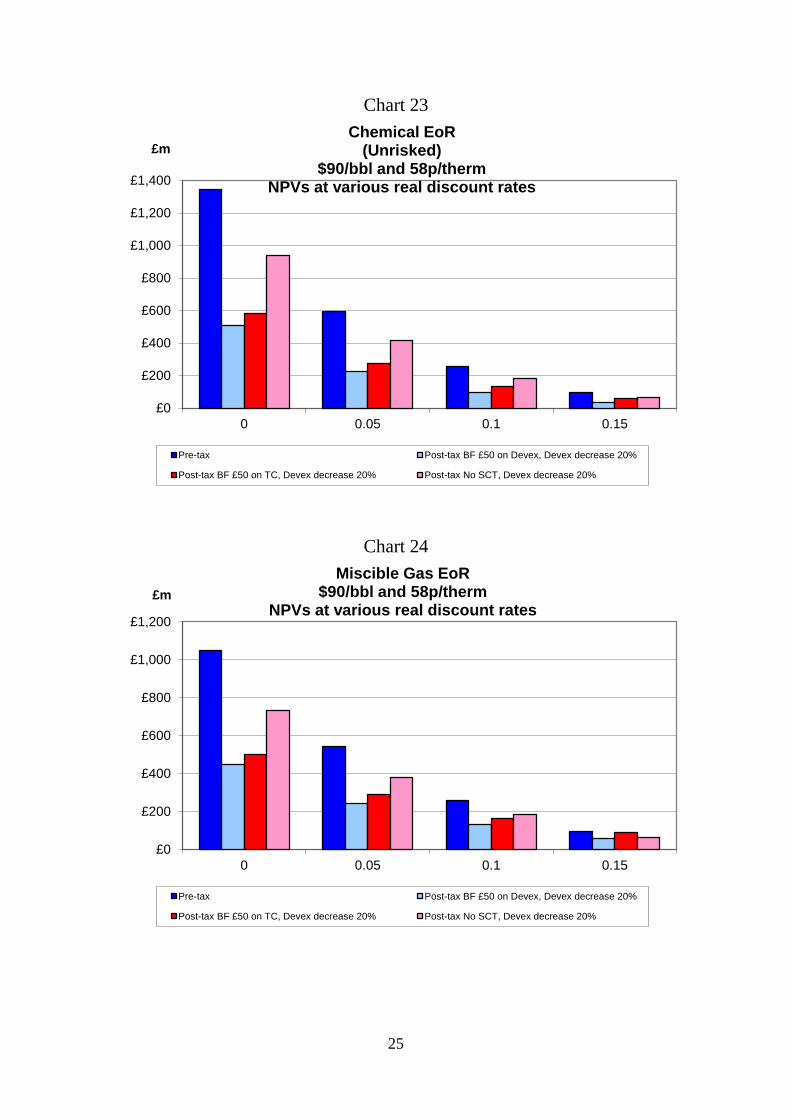
In Charts 21-24 the results are shown with a decrease in investment costs
of 20% with (a) current BF allowance of £50 per tonne, (b) BF of £50 per
tonne based on TC, and (c) no SC. For the Low Salinity project, in Chart
21 it is seen that, with the 10% discount rate, the NPVs are positive, but
the NPV/I ratio is 0.07 with the allowance based on investment costs, and
0.16 when the allowance is based on TC. At 5% real discount rate the
NPV/I ratios exceed 0.3 under all the schemes. The returns are clearly
higher in the scheme with no SC.
24
Chart 21
Chart 22
-£500
£0
£500
£1,000
£1,500
£2,000
0 0.05 0.1 0.15
£m
Low Salinity $90/bbl and 58p/therm
NPVs at various real discount rates
Pre-tax Post-tax BF £50 on Devex, Devex decrease 20%
Post-tax BF £50 on TC, Devex decrease 20% Post-tax No SCT, Devex decrease 20%
-£50
£0
£50
£100
£150
£200
£250
£300
£350
£400
0 0.05 0.1 0.15
£m Chemical EoR
(Risked) $90/bbl and 58p/therm
NPVs at various real discount rates
Pre-tax Post-tax BF £50 on Devex, Devex decrease 20%
Post-tax BF £50 on TC, Devex decrease 20% Post-tax No SCT, Devex decrease 20%
25
Chart 23
Chart 24
£0
£200
£400
£600
£800
£1,000
£1,200
£1,400
0 0.05 0.1 0.15
£m
Chemical EoR (Unrisked)
$90/bbl and 58p/therm NPVs at various real discount rates
Pre-tax Post-tax BF £50 on Devex, Devex decrease 20%
Post-tax BF £50 on TC, Devex decrease 20% Post-tax No SCT, Devex decrease 20%
£0
£200
£400
£600
£800
£1,000
£1,200
0 0.05 0.1 0.15
£m
Miscible Gas EoR $90/bbl and 58p/therm
NPVs at various real discount rates
Pre-tax Post-tax BF £50 on Devex, Devex decrease 20%
Post-tax BF £50 on TC, Devex decrease 20% Post-tax No SCT, Devex decrease 20%
26
In Chart 22 the returns to the risked Polymer Flood scheme are shown.
At 10% discount rate the NPVs are all positive. But with the present tax
system the NPV/I ratio is only 0.186. When the BF allowance at £50 per
tonne is based on TC the NPV/I ratio becomes 0.46.
In Chart 23 the returns are shown to the unrisked Polymer Flood project.
The NPVs are all positive at 10% real discount rate, and the NPV/I ratios
are all well in excess of the hurdle of 0.3. The highest post-tax returns
are achieved with the case of no SC.
In Chart 24 the returns are shown for the Miscible Gas project. At 10%
discount rate the NPVs are all significantly positive. But the post-tax
NPV/I ratio with the current tax system is 0.37. With the BF allowance at
£50 per tonne based on TC the ratio is 0.46. With no SC the hurdle is
clearly exceeded.
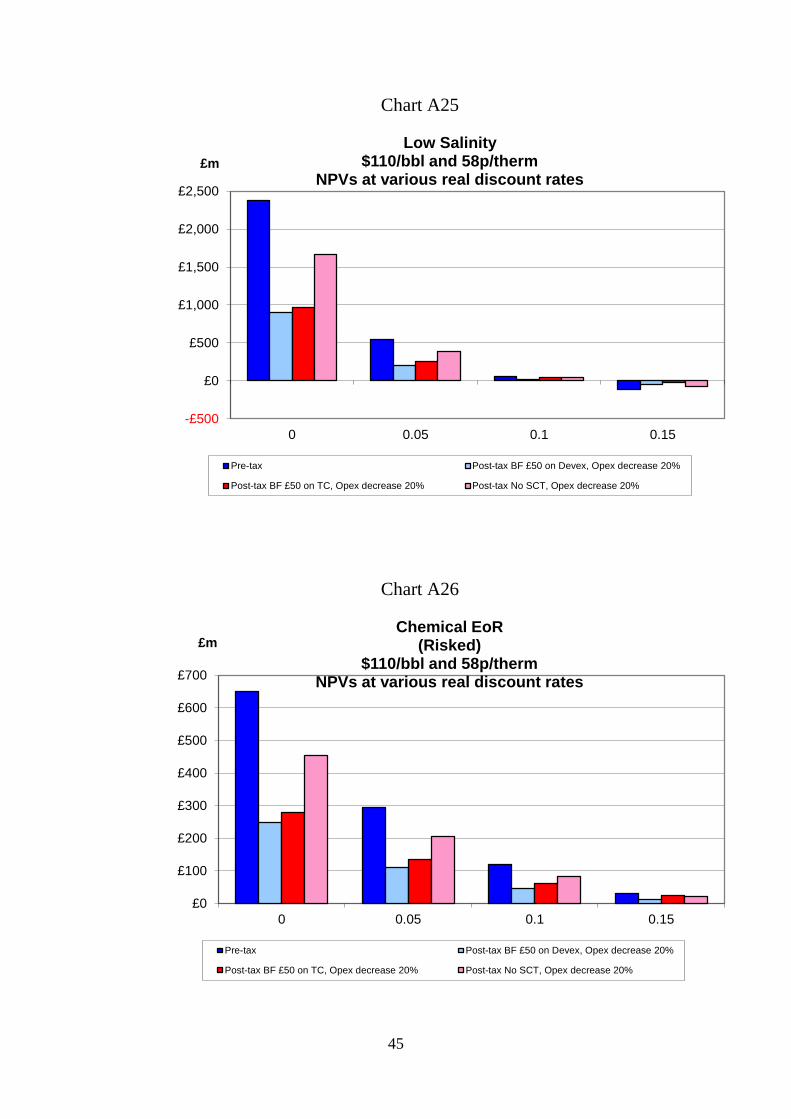
In Charts 25-28 the returns are shown with the operating costs decreased
by 20% under (a) the present tax system, (b) the BF allowance at £50 per
tonne based on TC, and (c) no SC. In Chart 25 the returns are shown for
the Low Salinity project. The NPV/I ratios at 10% are far below the 0.3
hurdle. It is seen that the NPVs at 10% discount rate are either negative
or very slightly positive. At 5% real discount rate the NPVs are all
positive. With the present tax system the NPV/I ratio is 0.46.
In Chart 26 the returns to the risked Polymer Flood project are shown. At
10% real discount rate the NPVs are all positive. The NPV/I hurdle of
0.3 is passed before tax but with the present tax system the ratio is 0.21.
With the BF allowance of £50 per tonne based on TC the ratio is 0.38.
With no SC the ratio is 0.39.
27
Chart 25
Chart 26
-£500
£0
£500
£1,000
£1,500
£2,000
0 0.05 0.1 0.15
£m
Low Salinity $90/bbl and 58p/therm
NPVs at various real discount rates
Pre-tax Post-tax BF £50 on Devex, Opex decrease 20%
Post-tax BF £50 on TC, Opex decrease 20% Post-tax No SCT, Opex decrease 20%
-£100
£0
£100
£200
£300
£400
£500
0 0.05 0.1 0.15
£m
Chemical EoR (Risked)
$90/bbl and 58p/therm NPVs at various real discount rates
Pre-tax Post-tax BF £50 on Devex, Opex decrease 20%
Post-tax BF £50 on TC, Opex decrease 20% Post-tax No SCT, Opex decrease 20%
28
Chart 27
Chart 28
£0
£200
£400
£600
£800
£1,000
£1,200
£1,400
£1,600
0 0.05 0.1 0.15
£m Chemical EoR
(Unrisked) $90/bbl and 58p/therm
NPVs at various real discount rates
Pre-tax Post-tax BF £50 on Devex, Opex decrease 20%
Post-tax BF £50 on TC, Opex decrease 20% Post-tax No SCT, Opex decrease 20%
£0
£200
£400
£600
£800
£1,000
£1,200
0 0.05 0.1 0.15
£m
Miscible Gas EoR $90/bbl and 58p/therm
NPVs at various real discount rates
Pre-tax Post-tax BF £50 on Devex, Opex decrease 20%
Post-tax BF £50 on TC, Opex decrease 20% Post-tax No SCT, Opex decrease 20%
29
In Chart 27 the returns to the unrisked Polymer Flood project are shown.
At 10% discount rate all the NPVs are significantly positive. The pre-tax
NPV/I ratio is far above the 0.3 hurdle, and after the imposition of the
present tax system it is 0.8. The highest post-tax returns are achieved
with the removal of SC where the NPV/I ratio at 10% is 1.49.
In Chart 28 the results are shown for the Miscible Gas project. At 10%
real discount rate all the NPVs are positive. The pre-tax NPV/I ratio
clearly passes the 0.3 hurdle, but, under the present tax system, the post-
tax ratio at 10% is 0.27. With BF allowance of £50 per tonne based on
TC the hurdle is passed with a ratio of 0.35. With no SC the ratio at 10%
is 0.37.
5. Oil Price Sensitivity
The effects of all the scenarios on the returns to the four projects were
also evaluated at an oil price of $110 in real terms. The full set of results
is reported in the Appendix. Significant differences and implications for
the returns to the projects are summarised below.
(a) With respect to the Low Salinity project the pre-tax returns failed the
NPV/I at 10% hurdle at both $90 and $110 prices. In the latter case
the ratio is 0.176. At 5% discount rate the pre-tax returns at $90 were
sufficient to meet the NPV/I ˃ 0.3 hurdle. Under the existing tax
system at 10% discount rate the project failed the NPV/I ˃ 0.3 hurdle
at both $90 and $110 prices. In the latter case the ratio is 0.067. At
5% real discount rate the project passes the NPV/I ˃ 0.3 hurdle at the
$90 price and so at the $110 one. With the investment uplift schemes
the project failed the NPV/I ˃ 0.3 hurdle at both $110 and $90 prices
at 10% discount rate. At 5% discount rate the hurdle was passed at
30
$90 prices and so at $110. With uplift based on TC the project fails
the hurdle at $110 as well as at $90 at 10% discount rate. The NPV/I
ratio is 0.13 at $110. With no SC the project again fails the hurdle of
NPV/I ˃ 0.3 at 10% discount rate at $110 as well as at $90. At 5%
discount rate without SC the project passes the hurdle at $90 as well as
at $110. With respect to the effects of variations in production,
investment costs, and operating costs there is generally little
difference across the two price scenarios regarding whether or not the
project passes the post-tax investment hurdle.
(b) With respect to the risked Polymer Flood scheme, at $110 price at
10% discount rate the project has a pre-tax NPV/I ratio of 0.82 and a
post-tax one of 0.31 with the present tax system. At $90 price the
post-tax ratio was only 0.07. At 5% real discount rate the project
passes the pre-tax hurdle at $90. With BF allowance at £75 per tonne
based on TC the project clearly passes the investment hurdle at 10%
discount rate at $110 with a ratio of 0.56. At the $90 price the ratio is
0.32. With the investment uplift schemes at 10% discount rate the
project fails the NPV/I test at $90 even with uplift at 75%, but passes
the hurdle at $110. Even with the uplift at 50% the NPV/I ratio is 0.41.
When the uplift is based on TC the project passes the hurdle at $90 as
well as $110, even with the uplift at 50%. When SC is removed from
the EOR projects at 10% discount rate it fails the investment hurdle at
$90, but clearly passes it at the $110 price. When production is
increased by 20% at 10% discount rate the project passes the hurdle at
$90 under the present tax system. Similarly, when investment costs
are reduced by 20% at 10% discount rate the project passed the
investment hurdle at $90 under the present tax system. When
operating costs are reduced by 20% at 10% discount rate the project
31
also passes the investment hurdle under the current tax system at $90
price.
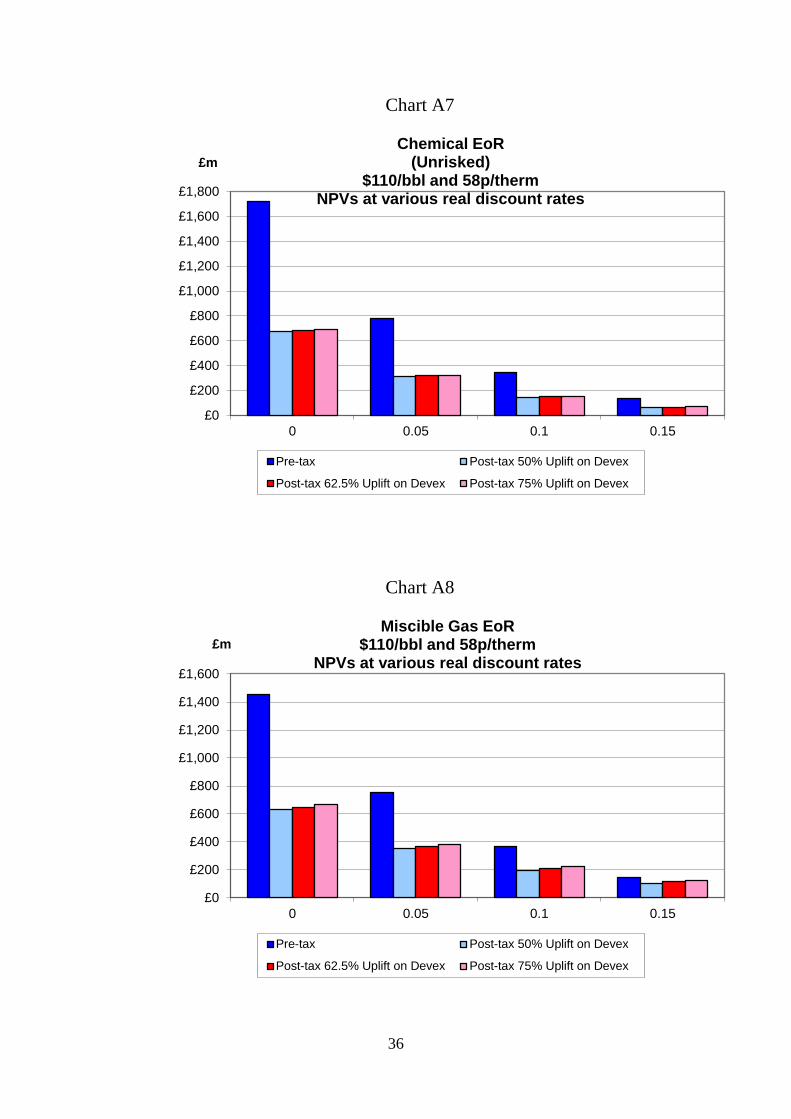
(c) The unrisked Polymer Flood scheme was found to pass all the
investment hurdles at $90 as well as $110 at 10% real discount rates.
(d) With respect to the Miscible Gas scheme it was found that the project
clearly passed the pre-tax investment hurdle at 10% real discount rate
at $90 as well as $110. But on an after-tax basis the project failed the
hurdle at 10% discount rate under the present tax system at $90 price
(ratio of 0.22), but passed the hurdle at $110 price (ratio of 0.39). A
larger BF allowance (£75 per tonne based on TC per tonne of EOR)
was needed to enable the hurdle to be passed at the $90 price. If the
investment uplift were introduced it was found that at 50% rate the
project failed the investment hurdle at $90 (ratio of 0.18), but passed it
at $110 (ratio of 0.45). At the $90 price an investment uplift of 75%
was needed to pass the hurdle. When the uplift was based on TC the
project passed the hurdle under the $90 price with a 50% rate (ratio of
0.37). If SC were removed from EOR projects the Miscible Gas
project just fails the hurdle at 10% discount rate and $90 price (ratio of
0.29), but passes it at the $110 price (ratio of 0.6). If production were
to increase by 20% the project passes the hurdle at 10% discount rate
at $90 as well as $110 under the present tax system. The same finding
applies to reductions in investment costs of 20%. With reductions in
operating costs of 20% the investment hurdle is not reached at 10%
discount rate at the $90 price (ratio is 0.27), but is comfortably passed
at $110 price (ratio is 0.45).
32
6. Conclusions
In this study the economics of several EOR projects in the UKCS have
been examined in detail in the context of the Tax Review. The findings
indicate that currently the project investment economics are quite
challenging. At oil prices and hurdle rates likely to be employed by
investors the returns are generally modest. The efficiency of several
types and rates of further tax incentives was examined. An uplift
allowance for SC related to investment and operating costs (TC) was
found to produce incentives which performed reasonably efficiently. The
provision of an uplift relating to operating costs is unusual, but, given the
very high costs involved in purchasing polymers and gas for schemes
which are promising in the context of the UKCS there is a case for an
uplift relating to these product requirements. They are akin to capital
expenditures when a wider view of their purpose is considered. Even a
partial allowance for these costs would be reasonably effective.
The more radical approach of removing SC from EOR projects was also
considered. In many circumstances this operated reasonably efficiently.
But in rather more cases the uplift mechanism produced a more effective
solution.
33
Appendix
Chart A1
Chart A2
-£500
£0
£500
£1,000
£1,500
£2,000
£2,500
0 0.05 0.1 0.15
£m
Low Salinity $110/bbl and 58p/therm
NPVs at various real discount rates
Pre-tax Post-tax BF £50 on Devex Post-tax BF £50 on TC
Post-tax BF £75 on Devex Post-tax BF £75 on TC
£0
£100
£200
£300
£400
£500
£600
0 0.05 0.1 0.15
£m
Chemical EoR (Risked)
$110/bbl and 58p/therm NPVs at various real discount rates
Pre-tax Post-tax BF £50 on Devex Post-tax BF £50 on TC
Post-tax BF £75 on Devex Post-tax BF £75 on TC
34
Chart A3
Chart A4
£0
£200
£400
£600
£800
£1,000
£1,200
£1,400
£1,600
£1,800
0 0.05 0.1 0.15
£m
Chemical EoR (Unrisked)
$110/bbl and 58p/therm NPVs at various real discount rates
Pre-tax Post-tax BF £50 on Devex Post-tax BF £50 on TC
Post-tax BF £75 on Devex Post-tax BF £75 on TC
£0
£200
£400
£600
£800
£1,000
£1,200
£1,400
£1,600
0 0.05 0.1 0.15
£m
Miscible Gas EoR $110/bbl and 58p/therm
NPVs at various real discount rates
Pre-tax Post-tax BF £50 on Devex Post-tax BF £50 on TC
Post-tax BF £75 on Devex Post-tax BF £75 on TC
35
Chart A5
Chart A6
-£500
£0
£500
£1,000
£1,500
£2,000
£2,500
0 0.05 0.1 0.15
£m
Low Salinity $110/bbl and 58p/therm
NPVs at various real discount rates
Pre-tax Post-tax 50% Uplift on Devex
Post-tax 62.5% Uplift on Devex Post-tax 75% Uplift on Devex
£0
£100
£200
£300
£400
£500
£600
0 0.05 0.1 0.15
£m
Chemical EoR (Risked)
$110/bbl and 58p/therm NPVs at various real discount rates
Pre-tax Post-tax 50% Uplift on Devex
Post-tax 62.5% Uplift on Devex Post-tax 75% Uplift on Devex
36
Chart A7
Chart A8
£0
£200
£400
£600
£800
£1,000
£1,200
£1,400
£1,600
£1,800
0 0.05 0.1 0.15
£m
Chemical EoR (Unrisked)
$110/bbl and 58p/therm NPVs at various real discount rates
Pre-tax Post-tax 50% Uplift on Devex
Post-tax 62.5% Uplift on Devex Post-tax 75% Uplift on Devex
£0
£200
£400
£600
£800
£1,000
£1,200
£1,400
£1,600
0 0.05 0.1 0.15
£m
Miscible Gas EoR $110/bbl and 58p/therm
NPVs at various real discount rates
Pre-tax Post-tax 50% Uplift on Devex
Post-tax 62.5% Uplift on Devex Post-tax 75% Uplift on Devex
37
Chart A9
Chart A10
-£500
£0
£500
£1,000
£1,500
£2,000
£2,500
0 0.05 0.1 0.15
£m
Low Salinity $110/bbl and 58p/therm
NPVs at various real discount rates
Pre-tax Post-tax 50% Uplift on TC Post-tax 62.5% Uplift on TC Post-tax 75% Uplift on TC
£0
£100
£200
£300
£400
£500
£600
0 0.05 0.1 0.15
£m
Chemical EoR (Risked)
$110/bbl and 58p/therm NPVs at various real discount rates
Pre-tax Post-tax 50% Uplift on TC Post-tax 62.5% Uplift on TC Post-tax 75% Uplift on TC
38
Chart A11
Chart A12
£0
£200
£400
£600
£800
£1,000
£1,200
£1,400
£1,600
£1,800
0 0.05 0.1 0.15
£m
Chemical EoR (Unrisked)
$110/bbl and 58p/therm NPVs at various real discount rates
Pre-tax Post-tax 50% Uplift on TC Post-tax 62.5% Uplift on TC Post-tax 75% Uplift on TC
£0
£200
£400
£600
£800
£1,000
£1,200
£1,400
£1,600
0 0.05 0.1 0.15
£m
Miscible Gas EoR $110/bbl and 58p/therm
NPVs at various real discount rates
Pre-tax Post-tax 50% Uplift on TC Post-tax 62.5% Uplift on TC Post-tax 75% Uplift on TC
39
Chart A13
Chart A14
-£500
£0
£500
£1,000
£1,500
£2,000
£2,500
£3,000
0 0.05 0.1 0.15
£m
Low Salinity $110/bbl and 58p/therm
NPVs at various real discount rates
Pre-tax Post-tax No SCT
Pre-tax Post-tax No SCT Production increase 20%
Pre-tax Post-tax No SCT, Devex decrease 20%
Pre-tax Post-tax No SCT, Opex decrease 20%
£0
£100
£200
£300
£400
£500
£600
£700
£800
0 0.05 0.1 0.15
£m
Chemical EoR (Risked)
$110/bbl and 58p/therm NPVs at various real discount rates
Pre-tax Post-tax No SCT
Pre-tax Post-tax No SCT Production increase 20%
Pre-tax Post-tax No SCT, Devex decrease 20%
Pre-tax Post-tax No SCT, Opex decrease 20%
40
Chart A15
Chart A16
£0
£500
£1,000
£1,500
£2,000
£2,500
0 0.05 0.1 0.15
£m
Chemical EoR (Unrisked)
$110/bbl and 58p/therm NPVs at various real discount rates
Pre-tax Post-tax No SCT
Pre-tax Post-tax No SCT Production increase 20%
Pre-tax Post-tax No SCT, Devex decrease 20%
Pre-tax Post-tax No SCT, Opex decrease 20%
£0
£500
£1,000
£1,500
£2,000
£2,500
0 0.05 0.1 0.15
£m
Miscible Gas EoR $110/bbl and 58p/therm
NPVs at various real discount rates
Pre-tax Post-tax No SCT
Pre-tax Post-tax No SCT Production increase 20%
Pre-tax Post-tax No SCT, Devex decrease 20%
Pre-tax Post-tax No SCT, Opex decrease 20%
41
Chart A17
Chart A18
-£500
£0
£500
£1,000
£1,500
£2,000
£2,500
£3,000
0 0.05 0.1 0.15
£m
Low Salinity $110/bbl and 58p/therm
NPVs at various real discount rates
Pre-tax Post-tax BF £50 on Devex Production increase 20%
Post-tax BF £50 on TC Production increase 20% Post-tax No SCT Production increase 20%
£0
£100
£200
£300
£400
£500
£600
£700
£800
0 0.05 0.1 0.15
£m
Chemical EoR (Risked)
$110/bbl and 58p/therm NPVs at various real discount rates
Pre-tax Post-tax BF £50 on Devex Production increase 20%
Post-tax BF £50 on TC Production increase 20% Post-tax No SCT Production increase 20%
42
Chart A19
Chart A20
£0
£500
£1,000
£1,500
£2,000
£2,500
0 0.05 0.1 0.15
£m
Chemical EoR (Unrisked)
$110/bbl and 58p/therm NPVs at various real discount rates
Pre-tax Post-tax BF £50 on Devex Production increase 20%
Post-tax BF £50 on TC Production increase 20% Post-tax No SCT Production increase 20%
£0
£500
£1,000
£1,500
£2,000
£2,500
0 0.05 0.1 0.15
£m
Miscible Gas EoR $110/bbl and 58p/therm
NPVs at various real discount rates
Pre-tax Post-tax BF £50 on Devex Production increase 20%
Post-tax BF £50 on TC Production increase 20% Post-tax No SCT Production increase 20%
43
Chart A21
Chart A22
-£500
£0
£500
£1,000
£1,500
£2,000
£2,500
0 0.05 0.1 0.15
£m
Low Salinity $110/bbl and 58p/therm
NPVs at various real discount rates
Pre-tax Post-tax BF £50 on Devex, Devex decrease 20%
Post-tax BF £50 on TC, Devex decrease 20% Post-tax No SCT, Devex decrease 20%
£0
£100
£200
£300
£400
£500
£600
0 0.05 0.1 0.15
£m
Chemical EoR (Risked)
$110/bbl and 58p/therm NPVs at various real discount rates
Pre-tax Post-tax BF £50 on Devex, Devex decrease 20%
Post-tax BF £50 on TC, Devex decrease 20% Post-tax No SCT, Devex decrease 20%
44
Chart A23
Chart A24
£0
£200
£400
£600
£800
£1,000
£1,200
£1,400
£1,600
£1,800
0 0.05 0.1 0.15
£m Chemical EoR
(Unrisked) $110/bbl and 58p/therm
NPVs at various real discount rates
Pre-tax Post-tax BF £50 on Devex, Devex decrease 20%
Post-tax BF £50 on TC, Devex decrease 20% Post-tax No SCT, Devex decrease 20%
£0
£200
£400
£600
£800
£1,000
£1,200
£1,400
£1,600
0 0.05 0.1 0.15
£m
Miscible Gas EoR $110/bbl and 58p/therm
NPVs at various real discount rates
Pre-tax Post-tax BF £50 on Devex, Devex decrease 20%
Post-tax BF £50 on TC, Devex decrease 20% Post-tax No SCT, Devex decrease 20%
45
Chart A25
Chart A26
-£500
£0
£500
£1,000
£1,500
£2,000
£2,500
0 0.05 0.1 0.15
£m
Low Salinity $110/bbl and 58p/therm
NPVs at various real discount rates
Pre-tax Post-tax BF £50 on Devex, Opex decrease 20%
Post-tax BF £50 on TC, Opex decrease 20% Post-tax No SCT, Opex decrease 20%
£0
£100
£200
£300
£400
£500
£600
£700
0 0.05 0.1 0.15
£m Chemical EoR
(Risked) $110/bbl and 58p/therm
NPVs at various real discount rates
Pre-tax Post-tax BF £50 on Devex, Opex decrease 20%
Post-tax BF £50 on TC, Opex decrease 20% Post-tax No SCT, Opex decrease 20%
46
Chart A27
Chart A28
£0
£200
£400
£600
£800
£1,000
£1,200
£1,400
£1,600
£1,800
£2,000
0 0.05 0.1 0.15
£m Chemical EoR
(Unrisked) $110/bbl and 58p/therm
NPVs at various real discount rates
Pre-tax Post-tax BF £50 on Devex, Opex decrease 20%
Post-tax BF £50 on TC, Opex decrease 20% Post-tax No SCT, Opex decrease 20%
£0
£200
£400
£600
£800
£1,000
£1,200
£1,400
£1,600
£1,800
0 0.05 0.1 0.15
£m
Miscible Gas EoR $110/bbl and 58p/therm
NPVs at various real discount rates
Pre-tax Post-tax BF £50 on Devex, Opex decrease 20%
Post-tax BF £50 on TC, Opex decrease 20% Post-tax No SCT, Opex decrease 20%