44
The Economics of Recycling Jennie Popp, Ph.D. Agricultural Economist Department of Agricultural Economics and Agribusiness Waste Not Want Not June 14, 2004 West Annex
| Date post: | 25-Dec-2015 |
| Category: |
Documents |
| Upload: | stephen-malcolm-dickerson |
| View: | 214 times |
| Download: | 0 times |

The Economics of Recycling
Jennie Popp, Ph.D.
Agricultural Economist
Department of Agricultural Economics and Agribusiness
Waste Not
Want Not
June 14, 2004
West Annex
Resources for Teaching the Economics of Recycling
1. Recycle City
2. Shrinking a Landfill
3. Project Learning Tree: Recycling and Economics

Recycle Cityhttp://www.epa.gov/recyclecity
Recycling information, like hazardous waste items and the 3 R’s of recycling, is available by clicking on buildings and areas of the city.
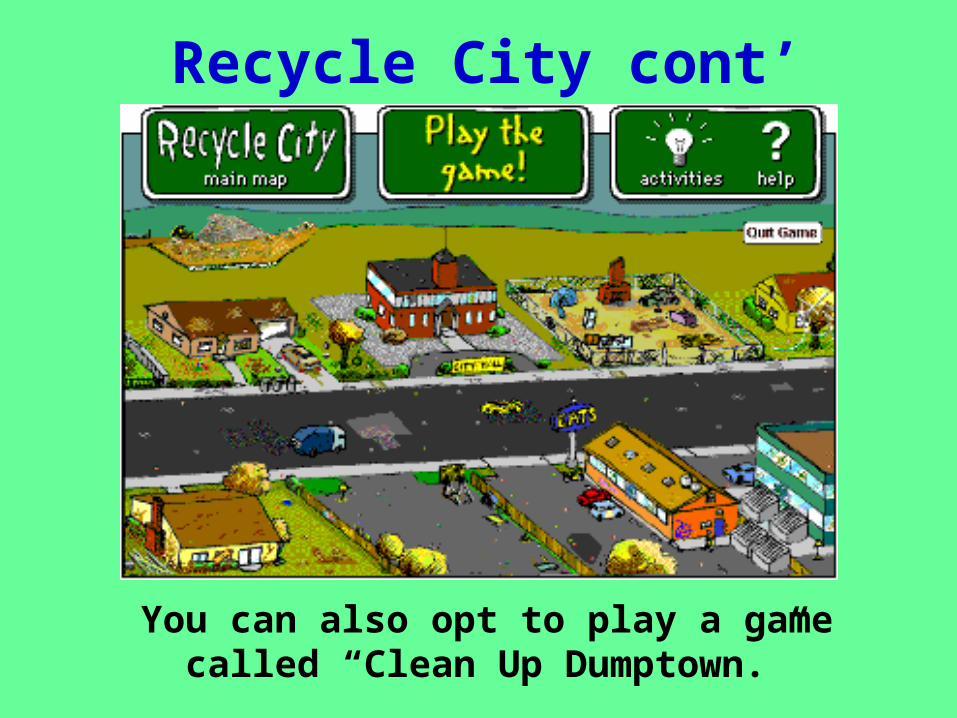
Recycle City cont’
You can also opt to play a game called “Clean Up Dumptown.”

Recycle City cont’
In the game, you’re given choices of various recycling programs. It is up to you to decide which program(s) to implement in the town. You can then see the program’s effect.

Recycle City cont’
You can see all of the waste broken down by category, and how much each category is decreased due to the implemented program.

Recycle City cont’
You can also see the total waste, how much waste has been recovered, and the total cost of the program.
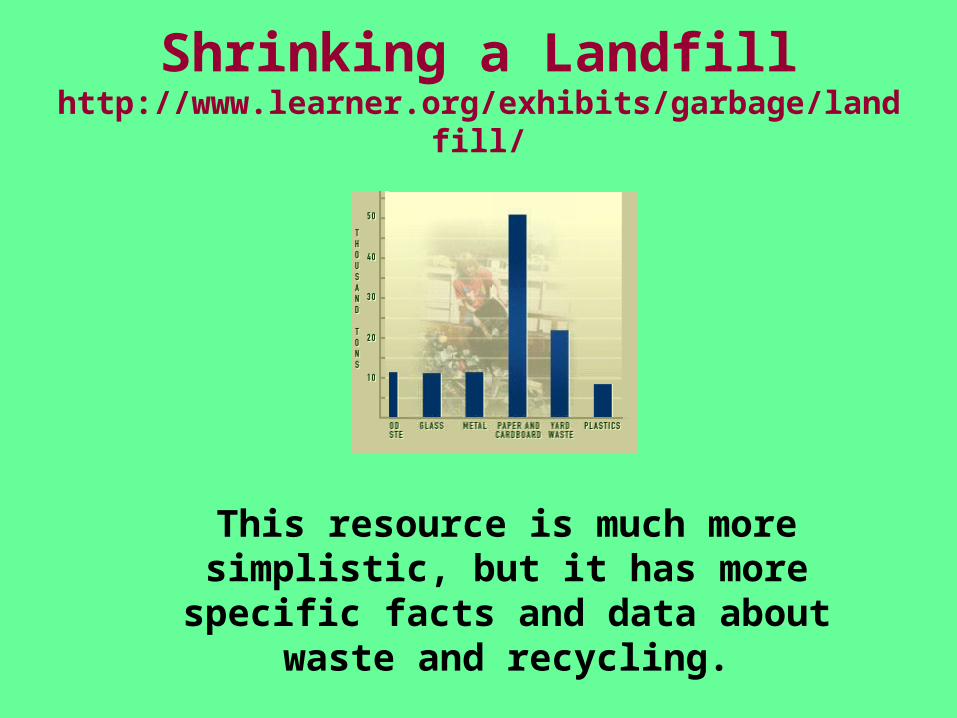
Shrinking a Landfillhttp://www.learner.org/exhibits/garbage/landfill/
This resource is much more
simplistic, but it has more specific facts and data about waste and
recycling.

Shrinking a Landfill cont’
In this game, you must select one of 6 waste categories. By selecting it, you are choosing to instate programs that would affect that category. You start with a budget of $50,000, and the goal is to reduce the most waste without going over budget.
When a category is selected, you are given information about the waste, the programs that can be used to reduce its amount, and the cost.
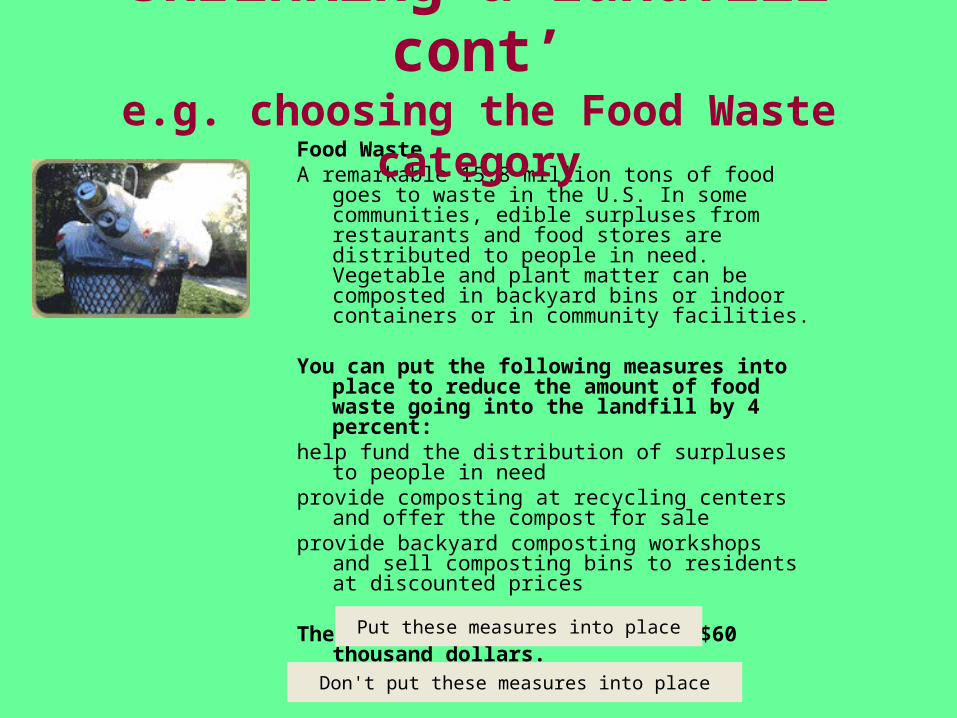
Food WasteA remarkable 15.8 million tons of food goes to waste
in the U.S. In some communities, edible surpluses from restaurants and food stores are distributed to people in need. Vegetable and plant matter can be composted in backyard bins or indoor containers or in community facilities.
You can put the following measures into place to reduce the amount of food waste going into the landfill by 4 percent:
help fund the distribution of surpluses to people in need
provide composting at recycling centers and offer the compost for sale
provide backyard composting workshops and sell composting bins to residents at discounted prices
These measures will cost $40 to $60 thousand dollars.
Shrinking a Landfill cont’e.g. choosing the Food Waste category
Put these measures into place
Don't put these measures into place

Shrinking a Landfill cont’e.g. choosing the Food Waste category
Reduction = 4%Budget Spent = $50000
You are at or over budget, and you haven't met the 10 percent reduction goal.
You can try again or see the optimal result.
Choose another option.

Paper and CardboardNationwide, paper and cardboard account for 41 percent of all municipal solid waste..
You can put the following measures into place to reduce the amount of paper going into the landfill by 13 percent: provide curbside recycling of newspaper and mixed waste paper (cardboard, phone books, magazines, junk mail, office paper, brown bags) recycle the paper left at drop-off recycling dumpsters placed throughout the city allow residents to drop off paper at city recycling centers start a commercial recycling program, offering pickup of recyclable mixed paper from businesses start a school recycling program, offering pickup of recyclable mixed paper from public and private schools These measures will cost $40 to $45 thousand dollars.
Put these measures into place
Don't put these measures into place
Shrinking a Landfill cont’e.g. choosing the Paper category
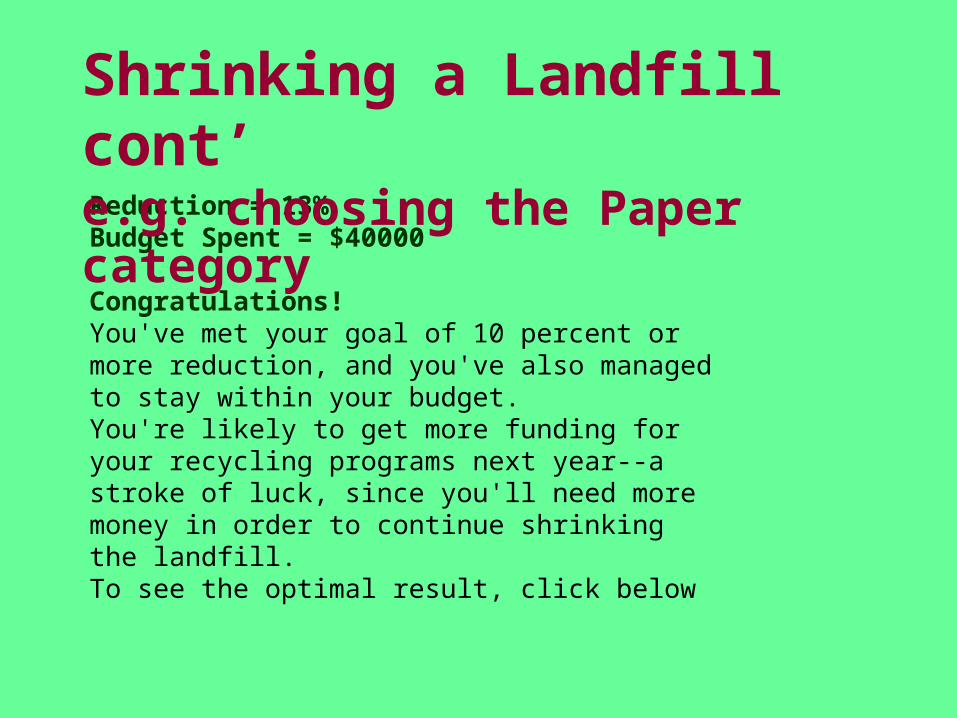
Reduction = 13%Budget Spent = $40000
Congratulations! You've met your goal of 10 percent or more reduction, and you've also managed to stay within your budget. You're likely to get more funding for your recycling programs next year--a stroke of luck, since you'll need more money in order to continue shrinking the landfill. To see the optimal result, click below
Shrinking a Landfill cont’e.g. choosing the Paper category

Shrinking a Landfill -- The Optimal ResultThe chart to the left shows the selections that reduce the landfill by 13.5 percent and stay within the $50,000 budget. Paper and Cardboard 13 percent reduction at a cost of $40,000 Metal 0.3 percent reduction at a cost of $5,000 Plastics 0.2 percent reduction at a cost of $5,000
Shrinking a Landfill cont’e.g. choosing the Paper category

What Recycle City Doesn’t Have
• Defined Goal
The game lacks a goal, but you can develop one of your own to be applied.
What Shrinking the Landfill Lacks
• Glamour

Missing Economics
• Opportunity CostThe costs in the games do not account for things like time and convenience. One program may cost less but be more difficult in implementation due to a greater amount of time that has to be spent on it.
• ExternalitiesThe unintended effects of NOT implementing recycling programs are not given.
• Basic Supply and DemandThe games don’t account for what will happen when there is no consumer or commercial demand or supply for recycled products or materials. The estimated costs given, therefore, are inaccurate.

Project Learning Tree: Recycling and Economics
This resource explains economic principles and how those are used in waste
management. It also contains graphs and tables to support these principles.
Questions and activities to expound on this information are also included.

“Closing the Loop”
• Collection– Consistent supply of recyclable materials
• Processing– Commercial demand for recycled materials
• Consumer Purchasing– Consumer demand for products made from recycled
materials
For a recycling program to be successful, consumer demand is necessary.
Without it, materials can only be collected, not actually recycled and reused!
Supply and Demand Included

Teaching Supply and DemandSupply and Demand Curves for Recycled
Newspaper
05
101520253035
0 5 15 30 45 60 75 90
quantity in tons
pri
ce
in d
olla
rs
Supply
Demand
1. Supply increases as price does, and also decreases as price does.
2. Demand increases as price decreases, and decreases as price increases.
3. If demand is greater than supply, the price will increase.

Exercises for Students
• There is plenty to do with students. Book comes with statistics.
• The following show updated statistics, compliments of Mr. Stephan Pollard.

Paper and Paperboard Recovery
0
10
20
30
40
50
60
91 92 93 94 95 96 19 98 99 00 01 02
Year
mil
lio
n t
on
s (Y
1)
0%
10%
20%
30%
40%
50%
60%
per
cen
t (Y
2)
recovered (Y1) recovery rate* (Y2)
Source: American Forest and Paper Association, Recovered Paper Statistical Highlights (Washington, DC: AF&PA, 2003
Market forces, economics, collection potential, and citizen participation influence materials recovery in MSW (municipal solid waste) management.

GENERATION AND RECOVERY OF MATERIALS IN MUNICIPAL SOLID WASTE, 2001
(In millions of tons and percent of generation of each material)
Weight Generated Weight RecoveredRecovery as a Percent
of Generation
Paper and paperboard 81.9 36.7 44.9%
Glass 12.6 2.4 19.1%
Metals
Steel 13.5 4.6 33.8%
Aluminum 3.2 0.8 24.5%
Other nonferrous metals* 1.4 0.9 64.8%
Total metals 18.1 6.3 34.5%
Plastics 25.4 1.4 5.5%
Rubber and leather 6.5 1.1 17.4%
Textiles 9.8 1.4 14.6%
Wood 13.2 1.3 9.5%
Other materials 4.2 0.9 20.7%
Total Materials in Products 171.5 51.4 30.0%
Other wastes
Food, other** 26.2 0.7 2.8%
Yard trimmings 28.0 15.8 56.5%
Miscellaneous inorganic wastes 3.5 Neg. Neg.
Total Other Wastes 57.7 16.6 28.7%
TOTAL MUNICIPAL SOLID WASTE 229.2 68.0 29.7%
Includes waste from residential, commercial, and institutional sources* Includes lead from lead-acid batteries.** Includes recovery of other MSW organics for composting.
Neg. = Less than 5,000 tons or 0.05 percent.
Source: US EPA, Municipal Solid Waste in The United States: 2001 Facts and Figures, EPA530-R03-011 citing Franklin Associates, Lt.

Other Updates for Exercises• Page 42: Last Sentence• For example, in 2002 approximately 92 billion aluminum cans
were produced in the United States, 48.4 percent of which were recycled (Mindfully.org, 2003)
• • Page 43: Second full sentence• In 2001, the U.S. paper recovery rate reached an all-time high
of 48.3 percent (American Forest and Paper Association, 2003).
• • Page 49: Third column first partial sentence• ...shows the population and solid waste generation for a 41-
year period.• • Page 50: Second column - first question mark
Other Updates for Exercises
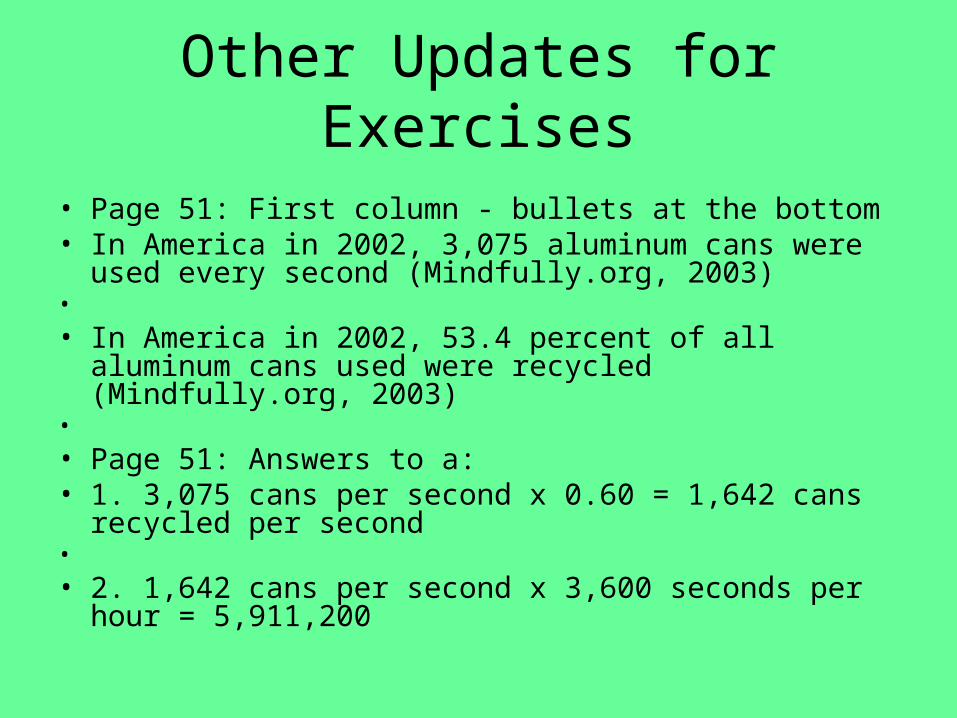
• Page 51: First column - bullets at the bottom• In America in 2002, 3,075 aluminum cans were used
every second (Mindfully.org, 2003)• • In America in 2002, 53.4 percent of all aluminum cans
used were recycled (Mindfully.org, 2003)• • Page 51: Answers to a:• 1. 3,075 cans per second x 0.60 = 1,642 cans recycled
per second• • 2. 1,642 cans per second x 3,600 seconds per hour =
5,911,200

Other Updates for Exercises
• 3. 3,075 cans per second x 3,600 seconds per hour = 11,070,000
•
• 4. 11,070,000 cans per hour x 24 hours per day = 265,680,000 cans used per day
•
• 5. 265,680,000 cans per day x 0.466 = 123,806,880 cans not recycled per day

What is Still Lacking?
• Analysis of All Types of Benefits and Costs of recycling
• Most analyses focus in on measurable (market) benefits and costs– Costs – associated with running program– Benefits – associated with revenues from
selling recyclables
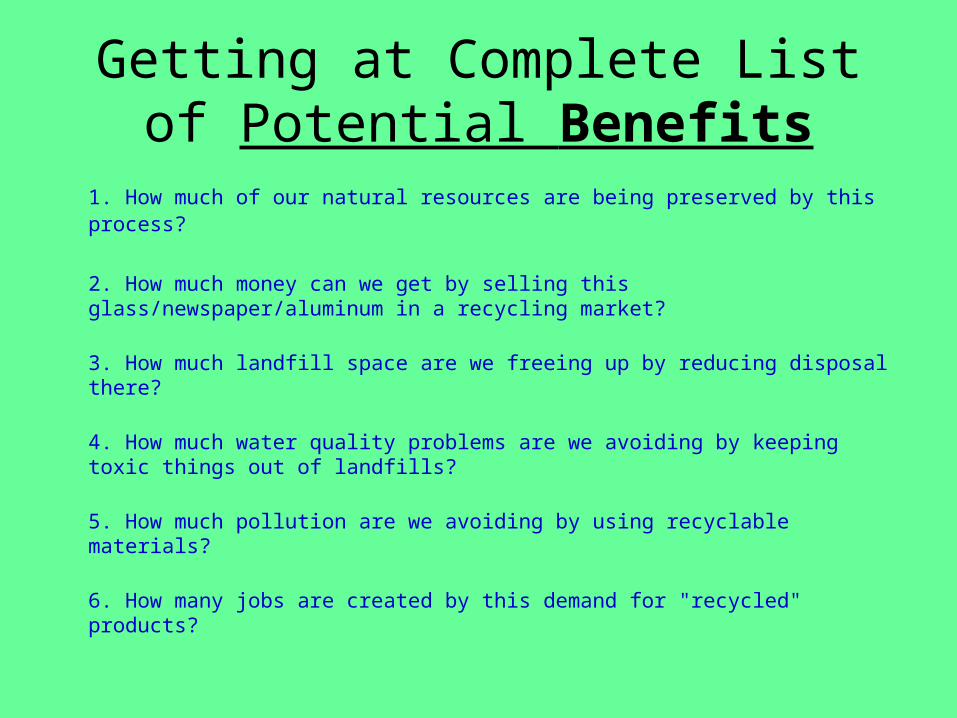
Getting at Complete List of Potential Benefits
1. How much of our natural resources are being preserved by this process?
2. How much money can we get by selling this glass/newspaper/aluminum in a recycling market?
3. How much landfill space are we freeing up by reducing disposal there?
4. How much water quality problems are we avoiding by keeping toxic things out of landfills?
5. How much pollution are we avoiding by using recyclable materials?
6. How many jobs are created by this demand for "recycled" products?
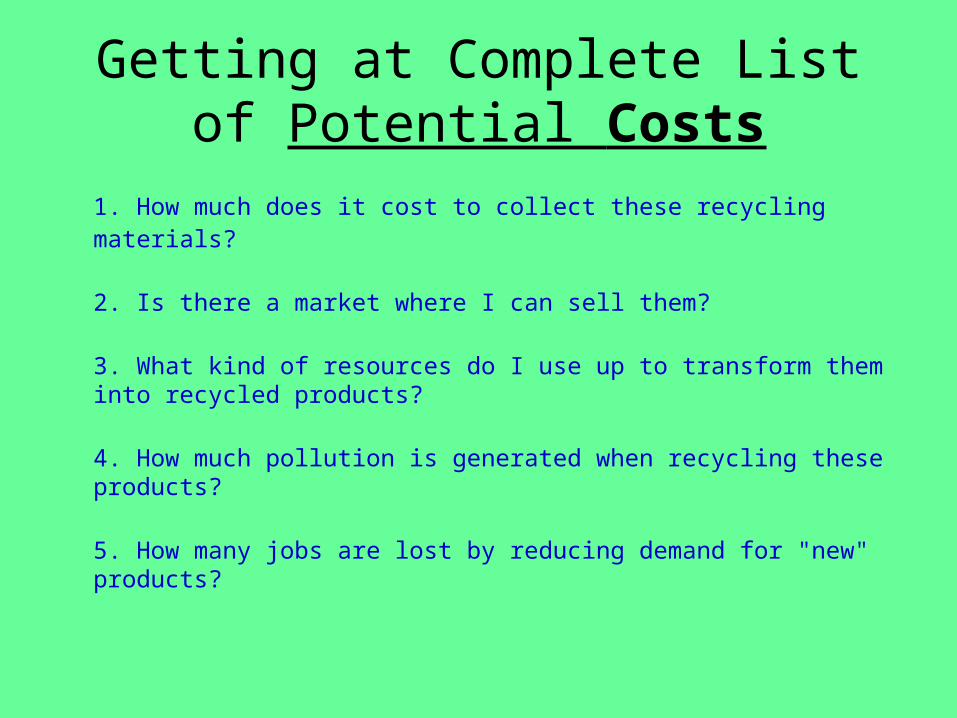
Getting at Complete List of Potential Costs
1. How much does it cost to collect these recycling materials?
2. Is there a market where I can sell them?
3. What kind of resources do I use up to transform them into recycled products?
4. How much pollution is generated when recycling these products?
5. How many jobs are lost by reducing demand for "new" products?

How Does This Affect Supply and Demand?
Using only Direct Market Benefits and Costs
If we only look at how much it costs to run the program and how much money we get from selling the recycled products we find we should recycle Q amount for P price
P
Q Tons recycled
$

How Does This Affect Supply and Demand?
Finding Other Positive Benefits to Recycling
If other positive benefits exist we should recycle more and be willing to pay more for those recycled products
P
Q
PB
QB Tons recycled
$

Same Idea in Another Way
• Suppose it costs the City of Fayetteville $30,000 to run the recycling program and they receive $20,000 in revenue from the sale of recovered materials, is it fair to say that the costs of recycling outweigh the benefits of recycling ?
• Likely not. Can’t answer the question until you have looked at all the costs and all of the benefits.
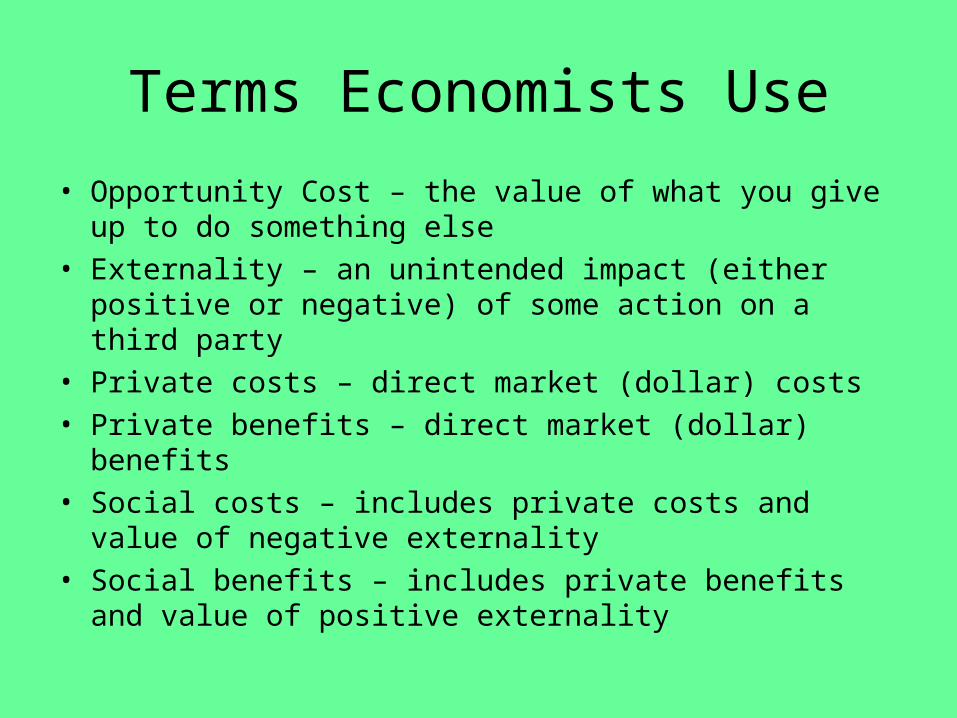
Terms Economists Use
• Opportunity Cost – the value of what you give up to do something else
• Externality – an unintended impact (either positive or negative) of some action on a third party
• Private costs – direct market (dollar) costs• Private benefits – direct market (dollar) benefits• Social costs – includes private costs and value of
negative externality• Social benefits – includes private benefits and value of
positive externality

The Way An Economist Values a Recycling Program
• Look at complete value of social costs and social benefits to determine optimum amount of recycling
• Answer is most likely not– Must recycle everything– Must recycle nothing– Answer will vary from situation to situation

Aluminum Recycling• Recycling aluminum uses 95% less energy than making it from raw
ore, creates 95% less air pollution and 97% less water pollution • Recycling 1 kg of aluminum saves 8 kg of bauxite, 4 kg of chemical
products and 14 kWh of electricity. • Recycling 1 aluminum can saves enough energy to run a 100-Watt
bulb for 20 hours; a computer for 3 hours; or a TV for 2 hours • SAS Airlines collect enough aluminum drink cans off flights in a year
to make of the metal needed to build a new McDonnell Douglas MD-90
• The production of 1 tonne of primary of aluminum consumes 14.000 kWh. This is as much as the annual average electricity consumption of an household during 4 years.
• In comparison, producing 1 tonne of secondary aluminium only consumes 700kWh.
• source: http://www.acrr.org/resourcities/recycling/recycling_did.htm#menu1
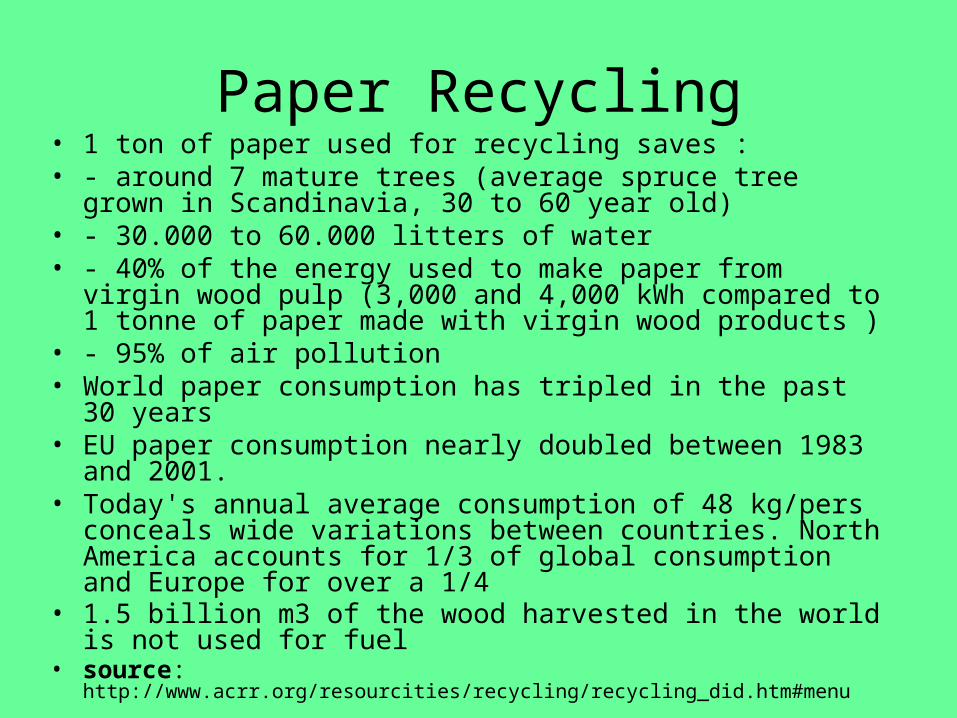
Paper Recycling• 1 ton of paper used for recycling saves : • - around 7 mature trees (average spruce tree grown in
Scandinavia, 30 to 60 year old) • - 30.000 to 60.000 litters of water • - 40% of the energy used to make paper from virgin wood
pulp (3,000 and 4,000 kWh compared to 1 tonne of paper made with virgin wood products )
• - 95% of air pollution • World paper consumption has tripled in the past 30 years • EU paper consumption nearly doubled between 1983 and
2001. • Today's annual average consumption of 48 kg/pers conceals
wide variations between countries. North America accounts for 1/3 of global consumption and Europe for over a 1/4
• 1.5 billion m3 of the wood harvested in the world is not used for fuel
• source: http://www.acrr.org/resourcities/recycling/recycling_did.htm#menu

Energy Savings• 1/3 of this wood is used to make paper and paper board i.e.
Total wood consumption for making paper: 709 million m3 • Newspapers, magazines and written advertising = nearly
50% of domestic paper waste production. • Paper waste collection rate in 2000 in Europe ranged
between 18% (Italy) and 70% (Germany) • If every country recycled as much as Germany does, nearly
1/3 less wood would be needed worldwide to produce paper.
• Another argument in favour of waste paper recycling is that more wood remains in the forest and, as a consequence, the potential of natural area -the portion of woodland that can develop independent of human interference- increases.
• source: http://www.acrr.org/resourcities/recycling/recycling_did.htm#menu1

Glass Recycling
• Recycling glass 1 tonne of cullet (glass to be recycled) saves 1.2 tons of virgin raw materials: sand, limestone and soda ash.
• The energy saving from recycling one bottle will: * Power a 100 watt light bulb for 1 to 4 hours * Power a computer for 25 minutes * Power a colour TV for 20 minutes * Power a washing machine for 10 minutes Recycling 1 container of glass saves enough energy to light a 100 Watt bulb for 4 hours.
source: http://www.acrr.org/resourcities/recycling/recycling_did.htm#menu1
-Sources of More Info
• EPA Student Center: Waste and Recycling
http://www.epa.gov/students/waste.htm• Econ Ed Link: The Economics of Recycling
http://www.econedlink.org/lessons/index.cfm?lesson=EM218
• Biodegredation of Newspapers
http://www.forester.net/msw_0103_beyond.html• Newspaper Use/Recycling Facts
http://wasteage.com/mag/waste_profiles_garbage_newspaper/

-Sources of More Info
• EPA Source Reduction and Recycling
http://www.epa.gov/epaoswer/non- hw/muncpl/ghg/chapter4.pdf
• Energy Savings from Recycling
http://www.bagelhole.org/article.php/Miscellaneous/340/
http://www.acrr.org/resourcities/recycling/recycling_did.htm#menu1
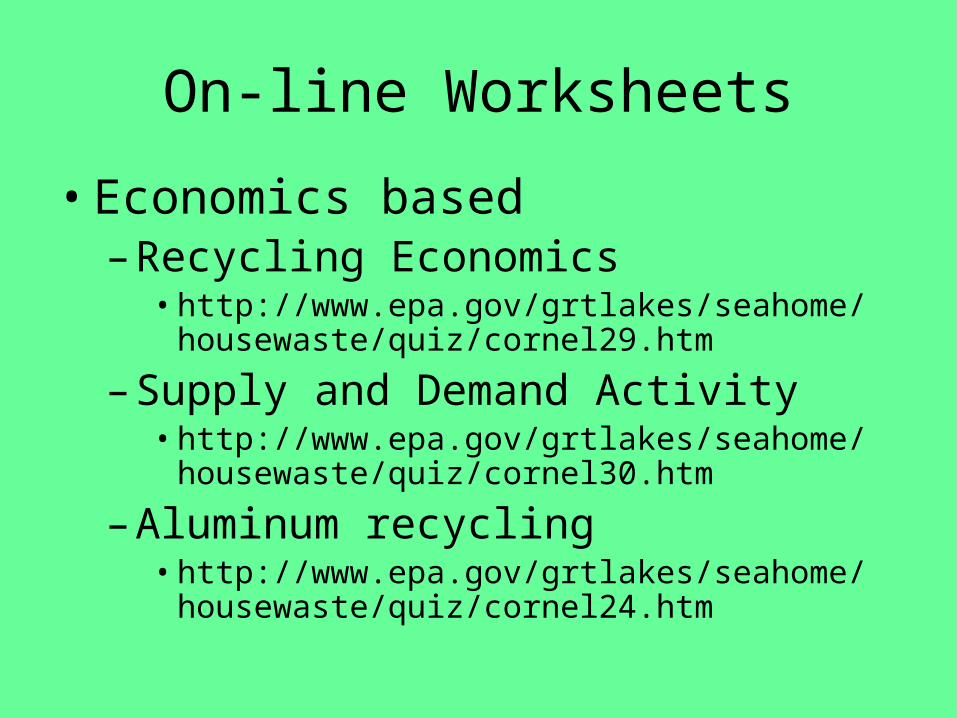
On-line Worksheets
• Economics based– Recycling Economics
• http://www.epa.gov/grtlakes/seahome/housewaste/quiz/cornel29.htm
– Supply and Demand Activity• http://www.epa.gov/grtlakes/seahome/
housewaste/quiz/cornel30.htm
– Aluminum recycling• http://www.epa.gov/grtlakes/seahome/
housewaste/quiz/cornel24.htm

On-Line Worksheets
• Recycling based– Disposal Options Crossword
• http://www.epa.gov/grtlakes/seahome/housewaste/quiz/cross1.htm
– Mix and Match Waste Game• http://www.epa.gov/grtlakes/seahome/housewaste/quiz/cornel20.htm
– Trash Trivia Quiz 1• http://www.epa.gov/grtlakes/seahome/housewaste/quiz/cornl22a.htm
– Trash Trivia Quiz 2• http://www.epa.gov/grtlakes/seahome/housewaste/quiz/cornl22b.htm

For More Information
Jennie Popp, Ph.D.Dept of Agricultural Economics and Agribusiness217 Agriculture BuildingUniversity of ArkansasFayetteville, AR [email protected]
Thank You!


