Policy Research Working Paper 5341 e Economy-wide Effects of Further Trade Reforms in Tunisia’s Services Sectors Philippa Dee Ndiamé Diop e World Bank Middle East and North Africa Region Social and Economic Development Department June 2010 WPS5341 Public Disclosure Authorized Public Disclosure Authorized Public Disclosure Authorized Public Disclosure Authorized
Transcript
Policy Research Working Paper 5341
The Economy-wide Effects of Further Trade Reforms in Tunisia’s Services Sectors
Philippa DeeNdiamé Diop
The World BankMiddle East and North Africa RegionSocial and Economic Development DepartmentJune 2010
WPS5341P
ublic
Dis
clos
ure
Aut
horiz
edP
ublic
Dis
clos
ure
Aut
horiz
edP
ublic
Dis
clos
ure
Aut
horiz
edP
ublic
Dis
clos
ure
Aut
horiz
ed
Produced by the Research Support Team
Abstract
The Policy Research Working Paper Series disseminates the findings of work in progress to encourage the exchange of ideas about development issues. An objective of the series is to get the findings out quickly, even if the presentations are less than fully polished. The papers carry the names of the authors and should be cited accordingly. The findings, interpretations, and conclusions expressed in this paper are entirely those of the authors. They do not necessarily represent the views of the International Bank for Reconstruction and Development/World Bank and its affiliated organizations, or those of the Executive Directors of the World Bank or the governments they represent.
Policy Research Working Paper 5341
The purpose of this paper is to benchmark Tunisia against other emerging economies in terms of the regulatory barriers affecting particular services sectors, and to assess the economy-wide effects of further liberalizing these services trade restrictions, compared with reducing the dispersion in barriers to its merchandise trade. On the basis of a rather restricted sample of services sectors, partial regulatory reform would yield gains roughly equivalent to full unilateral reform of manufacturing tariffs, but roughly one-tenth the gains from full bilateral
This paper—a product of the Social and Economic Development Department, Middle East and North Africa Region—is part of a larger effort in the department to assist countries of the region devise strategies for integrating services sectors to the global economy. Policy Research Working Papers are also posted on the Web at http://econ.worldbank.org. The author may be contacted at [email protected].
reform of border protection in agriculture with the European Union. The adjustment costs associated with these services trade reforms would be minimal. The paper identifies the reasons why the gains from these services reforms are relatively small, and argues that a wider set of reforms could provide win-win outcomes and even fewer adjustment costs. By contrast, the gains in agriculture and manufacturing tend to come at the expense of domestic output in the reforming sectors—the gains are greater, but so too are the adjustment costs.
The Economy-wide Effects of Further Trade Reforms in Tunisia’s Services Sectors*
Adjunct Associate Professor, Crawford School of Economics and Government, The Australian National University, [email protected]. ¥ Senior Country Economist for Tunisia (MNSED, MENA Region), World Bank, [email protected]. The World Bank, 1818 H street, NW, Washington DC.
2
1. Introduction
Tunisia has been one of the best performers in the Middle East and North Africa region since the mid-1990s, when it accelerated market-oriented reforms. Economic growth reached an average 5 percent in 1996-2007, despite many external shocks. As a result, the poverty incidence dropped to about 7 percent in 2007 (World Bank Global Poverty numbers 2008). Nevertheless, because of its strong trade ties with Europe, Tunisia’s real sector was affected by the global financial crisis through Europe’s 2009 recession. As a result of a sharp decline in exports (-12 percent in real terms), GDP growth was only half of what was predicted (3 percent against an expected 6 percent).
Tunisia’s global integration policies can be traced back to 1971, when the country decided to create an offshore sector in order to reduce the anti-export bias inherent in the heavy protection of the economy. The offshore sector provided generous fiscal and financial incentives to exporters and triggered a rapid rise in foreign direct investment (FDI) and the birth of a large labour-intensive textile industry integrated vertically with the EU’s production networks. This heterodox trade policy stance — similar to the ones also applied at different points in time by Japan, Korea, Malaysia, and Mauritius — led to the first wave of diversification away from hydrocarbons. However, overall productivity growth was heavily constrained by the high level of protection of the economy.
A decisive step toward liberalizing trade occurred in the middle of the 1990s. As part of the Tunisia-EU Association Agreement (AA), trade protection vis-à-vis the EU was scheduled for gradual and systematic dismantling, starting in 1996. As a result, tariffs on industrial goods imported from the EU (the source of 65 percent of Tunisia’s imports), went from about 100 percent in 1996 to 0 percent in January 2008. World Bank (2008) shows that Tunisia’s industrial sectors that are highly integrated to the global market have been able to attract investment, converge to EU’s labor productivity standards, and boost job creation. In sharp contrast, in the services sector where many entry and competition barriers remain, convergence to EU labor productivity standards is slow.
Tunisia is now preparing to embark on bolder services liberalization. The sector currently provides 59 percent of GDP and absorbs 55 percent of employment. So far, the country has no free trade agreement (FTA) that includes services. Its multilateral liberalization of services under WTO’s General Agreement on Trade in Services (GATS) has been very limited. Tunisia included only three sectors (tourism, telecommunications and financial services) in its GATS Uruguay Round commitments. While some of its sectors not included are quite open (e.g. maritime transport), entry into many other services sectors is restricted. Under the Uruguay Round, Tunisia bound without limitation many cross-border (mode 1) transactions (e.g. in the financial sector), but in reality, those GATS measures overlap with strict foreign exchange controls, making them partly ineffective. Apart from the financing of current operations, opportunities for cross-border (mode 1) trade are sharply restricted, and foreign competition is mostly possible through commercial presence (mode 3) or through the presence of natural persons (mode 4). But the measures affecting the presence of natural persons (mode 4) remain unbound, with
3
the exception of wholly exporting enterprises that can recruit up to four executives and managers of foreign nationality.
It is not clear whether Tunisia will significantly increase its commitments at the end of the ongoing Doha Round. In its conditional Doha offer of 2005, Tunisia maintained some restrictive horizontal commitments. For instance, freedom of investment would be guaranteed only to ‘wholly exporting’ firms and a nationality condition would be attached to the exercise of commercial activities (whole and retail trade) in Tunisia. In terms of sectoral coverage, five sectors were included in the conditional offer (out of eleven possible): telecommunications, environmental services, financial services, health services and tourism and travel.1 In a recent unilateral move, however, a new global telecom license (fixed, mobile and VSAT) has been granted to a new operator that started operations in April 2010.
Tunisia started a process of negotiations for a services trade agreement with the EU in March 2006 in the Euro-Med context. Discussions on the general provisions of the agreements have started. These will be followed by bilateral negotiations on market access commitments. For Tunisia, mode 4 (temporary movement of professional services providers) and mode 2 in the area of health services represent two big areas of interest. These negotiations are crucial to secure better market access for its services providers to Europe, which would require a relaxing of restrictions in obtaining visas and mutual recognition agreements for diplomas and professional qualifications with some EU countries.
To our knowledge, the only quantitative analysis of the impact of services trade liberalization for Tunisia is Konan and Maskus (2006). An earlier quantitative analysis of potential impacts of Tunisia-EU Association Agreement by Brown et al. (1997) did not include services sectors. Konan and Maskus used a computable general equilibrium model with multiple products, services and trading partners and found that reducing services barriers would generate relatively large welfare gains and low adjustment costs. However, their benchmark data and Social Accounting Matrix are dated 1995, which no longer reflect the current situation. Moreover, a strong assumption made in their paper is that barriers to foreign direct investment were half rent-creating and half cost-escalating. As is well-known, the results of reform simulations are very sensitive to those assumptions. In the current paper, the treatment of barriers is based on empirical evidence, where available, rather than assumption.
The purpose of this paper is to: (i) benchmark Tunisia against other emerging economies in terms of the regulatory barriers affecting its services trade; (ii) assess the economy-wide effects of further liberalizing services trade restrictions in particular sectors, either regionally or unilaterally; (iii) compare this with the effects of further liberalizing Tunisia’s agricultural and manufacturing trade in the context of its Association
1 Environment services relate to the management of solid waste, dangerous waste and sanitation. Foreign firms can enter the market but face a majority holding restriction (they can own up to 49 per cent of the capital) and they should agree to transfer technologies, recruit local staff and train staff locally. In the health sector, establishment is free without limit imposed on the capital for a list of medical fields where Tunisia has an export potential.
4
Agreement with the EU; and (iv) also contrast this with the effects of bringing its MFN tariff rates on manufacturing goods closer to EU preferential rates. These comparisons give important insights into Tunisia’s trade policy priorities over the next few years.
2. Methodological approach to measuring services trade barriers
Barriers in services trade vary by sector and a sector-by-sector analysis is needed to identify policy restrictions to entry and competition in services. The analytical framework that has been used to measure services trade barriers comprises three stages.
The first stage is to collect qualitative information about regulatory restrictions affecting services delivery, and to convert it into a quantitative index (or indexes), using weights that reflect the relative severity of the different restrictions. Sometimes the weights are based on a priori judgements drawn from detailed knowledge of the industry concerned. Sometimes the weights are derived using statistical techniques, giving greatest weight to restrictions that have the greatest variability within the sample. Studies along these lines include the OECD studies of product market regulation (OECD 2005a, 2005b, Conway, Janod and Nicoletti 2005), Findlay and Warren (2000), Kalirajan (2000), Kalirajan et al. (2000), Nguyen-Hong (2000), Doove et al. (2001), Copenhagen Economics (2005) and OECD (2005c).
Since services trade barriers typically operate behind the border, the second stage is to quantify the effects of these indexes of services trade barriers on some behind-the-border measure of economic performance — often prices or price-cost margins, but sometimes quantities or costs — while controlling for all the other factors that affect economic performance in that market. These econometric results are used to construct the counterfactual — what economic performance would be in the absence of the services trade restrictions, holding all other factors constant.
This does not give a ‘tariff equivalent’, because the ‘tariff equivalent’ concept (a) assumes services are traded primarily cross-border, whereas most are traded behind the border via the movement of people or capital, and (b) assumes that domestic and foreign services are perfect substitutes, whereas most are highly differentiated to particular users. Instead, the counterfactual comparison gives a behind-the-border ‘tax equivalent’, if the restrictions have raised price-cost margins, or a behind-the-border ‘productivity equivalent’, if the restrictions have raised real resource costs. Econometric studies along these lines include Findlay and Warren (2000), Gonenc and Nicoletti (2000), Steiner (2000), Kalirajan (2000), Nguyen-Hong (2000), Barth, Caprio and Levine (2004), Clark, Dollar and Micco (2004) and OECD (2005c).
In the third stage, the ‘tax equivalents’ or ‘productivity equivalents’ are entered into a computable general equilibrium model, which is then used to project the direct and indirect effects of services trade liberalization for each sector and for the economy as a whole. Examples include Dee and Hanslow (2001), Dee, Hanslow and Phamduc (2003), OECD (2004) and Copenhagen Economics (2005).
5
This study benchmarks Tunisia against a range of other emerging countries using index measures of services trade barriers derived from the first stage. The index measures are somewhat arbitrary — it is the econometrics in the second stage that establishes the true economic significance of the barriers. However, the index measures bear a monotonic relationship to the tax or productivity equivalent measures, and there are more of the former available than the latter. So for benchmarking purposes, the arbitrariness of the index measures is not a drawback.
3. Benchmarking Tunisia on services restrictiveness
This section benchmarks Tunisia against emerging and high-income countries for which restrictiveness indices, calculated consistently, exist. We consider seven key services sectors — postal services, telecommunications, air passenger transport, the accounting, legal and engineering professions, and banking. Tourism and maritime services sectors, two important sectors in Tunisia, are not covered because they are traditionally open to trade and investment with no significant barriers. One important sector not included is distribution. Entry into the distribution sector is strictly regulated and trading activities, including wholesale distribution and retail trading services, are reserved for enterprises in which Tunisians hold a majority interest. Table 1 shows the importance of the different services sectors in Tunisia’s economy (where the professional services are included in ‘Other business services’ and banking is included in ‘Other financial services’).
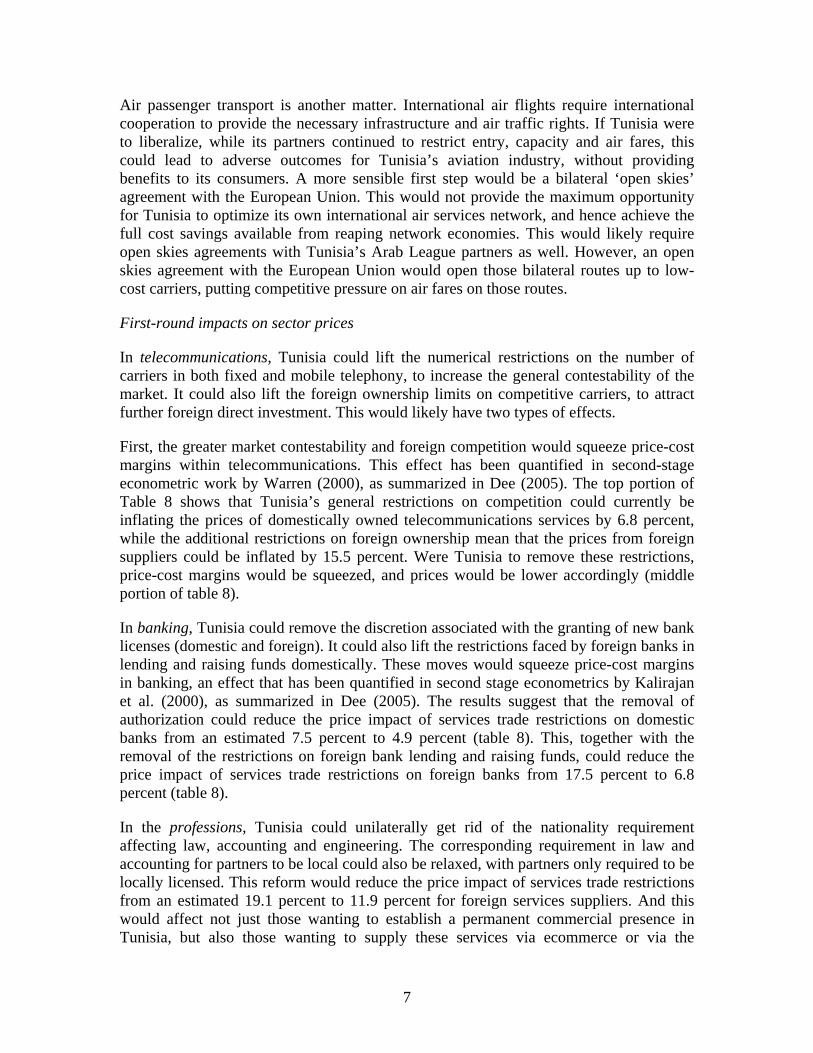
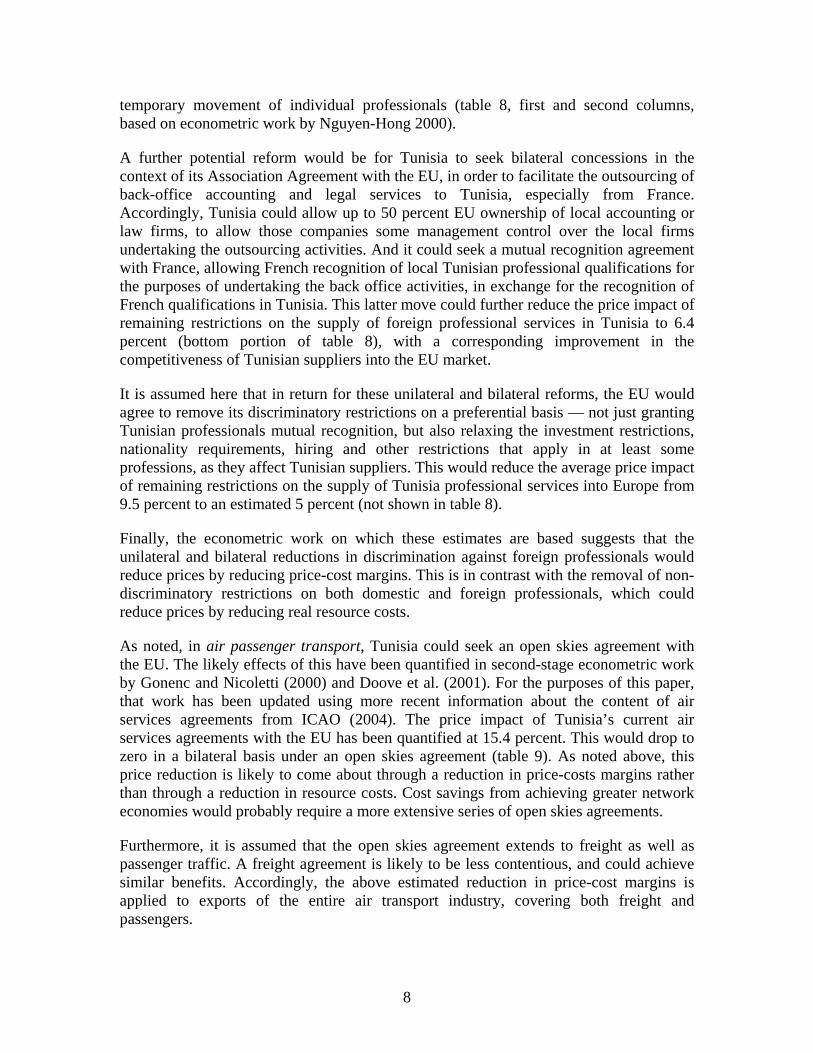
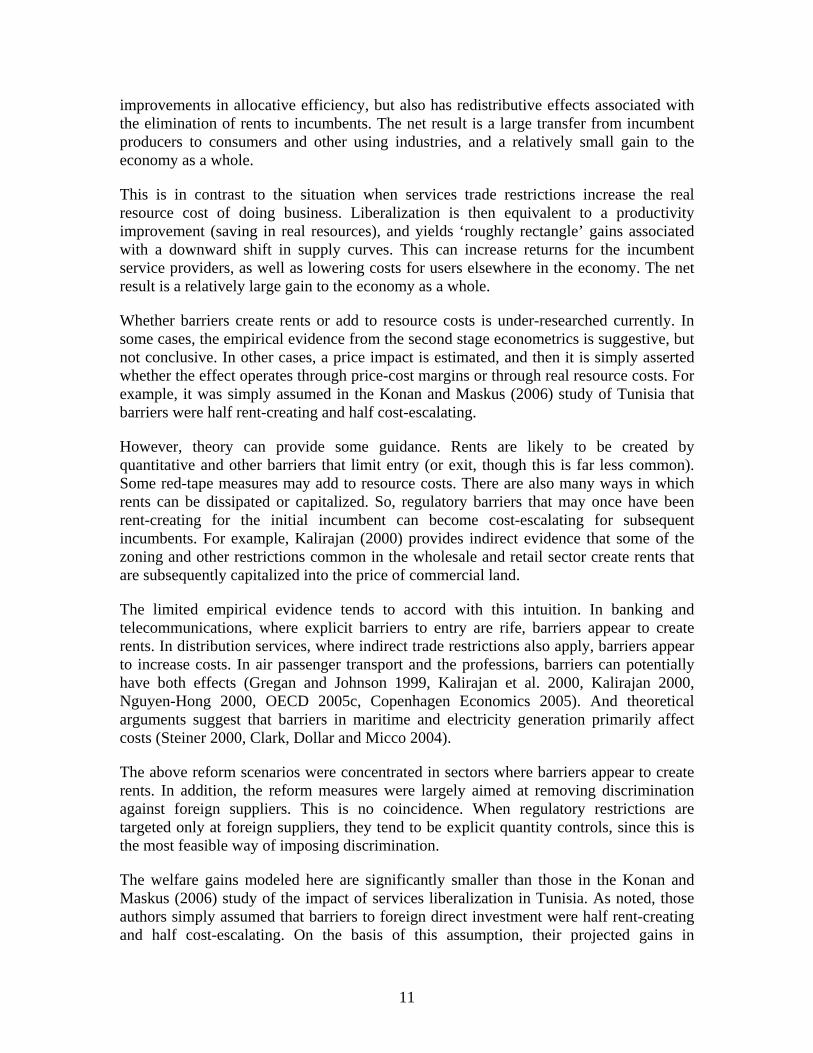
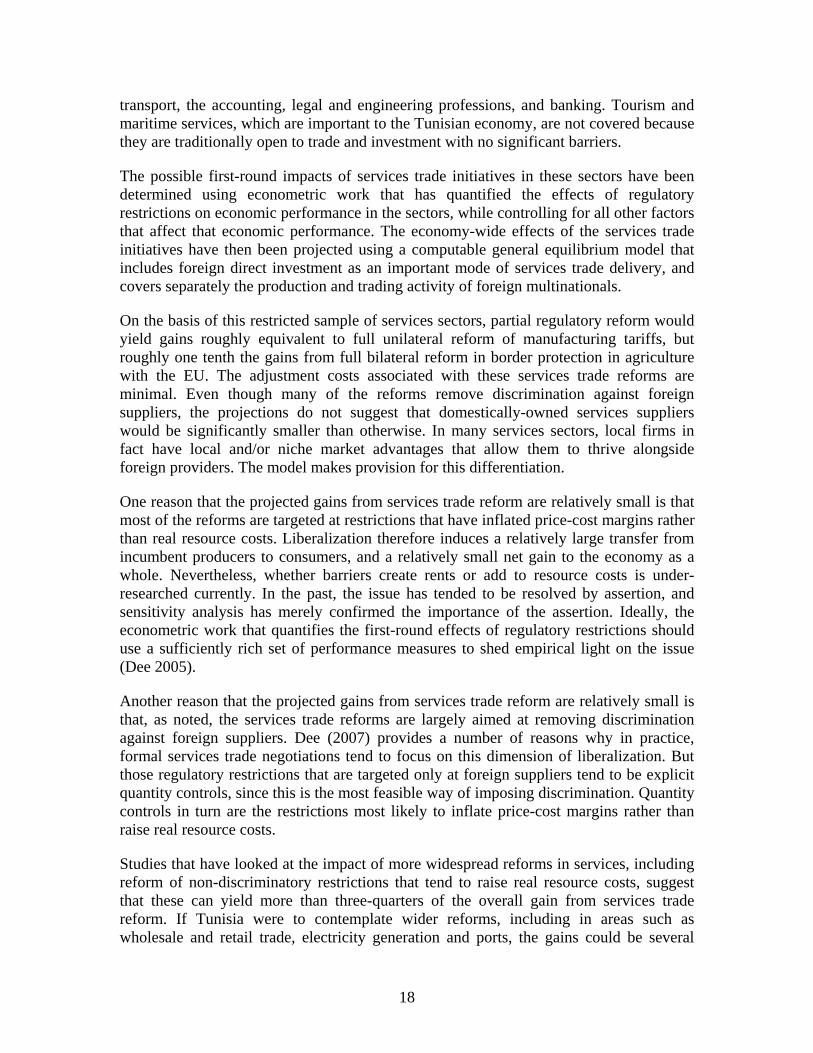
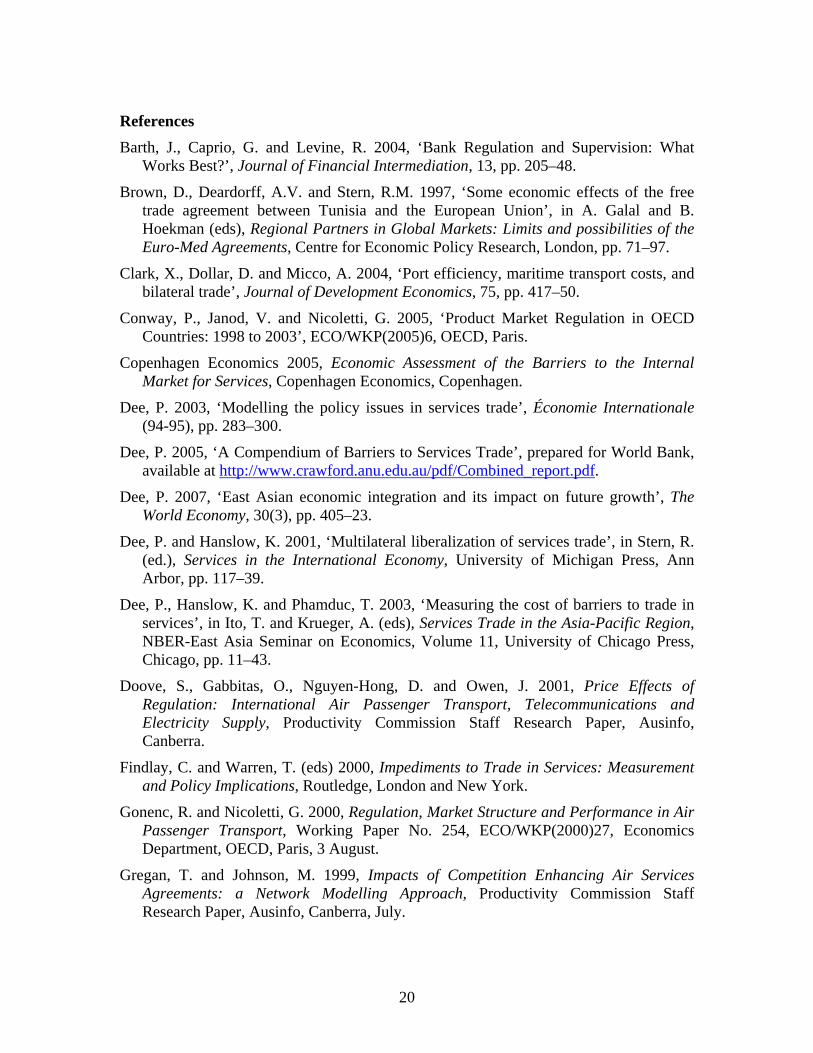
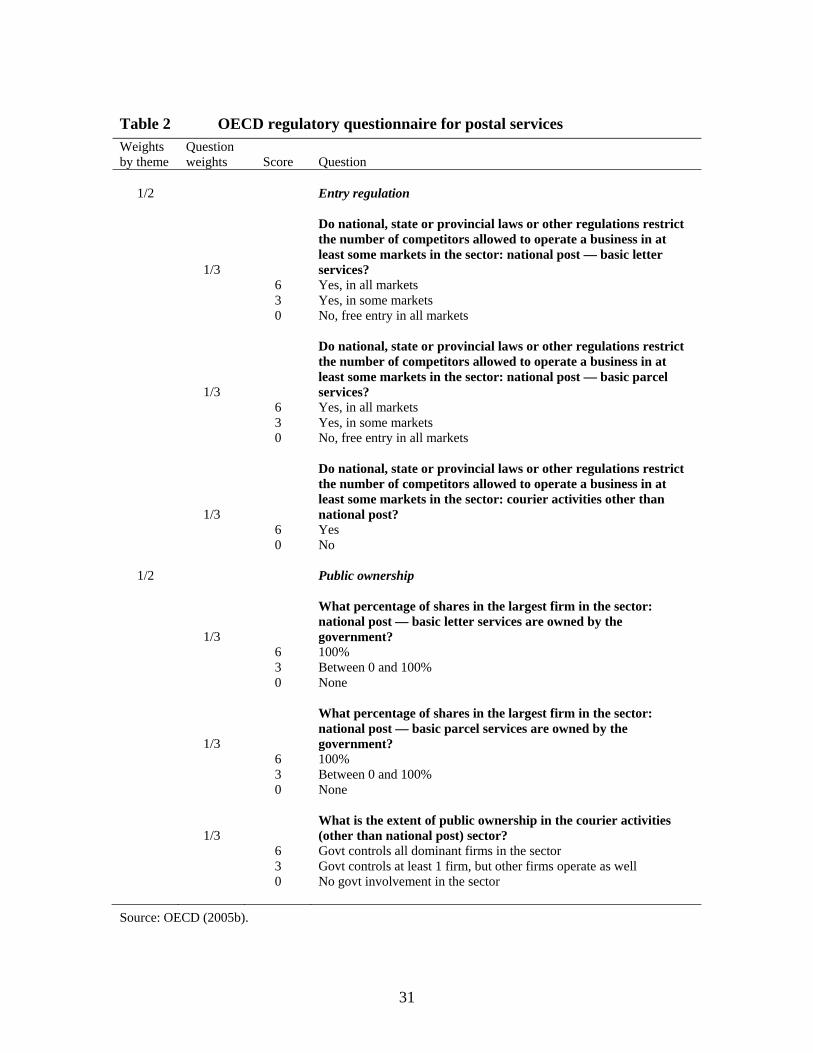
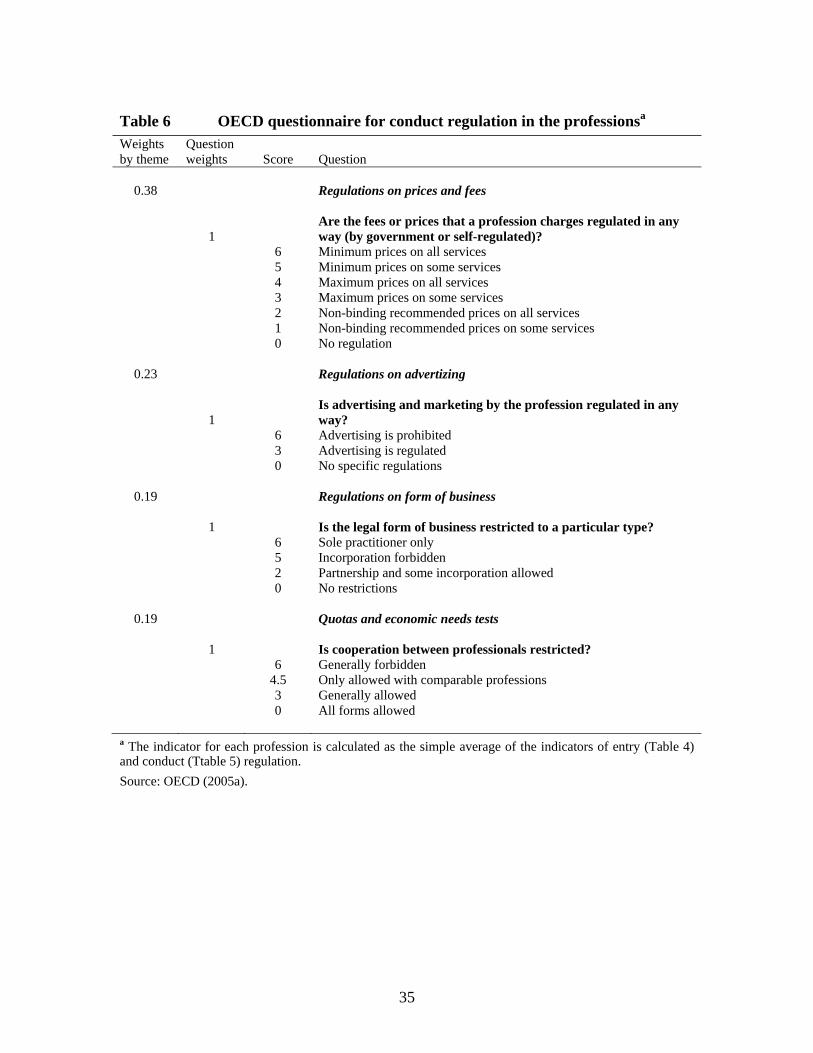
As noted, one rich source of index measures is the OECD studies of product market regulation (OECD 2005a, 2005b). Figures 1 to 6 show how Tunisia compares against the worst performing developed and emerging countries in the OECD sample in six key services sectors of interest. The scoring is based on answers to the questions shown in Tables 2-6. The OECD questionnaires collect and score information about a range of regulatory restrictions, but do not distinguish whether the restrictions only affect foreign operators, or also affect domestic players.
Tunisia scores particularly poorly in postal services because it is one of the few countries in the world to retain restrictions on courier services — private operators are required to operate in partnership with Rapid Poste. Tunisia’s restrictions are second only to Turkey’s in telecommunications, largely because it still has a monopoly in fixed line telecommunications and a duopoly in mobile telephony. Its restrictions in air passenger transport are second only to Hungary, because Tunisia has not entered into an open skies agreement with the United States or regionally, because the rates are regulated for domestic aviation, and because the government still retains majority ownership in the largest carrier.
Tunisia also scores relatively poorly in legal and accounting services. Here the OECD questionnaires are largely restricted to measures that are non-discriminatory — for example, exclusive licensing, and restrictions on fees, advertizing and the legal form of business. Tunisia’s range of regulations, particularly on fees, make it second only to Turkey and Italy in restricting competition in accounting, and second only to Greece and Turkey in restricting competition in law. What the OECD index fails to indicate is the strength of Tunisia’s discriminatory restrictions in these professions — foreign firms
6
cannot practice law, but can only provide legal consulting services, and accounting firms must be 100 percent locally owned.
Only in engineering services does Tunisia receive a relatively liberal score. Tunisia has been trying to encourage FDI, and accordingly provides a relatively unrestrictive regulatory regime for both the domestic and foreign engineers required for large projects.
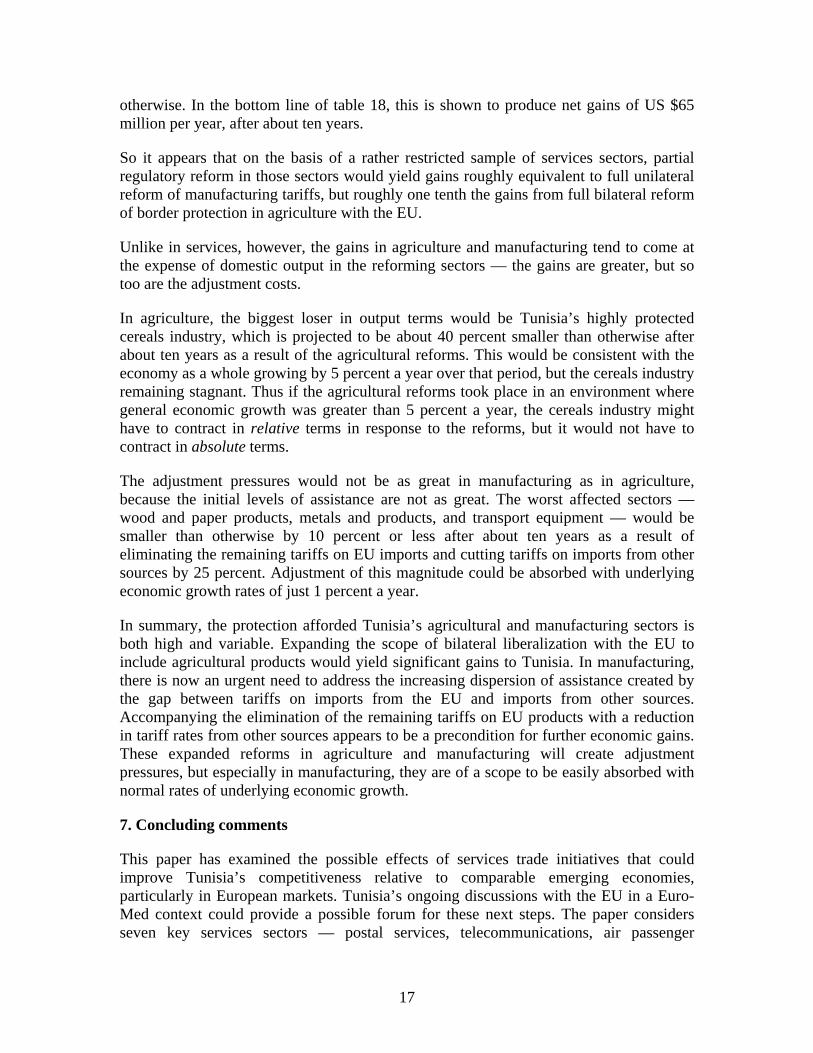
The index measures of regulatory restrictions in banking services originate from one of a series of studies carried out by the Australian Productivity Commission (McGuire and Schuele 2000). Figure 7 shows how Tunisia compares against the worst performing developed and developing countries for which recent banking estimates are available. The scoring is based on the template shown in Table 7.
These index measures in banking explicitly distinguish between regulations that affect only foreign banks (the foreign index), and those that affect domestic and foreign banks equally (the domestic index). Thus the difference between the domestic and foreign index measures the pure margin of discrimination against foreign banks.
Tunisia’s banking restrictions against foreign banks are not as severe as those in Malaysia, China, Vietnam and Brazil. But they are marginally worse than those in Morocco, and significantly worse than those in South Eastern Europe. Tunisia’s score reflects in part the restrictions on both lending and raising funds that are faced by foreign banks. Tunisia also maintains non-discriminatory restrictions, including the authorization process that is required of both domestic and foreign banks.
4. Reform options
Reform strategies
It appears that the regulatory restrictions affecting Tunisia’s services sector are generally relatively severe, compared with those in comparable emerging economies. Liberalizing these restrictions could help to harness the export potential of its emerging services, such as ICT-enabled services and the professions, allowing Tunisia to be better positioned as a location for the outsourcing of the back-office functions of European companies. Greater use of business-to-business (B2B) ecommerce within Tunisia could also improve the competitiveness of Tunisia’s own manufacturing and services sectors. Finally, liberalizing the restrictions in key backbone services such as banking, telecommunications and air passenger transport could boost competition and investment in these sectors, for further gains to the economy as a whole.
Given Tunisia’s relatively uncompetitive position in services relative to other emerging economies, there is little reason for Tunisia to wait for other countries to reciprocate in liberalizing their services. France, its key client economy within Europe, is already significantly more liberal than Tunisia. And Tunisia lags behind many of the emerging countries that would compete with it for outsourced services. For the professions, banking and telecommunications, it would make sense for Tunisia to liberalize unilaterally, although there is also scope for reform on a bilateral basis in the professions.
7
Air passenger transport is another matter. International air flights require international cooperation to provide the necessary infrastructure and air traffic rights. If Tunisia were to liberalize, while its partners continued to restrict entry, capacity and air fares, this could lead to adverse outcomes for Tunisia’s aviation industry, without providing benefits to its consumers. A more sensible first step would be a bilateral ‘open skies’ agreement with the European Union. This would not provide the maximum opportunity for Tunisia to optimize its own international air services network, and hence achieve the full cost savings available from reaping network economies. This would likely require open skies agreements with Tunisia’s Arab League partners as well. However, an open skies agreement with the European Union would open those bilateral routes up to low-cost carriers, putting competitive pressure on air fares on those routes.
First-round impacts on sector prices
In telecommunications, Tunisia could lift the numerical restrictions on the number of carriers in both fixed and mobile telephony, to increase the general contestability of the market. It could also lift the foreign ownership limits on competitive carriers, to attract further foreign direct investment. This would likely have two types of effects.
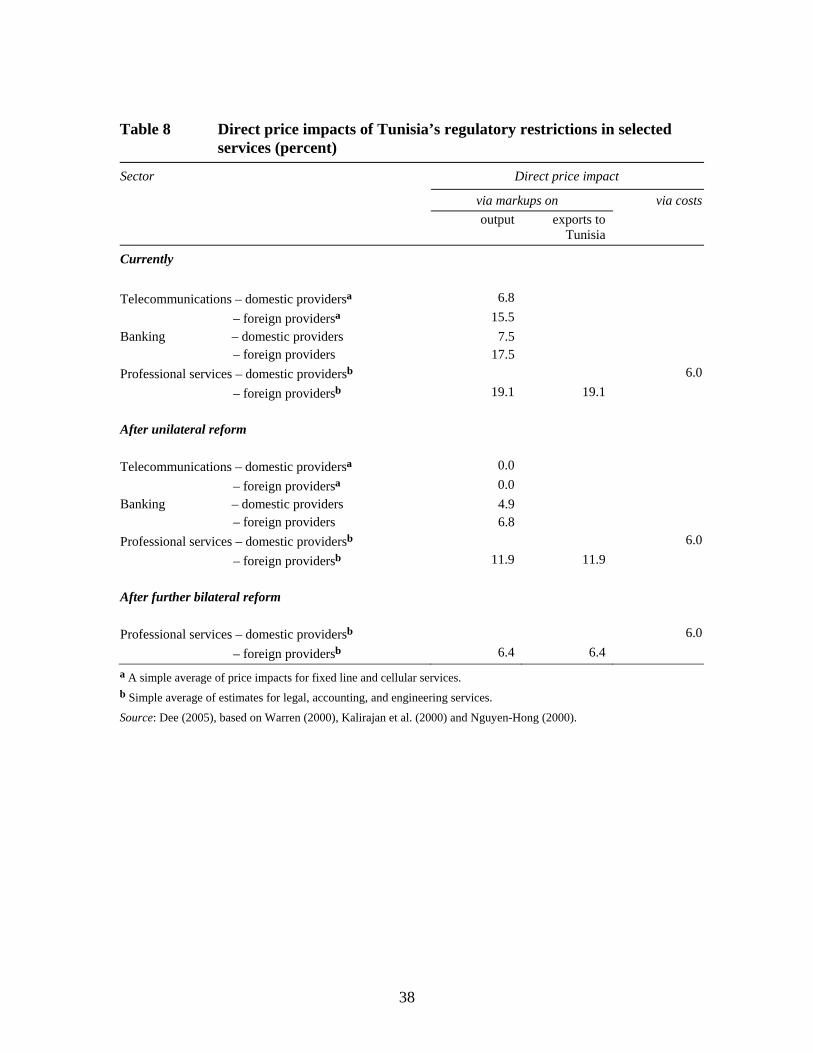
First, the greater market contestability and foreign competition would squeeze price-cost margins within telecommunications. This effect has been quantified in second-stage econometric work by Warren (2000), as summarized in Dee (2005). The top portion of Table 8 shows that Tunisia’s general restrictions on competition could currently be inflating the prices of domestically owned telecommunications services by 6.8 percent, while the additional restrictions on foreign ownership mean that the prices from foreign suppliers could be inflated by 15.5 percent. Were Tunisia to remove these restrictions, price-cost margins would be squeezed, and prices would be lower accordingly (middle portion of table 8).
In banking, Tunisia could remove the discretion associated with the granting of new bank licenses (domestic and foreign). It could also lift the restrictions faced by foreign banks in lending and raising funds domestically. These moves would squeeze price-cost margins in banking, an effect that has been quantified in second stage econometrics by Kalirajan et al. (2000), as summarized in Dee (2005). The results suggest that the removal of authorization could reduce the price impact of services trade restrictions on domestic banks from an estimated 7.5 percent to 4.9 percent (table 8). This, together with the removal of the restrictions on foreign bank lending and raising funds, could reduce the price impact of services trade restrictions on foreign banks from 17.5 percent to 6.8 percent (table 8).
In the professions, Tunisia could unilaterally get rid of the nationality requirement affecting law, accounting and engineering. The corresponding requirement in law and accounting for partners to be local could also be relaxed, with partners only required to be locally licensed. This reform would reduce the price impact of services trade restrictions from an estimated 19.1 percent to 11.9 percent for foreign services suppliers. And this would affect not just those wanting to establish a permanent commercial presence in Tunisia, but also those wanting to supply these services via ecommerce or via the
8
temporary movement of individual professionals (table 8, first and second columns, based on econometric work by Nguyen-Hong 2000).
A further potential reform would be for Tunisia to seek bilateral concessions in the context of its Association Agreement with the EU, in order to facilitate the outsourcing of back-office accounting and legal services to Tunisia, especially from France. Accordingly, Tunisia could allow up to 50 percent EU ownership of local accounting or law firms, to allow those companies some management control over the local firms undertaking the outsourcing activities. And it could seek a mutual recognition agreement with France, allowing French recognition of local Tunisian professional qualifications for the purposes of undertaking the back office activities, in exchange for the recognition of French qualifications in Tunisia. This latter move could further reduce the price impact of remaining restrictions on the supply of foreign professional services in Tunisia to 6.4 percent (bottom portion of table 8), with a corresponding improvement in the competitiveness of Tunisian suppliers into the EU market.
It is assumed here that in return for these unilateral and bilateral reforms, the EU would agree to remove its discriminatory restrictions on a preferential basis — not just granting Tunisian professionals mutual recognition, but also relaxing the investment restrictions, nationality requirements, hiring and other restrictions that apply in at least some professions, as they affect Tunisian suppliers. This would reduce the average price impact of remaining restrictions on the supply of Tunisia professional services into Europe from 9.5 percent to an estimated 5 percent (not shown in table 8).
Finally, the econometric work on which these estimates are based suggests that the unilateral and bilateral reductions in discrimination against foreign professionals would reduce prices by reducing price-cost margins. This is in contrast with the removal of non-discriminatory restrictions on both domestic and foreign professionals, which could reduce prices by reducing real resource costs.
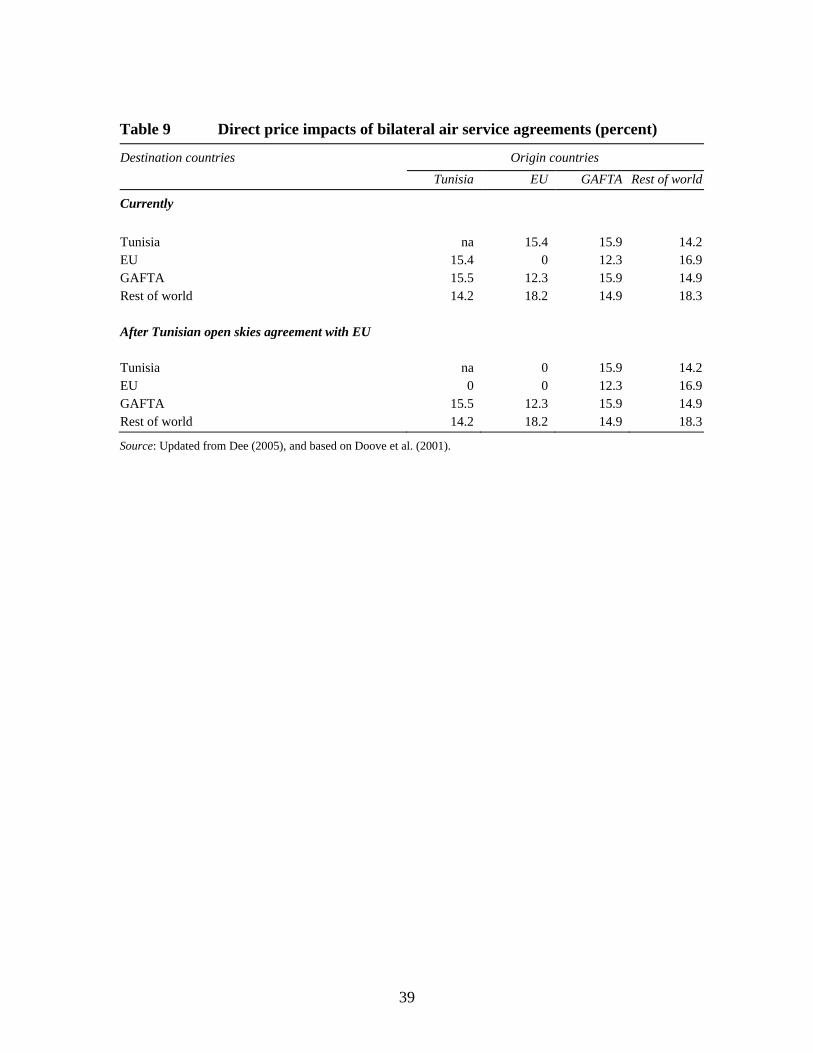
As noted, in air passenger transport, Tunisia could seek an open skies agreement with the EU. The likely effects of this have been quantified in second-stage econometric work by Gonenc and Nicoletti (2000) and Doove et al. (2001). For the purposes of this paper, that work has been updated using more recent information about the content of air services agreements from ICAO (2004). The price impact of Tunisia’s current air services agreements with the EU has been quantified at 15.4 percent. This would drop to zero in a bilateral basis under an open skies agreement (table 9). As noted above, this price reduction is likely to come about through a reduction in price-costs margins rather than through a reduction in resource costs. Cost savings from achieving greater network economies would probably require a more extensive series of open skies agreements.
Furthermore, it is assumed that the open skies agreement extends to freight as well as passenger traffic. A freight agreement is likely to be less contentious, and could achieve similar benefits. Accordingly, the above estimated reduction in price-cost margins is applied to exports of the entire air transport industry, covering both freight and passengers.
9
5. The economy-wide effects of services trade liberalization in Tunisia
Modeling framework
The effects of these reform initiatives have been projected using the FTAP model of the world economy, which was developed by Dee and Hanslow (2001), is documented fully in Hanslow, Phamduc and Verikios (1999), and is available for download at http://www.crawford.anu.edu.au/staff/pdee.php. The FTAP model is a computable general equilibrium model incorporating services delivered via FDI. It differs in turn from GTAP (Hertel 1997), the ‘plain vanilla’ model from which it was derived, in three important respects.
First, because many services are delivered primarily via commercial presence, the modelling framework includes foreign direct investment as a mode of services trade delivery, and covers separately the production and trading activity of foreign multinationals. In other words, GTAP, the conventional multi-country model, is split out by ownership as well as location. In the current version of FTAP, the foreign ownership shares for Tunisia were obtained from survey data provided by Tunisia’s Institut National de la Statisique (INS). The relative size of the Tunisian communications industry was also adjusted upwards, compared with that in the original GTAP database (version 6), based on value added shares provided by INS.
Second, by virtue of foreign ownership, at least some of the profits of foreign multinationals will be repatriated back to the home countries. Thus the profit streams in the conventional multi-country model have to be reallocated from the host to the home country, after provision is made for them to be taxed in either the home or host country. This reallocation leads to a distinction between GDP — the income generated in a region — and GNP — the income received by residents of a region. The latter forms the basis of (although is not identical to) the welfare measure in FTAP. The information on profit repatriation comes from the Balance of Payments Statistics of the International Monetary Fund (IMF).
Finally, not all profits of foreign multinationals need be repatriated to the home country. Some may be reinvested in the host country. To account for this phenomenon, and to allow for the effect that regulatory reform may have on both domestic and foreign direct investment more generally, the model makes provision for savings and capital accumulation. This is particularly important, since some regulatory barriers are aimed directly at limiting foreign equity participation. It is therefore important to capture how regulatory reform will affect not just foreign ownership shares, but also the total amount of productivity capacity available to an economy. National savings rates are derived from the macroeconomic data in the International Financial Statistics and Balance of Payments Statistics of the IMF. Government savings rates are derived from the Government Finance Statistics of the IMF. Household savings rates are calculated as a residual.
The FTAP model also differs from GTAP in other respects. In particular, it allows for firm-level product differentiation, economies of scale and large-group monopolistic competition. This is also important, since services tend to be highly specialized, being
10
tailored to the needs of individual customers. In the current version, economies of scale are assumed to be regional for services, and global for all other sectors (Dee 2003).
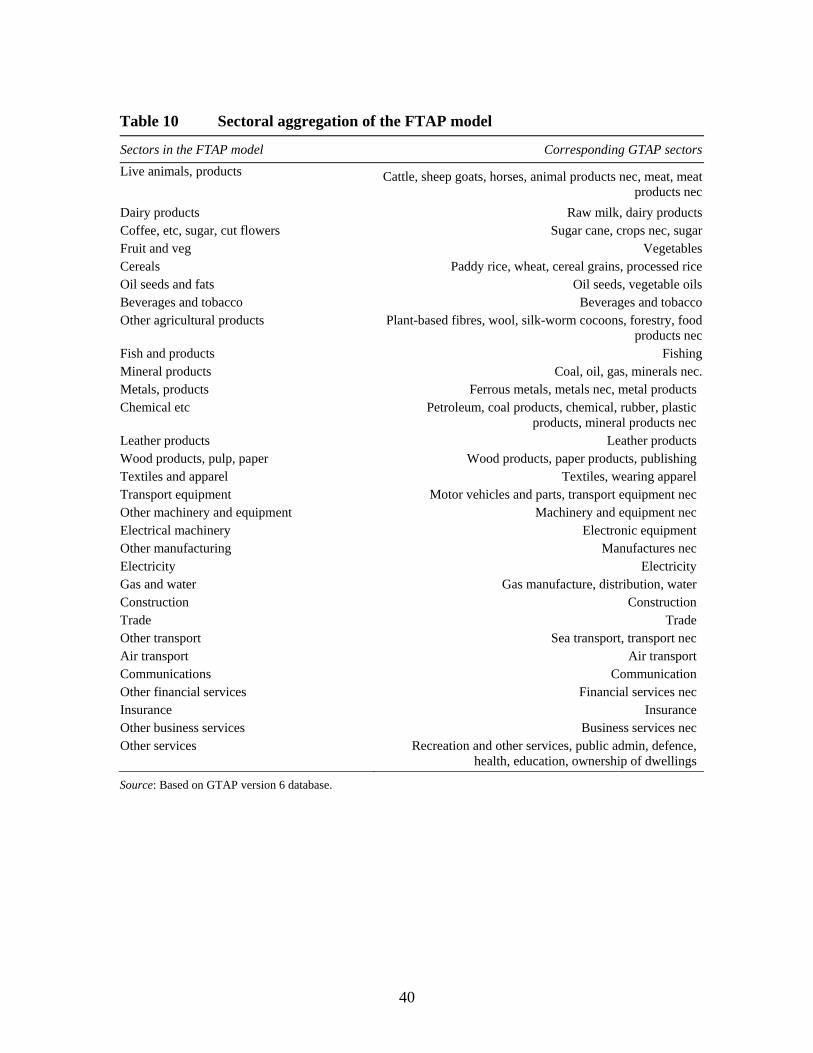
The version used here contains four regions — Tunisia, the EU, the GAFTA countries, and the rest of the world. It contains 30 sectors, including 11 in the services sector (table 10). Note that tourism is included in the model as a sales activity rather than a separate productive industry. This means that sales to foreign tourists are recorded among the exports of the industries producing goods that foreign tourists buy (air passenger transport, and so on), while sales to domestic tourists are recorded among the sales to household consumption of those industries.
The model provides a long-run snapshot of how different each economy would look about ten years after the introduction of the reforms, compared to the situation at that same point in time if the reforms had not taken place. During the ten year adjustment period, many other changes would affect each economy, but they are not taken into account in the current analysis. For this reason, the results should not be interpreted as indicating the likely changes that would occur over time in each economy — this would require all changes, not just those in regulatory trade barriers, to be taken into account.
The distinction is important to keep in mind. Sometimes, to aid fluency, the results are couched as if key indicators ‘rise’ or ‘fall’. This does not mean that the indicators would be higher or lower than they are now. It means that at some future time, they would be higher or lower than they would be otherwise. In both cases, in a growing economy, they could be higher than they are now.
Results
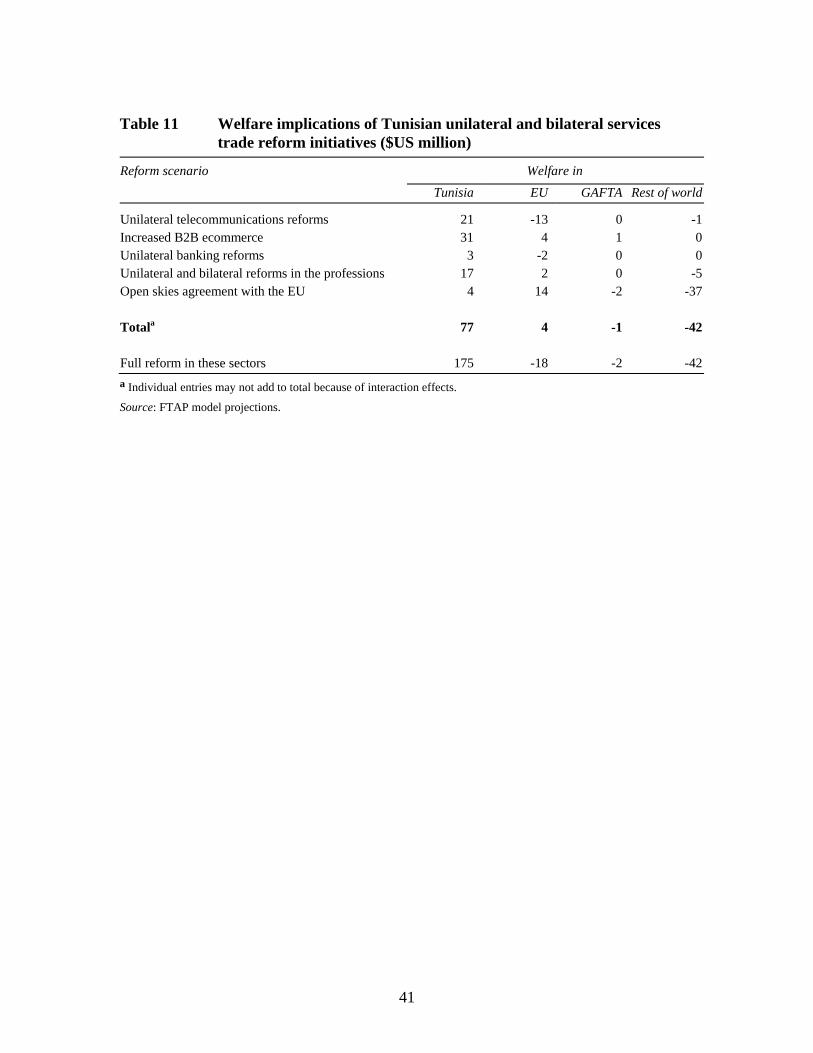
The effects of the above Tunisian services trade liberalization scenarios on economic well-being in each region are shown in table 11. The effects on Tunisia are not large — gains in economic well-being of around US $77 million per year after ten years (in an economy with GDP of about US $20 billion per year in the model’s initial database, which is mostly calibrated to 2001). The economy is also projected to be slightly larger, with real GDP being 0.29 percent larger than otherwise.
These projected macroeconomic effects are driven by the changes to consumer prices (from domestic and import sources), producer prices (of both Tunisian-owned and EU-owned firms), and real resource costs (for both Tunisian-owned and EU-owned firms) that are shown in table 12. This pattern of projected price changes largely reflects the pattern of first-round effects shown in tables 8 and 9.
The reason that the welfare gains are small is that most of the reforms are targeted at restrictions that have inflated price-cost margins, rather than real resource costs. The distinction is crucial for economic well-being. The prices of services have been inflated, not because the real resource cost of producing them has been inflated, but because incumbent firms have been able to earn economic rents — akin to a tax, but with the revenue flowing to the incumbents rather than to government. Liberalization of these barriers yields ‘triangle gains’ in producer and consumer surplus associated with
11
improvements in allocative efficiency, but also has redistributive effects associated with the elimination of rents to incumbents. The net result is a large transfer from incumbent producers to consumers and other using industries, and a relatively small gain to the economy as a whole.
This is in contrast to the situation when services trade restrictions increase the real resource cost of doing business. Liberalization is then equivalent to a productivity improvement (saving in real resources), and yields ‘roughly rectangle’ gains associated with a downward shift in supply curves. This can increase returns for the incumbent service providers, as well as lowering costs for users elsewhere in the economy. The net result is a relatively large gain to the economy as a whole.
Whether barriers create rents or add to resource costs is under-researched currently. In some cases, the empirical evidence from the second stage econometrics is suggestive, but not conclusive. In other cases, a price impact is estimated, and then it is simply asserted whether the effect operates through price-cost margins or through real resource costs. For example, it was simply assumed in the Konan and Maskus (2006) study of Tunisia that barriers were half rent-creating and half cost-escalating.
However, theory can provide some guidance. Rents are likely to be created by quantitative and other barriers that limit entry (or exit, though this is far less common). Some red-tape measures may add to resource costs. There are also many ways in which rents can be dissipated or capitalized. So, regulatory barriers that may once have been rent-creating for the initial incumbent can become cost-escalating for subsequent incumbents. For example, Kalirajan (2000) provides indirect evidence that some of the zoning and other restrictions common in the wholesale and retail sector create rents that are subsequently capitalized into the price of commercial land.
The limited empirical evidence tends to accord with this intuition. In banking and telecommunications, where explicit barriers to entry are rife, barriers appear to create rents. In distribution services, where indirect trade restrictions also apply, barriers appear to increase costs. In air passenger transport and the professions, barriers can potentially have both effects (Gregan and Johnson 1999, Kalirajan et al. 2000, Kalirajan 2000, Nguyen-Hong 2000, OECD 2005c, Copenhagen Economics 2005). And theoretical arguments suggest that barriers in maritime and electricity generation primarily affect costs (Steiner 2000, Clark, Dollar and Micco 2004).
The above reform scenarios were concentrated in sectors where barriers appear to create rents. In addition, the reform measures were largely aimed at removing discrimination against foreign suppliers. This is no coincidence. When regulatory restrictions are targeted only at foreign suppliers, they tend to be explicit quantity controls, since this is the most feasible way of imposing discrimination.
The welfare gains modeled here are significantly smaller than those in the Konan and Maskus (2006) study of the impact of services liberalization in Tunisia. As noted, those authors simply assumed that barriers to foreign direct investment were half rent-creating and half cost-escalating. On the basis of this assumption, their projected gains in
12
economic well-being from services trade liberalization were about 4 percent. By contrast, when they assumed the barriers to be entirely rent-creating, their projected gains in economic well-being fell to 0.33 percent, close to that projected here (see their table 4). In the current study, the treatment of barriers is based on available empirical evidence, where available, rather than assumption.
Another reason for the gains in the Konan and Maskus (2006) to be slightly bigger is that they implicitly assumed that the services of domestic and foreign-owned firms in Tunisia were perfect substitutes (they did not explicitly identify the proportion of each industry that was foreign-owned, but assumed that the reduction in barriers to foreign investment would affect the prices of all firms in Tunisia, not just the foreign-owned firms). By contrast, the FTAP model assumes that the services of domestic and foreign-owned firms are close but imperfect substitutes. This also reduces the gains from reform slightly, but this is of second order importance, compared to the different treatment of the barriers themselves (as the Konan and Maskus sensitivity analysis shows).
If Tunisia were to also contemplate domestic regulatory reform initiatives aimed at the non-discriminatory restrictions in sectors such as ports, electricity generation and wholesale and retail trade, where the empirical evidence suggests that restrictions raise real resource costs, this could provide much larger gains to the economy as a whole.
This can be demonstrated in a small way by considering the gains to the Tunisian economy from full rather than partial reform in the four chosen sectors. Here, full reform is defined to mean that all the discriminatory and non-discriminatory restrictions in telecommunications, banking and professional services are eliminated entirely, while air passenger transport is liberalized on a bilateral basis with the EU. So importantly, full reform would include reform of the non-discriminatory restrictions in the professions that appear to raise real resource costs (see the last column of table 8). The welfare gains to the Tunisian economy from full reform are projected to be US $175 million per year after ten years (last row of table 11), compared to US $77 million per year from partial reform. And fully 80 percent of the difference is accounted for by lower resource costs in the professions.
The point is also demonstrated by studies that have looked at the impact of more widespread reforms in services, including reform of the non-discriminatory restrictions in wholesale and retail trade, electricity generation and ports, where costs have been raised. These studies suggest that reform of the non-discriminatory restrictions can yield between 75 and 90 percent of the total gains from reform (eg OECD 2004). These results suggest that if Tunisia were to contemplate broader domestic regulatory reform initiatives aimed at non-discriminatory restrictions in these other sectors, the gains could be several orders of magnitude greater than those projected here.
There are still some useful insights from the narrower set of reforms. Because the Tunisian reforms are mostly behind the border (with the main exception of the open skies agreement in air passenger transport, which is in any event bilateral), the gains to other regions from so-called ‘free-riding’ are minimal. This has been observed in other studies of services trade reform. In the current case, the EU is in fact projected to lose slightly in
13
welfare terms from unilateral reform of Tunisia’s telecommunications and banking sectors. The EU is an important source of Tunisia’s foreign investment in these sectors, so is adversely affected to a small degree by the loss of rents of its foreign multinationals in Tunisia. In other studies, trading partner countries can be slightly adversely affected by unilateral reforms, especially those that reduce costs in the reforming country. This is because such reforms improve the international competitiveness of the reforming country, so partners suffer a small terms of trade loss.
But reversing the argument, it means that Tunisia also has little to gain from behind-the-border reform in other countries. This is an additional reason why Tunisia should not wait for services trade reform initiatives to be reciprocated, except in sectors like air passenger transport where unilateral action would clearly be unwise.
The reforms also have implications for the ownership structure of Tunisian industries. Surprisingly, even though many of the reforms remove discrimination against foreign suppliers, the projections do not suggest that domestically-owned services suppliers would be significantly smaller than otherwise (table 13). Only in the professions (the model’s ‘Other business services’ sector) are domestically owned firms projected to be smaller than otherwise — by less than 1 percent, a result that could be easily absorbed by normal economic growth. In banking (the model’s ‘Other financial services’ sector) and communications, the domestically owned firms are projected to benefit from the removal of some of the discrimination against foreign firms.
One important reason for this is that domestically owned and foreign firms in these sectors have been modeled as providing closely, but not perfectly, substitutable services. In many services sectors, local firms in fact have local advantages that allow them to thrive alongside foreign providers.
Another reason is that, as in most other countries, the most intensive users of services are other services sectors, not agriculture or manufacturing. For example, there are typically more telephones in office buildings than in factories. So the sectors to benefit most from services sector reform are the services sectors themselves — not just banking and telecommunications, but also construction, trade and insurance. Most sectors in agriculture and manufacturing are projected to be slightly smaller than otherwise as a result of the services sector reforms. This is because there is assumed to be the same amount of skilled and unskilled labor available to the economy, whether or not the reforms take place. So if the reforms encourage some sectors to be larger than otherwise, then at least some other sectors need to be smaller than otherwise. But overall, the services sector reforms are good for the Tunisian labor market — real wages are projected to be 1.4 percent higher than otherwise as a result of the reforms.
Table 14 confirms a significant boost in exports from the services sectors undergoing reform — by about 30 percent in air passenger transport (including increased exports to foreign tourists), 50-70 percent in communications, 10-20 percent in banking and 30-50 percent in professional services. Again, the export performance comes not just from the foreign-owned services suppliers in these industries, but also from Tunisian-owned firms, and contributes to a 0.9 percent increase in total export volumes. The services exports
14
shown in table 14 are those recorded in traditional balance of payments statistics — predominantly exports delivered via cross-border trade and consumption abroad (eg sales of services to foreign tourists). The growth in the output of foreign-owned firms in Tunisia (table 13), and the corresponding increases in their sales to other firms in Tunisia, represents an increase in Tunisian imports of services delivered via commercial presence. But table 14 confirms that those same foreign-owned firms contribute significantly to increases in services exports delivered via other modes.
In summary, the services sector reforms examined here could provide small but useful benefits to the Tunisian economy. The economy is projected to be slightly bigger than otherwise, slightly more services intensive than otherwise, with a slightly bigger proportion of foreign ownership than otherwise, and with a greater export intensity than otherwise (table 15), providing a projected slight improvement in economic well-being.
Note that the representation of the Tunisian economy in the benchmark equilibrium in table 15 is after the injection into the FTAP model’s database of the estimated initial barriers to services trade in each region (carried out using the GTAP model’s ‘altertax’ procedure adapted to the FTAP model — see Malcolm 1998 for details), and after an increase in the relative size of the Tunisian communications industry, to better match national data (carried out via a taste shift in favour of communications). The benchmark equilibrium matches neither national data nor the GTAP model database exactly.
A further policy question is how the benefits from services sector reforms would compare to those from further reform of agriculture and manufacturing. This is the topic of the next section.
6. The economy-wide effects of further liberalizing agriculture and manufacturing
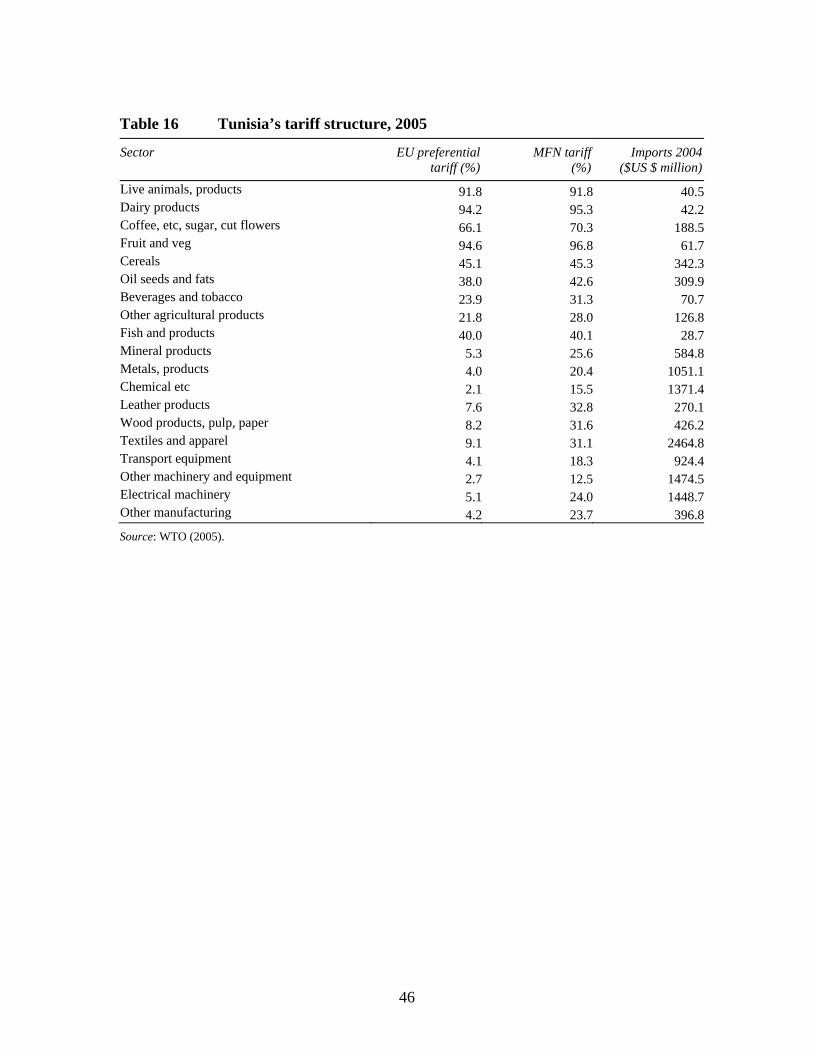
In 2005, the tariff assistance provided to Tunisia’s agricultural and manufacturing sectors was both high and variable. Detailed data for 2005 (summarized in WTO 2005) show that tariffs on agricultural products were in the 20-90 percent range, while MFN tariffs on manufactures were mostly 20-30 percent (table 16). Thus the protection in agriculture was much higher than in manufacturing. Both were higher than the tax equivalents of the regulatory restrictions in the particular services sectors considered above. However, they would not necessarily be of less economic significance than cost-raising restrictions elsewhere in services.
Tunisia has been in the process of phasing out its tariffs on manufactured imports from the EU, so that in 2005 tariffs on manufactures from this source were less than 10 percent (table 16). This is an additional source of variability in Tunisia’s protection structure.
Once account is taken of tariff rate quotas and the ad-valorem equivalent of specific tariffs, Tunisia’s protection structure may be even more variable. Such protection estimates are available from the GTAP model database for the year 2001, and are shown in table 17. The estimates for manufactures from this source are very roughly the same as those for 2005 from the WTO (note that the GTAP version 6 database incorporates trade-weighted applied preferential tariff rates). The estimates for agriculture are more variable
15
than from the WTO, reflecting in part the incidence of tariff rate quotas and specific tariffs in this sector.
Tunisia has also signed a trade agreement with GAFTA countries, and has been reducing its formal tariffs from this source. But reports are that any reduction in tariffs on imports from GAFTA has been countered by an increase in administrative barriers, with no real increase in market access. So the extent of true protection from GAFTA imports now is probably the same as that shown in table 17 for 2001. It generally lies somewhere between that for the EU and that for other countries.
The policy dilemma facing Tunisia is that the further reductions in its tariffs on imports from EU, while reducing the average level of protection, may greatly increase the dispersion in protection — both the dispersion between agriculture and manufacturing, and the dispersion between different country sources of manufactured goods. Since the welfare damage done by import protection comes from the dispersion and well as the average level, Tunisia’s current policy course may not yield benefits unless the question of dispersion is also addressed.
The extent of this policy dilemma is now examined empirically. For this purpose, the structure of protection from the GTAP version 6 database is used, since although it slightly overstates the current tariffs on manufactures from the EU, it picks up the incidence of tariff rate quotas and specific tariffs in agriculture, as well as the likely real structure of protection against imports from GAFTA countries.
Reform scenarios
One way that Tunisia could address the issue of dispersion in protection is by including agriculture in its bilateral reductions in protection with the EU — currently agriculture is largely omitted by both sides. This forms the basis of one reform scenario — Tunisia eliminates its border protection (import barriers and export subsidies) on agricultural goods from the EU, and the EU reciprocates.
Tunisian agricultural producers could have difficulty taking full advantage of this market access, without improvements in the quality of the exportables they produce.
‘The cases of citrus and olive oil illustrate how potential is not being realized. The key issue is quality. Supply chains must be responsive to consumers’ specific demands. But to get premium oranges and oil onto the market, farmers need first-rate technical and marketing support from research, extension and producers’ organizations. And Government interventions, in the form of fixed retail margins and the Office des Huiles’ control over quotas and testing, are interposed between the producer and consumer. The result is that Tunisian oranges and olive oil command low prices and EU quota is left unused. Conversely, when Government has made partial reforms, such as the removal of the ONH’s olive oil export monopoly, the private sector has responded.’ (World Bank 2006, pp. 6–7)
16
Improving the quality of agricultural exportables would require not just technical solutions (research, extension) but also domestic regulatory reforms to remove government controls over quality control and wholesale and retail distribution networks, allowing Tunisian producers’ direct access to their customers in Europe. The benefits of a 10 percent productivity improvement in Tunisia’s agricultural exportables (Fruit and vegetables, Oil seeds and fats, Other agricultural products) is also examined here, although the broader benefits of reform in wholesale and retail distribution, which could help bring it about, are not included.
Another way in which Tunisia could address the issue of dispersion in protection is by accompanying the elimination of the remaining tariffs on manufactures from Europe with a concomitant reduction in applied tariffs on imports from other sources. Tariffs on imports from the EU have been eliminated in recent years — Tunisia could also consider reducing its tariffs on imports from all other sources by 25 percent.
Results
The effects of these reform scenarios in Tunisian agriculture and manufacturing are shown in table 18. As expected, the results confirm that there are significant gains from reforming border protection in Tunisian agriculture. Current protection levels are so high that any form of liberalization yields gains, even if it is on a preferential basis with the EU. This alone is projected to improve economic well-being in Tunisia by US $114 million per year after about ten years.
Unlike in services, there are also significant gains in other countries reciprocating. Tunisia would gain US $295 million per year after about ten years if the EU were to drop its border protection (import tariffs and quotas and export subsidies) against Tunisian agriculture. Productivity improvements in Tunisian agriculture are probably a precondition for these gains to be realized. But a 10 percent productivity improvement in agricultural exportables would by itself provide US $258 million per year in gains. The combined package of agricultural reforms would provide total gains of US $733 million per year after about then years (equivalent to almost 4 percent of GDP). Real GDP itself would be 4.6 percent higher than otherwise.
The results confirm, however, that manufacturing tariffs against EU imports in 2005 were sufficiently low, relative to protection elsewhere, that the welfare cost of exacerbating the dispersion in protection would dominate — phasing out the remaining tariffs against EU manufactures would mean economic well-being was US $184 million per year lower than otherwise, after about ten years. This adverse effect could be partially offset by reducing tariffs on imports from all other sources by 25 percent. By itself, this would provide gains of US $74 million per year. The combined package of reforms to manufacturing tariffs would yield a net loss of US $104 million per year.
But the structure of protection in Tunisia in 2005 was so variable that perhaps the only strategy in manufacturing to guarantee an overall net gain would be an across-the-board-approach — full liberalization of protection on imports from all sources, both EU and
17
otherwise. In the bottom line of table 18, this is shown to produce net gains of US $65 million per year, after about ten years.
So it appears that on the basis of a rather restricted sample of services sectors, partial regulatory reform in those sectors would yield gains roughly equivalent to full unilateral reform of manufacturing tariffs, but roughly one tenth the gains from full bilateral reform of border protection in agriculture with the EU.
Unlike in services, however, the gains in agriculture and manufacturing tend to come at the expense of domestic output in the reforming sectors — the gains are greater, but so too are the adjustment costs.
In agriculture, the biggest loser in output terms would be Tunisia’s highly protected cereals industry, which is projected to be about 40 percent smaller than otherwise after about ten years as a result of the agricultural reforms. This would be consistent with the economy as a whole growing by 5 percent a year over that period, but the cereals industry remaining stagnant. Thus if the agricultural reforms took place in an environment where general economic growth was greater than 5 percent a year, the cereals industry might have to contract in relative terms in response to the reforms, but it would not have to contract in absolute terms.
The adjustment pressures would not be as great in manufacturing as in agriculture, because the initial levels of assistance are not as great. The worst affected sectors — wood and paper products, metals and products, and transport equipment — would be smaller than otherwise by 10 percent or less after about ten years as a result of eliminating the remaining tariffs on EU imports and cutting tariffs on imports from other sources by 25 percent. Adjustment of this magnitude could be absorbed with underlying economic growth rates of just 1 percent a year.
In summary, the protection afforded Tunisia’s agricultural and manufacturing sectors is both high and variable. Expanding the scope of bilateral liberalization with the EU to include agricultural products would yield significant gains to Tunisia. In manufacturing, there is now an urgent need to address the increasing dispersion of assistance created by the gap between tariffs on imports from the EU and imports from other sources. Accompanying the elimination of the remaining tariffs on EU products with a reduction in tariff rates from other sources appears to be a precondition for further economic gains. These expanded reforms in agriculture and manufacturing will create adjustment pressures, but especially in manufacturing, they are of a scope to be easily absorbed with normal rates of underlying economic growth.
7. Concluding comments
This paper has examined the possible effects of services trade initiatives that could improve Tunisia’s competitiveness relative to comparable emerging economies, particularly in European markets. Tunisia’s ongoing discussions with the EU in a Euro-Med context could provide a possible forum for these next steps. The paper considers seven key services sectors — postal services, telecommunications, air passenger
18
transport, the accounting, legal and engineering professions, and banking. Tourism and maritime services, which are important to the Tunisian economy, are not covered because they are traditionally open to trade and investment with no significant barriers.
The possible first-round impacts of services trade initiatives in these sectors have been determined using econometric work that has quantified the effects of regulatory restrictions on economic performance in the sectors, while controlling for all other factors that affect that economic performance. The economy-wide effects of the services trade initiatives have then been projected using a computable general equilibrium model that includes foreign direct investment as an important mode of services trade delivery, and covers separately the production and trading activity of foreign multinationals.
On the basis of this restricted sample of services sectors, partial regulatory reform would yield gains roughly equivalent to full unilateral reform of manufacturing tariffs, but roughly one tenth the gains from full bilateral reform in border protection in agriculture with the EU. The adjustment costs associated with these services trade reforms are minimal. Even though many of the reforms remove discrimination against foreign suppliers, the projections do not suggest that domestically-owned services suppliers would be significantly smaller than otherwise. In many services sectors, local firms in fact have local and/or niche market advantages that allow them to thrive alongside foreign providers. The model makes provision for this differentiation.
One reason that the projected gains from services trade reform are relatively small is that most of the reforms are targeted at restrictions that have inflated price-cost margins rather than real resource costs. Liberalization therefore induces a relatively large transfer from incumbent producers to consumers, and a relatively small net gain to the economy as a whole. Nevertheless, whether barriers create rents or add to resource costs is under-researched currently. In the past, the issue has tended to be resolved by assertion, and sensitivity analysis has merely confirmed the importance of the assertion. Ideally, the econometric work that quantifies the first-round effects of regulatory restrictions should use a sufficiently rich set of performance measures to shed empirical light on the issue (Dee 2005).
Another reason that the projected gains from services trade reform are relatively small is that, as noted, the services trade reforms are largely aimed at removing discrimination against foreign suppliers. Dee (2007) provides a number of reasons why in practice, formal services trade negotiations tend to focus on this dimension of liberalization. But those regulatory restrictions that are targeted only at foreign suppliers tend to be explicit quantity controls, since this is the most feasible way of imposing discrimination. Quantity controls in turn are the restrictions most likely to inflate price-cost margins rather than raise real resource costs.
Studies that have looked at the impact of more widespread reforms in services, including reform of non-discriminatory restrictions that tend to raise real resource costs, suggest that these can yield more than three-quarters of the overall gain from services trade reform. If Tunisia were to contemplate wider reforms, including in areas such as wholesale and retail trade, electricity generation and ports, the gains could be several
19
orders of magnitude greater than those projected here. To the extent that the wider reforms targeted non-discriminatory restrictions, they could further benefit locally-owned new entrants. To the extent that they targeted restrictions at raised real resource costs, they could even benefit incumbent suppliers. A wider set of reforms could therefore provide win-win outcomes and even fewer adjustment problems than projected here.
Relative to the selected services trade reforms considered here, reducing the dispersion in Tunisia’s barriers to its merchandise trade would yield at least as big a gain. This could be achieved, either by including agriculture in the bilateral liberalization occurring with the EU, or by accompanying the current elimination of tariffs against EU manufactures with a reduction in tariffs against imports from other sources. Unlike in services, however, the gains in agriculture and manufacturing would tend to come at the expense of domestic output in the reforming sectors — the gains are greater, but so too are the adjustment costs.
20
References
Barth, J., Caprio, G. and Levine, R. 2004, ‘Bank Regulation and Supervision: What Works Best?’, Journal of Financial Intermediation, 13, pp. 205–48.
Brown, D., Deardorff, A.V. and Stern, R.M. 1997, ‘Some economic effects of the free trade agreement between Tunisia and the European Union’, in A. Galal and B. Hoekman (eds), Regional Partners in Global Markets: Limits and possibilities of the Euro-Med Agreements, Centre for Economic Policy Research, London, pp. 71–97.
Clark, X., Dollar, D. and Micco, A. 2004, ‘Port efficiency, maritime transport costs, and bilateral trade’, Journal of Development Economics, 75, pp. 417–50.
Conway, P., Janod, V. and Nicoletti, G. 2005, ‘Product Market Regulation in OECD Countries: 1998 to 2003’, ECO/WKP(2005)6, OECD, Paris.
Copenhagen Economics 2005, Economic Assessment of the Barriers to the Internal Market for Services, Copenhagen Economics, Copenhagen.
Dee, P. 2003, ‘Modelling the policy issues in services trade’, Économie Internationale (94-95), pp. 283–300.
Dee, P. 2005, ‘A Compendium of Barriers to Services Trade’, prepared for World Bank, available at http://www.crawford.anu.edu.au/pdf/Combined_report.pdf.
Dee, P. 2007, ‘East Asian economic integration and its impact on future growth’, The World Economy, 30(3), pp. 405–23.
Dee, P. and Hanslow, K. 2001, ‘Multilateral liberalization of services trade’, in Stern, R. (ed.), Services in the International Economy, University of Michigan Press, Ann Arbor, pp. 117–39.
Dee, P., Hanslow, K. and Phamduc, T. 2003, ‘Measuring the cost of barriers to trade in services’, in Ito, T. and Krueger, A. (eds), Services Trade in the Asia-Pacific Region, NBER-East Asia Seminar on Economics, Volume 11, University of Chicago Press, Chicago, pp. 11–43.
Doove, S., Gabbitas, O., Nguyen-Hong, D. and Owen, J. 2001, Price Effects of Regulation: International Air Passenger Transport, Telecommunications and Electricity Supply, Productivity Commission Staff Research Paper, Ausinfo, Canberra.
Findlay, C. and Warren, T. (eds) 2000, Impediments to Trade in Services: Measurement and Policy Implications, Routledge, London and New York.
Gonenc, R. and Nicoletti, G. 2000, Regulation, Market Structure and Performance in Air Passenger Transport, Working Paper No. 254, ECO/WKP(2000)27, Economics Department, OECD, Paris, 3 August.
Gregan, T. and Johnson, M. 1999, Impacts of Competition Enhancing Air Services Agreements: a Network Modelling Approach, Productivity Commission Staff Research Paper, Ausinfo, Canberra, July.
21
Hanslow, K., Phamduc, T. and Verikios, G. 1999, ‘The structure of the FTAP model’, Research Memorandum, Productivity Commission, Canberra, December, available from http://www.pc.gov.au/research/rm/ftap/index.html.
Hertel, T. 1997, Global Trade Analysis: Modelling and Applications, Cambridge University Press, Cambridge.
Hertel, T., Walmsley, T. and Itakura, K. 2001, ‘Dynamic effects of the “new age” free trade agreement between Japan and Singapore’, Journal of Economic Integration, 16(4), pp. 446–84.
ICAO (International Civil Aviation Organization) 2004, Database of the World’s Air Services Agreements, Doc 9511, 2004 edition, CD-Rom.
ITU (International Telecommunications Union) 2006, ICT Statistics Database, available at http://www.itu.int/ITU-D/icteye/Indicators/Indicators.aspx.
Kalirajan, K. 2000, Restrictions on Trade in Distribution Services, Productivity Commission Staff Research Paper, Ausinfo, Canberra.
Kalirajan, K., McGuire, G., Nguyen-Hong, D. and Schuele, M. 2000, ‘The price impact of restrictions on banking services’, in Findlay, C. and Warren, T. (eds) 2000, Impediments to Trade in Services: Measurement and Policy Implications, Routledge, London and New York, pp. 215–30.
Konan, D. and Maskus, K. 2006, ‘Quantifying the Impact of Services Liberalization in a Developing Economy’, Journal of Development Economics, 81(1), pp. 142–62.
Malcolm, G. 1998, ‘Adjusting Tax Rates in the GTAP Data Base’, GTAP Technical Paper No. 12, Purdue University, West Lafayatte IN.
McGuire, G. and Schuele, M. 2000, ‘Restrictiveness of international trade in banking services’, in C. Findlay and T. Warren (eds), Impediments to Trade in Services, Measurement and Policy Implications, Routledge, London and New York, pp. 201–214.
Nguyen-Hong, D. 2000, Restrictions on Trade in Professional Services, Productivity Commission Staff Research Paper, Ausinfo, Canberra.
OECD 2004, ‘The Economy-wide Effects of Services Trade Barriers in Selected Developing Countries’, TD/TC/WP(2004)42, OECD, Paris.
OECD 2005a, Indicators of Regulatory Conditions in the Professional Services, 2 December 2005, accessible at http://www.oecd.org/document/24/0,2340,en_2649_37421_35858776_1_1_1_37421,00.html.
OECD 2005b, Indicators of Regulatory Conditions in Seven Non-manufacturing Sectors, 2 December 2005, accessible at http://www.oecd.org/document/32/0,2340,en_2649_37421_35791136_1_1_1_37421,00.html.
OECD 2005c, ‘Modal Estimates of Services Barriers’, TD/TC/WP(2005)36, OECD, Paris.
22
Steiner, F. 2000, Regulation, Industry Structure and Performance in the Electricity Supply Industry, Working Paper No. 238, ECO/WKP(2000)11, Economics Department, OECD, Paris, 12 April.
Warren, T. 2000, ‘The impact on output of impediments to trade and investment in telecommunications services’, in Findlay, C. and Warren, T. (eds) 2000, Impediments to Trade in Services: Measurement and Policy Implications, Routledge, London and New York, pp. 85–100.
World Bank 2006, Tunisia Agricultural Policy Review, Report No. 35239-TN, Washington DC.
World Bank 2008, Tunisia Global Integration: A New Generation of Reforms to Support Employment, World Bank, Washington DC.
Figure 1 OECD index of regulatory restrictions in postal services
0 1 2 3 4 5 6
Poland
Portugal
Spain
United Kingdom
Canada
Czech Republic
Mexico
Switzerland
United States
Hungary
Italy
Turkey
Tunisia
Restrictiveness index
Data source: Based on OECD (2005b).
24
Figure 2 OECD index of regulatory restrictions in telecommunications services
0 1 2 3 4 5 6
Korea
Spain
Mexico
Hungary
Portugal
Ireland
Germany
Austria
Japan
Greece
Sweden
Australia
France
Belgium
Switzerland
Slovak Republic
Norway
Iceland
Morocco
Luxembourg
Tunisia
Turkey
Restrictiveness index
Data source: Based on OECD (2005b).
25
Figure 3 OECD index of regulatory restrictions in air passenger transport
0.0 1.0 2.0 3.0 4.0 5.0 6.0
Korea
Finland
Italy
New Zealand
Morocco
Portugal
Mexico
Poland
Turkey
Slovak Republic
Greece
Ireland
Czech republic
Tunisia
Hungary
Restrictiveness index
Data source: Based on OECD (2005b).
26
Figure 4 OECD index of regulatory restrictions in accounting services
0 1 2 3 4 5
Korea
Iceland
Slovak Republic
Finland
Japan
Sweden
Belgium
Germany
Luxembourg
Netherlands
France
Canada
Czech republic
Tunisia
Italy
Turkey
Restrictiveness index
Data source: Based on OECD (2005a).
27
Figure 5 OECD index of regulatory restrictions in legal services
0 1 2 3 4 5
Korea
Norway
France
Ireland
Hungary
Switzerland
Luxembourg
Canada
New Zealand
Japan
Portugal
Italy
Germany
Spain
Slovak Republic
Czech republic
Tunisia
Turkey
Greece
Restrictiveness index
Data source: Based on OECD (2005a).
28
Figure 6 OECD index of regulatory restrictions in engineering services
0 1 2 3 4 5
Finland
Norway
Tunisia
Netherlands
Mexico
Spain
New Zealand
Korea
Hungary
Austria
Czech republic
Turkey
Slovak Republic
Japan
Greece
Germany
Luxembourg
Canada
Italy
Restrictiveness index
Data source: Based on OECD (2005a).
29
Figure 7 Productivity Commission index of regulatory restrictions in banking services
0 0.1 0.2 0.3 0.4 0.5 0.6 0.7
Albania
Croatia
Estonia
Macedonia
Moldova
Lithuania
Bulgaria
Australia
Zambia
Serbia/Montenegro
Latvia
Russia
Chile
Thailand
Morocco
Tunisia
Brazil
Vietnam
China
Malaysia
Restrictiveness index
Domestic Foreign
Data source: Based on Dee (2005) and McGuire and Schuele (2000).
30
Table 1 Sectoral value added in Tunisia
Millions of US dollars Percentage of total
Agriculture, other primary and food 3281 20.1Other manufacturing 2111 12.9Electricity 344 2.1Gas and water 126 0.8Construction 975 6.0Trade 2744 16.8Other transport 1194 7.3Air transport 382 2.3Communications 778 4.8Other financial services 557 3.4Insurance 67 0.4Other business services 680 4.2Other services 3098 19.0Total 16336 100.0
Source: FTAP model database, based on the GTAP version 6 database (Hertel 1997).
31
Table 2 OECD regulatory questionnaire for postal services Weights by theme
Question weights Score Question
1/2 Entry regulation
1/3
Do national, state or provincial laws or other regulations restrict the number of competitors allowed to operate a business in at least some markets in the sector: national post — basic letter services?
6 Yes, in all markets 3 Yes, in some markets 0 No, free entry in all markets
1/3
Do national, state or provincial laws or other regulations restrict the number of competitors allowed to operate a business in at least some markets in the sector: national post — basic parcel services?
6 Yes, in all markets 3 Yes, in some markets 0 No, free entry in all markets
1/3
Do national, state or provincial laws or other regulations restrict the number of competitors allowed to operate a business in at least some markets in the sector: courier activities other than national post?
6 Yes 0 No
1/2 Public ownership
1/3
What percentage of shares in the largest firm in the sector: national post — basic letter services are owned by the government?
6 100% 3 Between 0 and 100% 0 None
1/3
What percentage of shares in the largest firm in the sector: national post — basic parcel services are owned by the government?
6 100% 3 Between 0 and 100% 0 None
1/3 What is the extent of public ownership in the courier activities (other than national post) sector?
6 Govt controls all dominant firms in the sector 3 Govt controls at least 1 firm, but other firms operate as well 0 No govt involvement in the sector
Source: OECD (2005b).
32
Table 3 OECD regulatory questionnaire for telecommunications services Weights by theme
Question weightsa Score Question
1/3 Entry regulation
wt(1-wm) What are the legal conditions of entry into the trunk telephony market?
6 Franchised to 1 firm 3 Franchised to 2 or more firms 0 Free entry
(1- wt)(1-
wm) What are the legal conditions of entry into the international market?
6 Franchised to 1 firm 3 Franchised to 2 or more firms 0 Free entry wm What are the legal conditions of entry into the mobile market? 6 Franchised to 1 firm 3 Franchised to 2 or more firms 0 Free entry
1/3 Public ownership
(1-wm) What percentage of shares in the public telecommunications operator is owned by the government?
% government ownership/100*6
wm What percentage of shares in the largest firm ion the mobile telecommunications market is owned by the government?
% government ownership/100*6
1/3 Market structure
wt(1-wm) What is the market share of new entrants in the trunk telephony market?
6-normalized market shareb
(1- wt)(1-
wm) What is the market share of new entrants in the international telephony market?
6-normalized market shareb
wm What is the market share of new entrants in the mobile telephony market?
6-normalized market shareb
a The weight wm is the OECD-wide revenue share from mobile telephony in total revenue from trunk, international and mobile. The weight wt is the OECD-wide revenue share of trunk in total revenue from trunk and international telephony. b The market share of new entrants has been normalized to be between 0 and 6 with 6 being the smallest market share over all countries and 0 being the largest.
Source: OECD (2005b).
33
Table 4 OECD regulatory questionnaire for air passenger transport Weights by theme
Question weightsa Score Question
1/2 Entry regulation
½*w Does your country have an open skies agreement with the United States?
6 No 0 Yes ½*w Is your country participating in a regional agreement? 6 No 0 Yes
(1-w)
Is the domestic aviation market in your country fully liberalized? That is, there are no restrictions on the number of (domestic) airlines that are allowed to operate on domestic routes?
6 No 0 Yes
1/2 Public ownership
1
What percentage of shares in the largest carrier (domestic and international traffic combined) are owned by national, state or provincial authorities?
% of shares owned by government/100*6
a The weight w is the average share of international traffic in total traffic (measured in ‘000 revenue passenger kilometres) for each country.
Source: OECD (2005b).
34
Table 5 OECD questionnaire for entry regulation in the professionsa Weights by theme
Question weights Score Question
2/5 Licensing
1 How many services does the profession have an exclusive or shared exclusive right to provide?
6 More than 3 4.5 3 3 2 1.5 1 0 0
2/5 Education requirements (only applies if licensing not 0)
1/3 What is the duration of special education/university/or other higher degree?
Equals number of years of education (max of 6)
1/3 What is the duration of compulsory practice necessary to become a full member of the profession?
Equals number of years of compulsory practice (max of 6)
1/3 Are there professional exams that must be passed to become a full member of the profession?
6 Yes 0 No
1/5 Quotas and economic needs tests
1 Is the number of foreign professionals/firms permitted to practice restricted by quotas or economic needs tests?
6 Yes 0 No
a The indicator for each profession is calculated as the simple average of the indicators of entry (Table 4) and conduct (Table 5) regulation.
Source: OECD (2005a).
35
Table 6 OECD questionnaire for conduct regulation in the professionsa Weights by theme
Question weights Score Question
0.38 Regulations on prices and fees
1 Are the fees or prices that a profession charges regulated in any way (by government or self-regulated)?
6 Minimum prices on all services 5 Minimum prices on some services 4 Maximum prices on all services 3 Maximum prices on some services 2 Non-binding recommended prices on all services 1 Non-binding recommended prices on some services 0 No regulation
0.23 Regulations on advertizing
1 Is advertising and marketing by the profession regulated in any way?
6 Advertising is prohibited 3 Advertising is regulated 0 No specific regulations
0.19 Regulations on form of business 1 Is the legal form of business restricted to a particular type? 6 Sole practitioner only 5 Incorporation forbidden 2 Partnership and some incorporation allowed 0 No restrictions
0.19 Quotas and economic needs tests 1 Is cooperation between professionals restricted? 6 Generally forbidden 4.5 Only allowed with comparable professions 3 Generally allowed 0 All forms allowed
a The indicator for each profession is calculated as the simple average of the indicators of entry (Table 4) and conduct (Ttable 5) regulation.
Source: OECD (2005a).
36
Table 7 Productivity Commission template for restrictions in banking services Weight - foreign index
Weight - domestic index Score Restriction
Restrictions on commercial presence
0.1900 0.1900 Licensing 1.00 Issues no new banking licenses 0.75 Issues up to 3 new banking licenses with only prudential restrictions 0.50 Issues up to 6 new banking licenses with only prudential restrictions 0.25 Issues up to 10 new banking licenses with only prudential restrictions 0.00 Issues new banking licenses with only prudential restrictions
0.1900 0.1900 Direct Investment
The score will be inversely proportional to maximum equity participation permitted in an existing domestic bank. For example, ownership to a maximum of 49 percent of a bank would receive a score of 0.51.
0.0950 0 No new licenses and JV arrangements
1.00 Issues no new banking licenses and no entry is allowed through a joint venture with a domestic bank
0.50 Bank entry is only through a joint venture with a domestic bank
0.00 No requirement for a bank to enter through a joint venture with a domestic bank
0.0190 0 Movement of People - Permanent
1.00 No entry of executives, senior managers or specialists
0.80 Executives, specialists and/or senior managers can stay a period of up to 1 year
0.60 Executives, specialists and/or senior managers can stay a period of up to 2 years
0.40 Executives, specialists and/or senior managers can stay a period of up to 3 years
0.20 Executives, specialists and/or senior managers can stay a period of up to 4 years
0.00 Executives, specialists and/or senior managers can stay a period of more than 5 years
Other Restrictions
0.1425 0.1425 Raising funds by banks 1.00 Banks are unable to raise funds from domestic sources 0.75 Banks are restricted from raising funds from domestic capital markets
0.50 Banks are restricted in accepting deposits from the public, or face interest rate controls
0.00 Banks can raise funds from any source with only prudential restrictions
Continued
37
Table 7 Continued Weight - foreign index
Weight - domestic index Score Restriction
Lending funds by banks
0.1425 0.1425 1.00 Banks are not permitted to lend to domestic clients
0.75 Banks are restricted to specified lending size or lending to Government projects
0.5 Banks are restricted in providing certain lending services such as leasing, credit cards and consumer finance
0.25 Banks are directed to lend to certain sectors such as housing and small business
0.00 Banks can lend to any source with only prudential restrictions
0.0950 0.0950 Other business of banks - insurance and securities services 1.00 Banks can only provide banking services
0.50 Banks can provide banking services plus one other line of business - insurance or securities services
0.00 Banks have no restrictions on conducting other lines of business
0.0475 0.0475 Expanding operations - street branches, offices and ATMs 1.00 One banking outlet with no new banking outlets permitted 0.75 Number of bank outlets is limited in number and location
0.25 Expansion of banking outlets is subject to non-prudential regulatory approval
0.00 No restrictions on banks expanding operations
0.0095 0 Movement of people - Temporary 1.00 No temporary entry of executives, senior managers and/or specialists
0.75 Temporary entry of executives, senior managers and/or specialists up to 30 days
0.50 Temporary entry of executives, senior managers and/or specialists up to 60 days
0.25 Temporary entry of executives, senior managers and/or specialists up to 90 days
0.00 Temporary entry of executives, senior managers and/or specialists over 90 days
0* 0 Movement of people - Board of Directors
1.00 Board cannot comprise of foreigners 0.00 No restrictions on the composition of the board of directors
The score is inversely related to the percentage of the Board which can comprise of foreigners. For example, if 20% of a BOD can comprise of foreigners they would receive a score of 0.80.
0.9310 0.8075 Total
* Weight was 0.019 in McGuire and Schuele (2000). Source: Dee (2005), based on McGuire and Schuele (2000).
38
Table 8 Direct price impacts of Tunisia’s regulatory restrictions in selected services (percent)
a A simple average of price impacts for fixed line and cellular services. b Simple average of estimates for legal, accounting, and engineering services.
Source: Dee (2005), based on Warren (2000), Kalirajan et al. (2000) and Nguyen-Hong (2000).
39
Table 9 Direct price impacts of bilateral air service agreements (percent)
Destination countries Origin countries
Tunisia EU GAFTA Rest of world
Currently
Tunisia na 15.4 15.9 14.2EU 15.4 0 12.3 16.9GAFTA 15.5 12.3 15.9 14.9Rest of world 14.2 18.2 14.9 18.3 After Tunisian open skies agreement with EU Tunisia na 0 15.9 14.2EU 0 0 12.3 16.9GAFTA 15.5 12.3 15.9 14.9Rest of world 14.2 18.2 14.9 18.3
Source: Updated from Dee (2005), and based on Doove et al. (2001).
40
Table 10 Sectoral aggregation of the FTAP model
Sectors in the FTAP model Corresponding GTAP sectors
Live animals, products Cattle, sheep goats, horses, animal products nec, meat, meat products nec
Dairy products Raw milk, dairy productsCoffee, etc, sugar, cut flowers Sugar cane, crops nec, sugarFruit and veg VegetablesCereals Paddy rice, wheat, cereal grains, processed riceOil seeds and fats Oil seeds, vegetable oilsBeverages and tobacco Beverages and tobaccoOther agricultural products Plant-based fibres, wool, silk-worm cocoons, forestry, food
products necFish and products FishingMineral products Coal, oil, gas, minerals nec.Metals, products Ferrous metals, metals nec, metal products Chemical etc Petroleum, coal products, chemical, rubber, plastic
products, mineral products nec Leather products Leather products Wood products, pulp, paper Wood products, paper products, publishing Textiles and apparel Textiles, wearing apparel Transport equipment Motor vehicles and parts, transport equipment nec Other machinery and equipment Machinery and equipment nec Electrical machinery Electronic equipment Other manufacturing Manufactures nec Electricity Electricity Gas and water Gas manufacture, distribution, water Construction Construction Trade Trade Other transport Sea transport, transport nec Air transport Air transport Communications Communication Other financial services Financial services nec Insurance Insurance Other business services Business services nec Other services Recreation and other services, public admin, defence,
health, education, ownership of dwellings
Source: Based on GTAP version 6 database.
41
Table 11 Welfare implications of Tunisian unilateral and bilateral services trade reform initiatives ($US million)
Reform scenario Welfare in
Tunisia EU GAFTA Rest of world
Unilateral telecommunications reforms 21 -13 0 -1Increased B2B ecommerce 31 4 1 0Unilateral banking reforms 3 -2 0 0Unilateral and bilateral reforms in the professions 17 2 0 -5Open skies agreement with the EU 4 14 -2 -37 Totala 77 4 -1 -42 Full reform in these sectors 175 -18 -2 -42
a Individual entries may not add to total because of interaction effects.
Source: FTAP model projections.
42
Table 12 Implications of Tunisian unilateral and bilateral services trade reform initiatives for consumer and producer prices and real resource costs in Tunisia (percentage deviation from baseline)
Consumer prices Producer pricesa Real resource costsa
Domestic goods
Imports Tunisian owned
EU-owned Tunisian owned
EU-owned
Electricity 0.4 0.0 0.4 0.0 0.4 0.0Gas and water 0.3 0.0 0.3 0.0 0.3 0.0Construction 0.3 0.0 0.3 0.3 0.3 0.3Trade -0.2 0.0 -0.2 -0.2 -0.2 -0.2Other transport 0.4 0.0 0.4 0.4 0.4 0.4Air transport 5.1 -8.1 5.1 5.0 5.1 5.0Communications -4.8 0.0 -4.5 -5.3 2.0 9.3Other financial services -1.2 0.0 -1.1 -1.7 1.3 8.1Insurance 0.1 0.0 0.1 0.1 0.1 0.1Other business services -0.5 -8.4 -0.4 -1.8 -0.4 9.9Other services 0.8 0.0 0.8 0.8 0.8 0.8a Producer prices are inclusive of rents from services trade barriers, while real resource costs are not.
Source: FTAP model projections.
43
Table 13 Implications of Tunisian unilateral and bilateral services trade reform initiatives for sectoral output in Tunisia (percentage deviation from baseline)
Table 14 Implications of Tunisian unilateral and bilateral services trade reform initiatives for sectoral export volumes from Tunisia (percentage deviation from baseline)