96
The Education Trust, 2003 Don’t Don’t Turn Back Turn Back The Clock The Clock OPENING PLENARY: Kati Haycock, Director, The Education Trust
| Date post: | 14-Dec-2015 |
| Category: |
Documents |
| Upload: | freddie-watkin |
| View: | 214 times |
| Download: | 0 times |
The Education Trust, 2003
Don’tDon’tTurn BackTurn BackThe ClockThe Clock
OPENING PLENARY: Kati Haycock, Director, The Education Trust
The Education Trust, 2003
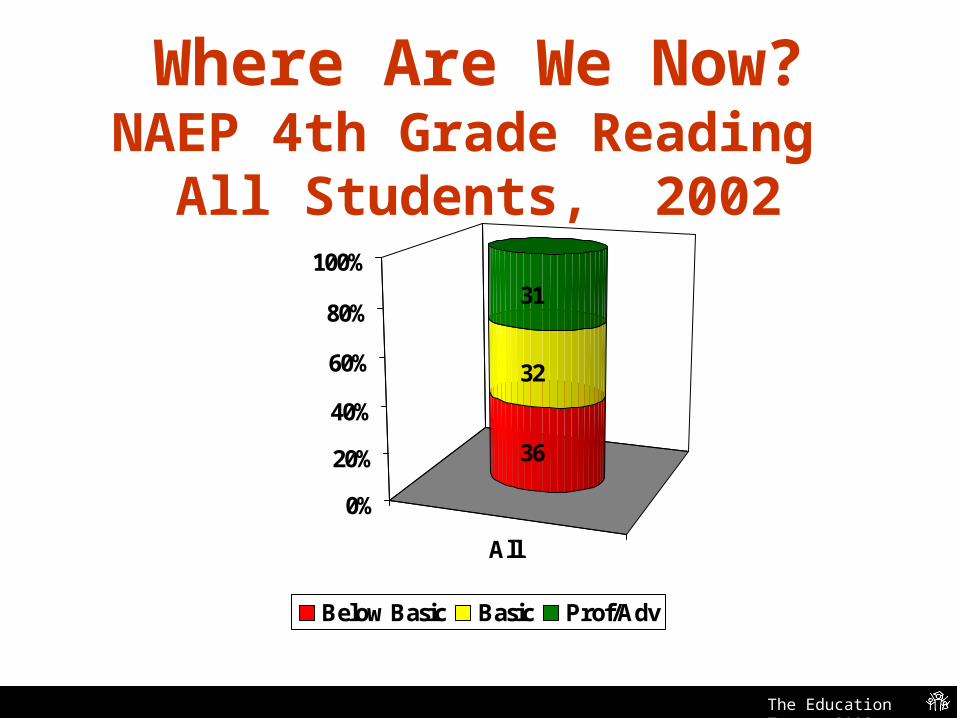
Where Are We Now?NAEP 4th Grade Reading
All Students, 2002
All
36
32
31
0%
20%
40%
60%
80%
100%
Below Basic Basic Prof/Adv
The Education Trust, 2003
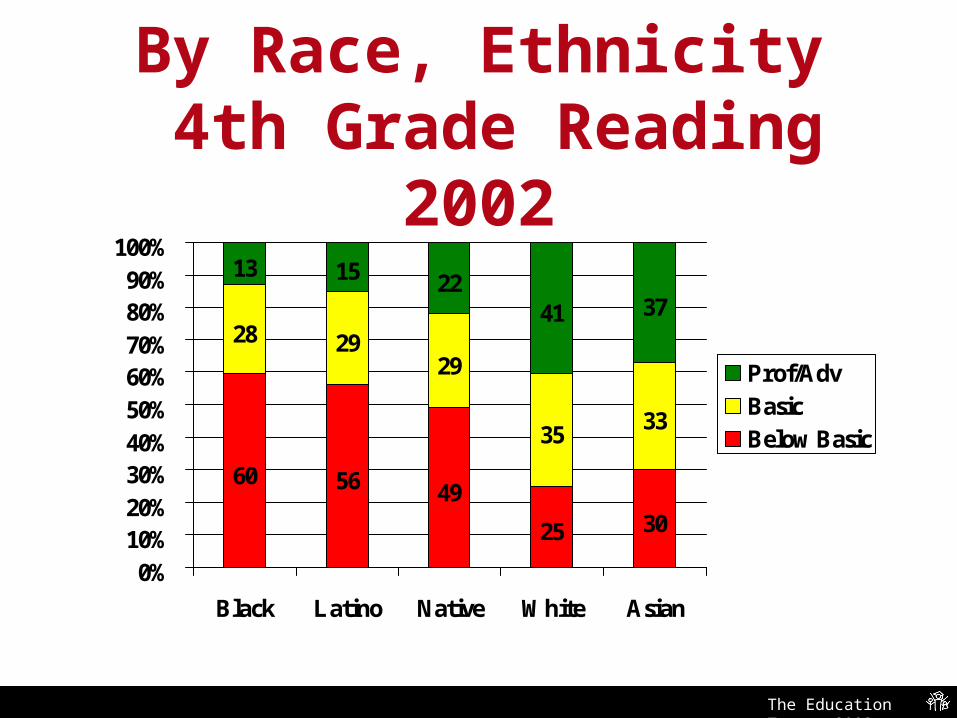
By Race, Ethnicity 4th Grade Reading 2002
60 56 49
25 30
28 2929
3533
13 15 2241 37
0%10%20%30%40%50%60%70%80%90%
100%
Black Latino Native White Asian
Prof/AdvBasicBelow Basic
The Education Trust, 2003
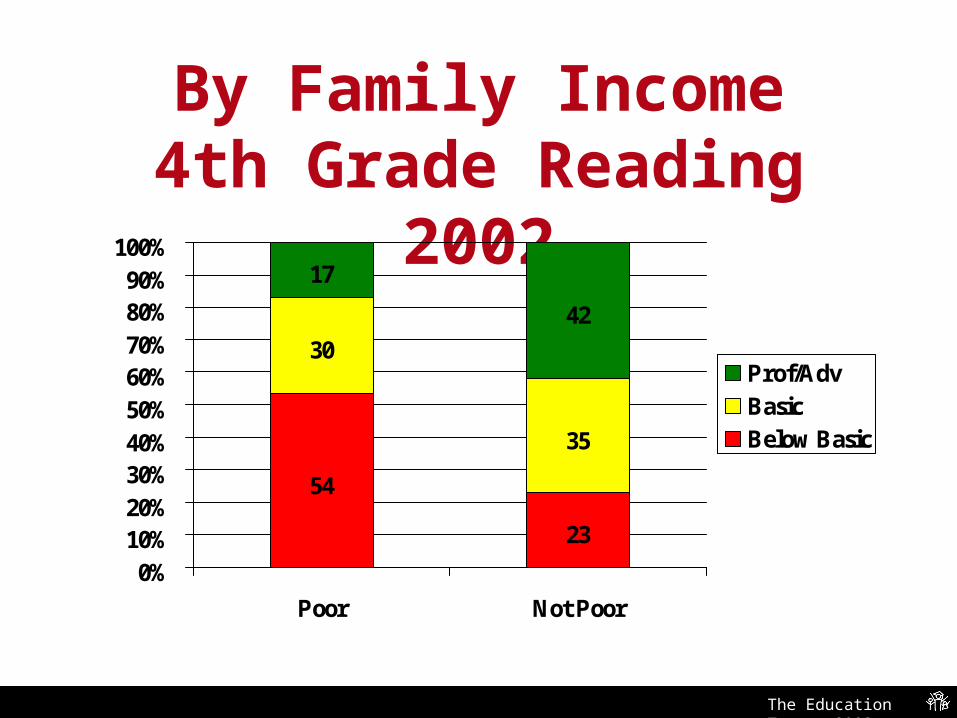
By Family Income4th Grade Reading 2002
54
23
30
35
17
42
0%10%20%30%40%50%60%70%80%90%
100%
Poor Not Poor
Prof/AdvBasicBelow Basic
The Education Trust, 2003
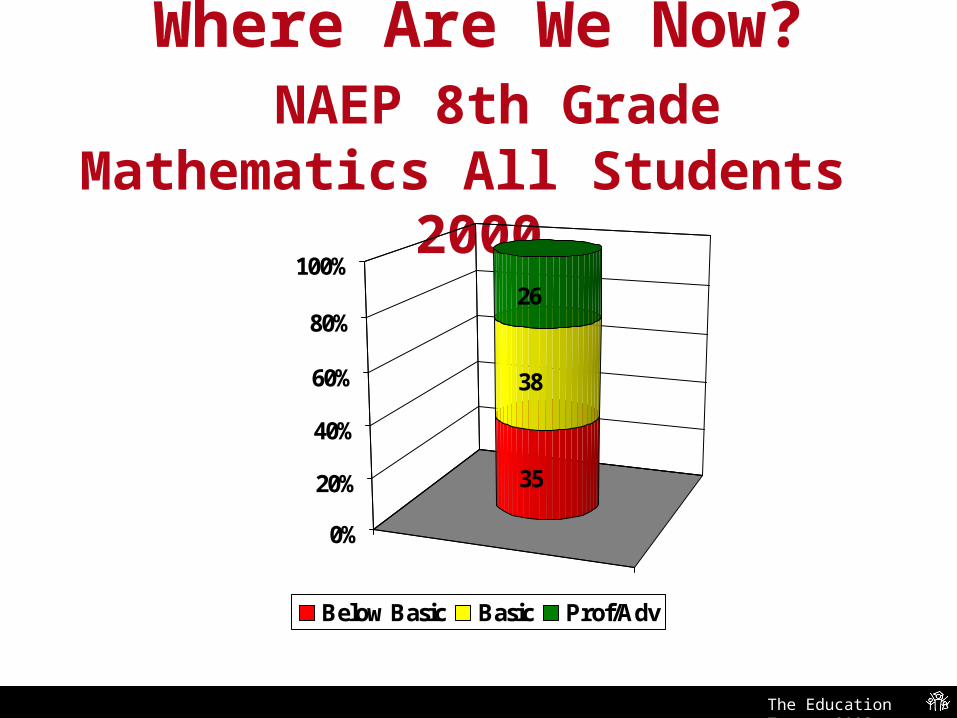
Where Are We Now? NAEP 8th Grade Mathematics All
Students 2000
35
38
26
0%
20%
40%
60%
80%
100%
Below Basic Basic Prof/Adv
The Education Trust, 2003
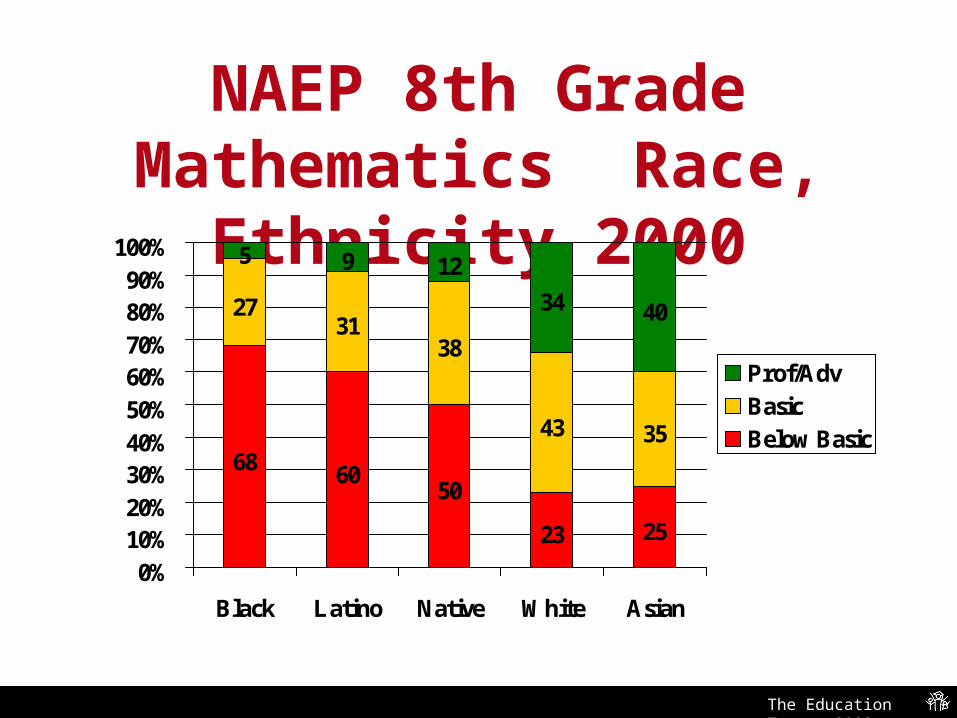
NAEP 8th Grade Mathematics Race, Ethnicity 2000
68 6050
23 25
2731
38
43 35
5 9 12
34 40
0%10%20%30%40%50%60%70%80%90%
100%
Black Latino Native White Asian
Prof/AdvBasicBelow Basic
The Education Trust, 2003
Progress Over Time?Progress Over Time?
The Education Trust, 2003
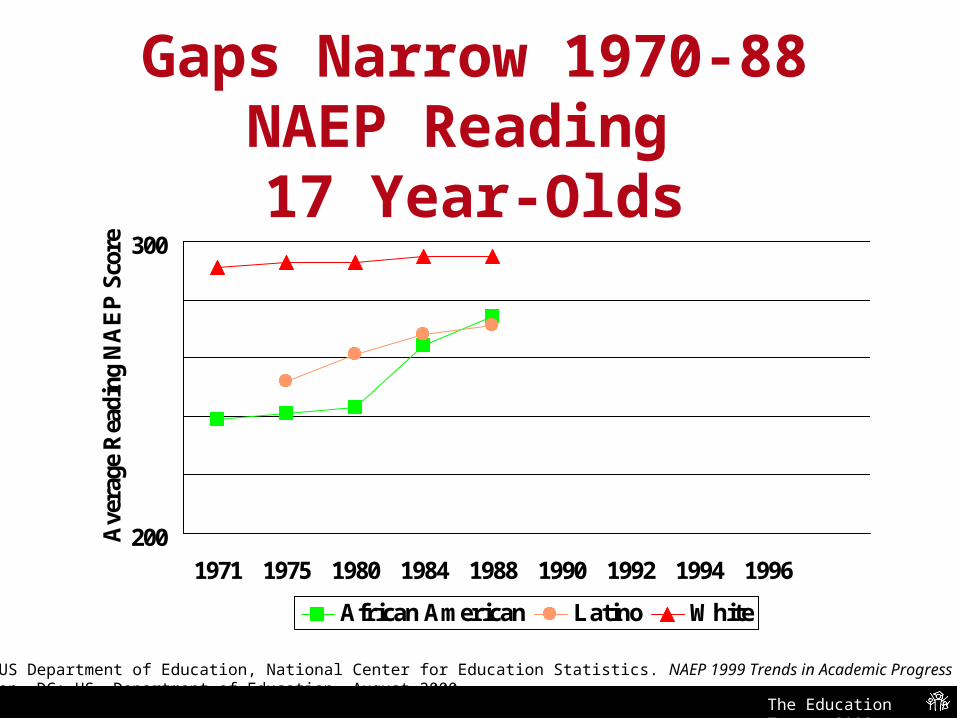
Gaps Narrow 1970-88NAEP Reading
17 Year-Olds
200
300
1971 1975 1980 1984 1988 1990 1992 1994 1996
Ave
rage
Rea
ding
NA
EP
Sco
re
African American Latino White
Source: US Department of Education, National Center for Education Statistics. NAEP 1999 Trends in Academic Progress (p. 107) Washington, DC: US Department of Education, August 2000
The Education Trust, 2003
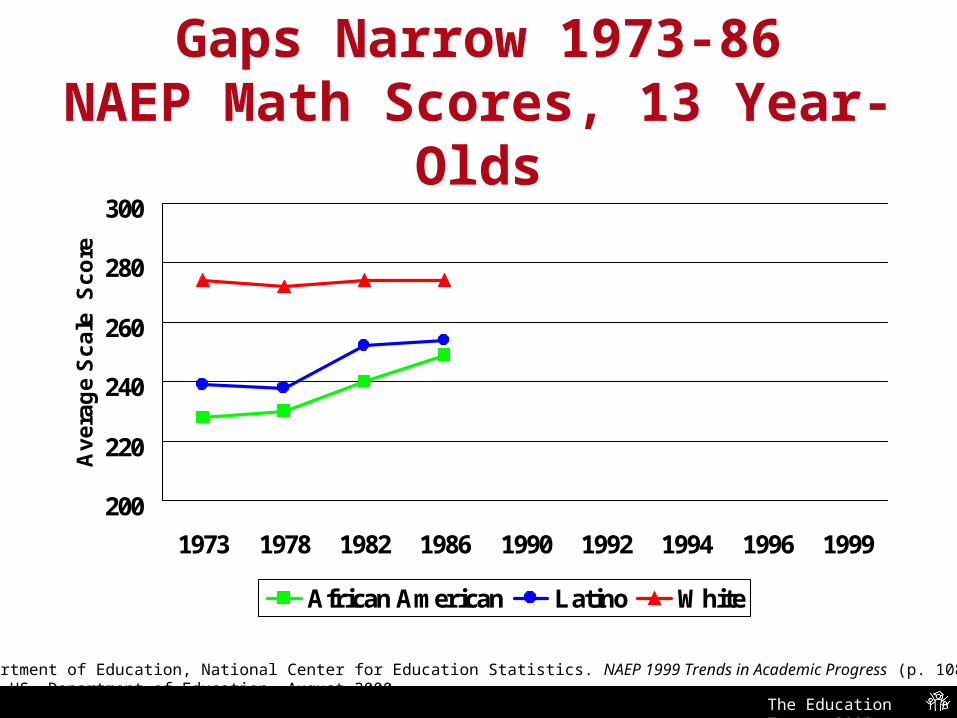
Gaps Narrow 1973-86NAEP Math Scores, 13 Year-Olds
200
220
240
260
280
300
1973 1978 1982 1986 1990 1992 1994 1996 1999
Av
era
ge
Sc
ale
S
co
re
African American Latino White
Source: US Department of Education, National Center for Education Statistics. NAEP 1999 Trends in Academic Progress (p. 108) Washington, DC: US Department of Education, August 2000
The Education Trust, 2003
Between 1988-90, that Between 1988-90, that progress came to a halt…and progress came to a halt…and
gaps began to widen once gaps began to widen once again.again.
The Education Trust, 2003
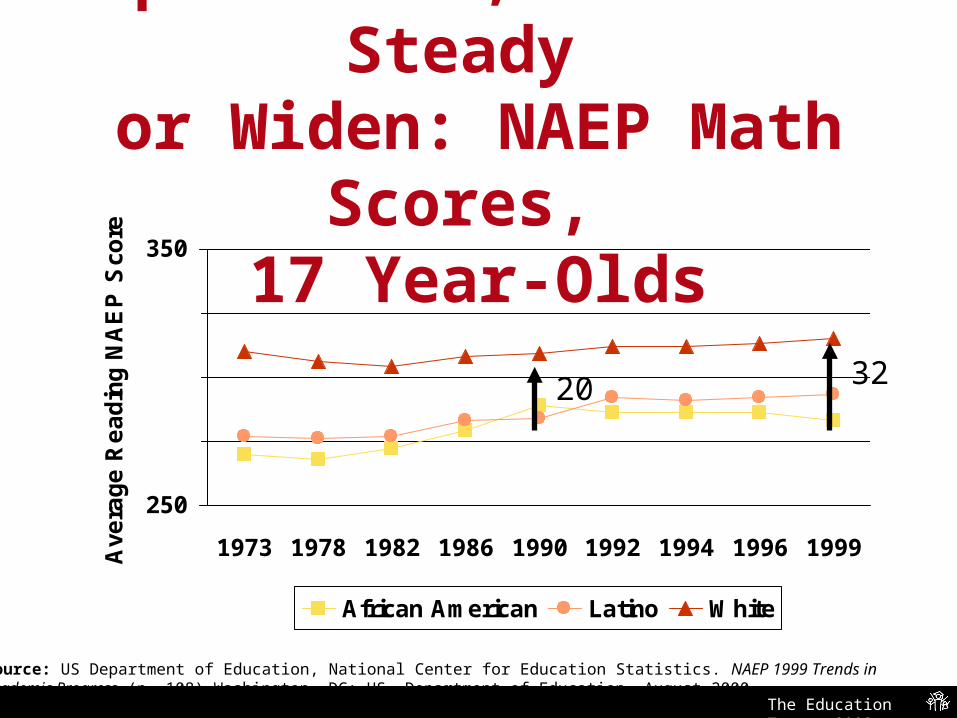
Source: US Department of Education, National Center for Education Statistics. NAEP 1999 Trends in Academic Progress (p. 108) Washington, DC: US Department of Education, August 2000
Gaps Narrow, Then Hold Steady or Widen: NAEP Math Scores,
17 Year-Olds
250
350
1973 1978 1982 1986 1990 1992 1994 1996 1999Ave
rage R
eadin
g N
AE
P S
core
African American Latino White
20 32
The Education Trust, 2003
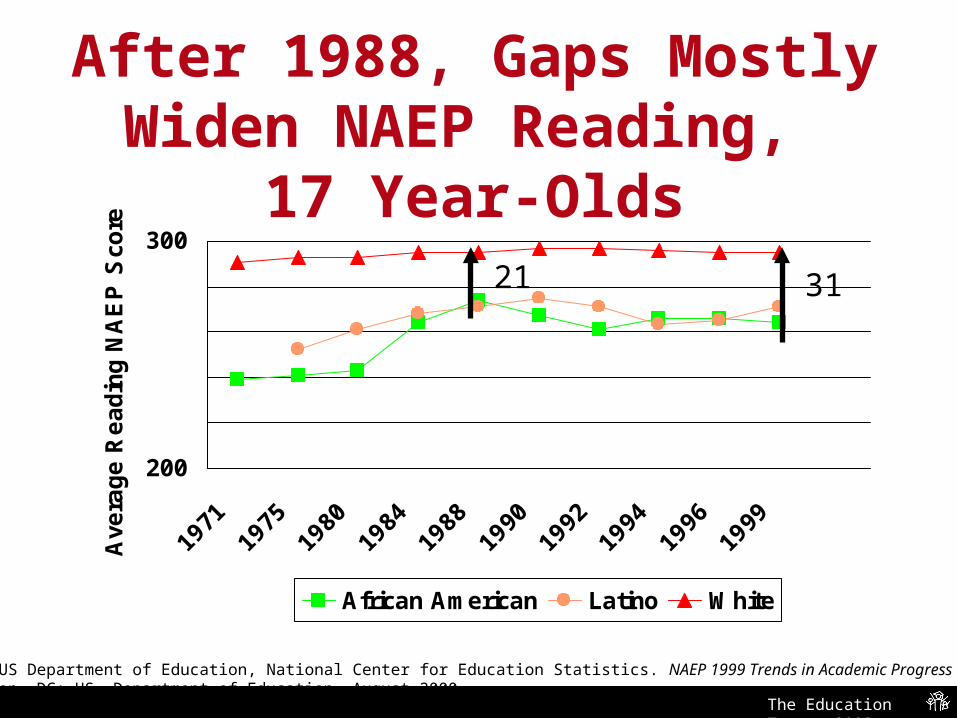
After 1988, Gaps Mostly Widen NAEP Reading,
17 Year-Olds
200
300
1971
1975
1980
1984
1988
1990
1992
1994
1996
1999
Ave
rage R
eadin
g N
AE
P S
core
African American Latino White
Source: US Department of Education, National Center for Education Statistics. NAEP 1999 Trends in Academic Progress (p. 107) Washington, DC: US Department of Education, August 2000
21 31

The Education Trust, 2003
AT END OF HIGH AT END OF HIGH SCHOOL?SCHOOL?

The Education Trust, 2003
African American and Latino 17 Year Olds Do Math at Same Levels
As White 13 Year Olds
0%
100%
200 250 300 350
White 8th Graders African American 12th GradersLatino 12th Graders
Source: NAEP 1999 Long Term Trends Summary Tables (online)
The Education Trust, 2003
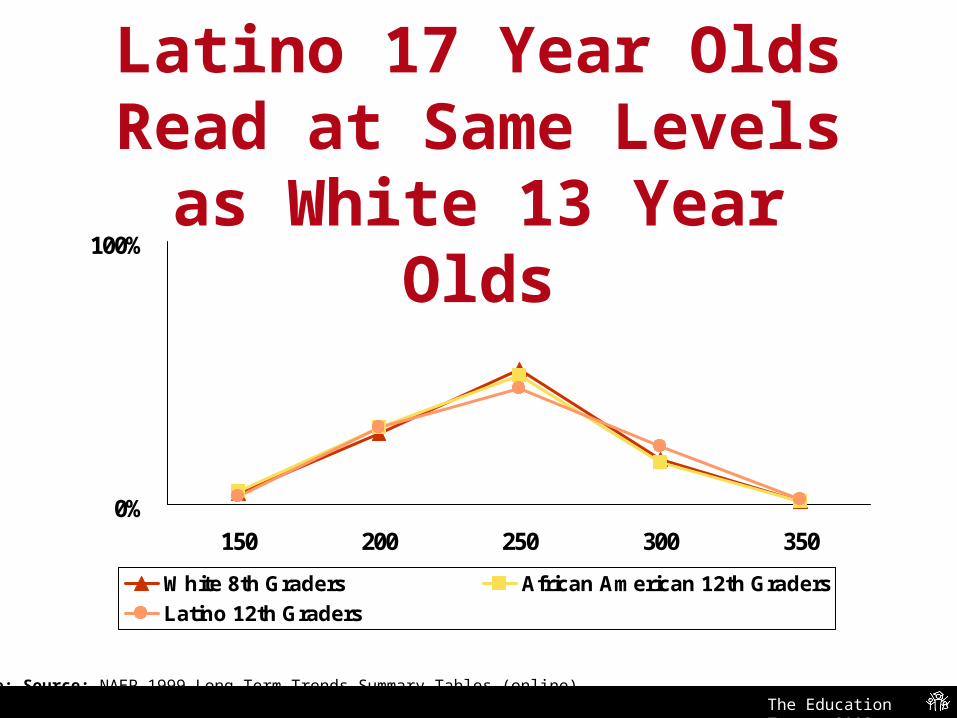
African American and Latino 17 Year Olds Read at Same Levels
as White 13 Year Olds
Source: Source: NAEP 1999 Long Term Trends Summary Tables (online)
0%
100%
150 200 250 300 350
White 8th Graders African American 12th Graders
Latino 12th Graders
The Education Trust, 2003
ADD IT ALL UP...ADD IT ALL UP...
The Education Trust, 2003
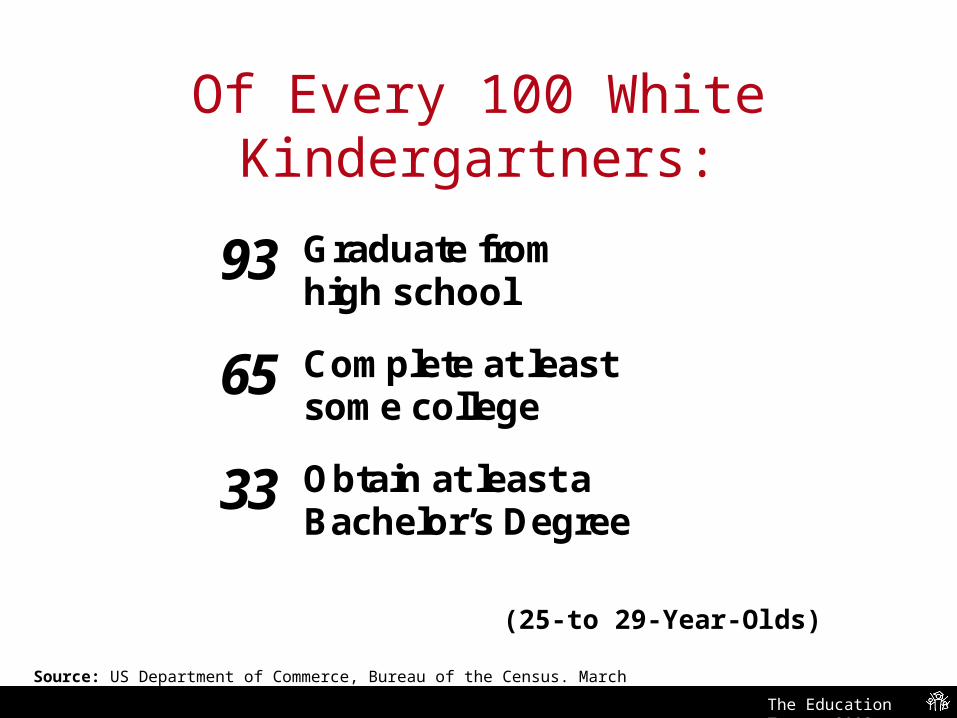
Of Every 100 White Kindergartners:
93 Graduate from high school
65 Complete at least some college
33 Obtain at least a Bachelor’s Degree
(25-to 29-Year-Olds)
Source: US Department of Commerce, Bureau of the Census. March Current Population Surveys, 1971-2001, in The Condition of Education 2002.
The Education Trust, 2003
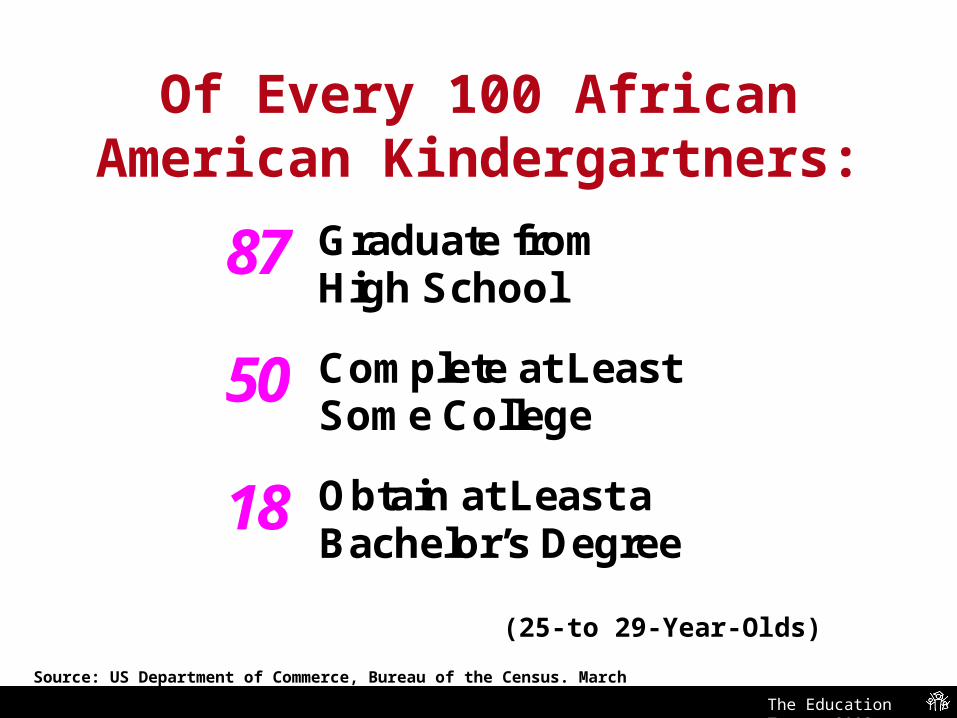
Of Every 100 African American Kindergartners:
87 Graduate from High School
50 Complete at Least Some College
18 Obtain at Least a Bachelor’s Degree
(25-to 29-Year-Olds)
Source: US Department of Commerce, Bureau of the Census. March Current Population Survey, 1971-2001, In The Condition of Education 2002.
The Education Trust, 2003
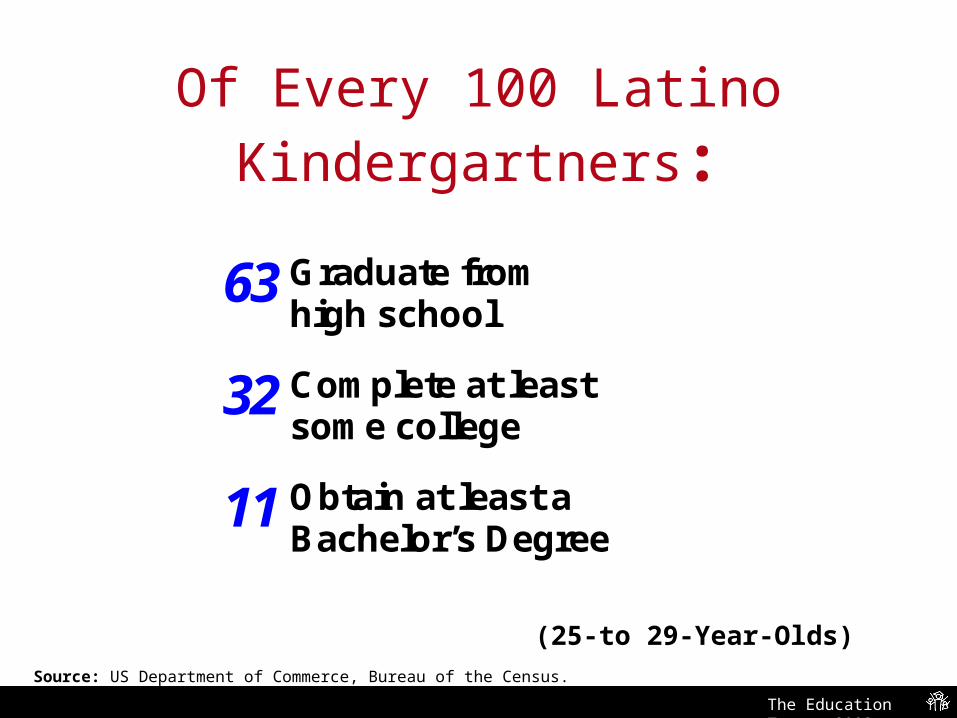
Of Every 100 Latino Kindergartners:
63 Graduate from high school
32 Complete at least some college
11 Obtain at least a Bachelor’s Degree
(25-to 29-Year-Olds)
Source: US Department of Commerce, Bureau of the Census. March Current Population Surveys, 1971-2001, In The condition of Education 2002.

The Education Trust, 2003
College Graduates by Age 26
Young People From High Income Families
60%
Young People From Low Income Families
7%
Source: Tom Mortenson, Research Seminar on Public Policy Analysis of Opportunity for Post Secondary, 1997.
The Education Trust, 2003
Some education “leaders” are talking about the challenges in
closing these gaps one way……
The Education Trust, 2003
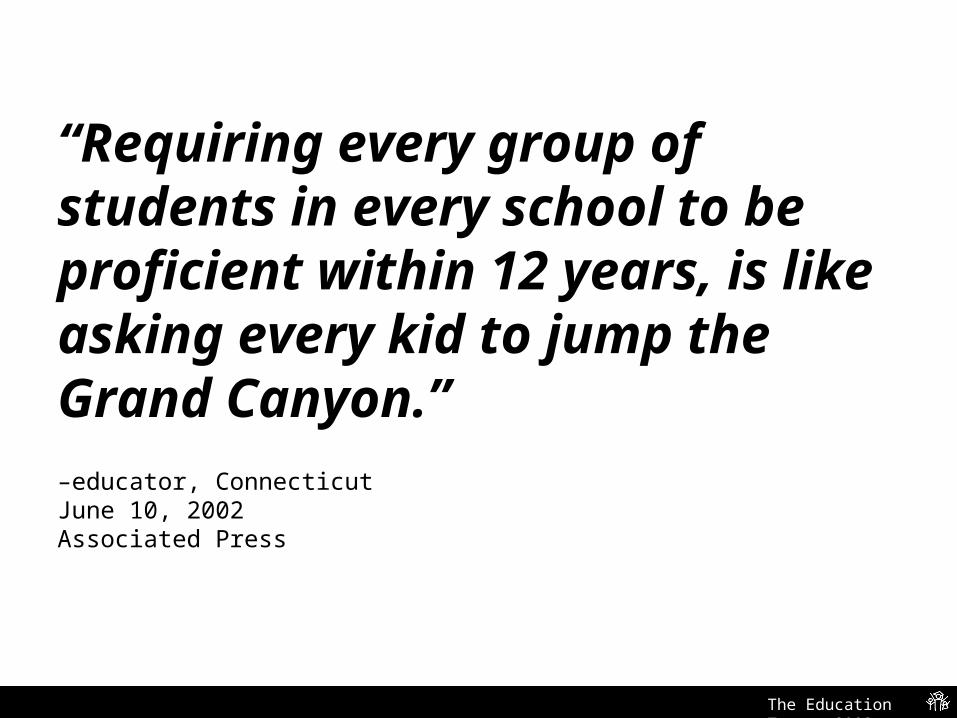
“Requiring every group of students in every school to be proficient within 12 years, is like asking every kid to jump the Grand Canyon.”–educator, ConnecticutJune 10, 2002Associated Press
The Education Trust, 2003
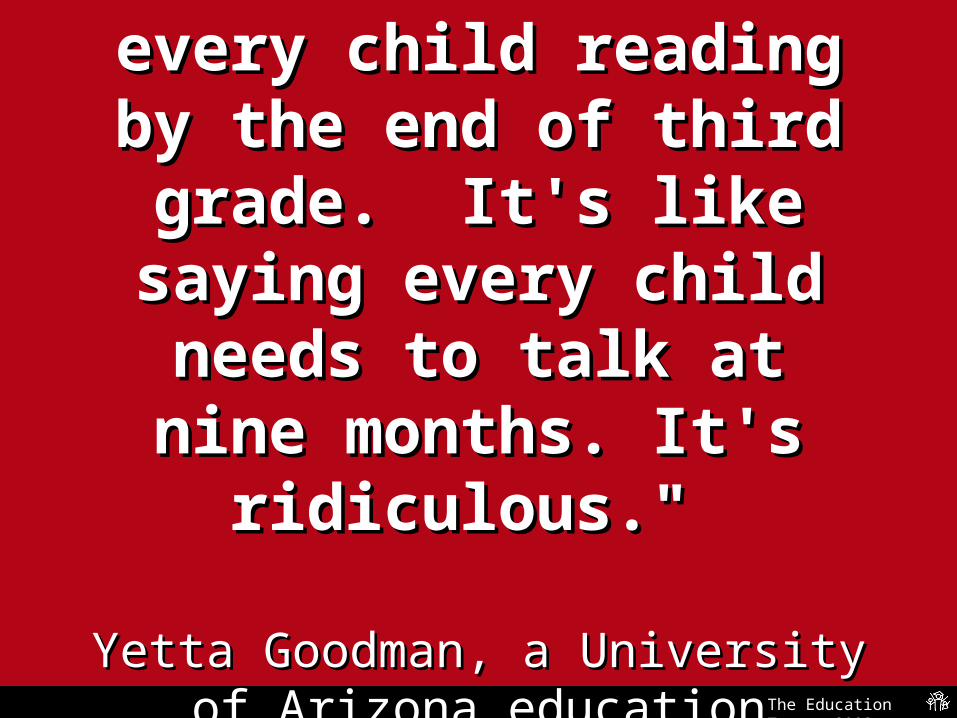
"President Bush often talks "President Bush often talks about every child reading by about every child reading by
the end of third grade. It's like the end of third grade. It's like saying every child needs to talk saying every child needs to talk at nine months. It's ridiculous." at nine months. It's ridiculous."
Yetta Goodman, a University of Arizona Yetta Goodman, a University of Arizona education professor, education professor, The Arizona RepublicThe Arizona Republic, ,
6/2/036/2/03
The Education Trust, 2003
"It is so inflexible. If any group of kids fails to meet the standard, the whole school is labeled as failing.”–suburban superintendent (used to doing extremely well under old system of averages)
The Education Trust, 2003
Even if schools are doing extremely well, they can be cited for poor performance if designated
groups of students or minorities do not meet annual expectations two years in a row. Under this standard it is theoretically possible to have
sanctions imposed on schools in our state where there are dozens of Illinois state scholars.”
– Larry Vigon, Local School Council teacher representative (Chicago) in a letter to the Chicago Tribune, 8/26/03
The Education Trust, 2003
"I have difficulty with the standards because they're so unattainable for so many of our students . . . We just don't have the same kids they have on Long Island or Orchard Park.”–Superintendent, New York October 21, 2002, The Buffalo News
The Education Trust, 2003
"If a school has five subgroups (of "If a school has five subgroups (of students) and four do well, but students) and four do well, but one fails, the entire school is a one fails, the entire school is a
failure. We don't think that's fair.” failure. We don't think that's fair.”
Reg Weaver, President of the NEA, Reg Weaver, President of the NEA, Whittier Daily Whittier Daily NewsNews, 5/24/03, 5/24/03
The Education Trust, 2003
“They may as well have decreed that pigs can fly . . . I think the State Board of Education is dealing with reality, not myth. Some of these politicians just have their heads in the sand.”-Wayne Johnson, CTA PresidentLos Angeles TimesAugust 6, 2002
The Education Trust, 2003
““If we could do it, we If we could do it, we already would have.” already would have.”
-- Peter Gutierrez, assistant superintendent of the -- Peter Gutierrez, assistant superintendent of the Hollister School District, Hollister School District, Hollister Free LanceHollister Free Lance (CA), (CA),
4/30/034/30/03
The Education Trust, 2003
Think about the messages in what they say…
To parents…about whose kids matter; To students…about how much educators
think they can learn; and, To teachers…about whether they even have
to try.
The Education Trust, 2003
Myths and RealitiesMyths and Realities
The Education Trust, 2003
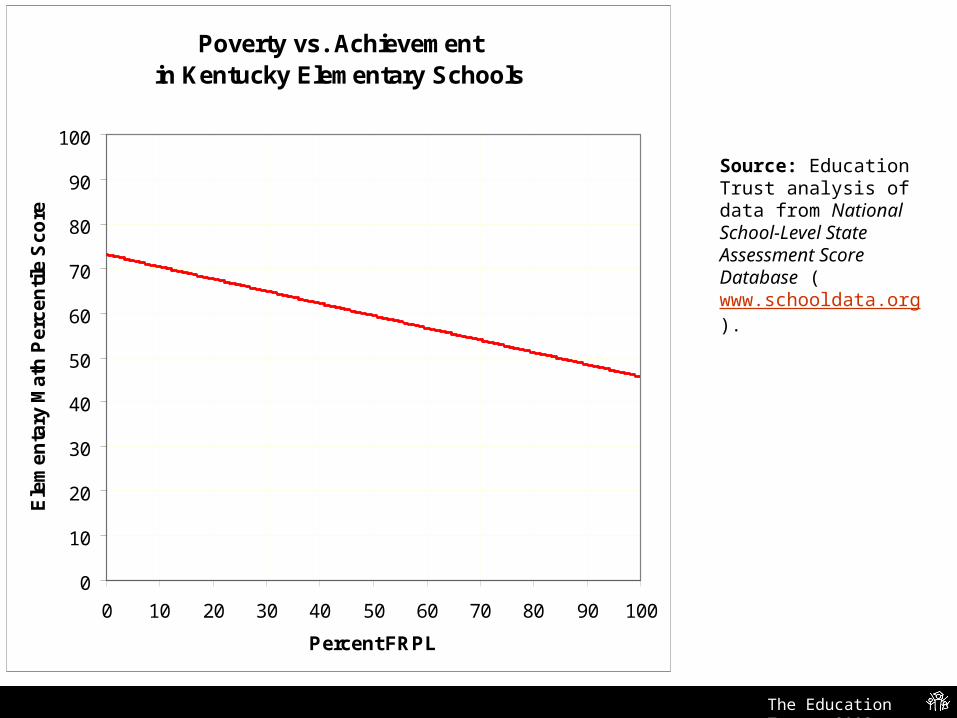
#1. Poverty has a bigger effect than anything that educators
can ever do.
The Education Trust, 2003
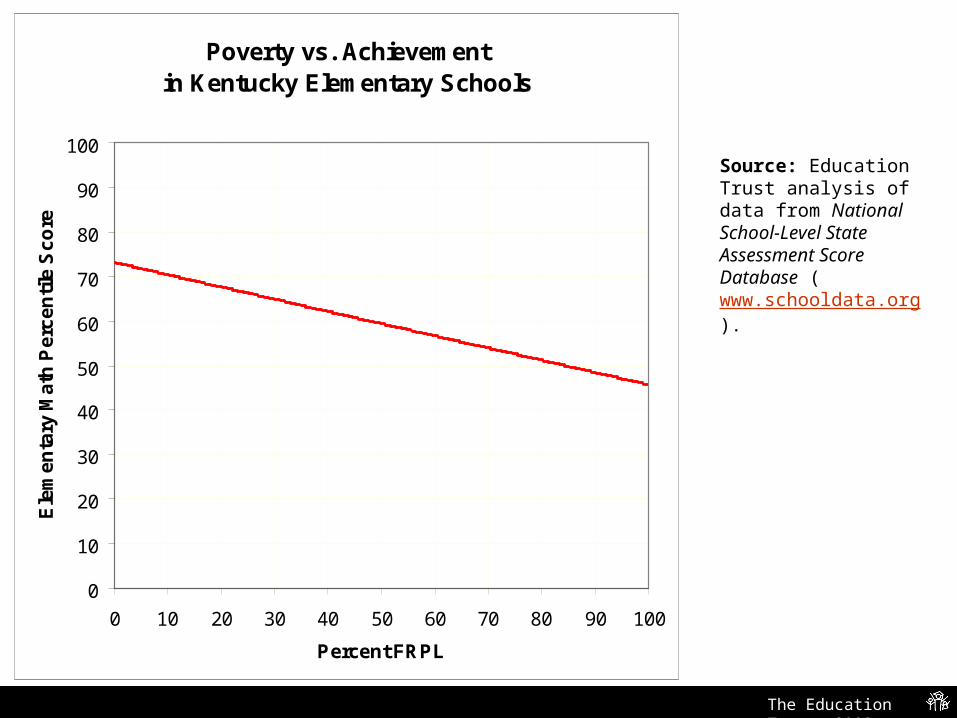
Source: Education Trust analysis of data from National School-Level State Assessment Score Database (www.schooldata.org).
Poverty vs. Achievement in Kentucky Elementary Schools
0
10
20
30
40
50
60
70
80
90
100
0 10 20 30 40 50 60 70 80 90 100
Percent FRPL
Ele
me
nta
ry M
ath
Per
ce
nti
le S
co
re
The Education Trust, 2003
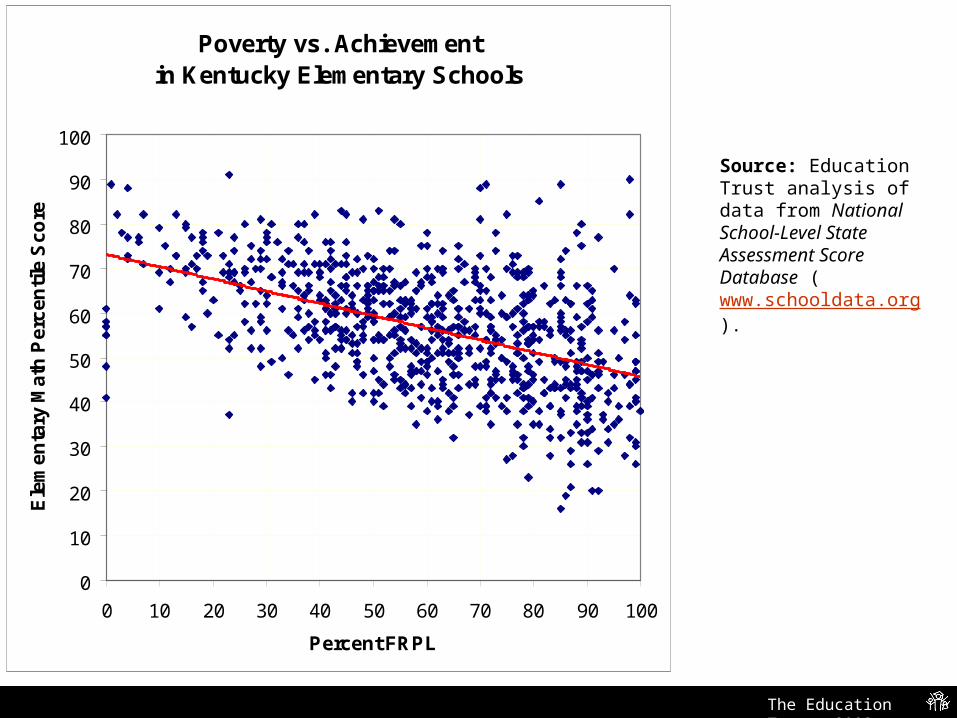
Source: Education Trust analysis of data from National School-Level State Assessment Score Database (www.schooldata.org).
Poverty vs. Achievement in Kentucky Elementary Schools
0
10
20
30
40
50
60
70
80
90
100
0 10 20 30 40 50 60 70 80 90 100
Percent FRPL
Ele
me
nta
ry M
ath
Pe
rce
nti
le S
co
re
The Education Trust, 2003
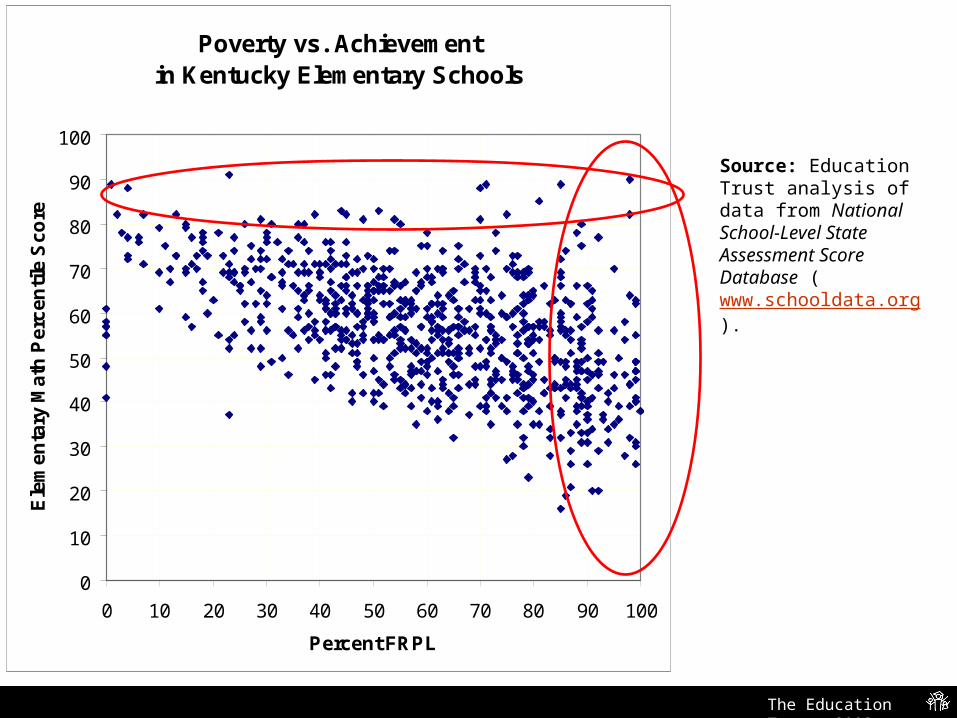
Poverty vs. Achievement in Kentucky Elementary Schools
0
10
20
30
40
50
60
70
80
90
100
0 10 20 30 40 50 60 70 80 90 100
Percent FRPL
Ele
me
nta
ry M
ath
Pe
rce
nti
le S
co
re
Source: Education Trust analysis of data from National School-Level State Assessment Score Database (www.schooldata.org).
The Education Trust, 2003
Source: Education Trust analysis of data from National School-Level State Assessment Score Database (www.schooldata.org).
Poverty vs. Achievement in Kentucky Elementary Schools
0
10
20
30
40
50
60
70
80
90
100
0 10 20 30 40 50 60 70 80 90 100
Percent FRPL
Ele
me
nta
ry M
ath
Per
ce
nti
le S
co
re
The Education Trust, 2003
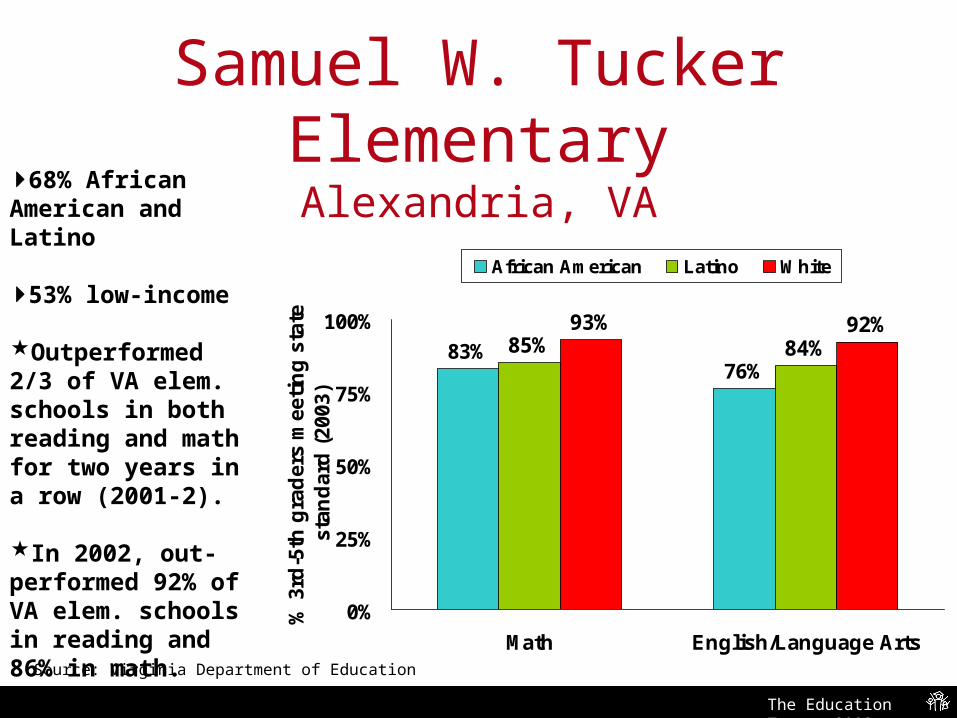
Samuel W. Tucker ElementaryAlexandria, VA
83%76%
85% 84%92%93%
0%
25%
50%
75%
100%
Math English/Language Arts
% 3
rd-5
th g
rad
ers
mee
tin
g s
tate
st
and
ard
(20
03)
African American Latino White
Source: Virginia Department of Education
68% African American and Latino
53% low-income
Outperformed 2/3 of VA elem. schools in both reading and math for two years in a row (2001-2).
In 2002, out-performed 92% of VA elem. schools in reading and 86% in math.
The Education Trust, 2003
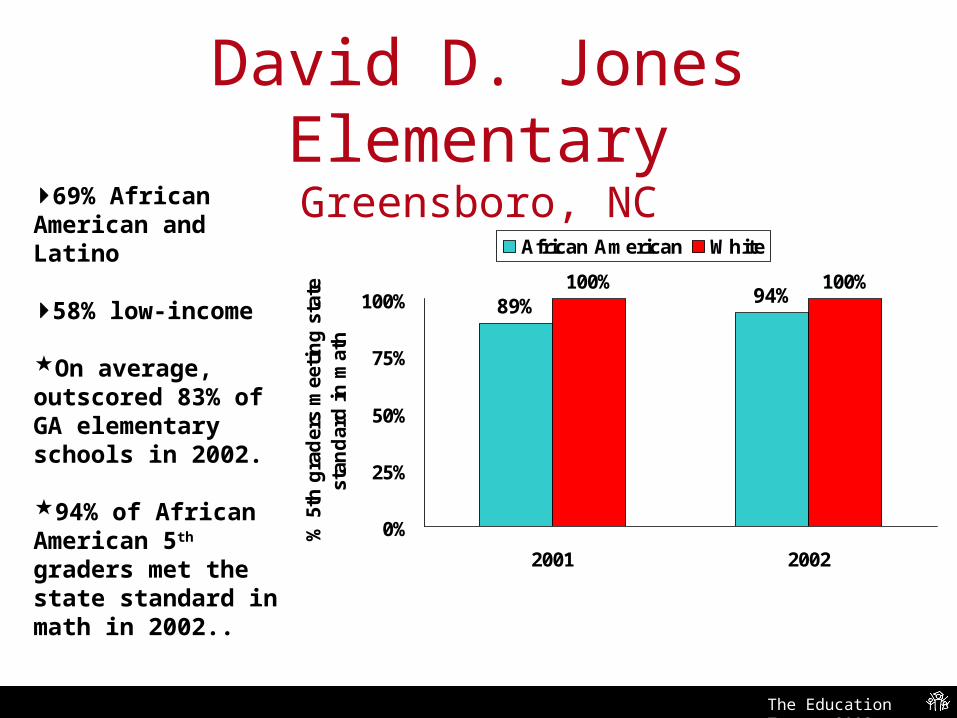
David D. Jones ElementaryGreensboro, NC
89% 94%100% 100%
0%
25%
50%
75%
100%
2001 2002
% 5
th g
rad
ers
mee
tin
g s
tate
st
and
ard
in
mat
h
African American White
Source: The Education Trust, Dispelling the Myth Online
69% African American and Latino
58% low-income
On average, outscored 83% of GA elementary schools in 2002.
94% of African American 5th graders met the state standard in math in 2002..

The Education Trust, 2003
West Manor Elementary Atlanta, GA
68%
90%
0%
25%
50%
75%
100%
% 4
th g
rad
ers
mee
tin
g s
tate
st
and
ard
in
rea
din
g
2000 2002
Source: The Education Trust, Dispelling the Myth
99% African American.
80% low-income
Outscored 98% of GA elementary schools in 2nd grade reading in 2002.
Outperformed 90% of GA elementary schools in 2nd grade math in 2002.
The Education Trust, 2003
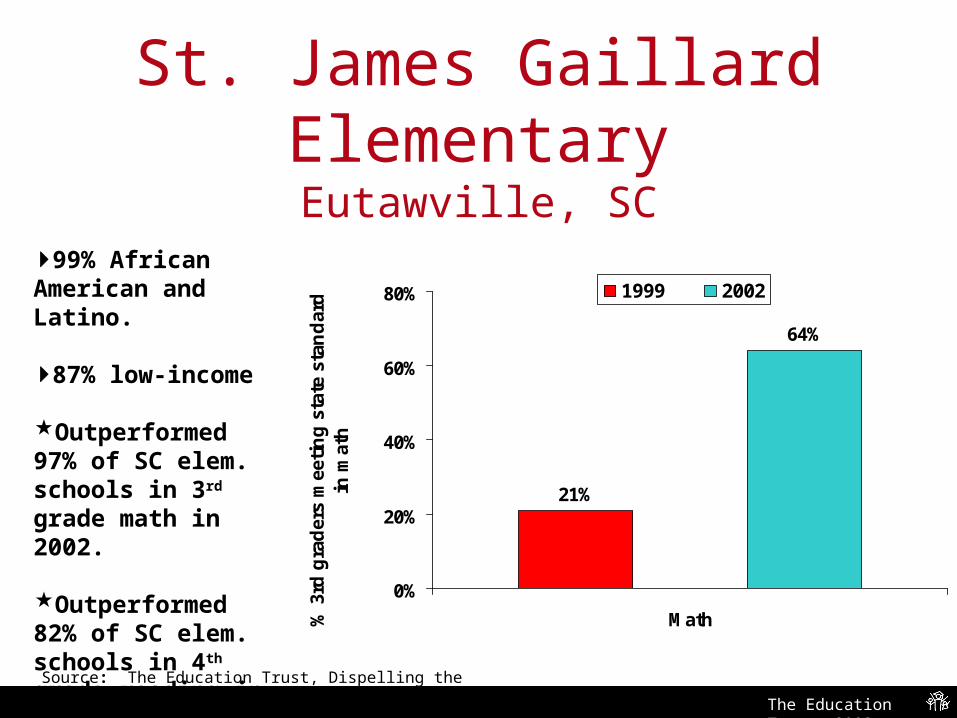
St. James Gaillard Elementary
Eutawville, SC
21%
64%
0%
20%
40%
60%
80%
Math% 3
rd g
rad
ers
mee
tin
g s
tate
sta
nd
ard
in
mat
h
1999 2002
Source: The Education Trust, Dispelling the Myths Online
99% African American and Latino.
87% low-income
Outperformed 97% of SC elem. schools in 3rd grade math in 2002.
Outperformed 82% of SC elem. schools in 4th grade reading in 2002.
The Education Trust, 2003
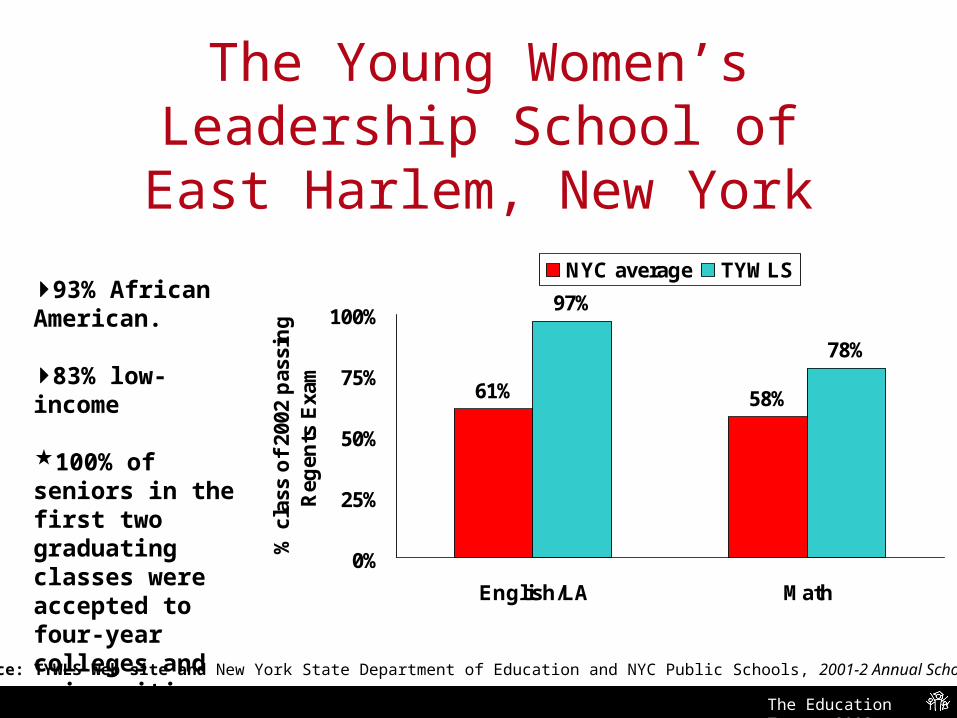
The Young Women’s Leadership School of East Harlem, New York
61% 58%
97%
78%
0%
25%
50%
75%
100%
English/LA Math
% c
lass
of
2002
pas
sin
g
Reg
ents
Exa
m
NYC average TYWLS
Source: TYWLS Web site and New York State Department of Education and NYC Public Schools, 2001-2 Annual School Report.
93% African American.
83% low-income
100% of seniors in the first two graduating classes were accepted to four-year colleges and universities.
The Education Trust, 2003
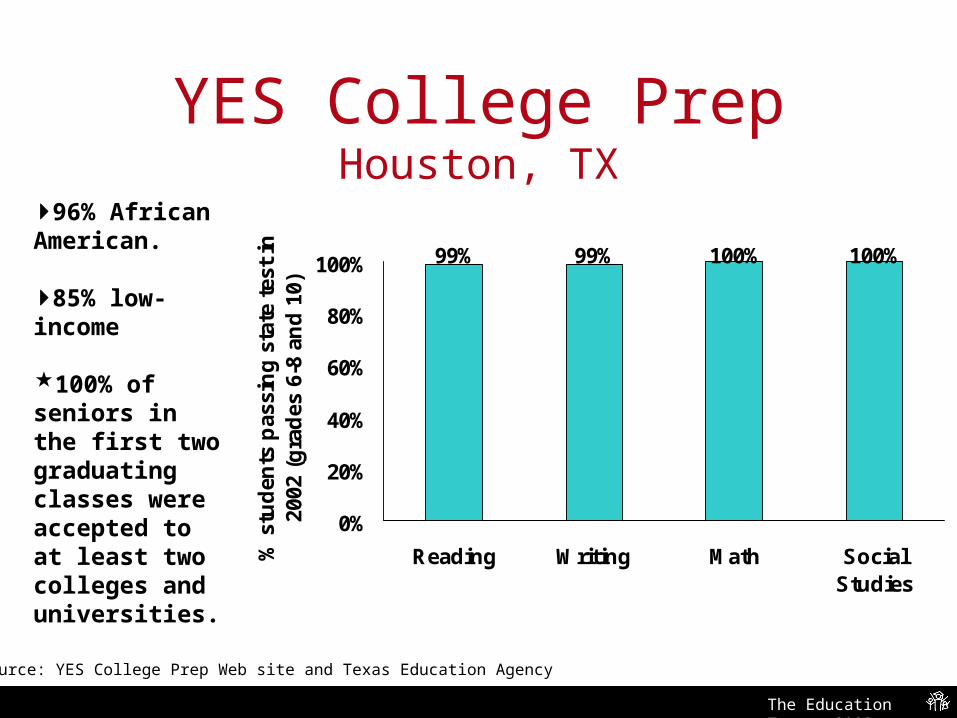
YES College PrepHouston, TX
99% 99% 100% 100%
0%
20%
40%
60%
80%
100%
Reading Writing Math SocialStudies
% s
tud
ents
pas
sin
g s
tate
tes
t in
20
02 (
gra
des
6-8
an
d 1
0)
Source: YES College Prep Web site and Texas Education Agency
96% African American.
85% low-income
100% of seniors in the first two graduating classes were accepted to at least two colleges and universities.
The Education Trust, 2003
Of course, poverty is a barrier. Of course, poverty is a barrier. And it doesn’t help to imply And it doesn’t help to imply
otherwise.otherwise.
But what’s clear from these But what’s clear from these schools, is that it is a barrier that schools, is that it is a barrier that
can be overcome.can be overcome.
The Education Trust, 2003
#2. Perhaps we could narrow the gap, but given all those
advantages, we’ll certainly never close it.
The Education Trust, 2003
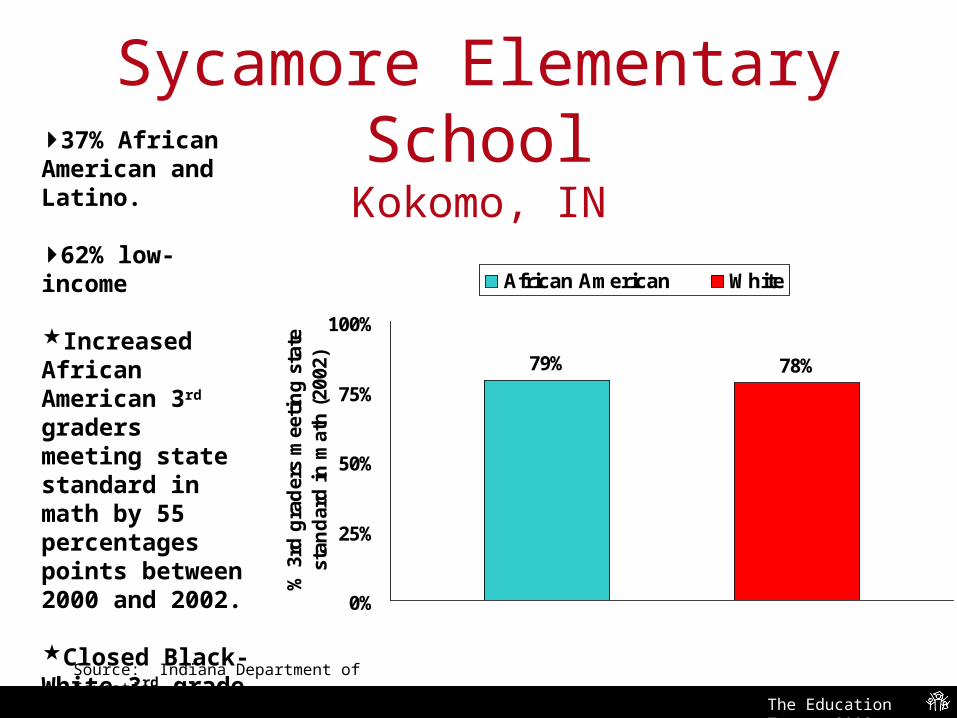
Sycamore Elementary School
Kokomo, IN
79% 78%
0%
25%
50%
75%
100%
% 3
rd g
rad
ers
mee
tin
g s
tate
st
and
ard
in
mat
h (
2002
)
African American White
Source: Indiana Department of Education
37% African American and Latino.
62% low-income
Increased African American 3rd graders meeting state standard in math by 55 percentages points between 2000 and 2002.
Closed Black-White 3rd grade reading gap.
The Education Trust, 2003
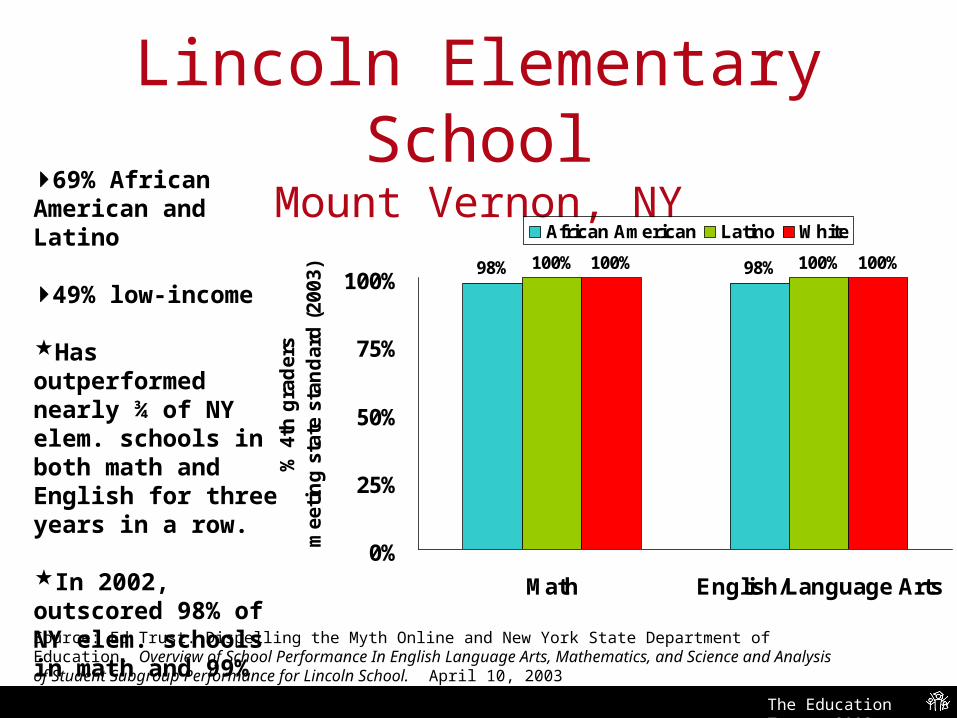
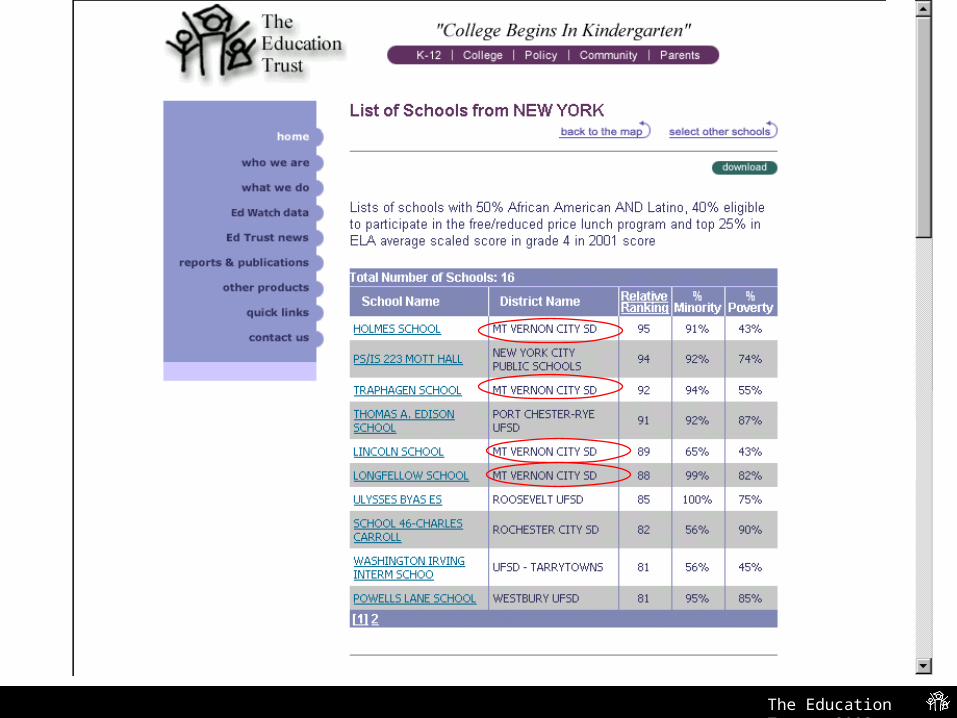
Lincoln Elementary SchoolMount Vernon, NY
98% 98%100% 100%100% 100%
0%
25%
50%
75%
100%
Math English/Language Arts
% 4
th g
rad
ers
mee
tin
g s
tate
sta
nd
ard
(20
03)
African American Latino White
Source: Ed Trust. Dispelling the Myth Online and New York State Department of Education. Overview of School Performance In English Language Arts, Mathematics, and Science and Analysis of Student Subgroup Performance for Lincoln School. April 10, 2003
69% African American and Latino
49% low-income
Has outperformed nearly ¾ of NY elem. schools in both math and English for three years in a row.
In 2002, outscored 98% of NY elem. schools in math and 99% in English.
The Education Trust, 2003
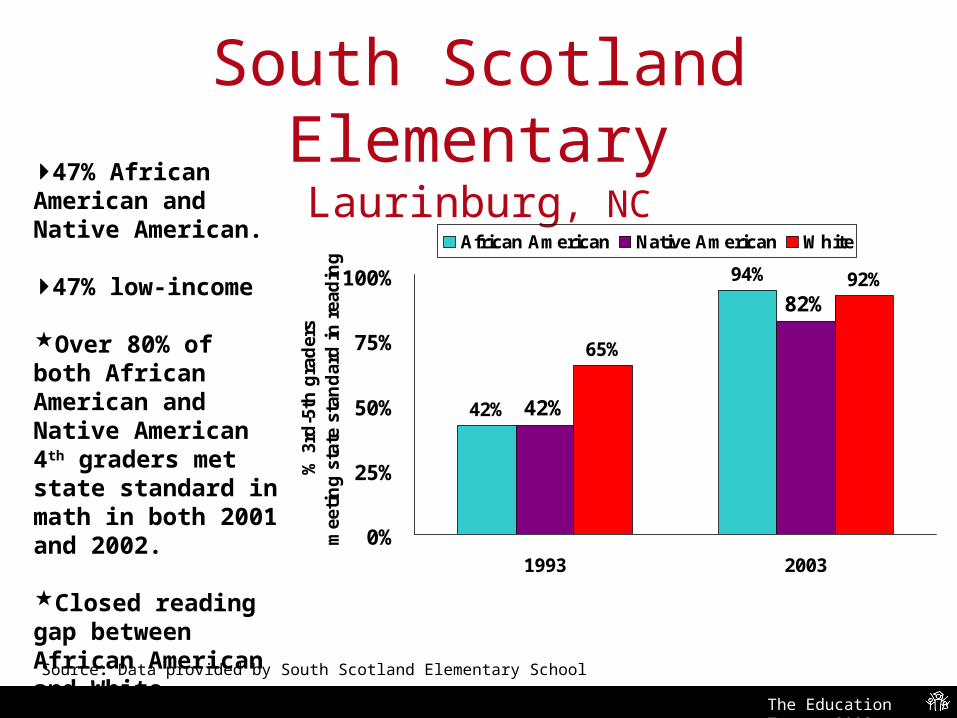
South Scotland ElementaryLaurinburg, NC
94%
42%
65%
92%
42%
82%
0%
25%
50%
75%
100%
1993 2003
% 3
rd-5
th g
rad
ers
mee
tin
g s
tate
sta
nd
ard
in
rea
din
g
African American Native American White
Source: Data provided by South Scotland Elementary School
47% African American and Native American.
47% low-income
Over 80% of both African American and Native American 4th graders met state standard in math in both 2001 and 2002.
Closed reading gap between African American and White students in 2003.
The Education Trust, 2003
#3. There may be schools, but no #3. There may be schools, but no school districts that get high school districts that get high
performance from poor children performance from poor children or children of color.or children of color.
The Education Trust, 2003

The Education Trust, 2003
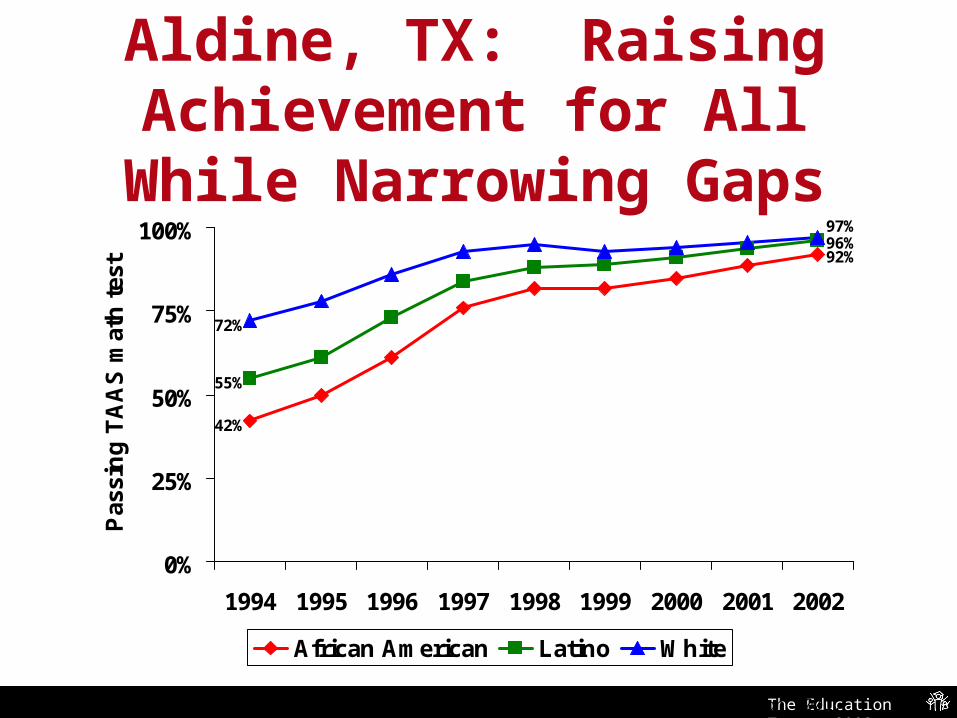
Aldine, TX: Raising Achievement for All While Narrowing Gaps
42%
55%
72%
0%
25%
50%
75%
100%
1994
Pas
sin
g T
AA
S m
ath
tes
t
African American Latino White
Source: Texas Education Agency-Academic Excellence Indicator System Report 1994 through 2001.
The Education Trust, 2003
Aldine, TX: Raising Achievement for All While Narrowing Gaps
92%96%
42%
55%
97%
72%
0%
25%
50%
75%
100%
1994 1995 1996 1997 1998 1999 2000 2001 2002
Pas
sin
g T
AA
S m
ath
tes
t
African American Latino White
Source: Texas Education Agency-Academic Excellence Indicator System Report 1994 through 2001.
The Education Trust, 2003
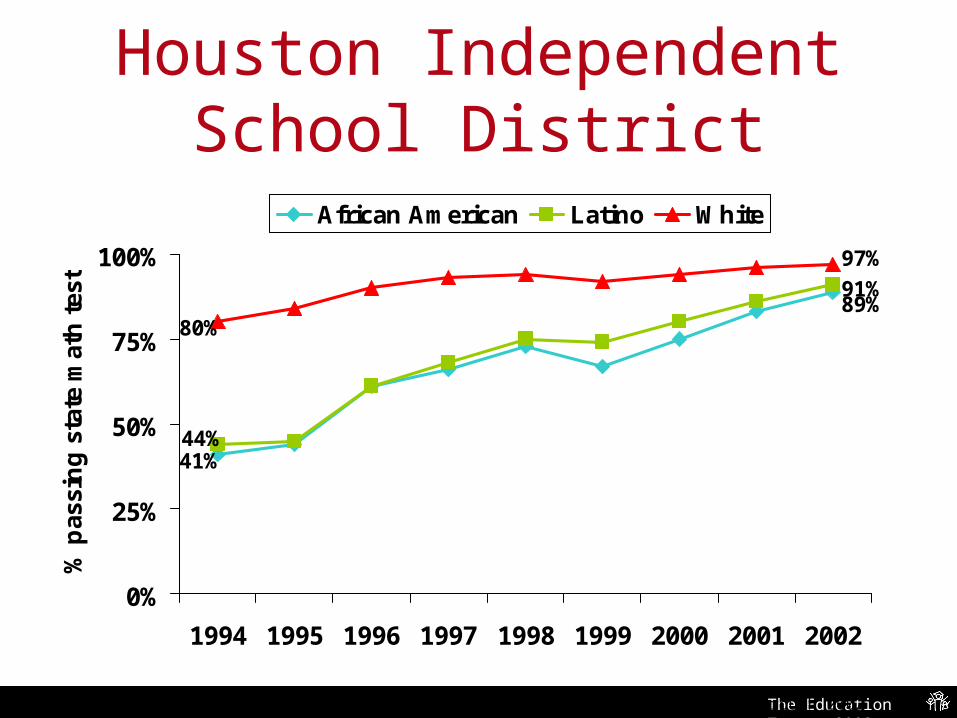
Houston Independent School District
89%
41%
91%
44%
97%
80%
0%
25%
50%
75%
100%
1994 1995 1996 1997 1998 1999 2000 2001 2002
% p
assi
ng
sta
te m
ath
tes
t
African American Latino White
Source: Texas Education Agency-Academic Excellence Indicator System Report 1994 through 2002

The Education Trust, 2003
#4. There are certainly no whole #4. There are certainly no whole states that are getting it right.states that are getting it right.
The Education Trust, 2003
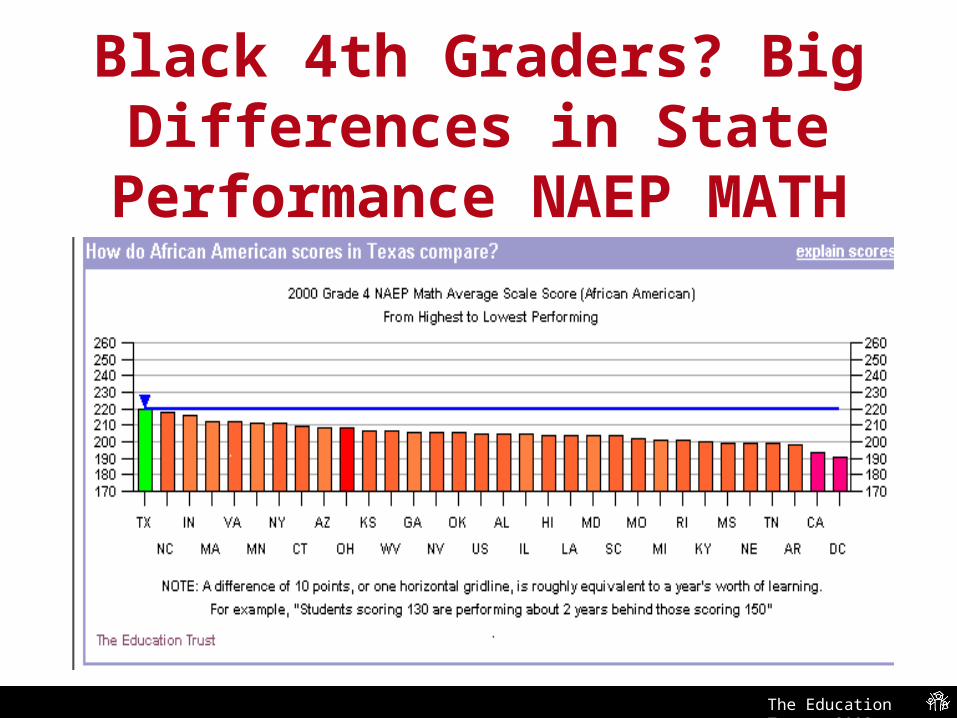
Black 4th Graders? Big Differences in State Performance
NAEP MATH
The Education Trust, 2003
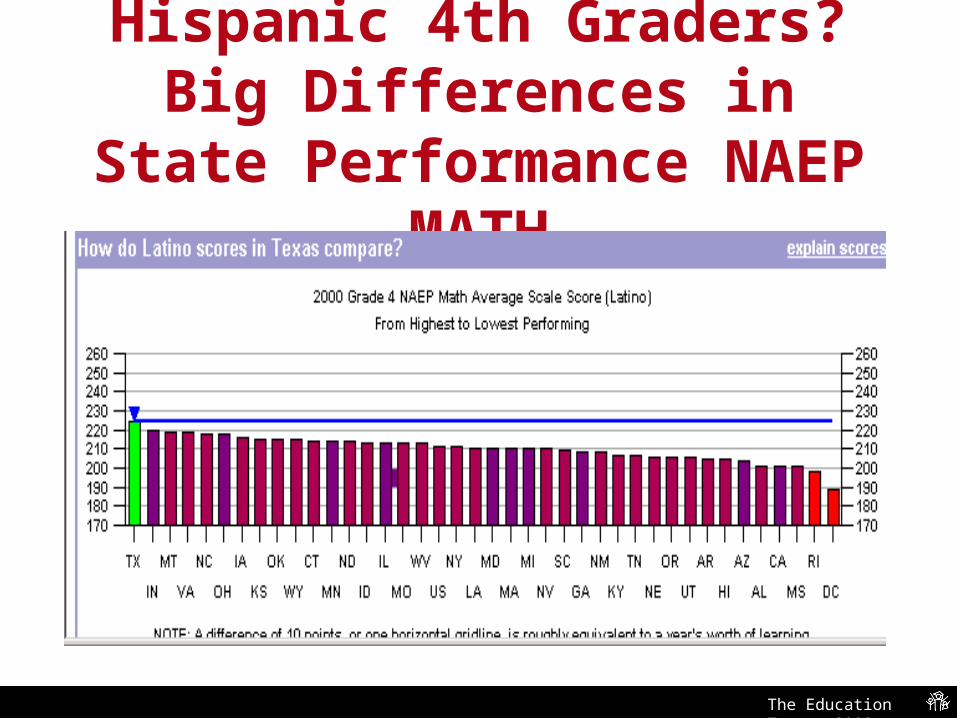
Hispanic 4th Graders? Big Differences in State Performance
NAEP MATH

The Education Trust, 2003
Black 8th Graders: Big Differences in State Performance
NAEP Math
The Education Trust, 2003
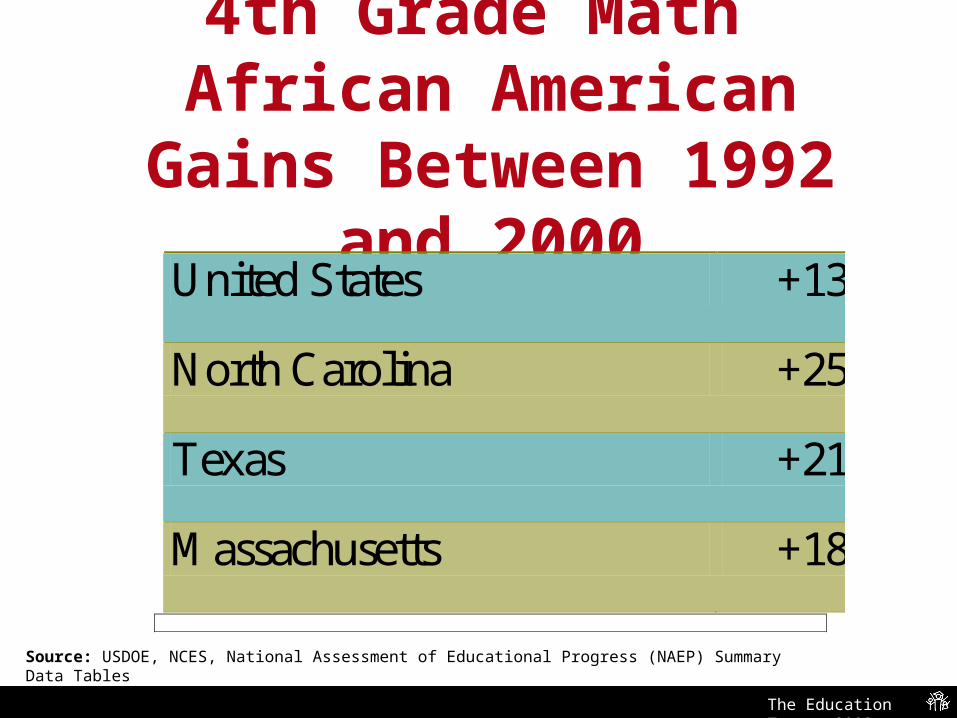
4th Grade Math African American Gains Between 1992 and 2000
United States +13
North Carolina +25
Texas +21
Massachusetts +18
Source: USDOE, NCES, National Assessment of Educational Progress (NAEP) Summary Data Tables
The Education Trust, 2003
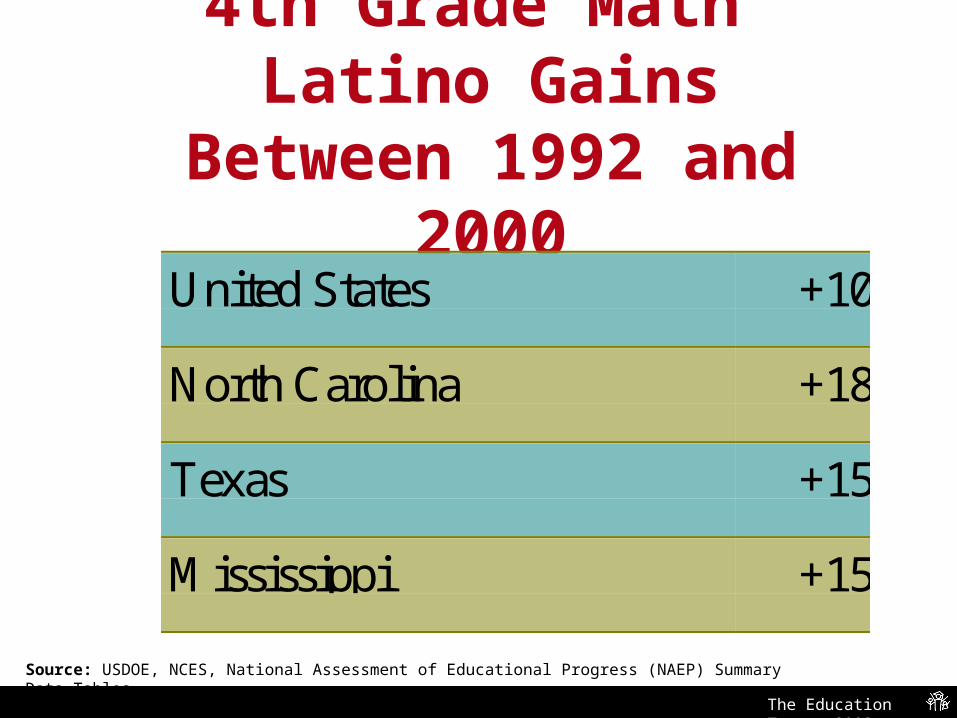
4th Grade Math Latino Gains Between 1992
and 2000United States +10
North Carolina +18
Texas +15
Mississippi +15
Source: USDOE, NCES, National Assessment of Educational Progress (NAEP) Summary Data Tables
The Education Trust, 2003
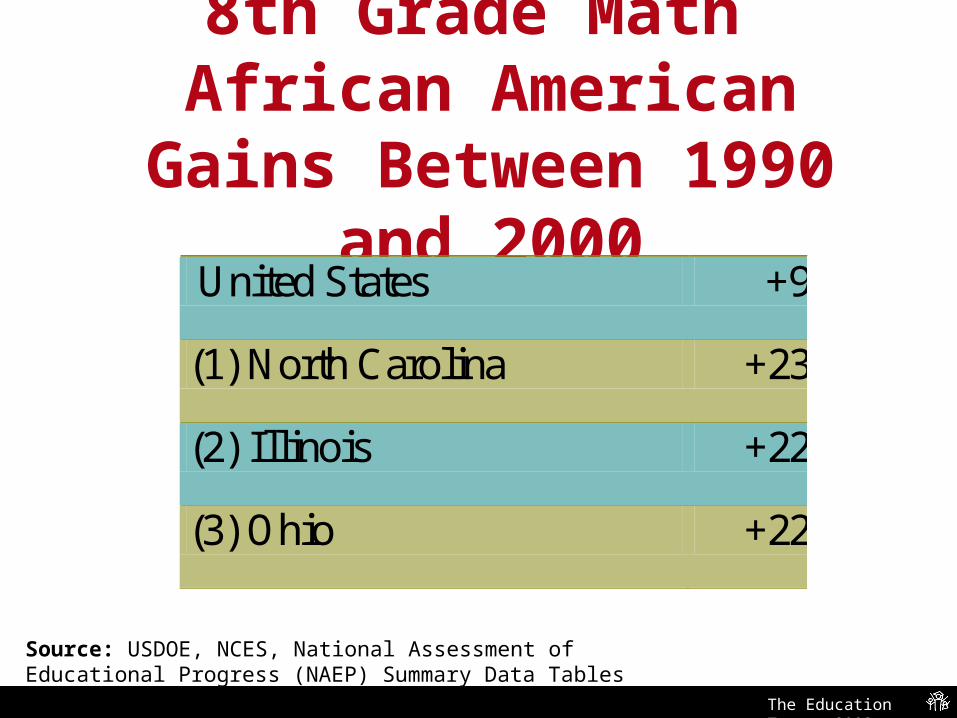
8th Grade Math African American Gains Between 1990 and 2000
United States +9
(1) North Carolina +23
(2) Illinois +22
(3) Ohio +22
Source: USDOE, NCES, National Assessment of Educational Progress (NAEP) Summary Data Tables
The Education Trust, 2003
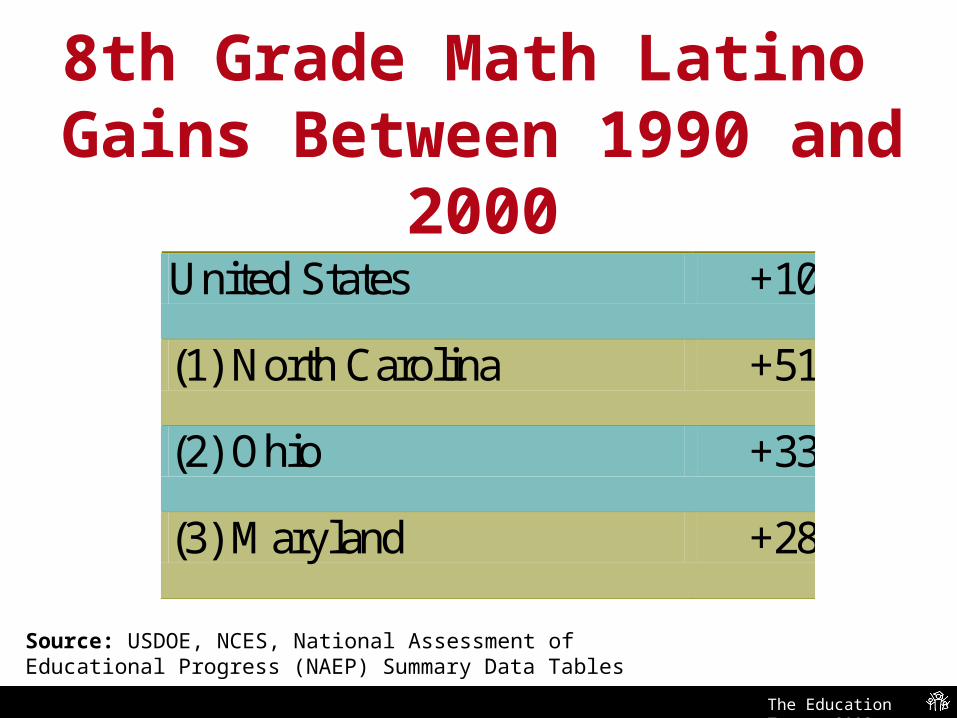
8th Grade Math Latino Gains Between 1990 and 2000
United States +10
(1) North Carolina +51
(2) Ohio +33
(3) Maryland +28
Source: USDOE, NCES, National Assessment of Educational Progress (NAEP) Summary Data Tables
The Education Trust, 2003
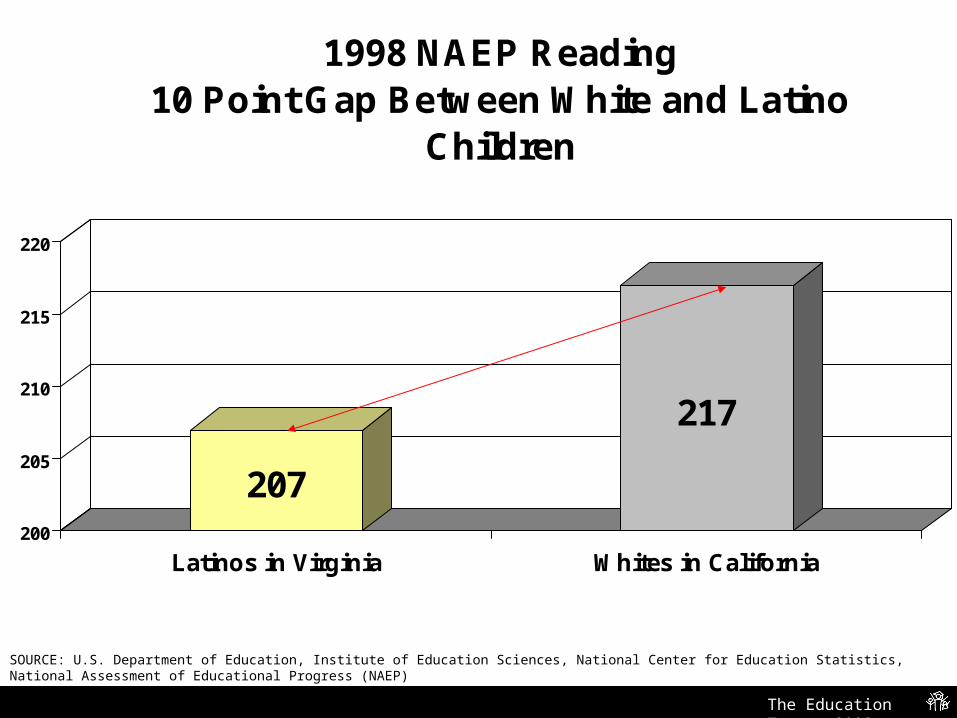
207
217
200
205
210
215
220
Latinos in Virginia Whites in California
1998 NAEP Reading10 Point Gap Between White and Latino
Children
10 point gap= 1 year worth of learning
SOURCE: U.S. Department of Education, Institute of Education Sciences, National Center for Education Statistics, National Assessment of Educational Progress (NAEP)
The Education Trust, 2003
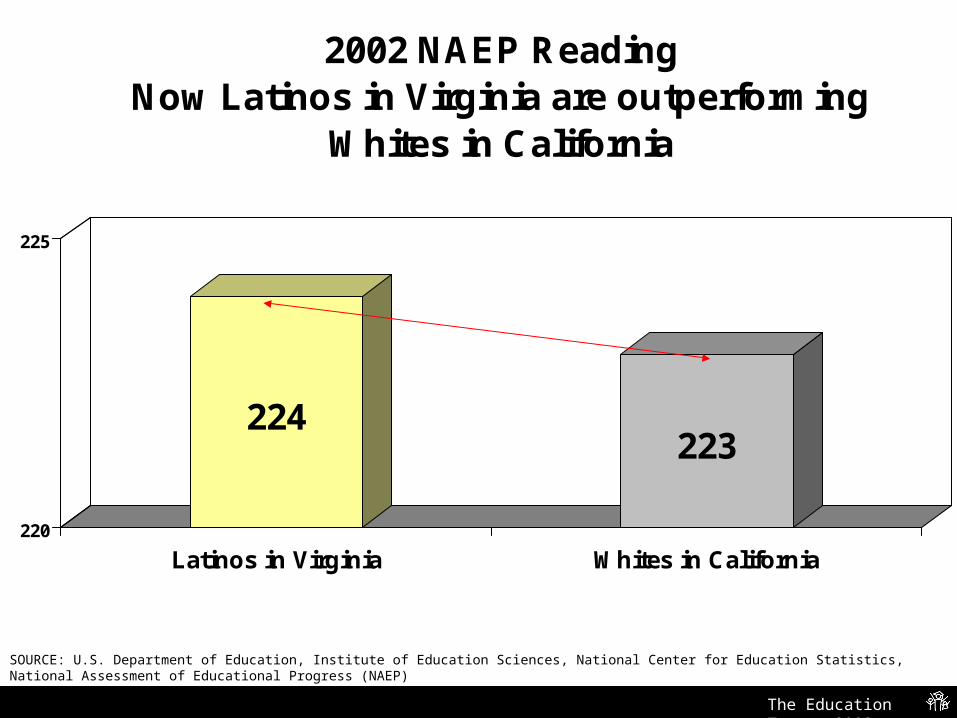
224223
220
225
Latinos in Virginia Whites in California
2002 NAEP ReadingNow Latinos in Virginia are outperforming
Whites in California
SOURCE: U.S. Department of Education, Institute of Education Sciences, National Center for Education Statistics, National Assessment of Educational Progress (NAEP)
The Education Trust, 2003
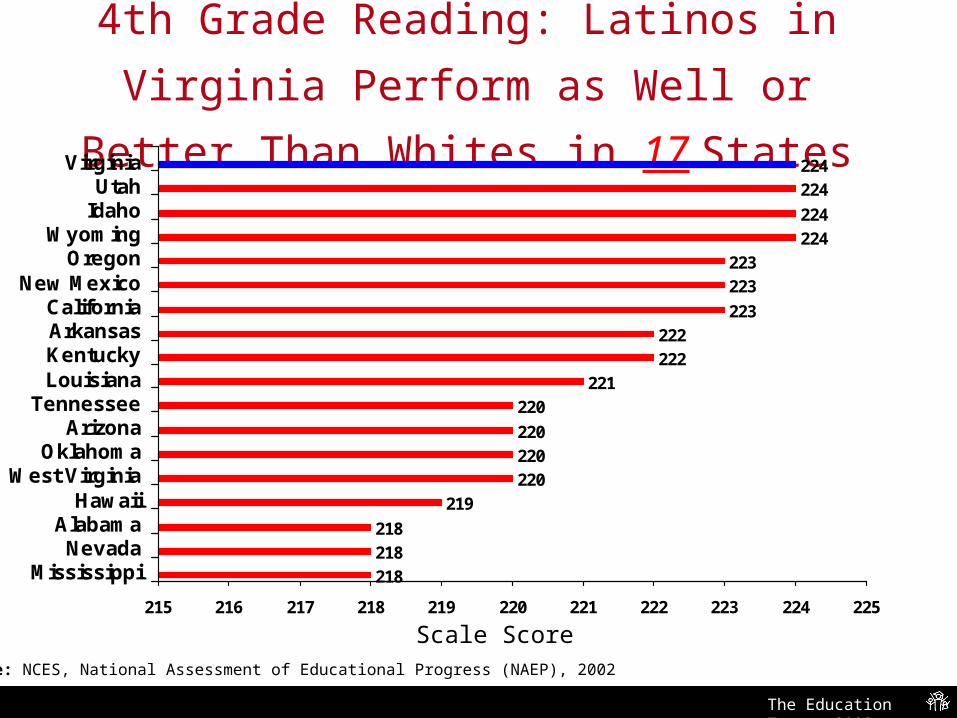
4th Grade Reading: Latinos in Virginia Perform as Well
or Better Than Whites in 17 States
218
218
218
219
220
220
220
220
221
222
222
223
223
223
224
224
224
224
215 216 217 218 219 220 221 222 223 224 225
MississippiNevada
AlabamaHawaii
West VirginiaOklahoma
ArizonaTennessee
LouisianaKentuckyArkansasCalifornia
New MexicoOregon
WyomingIdahoUtah
Virginia
Source: NCES, National Assessment of Educational Progress (NAEP), 2002
Scale Score
The Education Trust, 2003
#5. We might be able to make some improvements in “these”
children, but it will take a decade or two.
The Education Trust, 2003
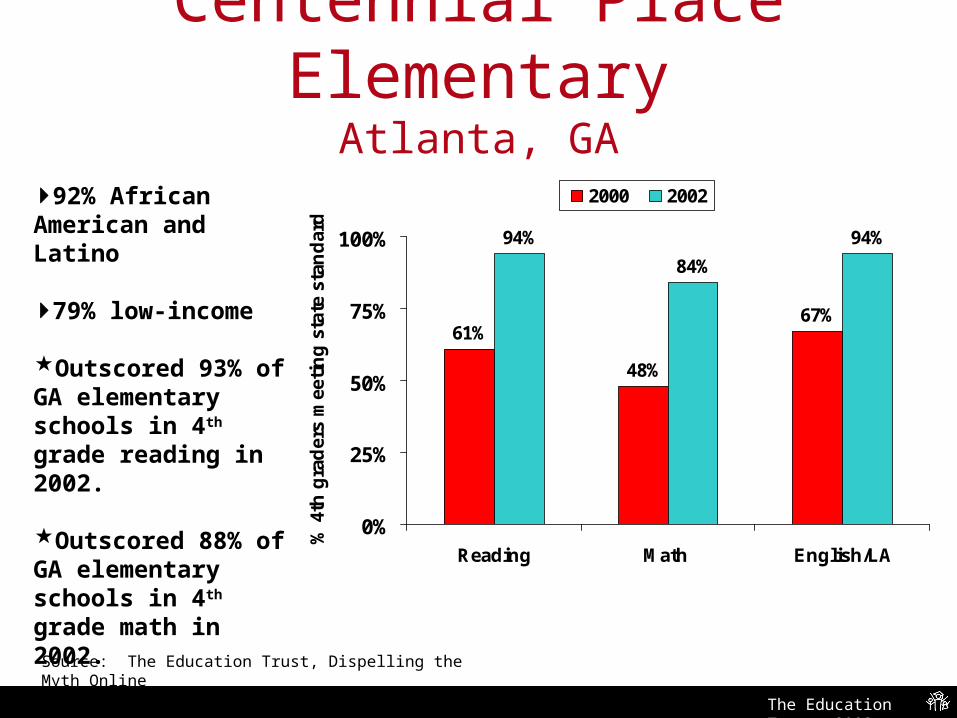
Centennial Place ElementaryAtlanta, GA
94%
84%
94%
67%
48%
61%
0%
25%
50%
75%
100%
Reading Math English/LA
% 4
th g
rad
ers
mee
tin
g s
tate
sta
nd
ard
2000 2002
Source: The Education Trust, Dispelling the Myth Online
92% African American and Latino
79% low-income
Outscored 93% of GA elementary schools in 4th grade reading in 2002.
Outscored 88% of GA elementary schools in 4th grade math in 2002.
The Education Trust, 2003
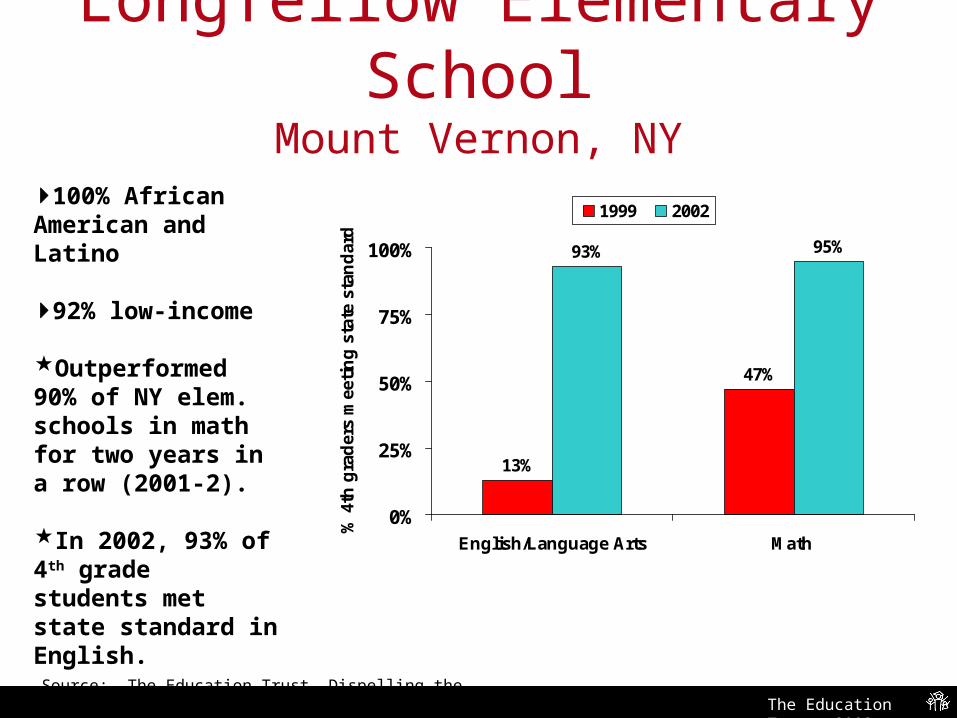
Longfellow Elementary SchoolMount Vernon, NY
93% 95%
47%
13%
0%
25%
50%
75%
100%
English/Language Arts Math
% 4
th g
rad
ers
mee
tin
g s
tate
sta
nd
ard
1999 2002
Source: The Education Trust, Dispelling the Myth Online
100% African American and Latino
92% low-income
Outperformed 90% of NY elem. schools in math for two years in a row (2001-2).
In 2002, 93% of 4th grade students met state standard in English.
The Education Trust, 2003
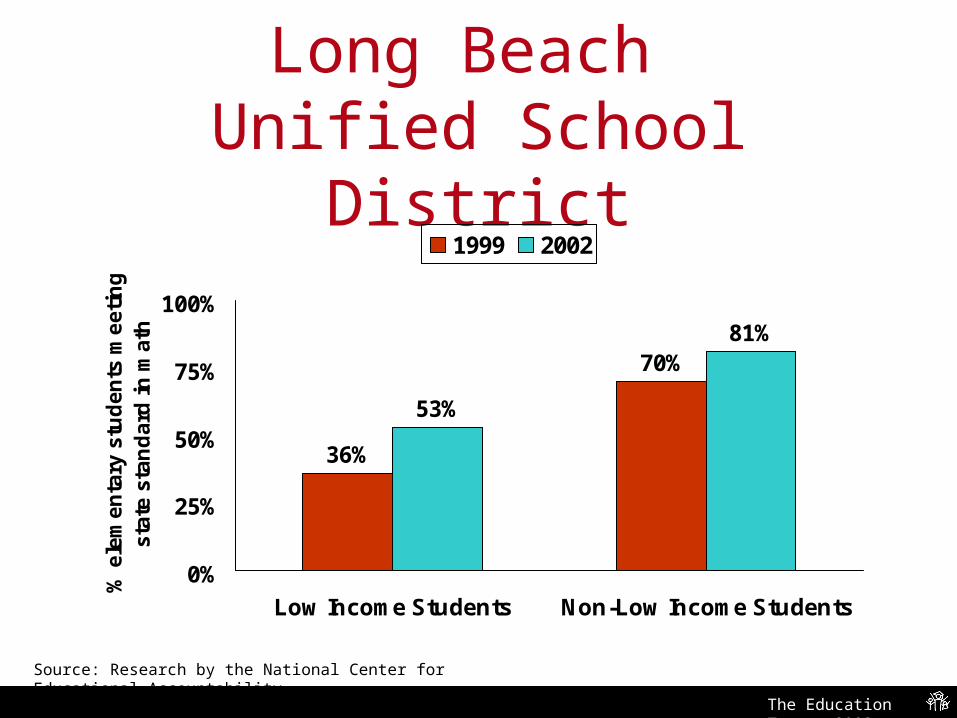
Long Beach Unified School District
36%
70%
53%
81%
0%
25%
50%
75%
100%
Low Income Students Non-Low Income Students
% e
lem
en
tary
stu
de
nts
me
eti
ng
s
tate
sta
nd
ard
in
ma
th
1999 2002
Source: Research by the National Center for Educational Accountability
The Education Trust, 2003
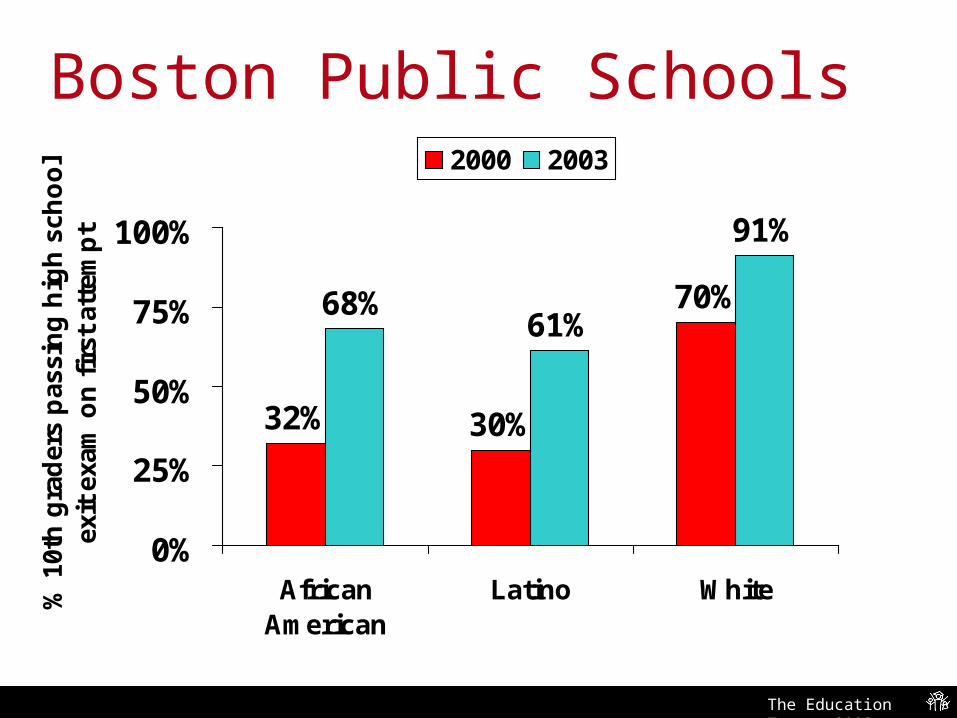
Boston Public Schools
32% 30%
70%68%61%
91%
0%
25%
50%
75%
100%
AfricanAmerican
Latino White% 1
0th
gra
der
s p
assi
ng
hig
h s
cho
ol
exit
exa
m o
n f
irst
att
emp
t
2000 2003
Source: Massachusetts Department of Education
The Education Trust, 2003
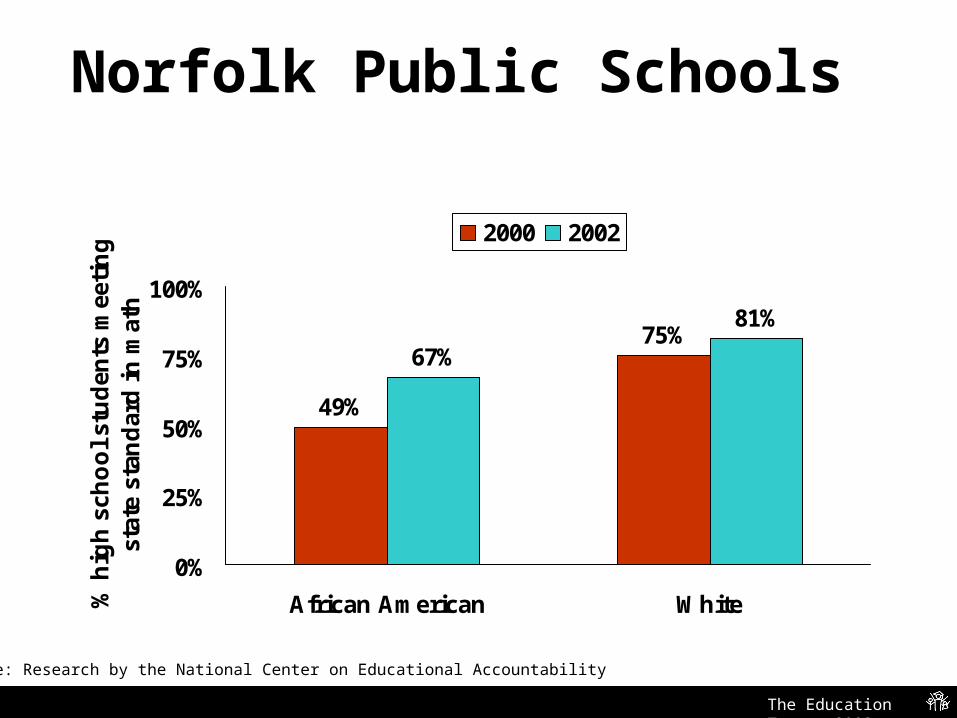
49%
75%67%
81%
0%
25%
50%
75%
100%
African American White% h
igh
sch
oo
l st
ud
ents
mee
tin
g
stat
e st
and
ard
in
mat
h
2000 2002
Source: Research by the National Center on Educational Accountability
Norfolk Public Schools

The Education Trust, 2003
Garden Grove Unified School District
30%
59%50%
66%
0%
20%
40%
60%
80%
100%
Latino White% e
lem
enta
ry s
cho
ol
stu
den
ts
mee
tin
g s
tate
sta
nd
ard
in
mat
h 1999 2002
Source: Research by the National Center on Educational Accountability

The Education Trust, 2003
Delaware: Gains in Grade 4 Reading Outpace the Nation,
1998-2002
15
36
21
4
8
6
0 10 20 30 40
White Gain
Latino Gain
African American Gain
Change in Average Score
Delaware United States
Source: USDOE, NCES, National Assessment of Educational Progress (NAEP) Summary Data Tables

The Education Trust, 2003
State Progress in Moving African American 8th Graders From Below Basic to at Least Basic
Math 1990-2000
State % Below basic 1990
% Below basic 2000
Change 1990-2000
United States
78% 68% -10%
(1) Indiana 77% 52% -25%
(1) Ohio 83% 59% -25%
(3) North Carolina
82% 58% -24%
(4) New York
80% 56% -23%
Source: USDOE, NCES, National Assessment of Educational Progress (NAEP) Summary Data Tables
The Education Trust, 2003
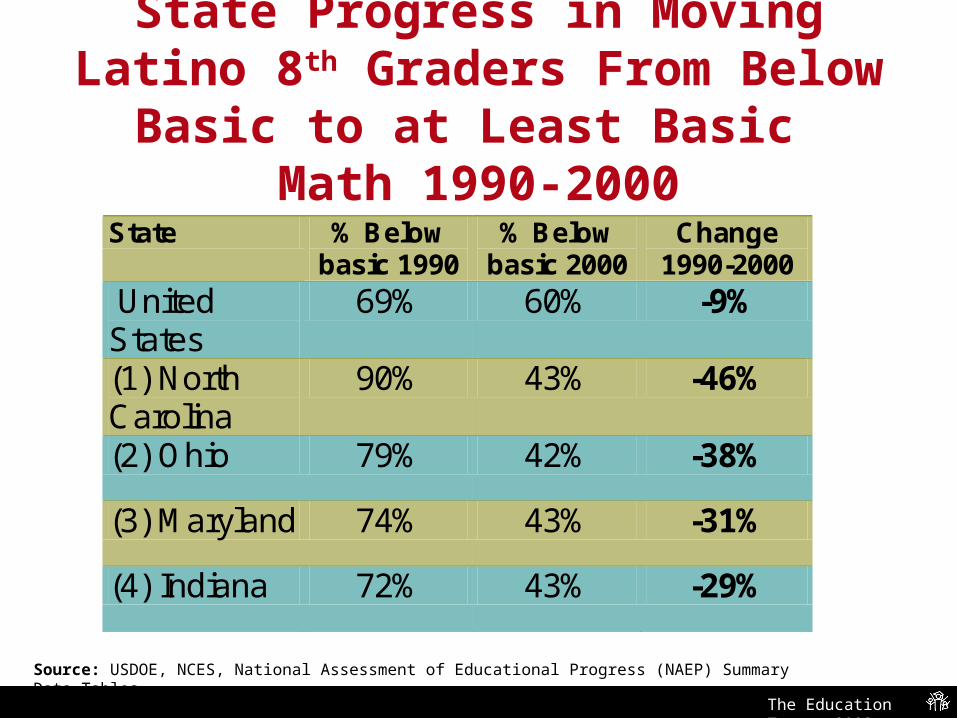
State Progress in Moving Latino 8th Graders From Below Basic to at Least Basic
Math 1990-2000
State % Below basic 1990
% Below basic 2000
Change 1990-2000
United States
69% 60% -9%
(1) North Carolina
90% 43% -46%
(2) Ohio 79% 42% -38%
(3) Maryland 74% 43% -31%
(4) Indiana 72% 43% -29%
Source: USDOE, NCES, National Assessment of Educational Progress (NAEP) Summary Data Tables
The Education Trust, 2003
But look at how the system But look at how the system worked…worked…
The Education Trust, 2003
Abraham Lincoln Middle School Gainesville, Florida
31% White 59% African American 57% Low Income An “A” school under the Florida
accountability model
Source: Florida Department of Education, http://web.fldoe.org.
The Education Trust, 2003
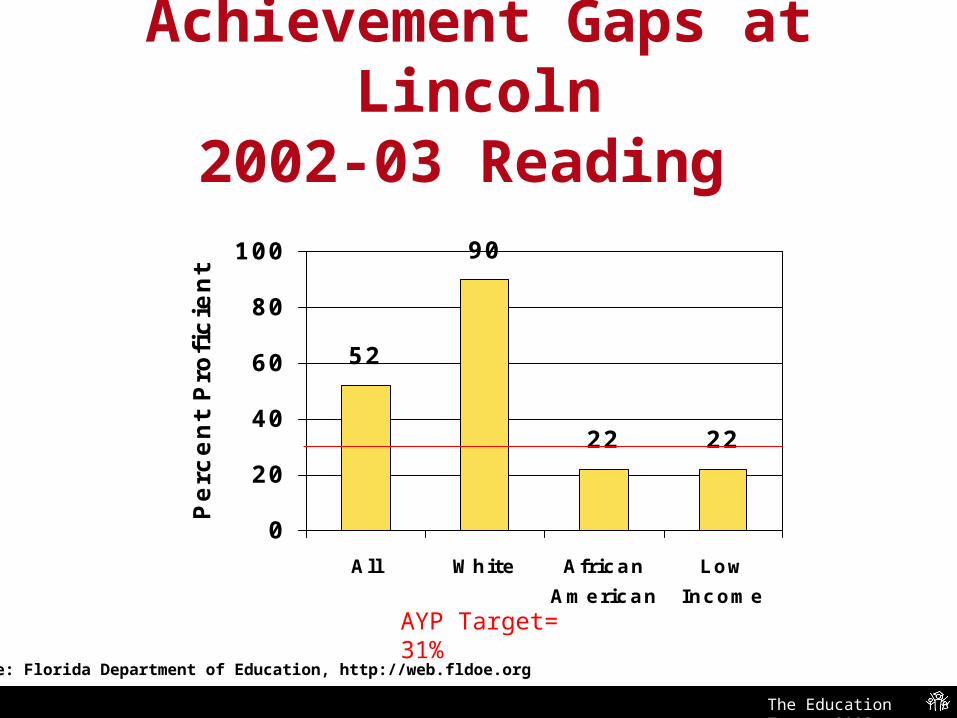
Achievement Gaps at Lincoln2002-03 Reading
52
90
22 22
0
20
40
60
80
100
All White African
American
Low
Income
Pe
rce
nt
Pro
fic
ien
t
Source: Florida Department of Education, http://web.fldoe.org
AYP Target= 31%
The Education Trust, 2003
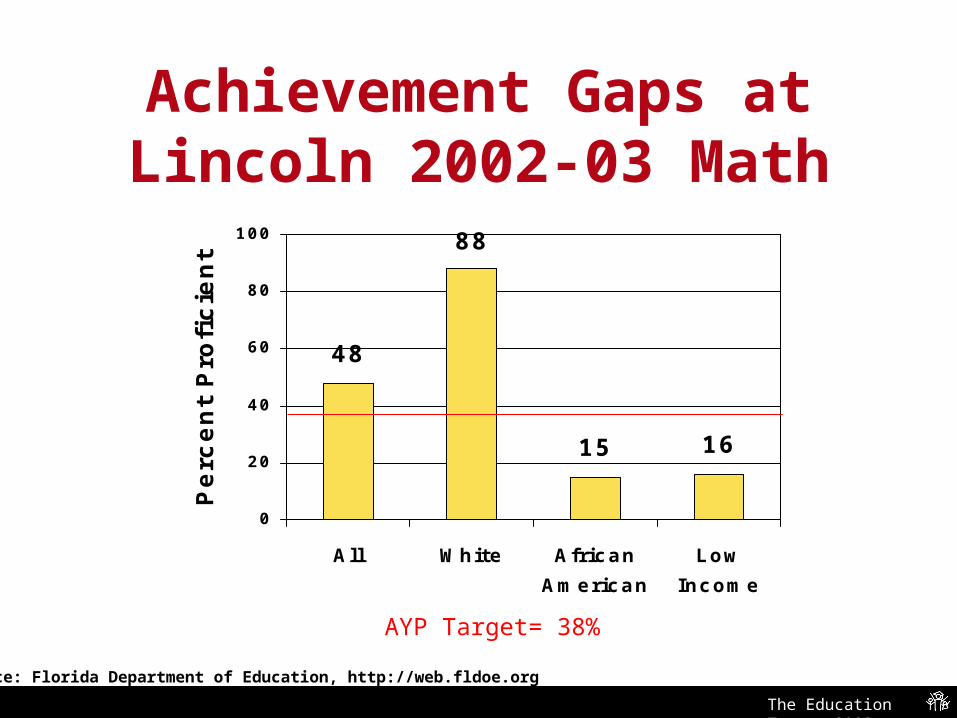
Achievement Gaps at Lincoln 2002-03 Math
48
88
15 16
0
20
40
60
80
100
All White African
American
Low
Income
Pe
rce
nt
Pro
fic
ien
t
Source: Florida Department of Education, http://web.fldoe.org
AYP Target= 38%
The Education Trust, 2003
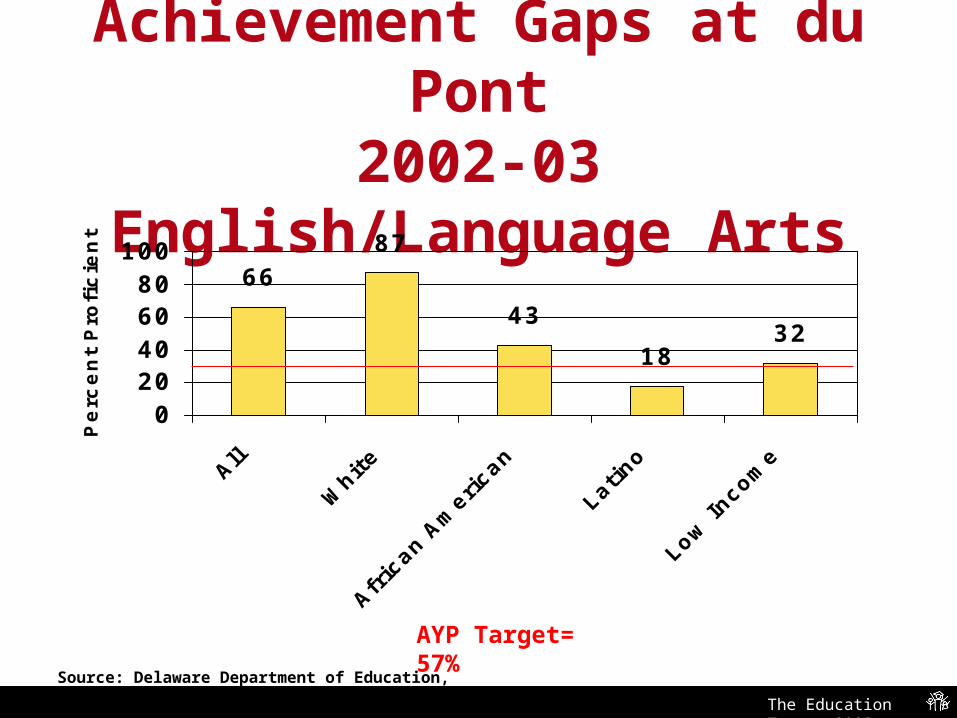
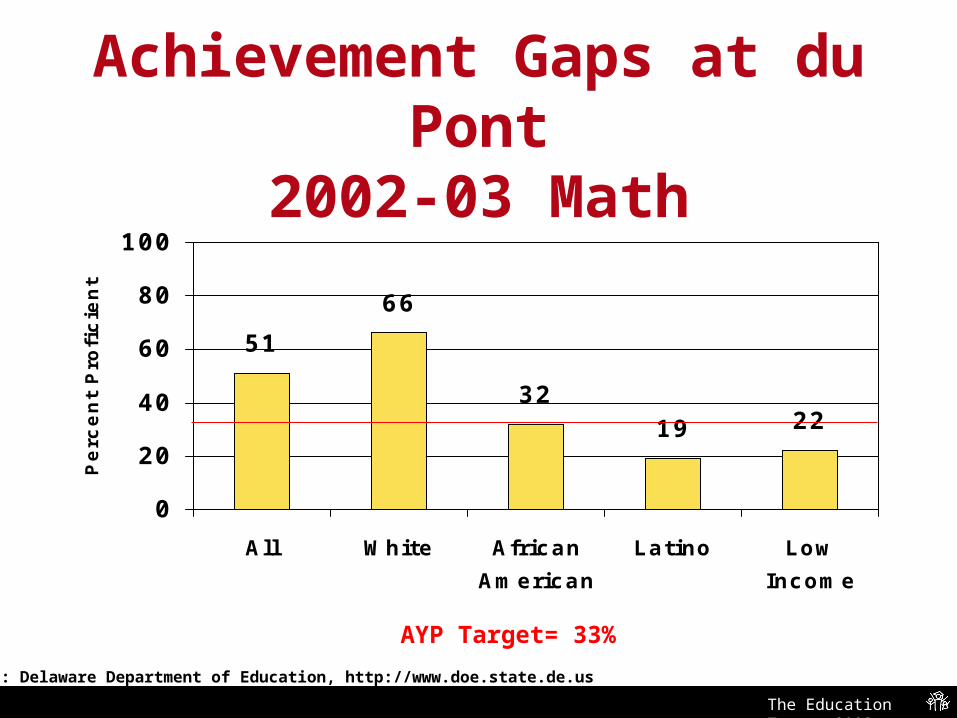
Alexis I du Pont High SchoolRed Clay, Delaware
49% White 24% African American 21% Latino 31% Low Income Named “ One of America’s Best High
Schools” by Newsweek Magazine
Source: Delaware Department of Education, http://www.doe.state.de.us
Newsweek Magazine, June 2, 2003
The Education Trust, 2003
Achievement Gaps at du Pont2002-03 English/Language Arts
6687
43
1832
020406080
100
All
Whi
te
Afric
an A
mer
ican
Latino
Low
Inco
me
Pe
rce
nt
Pro
fic
ien
t
AYP Target= 57%
Source: Delaware Department of Education, http://www.doe.state.de.us
The Education Trust, 2003
Achievement Gaps at du Pont2002-03 Math
51
66
3219 22
0
20
40
60
80
100
All White African
American
Latino Low
Income
Pe
rce
nt
Pro
fic
ien
t
AYP Target= 33%
Source: Delaware Department of Education, http://www.doe.state.de.us

The Education Trust, 2003
All NCLB Says is That These All NCLB Says is That These Schools Need to ImproveSchools Need to Improve
Wouldn’t you agree?
The Education Trust, 2003
Fortunately, other education Fortunately, other education leaders are talking about the same leaders are talking about the same
challenge in quite different challenge in quite different ways…ways…

The Education Trust, 2003
"It means to me that all kids can "It means to me that all kids can learn, all kids can be successful, and learn, all kids can be successful, and
that I will never ever lower my that I will never ever lower my standard of expectations, because I standard of expectations, because I know now in my heart that it's real."know now in my heart that it's real."
Ft. Worth Walton Elementary’s top Reading Teacher Vanessa Kemp re:
Walton’s dramatically improved student reading levels, Reporter Matt Frazier, Ft.
Worth Star Telegram, 10/24/03

The Education Trust, 2003
““At the end of the day, school districts At the end of the day, school districts have to make sure that all their schools have to make sure that all their schools
are strong academically. It won't be are strong academically. It won't be easy, but it's doable. As educators, this easy, but it's doable. As educators, this
is what we signed up for; this is the is what we signed up for; this is the
work that we have to do."work that we have to do."
Saginaw School District Superintendent Gerald Saginaw School District Superintendent Gerald Dawkins (MI), Dawkins (MI), The Saginaw NewsThe Saginaw News, 4/13/03. , 4/13/03.
The Education Trust, 2003
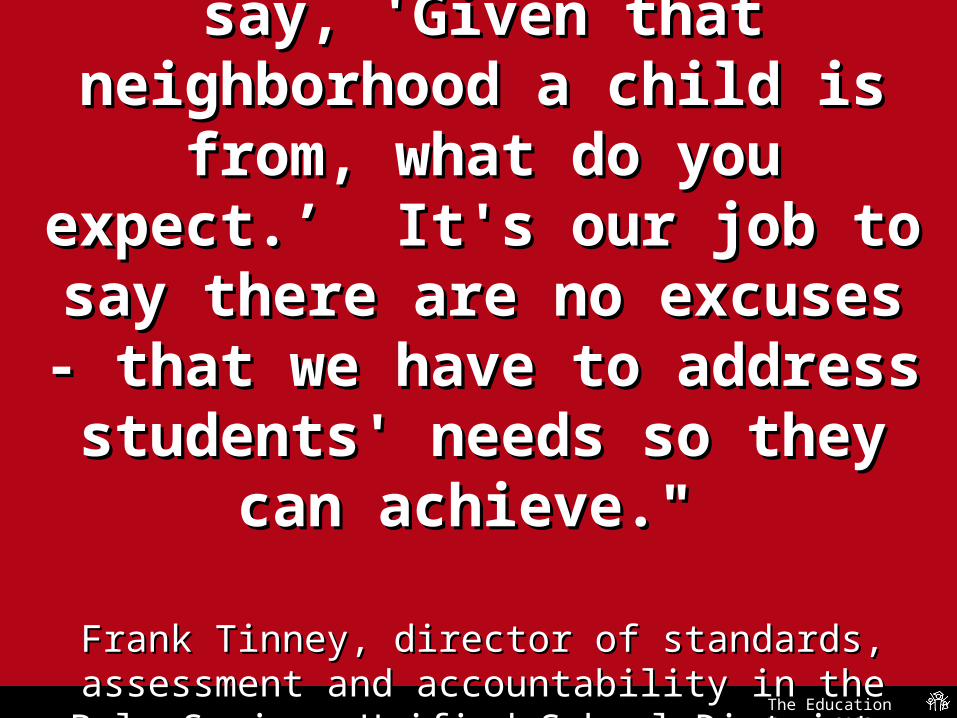
"There are people who'll say, 'Given "There are people who'll say, 'Given that neighborhood a child is from, that neighborhood a child is from, what do you expect.’ It's our job to what do you expect.’ It's our job to say there are no excuses - that we say there are no excuses - that we
have to address students' needs so have to address students' needs so they can achieve." they can achieve."
Frank Tinney, director of standards, assessment and Frank Tinney, director of standards, assessment and accountability in the Palm Springs Unified School District, accountability in the Palm Springs Unified School District, The The
Desert SunDesert Sun (Palm Springs, CA), 4/8/03 (Palm Springs, CA), 4/8/03
The Education Trust, 2003
"Until the gap is closed, our work is "Until the gap is closed, our work is
not done."not done."
Des Moines Superintendent Eric Witherspoon, Des Moines Superintendent Eric Witherspoon, Des Des Moines RegisterMoines Register, 4/15/03, 4/15/03

The Education Trust, 2003
"It's not that "It's not that theythey are failing so much as are failing so much as wewe are failing…This shines a very bright are failing…This shines a very bright light on something we have known for light on something we have known for
years but haven't been forced to deal with years but haven't been forced to deal with until now ---- that we have to close this until now ---- that we have to close this massive gap if all of our students are massive gap if all of our students are
going to succeed." going to succeed."
Ken Noonan, Oceanside Unified School District Ken Noonan, Oceanside Unified School District Superintendent, Superintendent, North County TimesNorth County Times (CA), 5/25/03 (CA), 5/25/03
The Education Trust, 2003
"As you put in accountability, people "As you put in accountability, people pay more attention to what the pay more attention to what the
expectations are. . . You're seeing a expectations are. . . You're seeing a lot of things coming together and lot of things coming together and
paying off for kids." paying off for kids."
Susan Agruso, assistant superintendent for Susan Agruso, assistant superintendent for instructional accountability for Charlotte-instructional accountability for Charlotte-
Mecklenburg, Mecklenburg, Raleigh News and Observer, Raleigh News and Observer, 6/18/036/18/03

The Education Trust, 2003
““[McMillan] said the goals of NCLB [McMillan] said the goals of NCLB may be lofty, but without, for may be lofty, but without, for
example, President Kennedy’s lofty example, President Kennedy’s lofty goal of putting a man on the moon, goal of putting a man on the moon,
it would not have happened.” it would not have happened.”
Houghton Lake Community Schools Superintendent Greg McMillan,
Reporter Cheryl Holladay, Hougton Lake Resorter, 10/3/03
The Education Trust, 2003
““We have really blown that myth We have really blown that myth about high-poverty schools being about high-poverty schools being
low achievers out of the water. low achievers out of the water. Economically deprived doesn't Economically deprived doesn't
mean brain deprived.” mean brain deprived.”
Janie Moran, Principal Southern Hills, a high Janie Moran, Principal Southern Hills, a high poverty school in Louisiana where all but one poverty school in Louisiana where all but one of their 48 4th grade student passed LEAP, of their 48 4th grade student passed LEAP,
Shreveport Times, Shreveport Times, 5/29/035/29/03
The Education Trust, 2003
“…“…this new era is not just a matter of this new era is not just a matter of kids having access to school… This kids having access to school… This new era is about how we're going to new era is about how we're going to
make sure all kids learn.make sure all kids learn.
Andy Tompkins, Kansas Department of Andy Tompkins, Kansas Department of Education Commissioner, Education Commissioner, Topeka Capital Topeka Capital
Journal, Journal, 7/8/037/8/03
The Education Trust, 2003
"Neither poverty nor race is an excuse. All children can rise to the standards and there are many schools in the data that you have to prove it.” –Rick Mills, Commissioner of Education, New York. March 28, 2002, New York Times
The Education Trust, 2003
“With proper instruction, students here can blow other kids away in the humanities. The more you challenge them, the better they'll do.”
–Dolores Edwards Sullivan, an English teacher in the predominantly African American Roosevelt school district, whose 11th graders are starting to earn higher marks on state Regents exams.
The Education Trust, 2003
“Yes, parents may have the greatest impact on how their children come to us. But we have the greatest impact on how they leave us.”–Superintendent, North Carolina

The Education Trust, 2003
Yes, this is going to be hard. But how we communicate will play a large role in whether people will
even try.

The Education Trust, 2003
The Education TrustThe Education Trust
For More Information . . .
www.edtrust.org
Washington, DC: 202-293-1217
Oakland, CA: 510-465-6444


