The Education Trust-West Opportunity Audit: Identifying and Bridging Gaps in College and Career Readiness Using High School Transcript Data to Promote Systems Change Arun Ramanathan, Linda Murray, and Carrie Hahnel The Education Trust-West ACHIEVE: AMERICAN DIPLOMA PROJECT NETWORK JUNE 18, 2010
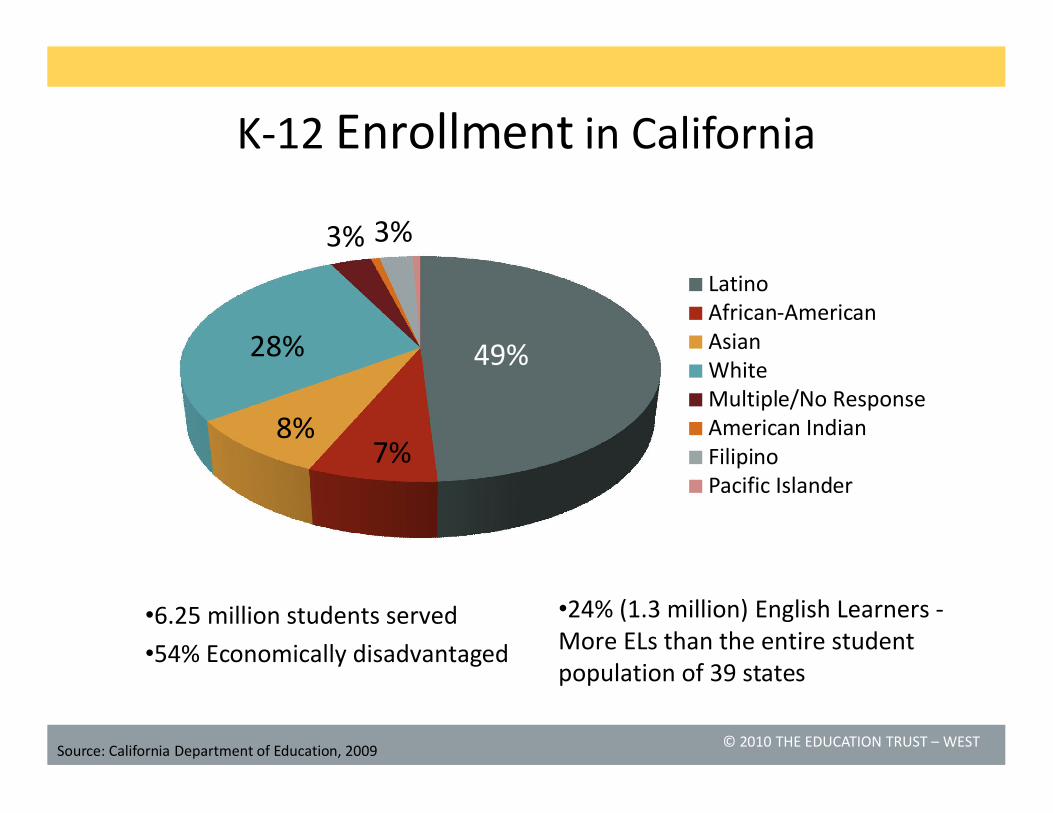
• California’s high school graduation requirements are notcollege-ready
• The state’s two largest systems, UC and CSU, require a more rigorous set of courses
High-School Graduation Requirements
UC/CSU “A-G” Requirements
English 3 years 4 years
Math 2 years, including Algebra I 3 years, including Algebra I, Algebra II, and Geometry
Science 2 years, including biological and physical sciences
2 years of lab science, in at least 2 of these 3: biology, chemistry and physics
History/ Social Studies
3 years, including 1 year of U.S. history & geography; 1year of world history, culture, and geography; ½ year of American govt. and civics; and ½ year of economics
2 years, including 1 year of world history, cultures and geography; 1 year of U.S. history, or ½ year of U.S. history and ½ year of civics or American govt.
Arts 1 year in either art or foreign language
1 year
Foreign Language
2 years
Other 2 years of PE 1 year of a college-prep elective
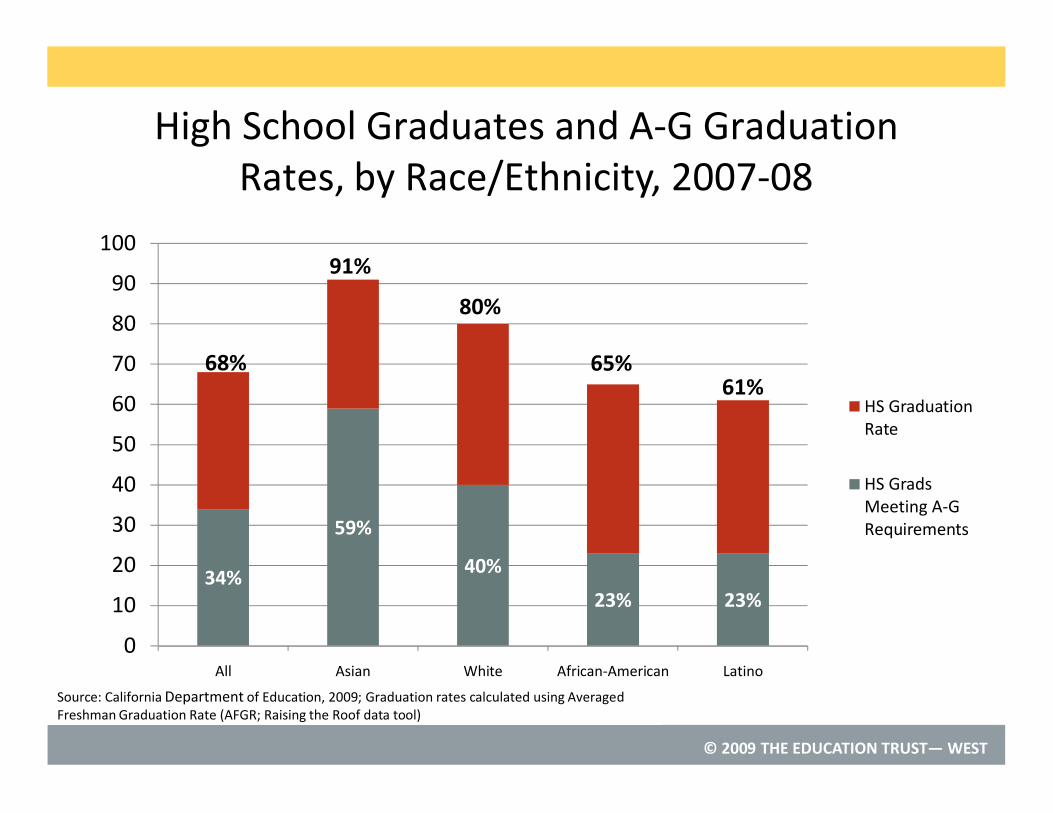
High School Graduates and A-G Graduation Rates, by Race/Ethnicity, 2007-08
34%
59%
40%
23% 23%
68%
91%
80%
65%61%
0
10
20
30
40
50
60
70
80
90
100
All Asian White African-American Latino
HS Graduation Rate
HS Grads Meeting A-G Requirements
Source: California Department of Education, 2009; Graduation rates calculated using Averaged Freshman Graduation Rate (AFGR; Raising the Roof data tool)
• In 2008, 17% of African-American public high school graduates in CA enrolled in a UC or CSU as first-time freshmen.
• African-American students represent a scant 3% of UC undergraduate enrollment and 6% of CSU undergraduate enrollment, despite the fact that African Americans represent 8% of the California population between the ages of 18 and 24.
• College admission is no guarantee of success. Six-year graduation rates for African-American first-time freshman are low, ranging from 29-33% percent in the CSU system and 70-73% in the UC system (depending on the source).
• In 2008, 14% of Latino public high school graduates in CA enrolled in a UC or CSU as first-time freshmen.
• Latino students represent only 16% of UC undergraduate enrollment and 25% of CSU undergraduate enrollment, despite the fact that Latinos represent 45% percent of the California population between the ages of 18 and 24.
• College admission is no guarantee of success. Six-year graduation rates for Latino first-time freshman range from 41% in the CSU system to in the 72% in the UC system
Purpose: To determine current levels of high school preparation and to identify the changes necessary to ensure access to a college preparatory curriculum for all students.
The Education Trust – West Educational Opportunity Audit
• Built on pioneering work in San Jose Unified• Initiated in 2005• Conducted with 9 districts in California • Also conducted with demonstration schools
in Hawaii as part of a statewide movement toward college and career readiness for all
Understanding the current level of preparation high school students receive by:High school transcript analysisExamination of artifacts including course
directories, master schedules, and district policiesSurveys and interviews with key district leadersStakeholder focus groups and community
conversations
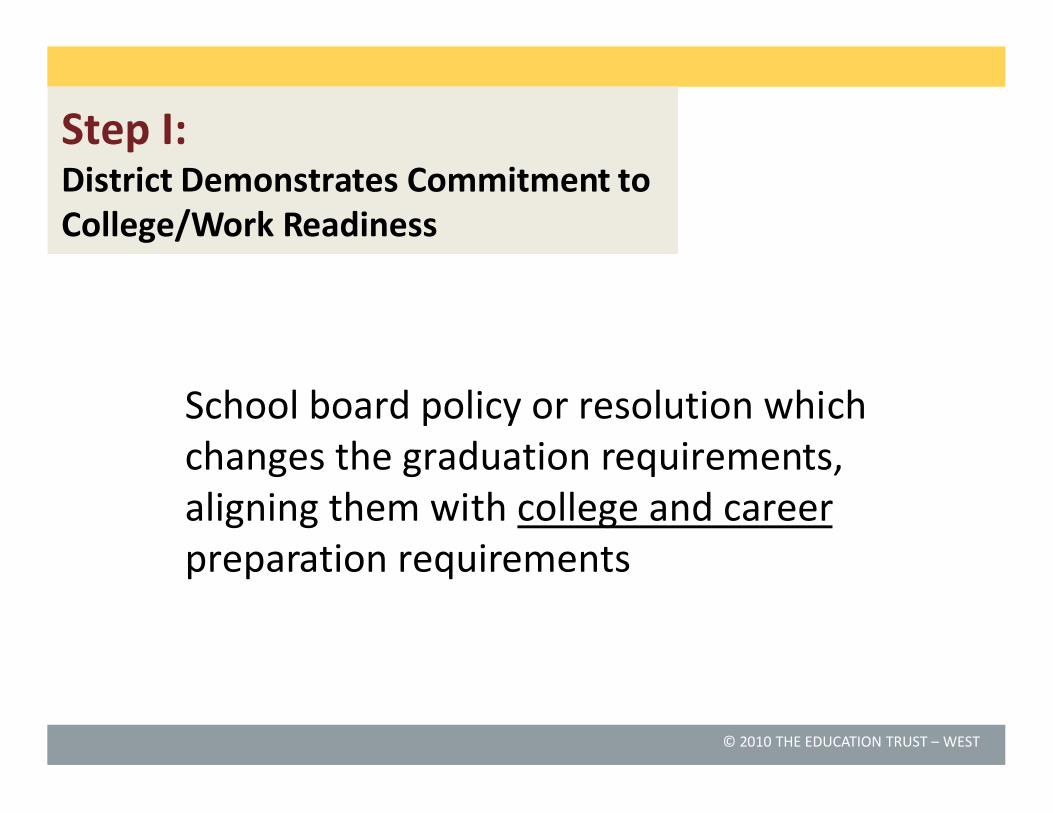
Step II: The Educational Opportunity Audit –Uncovering Gaps
• Lower achievement exists in some groups of students, specifically Latino and African-American students. For example, these students are far less likely to be enrolled in rigorous college preparatory courses.
• Students ‘getting by’ with academic minimums• Only two clear tracks: college track and non-college
track. Students who begin in non-college track rarely move up to college track.
Step II: The Educational Opportunity Audit –Uncovering Gaps
• Develop “Blueprint” through working committees that review audit findings and create action plan for: Curriculum and instruction Student supports and interventions Professional development
• District leaders review teacher recruitment and staffing, funding patterns, and facilities findings and create action plans to move forward the reform
• The Blueprint will be the district’s detailed action plan to implement college and career ready high school preparation for all students
Step III: Blueprint Design Process –Implementing Change
• Initially piloted in a small suburban district of ~10,000 students district-wide– 700 high school seniors– High correlation between electronic and hand analysis
• Next step was applying analysis in a large urban school district of ~130,000 students district-wide– 44% Latino, 25% White, 13% African-American, 9% Asian– 29% English Learner– 63% free/reduced lunch eligibility
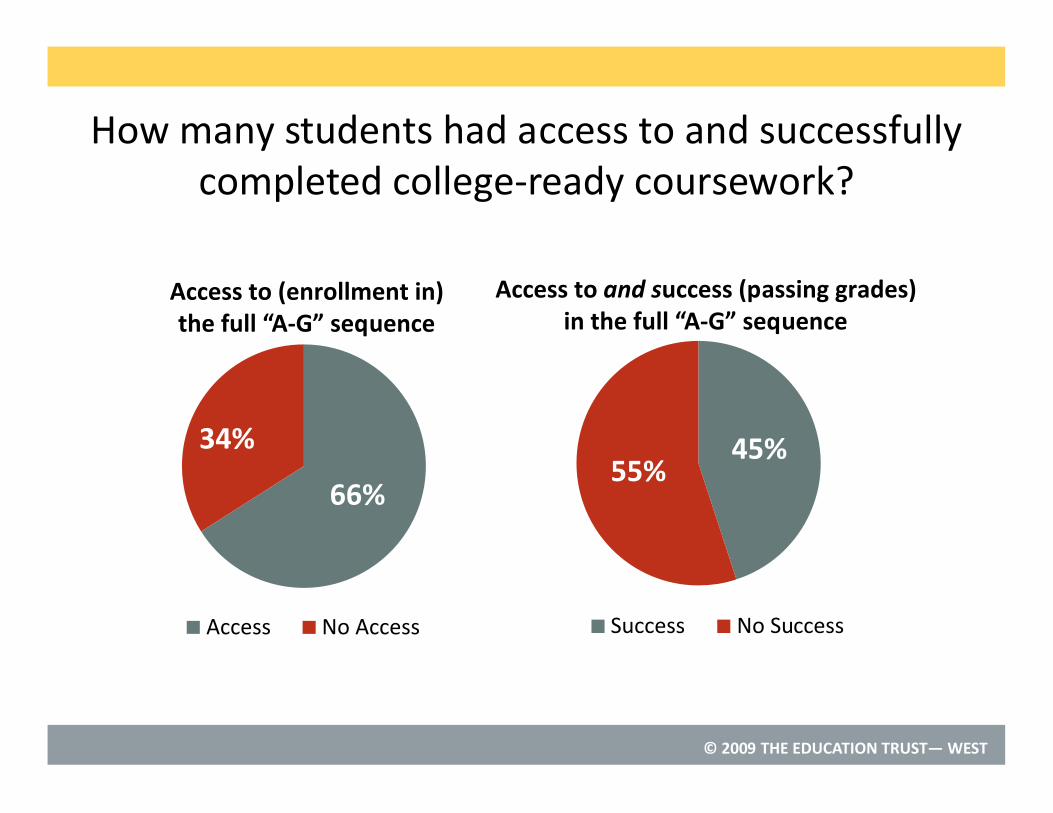
1. Collect and organize data into relational database2. Clean data, with district input as needed3. Establish key questions (e.g. how many students are
accessing the full college-ready course sequence?)
4. Write queries and output reports5. Vet results against a small sample of physical
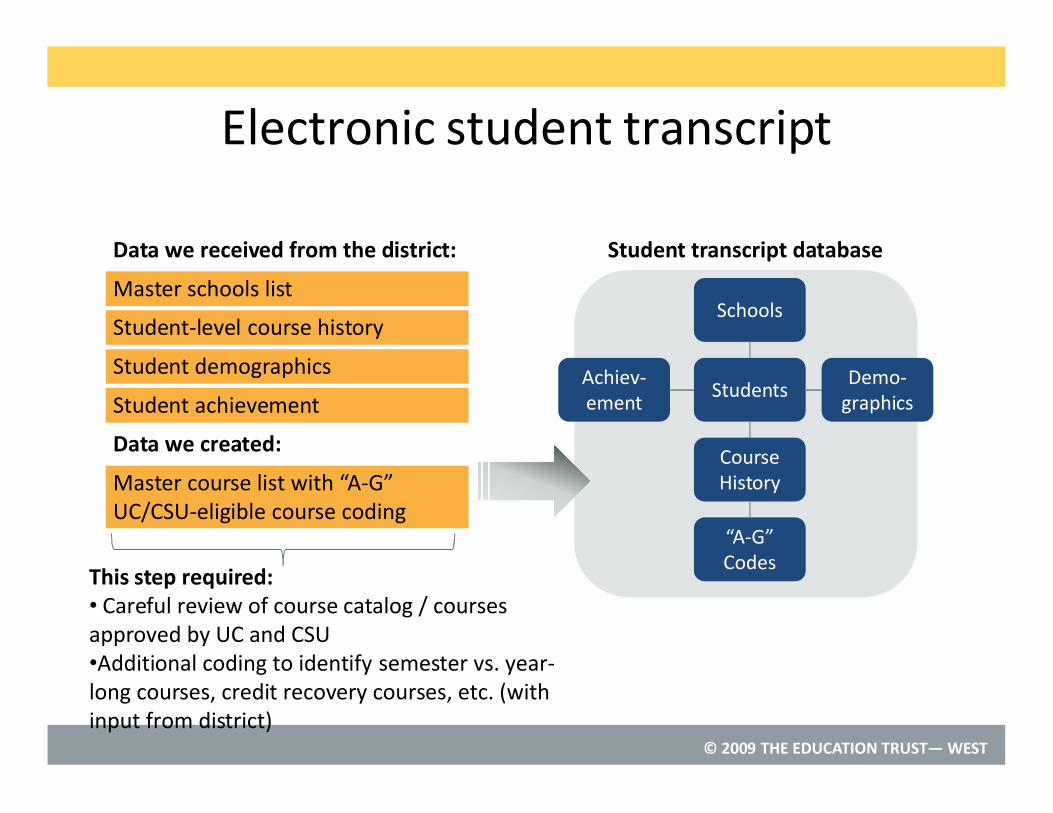
Master course list with “A-G” UC/CSU-eligible course coding
Schools
Students
Course History
“A-G” Codes
Demo-graphics
Achiev-ement
Student transcript database
This step required:• Careful review of course catalog / courses approved by UC and CSU•Additional coding to identify semester vs. year-long courses, credit recovery courses, etc. (with input from district)
In this step, we codify “A-G” course-taking requirements. For example, this checks to see whether students have taken the necessary lab sciences, 4 years of English, and so on. This step also considers validation rules—e.g., passing Algebra II “covers” an earlier failing grade in Algebra I.
• Are students across schools receiving equal access to rigorous ninth grade courses? Twelfth grade?
• What patterns of “tracking” are evident?• Does participation in CTE courses allow for multiple
pathways to college readiness, or does it serve as a barrier?
• How does 8th grade Algebra I enrollment/passage impact later completion of college-ready coursework?
• What impact do D’s and F’s have on graduation status and completion of college-ready coursework? Are sufficient interventions and remediation opportunities offered?