Page 1
i
The Effect of Alcohol Intoxication on Emotion Perception and Perceptions of Ability
Sarah Anne Skromanis (BPsychSc)
A report submitted as a partial requirement for the degree of Bachelor of
Psychological Science with Honours in Psychology at the University of Tasmania,
13 October 2016.
Page 2
ii
Statement of Sources
I declare that this report is my own original work and that contributions of others
have been duly acknowledged.
____________________________________________________________________
Sarah Skromanis Date
Page 3
iii
Acknowledgements
Firstly, I would like to thank my supervisor, Dr Cynthia Honan for your support and
encouragement throughout this year. Thank you for the opportunity to be involved in
such a wonderful study and for everything you have taught me. I am extremely
grateful to have had such a positive role model during my final year.
Thank you to Dr Matthew Palmer for your assistance with calibration. Your support
was greatly appreciated.
Thank you to Emma for such a great year. It has been so lovely working with you on
this exciting project. Thank you for all of the laughs we shared. They certainly made
those long hours of testing much more enjoyable.
Thank you to my wonderful friends, Nikki, Caitlin, Madi, Chloe, and Hema for
making the past four years so enjoyable. It has been wonderful sharing this exciting
journey with you all and I can’t wait to see where the future takes you.
Thank you to Tasmania Police for the loaning of a breathalyser. Without your
generosity and support, this project would not have been possible.
Thank you to the participants who kindly volunteered their time to be a part of this
study.
Lastly, a huge thank you to my family whose love and support kept me going. Thank
you for always believing in me and for sharing this challenging, yet very exciting
journey with me. To my sisters, thank you for being the best practice test subjects.
Page 4
iv
Table of Contents
List of Tables............................................................................................................... vi
List of Figures ............................................................................................................ vii
List of Acronyms ...................................................................................................... viii
Abstract ........................................................................................................................ 1
Introduction………………………………………………………………………….. 2
Emotion Perception .................................................................................................. 3
Regions of the Brain Involved in Emotion Perception ............................................. 4
Neuropathology and Alcohol Intoxication ............................................................... 4
Neuropathology in Clinical Populations .................................................................. 5
Alcohol and Emotion Perception.............................................................................. 6
Aims and Hypotheses ............................................................................................. 13
Method ....................................................................................................................... 14
Design ..................................................................................................................... 14
Participants ............................................................................................................. 15
Materials ................................................................................................................. 17
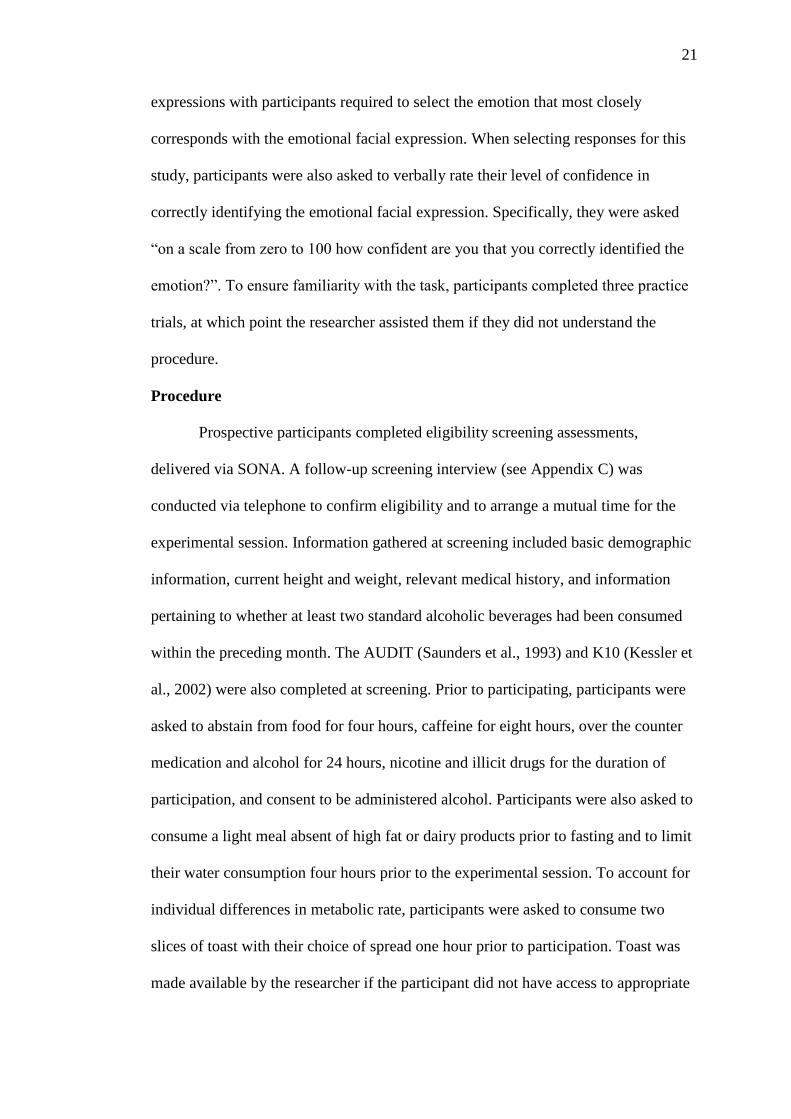
Procedure ................................................................................................................ 21
Statistical Analyses ................................................................................................. 23
Analysis of Emotion Perception Accuracy. ........................................................ 24
Results ........................................................................................................................ 26
Eligibility and Baseline Assessments ..................................................................... 26
BrAC Readings ....................................................................................................... 29
Page 5
v
ERT Performance ................................................................................................... 29
Calibration Analyses .............................................................................................. 34
Discussion .................................................................................................................. 38
Limitations and Areas for Future Research ............................................................ 44
References .................................................................................................................. 46
Appendix……………………………………………………………………………….
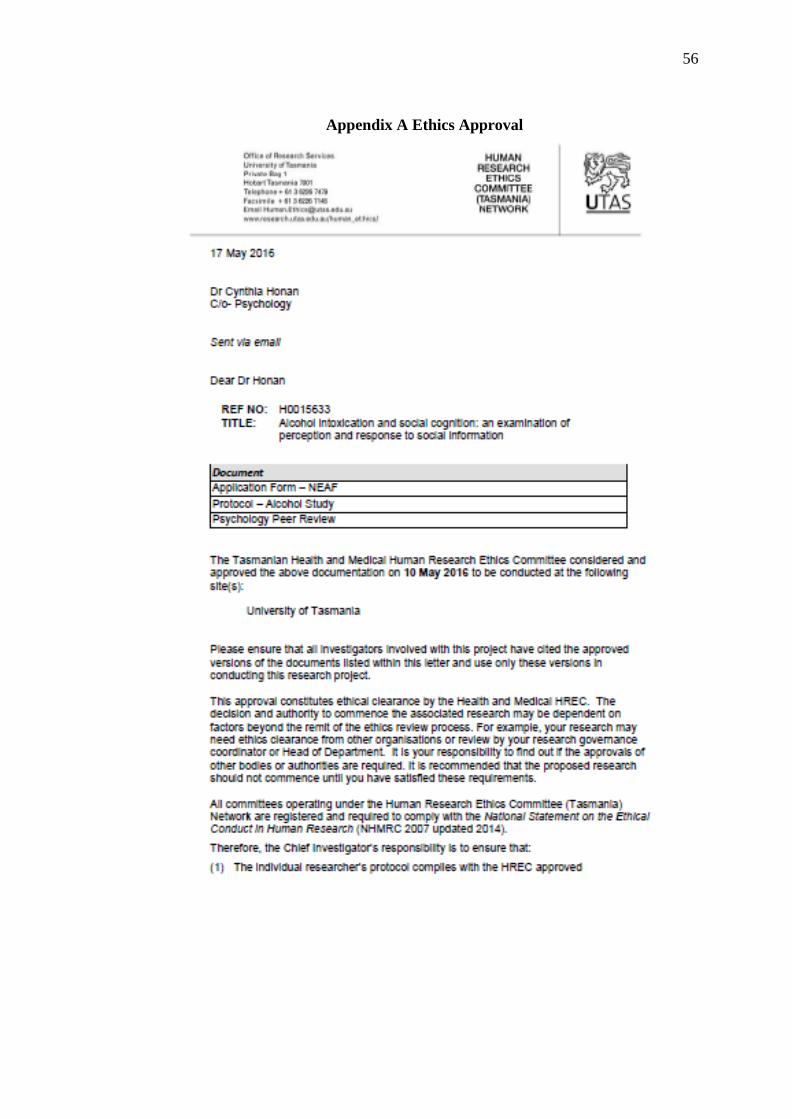
Appendix A Ethics Approval ................................................................................. 56
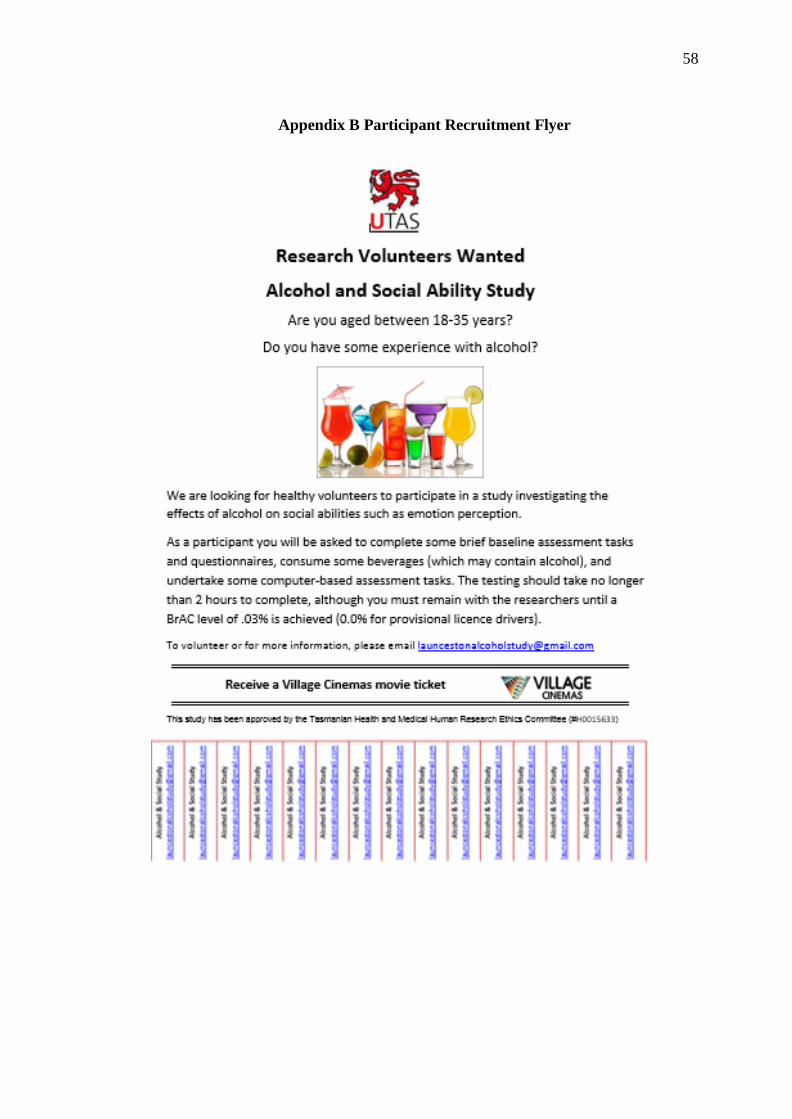
Appendix B Participant Recruitment Flyer ............................................................ 58
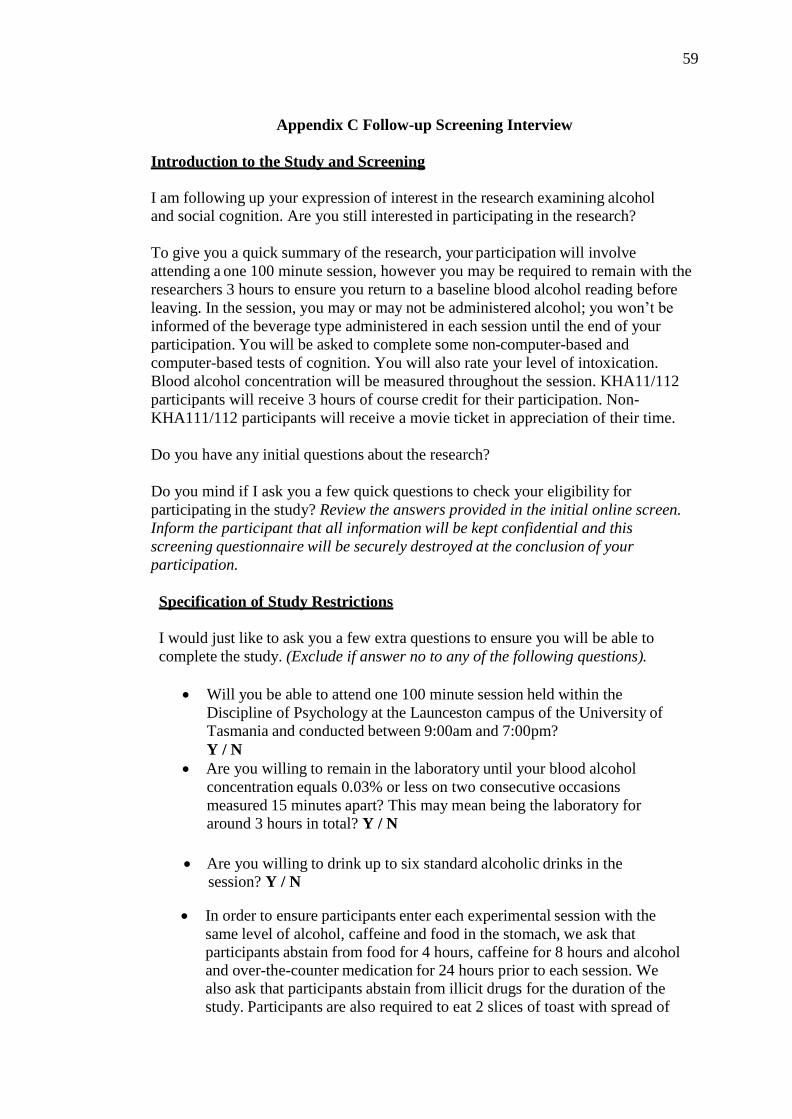
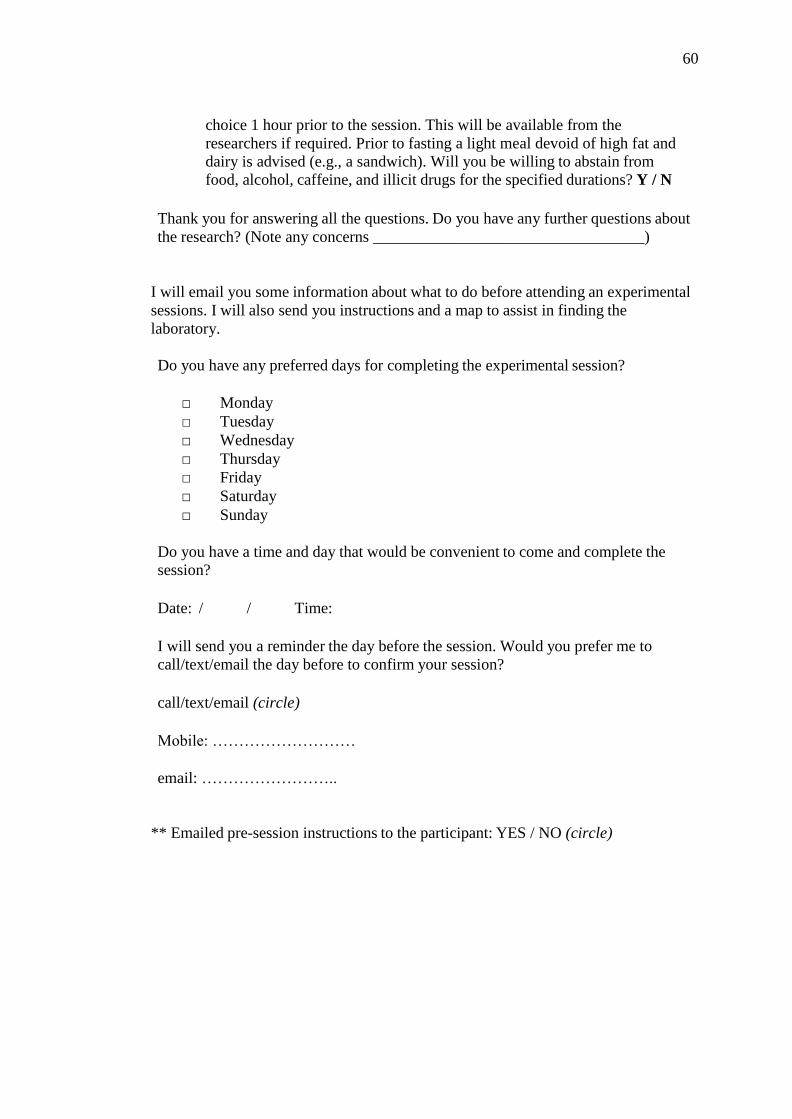
Appendix C Follow-up Screening Interview .......................................................... 59
Appendix D Participant Information Sheet ............................................................ 61
Appendix E Participant Consent Form ................................................................... 65
Appendix F Widmark Equation ............................................................................. 68
Appendix G Statistical Output………………………………………………...… 69
Page 6
vi
List of Tables
Table 1. Descriptive and Inferential Statistics for Demographic Data…………...16
Table 2. Descriptive and Inferential Statistics for Eligibility and Baseline
Assessments………………………………………………………………………….27
Page 7
vii
List of Figures
Figure 1. A model of awareness ……………………………………………………13
Figure 2. Means and standard errors representing sedative and stimulant effects of
alcohol at three time points for alcohol-intoxicated and placebo conditions …..…...29
Figure 3. Means and standard errors for the two-way interaction between condition
and emotion …………………………………………………………………………32
Figure 4. Means and standard errors for the two-way interaction between condition
and intensity ………………………………………………………………………...32
Figure 5. Mean correct identifications of six basic emotions across five intensity
levels in alcohol-intoxicated and control participants ……………………………...33
Figure 6. Means and standard errors for the Calibration statistic across all
participants for each emotion ……………………………………………………….35
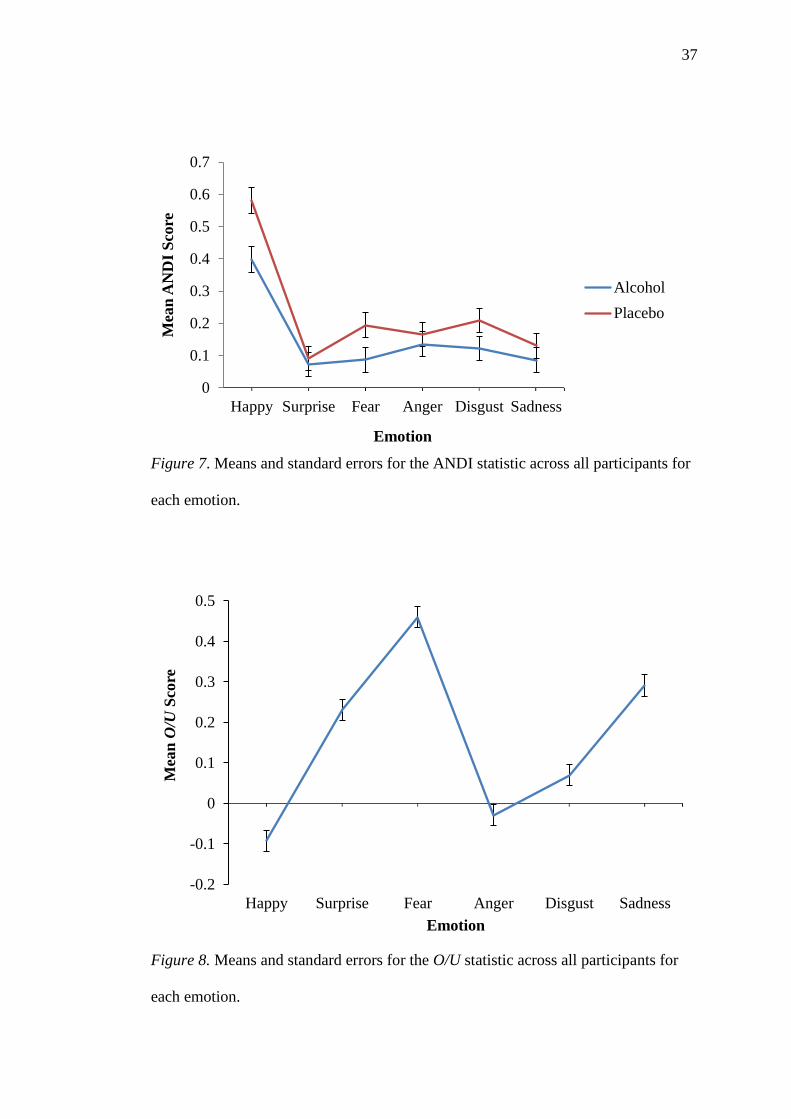
Figure 7. Means and standard errors for the ANDI statistic across all participants for
each emotion ………………………………………………………………………..37
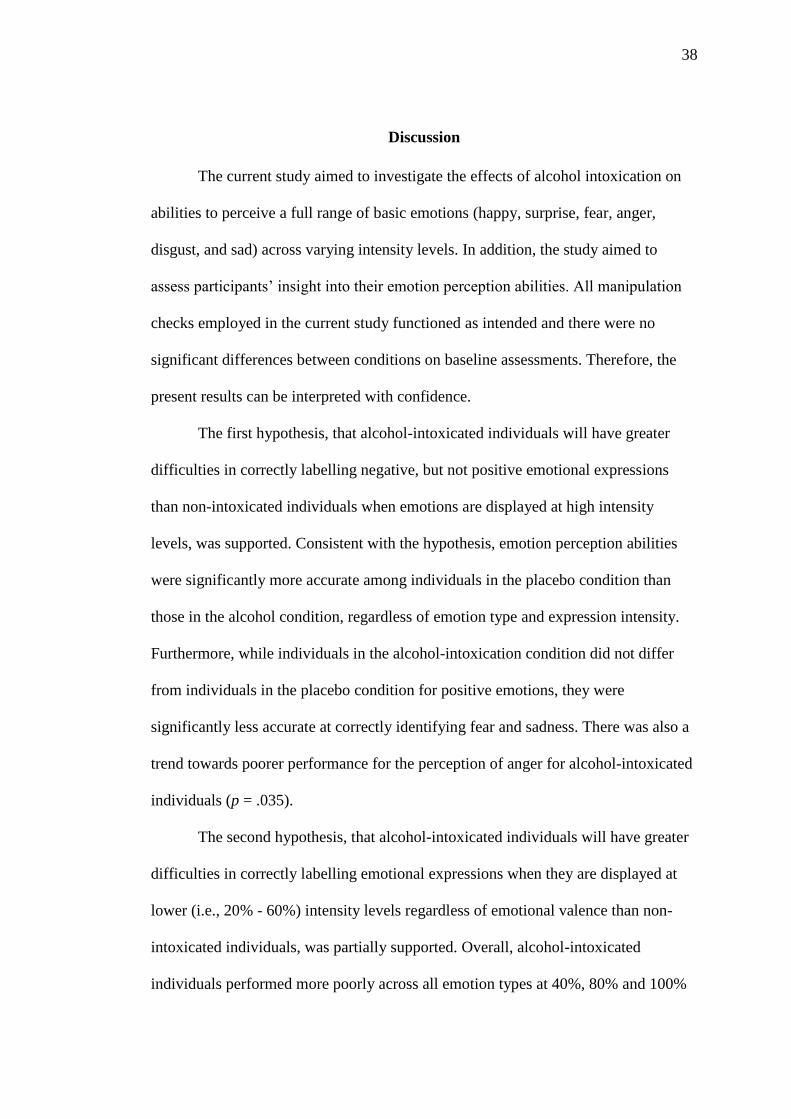
Figure 8. Means and standard errors for the O/U statistic across all participants for
each emotion ………………………………………………………………………..37
Page 8
viii
List of Acronyms
ACS Advanced Clinical Solutions
ANDI Adjusted Normalised Discrimination Index
AUDIT Alcohol Use Disorders Identification Test
BAES Biphasic Alcohol Effects Scale
BMI Body Mass Index
BrAC Breath Alcohol Concentration
BRS Beverage Rating Scale
ERT Emotion Recognition Scale
FIML Full Information Maximum Likelihood
K10 Kessler Psychological Distress Scale
O/U Overconfidence/Underconfidence
SEQ Social Emotional Questionnaire
TBI Traumatic Brain Injury
TLFB Timeline Followback
Page 9
ix
The Effect of Alcohol Intoxication on Emotion Perception and Perceptions of Ability
Sarah Anne Skromanis (BPsychSc)
Word Count: 9,962
Page 10
1
Abstract
Alcohol-fuelled violence has become increasingly reported in and ‘exploited’ by the
Australian media. While links between alcohol consumption and violence are well
established, the possible mechanisms underlying these negative social behaviours are
poorly understood. This study aimed to ascertain whether alcohol intoxication
impairs individuals’ emotion perception abilities in a manner similar to other clinical
populations, such as schizophrenia and traumatic brain injury (TBI), which
demonstrate similar neuropathological profiles. A supplementary aim of the study
was to examine whether accuracy of appraisals of emotion perception ability are
impaired. Following quasi-random assignment to counterbalance for gender, 64
participants were administered either an alcohol (Mage = 24.55, SD = 3.38) or placebo
(Mage = 22.70, SD = 4.80) beverage. Emotion perception abilities were then assessed
using the Emotion Recognition Task (ERT). Insight into performance was also
measured by obtaining confidence ratings from zero to 100% for each viewed
emotion. The study found that alcohol intoxicated individuals were less able to
correctly identify negative emotions than the non-intoxicated individuals at
moderate-to-high levels of emotion intensity. They also demonstrated significantly
less insight into their performance regardless of emotion type. These results offer
invaluable information to further our understanding of the possible mechanisms
underlying alcohol-fuelled violence.
Page 11
2
The Effects of Alcohol Intoxication on Emotion Perception and Perceptions of
Ability
Alcohol forms a prominent part of Australian culture and is commonly
consumed to regulate and facilitate social interactions (Cooper, Frone, Russell, &
Mudar, 1995). Alcohol’s psychoactive abilities may reduce stress and anxiety and
induce states of relaxation, euphoria, and disinhibition, making it a desirable social
lubricant (Kano et al., 2003). Alcohol consumption in Australia is highly prevalent
with recent Australian Bureau of Statistics (ABS, 2015) data indicating that 80.6
percent of Australians aged over 18 years consumed alcohol between 2014 and 2015.
During the same period, 44.0 percent of Australians aged over 18 years exceeded the
National Health and Medical Research Council’s ‘single occasion risk guideline’ of
consuming more than four standard drinks in a single session. This excessive
drinking was also reportedly more common among young adults, with 69.4 percent
of males and 60.6 percent of females aged between 18 and 24 years exceeding the
single occasion risk guidelines. In comparison, 65.3 percent of males and 36.1
percent of females aged between 35 and 44 years exceeded the single occasion risk
guideline.
Excessive alcohol consumption is particularly concerning given its potential
role in initiating negative social behaviours, such as aggression (Attwood, Ataya,
Benton, Penton-Voak, & Munafò, 2009). Links between alcohol consumption and
aggressive behaviours (e.g., violence towards others) are well established in the
scientific literature (Hoaken & Stewart, 2003). Local Australian data has also
indicated that a majority of victims who had sustained a physical assault aged
between 25 and 34 years (67 percent) attributed the assault to alcohol and/or another
illicit substance (ABS, 2015). Alcohol-fuelled violence, such as “king hits” in
Page 12
3
particular have become increasingly reported in and ‘exploited’ by the Australian
media (Pilgrim et al., 2014). “King hits” are characterised by a sudden knock to the
head, debilitating the victim and causing them to become unconscious. Between
2000 and 2012, a staggering 90 Australians were victims of fatal king hits, with
alcohol being recognised as a contributing factor in 73 percent of these cases.
Despite the established link between alcohol intoxication and violence, the possible
underlying mechanisms of these negative social behaviours are poorly understood.
One possible explanation for the negative social behaviour seen in intoxicated
individuals, is poor ability to accurately recognise the emotions displayed by other
people. The ability to correctly recognise emotions is a fundamental aspect of human
interaction, and deficits in this area may result in misunderstandings or incorrect
interpretations of intent and reaction (Attwood et al., 2009; Kornreich et al., 2001;
Philippot et al., 1999; Uekermann & Daum, 2008; Walter et al., 2011).
Emotion Perception
Facial expressions are an important channel in which emotions and feelings
are conveyed (Carton, Kessler, & Pape, 1999). Accurate perception of these facial
expressions is essential for interpersonal communication and is important in
obtaining and maintaining successful relationships (Kornreich et al., 2001; Philippot
et al., 1999). Emotion perception deficits are therefore likely to negatively impact
individuals’ capacity to engage in activities necessitating interactions with others,
such as employment, and leisure activities. Emotion perception deficits have been
attributed to a number of clinical populations, including traumatic brain injury (TBI)
and schizophrenia, whereby reduced social functioning is evident (Kee, Green,
Mintz, & Brekke, 2003; Ponsford, Olver, & Curran, 1995). In particular, these
groups demonstrate difficulties in independent living, maintaining employment, and
Page 13
4
sustaining meaningful social relationships. These difficulties highlight the
importance of emotion perception in successful daily functioning.
Regions of the Brain Involved in Emotion Perception
Emotion perception is one of the most developed perceptual skills in humans
(Haxby, Hoffman, & Gobbini, 2002). Neuroimaging and lesion studies have both
revealed a number of different brain regions that mediate emotion perception
abilities. These include the orbitofrontal and medial pre-frontal cortex, the superior
temporal cortex, the insular, and select regions of the amygdala (Breiter et al., 1996;
Kumfor, Irish, Hodges, & Piguet, 2013; Repeiski, Smith, Sansom, & Repetski, 1996;
Streit et al., 1999). The evolutionary development of the human brain has resulted in
some of these structures being responsible for the recognition of specific emotional
expressions (Haxby et al., 2002). The amygdala, for example, has long been
recognised as having a central role in the recognition of, and response to, fearful
stimuli (Davis, Walker, Miles, & Grillon, 2010; Sripada, Angstadt, McNamara,
King, & Phan, 2011). More specifically, many studies have found increased
amygdala activation in the presence of fearful emotional expressions (Adolphs,
Tranel, Damasio, & Damasio, 1994; Breiter et al., 1996). The insular, a region of the
brain closely associated with the amygdala, is particularly responsive to aversive
stimuli and is predominantly activated in the presence of disgust facial stimuli
(Calder, Lawrence, & Young, 2001; Sprengelmeyer et al., 1996). The specific
structures responsible for the detection of positive emotions (i.e., happiness and
surprise) however, remain less understood (Kumfor et al., 2013).
Neuropathology and Alcohol Intoxication
The regions of the brain involved in emotion perception ability have also
been found in neuroimaging studies to be implicated in alcohol-intoxicated states. In
Page 14
5
particular, alcohol-intoxicated individuals display attenuation of the bilateral
amygdala and the insular, compromising their abilities to correctly identify fearful
and disgust emotional facial expressions (Padula et al., 2011; Sripada et al., 2011).
Given alcohol is considered to be a drug that produces anxiolytic effects (i.e.,
reduced stress and anxiety), the attenuated activation of these brain regions for
negative stimuli in this group is highly intuitive. Further, evidence has also indicated
alcohol intoxicated individuals’ preferential recognition for positive stimuli (e.g.,
happiness and surprise), which may be due to reduced abilities to recognise negative
facial stimuli (Kano et al., 2003).
Neuropathology in Clinical Populations
Similar regions of the brain also appear to be compromised in alternative
clinical populations, such as TBI and schizophrenia, who are known to have
difficulties in emotion recognition. Studies have shown that the pre-frontal and
temporal lobes, the amygdala, and the fusiform gyrus, are particularly affected in
those with a TBI (Hornak, Rolls, & Wade, 1996; Radice-Neumann, Zupan, Babbage,
& Willer, 2007). Croker and McDonald (2005) found that individuals with a TBI
were equally as effective at recognising positive (i.e., happiness, and surprise)
emotional expressions as those without a TBI. Correct identification of negative (i.e.,
sadness, disgust, and fear) emotional expressions, however, were significantly worse
among those with a TBI, except for anger stimuli, in which performance between the
two groups was similar. Similar findings have been reported in individuals with
schizophrenia, with the amygdala, the anterior insular, and the ventral striatum being
recognised as contributing to emotion perception processes (Phillips, Drevets, Rauch,
& Lane, 2003). Similar to alcohol-intoxicated individuals and those with a TBI,
schizophrenic patients display reduced amygdala activation in response to fear
Page 15
6
stimuli (Phillips et al., 1999). Further, individuals with schizophrenia demonstrate
reduced volume of bilateral insular grey matter (Saze et al., 2007), supporting
findings of abnormal recognition of disgust stimuli (Kohler et al., 2003).
A recent study conducted by Rosenberg, McDonald, Dethier, Kessels, and
Westbrook (2014) further demonstrated the propensity for individuals with a TBI to
display deficits in emotion perception across a range of emotion intensities. An
important finding of their study was that not only were TBI individuals impaired in
detecting negative facial stimuli, but they were also impaired in detecting happy
facial stimuli, albeit at lower levels of emotion intensity. Thus, impairments to
emotion perception abilities may be more widespread in some clinical groups than
initially thought.
Alcohol and Emotion Perception
In recent decades, there has been an emergence of research into the effects of
alcohol use on social abilities. However, much of this research has been aimed at
examining the effects of chronic alcohol consumption. Chronic alcohol consumption
is associated with negative social implications, such as isolation and reduced
interpersonal relationships (Maurage, Campanella, Philippot, Martin, & De Timary,
2008). Emotion perception deficits in particular have been identified as a prominent
contributor of social and communication impairments among alcoholics or those
diagnosed with an alcohol use disorder (Kornreich et al., 2001; Maurage et al., 2008;
Philippot et al., 1999).
Alcohol Use Disorder is characterised by problematic patterns of alcohol use
resulting in significant clinical impairment or distress, as manifested by problems
such as the cessation of occupational, social and recreational activities because of
alcohol; continued alcohol use despite continuous social or interpersonal problems
Page 16
7
caused by the effects of alcohol; and desires or unsuccessful attempts at controlling
alcohol use (American Psychiatric Association (APA), 2013). Alcohol use disorder
is also associated with an array of cognitive impairments, such as deficits in
attention; memory; emotional prosody; and executive functions, which are believed
to arise from the functional and structural brain changes that result from chronic
alcohol use (Uekermann & Daum, 2007, 2008). The combination of these cognitive
deficits and impaired emotion perception may help explain the social deficits and
negative social responses, such as aggression, seen among those consuming
excessive proportions of alcohol (Uekermann & Daum, 2007).
Emotion perception deficits were demonstrated by Philippot et al. (1999) in
recently diagnosed alcohol dependent individuals. A series of static photographs,
each displaying one of five basic emotions (happiness, anger, sadness, disgust, and
fear) were used as the emotion perception stimuli. Each emotion was presented on
two male and two female Caucasian faces at four different intensity levels. A 7-point
scale (0 = ‘not at all’, 7 = ‘very intensely’) for eight emotions (happiness, sadness,
fear, anger, disgust, surprise, shame, and contempt) was employed as a measure of
perception accuracy. Accurate identification of an emotional expression occurred
when the scale receiving the highest rating corresponded to the target emotion being
displayed. The authors concluded that individuals with alcohol dependence disorder
were significantly worse at correctly identifying happy, sad, disgust, and angry
emotional expressions in comparison to controls. It was also found that expression
intensity (i.e., slight angry face versus full angry face) did not influence perception
accuracy for happy, sad, and anger stimuli. However, when fear stimuli were
presented at 70 percent and 100 percent intensity levels, perception accuracy was
poorer for alcohol dependent individuals than controls. While these results support
Page 17
8
the existence of emotion perception deficits among chronic alcohol users, the use of
static images may not accurately reflect the dynamic nature of emotional expressions
in humans. As such, it is possible that some emotion perception deficits in alcohol
dependent individuals were not detected in this study.
Kornreich et al. (2001) extended on Philippot et al. (1999) findings by
examining enduring emotion perception deficits (i.e., deficits over time) among
abstainers (abstained for two months) and recently detoxified (abstained for two to
three weeks) individuals. Employing the same methodology as Philippot et al.,
Kornreich et al. found that both the abstainers and detoxified groups were
significantly worse than controls at decoding emotional expressions. However,
abstainers were significantly more accurate than recently detoxified individuals, with
the exception of expressions depicting sadness, anger, and disgust in which their
performance was similar. This indicated identification of negative emotions was
particularly impaired in both the abstained and detoxified group. Interestingly,
alcohol dependent individuals, whether abstinent or recently detoxified, also
displayed little insight into their emotion perception deficits. This was argued by the
authors to be a contributor of inappropriate social responding in these groups.
Alcohol-Intoxication and Emotion Perception
Research has more recently focused on the effects of alcohol intoxication on
emotion perception abilities. Alcohol intoxication occurs as a result of recent
ingestion of alcohol, leading to problematic behavioural or psychological changes,
such as mood lability, impaired judgement, and inappropriate sexual or aggressive
behaviours that develop during or shortly after alcohol consumption (APA, 2013).
The mechanisms underlying these behavioural and psychological changes have been
sparsely examined in alcohol intoxicated individuals.
Page 18
9
Tucker and Vuchinich (1983) attempted to discover a possible mechanism
underlying social behaviours following alcohol consumption. Specifically, Tucker
and Vuchinich examined the effect of alcohol intoxication on emotion perception
abilities, using a series of 14 standardised cross-cultural facial photographs depicting
seven basic emotions (fear, anger, disgust, surprise, happiness, contempt, and
sadness), each presented on a single female face. Seven 11-point scales (0 = ‘no
amount of the emotion is present’, 10 = ‘an extreme amount of the emotion is
present’), each representing one of the basic emotions, was used to assess
identification accuracy. Correct identifications occurred when the emotion receiving
the highest rating corresponded with the target emotion. Consistent with chronic
alcohol users’ performance, alcohol intoxicated individuals were significantly less
accurate at identifying emotional expressions than controls. Although these results
support the existence of emotion perception deficits in alcohol intoxicated
individuals, the authors did not provide results for the individual emotion types.
Difficulties in emotion detection among alcohol-intoxicated individuals,
however, are not consistently reported, with some researchers arguing that
intoxicated individuals are equally as effective at detecting emotional expressions as
non-intoxicated individuals (Kamboj et al., 2013; Walter et al., 2011). One such
study, conducted by Walter et al. (2011), examined the effect of alcohol intoxication
on emotion perception abilities. Specifically, participants were presented with a
series of video clips in which facial expressions gradually changed from a neutral to
a fully expressed emotion. Each clip displayed one of six emotions (happy, sad,
disgust, fearful, angry, and surprised), each of which were displayed on one of six
individuals. While viewing each video clip, participants were instructed to press the
space bar on a keyboard when they were able to detect an emotion emerging from a
Page 19
10
neutral expression. Emotion perception ability in this study is therefore determined
by the intensity threshold at which participants are able to correctly identify an
emotion. Although Walter et al. examined the detection of all six basic emotions,
only anger and happiness were analysed. Significant between group differences were
not detected, indicating that alcohol intoxicated individuals were equally as capable
at correctly identifying these emotion as non-intoxicated individuals at the intensity
threshold level.
Whether alcohol-intoxicated individuals experience difficulties for select
emotion types, and whether these difficulties are apparent across varying intensity
levels remains unknown. However, based on similar neuropathological profiles
between the previously mentioned clinical populations and alcohol intoxicated
individuals, it is reasonable to expect that alcohol intoxicated individuals may also
display emotion perception deficits, particularly for negative stimuli. Further, based
on the findings of Rosenberg et al. (2014), it is also reasonable to expect that deficits
in the identification of positive facial stimuli may also be present, albeit at lower
intensity levels. These deficits are also likely to be exacerbated by an inability to
recognise or have insight into emotion perception difficulties.
Insight – Comprehensive Dynamic Interactional Model
Insight refers to the ability to accurately recognise one’s deficits (Toglia &
Kirk, 2000). The Pyramid Model proposed by Barco, Crosson, Bolesta, Werts, and
Stout (1991) explains insight as a hierarchical process. At the base of the hierarchy is
intellectual awareness, which provides the foundations for the subsequent levels of
the hierarchy; emergent and anticipatory awareness. ‘Intellectual awareness’
(sometimes also referred to as trait awareness) refers to the general ability to
recognise that you have an existing deficit or generalised difficulty in performing a
Page 20
11
particular type of task. Higher levels of intellectual awareness allows for recognition
of any implications that may arise as a result of those deficits. The ability to
recognise a problem when it occurs, on the other hand, is a process referred to as
‘emergent awareness’ (sometimes also referred to as state awareness). Emergent
awareness sits in the middle of the hierarchy. Discrepancies between intellectual
awareness and emergent awareness can exist. For instance, although intellectual
awareness may be intact, emergent awareness may be deficient, consequently
restricting an individual’s ability to apply situation specific compensations.
‘Anticipatory awareness’ occupies the peak of the hierarchy and is largely dependent
on the preceding levels. Anticipatory awareness extends on emergent awareness in
that individuals are not only required to recognise the existence of a deficit in
relation to performance on a specific task, but they are also required to anticipate
future problems as a result of their deficit.
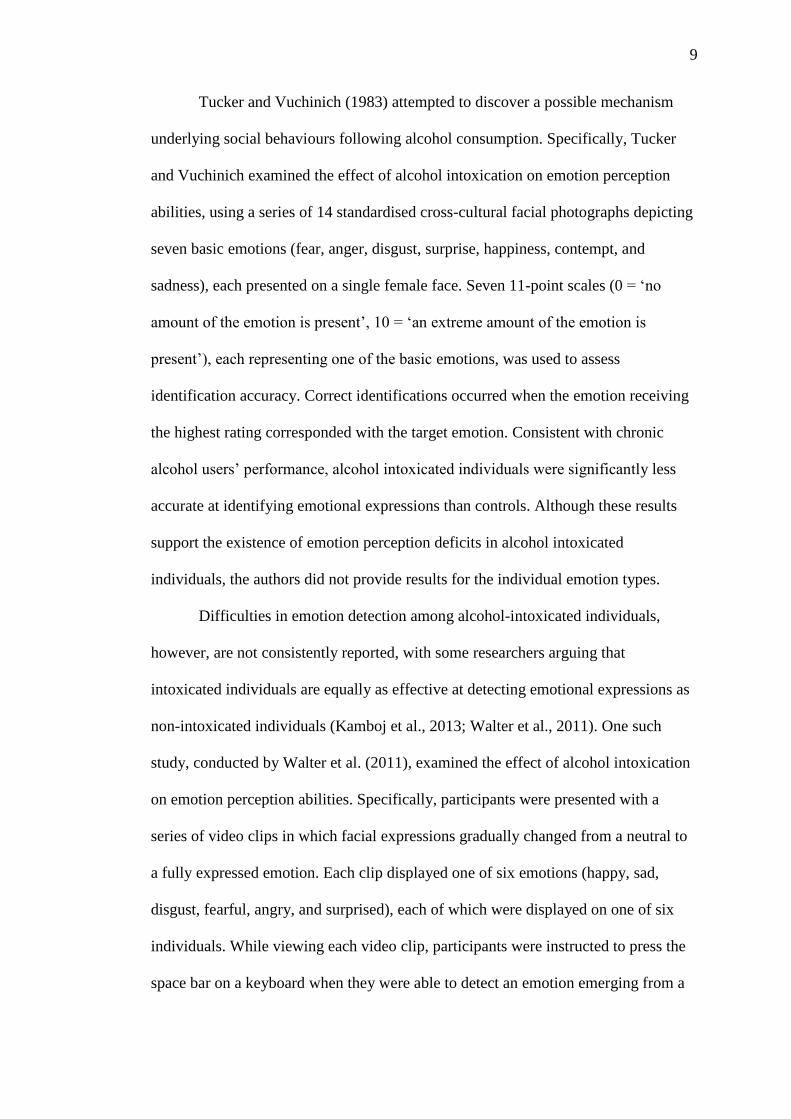
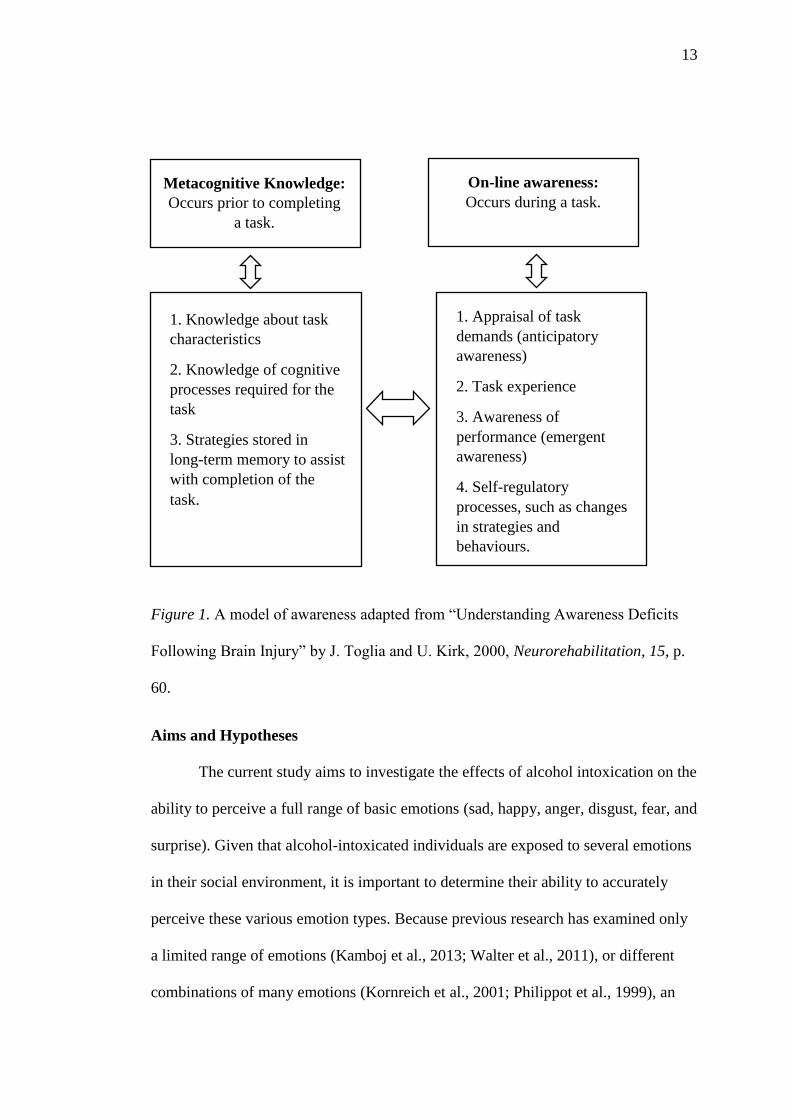
Toglia and Kirk (2000) argue that the hierarchical nature of Barco et al.
(1991) model does not accurately reflect the dynamic nature of insight. Instead,
Toglia and Kirk propose that insight is comprised of two interrelated domains:
metacognitive knowledge and online awareness (Figure 1). Metacognitive
knowledge refers to knowledge that exists prior to engaging in a task and consists of
factual knowledge about task characteristics, knowledge of the cognitive processes
required for the task, and strategies that are stored in long-term memory that assist
task completion. Whereas metacognitive knowledge is what individuals bring to a
task, on-line awareness occurs throughout a task and involves monitoring and
regulation of individual performance. Self-monitoring involves the appraisal of task
demands (anticipatory awareness) and awareness of performance on that given task
(emergent awareness). Self-monitoring consequently results in self-regulatory
Page 21
12
processes, such as changes in strategies and behaviour in response to task demands.
Inaccurate self-monitoring and overestimation of capabilities can prove
problematic, such as in situations involving emotion perception. In particular, poor
self-monitoring hinders individuals’ abilities to adaptively alter strategies and
behaviours in response to a given task, such as in an emotion recognition task.
Accurate emotion perception is fundamental for successful social interaction
(Attwood et al., 2009), as is the ability to accurately recognise emotion perception
performance. Inaccurate performance perception may prevent withdrawal of
negative, or initiation of desirable social responses. For example, perceptions of
negative expressions, combined with inaccurate overestimation of perception
performance, may prevent reductions in negative social responses. Similarly,
perceptions of positive expressions, combined with inaccurate overestimation of
performance, may prevent increases in desirable social responses. An understanding
of the effects of alcohol on both emotion perception and insight into emotion
perception ability are therefore both important considerations in understanding the
possible mechanisms underlying alcohol-related negative social behaviours.
Page 22
13
Figure 1. A model of awareness adapted from “Understanding Awareness Deficits
Following Brain Injury” by J. Toglia and U. Kirk, 2000, Neurorehabilitation, 15, p.
60.
Aims and Hypotheses
The current study aims to investigate the effects of alcohol intoxication on the
ability to perceive a full range of basic emotions (sad, happy, anger, disgust, fear, and
surprise). Given that alcohol-intoxicated individuals are exposed to several emotions
in their social environment, it is important to determine their ability to accurately
perceive these various emotion types. Because previous research has examined only
a limited range of emotions (Kamboj et al., 2013; Walter et al., 2011), or different
combinations of many emotions (Kornreich et al., 2001; Philippot et al., 1999), an
1. Knowledge about task
characteristics
2. Knowledge of cognitive
processes required for the
task
3. Strategies stored in
long-term memory to assist
with completion of the
task.
1. Appraisal of task
demands (anticipatory
awareness)
2. Task experience
3. Awareness of
performance (emergent
awareness)
4. Self-regulatory
processes, such as changes
in strategies and
behaviours.
Metacognitive Knowledge:
Occurs prior to completing
a task.
On-line awareness:
Occurs during a task.
Page 23
14
understanding of how alcohol affects perception of the six universal basic emotions
is yet to be obtained. Secondly, given that no comprehensive examination of emotion
perception abilities across varying levels of emotion intensity has been conducted,
the current study also aims to examine the effect of alcohol intoxication on emotion
perception ability across five levels of emotion intensity (20%, 40%, 60%, 80%, and
100%). Lastly, based on the findings of Kornreich et al. (2001), the current study
assesses participants’ insight into their emotion perception abilities by obtaining a
confidence rating ranging from 0% to 100% for each viewed emotion. Gaining an
understanding of the difficulties alcohol-intoxicated individuals experience in
recognising the emotions of others and in appraising their own abilities, may be
fundamental to developing an understanding of why alcohol-intoxicated individuals
engage in negative social behaviours.
It is specifically hypothesised that: (1) Alcohol-intoxicated individuals will
have greater difficulties in correctly labelling negative, but not positive, emotional
expressions than non-intoxicated individuals when emotions are displayed at higher
(i.e., 80-100%) intensity levels. (2) Alcohol-intoxicated individuals will have greater
difficulties in correctly labelling emotional expressions when they are displayed at
lower (i.e., 20-60%) intensity levels regardless of emotional valence than non-
intoxicated individuals. (3) Alcohol-intoxicated individuals will demonstrate a
greater lack of insight into their emotion perception abilities when compared to non-
intoxicated individuals.
Method
Design
The current study employed a mixed, single-blind, placebo-controlled,
randomly-allocated design with three independent variables (condition: placebo and
Page 24
15
alcohol; emotion: sad, happy, anger, disgust, fear, and surprise; and intensity: 20%,
40%, 60%, 80%, 100%) and one dependent variable (correct identification of
emotions). Ratings of performance on emotion perception task items were also
obtained using a zero to 100 percent scale.
Participants
Participants were 64 adults aged between 18 and 34 years. They were
randomly allocated (using the randomisation function in Microsoft Excel) to either
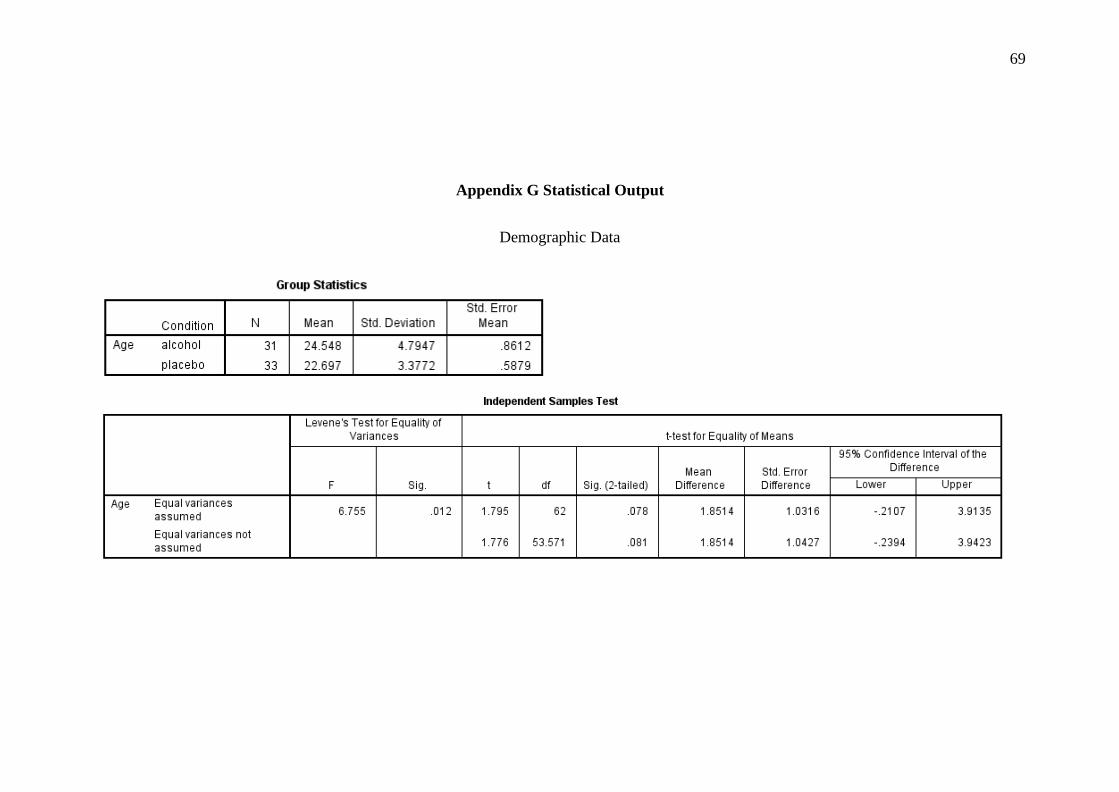
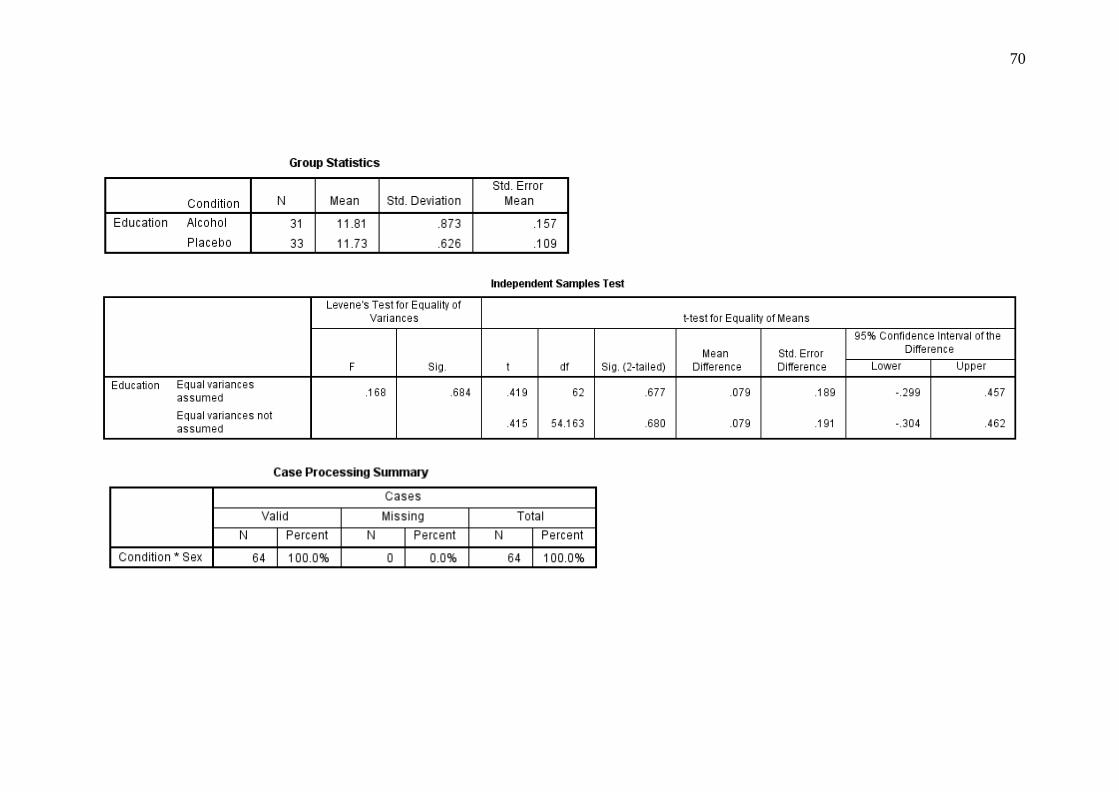
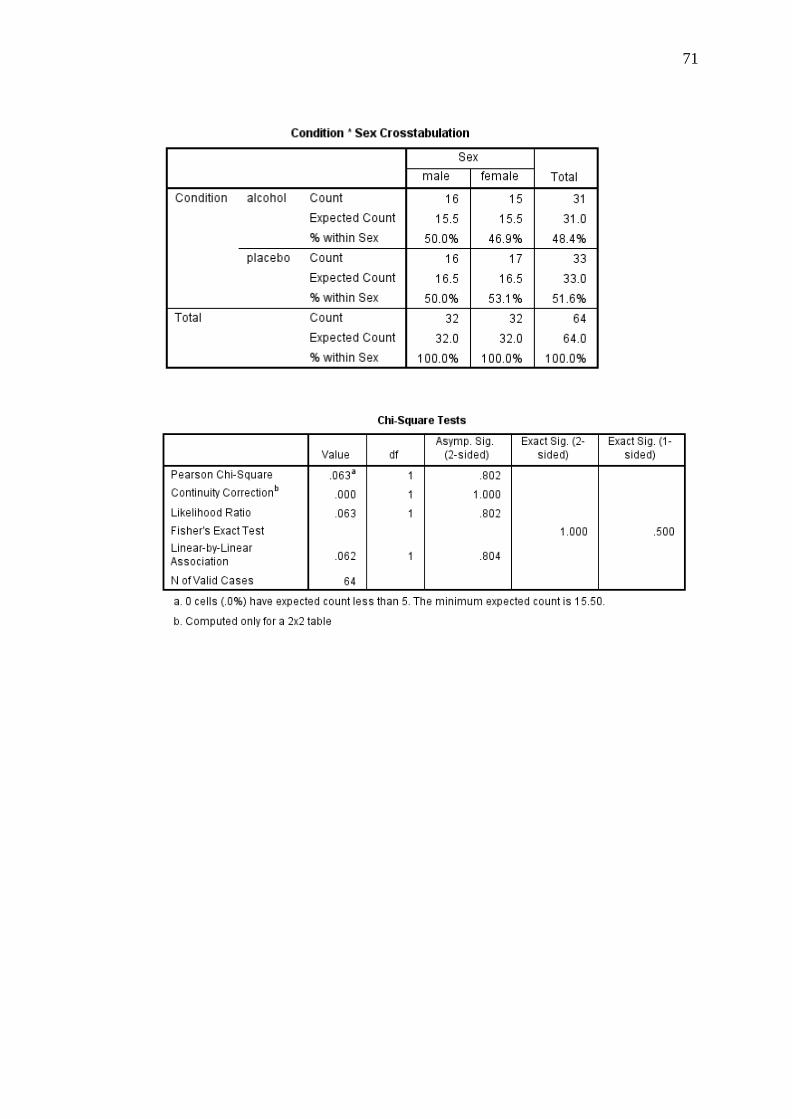
an alcohol intoxication or placebo condition. Basic demographic information for the
participants stratified by condition is shown in Table 1. Independent samples t-tests
indicated no differences between conditions on age or gender. A chi-square test of
goodness-of-fit indicated that there were no significant differences in the proportion
of males and females in the alcohol and placebo conditions, χ2(1, N = 64) = .06, p =
.802 (see Table 1 for demographic data).
An a-priori power analysis was conducted prior to recruiting participants
using G*Power 3.1.9.2 (Faul, Erdfelder, Lang, & Buchner, 2007) which indicated
that a sample of 42 participants would be required to detect significance with a large
effect size (d = .80, Cohen, 1992) (power = .80, alpha level = .05). Participants were
recruited from the University of Tasmania’s Newnham Campus and the wider
community via advertising on SONA (a secure online electronic platform), delivery
of presentations to first year psychology lectures, and flyers placed around the
University Campus (see Appendix B). Students undertaking first year psychology
units received three hours course credit, while all other participants received a single
Village Cinemas movie voucher for their time.
Page 25
16
Table 1
Descriptive and Inferential Statistics for Demographic Data
Alcohol Placebo t df p Cohens d
Male 16 (52%) 16 (49%)
Female 15 (48%) 17 (52%)
Age 24.55 (3.38) 22.70 (4.80) 1.78 53.57 .081 .44
Education 11.81 (.87) 11.73 (.63) .42 62 .677 .12
Note: For gender, frequency values are noted with proportion of participants in each
condition provided in brackets. For Age and Education, mean values are shown with
standard deviation (SD) values provided in brackets.
All participants were regular alcohol consumers as determined by responses
on a Timeline Follow-Back task (TLFB; Sobell, Sobell, Klajner, Pavan, & Basian,
1986), were fluent in their ability to read and speak English, had completed Year 10
or equivalent, had normal or corrected-to-normal vision, and had a Body Mass Index
(BMI) between 18.5 and 29.9. Participants were excluded if they had a history of a
neurological condition (e.g., epilepsy, traumatic brain injury, and stroke); had a
current diagnosis of a significant physical condition; had a current diagnosis of a
psychiatric disorder or a score of 30 or higher on the Kessler Psychological Distress
Scale (K10; Kessler et al., 2002); were regular tobacco smokers (one or more
cigarettes daily); had used illicit drugs in the preceding six months; were currently
using medicinal or recreational prescription medication (excluding contraceptive
medication); had been involved in a drug study in the preceding three months; and
had a history of alcohol or drug dependence or abuse disorder or use of alcohol at
Page 26
17
hazardous levels, determined by a score of 16 or higher on the Alcohol Use
Disorders Identification Test (AUDIT; Saunders, Aasland, Babor, De la Fuente, &
Grant, 1993). Ninety-six individuals completed the online eligibility assessments,
however, 32 of these were excluded because they did not meet the inclusion and
exclusion criteria.
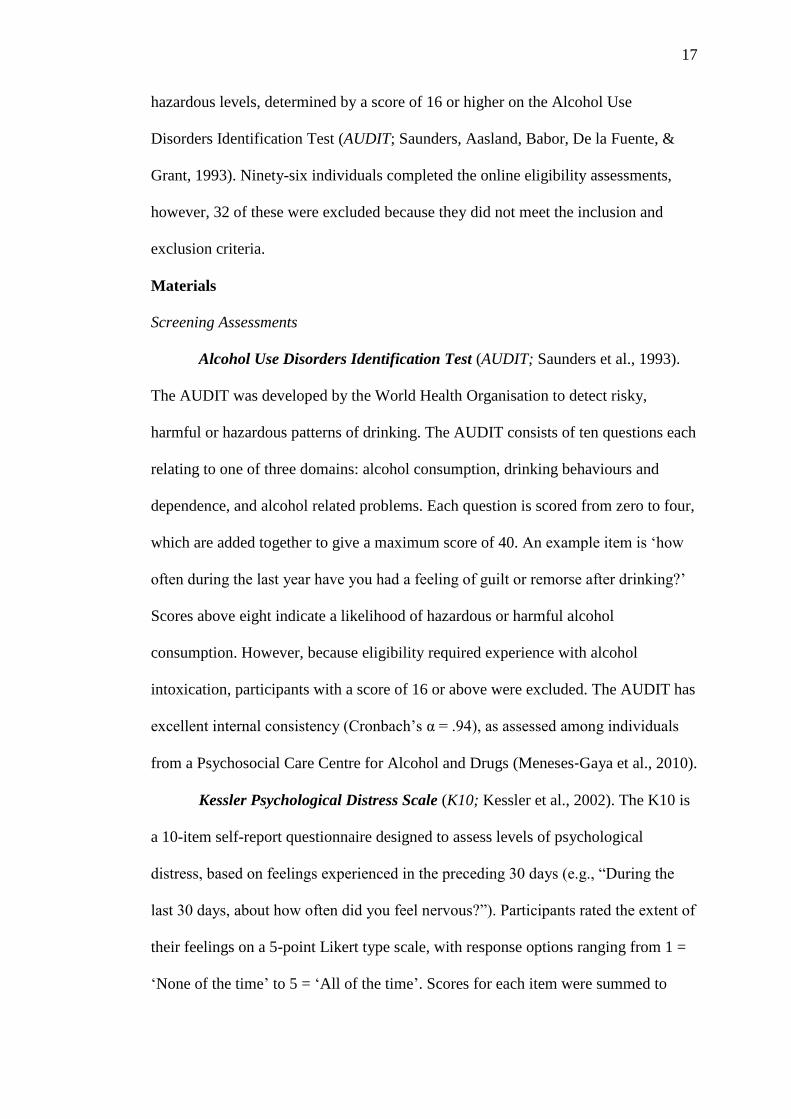
Materials
Screening Assessments
Alcohol Use Disorders Identification Test (AUDIT; Saunders et al., 1993).
The AUDIT was developed by the World Health Organisation to detect risky,
harmful or hazardous patterns of drinking. The AUDIT consists of ten questions each
relating to one of three domains: alcohol consumption, drinking behaviours and
dependence, and alcohol related problems. Each question is scored from zero to four,
which are added together to give a maximum score of 40. An example item is ‘how
often during the last year have you had a feeling of guilt or remorse after drinking?’
Scores above eight indicate a likelihood of hazardous or harmful alcohol
consumption. However, because eligibility required experience with alcohol
intoxication, participants with a score of 16 or above were excluded. The AUDIT has
excellent internal consistency (Cronbach’s α = .94), as assessed among individuals
from a Psychosocial Care Centre for Alcohol and Drugs (Meneses‐Gaya et al., 2010).
Kessler Psychological Distress Scale (K10; Kessler et al., 2002). The K10 is
a 10-item self-report questionnaire designed to assess levels of psychological
distress, based on feelings experienced in the preceding 30 days (e.g., “During the
last 30 days, about how often did you feel nervous?”). Participants rated the extent of
their feelings on a 5-point Likert type scale, with response options ranging from 1 =
‘None of the time’ to 5 = ‘All of the time’. Scores for each item were summed to
Page 27
18
give a total “psychological distress” score, with a maximum score of 50. Participants
with scores greater than 30 (i.e. which indicate high levels of distress) were excluded
from the study. The K10 has good internal consistency (Cronbach’s α = .84), as
determined by assessments of individuals with an alcohol-related disorder (Arnaud et
al., 2010).
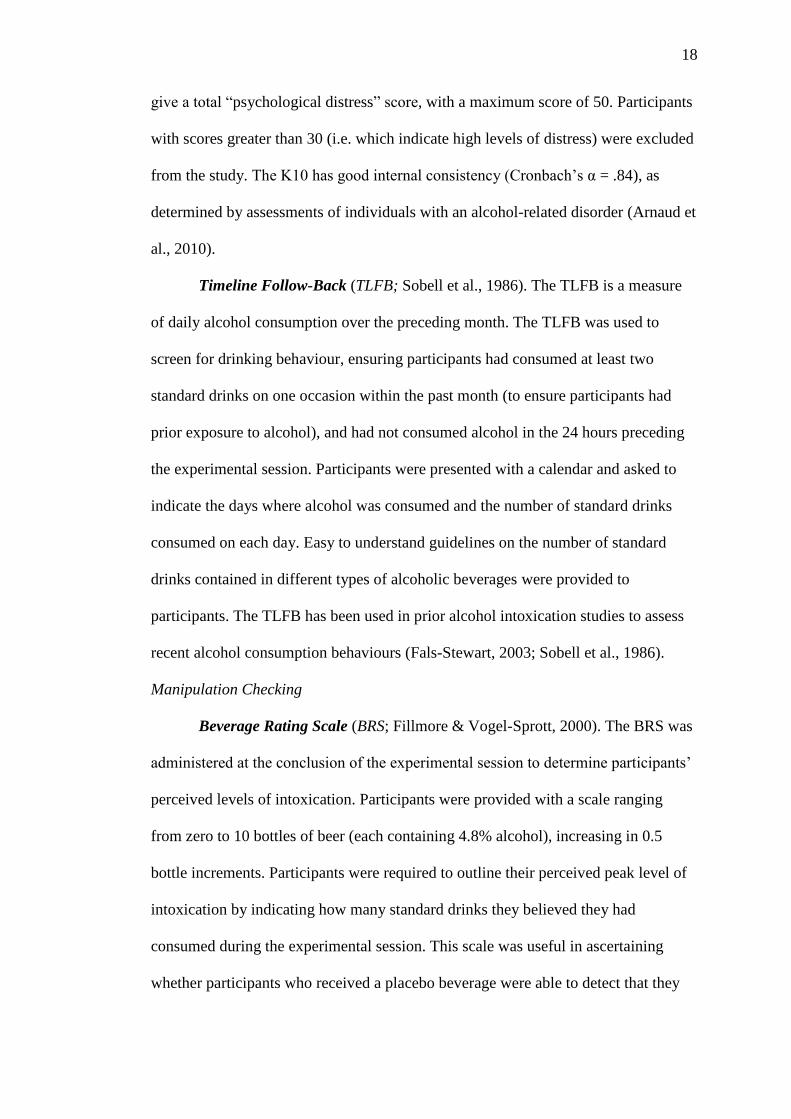
Timeline Follow-Back (TLFB; Sobell et al., 1986). The TLFB is a measure
of daily alcohol consumption over the preceding month. The TLFB was used to
screen for drinking behaviour, ensuring participants had consumed at least two
standard drinks on one occasion within the past month (to ensure participants had
prior exposure to alcohol), and had not consumed alcohol in the 24 hours preceding
the experimental session. Participants were presented with a calendar and asked to
indicate the days where alcohol was consumed and the number of standard drinks
consumed on each day. Easy to understand guidelines on the number of standard
drinks contained in different types of alcoholic beverages were provided to
participants. The TLFB has been used in prior alcohol intoxication studies to assess
recent alcohol consumption behaviours (Fals-Stewart, 2003; Sobell et al., 1986).
Manipulation Checking
Beverage Rating Scale (BRS; Fillmore & Vogel-Sprott, 2000). The BRS was
administered at the conclusion of the experimental session to determine participants’
perceived levels of intoxication. Participants were provided with a scale ranging
from zero to 10 bottles of beer (each containing 4.8% alcohol), increasing in 0.5
bottle increments. Participants were required to outline their perceived peak level of
intoxication by indicating how many standard drinks they believed they had
consumed during the experimental session. This scale was useful in ascertaining
whether participants who received a placebo beverage were able to detect that they
Page 28
19
had not consumed alcohol. The BRS has been used in prior alcohol intoxication
studies as a manipulation check (Fillmore & Vogel-Sprott, 1999).
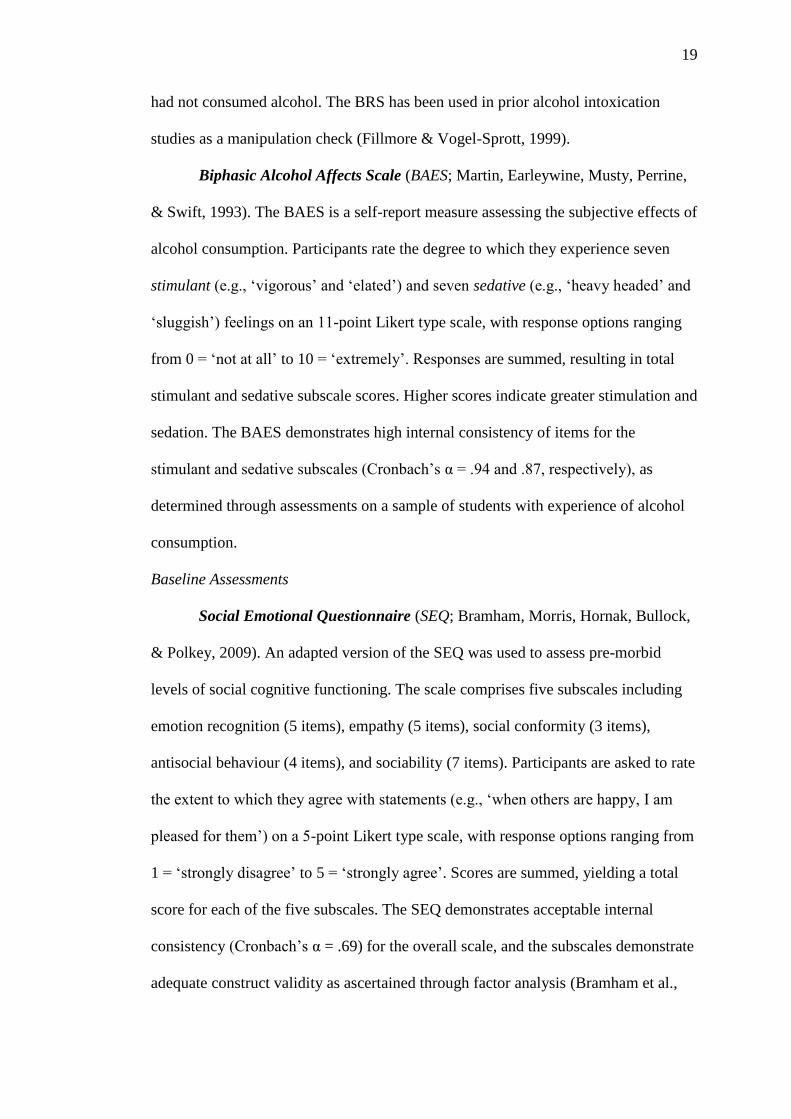
Biphasic Alcohol Affects Scale (BAES; Martin, Earleywine, Musty, Perrine,
& Swift, 1993). The BAES is a self-report measure assessing the subjective effects of
alcohol consumption. Participants rate the degree to which they experience seven
stimulant (e.g., ‘vigorous’ and ‘elated’) and seven sedative (e.g., ‘heavy headed’ and
‘sluggish’) feelings on an 11-point Likert type scale, with response options ranging
from 0 = ‘not at all’ to 10 = ‘extremely’. Responses are summed, resulting in total
stimulant and sedative subscale scores. Higher scores indicate greater stimulation and
sedation. The BAES demonstrates high internal consistency of items for the
stimulant and sedative subscales (Cronbach’s α = .94 and .87, respectively), as
determined through assessments on a sample of students with experience of alcohol
consumption.
Baseline Assessments
Social Emotional Questionnaire (SEQ; Bramham, Morris, Hornak, Bullock,
& Polkey, 2009). An adapted version of the SEQ was used to assess pre-morbid
levels of social cognitive functioning. The scale comprises five subscales including
emotion recognition (5 items), empathy (5 items), social conformity (3 items),
antisocial behaviour (4 items), and sociability (7 items). Participants are asked to rate
the extent to which they agree with statements (e.g., ‘when others are happy, I am
pleased for them’) on a 5-point Likert type scale, with response options ranging from
1 = ‘strongly disagree’ to 5 = ‘strongly agree’. Scores are summed, yielding a total
score for each of the five subscales. The SEQ demonstrates acceptable internal
consistency (Cronbach’s α = .69) for the overall scale, and the subscales demonstrate
adequate construct validity as ascertained through factor analysis (Bramham et al.,
Page 29
20
2009).
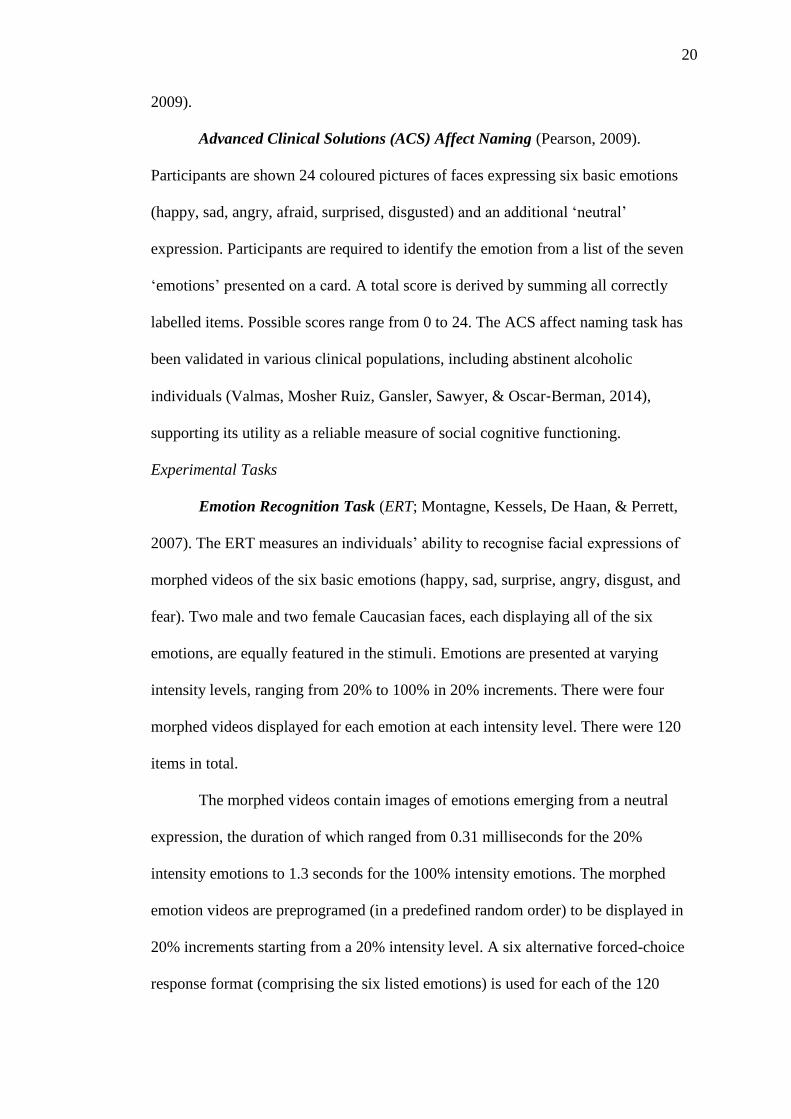
Advanced Clinical Solutions (ACS) Affect Naming (Pearson, 2009).
Participants are shown 24 coloured pictures of faces expressing six basic emotions
(happy, sad, angry, afraid, surprised, disgusted) and an additional ‘neutral’
expression. Participants are required to identify the emotion from a list of the seven
‘emotions’ presented on a card. A total score is derived by summing all correctly
labelled items. Possible scores range from 0 to 24. The ACS affect naming task has
been validated in various clinical populations, including abstinent alcoholic
individuals (Valmas, Mosher Ruiz, Gansler, Sawyer, & Oscar‐Berman, 2014),
supporting its utility as a reliable measure of social cognitive functioning.
Experimental Tasks
Emotion Recognition Task (ERT; Montagne, Kessels, De Haan, & Perrett,
2007). The ERT measures an individuals’ ability to recognise facial expressions of
morphed videos of the six basic emotions (happy, sad, surprise, angry, disgust, and
fear). Two male and two female Caucasian faces, each displaying all of the six
emotions, are equally featured in the stimuli. Emotions are presented at varying
intensity levels, ranging from 20% to 100% in 20% increments. There were four
morphed videos displayed for each emotion at each intensity level. There were 120
items in total.
The morphed videos contain images of emotions emerging from a neutral
expression, the duration of which ranged from 0.31 milliseconds for the 20%
intensity emotions to 1.3 seconds for the 100% intensity emotions. The morphed
emotion videos are preprogramed (in a predefined random order) to be displayed in
20% increments starting from a 20% intensity level. A six alternative forced-choice
response format (comprising the six listed emotions) is used for each of the 120
Page 30
21
expressions with participants required to select the emotion that most closely
corresponds with the emotional facial expression. When selecting responses for this
study, participants were also asked to verbally rate their level of confidence in
correctly identifying the emotional facial expression. Specifically, they were asked
“on a scale from zero to 100 how confident are you that you correctly identified the
emotion?”. To ensure familiarity with the task, participants completed three practice
trials, at which point the researcher assisted them if they did not understand the
procedure.
Procedure
Prospective participants completed eligibility screening assessments,
delivered via SONA. A follow-up screening interview (see Appendix C) was
conducted via telephone to confirm eligibility and to arrange a mutual time for the
experimental session. Information gathered at screening included basic demographic
information, current height and weight, relevant medical history, and information
pertaining to whether at least two standard alcoholic beverages had been consumed
within the preceding month. The AUDIT (Saunders et al., 1993) and K10 (Kessler et
al., 2002) were also completed at screening. Prior to participating, participants were
asked to abstain from food for four hours, caffeine for eight hours, over the counter
medication and alcohol for 24 hours, nicotine and illicit drugs for the duration of
participation, and consent to be administered alcohol. Participants were also asked to
consume a light meal absent of high fat or dairy products prior to fasting and to limit
their water consumption four hours prior to the experimental session. To account for
individual differences in metabolic rate, participants were asked to consume two
slices of toast with their choice of spread one hour prior to participation. Toast was
made available by the researcher if the participant did not have access to appropriate
Page 31
22
facilities.
Participants were provided with an information sheet (see Appendix D) and
written informed consent was obtained prior to participation (see Appendix E). Upon
arrival, participants were weighed and their height measured to ensure they met
eligibility requirements concerning BMI and to calculate a required dosage of
alcohol. A breath alcohol concentration (BrAC) reading was taken using a Lion
Alcolmeter 400+ Breathalyser to ensure participants had not consumed alcohol. The
Timeline Followback was then completed to ensure compliance with eligibility
requirements. All participants were then administered a 100ml placebo beverage
containing soda water, Angostura® bitters and lime syrup. Three ml of Smirnoff Red
Label No. 21 vodka was floated on top of the beverage and a light mist of vodka was
sprayed around the inside edge of the cup to create an alcohol scent. This initial
administration of a placebo beverage was designed to control for alcohol expectancy
effects when completing baseline assessment tasks which were administered to
ensure there were no pre-existing differences in social functioning across
experimental conditions. These baseline tasks included the SEQ (Bramham et al.,
2009) and the ACS Affect Naming task (Pearson, 2009).
After completing baseline tasks, participants were administered either a
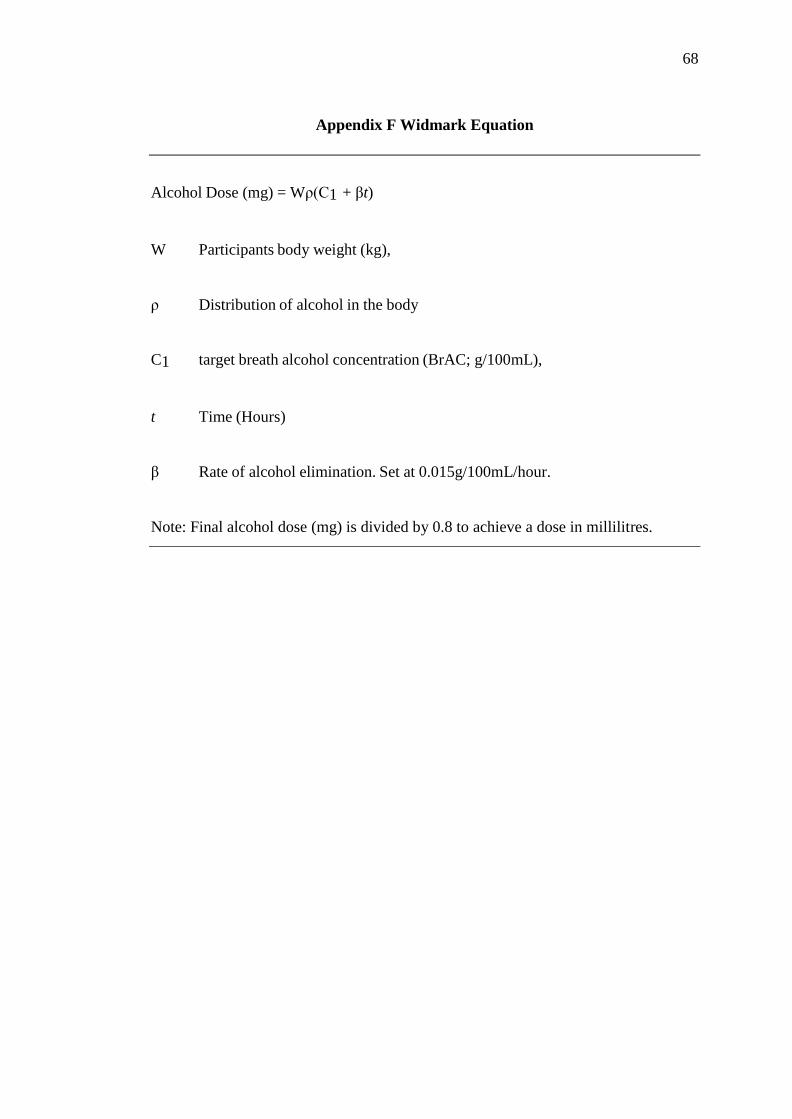
750ml placebo beverage or a 750ml alcoholic beverage. The Widmark equation (see
Appendix F; Dry, Burns, Nettelbeck, Farquharson, & White, 2012) was used to
calculate an alcohol dosage based on participants’ BMI, allowing a peak BrAC
reading of .08% to be reached. Ninety ml’s of lime syrup and 4ml’s of Angostura®
aromatic bitters were added to both beverages to mask smell and taste. Although
Angostura® aromatic bitters contains 44.7% alcohol by volume, previous research
has indicated that it is not sufficient to affect BrAC readings (Loeber & Duka, 2009).
Page 32
23
Participants were given 10 minutes to consume the beverage at a steady pace
and were asked not to hold it in their mouth for longer than five seconds. Participants
were allowed to drink no more than 250ml of still water throughout the experimental
session. Following beverage consumption, participants were placed in a separate
room where they viewed a neutral video (David Attenborough’s Great Barrier Reef)
while the alcohol was being absorbed. Participants were asked to refrain from
engaging in other activities (i.e., mobile phone use) during this absorption period.
Fifty minutes following beverage consumption a BrAC reading was obtained,
at which point BrAC was expected to be at .08%. Participants then completed a
Biphasic Alcohol Effects Scale (Martin et al., 1993) to check that the manipulation
was effective before completing the Emotion Recognition Task (Montagne et al.,
2007). Following this, they completed an additional Biphasic Alcohol Effects Scale,
and the Beverage Rating Scale (Fillmore & Vogel-Sprott, 2000).
After the conclusion of the experimental procedure, participants were
provided with entertainment, food, and water. Participants holding their full licence
were required to remain with the researcher until two consecutive BrAC readings of
.03% (.00% if the participant had a Provisional licence and were intending to drive),
measured 15 minutes apart, were recorded. Alternatively, participants were given the
option of being escorted by a nominated guardian to their place of residence and
accompanied for two hours following session completion.
Statistical Analyses
All statistical analyses were conducted using IBM SPSS Statistics Version
23. Independent samples t-tests were conducted to identify any significant
differences between conditions on eligibility and baseline assessments. A 2
(condition: alcohol and placebo) × 3 (time: baseline, time one, and time two) × 2
Page 33
24
(subscale: sedative and stimulant) mixed linear models full information maximum
likelihood (FIML) analysis (using syntax developed by Enders, 2011) was conducted
to examine differences between conditions on the BAES. A 2 (condition: alcohol and
placebo) × 5 (intensity: 20%, 40%, 60%, 80%, and 100%) × 6 (emotion: happy,
surprise, fear, anger, disgust, and sadness) mixed linear models FIML analysis was
also conducted to identify any significant differences between conditions on emotion
perception accuracy. Alpha levels were maintained at α = .05 for eligibility and
baseline analyses. However, a more conservative alpha level of .01 was used when
examining emotion perception accuracy to control for Type I error rate. Effect sizes
were interpreted in the context of Cohen’s d values, with .20 indicative of a small
effect, .50 a moderate effect, and .80 a large effect (Cohen, 1992).
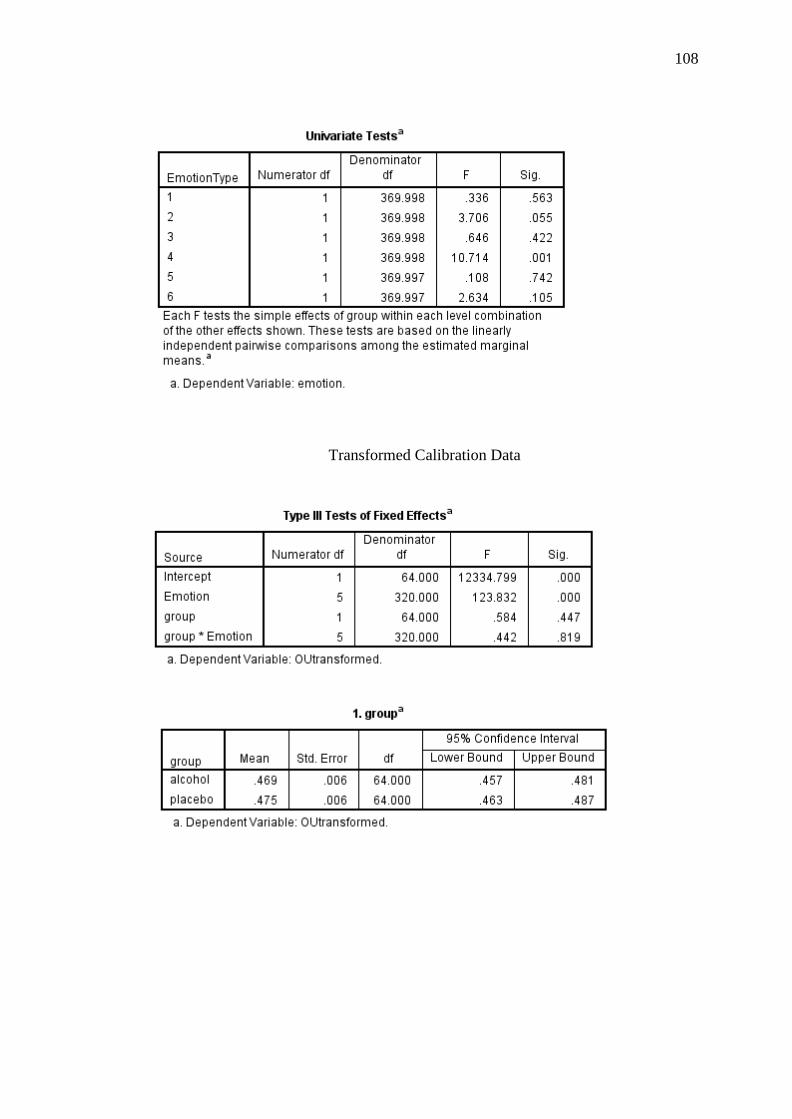
Assumptions for all analyses were checked. Where the homogeneity of
variance assumption was violated for the t-tests, the equal variances not assumed
statistics were reported. Due to non-normal positively skewed distributions, an
inverse transformation was performed on the Calibration and ANDI statistics and a
square root transformation was performed on the BAES. These transformations
normalised the data, however did not impact the results. Therefore, for ease of
interpretation all results presented in this paper were based on the raw data.
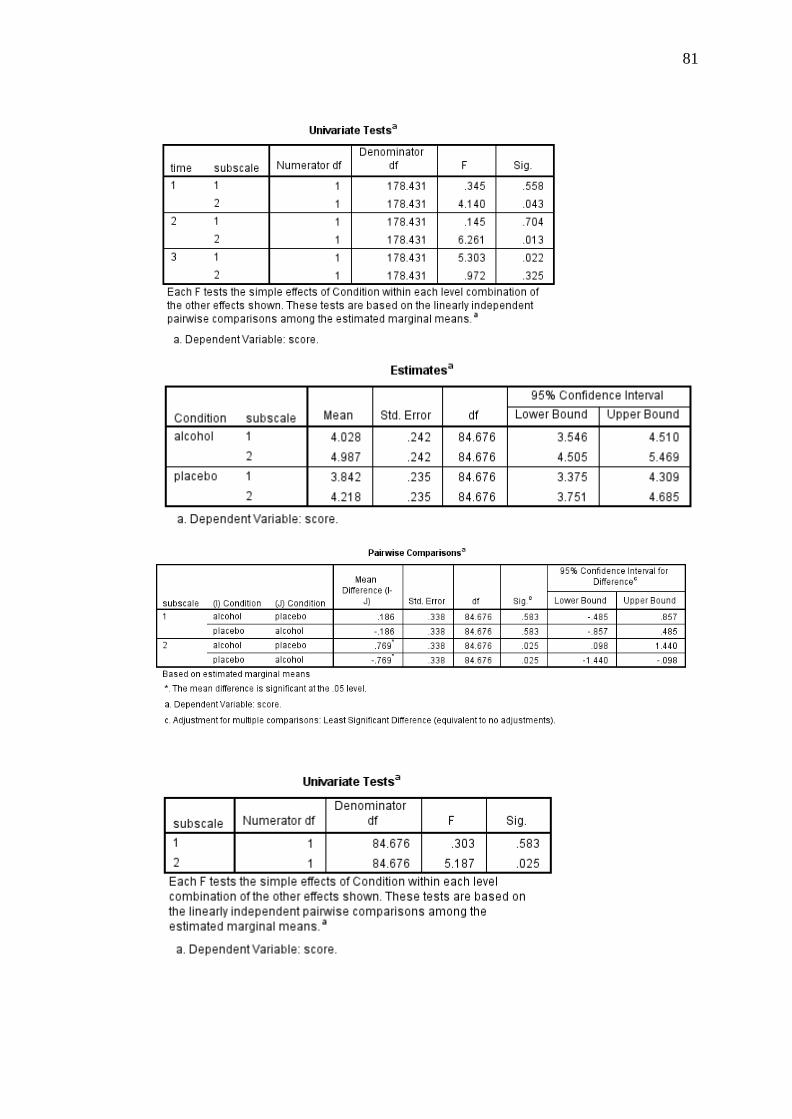
Analysis of Emotion Perception Accuracy. The current study conducted
Calibration analyses to assess the relationship between confidence ratings and
accuracy for the ERT items. Calibration refers to the match between objective
(accuracy) and subjective (confidence) probabilities of an event occurring, and can
be assessed by calculating Calibration, over/under confidence (O/U), and resolution
values (Weber & Brewer, 2004). Perfect Calibration occurs when the proportion of
correct responses is equal to the attributed confidence judgements (e.g., items that
Page 34
25
receive 60% confidence are accurately identified 60% of the time) (Yaniv, Yates, &
Smith, 1991). The Calibration statistic, with values ranging from 0 (perfect
Calibration) to 1 (worst possible Calibration), provides an indication of the extent to
which the relationship between accurate identifications of emotion and confidence
ratings deviates from optimum Calibration (Brewer & Wells, 2006). The O/U
statistic provides an indication of individuals’ tendencies to over- or under-estimate
their accuracy abilities. Values for this statistic range from -1 (complete under-
confidence) to +1 (complete confidence), and is derived by calculating the difference
between mean confidence and mean accuracy. Assessment of resolution or
discrimination can also be obtained. Resolution refers to an individual’s capacity to
discriminate between the probability of an event occurring (correct recognition) and
the probability of an event not occurring (incorrect recognition) (Howie & Roebers,
2007; Yaniv et al., 1991). Resolution can be expressed using the Adjusted
Normalised Discrimination Index (ANDI) which ranges from 0 (no discrimination)
to 1 (perfect discrimination) (Palmer, Brewer, Weber, & Nagesh, 2013).
The accuracy of confidence ratings for this study was assessed by examining
the departure of confidence ratings from optimal Calibration (Calibration and O/U
statistics) and their ability to discriminate between correctly and incorrectly
recognised items (ANDI). It is important to note that each of these statistics offers
unique and distinct information. In particular, perfect Calibration is not indicative of
perfect discrimination, and poor Calibration is not indicative of poor discrimination
(Yaniv et al., 1991).
Page 35
26
Results
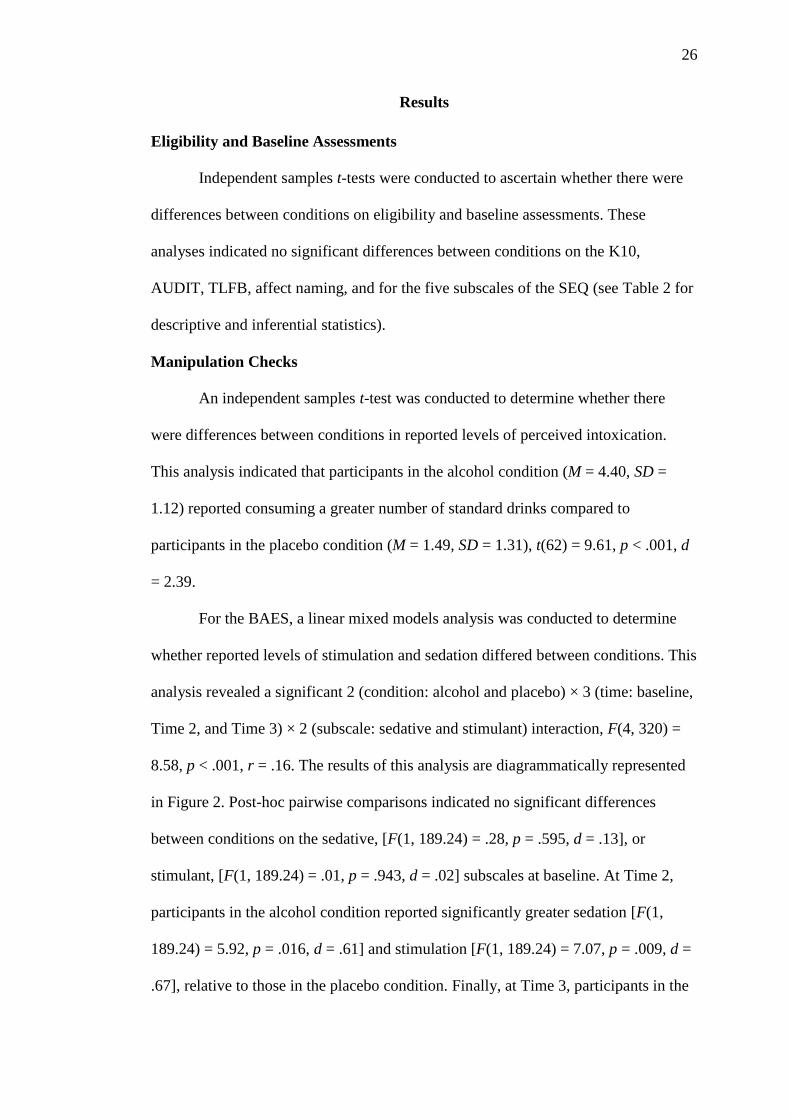
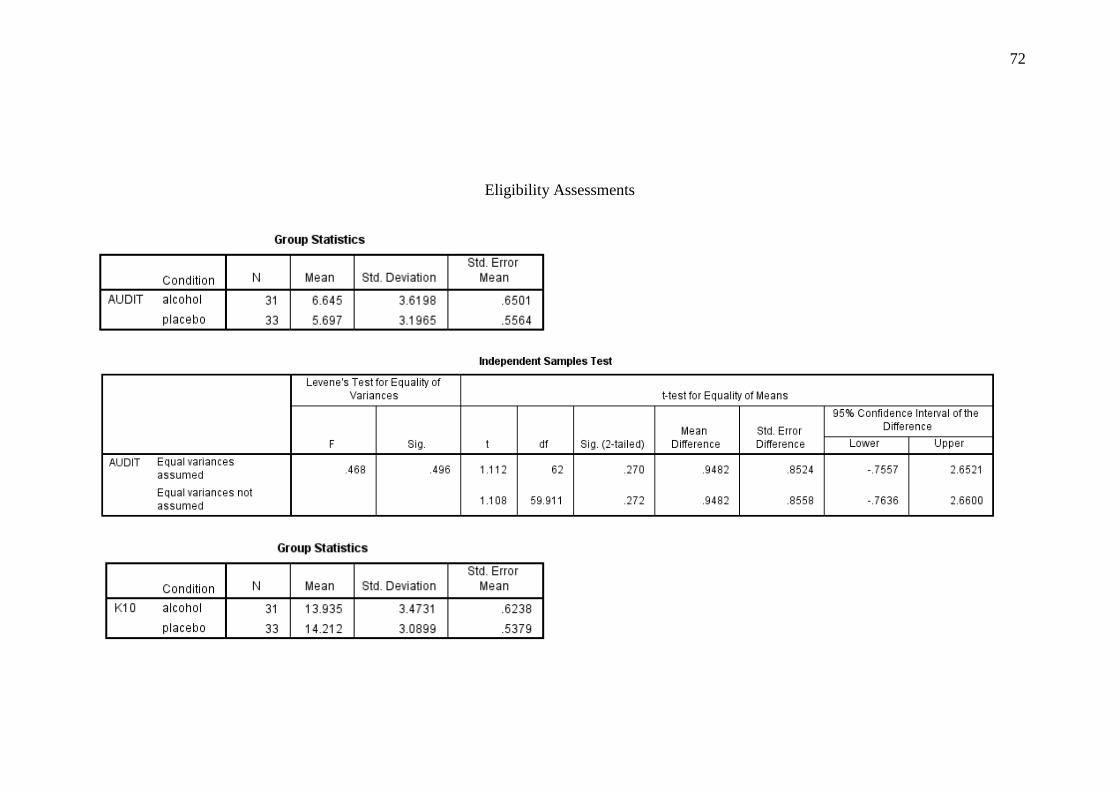
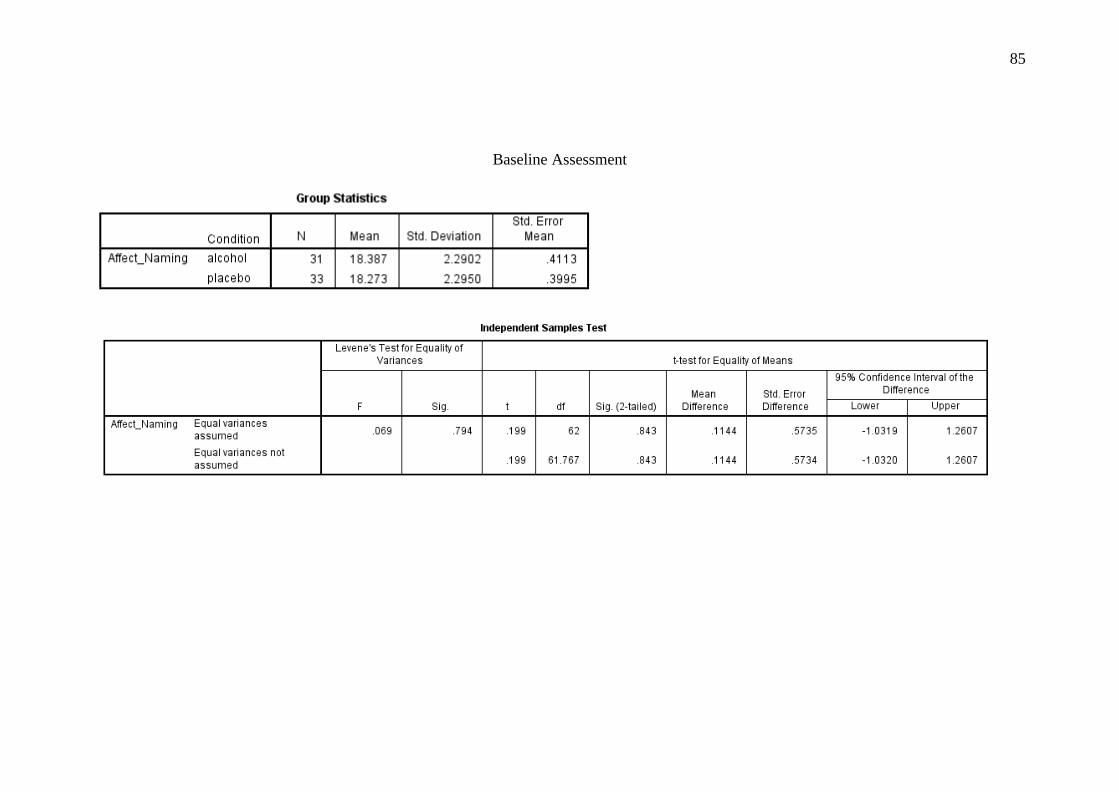
Eligibility and Baseline Assessments
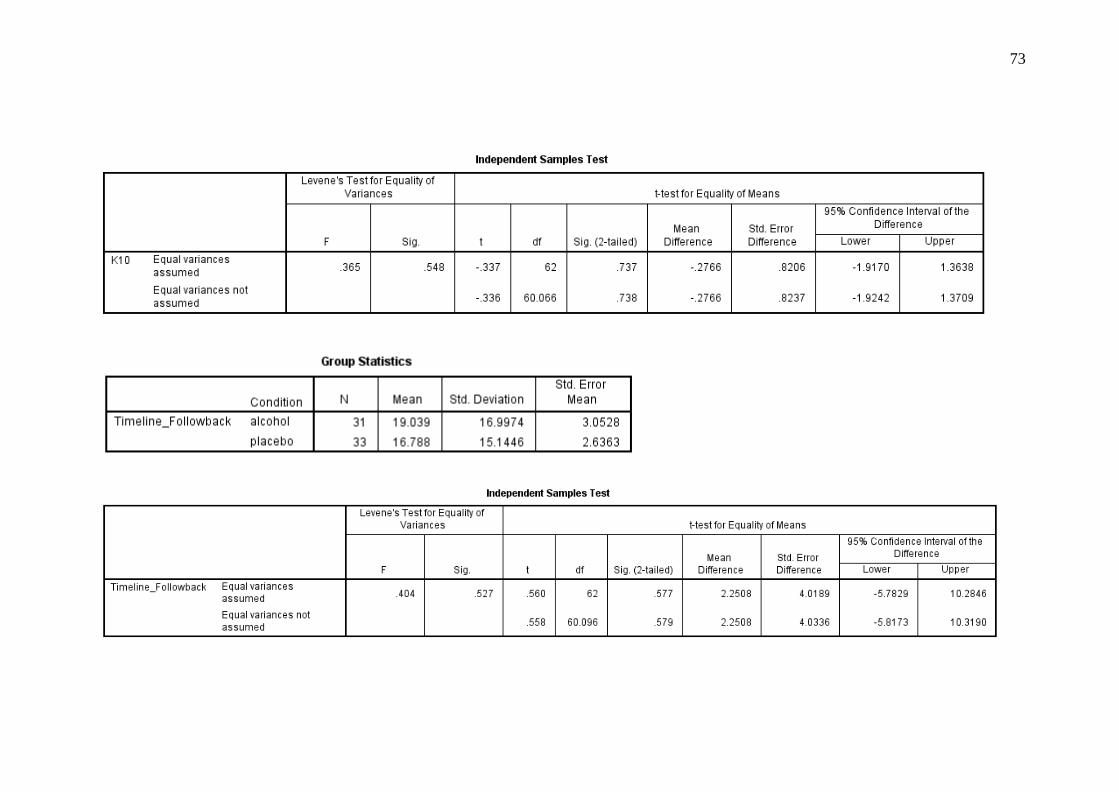
Independent samples t-tests were conducted to ascertain whether there were
differences between conditions on eligibility and baseline assessments. These
analyses indicated no significant differences between conditions on the K10,
AUDIT, TLFB, affect naming, and for the five subscales of the SEQ (see Table 2 for
descriptive and inferential statistics).
Manipulation Checks
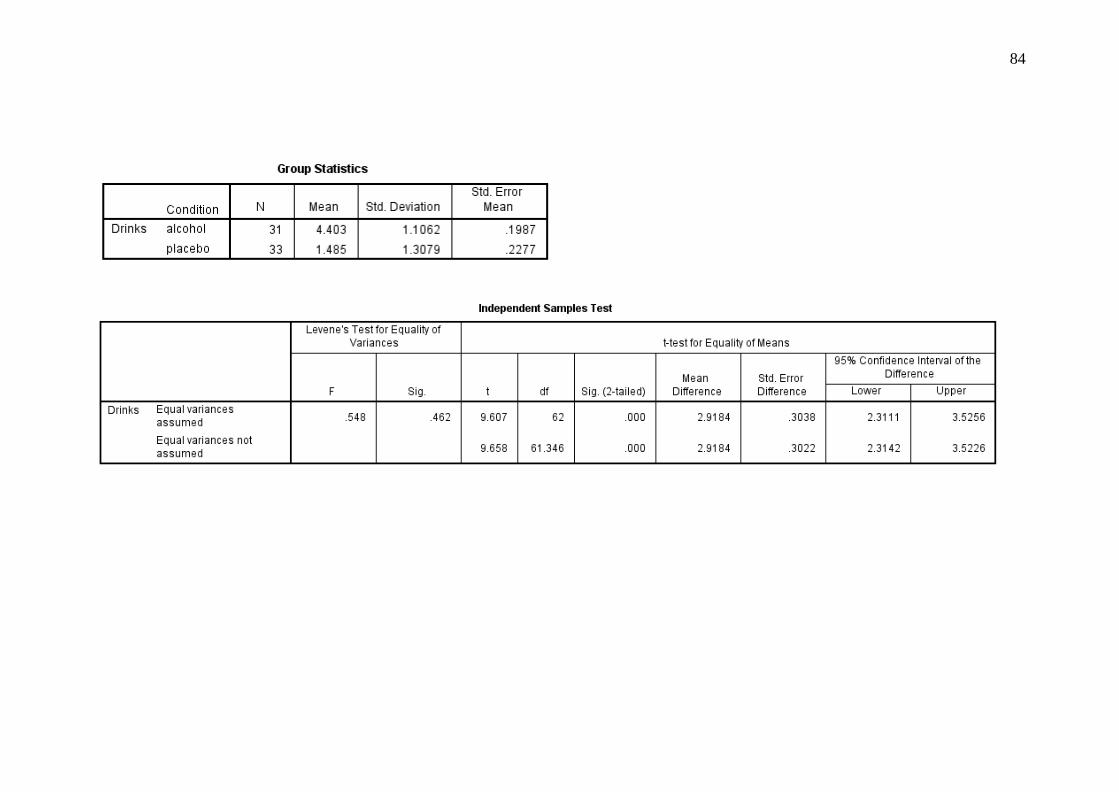
An independent samples t-test was conducted to determine whether there
were differences between conditions in reported levels of perceived intoxication.
This analysis indicated that participants in the alcohol condition (M = 4.40, SD =
1.12) reported consuming a greater number of standard drinks compared to
participants in the placebo condition (M = 1.49, SD = 1.31), t(62) = 9.61, p < .001, d
= 2.39.
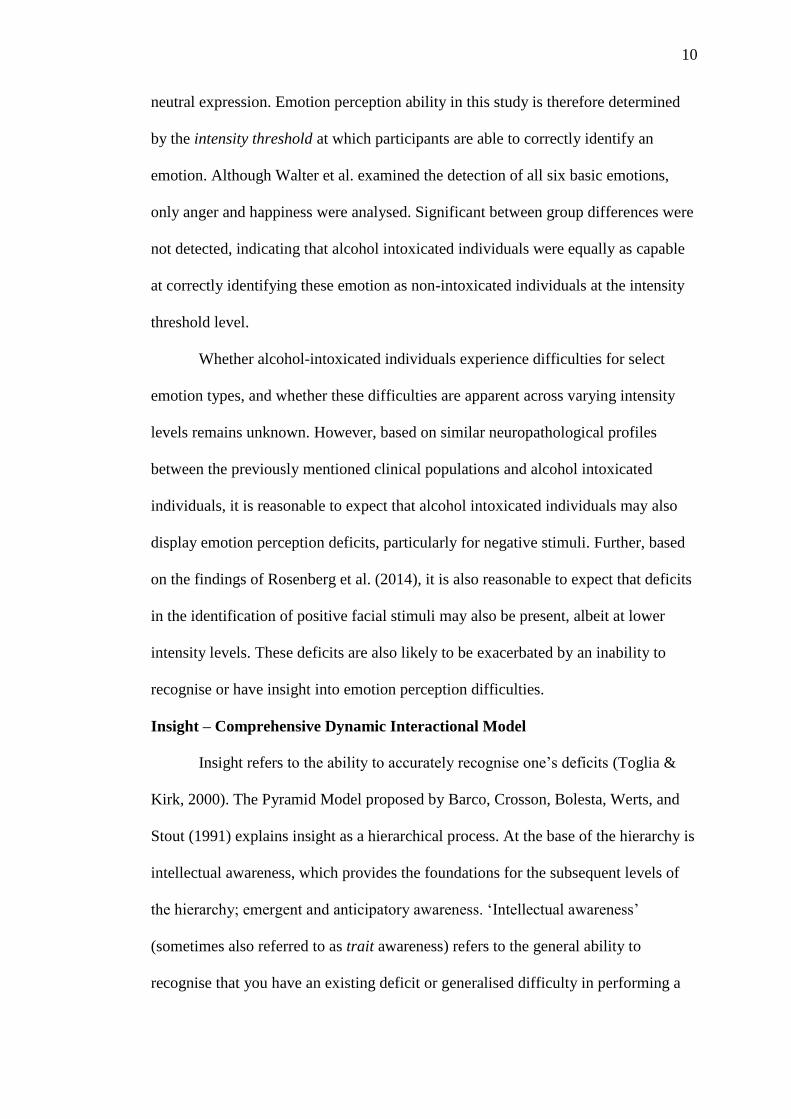
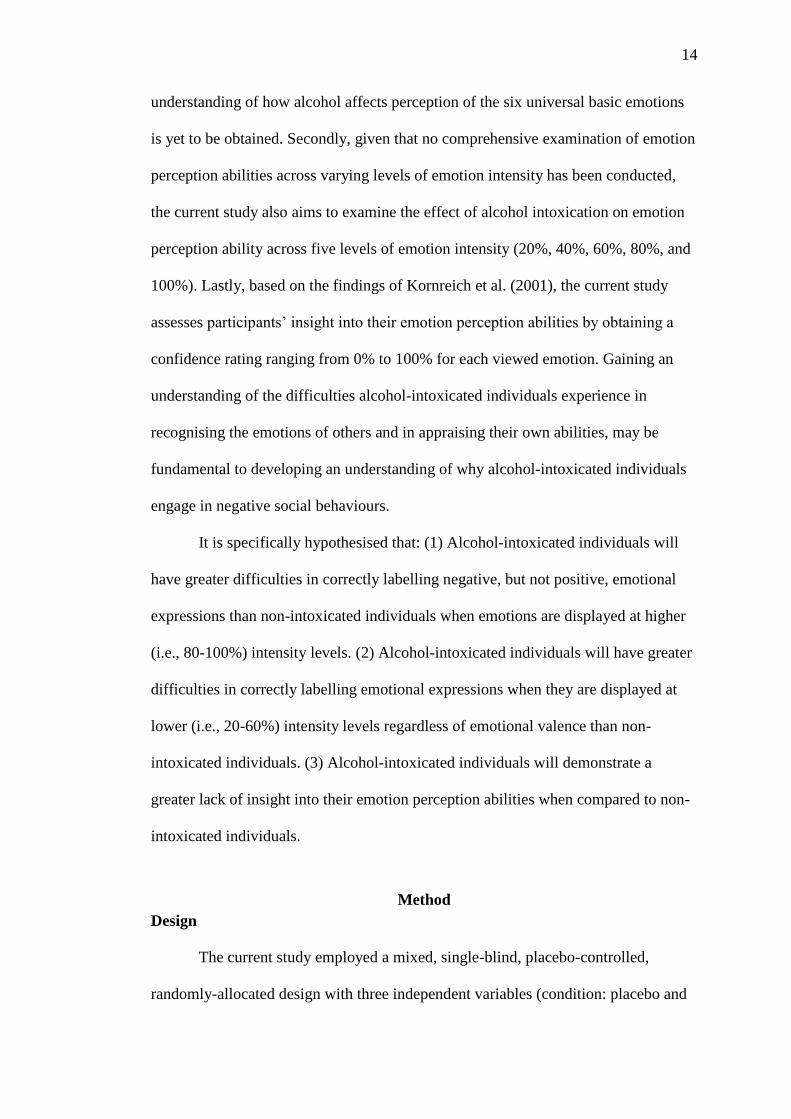
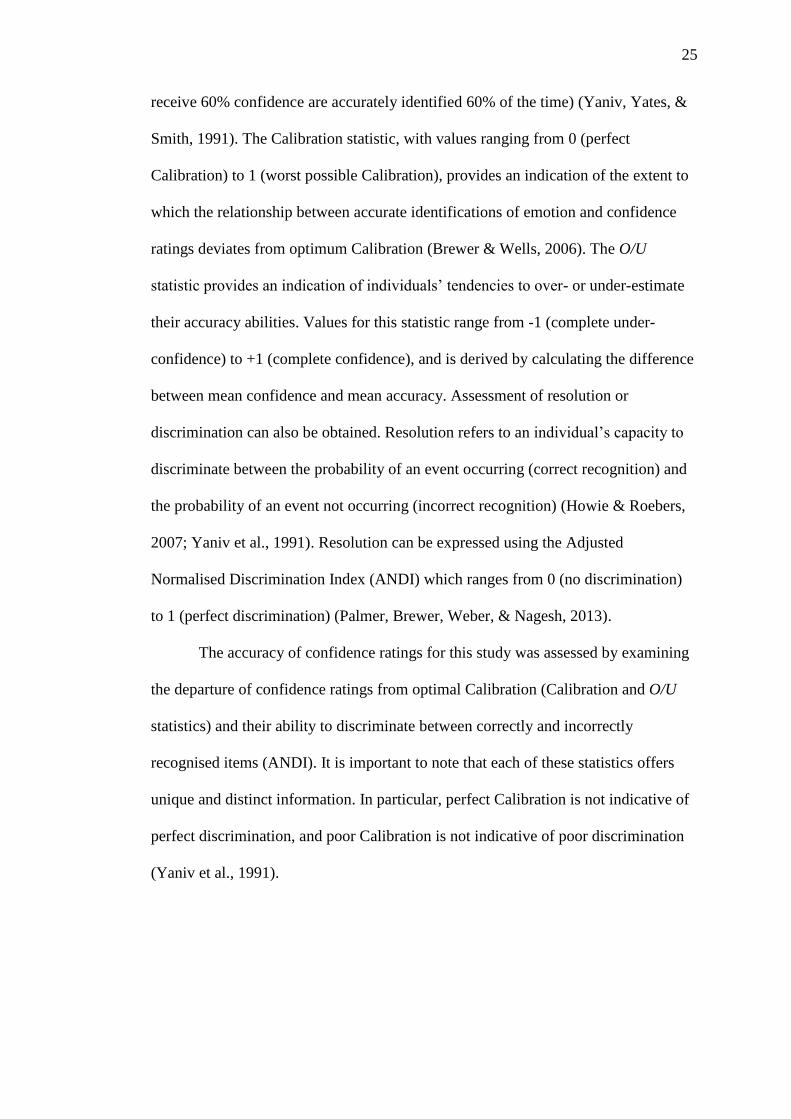
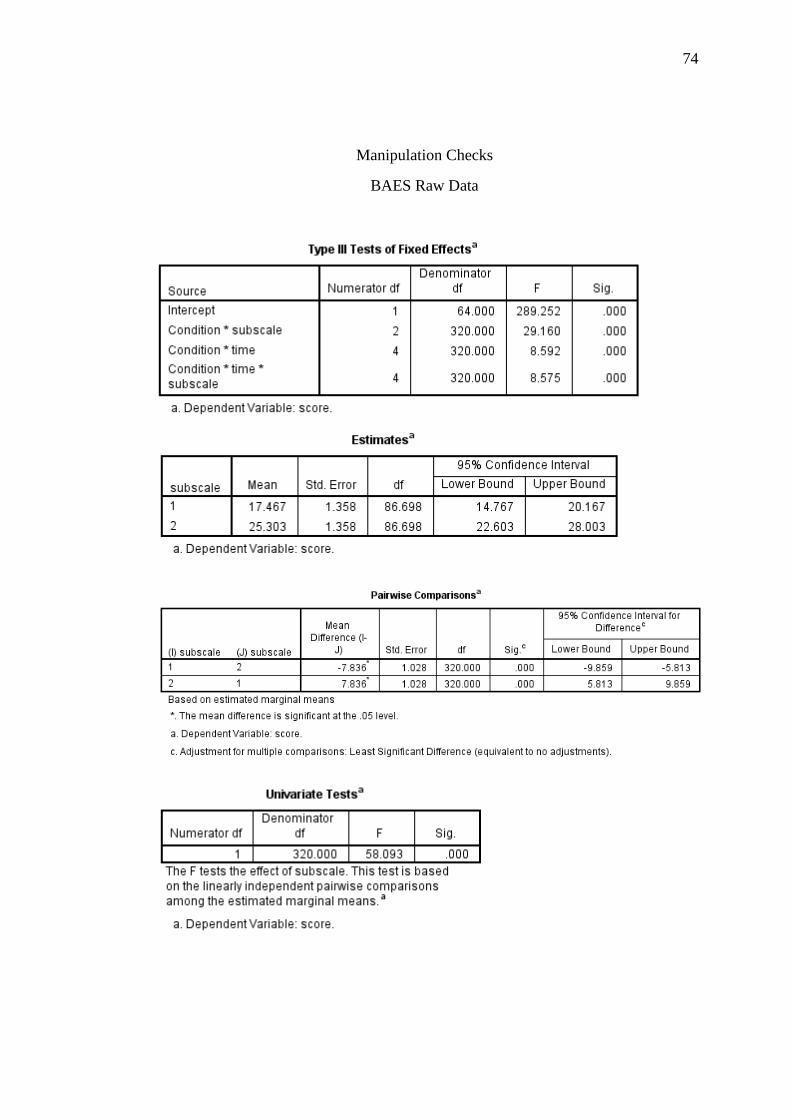
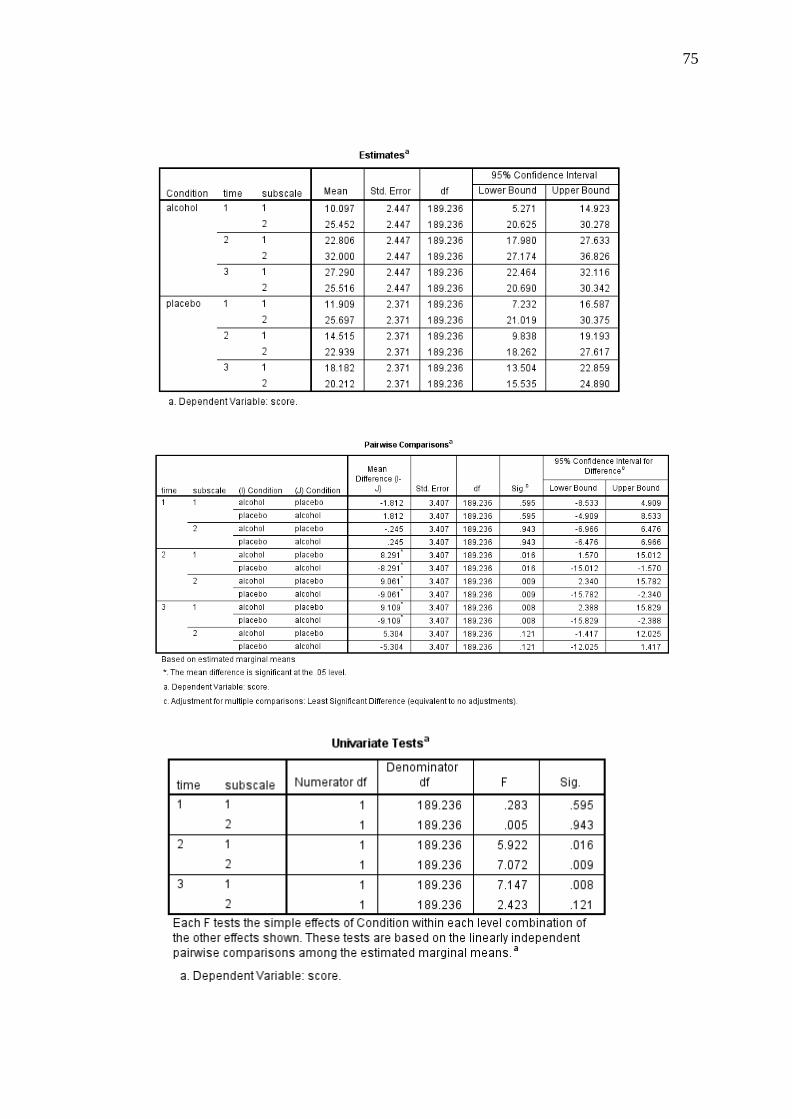
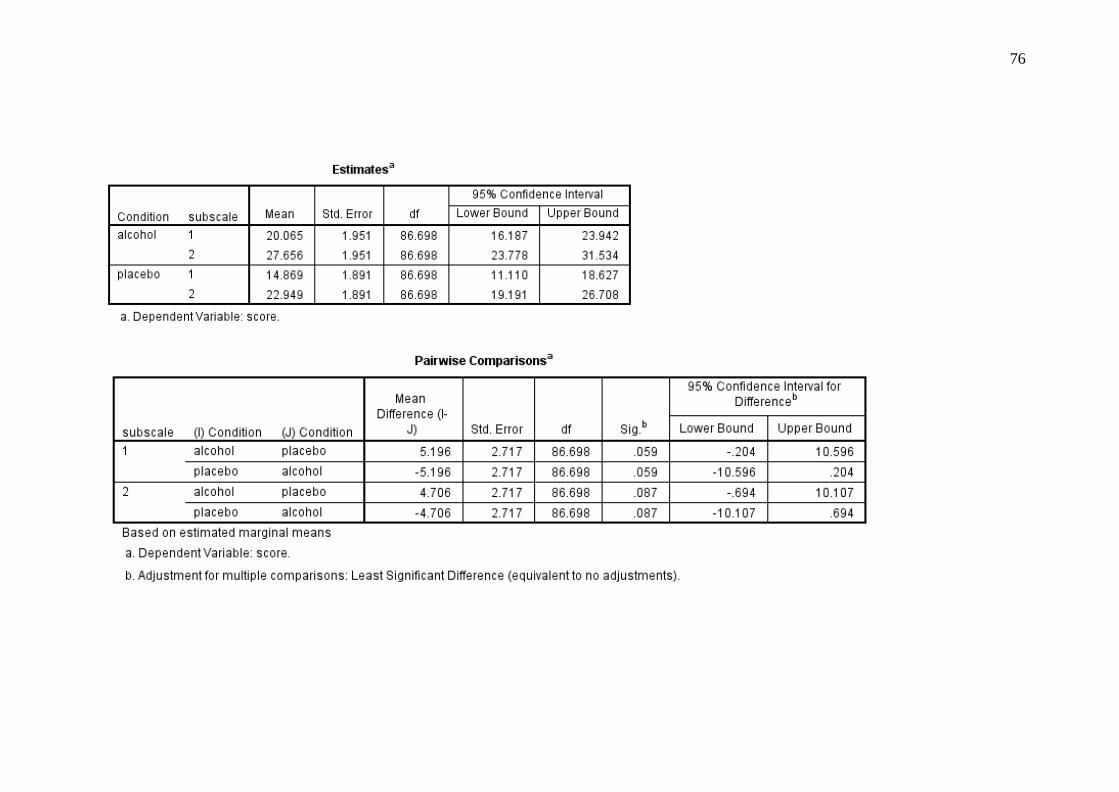
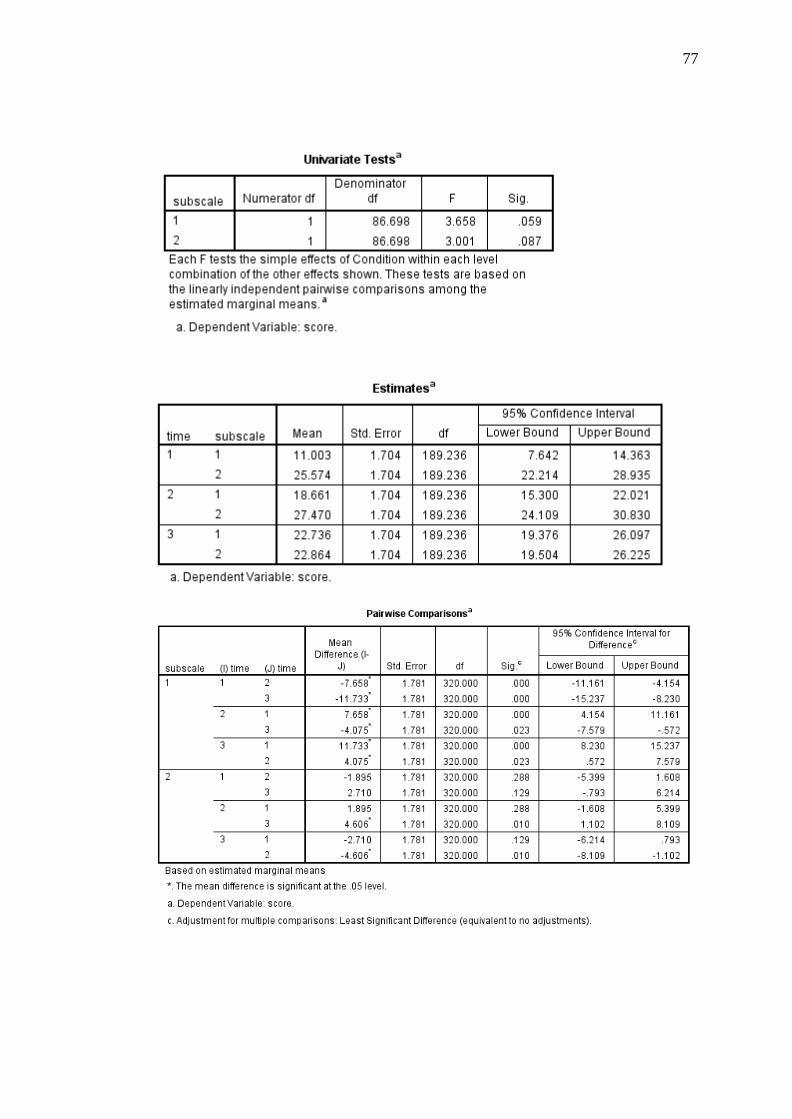
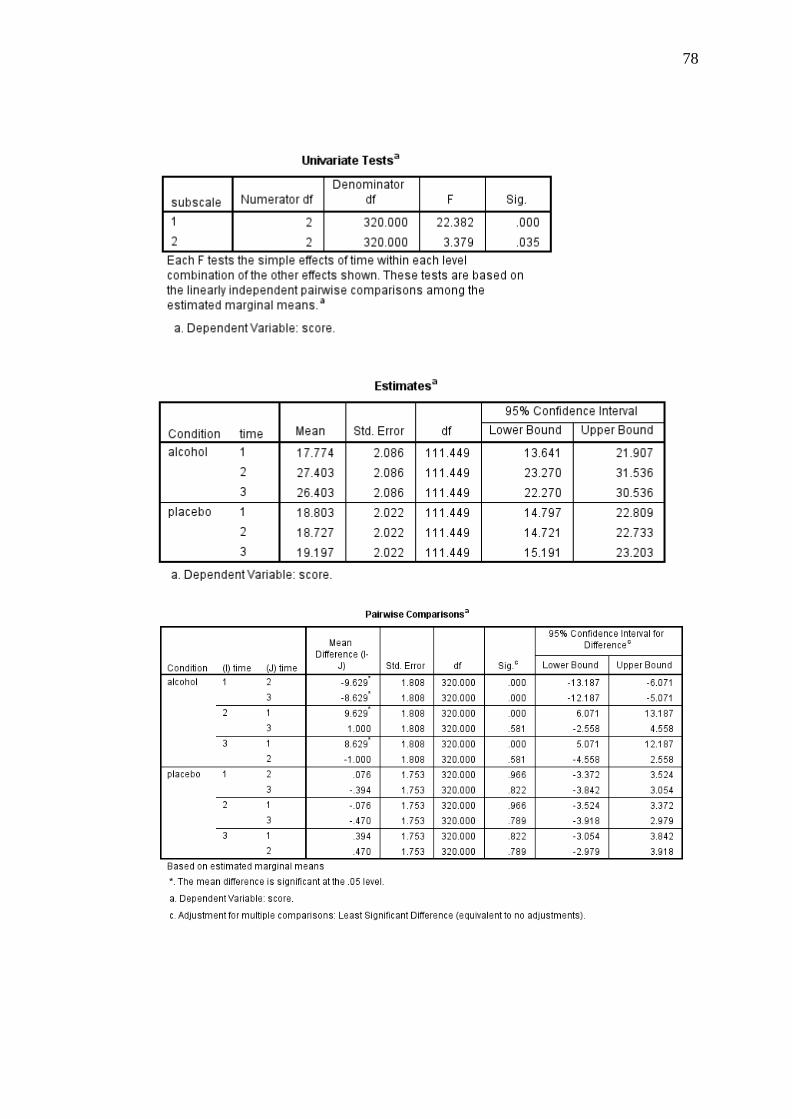
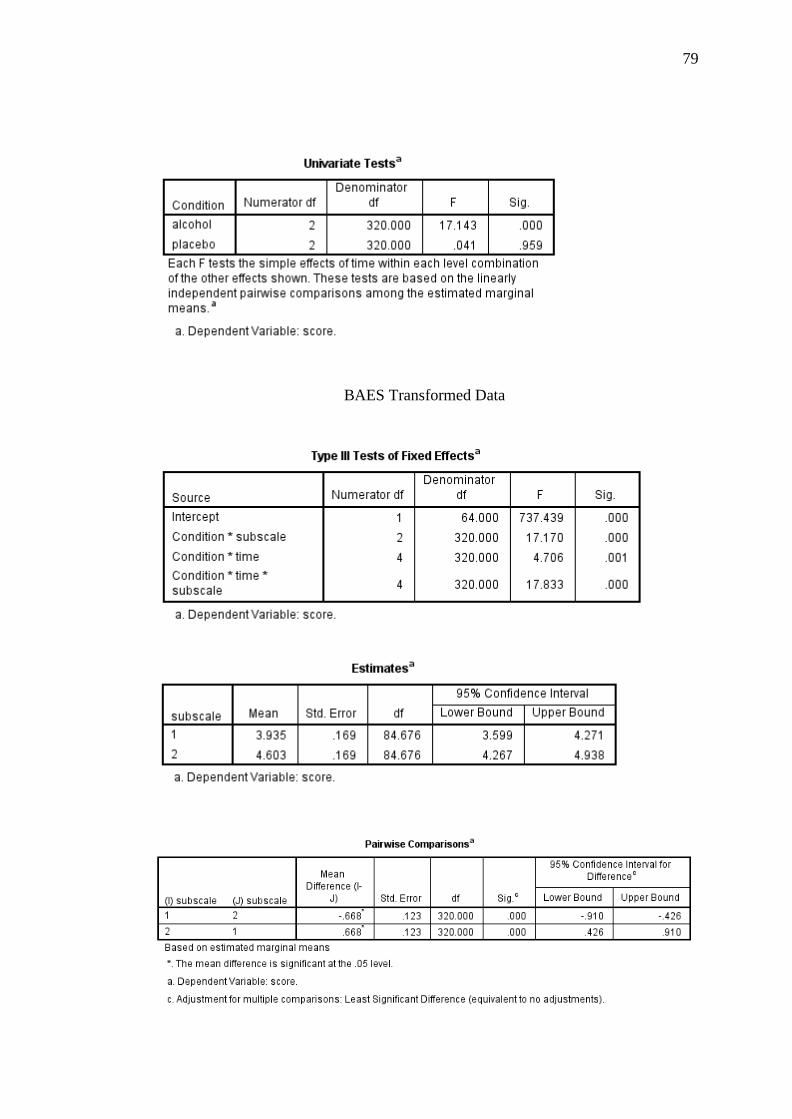
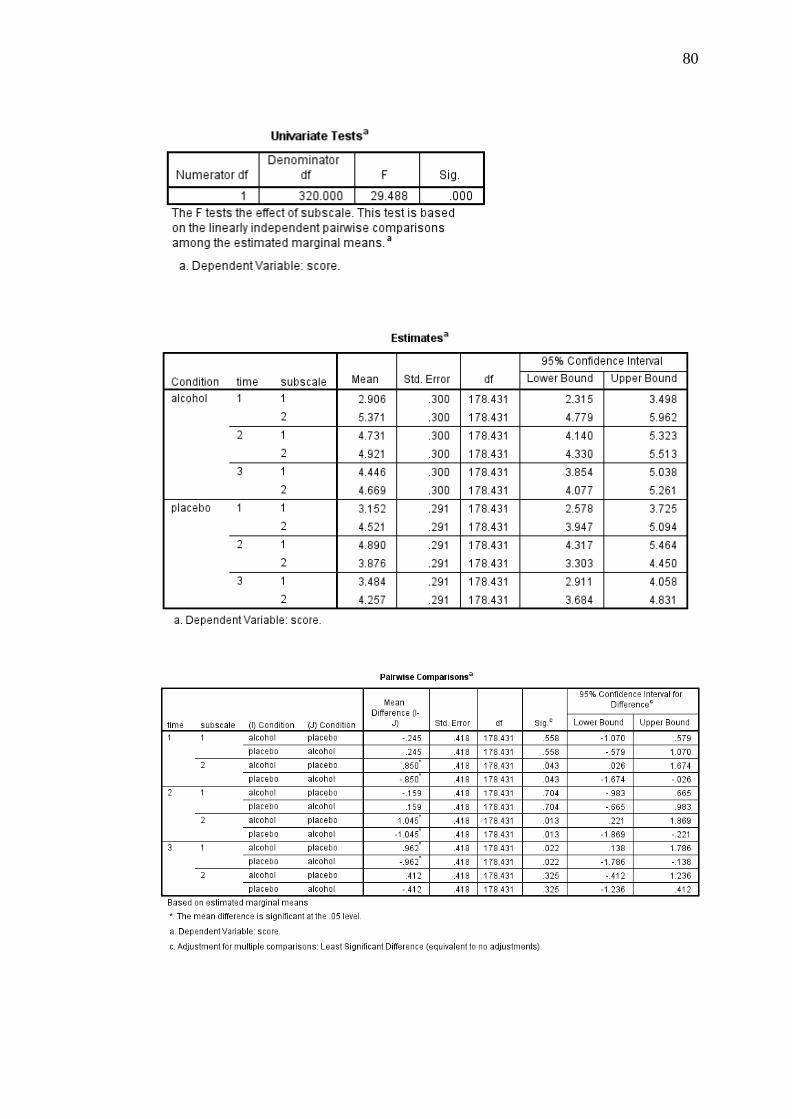
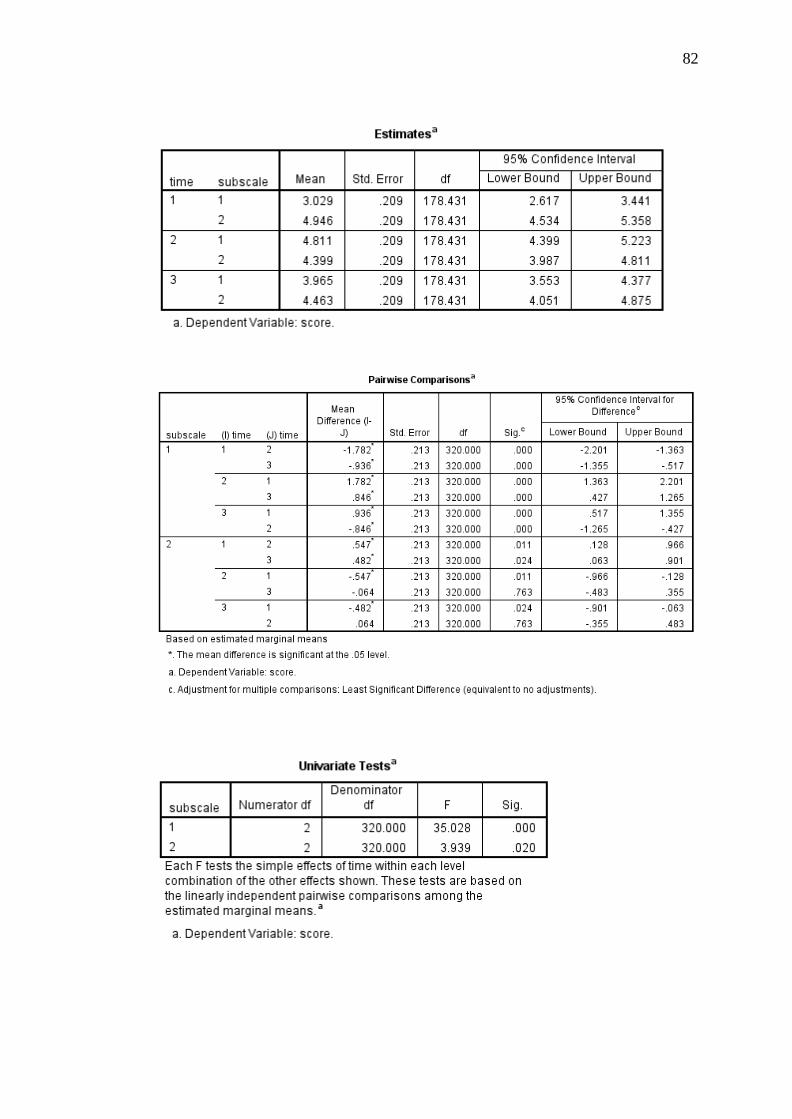
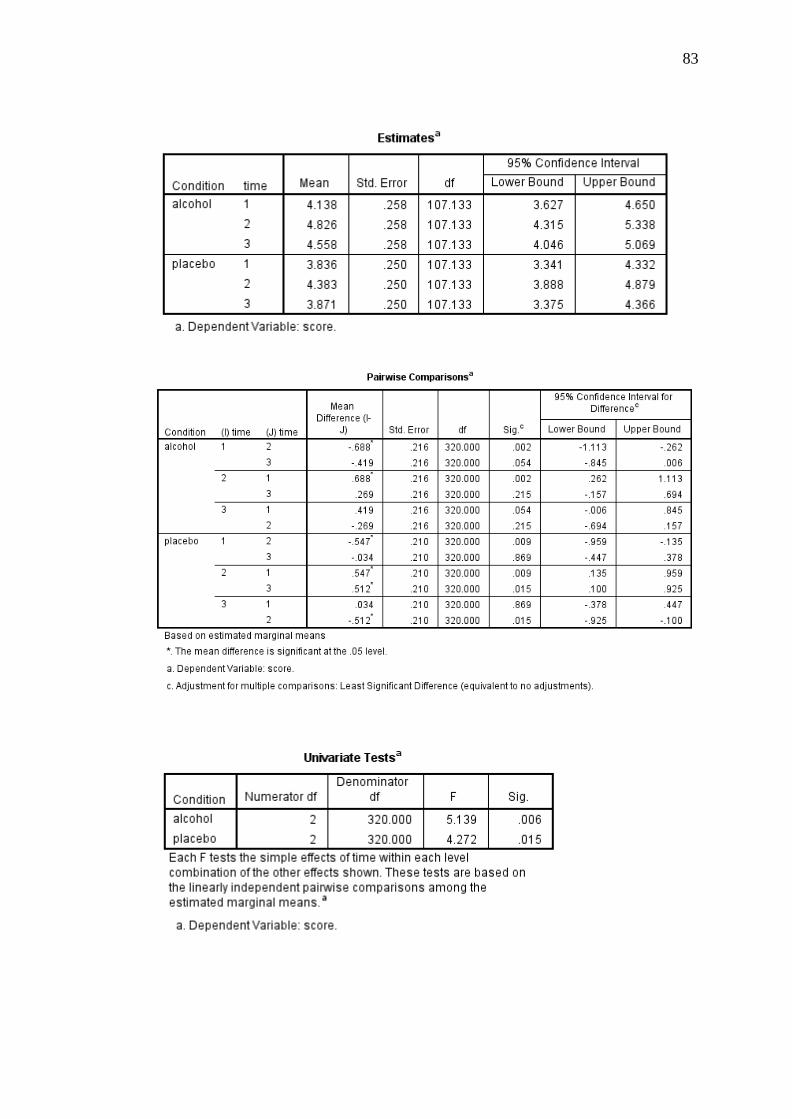
For the BAES, a linear mixed models analysis was conducted to determine
whether reported levels of stimulation and sedation differed between conditions. This
analysis revealed a significant 2 (condition: alcohol and placebo) × 3 (time: baseline,
Time 2, and Time 3) × 2 (subscale: sedative and stimulant) interaction, F(4, 320) =
8.58, p < .001, r = .16. The results of this analysis are diagrammatically represented
in Figure 2. Post-hoc pairwise comparisons indicated no significant differences
between conditions on the sedative, [F(1, 189.24) = .28, p = .595, d = .13], or
stimulant, [F(1, 189.24) = .01, p = .943, d = .02] subscales at baseline. At Time 2,
participants in the alcohol condition reported significantly greater sedation [F(1,
189.24) = 5.92, p = .016, d = .61] and stimulation [F(1, 189.24) = 7.07, p = .009, d =
.67], relative to those in the placebo condition. Finally, at Time 3, participants in the
Page 36
27
alcohol condition reported significantly greater sedation than participants in the
placebo condition [F(1, 189.24) = 7.15, p = .008, d = .67], however, there were no
differences detected between conditions in reported stimulation [F(1, 189.24) = 2.42,
p = .121, d = .39].
Figure 2. Means and standard errors representing sedative and stimulant effects of
alcohol at three time points for alcohol-intoxicated and placebo conditions.
0
5
10
15
20
25
30
35
40
Sedative Stimulant Sedative Stimulant Sedative Stimulant
Baseline Time Two Time Three
Mea
n S
core
Biphasic Alcohol Effects Scale
Alcohol Placebo
Page 37
28
Table 2
Descriptive and Inferential Statistics for Eligibility and Baseline Assessments
Note. K10 = Kessler Psychological Distress Scale; AUDIT = Alcohol Use Disorders Identification Test; TLFB = Timeline Followback; ACS =
Advanced Clinical Solutions; SEQ = Social Emotional Questionnaire; CI = confidence interval; LL = lower limit, UL = upper limit.
Alcohol Placebo
95% CI 95% CI
M (SD) LL UL M (SD) LL UL t(62) p Cohen’s d
K10 13.94 (3.47) 12.66 15.21 14.21 (3.09) 13.12 15.31 -0.34 .737 .08
AUDIT 6.65 (3.62) 5.32 7.97 5.70 (3.20) 4.56 6.83 1.11 .270 .28
TLFB 19.04 (17.0) 12.80 25.27 16.79 (15.14) 11.42 22.16 0.56 .577 .14
ACS Affect Naming 18.39 (2.29) 17.55 19.23 18.27 (2.30) 17.46 19.09 0.20 .843 .05
SEQ
Emotion Recognition 21.32 (2.47) 20.42 22.23 21.03 (2.57) 20.12 21.94 .46 .644 .12
Empathy 19.07 (3.15) 17.91 20.22 19.91 (2.38) 19.07 20.75 -1.22 .229 .30
Social Conformity 12.68 (1.30) 12.20 13.16 12.55 (1.50) 12.01 13.08 .38 .709 .09
Antisocial Behaviour 12.16 (2.12) 11.39 12.94 12.58 (1.58) 12.02 13.14 -.89 .376 .23
Sociability 22.42 (4.63) 20.72 24.12 23.52 (2.32) 22.69 24.34 -1.21 .232 .30
Page 38
29
BrAC Readings
Immediately prior to completing the ERT, participants in the alcohol
condition recorded a mean BrAC of .077 (SD = .02). A one-samples t-test indicated
that this value was significantly different from zero, t(30) = 22.52, p < .001, 95% CI
[.07, .08].
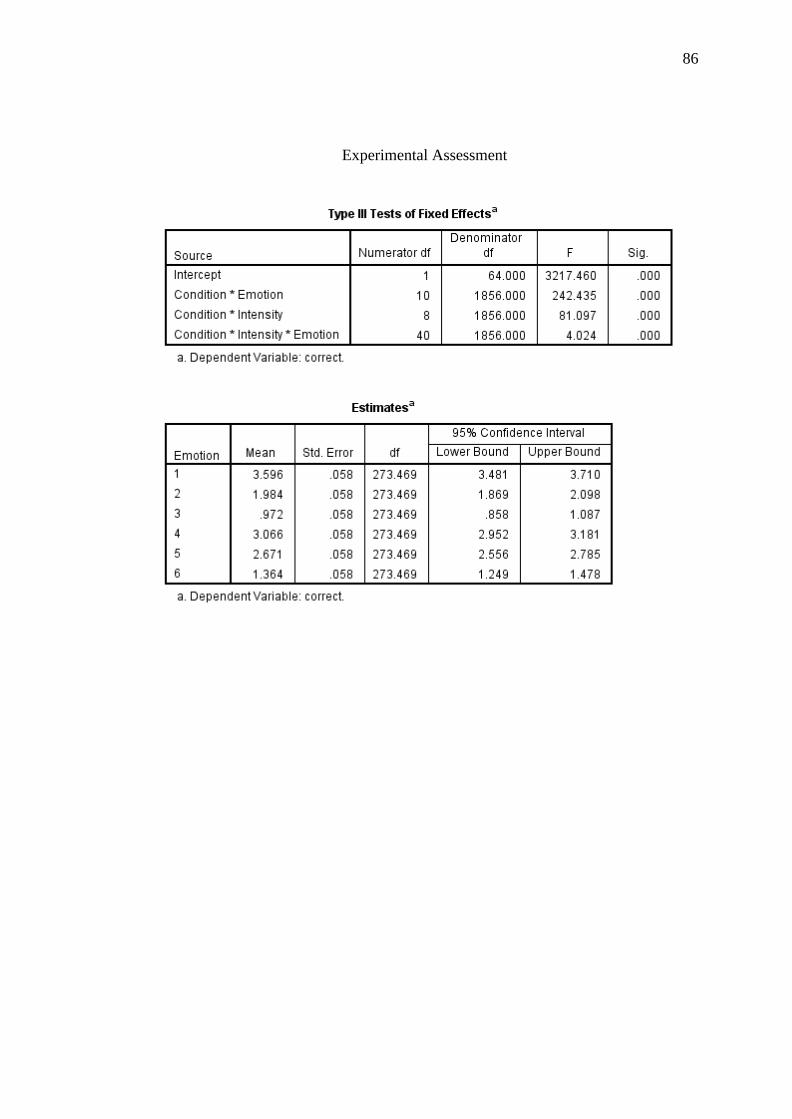
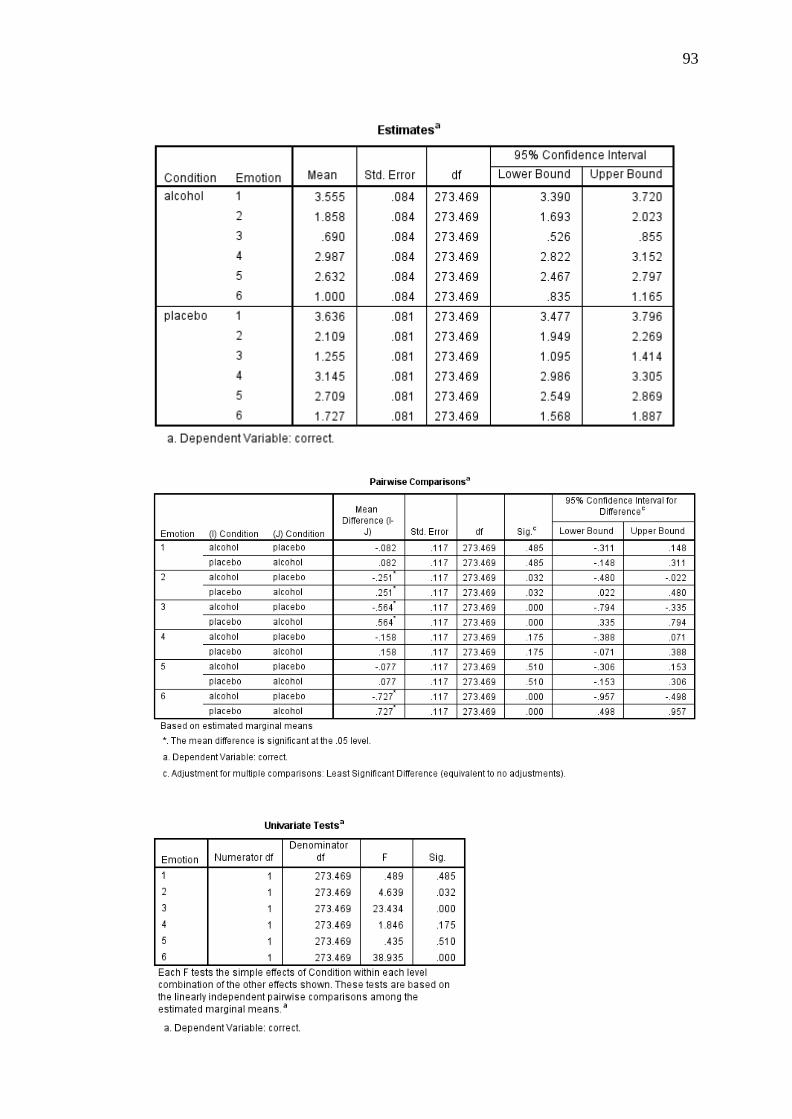
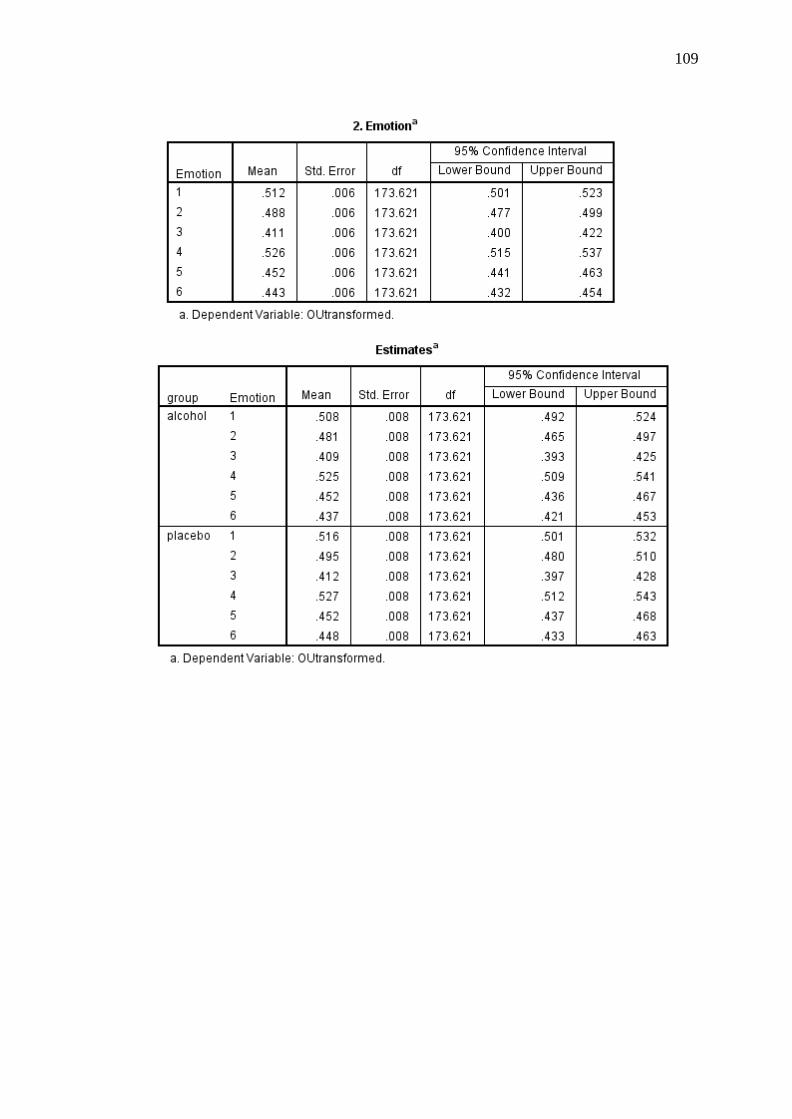
ERT Performance
A 2 (condition: alcohol and placebo) × 6 (emotion: happy, surprise, fear,
anger, disgust, and sadness) × 5 (intensity: 20%, 40%, 60%, 80%, and 100%) linear
mixed models analysis was conducted to determine whether emotion perception
abilities differed between conditions and whether these abilities differed across
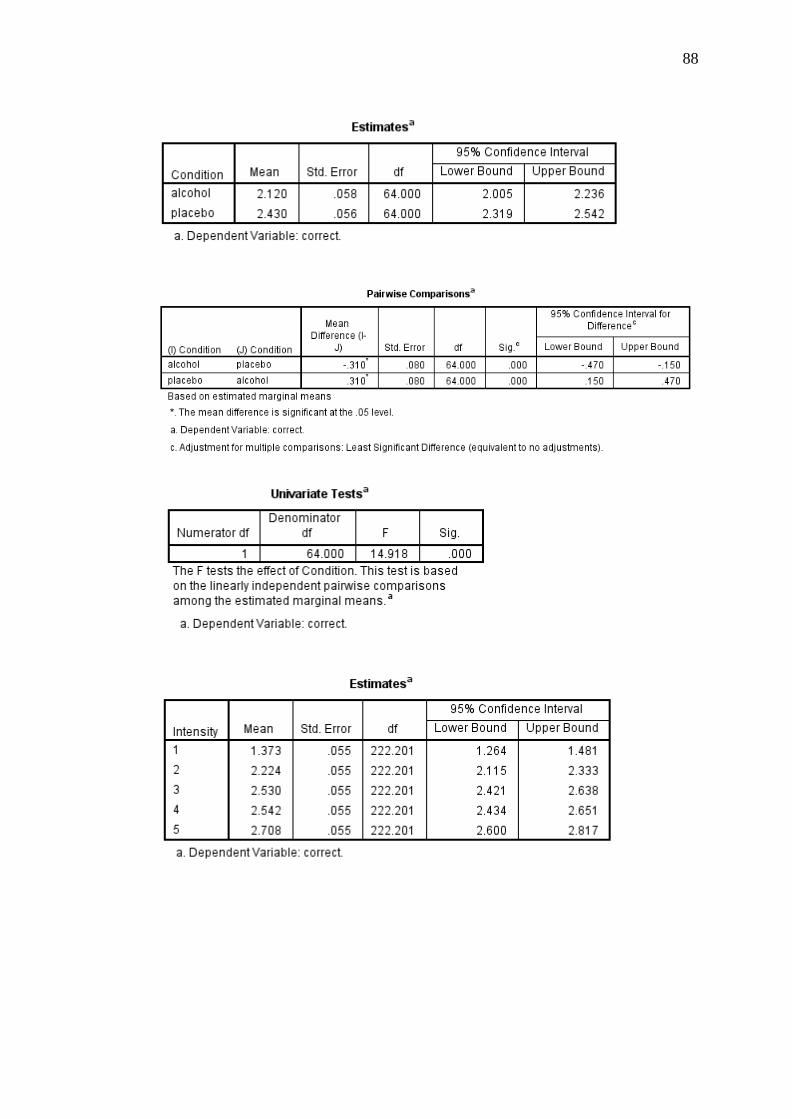
emotions and expression intensity. This analysis indicated a significant main effect
of condition, with emotion perception abilities being significantly poorer among
participants in the alcohol condition compared to participants in the placebo
condition [F(1, 64) = 14.92, p < .001, r = .43]. There was also a significant main
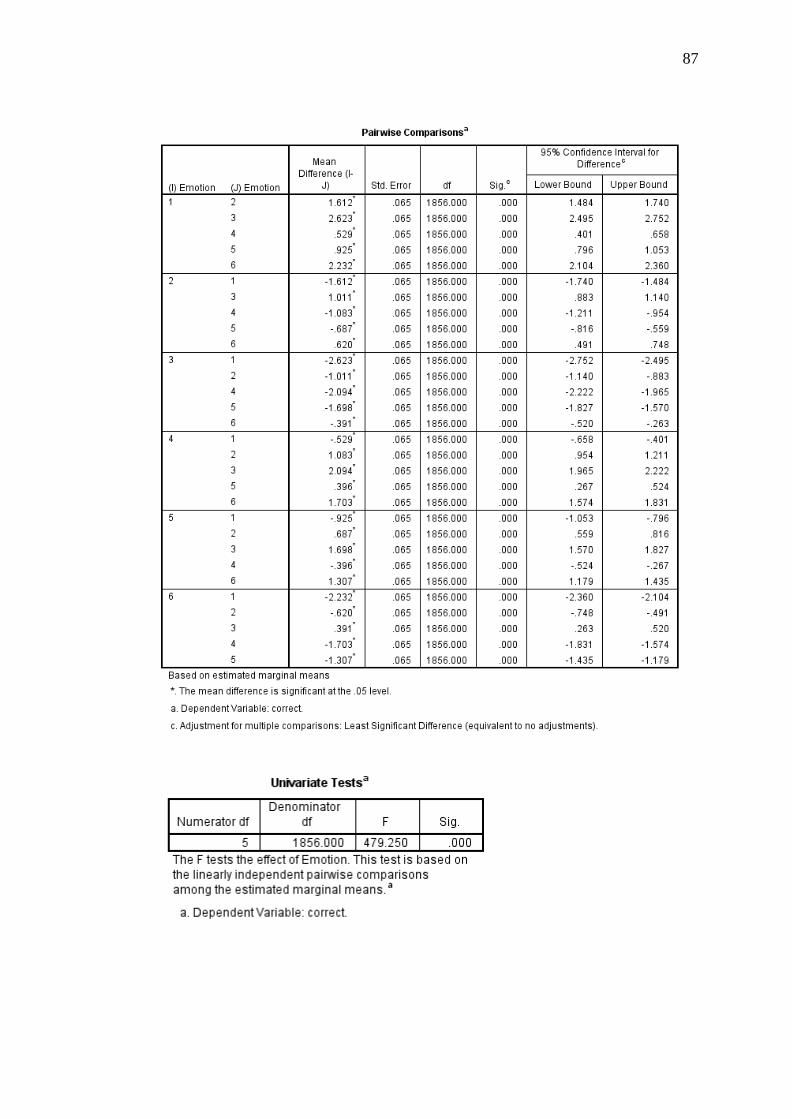
effect of emotion [F(5, 1856) = 479.25, p < .001, r = .45]. Post-hoc pairwise
comparisons indicated that, among all participants, emotion perception performance
significantly differed for all emotions (p < .001). The most accurately identified
emotion was happiness (M = 3.60, SD = .46) followed by anger (M = 3.07, SD = .46),
disgust (M = 2.67, SD = .46), surprise (M = 1.98, SD = .46), sadness (M = 1.36, SD =
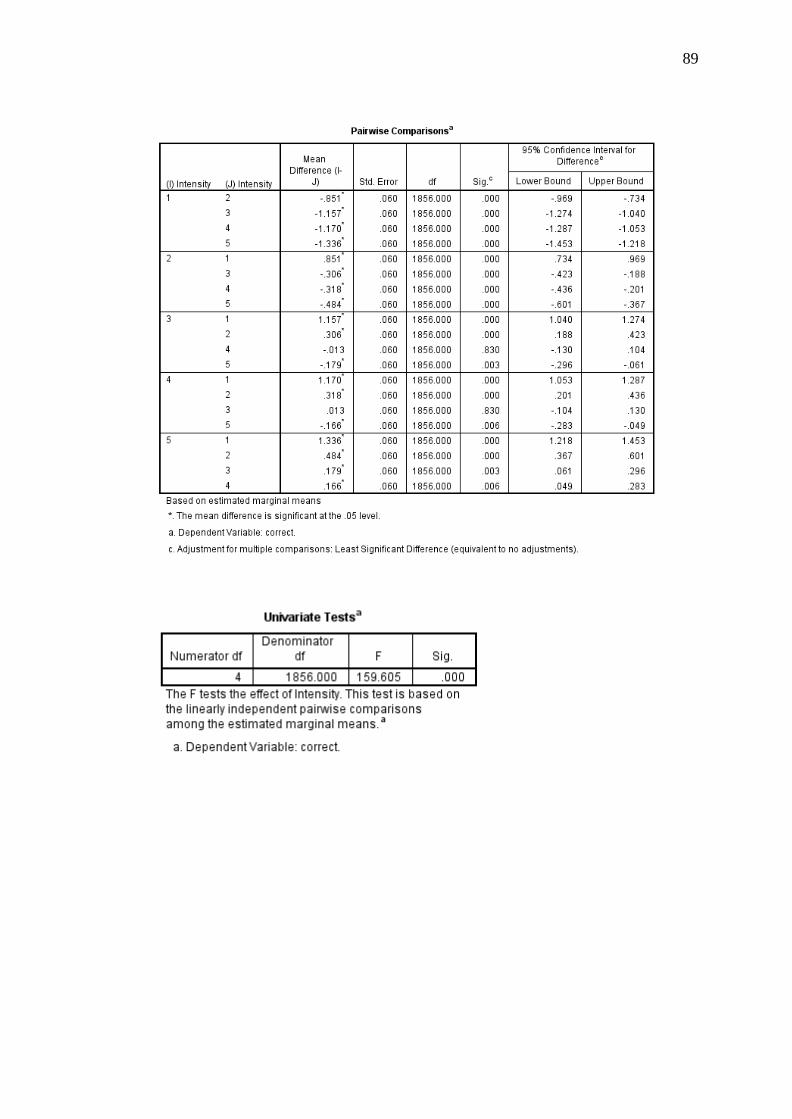
.46), and fear (M = .97, SD = .46). Finally, there was a significant main effect of
intensity, [F(4, 1856) = 159.61, p < .001, r = .28]. Post-hoc pairwise comparisons
indicated that emotion perception performance significantly differed at all intensity
levels at (p < .001), except for at 60% and 80% intensity (p = .830), where
performance was similar. Identification performance was most accurate for
Page 39
30
expressions that were presented at 100% intensity (M = 2.71, SD = .44), followed by
80% intensity (M = 2.54, SD = .44) and 60% intensity (M = 2.53, SD = .44), 40%
intensity (M = 2.22, SD = .44), and 20% intensity (M = 1.37, SD = .44).
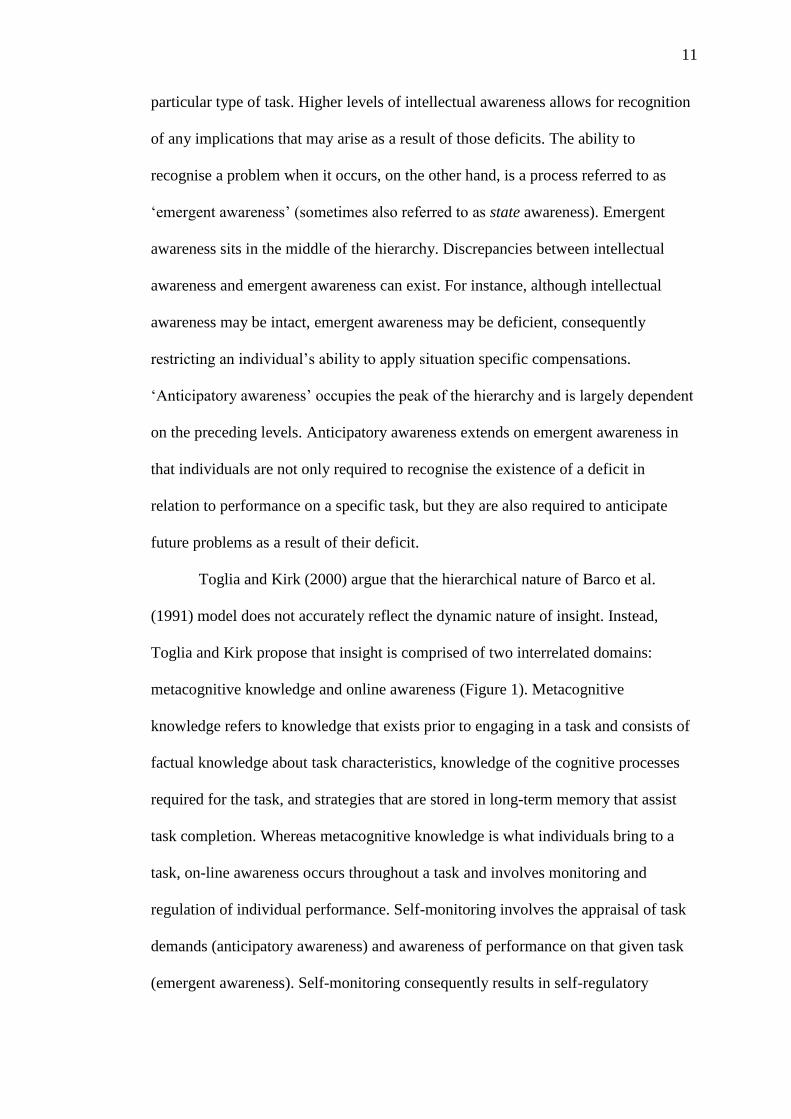
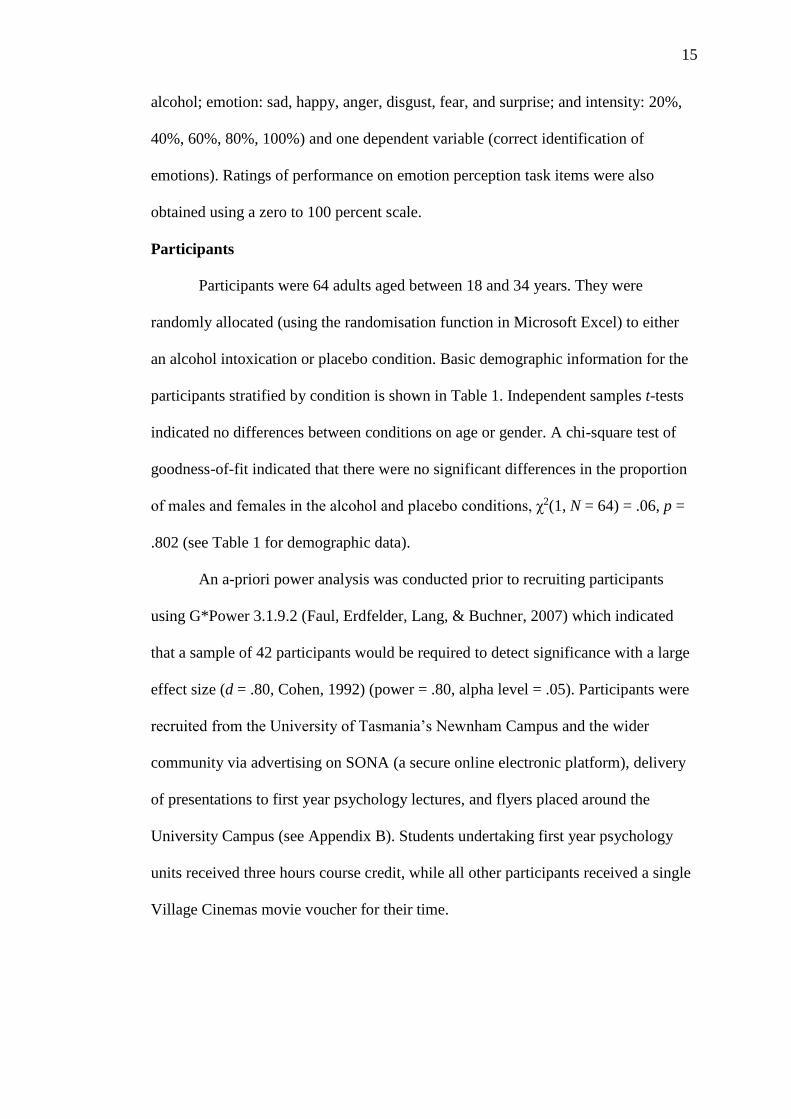
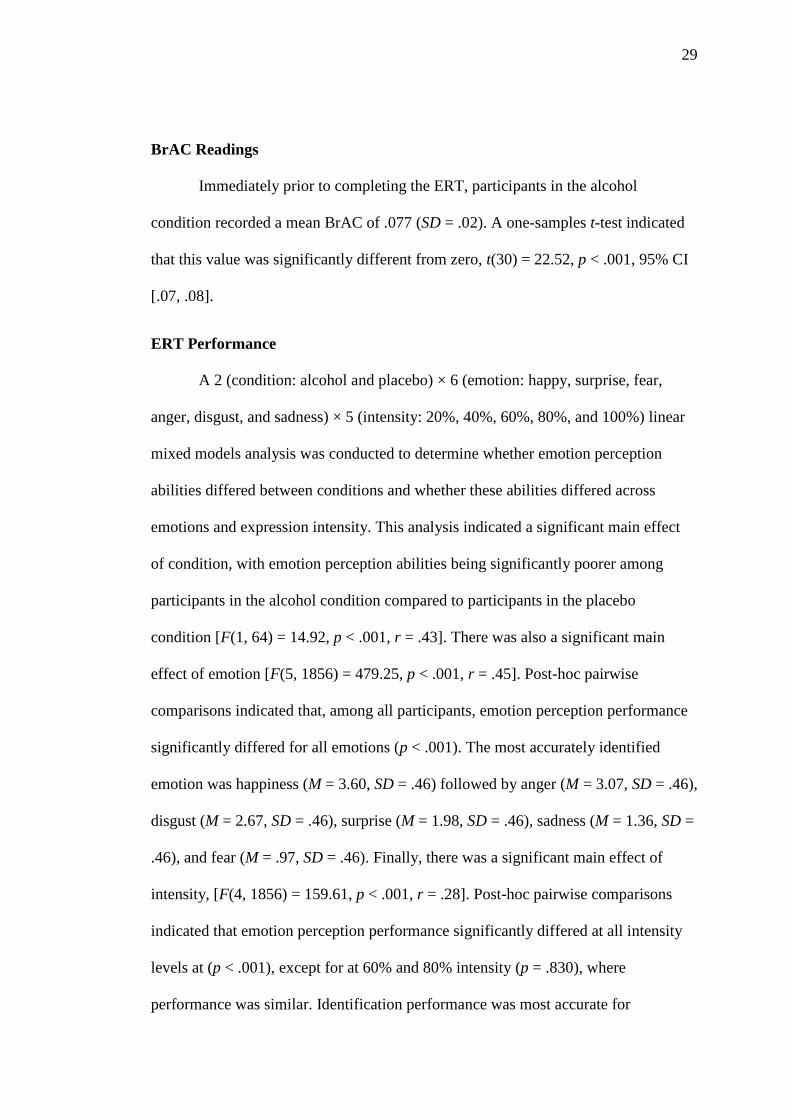
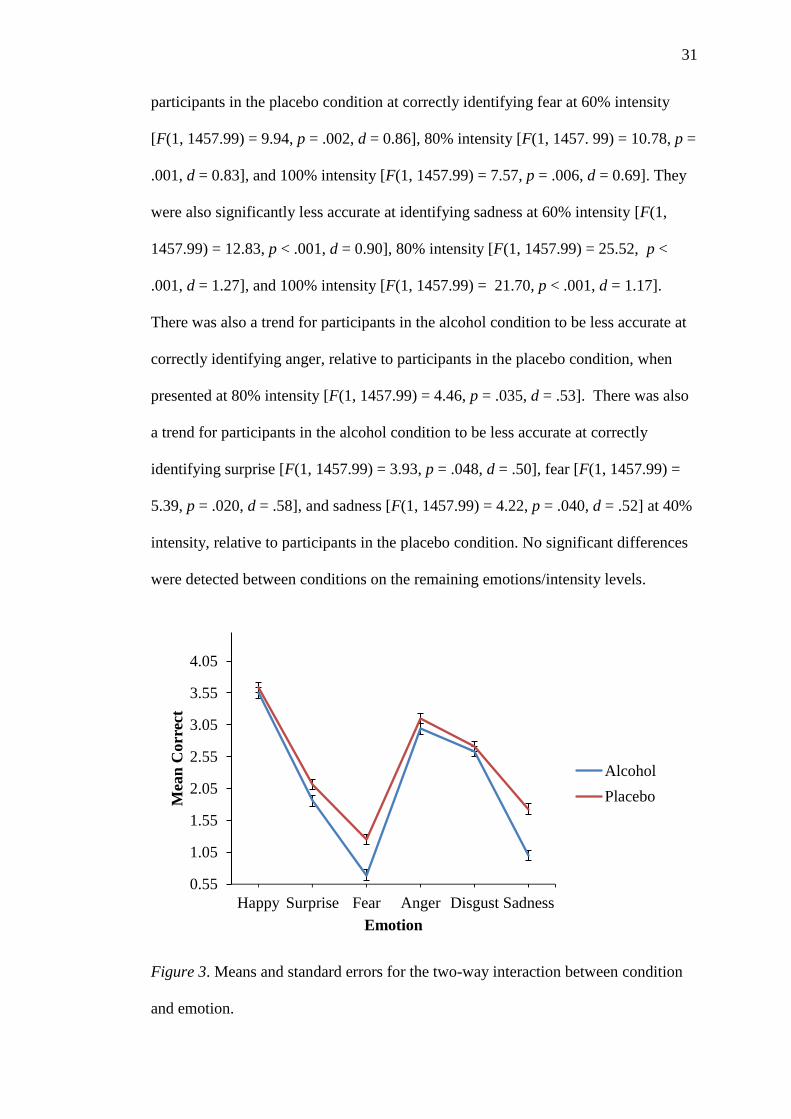
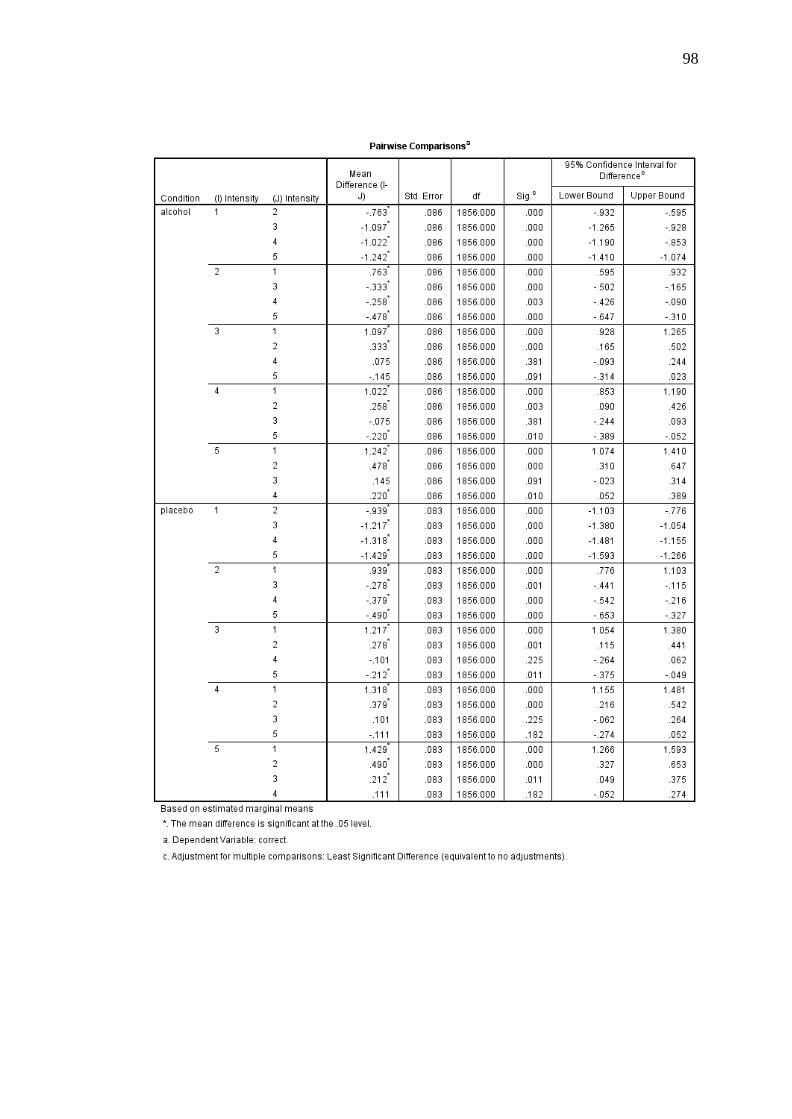
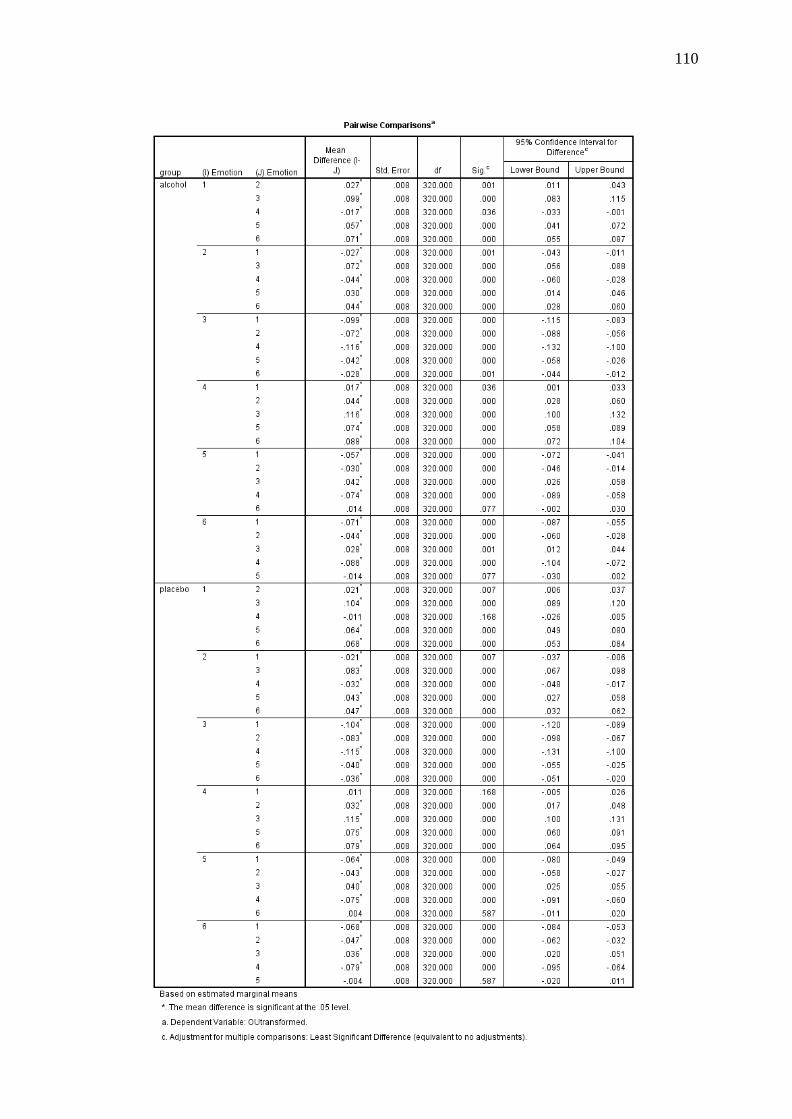
The linear mixed models analysis also revealed a significant two-way
interaction between condition and emotion [F(10, 1856) = 242.44, p < .001, r = .34].
Post-hoc pairwise comparisons indicated that participants in the alcohol condition
were significantly less accurate at correctly identifying fear and sadness relative to
participants in the placebo condition. There was also a trend for participants in the
alcohol condition to be less accurate at correctly identifying surprise (p = .032) (see
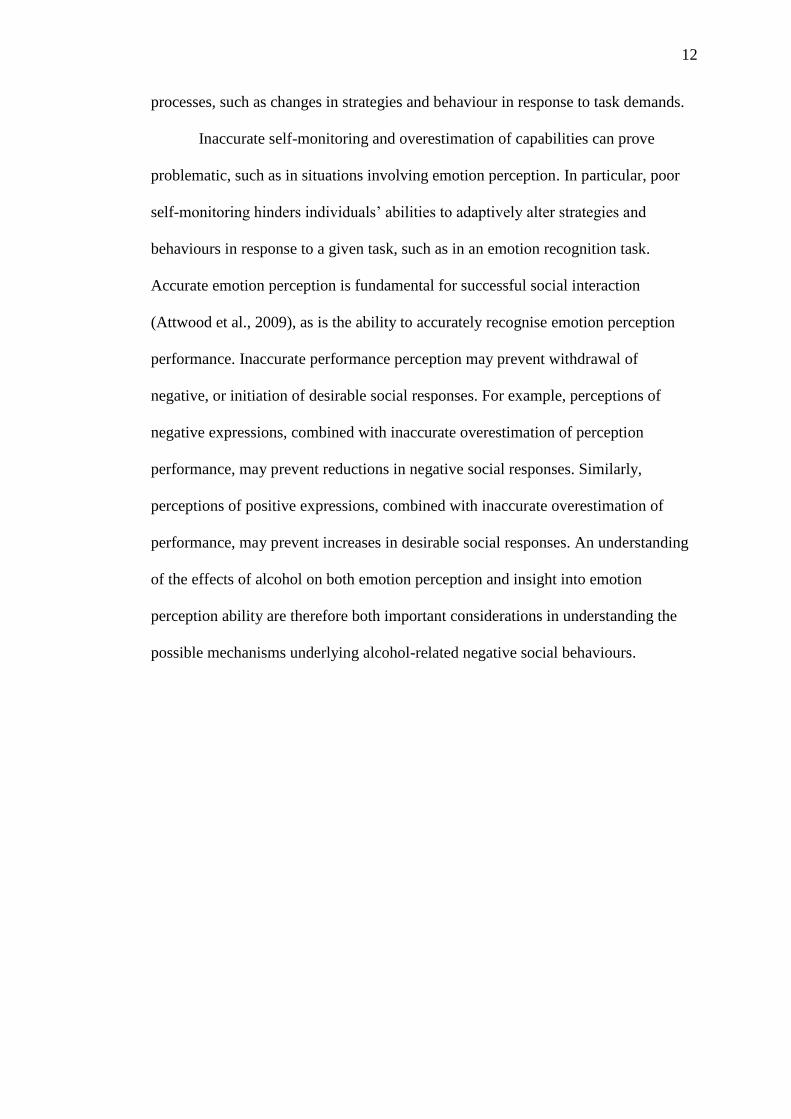
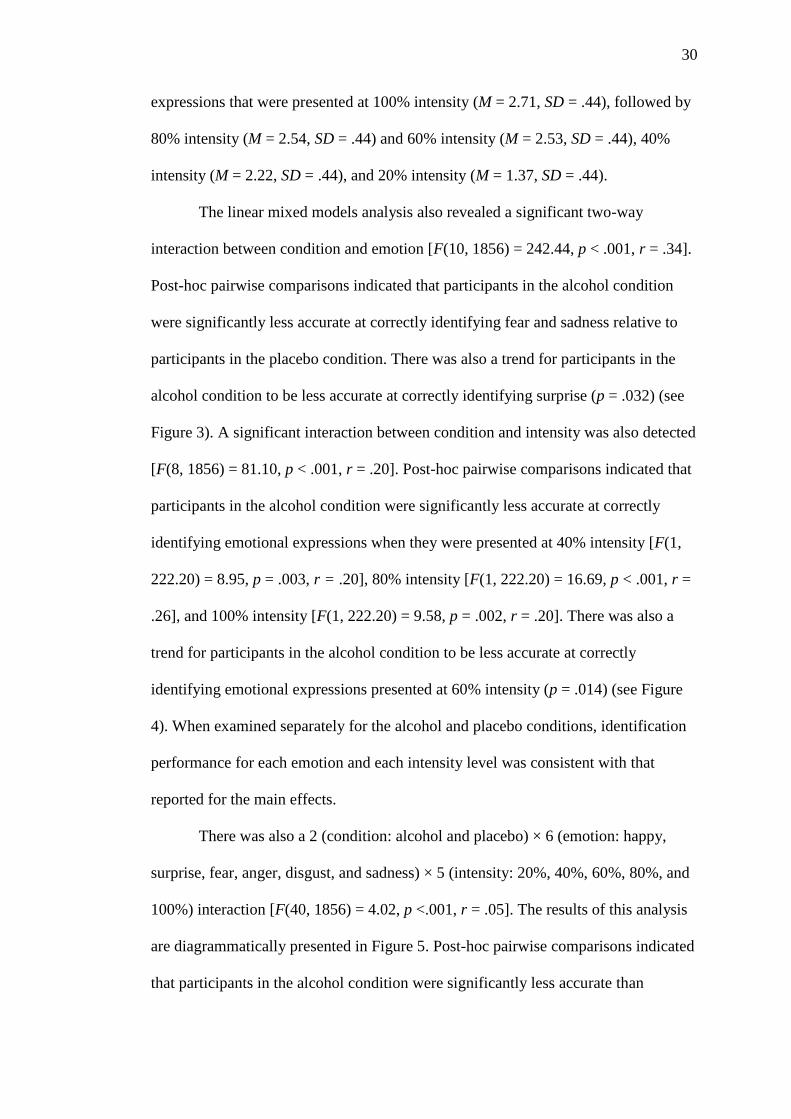
Figure 3). A significant interaction between condition and intensity was also detected
[F(8, 1856) = 81.10, p < .001, r = .20]. Post-hoc pairwise comparisons indicated that
participants in the alcohol condition were significantly less accurate at correctly
identifying emotional expressions when they were presented at 40% intensity [F(1,
222.20) = 8.95, p = .003, r = .20], 80% intensity [F(1, 222.20) = 16.69, p < .001, r =
.26], and 100% intensity [F(1, 222.20) = 9.58, p = .002, r = .20]. There was also a
trend for participants in the alcohol condition to be less accurate at correctly
identifying emotional expressions presented at 60% intensity (p = .014) (see Figure
4). When examined separately for the alcohol and placebo conditions, identification
performance for each emotion and each intensity level was consistent with that
reported for the main effects.
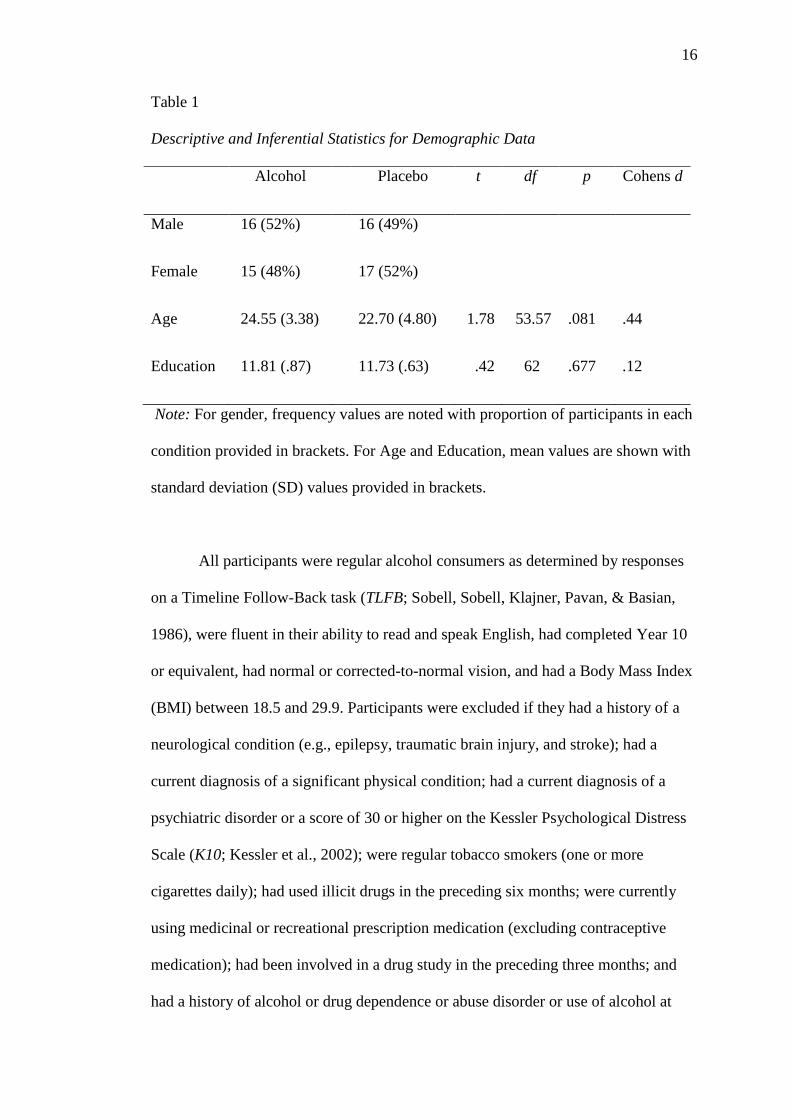
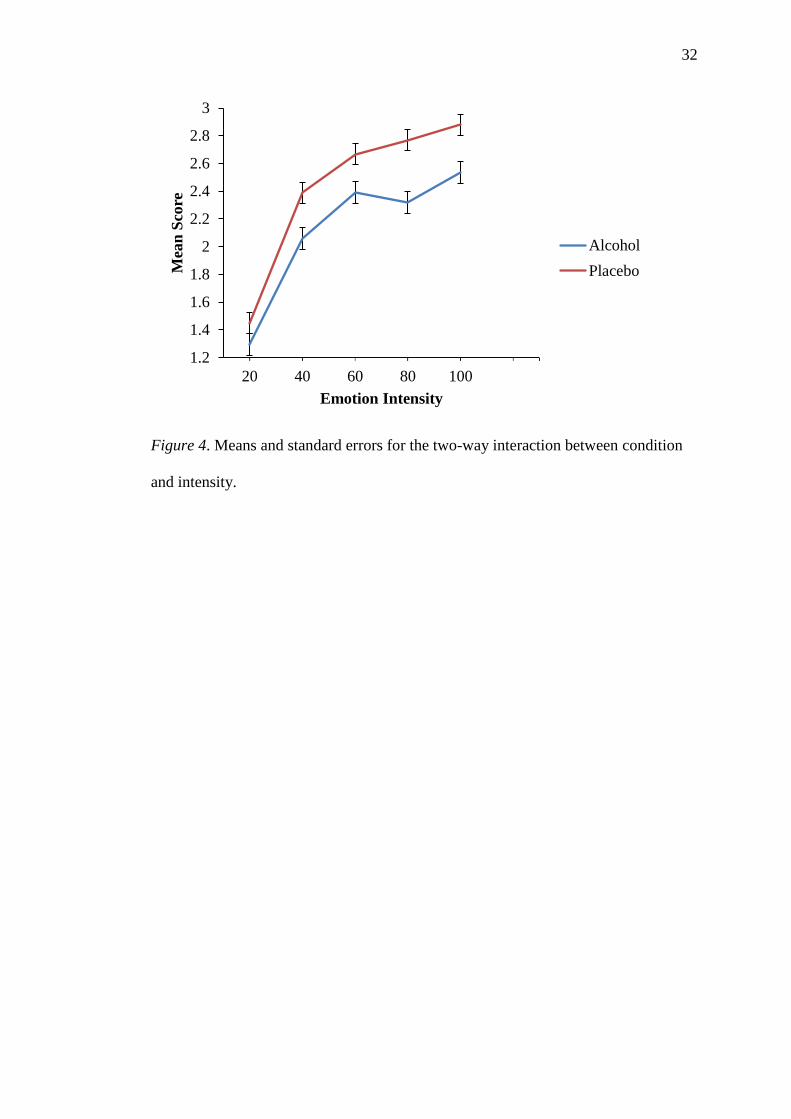
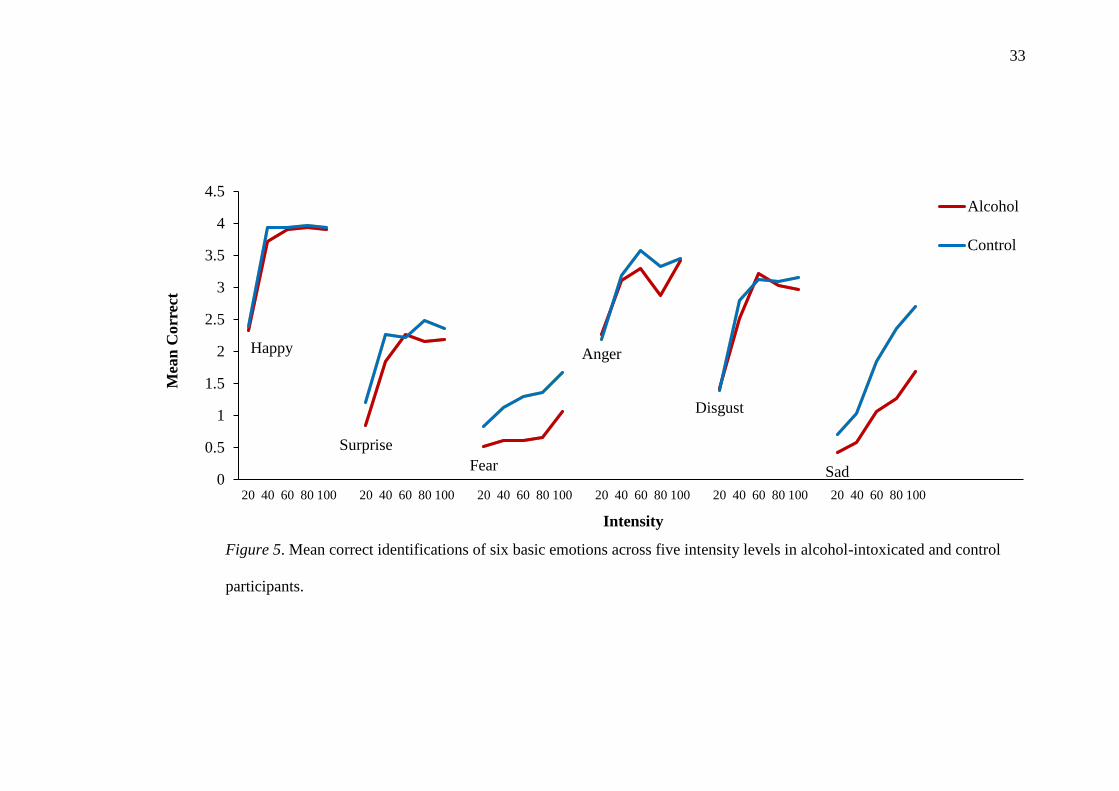
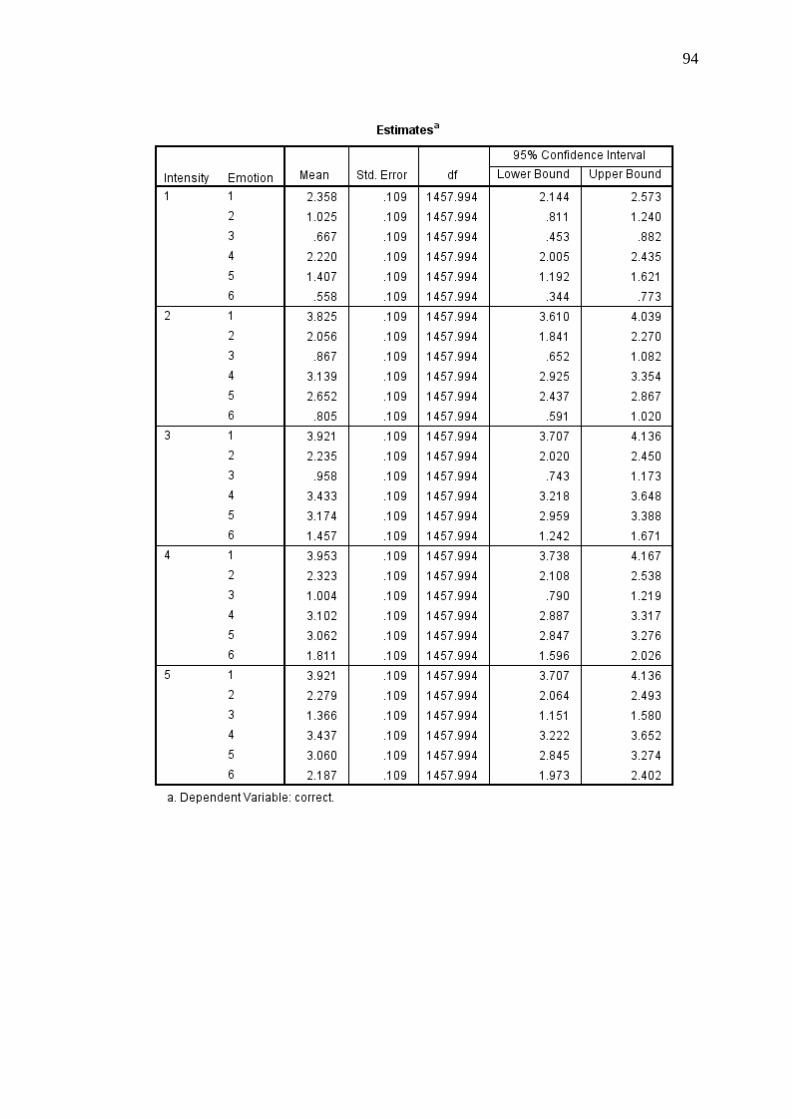
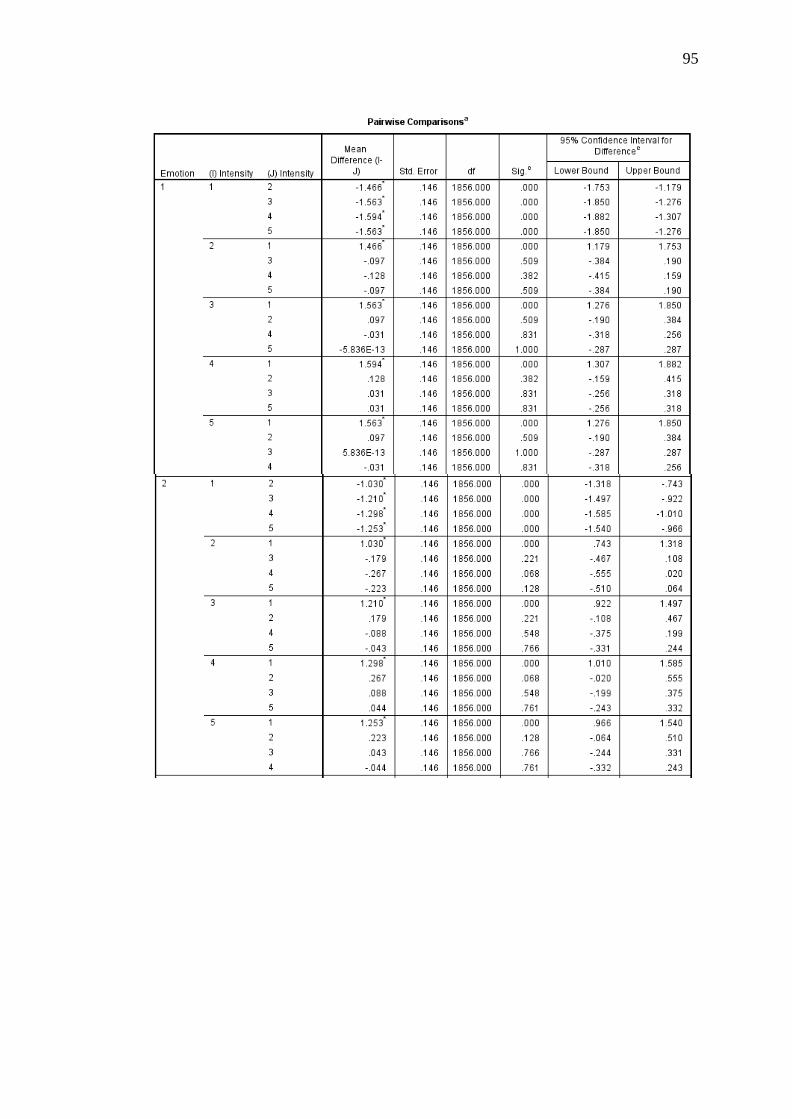
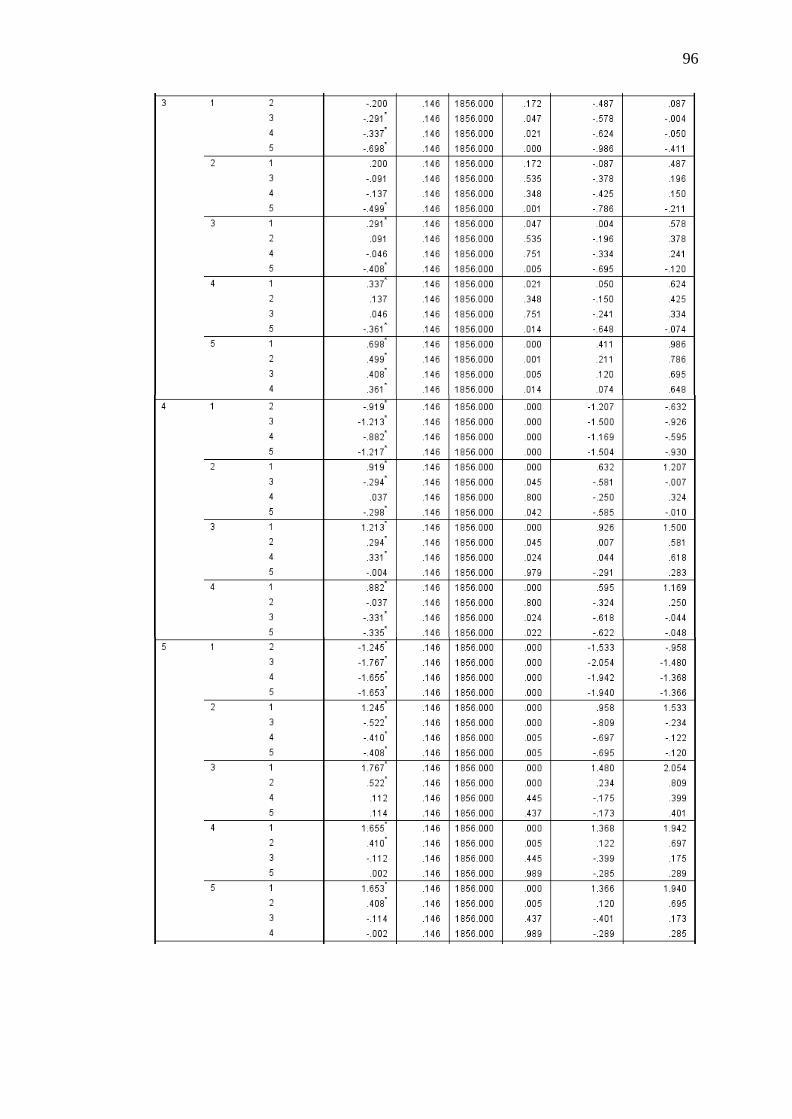
There was also a 2 (condition: alcohol and placebo) × 6 (emotion: happy,
surprise, fear, anger, disgust, and sadness) × 5 (intensity: 20%, 40%, 60%, 80%, and
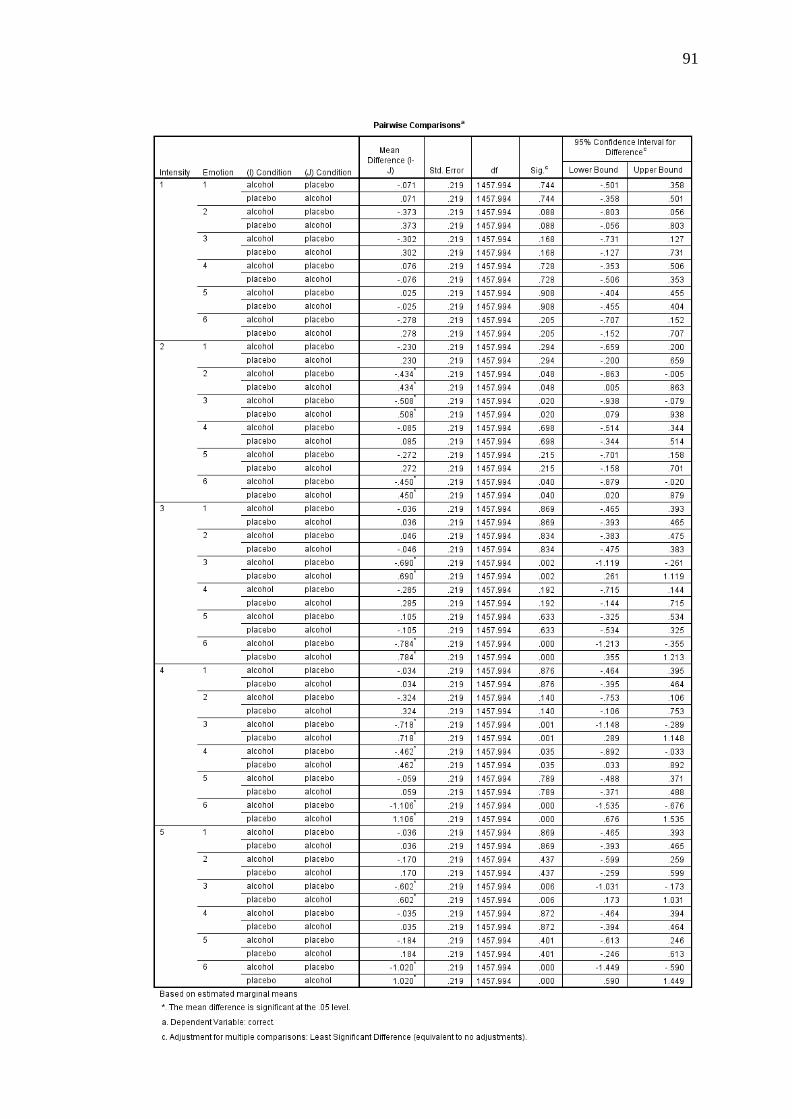
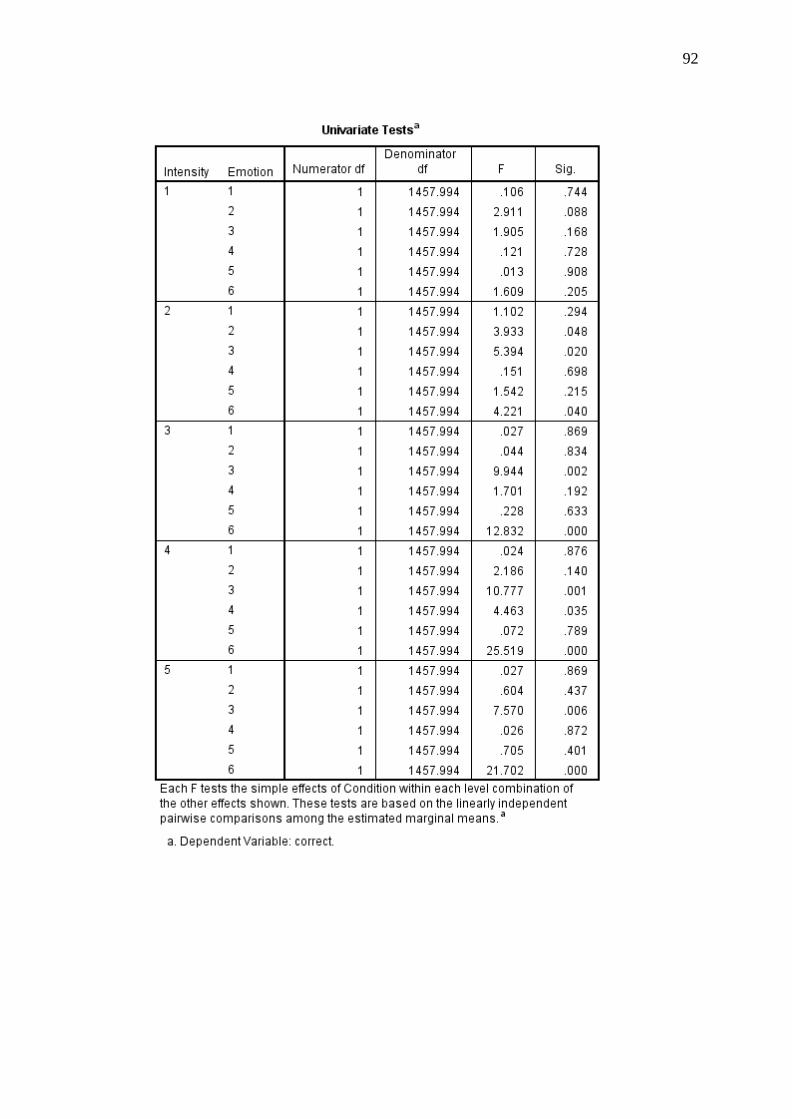
100%) interaction [F(40, 1856) = 4.02, p <.001, r = .05]. The results of this analysis
are diagrammatically presented in Figure 5. Post-hoc pairwise comparisons indicated
that participants in the alcohol condition were significantly less accurate than
Page 40
31
participants in the placebo condition at correctly identifying fear at 60% intensity
[F(1, 1457.99) = 9.94, p = .002, d = 0.86], 80% intensity [F(1, 1457. 99) = 10.78, p =
.001, d = 0.83], and 100% intensity [F(1, 1457.99) = 7.57, p = .006, d = 0.69]. They
were also significantly less accurate at identifying sadness at 60% intensity [F(1,
1457.99) = 12.83, p < .001, d = 0.90], 80% intensity [F(1, 1457.99) = 25.52, p <
.001, d = 1.27], and 100% intensity [F(1, 1457.99) = 21.70, p < .001, d = 1.17].
There was also a trend for participants in the alcohol condition to be less accurate at
correctly identifying anger, relative to participants in the placebo condition, when
presented at 80% intensity [F(1, 1457.99) = 4.46, p = .035, d = .53]. There was also
a trend for participants in the alcohol condition to be less accurate at correctly
identifying surprise [F(1, 1457.99) = 3.93, p = .048, d = .50], fear [F(1, 1457.99) =
5.39, p = .020, d = .58], and sadness [F(1, 1457.99) = 4.22, p = .040, d = .52] at 40%
intensity, relative to participants in the placebo condition. No significant differences
were detected between conditions on the remaining emotions/intensity levels.
Figure 3. Means and standard errors for the two-way interaction between condition
and emotion.
0.55
1.05
1.55
2.05
2.55
3.05
3.55
4.05
Happy Surprise Fear Anger Disgust Sadness
Mea
n C
orr
ect
Emotion
Alcohol
Placebo
Page 41
32
Figure 4. Means and standard errors for the two-way interaction between condition
and intensity.
1.2
1.4
1.6
1.8
2
2.2
2.4
2.6
2.8
3
20 40 60 80 100
Mea
n S
core
Emotion Intensity
Alcohol
Placebo
Page 42
33
Happy
Surprise
Fear
Anger
Disgust
Sad0
0.5
1
1.5
2
2.5
3
3.5
4
4.5
20 40 60 80 100 20 40 60 80 100 20 40 60 80 100 20 40 60 80 100 20 40 60 80 100 20 40 60 80 100
Mea
n C
orr
ect
Intensity
Alcohol
Control
Figure 5. Mean correct identifications of six basic emotions across five intensity levels in alcohol-intoxicated and control
participants.
Page 43
34
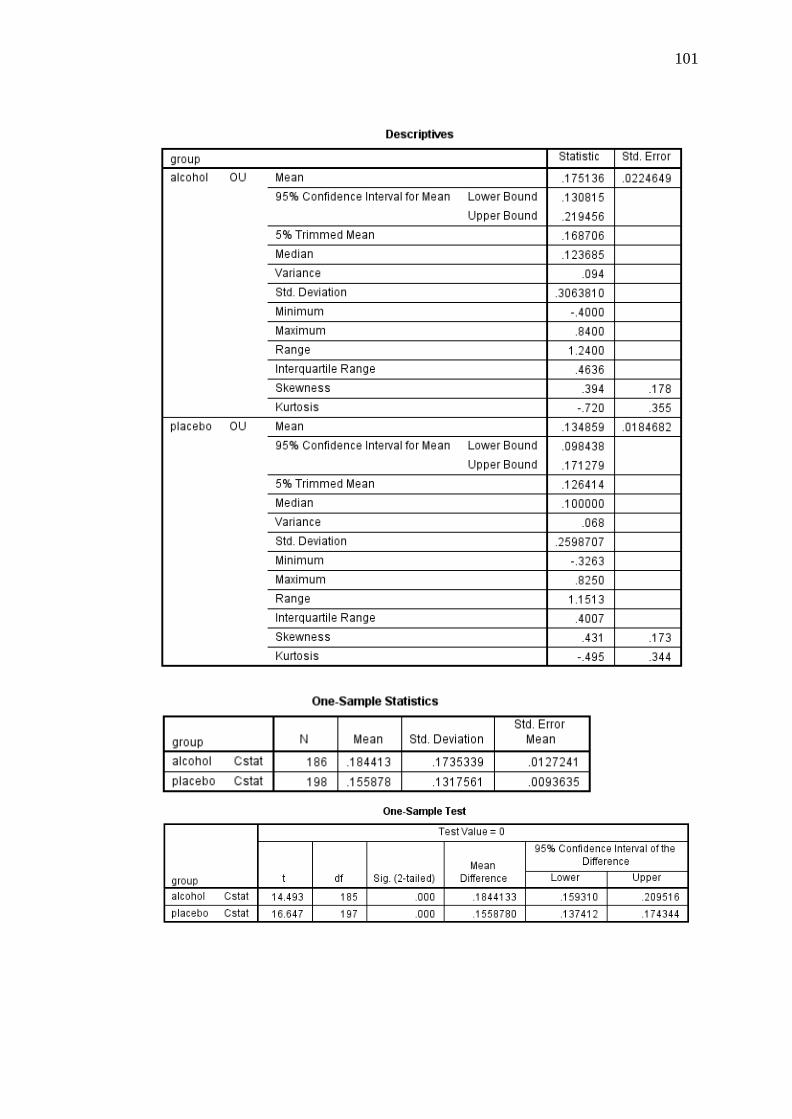
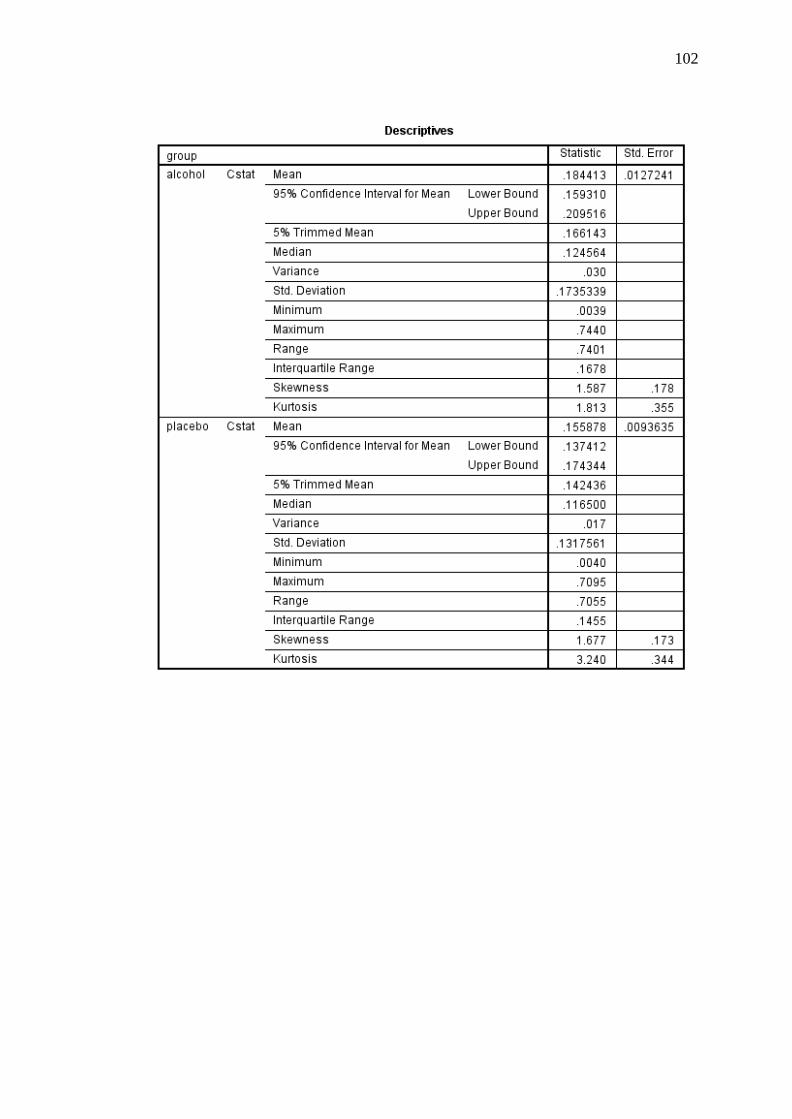
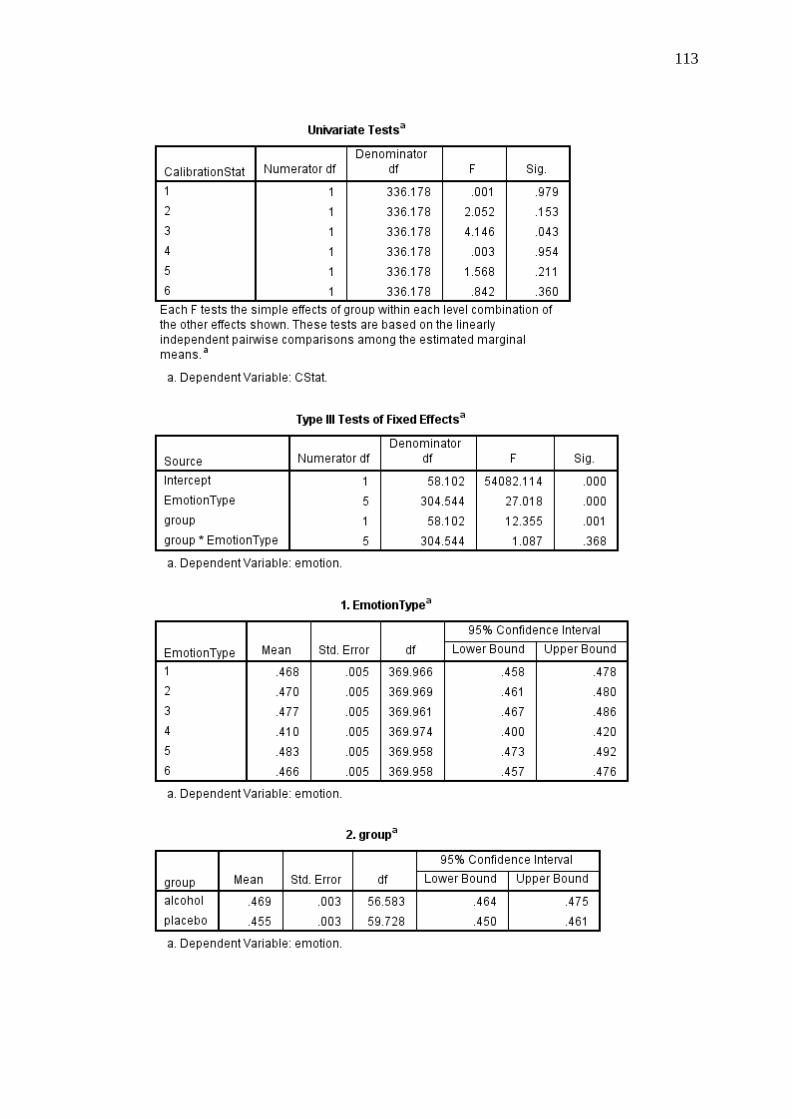
Calibration Analyses
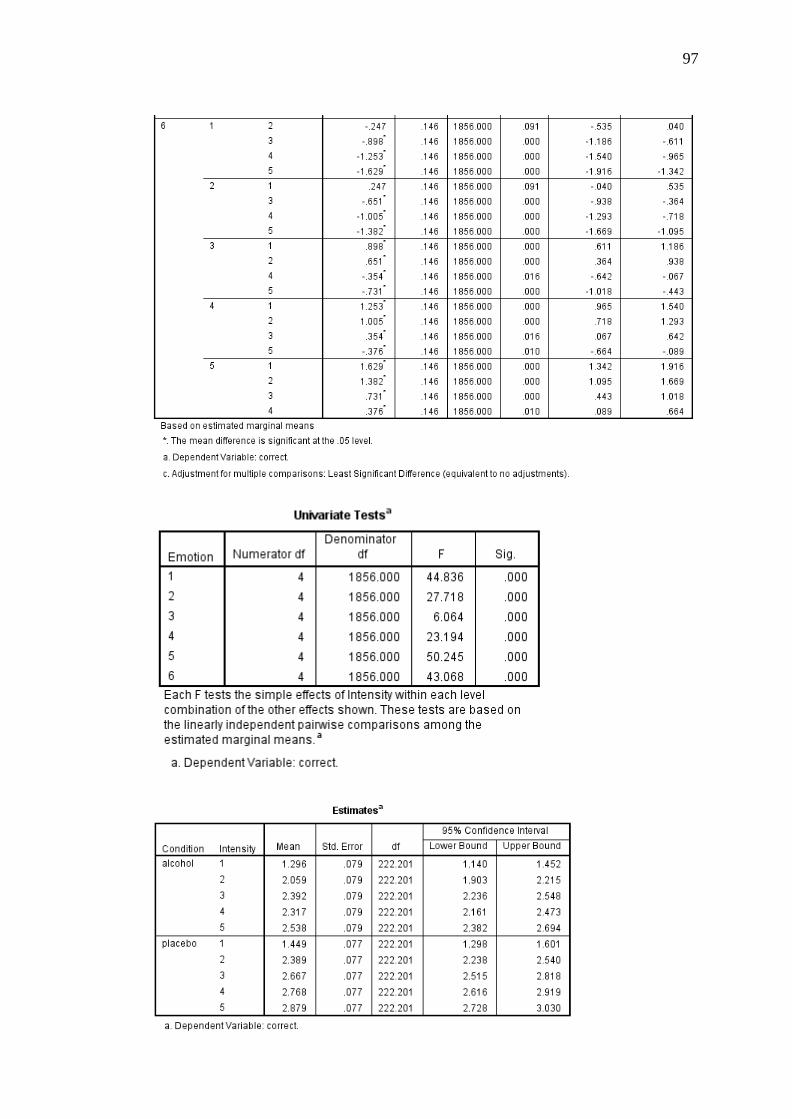
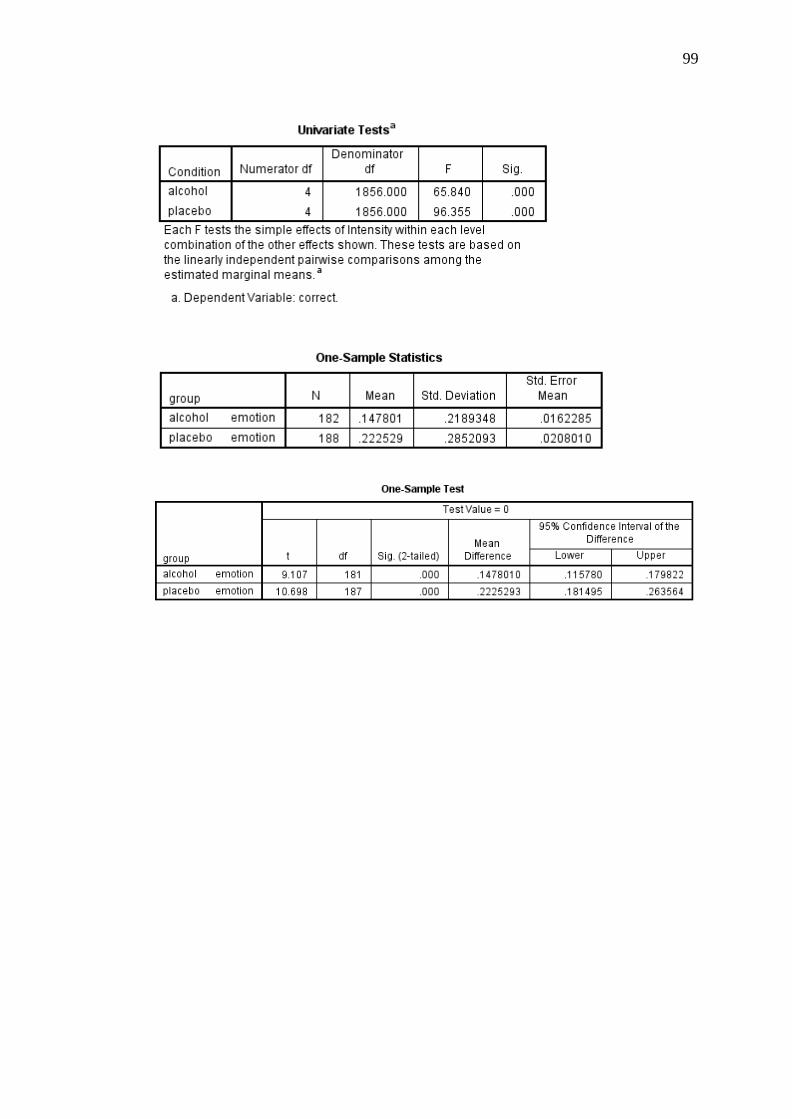
Accuracy of Confidence Ratings. One-samples t-tests were conducted to
determine the accuracy of confidence ratings amongst the total sample. The ANDI
values for the alcohol (M = .15, SD = .22) and placebo (M = .22, SD = .29)
conditions were significantly different from zero, t(181) = 9.12, p < .001, 95% CI
[.12, .18] and, t(187) = 10.70, p < .001, 95% CI [.18, .26], respectively. This
indicates that 15% of confidence ratings in the alcohol condition and 22% of
confidence ratings in the placebo condition were able to discriminate between
correctly and incorrectly recognised items. A significant O/U value of .18 (SD = .31)
for the alcohol condition and .13 (SD = .26) for the placebo condition indicated that
participants were slightly overconfident in their predictions and that these values
were significantly different from zero, t(185) = 7.80, p < .001, 95% CI [.13, .22] and,
t(197) = 7.30, p < .001, 95% CI [.10, .17], respectively. Lastly, a significant
Calibration value for the alcohol (M = .18, SD = .17) and the placebo (M = .16, SD =
.13) conditions indicated that actual performance closely corresponded with
subjective ratings of performance and that these values were significantly different
from zero, t(185) = 14.49, p < .001, 95% CI [.16, .21] and, t(197) = 16.65, p < .001,
95% CI [.14, .17], respectively.
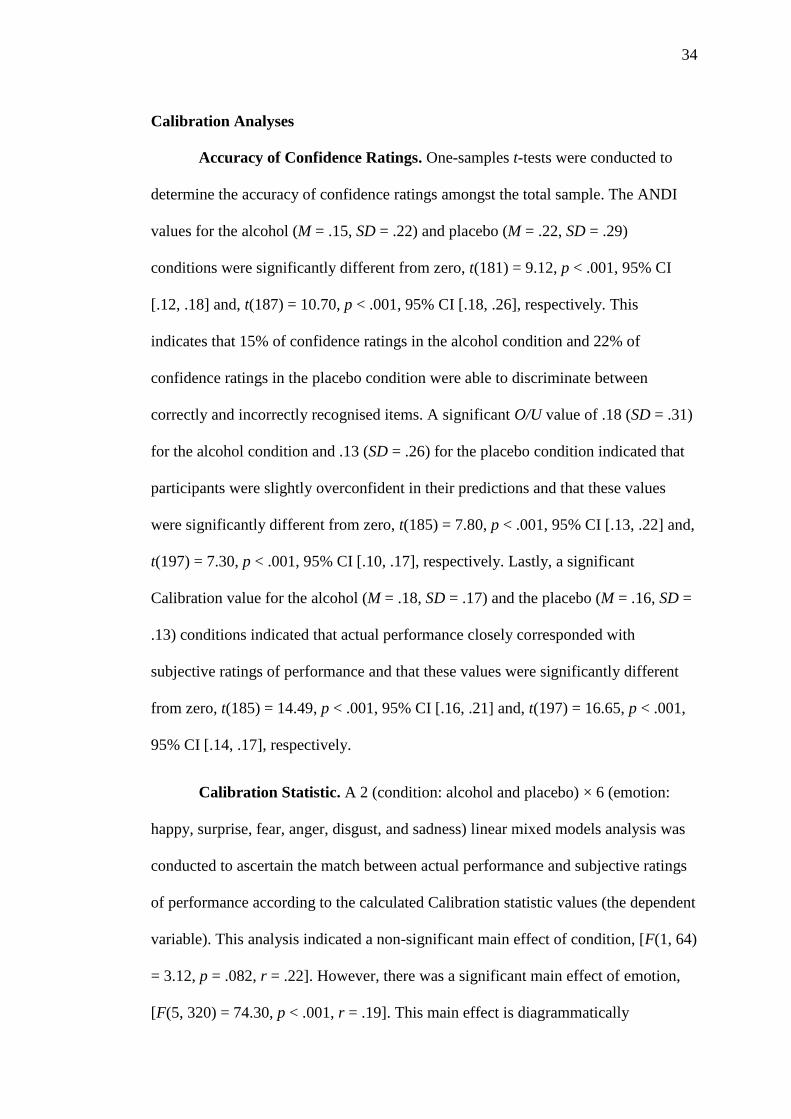
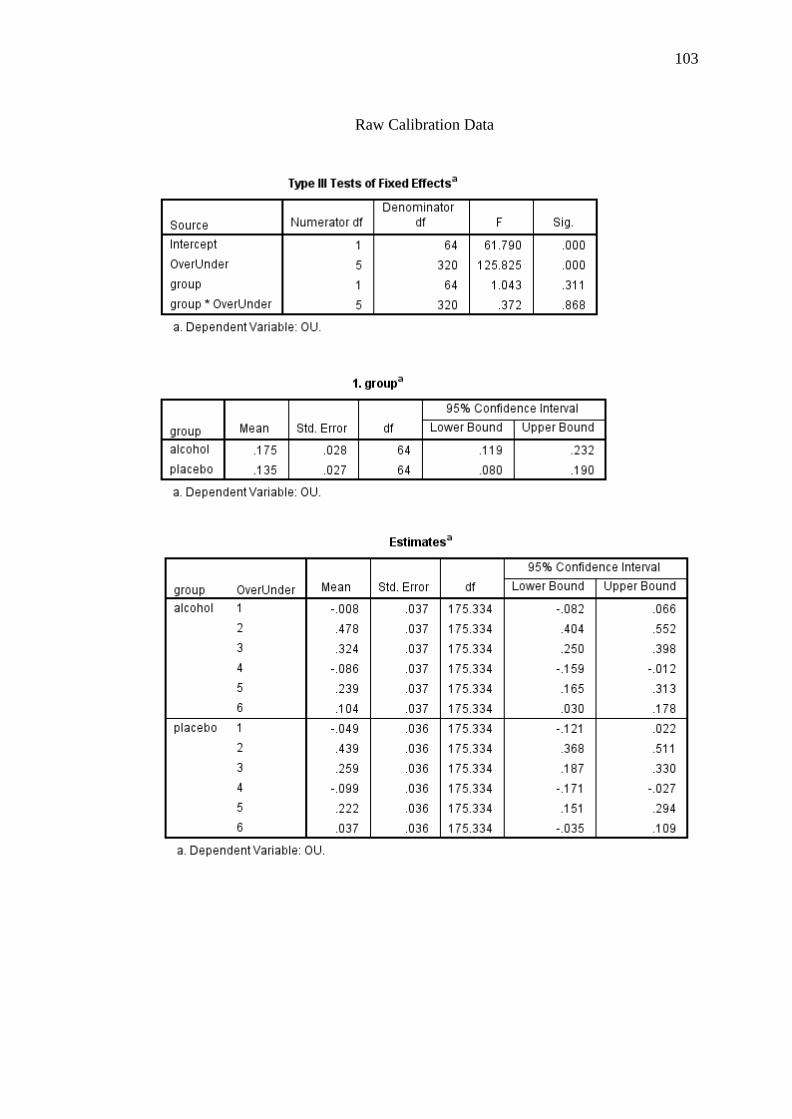
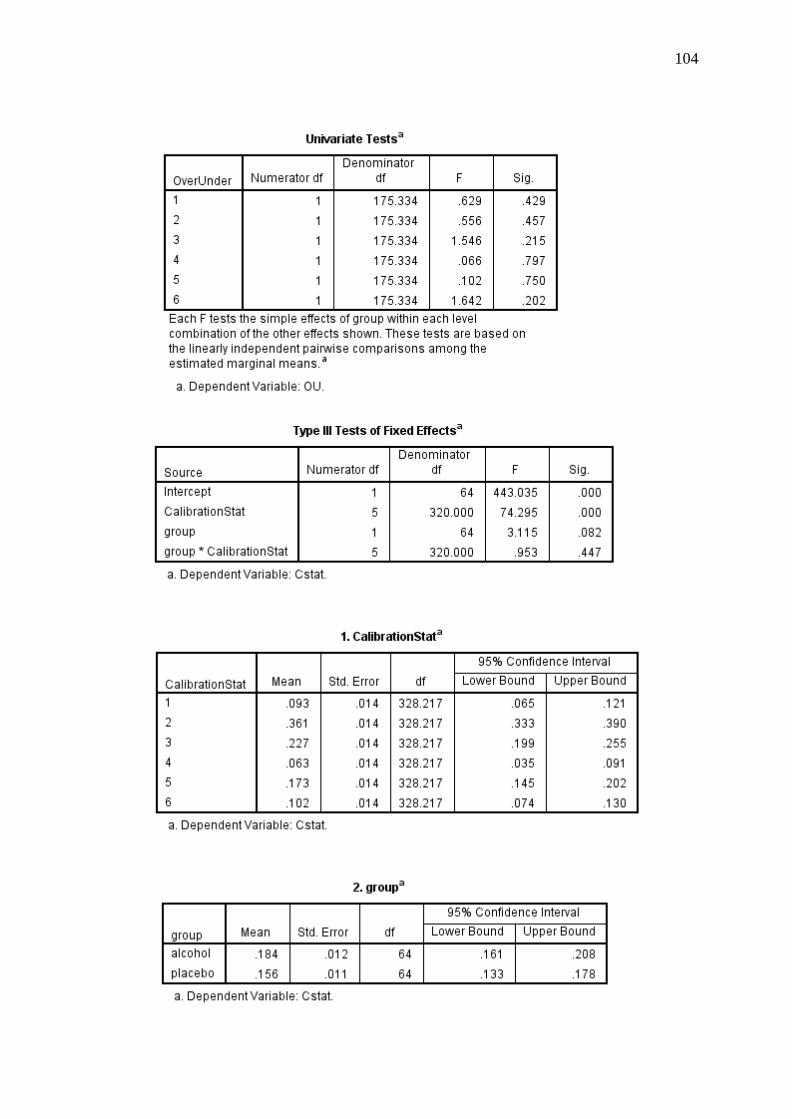
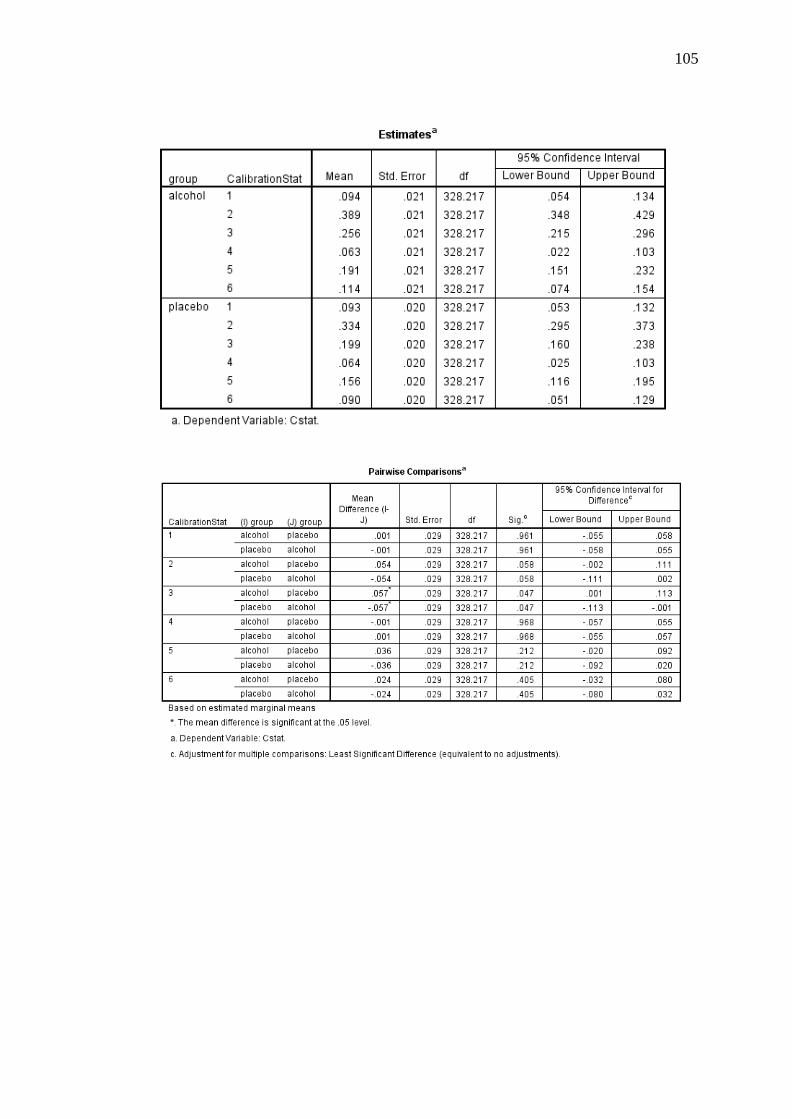
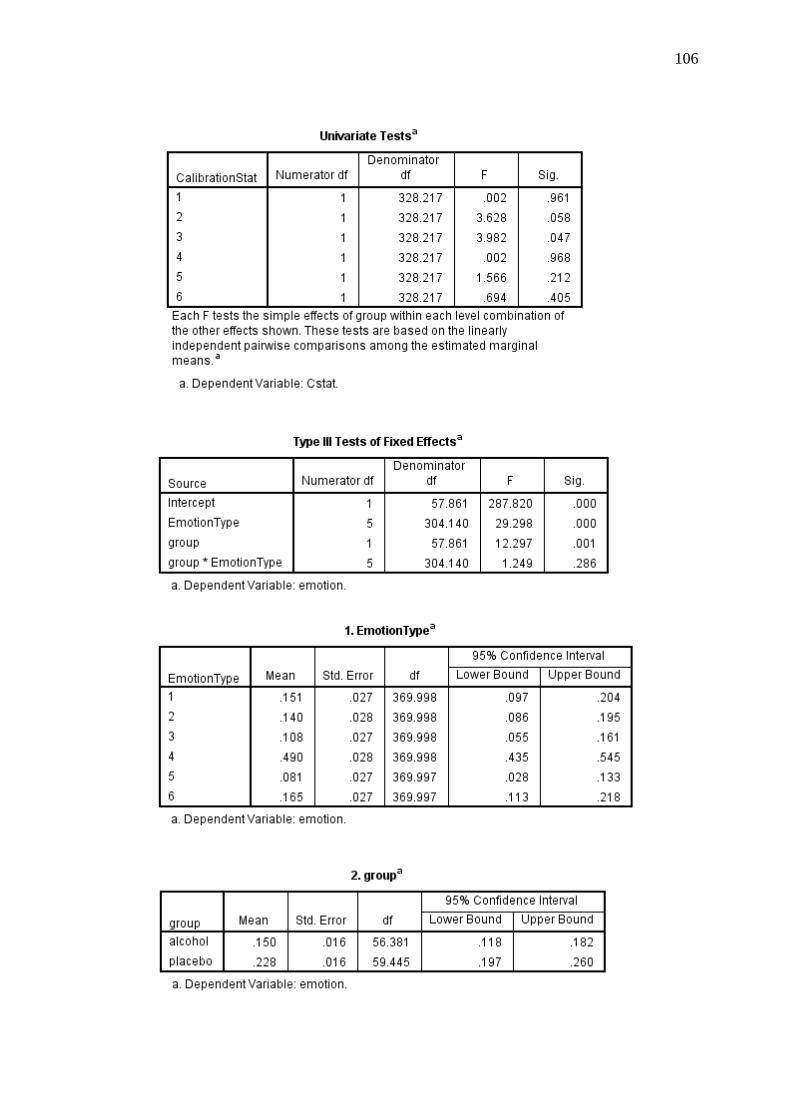
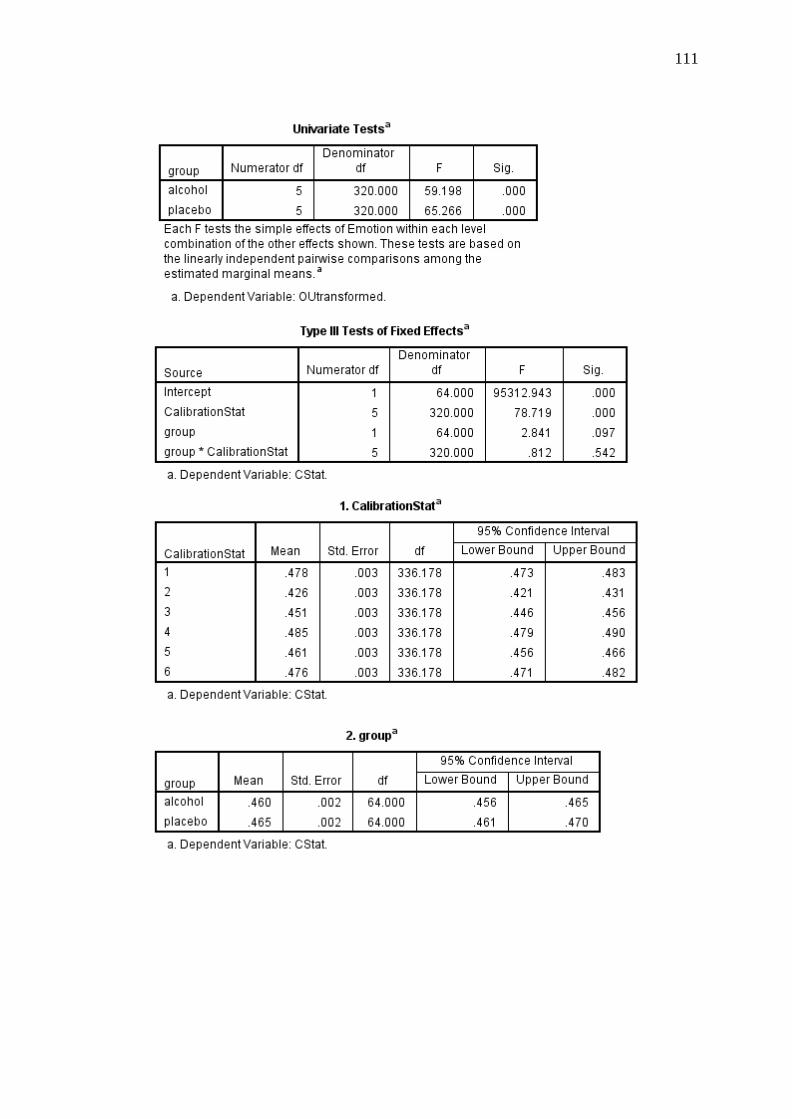
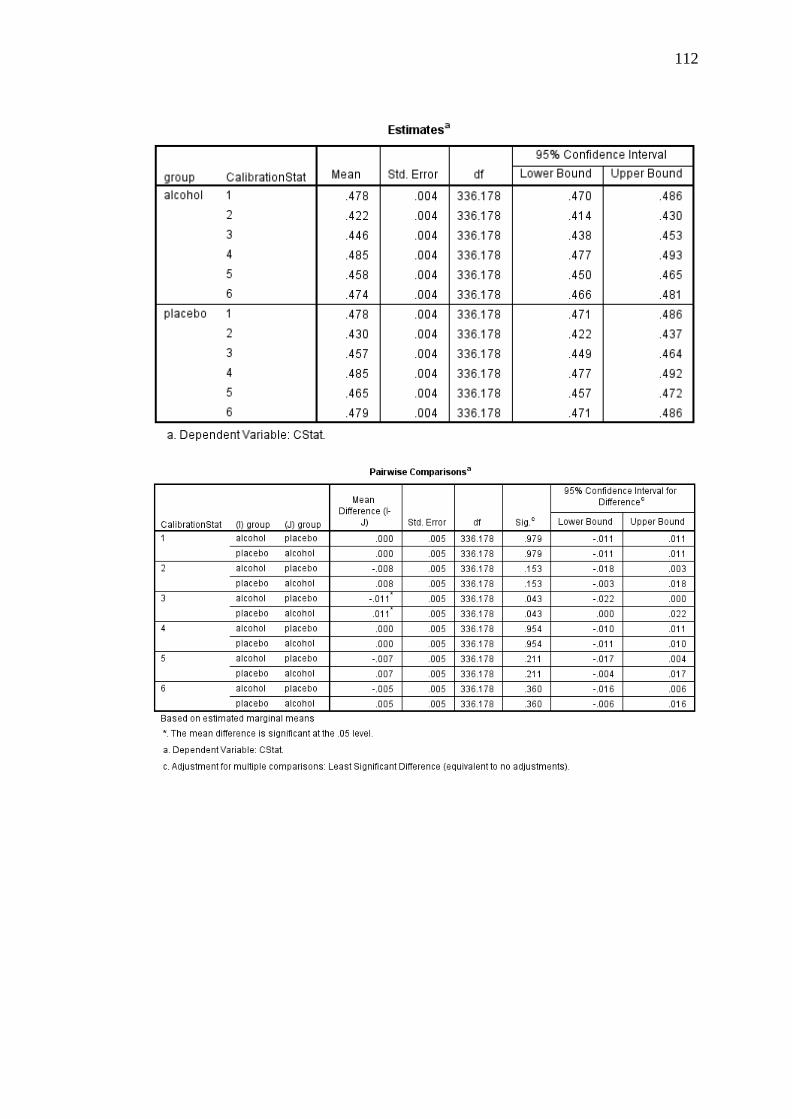
Calibration Statistic. A 2 (condition: alcohol and placebo) × 6 (emotion:
happy, surprise, fear, anger, disgust, and sadness) linear mixed models analysis was
conducted to ascertain the match between actual performance and subjective ratings
of performance according to the calculated Calibration statistic values (the dependent
variable). This analysis indicated a non-significant main effect of condition, [F(1, 64)
= 3.12, p = .082, r = .22]. However, there was a significant main effect of emotion,
[F(5, 320) = 74.30, p < .001, r = .19]. This main effect is diagrammatically
Page 44
35
represented in Figure 6. Post-hoc pairwise comparisons indicated that, among all
participants, fear, sadness, and surprise significantly differed from each other as well
as from all other emotions (p < .01). There was also a trend for happy and disgust to
differ from each other (p < .05). There was a non-significant condition by emotion
interaction, [F(5, 320) = .95, p = .447, r = .05].
Figure 6. Means and standard errors for the Calibration statistic across all
participants for each emotion.
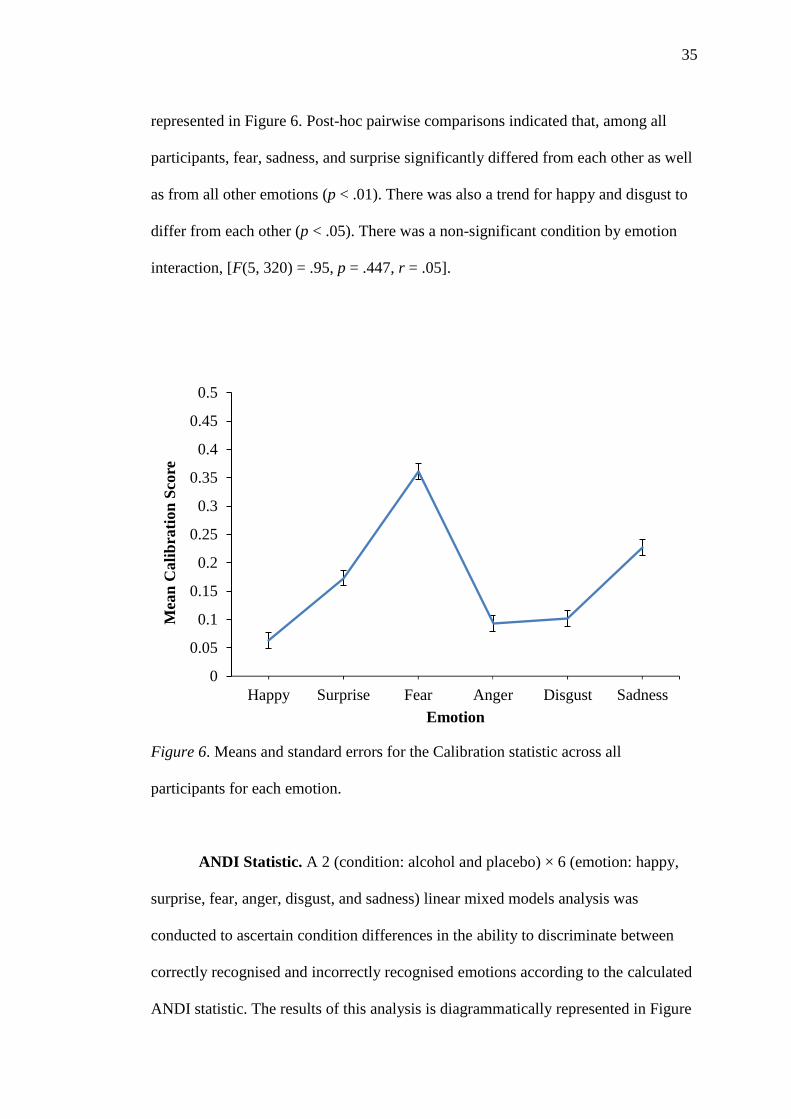
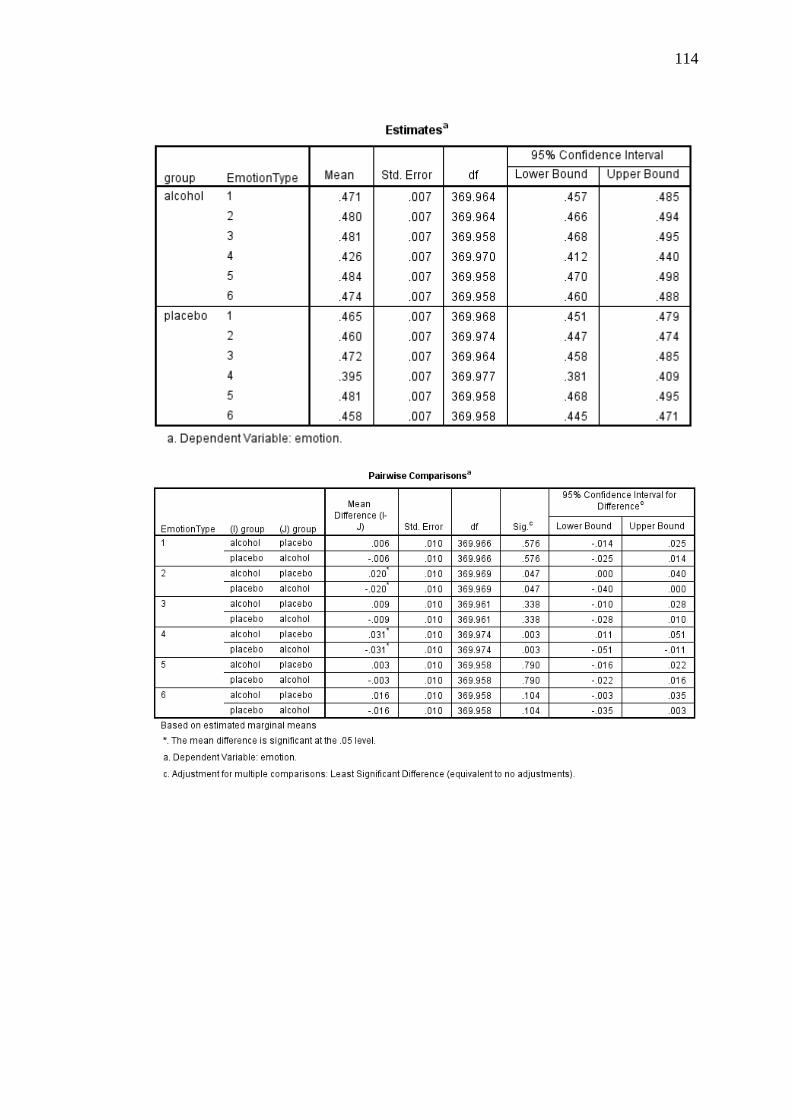
ANDI Statistic. A 2 (condition: alcohol and placebo) × 6 (emotion: happy,
surprise, fear, anger, disgust, and sadness) linear mixed models analysis was
conducted to ascertain condition differences in the ability to discriminate between
correctly recognised and incorrectly recognised emotions according to the calculated
ANDI statistic. The results of this analysis is diagrammatically represented in Figure
0
0.05
0.1
0.15
0.2
0.25
0.3
0.35
0.4
0.45
0.5
Happy Surprise Fear Anger Disgust Sadness
Mea
n C
ali
bra
tion
Sco
re
Emotion
Page 45
36
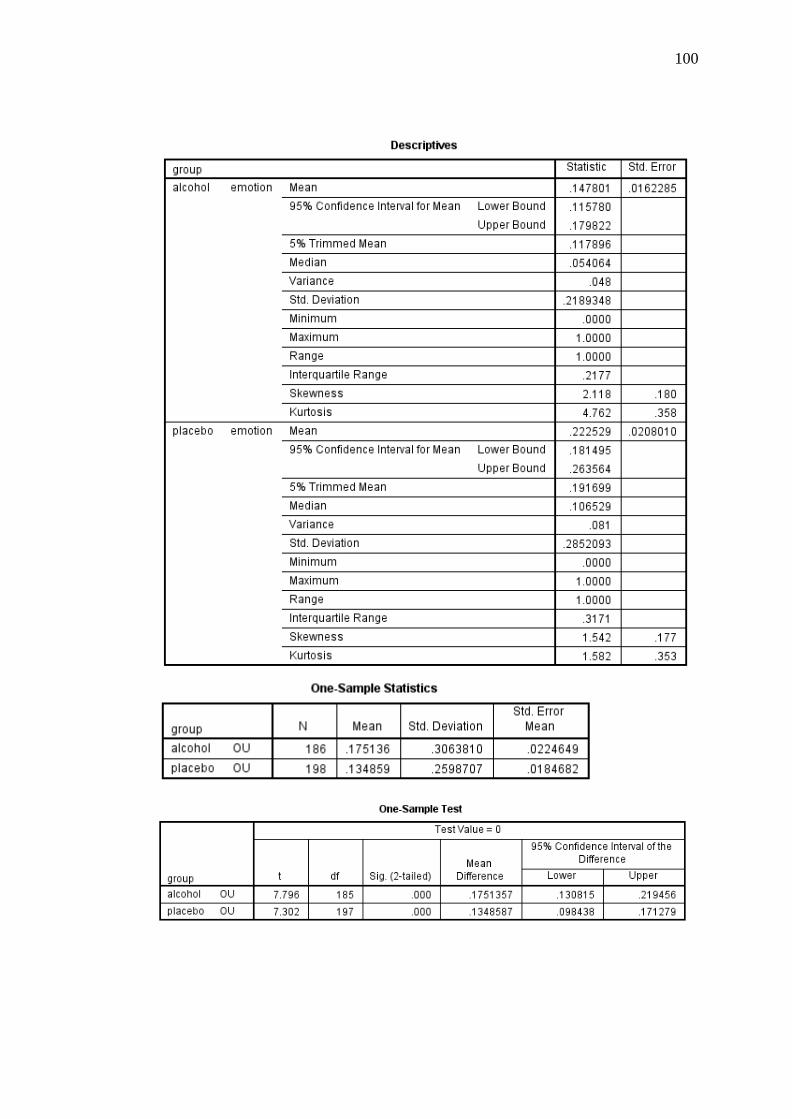
7. This analysis indicated a significant main effect of condition, [F(1, 57.86) = 12.30,
p = .001, r = .42], with confidence ratings predicting 23% (SD = .13) of correct
identifications in the placebo condition and 15% (SD = .13) of correct identifications
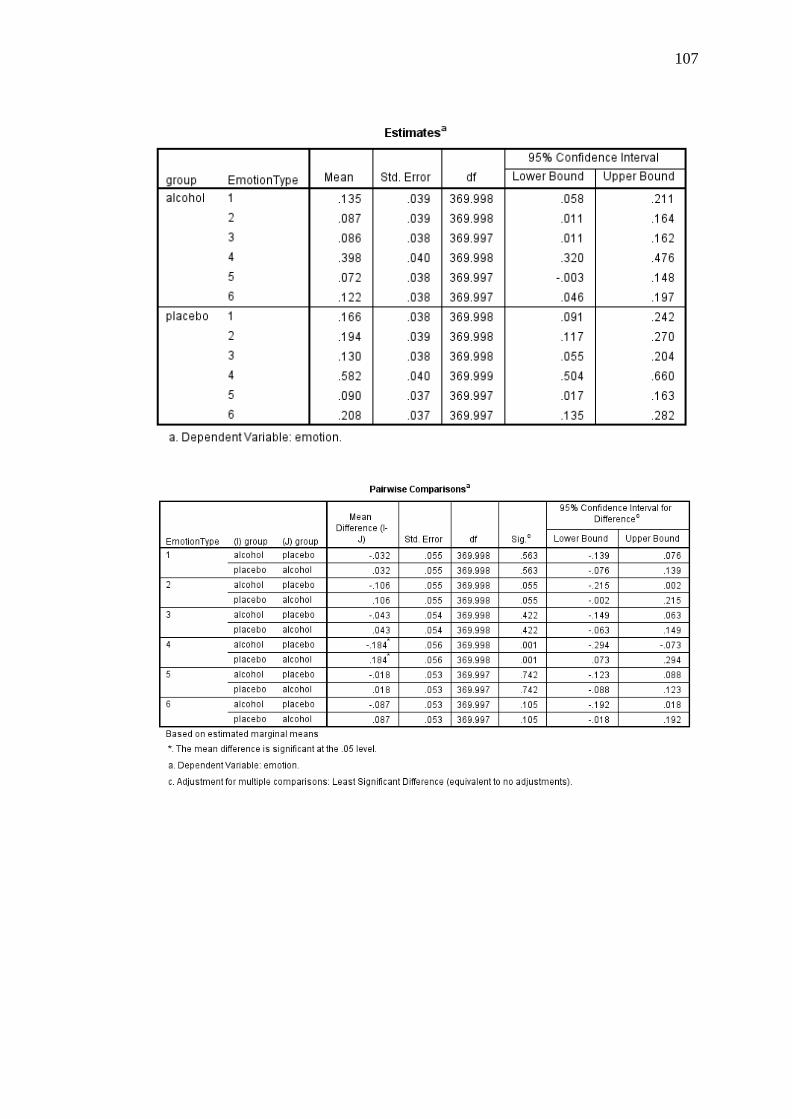
in the alcohol condition. There was also a significant main effect of emotion, [F(5,
304.14) = 29.30, p < .001]. Post-hoc pairwise comparisons indicated that the ANDI
value for happiness was significantly higher than all other emotions at p < .001. A
significant condition by emotion interaction was not detected, [F(5, 304.14) = 1.25, p
= .286, r = .06].
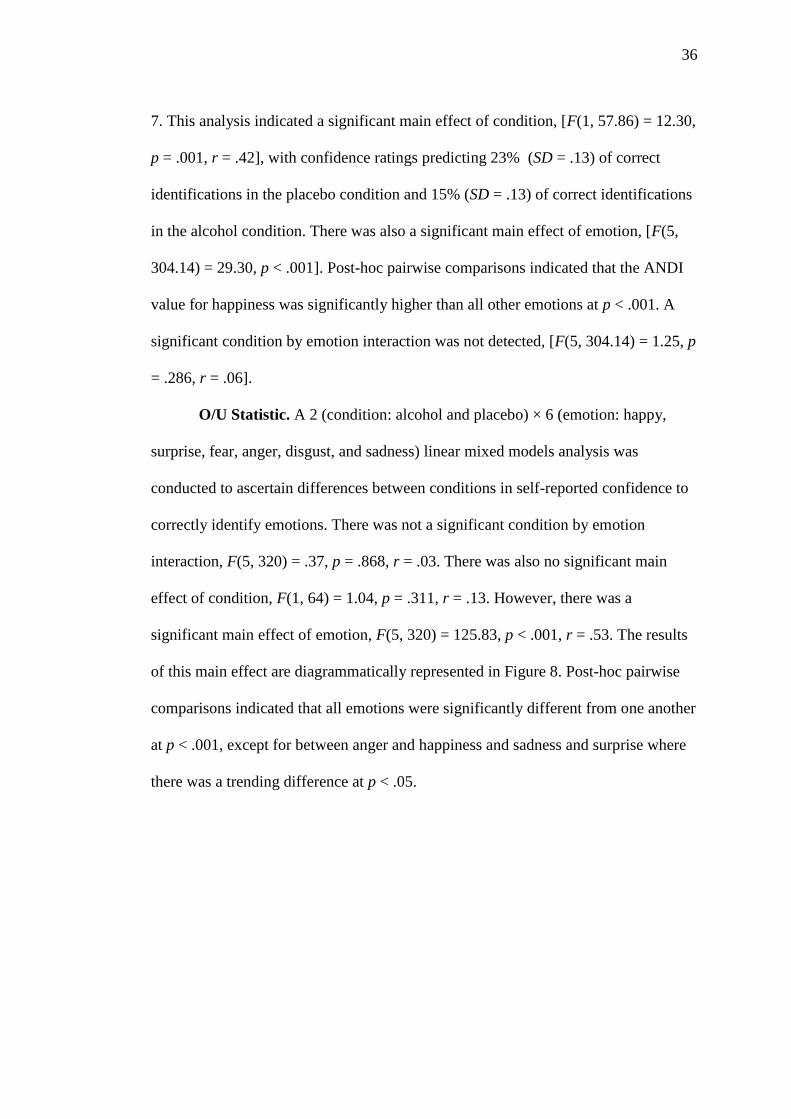
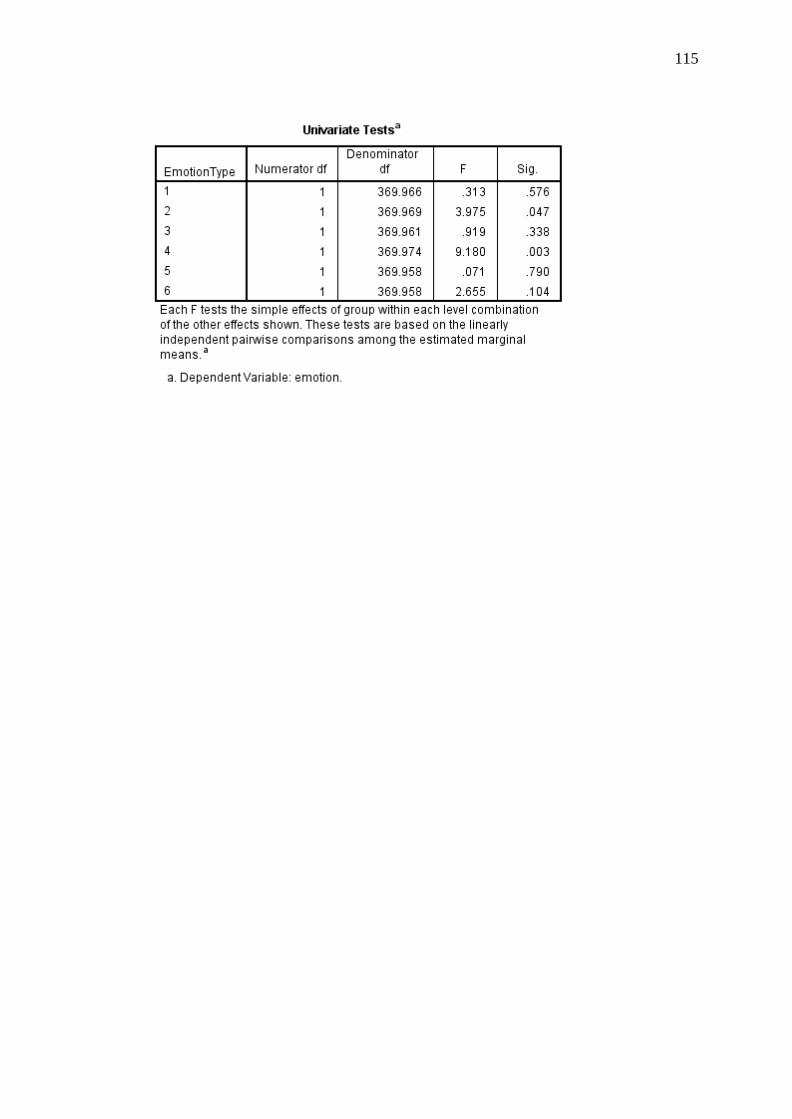
O/U Statistic. A 2 (condition: alcohol and placebo) × 6 (emotion: happy,
surprise, fear, anger, disgust, and sadness) linear mixed models analysis was
conducted to ascertain differences between conditions in self-reported confidence to
correctly identify emotions. There was not a significant condition by emotion
interaction, F(5, 320) = .37, p = .868, r = .03. There was also no significant main
effect of condition, F(1, 64) = 1.04, p = .311, r = .13. However, there was a
significant main effect of emotion, F(5, 320) = 125.83, p < .001, r = .53. The results
of this main effect are diagrammatically represented in Figure 8. Post-hoc pairwise
comparisons indicated that all emotions were significantly different from one another
at p < .001, except for between anger and happiness and sadness and surprise where
there was a trending difference at p < .05.
Page 46
37
0
0.1
0.2
0.3
0.4
0.5
0.6
0.7
Happy Surprise Fear Anger Disgust Sadness
Mea
n A
ND
I S
core
Emotion
Alcohol
Placebo
Figure 7. Means and standard errors for the ANDI statistic across all participants for
each emotion.
Figure 8. Means and standard errors for the O/U statistic across all participants for
each emotion.
-0.2
-0.1
0
0.1
0.2
0.3
0.4
0.5
Happy Surprise Fear Anger Disgust Sadness
Mea
n O
/US
core
Emotion
Page 47
38
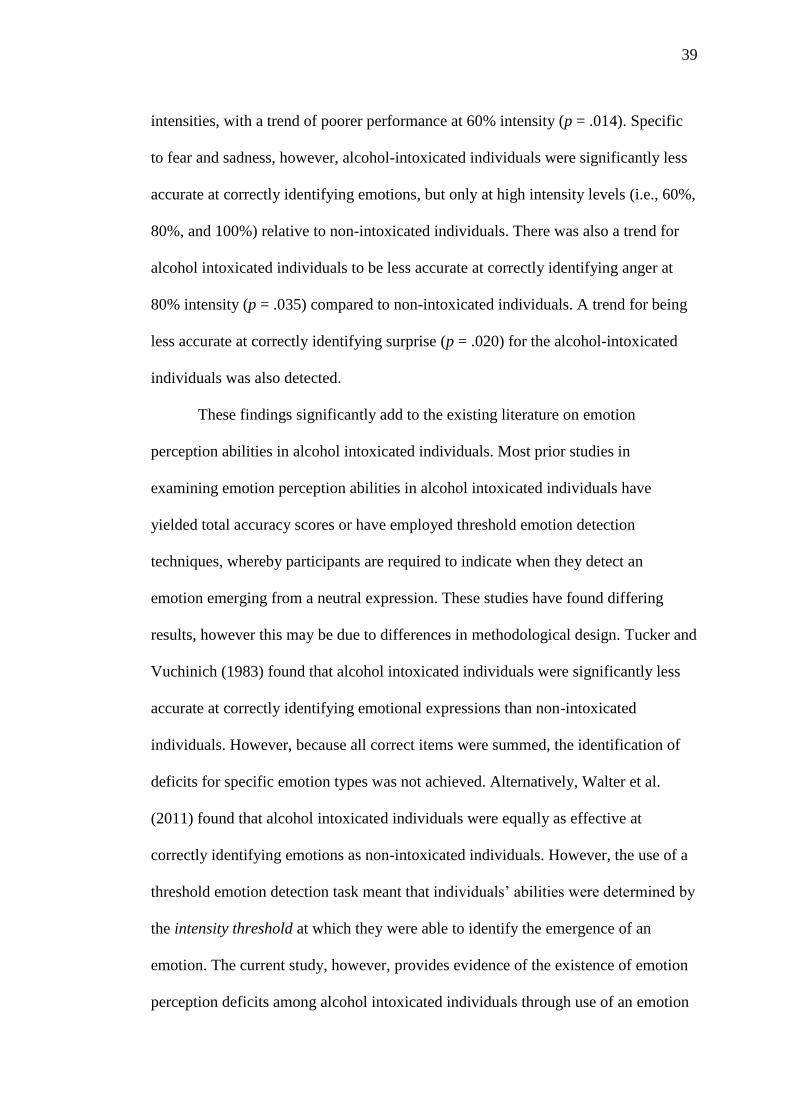
Discussion
The current study aimed to investigate the effects of alcohol intoxication on
abilities to perceive a full range of basic emotions (happy, surprise, fear, anger,
disgust, and sad) across varying intensity levels. In addition, the study aimed to
assess participants’ insight into their emotion perception abilities. All manipulation
checks employed in the current study functioned as intended and there were no
significant differences between conditions on baseline assessments. Therefore, the
present results can be interpreted with confidence.
The first hypothesis, that alcohol-intoxicated individuals will have greater
difficulties in correctly labelling negative, but not positive emotional expressions
than non-intoxicated individuals when emotions are displayed at high intensity
levels, was supported. Consistent with the hypothesis, emotion perception abilities
were significantly more accurate among individuals in the placebo condition than
those in the alcohol condition, regardless of emotion type and expression intensity.
Furthermore, while individuals in the alcohol-intoxication condition did not differ
from individuals in the placebo condition for positive emotions, they were
significantly less accurate at correctly identifying fear and sadness. There was also a
trend towards poorer performance for the perception of anger for alcohol-intoxicated
individuals (p = .035).
The second hypothesis, that alcohol-intoxicated individuals will have greater
difficulties in correctly labelling emotional expressions when they are displayed at
lower (i.e., 20% - 60%) intensity levels regardless of emotional valence than non-
intoxicated individuals, was partially supported. Overall, alcohol-intoxicated
individuals performed more poorly across all emotion types at 40%, 80% and 100%
Page 48
39
intensities, with a trend of poorer performance at 60% intensity (p = .014). Specific
to fear and sadness, however, alcohol-intoxicated individuals were significantly less
accurate at correctly identifying emotions, but only at high intensity levels (i.e., 60%,
80%, and 100%) relative to non-intoxicated individuals. There was also a trend for
alcohol intoxicated individuals to be less accurate at correctly identifying anger at
80% intensity (p = .035) compared to non-intoxicated individuals. A trend for being
less accurate at correctly identifying surprise (p = .020) for the alcohol-intoxicated
individuals was also detected.
These findings significantly add to the existing literature on emotion
perception abilities in alcohol intoxicated individuals. Most prior studies in
examining emotion perception abilities in alcohol intoxicated individuals have
yielded total accuracy scores or have employed threshold emotion detection
techniques, whereby participants are required to indicate when they detect an
emotion emerging from a neutral expression. These studies have found differing
results, however this may be due to differences in methodological design. Tucker and
Vuchinich (1983) found that alcohol intoxicated individuals were significantly less
accurate at correctly identifying emotional expressions than non-intoxicated
individuals. However, because all correct items were summed, the identification of
deficits for specific emotion types was not achieved. Alternatively, Walter et al.
(2011) found that alcohol intoxicated individuals were equally as effective at
correctly identifying emotions as non-intoxicated individuals. However, the use of a
threshold emotion detection task meant that individuals’ abilities were determined by
the intensity threshold at which they were able to identify the emergence of an
emotion. The current study, however, provides evidence of the existence of emotion
perception deficits among alcohol intoxicated individuals through use of an emotion
Page 49
40
perception task that allows the assessment of emotion perception ability across a
range of emotion types and emotion intensities. Importantly, unlike Walter et al. who
examined only group differences at the level of intensity threshold,
the current study found that difficulties in emotion detection ability were apparent in
most negative emotions at moderate-to-higher intensity levels. Thus, the emotion
perception difficulties of alcohol-intoxicated individuals appear to be more
widespread than the difficulties that may or may not be detected in these prior
studies.
The present findings are consistent with the findings of Philippot et al.
(1999), who examined emotion perception abilities in alcohol dependent individuals.
Specifically, this study found that alcohol dependent individuals were significantly
less accurate at correctly identifying sad, disgust, angry, and happy emotional
expressions at all intensity levels. Alcohol dependent individuals were also
significantly worse at correctly identifying fear when presented at 70% and 100%
intensity. While the existence of emotion perception deficits for negative stimuli
were consistent with Philippot et al.’s (1999) findings, deficits in detecting emotions
such as happy, were not consistent. One possible explanation for this is that Philippot
et al. employed static photographs to assess emotion perception abilities, which
arguably may not reflect the dynamic nature of emotional expressions in humans. In
particular, as these facial configurations do not allow a participant to see an emotion
emerge in real time (e.g., from a neutral stimulus in the form of a video clip as used
in the present study), it may be less detectable, potentially resulting in a greater
number of incorrect identifications. An alternative and highly plausible explanation
is that areas of the brain that mediate positive emotions are compromised in alcohol
dependent individuals, but not alcohol intoxicated individuals. That is, emotional
Page 50
41
valence is mediated by differing regions of the brain. In line with this, prior studies
using electroencephalograms have found more activation in the left hemisphere of
the frontal lobes during videotaped segments that were perceived by participants as
positive, than segments perceived as negative (Davidson, 1992; Davidson & Fox,
1982). The right hemisphere was more likely to be activated in the negative
segments. In alternative research, cerebellar lesions have been linked with reduced
pleasant experience in response to happiness- but not fear-evoking stimuli in
individuals with stroke (Turner et al., 2007). The notion that alcohol consumption is
a social lubricant when taken acutely and in moderate doses, thereby facilitating
positive social interaction, is consistent with a valence model that specifies there are
specialised regions of the brain mediating positive vs. negative emotion types
(Hellige, 1993).
These results are inconsistent with those reported by Kornreich et al. (2001)
who found that abstainers and recently detoxified individuals were significantly less
accurate at correctly identifying emotional expressions at low intensity levels relative
to controls. Deficits in emotion perception at low intensity levels have also been
found in individuals with a TBI, particularly for stimuli depicting anger, disgust, and
happy expressions (Rosenberg et al., 2014). The deficits identified in these clinical
populations may be attributed to brain injury severity or long term neurological
changes as a result of chronic alcohol consumption. In this way, it is reasonable to
expect that deficits were not identified in the current study because acute alcohol
consumption does not impact brain functionality to the same extent of chronic
alcohol use and TBI.
The more extensive emotion perception deficits detected in the alcohol
dependent individuals may also be the consequence of cognitive and perceptual
Page 51
42
dysfunctions commonly seen in these individuals (Kornreich et al., 2001). These
include deficits in memory, perceptual analysis, speed and accuracy of information
processing, and learning (Parsons, 1998). The severity and impact of these
dysfunctions are also likely influenced by the rate and extent of recovery from
chronic alcohol use. That is, certain brain regions are particularly sensitive to the
effects of chronic alcohol exposure, and recovery of these regions may take longer.
This may explain why individuals who had abstained from alcohol for two months in
Kornreich et al. (2001) study, were more accurate at correctly identifying emotions
than those who had recently detoxified. Increases in accurate identifications
following longer abstinence period would be unsurprising and may be more closely
related to the results observed in the current alcohol intoxicated sample.
The trending significance between groups in surprise is an interesting finding
of the study. Previous research has illustrated that, while surprise is often
conceptualised as being a positive emotion (Babbage et al., 2011), it has also been
regarded as an emotion without a clear valence (Kreibig, 2010). A study conducted
by Rosenberg et al. (2014) examining emotion perception performance among
individuals with a TBI found that expressions depicting surprise and fear were
commonly confused among both the TBI and control groups. This confusion is
unsurprising given the similar facial configurations of the two emotions (e.g., an
open mouth and raised eyebrows) (Honan, McDonald, Sufani, Hine, & Kumfor,
2016). Thus, it is possible that surprise in this study lacked clear valance. It would be
interesting in a future study to ascertain where misclassifications across the emotion
types might have occurred in alcohol intoxicated individuals.
The third hypothesis, that alcohol-intoxicated individuals will demonstrate a
greater lack of insight into their emotion perception abilities when compared to non-
Page 52
43
intoxicated individuals, was supported. Overall, alcohol intoxicated individuals
displayed poorer insight into their emotion perception abilities relative to non-
intoxicated individuals. Although it was interesting that across all participants
confidence ratings were significantly more predictive of correct identifications for
happy expressions than for all other emotional expressions.
These findings are consistent with prior findings reported by Kornreich et al.
(2001) that both abstainers and recently detoxified individuals displayed little insight
into their emotion perception deficits relative to control participants. However, the
present findings are also the first to demonstrate that alcohol intoxicated individuals
have impaired insight into their emotion perception ability. The results of the current
study, therefore, contribute important information to the literature on alcohol
intoxication, demonstrating that acute alcohol consumption has a considerable effect
on individuals’ abilities to identify their emotion perception deficits.
Insight into performance is adaptive, in that it allows individuals to alter their
behaviour when responding to the environment (Toglia & Kirk, 2000). Inaccurate
self-monitoring and overestimation of capabilities can be problematic. For example,
poor perception of negative expressions, combined with an overestimation of
perception performance, may mean that important social cues are not detected,
potentially potentiating increased negative social responses. Similarly, perceptions of
positive expressions, combined with inaccurate overestimation of performance, may
prevent increases in desirable social responses. Given the importance of insight in
mediating appropriate social behaviour, examining individuals’ insight into their
emotion perception abilities was an important aspect of the current study.
Specifically, the examination of online awareness, which refers to the monitoring and
regulation of performance throughout the completion of a task, was important. In this
Page 53
44
way, participants’ abilities to identify deficits and apply alternative strategies and
responses, could be directly examined.
Limitations and Areas for Future Research
A limitation of the current study is that emotion perception was assessed in
the absence of social contexts. As previously mentioned, emotions convey important
non-verbal information, and the interpretation of this information is likely to be
facilitated by information afforded by social and environmental contexts. Future
research may examine emotion perception abilities in alcohol-intoxicated individuals
when emotional expressions are presented in a variety of different contexts (e.g., at a
bar).
An additional limitation of the current study is that all emotions emerged
from a neutral expression. This is not reflective of the human experience of
emotional display and perception. Often, individuals are interacting in complex
social environments whereby the full process of an emerging expression is not in
view. Therefore, future research may examine whether emotion perception deficits
differ for expressions that emerge from neutral and expressions that emerge from
different intensities.
Conclusion
Relationships between alcohol consumption and negative social behaviours
are well established. However, the possible mechanisms underlying these behaviours
are poorly understood. One possible explanation is that alcohol-intoxicated
individuals are poor at recognising emotions displayed by others. Previous research
examining emotion perception abilities in this population has failed to indicate
whether deficits are present for select emotion types and whether these deficits are
apparent at different intensity levels. Research has also failed to examine
Page 54
45
participants’ insight into their emotion perception abilities. The results of the current
study, however, provide valuable insight into emotion perception performance
among alcohol intoxicated individuals. Specifically, it was found that alcohol
intoxicated individuals were significantly less accurate at correctly identifying
negative, but not positive, emotions presented at moderate-to-high intensity levels.
Alcohol-intoxicated individuals’ propensity to inaccurately identify negative
emotions provides a greater understanding into the possible mechanisms underlying
negative social behaviours seen in this group.
Page 55
46
References
American Psychiatric Association. (2013). Diagnostic statistical manual of mental
disorders (5th ed.). Washington, D. C: American Psychiatric Association.
Australian Bureau of Statistics (2015, December 8). 4364.0.55.001 – National Health
Survey: First Results, 2014-15. Retrieved from http://www.abs.gov.au/.
Adolphs, R., Tranel, D., Damasio, H., & Damasio, A. (1994). Impaired recognition
of emotion in facial expressions following bilateral damage to the human
amygdala. Nature, 372, 669-672. doi:10.1038/372669a0
Arnaud, B., Malet, L., Teissedre, F., Izaute, M., Moustafa, F., Geneste, J., . . .
Brousse, G. (2010). Validity Study of Kessler’s Psychological Distress Scales
Conducted Among Patients Admitted to French Emergency Department for
Alcohol Consumption–Related Disorders. Alcoholism: Clinical and
Experimental Research, 34, 1235-1245. doi:10.1111/j.1530-
0277.2010.01201.x
Attwood, A. S., Ataya, A. F., Benton, C. P., Penton-Voak, I. S., & Munafò, M. R.
(2009). Effects of alcohol consumption and alcohol expectancy on the
categorisation of perceptual cues of emotional expression.
Psychopharmacology, 204, 327-334. doi:10.1007/s00213-009-1463-1
Babbage, D. R., Yim, J., Zupan, B., Neumann, D., Tomita, M. R., & Willer, B.
(2011). Meta-analysis of facial affect recognition difficulties after traumatic
brain injury. Neuropsychology, 25, 277. doi:10.1037/a0021908
Barco, P. P., Crosson, B., Bolesta, M. M., Werts, D., & Stout, R. (1991). Training
awareness and compensation in postacute head injury rehabilitation. In J.S.
Kreutzer, & P. H. Wehman (Eds.), Cognitive rehabilitation for persons with
Page 56
47
traumatic brain injury: A functional approach. (pp. 129-146) Paul H.
Brookes Publishing, Baltimore, MD. Retrieved fromhttp://ezproxy.
utas.edu.au/login?url=ht tp://search.proquest.com/docview/61805
0020?accountid=14245
Bramham, J., Morris, R., Hornak, J., Bullock, P., & Polkey, C. (2009). Social and
emotional functioning following bilateral and unilateral neurosurgical
prefrontal cortex lesions. Journal of Neuropsychology, 3, 125-143.
doi:10.1348/174866408X293994
Breiter, H. C., Etcoff, N. L., Whalen, P. J., Kennedy, W. A., Rauch, S. L., Buckner,
R. L., . . . Rosen, B. R. (1996). Response and habituation of the human
amygdala during visual processing of facial expression. Neuron, 17, 875-887.
doi:10.1016/S0896-6273(00)80219-6
Brewer, N., & Wells, G. L. (2006). The confidence-accuracy relationship in
eyewitness identification: effects of lineup instructions, foil similarity, and
target-absent base rates. Journal of Experimental Psychology: Applied, 12,
11. doi:10.1037/1076-898X.12.1.11
Calder, A. J., Lawrence, A. D., & Young, A. W. (2001). Neuropsychology of fear
and loathing. Nature Reviews Neuroscience, 2, 352-363. doi:10.1028/
35072584
Carton, J. S., Kessler, E. A., & Pape, C. L. (1999). Nonverbal decoding skills and
relationship well-being in adults. Journal of Nonverbal Behavior, 23, 91-100.
doi:10.1023/A:1021339410262
Cohen, J. (1992). A power primer. Psychological bulletin, 112, 155.
doi:10.1037/0033-2909.112.1.155
Cooper, M. L., Frone, M. R., Russell, M., & Mudar, P. (1995). Drinking to regulate
Page 57
48
positive and negative emotions: a motivational model of alcohol use. Journal
of personality and social psychology, 69, 990-1005. doi:10.1037/0022-
3514.69.5.990
Croker, V., & McDonald, S. (2005). Recognition of emotion from facial expression
following traumatic brain injury. Brain Injury, 19, 787-799.doi:10.1080/026
99050500110033
Davidson, R. J. (1992). Emotion and affective style: Hemispheric substrates.
Psychological science, 3, 39-43. doi:10.1111/j.1467-9280.1992.tb00254.x
Davidson, R. J., & Fox, N. A. (1982). Asymmetrical brain activity discriminates
between positive and negative affective stimuli in human infants. Science,
218, 1235-1237. doi:10.1126/science.7146906
Davis, M., Walker, D. L., Miles, L., & Grillon, C. (2010). Phasic vs sustained fear in
rats and humans: role of the extended amygdala in fear vs anxiety.
Neuropsychopharmacology, 35, 105-135. doi:10.1038/npp.2009.109
Dry, M. J., Burns, N. R., Nettelbeck, T., Farquharson, A. L., & White, J. M. (2012).
Dose-related effects of alcohol on cognitive functioning. PloS one, 7, e50977.
doi:10.1371/journal.pone.0050977
Enders, C. K. (2011). Analyzing longitudinal data with missing values.
Rehabilitation Psychology, 56, 267. doi:10.1037/a0025579
Fals-Stewart, W. (2003). The occurrence of partner physical aggression on days of
alcohol consumption: a longitudinal diary study. Journal of consulting and
clinical psychology, 71, 41. doi: 10.1037/0022-006X.71.1.41
Faul, F., Erdfelder, E., Lang, A.-G., & Buchner, A. (2007). G* Power 3: A flexible
statistical power analysis program for the social, behavioral, and biomedical
sciences. Behavior research methods, 39, 175-191. doi:10.3758/BF03193146
Page 58
49
Fillmore, M. T., & Vogel-Sprott, M. (1999). An alcohol model of impaired inhibitory
control and its treatment in humans. Experimental and Clinical
Psychopharmacology, 7, 49-55. doi:10.1037/1064-1297.7.1.49
Fillmore, M. T., & Vogel-Sprott, M. (2000). Response inhibition under alcohol:
effects of cognitive and motivational conflict. Journal of studies on alcohol,
61, 239-246. doi:10.15288/jsa.2000.61.239
Haxby, J. V., Hoffman, E. A., & Gobbini, M. I. (2002). Human neural systems for
face recognition and social communication. Biological psychiatry, 51, 59-67.
doi:10.1016/S0006-3223(01)01330-0
Hellige, J. B. (1993). Hemispheric asymmetry: What's right and what's left (Vol. 6).
Harvard University Press.
Hoaken, P. N., & Stewart, S. H. (2003). Drugs of abuse and the elicitation of human
aggressive behavior. Addictive behaviors, 28, 1533-1554.
doi:10.1016/j.addbeh.2003.08.033
Honan, C. A., McDonald, S., Sufani, C., Hine, D. W., & Kumfor, F. (2016). The
awareness of social inference test: development of a shortened version for use
in adults with acquired brain injury. The Clinical Neuropsychologist, 30, 243-
264. doi:10.1080/13854046.2015.1136691
Hornak, J., Rolls, E., & Wade, D. (1996). Face and voice expression identification in
patients with emotional and behavioural changes following ventral frontal
lobe damage. Neuropsychologia, 34, 247-261. doi:10.1016/0028-
3932(95)00106-9
Howie, P., & Roebers, C. M. (2007). Developmental progression in the confidence‐
accuracy relationship in event recall: insights provided by a Calibration
Page 59
50
perspective. Applied Cognitive Psychology, 21, 871-893.
doi:10.1002/acp.1302
Kamboj, S. K., Joye, A., Bisby, J. A., Das, R. K., Platt, B., & Curran, H. V. (2013).
Processing of facial affect in social drinkers: a dose–response study of alcohol
using dynamic emotion expressions. Psychopharmacology, 227, 31-39.
doi:10.1007/s00213-012-2940-5
Kano, M., Gyoba, J., Kamachi, M., Mochizuki, H., Hongo, M., & Yanai, K. (2003).
Low doses of alcohol have a selective effect on the recognition of happy
facial expressions. Human Psychopharmacology: Clinical and Experimental,
18, 131-139. doi:10.1002/hup.440
Kee, K. S., Green, M. F., Mintz, J., & Brekke, J. S. (2003). Is emotion processing a
predictor of functional outcome in schizophrenia? Schizophrenia bulletin, 29,
487. doi:10.1016/j.schres.2012.01.023
Kessler, R. C., Andrews, G., Colpe, L. J., Hiripi, E., Mroczek, D. K., Normand, S.-
L., . . . Zaslavsky, A. M. (2002). Short screening scales to monitor population
prevalences and trends in non-specific psychological distress. Psychological
medicine, 32, 959-976. doi:10.1017/S0033291702006074
Kohler, C. G., Turner, T. H., Bilker, W. B., Brensinger, C. M., Siegel, S. J., Kanes, S.
J., . . . Gur, R. C. (2003). Facial emotion recognition in schizophrenia:
intensity effects and error pattern. American Journal of Psychiatry, 160,
1768-1774. doi:10.1176/appi.ajp.160.10.1768
Kornreich, C., Blairy, S., Philippot, P., Hess, U., Noël, X., Streel, E., . . . Verbanck,
P. (2001). Deficits in recognition of emotional facial expression are still
present in alcoholics after mid-to long-term abstinence. Journal of studies on
alcohol, 62, 533-542. doi:10.15288/jsa.2001.62.533
Page 60
51
Kreibig, S. D. (2010). Autonomic nervous system activity in emotion: A review.
Biological psychology, 84, 394-421. doi:10.1016/j.biopsycho.2010.03.010
Kumfor, F., Irish, M., Hodges, J. R., & Piguet, O. (2013). Discrete neural correlates
for the recognition of negative emotions: insights from frontotemporal
dementia. PloS one, 8, e67457. doi:10.1371/journal.pone.0067457
Loeber, S., & Duka, T. (2009). Acute alcohol impairs conditioning of a behavioural
reward‐seeking response and inhibitory control processes—implications for
addictive disorders. Addiction, 104, 2013-2022.doi:10.1371/journal
.pone.0067457
Martin, C. S., Earleywine, M., Musty, R. E., Perrine, M., & Swift, R. M. (1993).
Development and validation of the biphasic alcohol effects scale. Alcoholism:
Clinical and Experimental Research, 17, 140-146. doi:10.1111/j.1530-
0277.1993.tb00739.x
Maurage, P., Campanella, S., Philippot, P., Martin, S., & De Timary, P. (2008). Face
processing in chronic alcoholism: a specific deficit for emotional features.
Alcoholism: Clinical and Experimental Research, 32, 600-606.
doi:10.1111/j.1530-0277.2007.00611.x
Meneses‐Gaya, C., Zuardi, A. W., Loureiro, S. R., Hallak, J. E., Trzesniak, C., de
Azevedo Marques, J. M., . . . Crippa, J. A. (2010). Is the full version of the
AUDIT really necessary? Study of the validity and internal construct of its
abbreviated versions. Alcoholism: Clinical and Experimental Research, 34,
1417-1424. doi:10.1111/j.1530-0277.2010.01225.x
Montagne, B., Kessels, R. P., De Haan, E. H., & Perrett, D. I. (2007). The emotion
recognition task: A paradigm to measure the perception of facial emotional
Page 61
52
expressions at different intensities. Perceptual and motor skills, 104, 589-598.
doi:10.2466/pms.104.2.589-598
Padula, C. B., Simmons, A. N., Matthews, S. C., Robinson, S. K., Tapert, S. F.,
Schuckit, M. A., & Paulus, M. P. (2011). Alcohol attenuates activation in the
bilateral anterior insula during an emotional processing task: a pilot study.
Alcohol and alcoholism, 46, 547-552. doi:10.1093/alcalc/agr066
Palmer, M. A., Brewer, N., Weber, N., & Nagesh, A. (2013). The confidence-
accuracy relationship for eyewitness identification decisions: Effects of
exposure duration, retention interval, and divided attention. Journal of
Experimental Psychology: Applied, 19, 55. doi:10.1037/a0031602
Parsons, O. A. (1998). Neurocognitive deficits in alcoholics and social drinkers: a
continuum? Alcoholism: Clinical and Experimental Research, 22, 954-961.
doi:10.1111/j.1530-0277.1998.tb03895.x
Pearson. (2009). Advanced Clinical Solutions for WAIS-IV and WMS-IV
Administration and Scoring Manual San Antonio: The Psychological
Corporation.
Philippot, P., Kornreich, C., Blairy, S., Baert, I., Dulk, A. D., Bon, O. L., . . .
Verbanck, P. (1999). Alcoholics’ deficits in the decoding of emotional facial
expression. Alcoholism: Clinical and Experimental Research, 23, 1031-1038.
doi:10.1111/j.1530-0277.1999.tb04221.x
Phillips, M. L., Drevets, W. C., Rauch, S. L., & Lane, R. (2003). Neurobiology of
emotion perception I: The neural basis of normal emotion perception.
Biological psychiatry, 54, 504-514. doi:10.1111/j.1530-0277.1999.tb04221.x
Phillips, M. L., Williams, L., Senior, C., Bullmore, E. T., Brammer, M. J., Andrew,
C., . . . David, A. S. (1999). A differential neural response to threatening and
Page 62
53
non-threatening negative facial expressions in paranoid and non-paranoid
schizophrenics. Psychiatry Research: Neuroimaging, 92, 11-31.
doi:10.1016/S0925-4927(99)00031-1
Pilgrim, J. L., Gerostamoulos, D., & Drummer, O. H. (2014). “King hit” fatalities in
Australia, 2000–2012: The role of alcohol and other drugs. Drug and alcohol
dependence, 135, 119-132. doi:10.1016/j.drugalcdep.2013.11.019
Ponsford, J. L., Olver, J., & Curran, C. (1995). A profile of outcome: 2 years after
traumatic brain injury. Brain Injury, 9, 1-10.
doi:10.3109/02699059509004565
Radice-Neumann, D., Zupan, B., Babbage, D. R., & Willer, B. (2007). Overview of
impaired facial affect recognition in persons with traumatic brain injury.
Brain Injury, 21, 807-816. doi:10.1080/02699050701504281
Repeiski, J., Smith, M., Sansom, I., & Repetski, J. (1996). A differential neural
response in the human amygdala to fearful and happy facial expressions.
Nature, 383, 812-815. doi:10.1038/383812a0
Rosenberg, H., McDonald, S., Dethier, M., Kessels, R. P., & Westbrook, R. F.
(2014). Facial emotion recognition deficits following moderate–severe
traumatic brain injury (TBI): Re-examining the valence effect and the role of
emotion intensity. Journal of the International Neuropsychological Society,
20, 994-1003. doi:10.1017/S1355617714000940
Saunders, J. B., Aasland, O. G., Babor, T. F., De la Fuente, J. R., & Grant, M.
(1993). Development of the alcohol use disorders identification test
(AUDIT): WHO collaborative project on early detection of persons with
harmful alcohol consumption‐II. Addiction, 88, 791-804. doi:10.1111/j.1360-
0443.1993.tb02093.x
Page 63
54
Saze, T., Hirao, K., Namiki, C., Fukuyama, H., Hayashi, T., & Murai, T. (2007).
Insular volume reduction in schizophrenia. European archives of psychiatry
and clinical neuroscience, 257, 473-479. doi:10.1007/s00406-007-0750-2
Sobell, M. B., Sobell, L. C., Klajner, F., Pavan, D., & Basian, E. (1986). The
reliability of a timeline method for assessing normal drinker college students'
recent drinking history: Utility for alcohol research. Addictive behaviors, 11,
149-161. doi:10.1016/0306-4603(86)90040-7
Sprengelmeyer, R., Young, A. W., Calder, A. J., Karnat, A., Lange, H., Hömberg, V.,
. . . Rowland, D. (1996). Loss of disgust. Brain, 119, 1647-1665.
doi:10.1093/brain/119.5.1647
Sripada, C. S., Angstadt, M., McNamara, P., King, A. C., & Phan, K. L. (2011).
Effects of alcohol on brain responses to social signals of threat in humans.
Neuroimage, 55, 371-380. doi:10.1016/j.neuroimage.2010.11.062
Streit, M., Ioannides, A., Liu, L., Wölwer, W., Dammers, J., Gross, J., . . . Müller-
Gärtner, H.-W. (1999). Neurophysiological correlates of the recognition of
facial expressions of emotion as revealed by magnetoencephalography.
Cognitive Brain Research, 7, 481-491. doi:10.1016/S0926-6410(98)00048-2
Toglia, J., & Kirk, U. (2000). Understanding awareness deficits following brain
injury. NeuroRehabilitation, 15, 57-70. Retrieved fromhttp://content.io
spress.com/
Tucker, J. A., & Vuchinich, R. E. (1983). An information processing analysis of the
effects of alcohol on perceptions of facial emotions. Psychopharmacology,
79, 215-219. doi:10.1007/BF00427815
Turner, B. M., Paradiso, S., Marvel, C. L., Pierson, R., Ponto, L. L. B., Hichwa, R.
D., & Robinson, R. G. (2007). The cerebellum and emotional experience.
Page 64
55
Neuropsychologia, 45, 1331-1341. doi:10.1016/j.ne uropsychologia.2
006.09.023
Uekermann, J., & Daum, I. (2007). Social cognition in alcoholism. International
Journal on Disability and Human Development, 6, 143-148. doi:10.1515/I
JDHD.2007.6.2.143
Uekermann, J., & Daum, I. (2008). Social cognition in alcoholism: a link to
prefrontal cortex dysfunction? Addiction, 103, 726-735. doi:10.1111/j.1360-
0443.2008.02157.x
Valmas, M. M., Mosher Ruiz, S., Gansler, D. A., Sawyer, K. S., & Oscar‐Berman,
M. (2014). Social cognition deficits and associations with drinking history in
alcoholic men and women. Alcoholism: Clinical and Experimental Research,
38, 2998-3007. doi:10.1111/acer.12566
Walter, N. T., Mutic, S., Markett, S., Montag, C., Klein, A. M., & Reuter, M. (2011).
The influence of alcohol intake and alcohol expectations on the recognition of
emotions. Alcohol and alcoholism, 46, 680-685. doi:10.1093/alcalc/agr082
Weber, N., & Brewer, N. (2004). Confidence-accuracy calibration in absolute and
relative face recognition judgments. Journal of Experimental Psychology:
Applied, 10, 156. doi:10.1037/1076-898X
Yaniv, I., Yates, J. F., & Smith, J. K. (1991). Measures of discrimination skill in
probabilistic judgment. Psychological bulletin, 110, 611. doi:10.1037/0033-
2909.110.3.611
Page 65
56
Appendix A Ethics Approval
Page 67
58
Appendix B Participant Recruitment Flyer
Page 68
59
Appendix C Follow-up Screening Interview
Introduction to the Study and Screening
I am following up your expression of interest in the research examining alcohol
and social cognition. Are you still interested in participating in the research?
To give you a quick summary of the research, your participation will involve
attending a one 100 minute session, however you may be required to remain with the
researchers 3 hours to ensure you return to a baseline blood alcohol reading before
leaving. In the session, you may or may not be administered alcohol; you won’t be
informed of the beverage type administered in each session until the end of your
participation. You will be asked to complete some non-computer-based and
computer-based tests of cognition. You will also rate your level of intoxication.
Blood alcohol concentration will be measured throughout the session. KHA11/112
participants will receive 3 hours of course credit for their participation. Non-
KHA111/112 participants will receive a movie ticket in appreciation of their time.
Do you have any initial questions about the research?
Do you mind if I ask you a few quick questions to check your eligibility for
participating in the study? Review the answers provided in the initial online screen.
Inform the participant that all information will be kept confidential and this
screening questionnaire will be securely destroyed at the conclusion of your
participation.
Specification of Study Restrictions
I would just like to ask you a few extra questions to ensure you will be able to
complete the study. (Exclude if answer no to any of the following questions).
Will you be able to attend one 100 minute session held within the
Discipline of Psychology at the Launceston campus of the University of
Tasmania and conducted between 9:00am and 7:00pm?
Y / N
Are you willing to remain in the laboratory until your blood alcohol
concentration equals 0.03% or less on two consecutive occasions
measured 15 minutes apart? This may mean being the laboratory for
around 3 hours in total? Y / N
Are you willing to drink up to six standard alcoholic drinks in the
session? Y / N
In order to ensure participants enter each experimental session with the
same level of alcohol, caffeine and food in the stomach, we ask that
participants abstain from food for 4 hours, caffeine for 8 hours and alcohol
and over-the-counter medication for 24 hours prior to each session. We
also ask that participants abstain from illicit drugs for the duration of the
study. Participants are also required to eat 2 slices of toast with spread of
Page 69
60
choice 1 hour prior to the session. This will be available from the
researchers if required. Prior to fasting a light meal devoid of high fat and
dairy is advised (e.g., a sandwich). Will you be willing to abstain from
food, alcohol, caffeine, and illicit drugs for the specified durations? Y / N
Thank you for answering all the questions. Do you have any further questions about
the research? (Note any concerns __________________________________)
I will email you some information about what to do before attending an experimental
sessions. I will also send you instructions and a map to assist in finding the
laboratory.
Do you have any preferred days for completing the experimental session?
□ Monday
□ Tuesday □ Wednesday □ Thursday □ Friday □ Saturday
□ Sunday Do you have a time and day that would be convenient to come and complete the
session?
Date: / / Time:
I will send you a reminder the day before the session. Would you prefer me to
call/text/email the day before to confirm your session?
call/text/email (circle)
Mobile: ………………………
email: ……………………..
** Emailed pre-session instructions to the participant: YES / NO (circle)
Page 70
61
Appendix D Participant Information Sheet
School of Psychology
University of Tasmania
Information Sheet
The Impact of Alcohol Consumption on Social Ability
April 2016
Introduction
You are invited to participate in an experiment examining the effect of alcohol on
social ability. The research is being conducted by Miss Emma Johnson and Miss Sarah
Skromanis in partial fulfilment of the requirements of an Honours degree at the
University of Tasmania. Emma and Sarah are being supervised by Dr Cynthia Honan, a
Clinical Neuropsychologist and Lecturer from the Discipline of Psychology, School of
Medicine, University of Tasmania. The researchers can be contacted as follows: Emma
Johnson ([email protected] ; Ph: 03 6324 3266); Sarah Skromanis
([email protected] ; Ph: 03 6324 3266); Dr Cynthia Honan
([email protected] ; Ph: 03 6324 3266).
What is the purpose of the study? The purpose of this study is to investigate how alcohol interferes with social ability.
Emotion perception and theory of mind ability (ability to understand the thoughts and
behaviours of others), and the ability to inhibit automatic social responding will be
specifically examined. These abilities will be assessed using cognitive tasks.
Who can participate? We are seeking participants who are:
Aged 18-35 years
Speak and read fluent English
Completed Year 10 or equivalent
Normal or corrected-to-normal vision
Healthy (no history of significant neurological disorder or current psychiatric
disorder, significant intellectual disorder, alcohol/drug dependence, regular tobacco
use, or chronic health problems)
Regular alcohol consumers (minimum consumption of 2 standard alcoholic drinks
on one occasion in the preceding month)
Not currently using illicit drugs (i.e. use in the past six months)
Page 71
62
Not taking prescription medication (contraceptive medication allowed)
Able to attend the Newnham campus of the University of Tasmania for 3 hours
between 9am and 7pm (session lengths are an estimate only).
What does participation in the study involve?
This research will be conducted in Buildings O and N at the Newnham Campus,
University of Tasmania. Interested individuals will complete some online screening
questionnaires that will ask for your demographic details (e.g., age, sex, education),
height and weight (to calculate Body Mass Index), medical history, psychological
functioning, and use of alcohol. Eligible participants will be contacted to attend the
Newnham campus for an experimental session conducted between 9am and 7pm.
Experimental sessions:
At the beginning of the session participants will consume a 150ml beverage before
completing questionnaires asking about alcohol intake in the previous month and
current mood, and brief cognitive tasks assessing basic emotion perception and
inhibition ability. Participants will then be asked to consume a 750ml beverage that
will contain either a placebo or alcohol. Alcohol administered will be a maximum of 6
standard alcoholic drinks. Participants will not be informed of the beverage content
administered in each session until the conclusion of the session.
After consuming the beverage, participants will be asked to complete one emotion
recognition task, two computerised laboratory tasks assessing motor responses and
inhibition ability, and one social disinhibition task. A breathalyser will be used to
monitor participants’ breath alcohol concentration throughout the duration of the study.
Throughout testing, participants will also be asked to complete several scales assessing
their feeling of intoxication and impairment.
While it is estimated that the experimental tasks will take approximately 100 minutes
to complete, some participants may be required to remain in the laboratory for a total
of 3 hours to ensure each participant records two consecutive breath alcohol readings
of .03% or less (.00% for Provisional licence holders intending to drive). These times
are an estimate only as individual rates of alcohol absorption and elimination may
vary. Participants will be debriefed regarding the order of dose administration at the
conclusion the session.
What are the restrictions regarding participating? Participants will be asked to fast from food for 4 hours prior to each experimental
session, although we ask that participants consume two slices of toast with their choice
of spread 60 minutes prior to the session. Toast will be available from the researchers
if required. Prior to fasting, a standard light meal devoid of high-fat or dairy products
(e.g., a sandwich) is advised.
Participants will be asked to abstain from caffeine for 8 hours and alcohol and over-
the-counter medication for 24 hours prior to each session. Participants will be asked to
abstain from illicit drugs and tobacco for the duration of participation.
At the end of each session, participants will remain at leisure (with food and
entertainment provided) until they attain two consecutive breathalyser recordings of
Page 72
63
0.03% or less measured 15 minutes apart. Participants holding their provisional driver
licence, who are intending to drive will be required to remain in the laboratory until
two consecutive BrAC measurements are recorded at .00%. Participants holding their
provisional licence who are not intending to drive, will be able to leave the laboratory
at .03% BrAC if they sign a declaration in which they agree to be escorted by a
nominated guardian to their place of residence and accompanied for a two hour period
following session completion. The nominated guardian must be an adult aged 18 years
or older who: (i) holds their provisional or full driver licence (ii) directly collects the
participant from the research premises and meets the researcher in-person, and (iii)
signs a declaration agreeing to escort the participant directly to their place of residence
and accompany the participant for the two hour period following session completion.
The researcher reserves the right to retain participants in the laboratory until .03%
BrAC for those holding their full driver licence and .00% BrAC for those holding their
provisional licence when it is deemed unsafe for the participant to leave at .03% BrAC.
What are the benefits of participating?
Your participation will help us enhance our knowledge of the effects of alcohol on
social ability, and specifically, the mechanisms underlying social disinhibition, theory
of mind and emotion perception. This knowledge can be used to educate people
regarding the potential outcomes of alcohol intoxication on social functioning and will
inform further research that aims to investigate alcohol related social difficulties.
What are the risks associated with participating?
There are no anticipated risks of this research. However, if in the unlikely event you
experience negative side-effects, please inform the experimenter and the necessary
assistance will be sought and provided. We ask that participants refrain from
consuming alcohol or operating heavy machinery for four hours post-session.
Is there any reimbursement for participation?
Students of the University of Tasmania who are undertaking KHA111/112 unit will
receive three hours of research participation credit for their time. Participants who are
not undertaking KHA111/112 units will receive a Village Cinemas movie ticket as
recompense for their time. Participants who do not complete the full schedule of
sessions will not receive a movie ticket, unless withdrawal is necessary due to an
unexpected adverse physiological reaction to the investigatory products.
How do I volunteer to participate? What if I want to withdraw from
participating? Participation in this study is voluntary. By signing the attached consent
form, you are indicating that you are aware of the nature of the study and wish to
participate. While we would be pleased to have you participate, we respect your right
to decline. There will be no consequences to you if you decide not to participate. If you
decide to discontinue participation at any time, you may do so without providing an
explanation. However, you will be required to remain in the laboratory until your
breath alcohol concentration measurement equals 0.03% or less on two separate
occasions measured 15 minutes apart.
What will happen to the information I provide?
All information collected will be kept confidential. Each participant will be assigned a
treatment code and individual participant data will be identifiable only by that code.
Page 73
64
All of the data will be stored on password protected secure computers or in a locked
cabinet in the Department of Psychology, School of Medicine for a minimum of five
years after the publication of any academic journal articles, at which point all
questionnaires will be destroyed using a paper shredder and electronic data will be
deleted. The screening questionnaire will be securely destroyed immediately on
completion of the study and that any information provided by the participant on the
questionnaire will be identifiable only by participant number, kept confidential, and
viewed only by the experimenter.
Who do I contact if I have any queries?
If you would like to discuss any aspect of this study please contact Emma Johnson
([email protected] ) or Sarah Skromanis ([email protected] ).
Alternatively, you can contact Dr Cynthia Honan on (03) 6324 3266 or email
[email protected] .
How do I find out the results of the study? A summary of the results will be available on the Research webpage of the Discipline
of Psychology, University of Tasmania
(http://www.utas.edu.au/health/study/psychology). Results of the study can also be
provided by contacting the researchers directly.
Who do I contact if I have a complaint about the study? This study has been approved by the Tasmanian Health and Medical Human Research
Ethics Committee. If you have concerns or complaints about the conduct of this study
should contact the Executive Officer of the HREC (Tasmania) Network on (03) 6226
7479 or email [email protected] . The Executive Officer is the person
nominated to receive complaints from research participants. You will need to quote
H0015633.
Who do I contact if I wish to speak to someone about my alcohol or drug use, or
mental health?
As aforementioned, a number of simple screening questionnaires will be administered
assessing psychological functioning and alcohol and other drug use. Whilst it is not
anticipated that these questionnaires will cause distress, please do not hesitate to let the
researcher know if you do not wish to fill them in. If you are concerned about your
drinking or mental health, please contact the Tasmanian Alcohol Drug Information
Service 1800 811 994 or Lifeline 13 11 14 (both services available 24 hours a day).
Thank you for taking the time to consider this study.
If you wish to take part in it, please sign the attached consent form.
This information sheet is for you to keep.
Page 74
65
Appendix E Participant Consent Form
School of Psychology
University of Tasmania
Consent Form
The Impact of Alcohol Consumption on Social Ability
1. I have read and understood the 'Information Sheet' for this project.
2. The nature and possible effects of the study have been explained to me.
3. I understand that because of my prior participation in eligibility screening
session in which I have completed measures of psychological distress and alcohol
use, as well as reporting my correct demographic data (age, sex, height and weight)
that I am eligible to participate in the study.
4. I understand that I will be asked to abstain from food for 4 hours, caffeine-
containing products for 8 hours, and alcohol and prescription medication for 24 hours
prior to each session, and illicit drugs and tobacco for the duration of the study. I will
be asked to consume a standard meal 60 minutes prior to the experimental session.
5. I will be asked to sign a declaration and complete a breath alcohol
concentration measurement (via a breathalyser) to confirm my abstinence at the start
of each session.
6. I understand that in the experimental session I may be given a maximum of 6
standard alcoholic drinks, and that I will not be informed of the specific contents of
the beverage until the conclusion of testing. I understand that after beverage
consumption, I will be asked to complete a number of computerised laboratory
behavioural performance tasks during which my behavioural responses will be
recorded. I understand that my breath alcohol concentration (as measured via a
breathalyser) will be recorded throughout the session, and that I will be asked about
my perception of my intoxication and level of impairment.
7. I understand that the study involves attending the Newnham campus of the
University of Tasmania (Buildings O and N) for one 100 minute experimental
session.
8. I understand that I will be asked to remain in the laboratory until my blood
alcohol concentration equals 0.03% or less on two occasions measured 15 minutes
apart. This may mean remaining in the laboratory for approximately 3 hours in total.
9. I acknowledge that I have been advised to refrain from drinking alcohol or
operating a vehicle or other heavy machinery for four hours after the end of the
experimental session.
Page 75
66
10. I understand that if I hold a provisional driver licence and I intend to drive I
will be required to remain in the laboratory until my breath alcohol concentration is
.00% on two consecutive occasions. I understand that if I hold a provisional driver
licence and do not intend to drive I will be able to leave the laboratory at .030%
BrAC after signing a declaration in which I agree to be escorted by my nominated
legal adult to my place of residence and be accompanied for a two hour period
following session completion. I understand that the nominated legal guardian must be
an adult aged 18 years or older who: (i) holds their provisional or full driver licence
(ii) directly collects me from the research premises and meets the researcher in-
person, and (iii) signs a declaration agreeing to escort me directly to my place of
residence and accompany me for a two hour period following session completion.
Furthermore, I understand that the researcher reserves the right to retain participants
in the laboratory until .03% BrAC for those holding their full driver licence and .00%
BrAC for those holding their provisional licence when it is deemed unsafe for the
participant to leave at .03% BrAC. I acknowledge that I have been advised to refrain
from drinking alcohol or operating a vehicle or other heavy machinery for four hours
after the end of experimental sessions.
11. I understand that I will be entered into a draw to win one of five double
movie ticket passes for my participation in this study. I understand that if I am a
KHA111/112 student I can opt to be reimbursed up to three hours research
participation credit in addition instead of entering the prize draw. If I withdraw from
the study prior to concluding all sessions I will not be eligible for reimbursement,
unless the withdrawal is due to an unexpected adverse event occurring as a
consequence of ingesting the beverage.
12. I understand that, while there are no anticipated risks associated with this
study, I should inform the experimenter immediately if any unexpected negative
side-effects are experienced. I understand the experimenter will immediately cease
the session and seek the necessary assistance.
13. I understand that the researchers will maintain my confidentiality and that any
information I supply to the researcher(s) will be used only for the purposes of the
research. My data will only be identifiable by an individual numerical participant
code.
14. I understand that the screening questionnaire will be securely destroyed
immediately on completion of the study and that any information I provide on the
questionnaire will be identifiable only by my participant number, kept confidential,
and viewed only by the experimenter.
15. I understand that all research data will be securely stored on the University of
Tasmania premises for at least five years, and will then be securely destroyed when
no longer required.
16. I agree that research data gathered from me for the study may be published
provided that I cannot be identified as a participant.
17. I agree to participate in this investigation and understand that I may withdraw
at any time without any effect, and if I so wish, may request that any data I have
supplied to date be withdrawn from the research.
18. Any questions that I have asked have been answered to my satisfaction.
Page 76
67
Name of Participant:
Signature: Date:
Statement by Investigator
I have explained the project & the implications of participation in it to
this volunteer and I believe that the consent is informed and that he/she
understands the implications of participation
If the Investigator has not had an opportunity to talk to participants prior to
them participating, the following must be ticked.
The participant has received the Information Sheet where my details
have been provided so participants have the opportunity to contact me
prior to consenting to participate in this project.
Name of Investigator:
Signature: Date:
Page 77
68
Appendix F Widmark Equation
Alcohol Dose (mg) = Wρ(C1 + βt)
W Participants body weight (kg),
ρ Distribution of alcohol in the body
C1 target breath alcohol concentration (BrAC; g/100mL),
t Time (Hours)
β Rate of alcohol elimination. Set at 0.015g/100mL/hour.
Note: Final alcohol dose (mg) is divided by 0.8 to achieve a dose in millilitres.
Page 78
69
Appendix G Statistical Output
Demographic Data
Page 81
72
Eligibility Assessments
Page 83
74
Manipulation Checks
BAES Raw Data
Page 88
79
BAES Transformed Data
Page 94
85
Baseline Assessment
Page 95
86
Experimental Assessment
Page 112
103
Raw Calibration Data
Page 117
108
Transformed Calibration Data