University of Mississippi University of Mississippi eGrove eGrove Electronic Theses and Dissertations Graduate School 2019 The Effect of Auditors’ Informal Communication in the Audit The Effect of Auditors’ Informal Communication in the Audit Environment on Financial Reporting Outcomes Environment on Financial Reporting Outcomes Emily K. Hornok University of Mississippi Follow this and additional works at: https://egrove.olemiss.edu/etd Part of the Accounting Commons Recommended Citation Recommended Citation Hornok, Emily K., "The Effect of Auditors’ Informal Communication in the Audit Environment on Financial Reporting Outcomes" (2019). Electronic Theses and Dissertations. 1607. https://egrove.olemiss.edu/etd/1607 This Dissertation is brought to you for free and open access by the Graduate School at eGrove. It has been accepted for inclusion in Electronic Theses and Dissertations by an authorized administrator of eGrove. For more information, please contact [email protected].
Transcript
University of Mississippi University of Mississippi
eGrove eGrove
Electronic Theses and Dissertations Graduate School
2019
The Effect of Auditors’ Informal Communication in the Audit The Effect of Auditors’ Informal Communication in the Audit
Environment on Financial Reporting Outcomes Environment on Financial Reporting Outcomes
Emily K. Hornok University of Mississippi
Follow this and additional works at: https://egrove.olemiss.edu/etd
Part of the Accounting Commons
Recommended Citation Recommended Citation Hornok, Emily K., "The Effect of Auditors’ Informal Communication in the Audit Environment on Financial Reporting Outcomes" (2019). Electronic Theses and Dissertations. 1607. https://egrove.olemiss.edu/etd/1607
This Dissertation is brought to you for free and open access by the Graduate School at eGrove. It has been accepted for inclusion in Electronic Theses and Dissertations by an authorized administrator of eGrove. For more information, please contact [email protected].
THE EFFECT OF AUDITORS’ INFORMAL COMMUNICATION IN THE AUDIT
ENVIRONMENT ON FINANCIAL REPORTING OUTCOMES
A Dissertation presented in partial fulfillment of requirements
for the degree of Doctor of Philosophy in the Patterson School of Accountancy
The University of Mississippi
by
EMILY KATHRYN HORNOK
May 2019
Copyright Emily K. Hornok 2019 ALL RIGHTS RESERVED
ii
ABSTRACT
I examine the effect of auditors’ recurring, informal communication with managers and
other auditors on financial reporting outcomes in a laboratory experiment in which participants
in the roles of auditors and managers interact in a stylized audit setting. My 2×2 between-
subjects design manipulates whether the auditors are able to informally communicate with either,
neither, or both the manager and other auditors. I find that when the auditor and manager
informally communicate, they each develop a social bond, which increases the manager’s feeling
of accountability towards the auditor, causes the manager to make more honest representations to
the auditor, and leads the auditor to assess the manager’s representations as more honest.
Additionally, while the auditor’s informal communication with other auditors creates a social
bond among auditors, this bond neither reduces the strength of the auditor’s bond with the
manager nor reduces the effect of that bond on the auditor’s assessments of the honesty of the
manager’s representations. My study highlights the importance of the social nature of auditing
and its impact on financial reporting outcomes and has implications for practitioners and
regulators.
iii
DEDICATION
To my favorite people, my family.
iv
LIST OF ABBREVIATIONS AND SYMBOLS
ANCOVA Analysis of Covariance
ANOVA Analysis of Variance
AS Auditing Standard
CI Confidence Interval
DF Degrees of Freedom
LLCI Lower Level Confidence Interval
PCAOB Public Company Accounting Oversight Board
PEQ Post-experimental Questionnaire
SE Standard Error
ULCI Upper Level Confidence Interval
US United States
v
ACKNOWLEDGMENTS
Although there is only one name on the front of this project, it would be inappropriate for
me to ever claim that I completed this project on my own. This project has benefitted from the
guidance, suggestions, and encouragement of many, and so I pause to express gratitude to those
who have helped me along the way and allowed me to stand on their shoulders. First, I thank my
dissertation committee: Kendall Bowlin, my chair, Jeremy Griffin, Rachna Prakash, and John
Bentley. You gave me countless hours of your time and shared your expertise with me so that I
could gain the skills necessary to complete my project. You challenge me to push myself further
and to think deeply about my questions. I am grateful for your example of working with
excellence, and I count myself blessed to have had the chance to learn from you. Second, I thank
my fellow doctoral students for the valuable time you gave me to help collect my data, listen to
me hash out my ideas, and provide feedback on the initial drafts of this paper. Third, I thank my
family and friends. I would not have been able to maintain my sanity if it was not for you. You
continually encouraged me to not take life too seriously and step back when I was stressed. You
all are my biggest cheerleaders. Fourth, I am grateful for the investment Mark Wilder and the
Patterson School of Accountancy made in this project and my career. Finally, I would like to
thank my Heavenly Father, who is the whole reason I am here in the first place. To Him be the
glory.
This manuscript has benefitted from the helpful comments of my dissertation committee,
Dereck Barr-Pulliam, Brett Cantrell, Gia Chevis, Brian Goodson, Brandi Holley, Erin Johnson,
vi
Jason MacGregor, Paul Mason, Melanie Millar, Dennis O’Reilly, Jeff Pickerd, Linda Quick,
Josh Simer, and workshop participants at Ball State University, Baylor University, East Carolina
University, the University of Mississippi, 2017 AAA/Deloitte Foundation/J. Michael Cook
Doctoral Consortium, 2018 Accounting Research Roundtable Gathering, 2018 ABO Research
Conference, and 2019 Audit Mid-year Meeting.
vii
TABLE OF CONTENTS
ABSTRACT ............................................................................................................................... ii DEDICATION ...........................................................................................................................iii LIST OF ABBREVIATIONS AND SYMBOLS ........................................................................ iv ACKNOWLEDGMENTS ........................................................................................................... v LIST OF TABLES ..................................................................................................................... ix LIST OF FIGURES .................................................................................................................... x CHAPTER I: INTRODUCTION ................................................................................................ 1 CHAPTER II: BACKGROUND AND HYPOTHESES DEVELOPMENT ................................. 7
Background ........................................................................................................................... 7 Social Identity Theory ........................................................................................................... 8 Communication ..................................................................................................................... 9 Setting ................................................................................................................................. 10 Hypotheses .......................................................................................................................... 15
The Effect of Informal Communication on Manager Decisions ...................................... 15 The Effect of Informal Communication on Auditor Decisions ....................................... 18
CHAPTER III: METHODOLOGY AND DESIGN ................................................................... 22
VITA ...................................................................................................................................... 122
ix
LIST OF TABLES
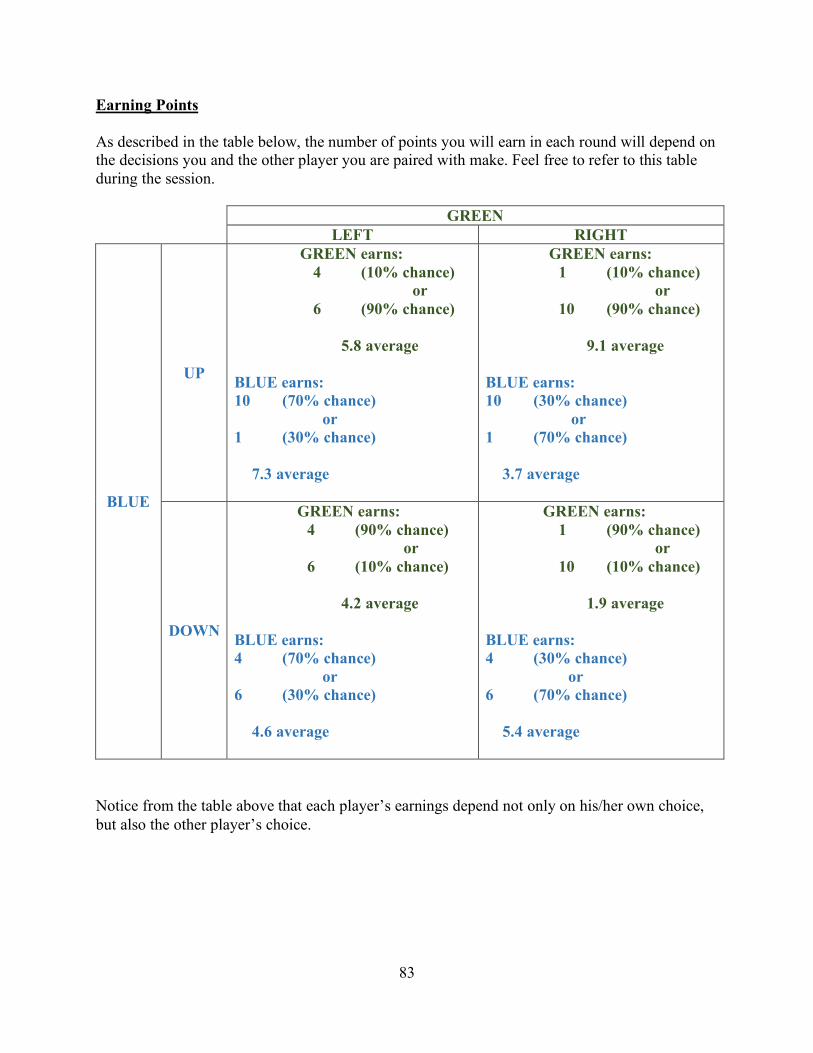
Table 1: Payoff Parameters for the Auditor and Manager Relationship Based on Player Choices and Exogenous Probabilities .......................................................................... 24
Table 2: Descriptive Statistics of Key Variables ........................................................................ 33
Table 3: Analysis of Honesty of Managers’ Representation ....................................................... 40
Table 4: Moderated Serial Mediation Analysis of the Auditor’s Informal Communication with the Manager on the Honesty of Manager's Representation Mediated by the Manager's Social Bond with Auditor and the Manager's Feeling of Accountability to the Auditor, Moderated by the Manager's Knowledge that Auditors Informally Communicate (H1) ...................................................................................................... 44
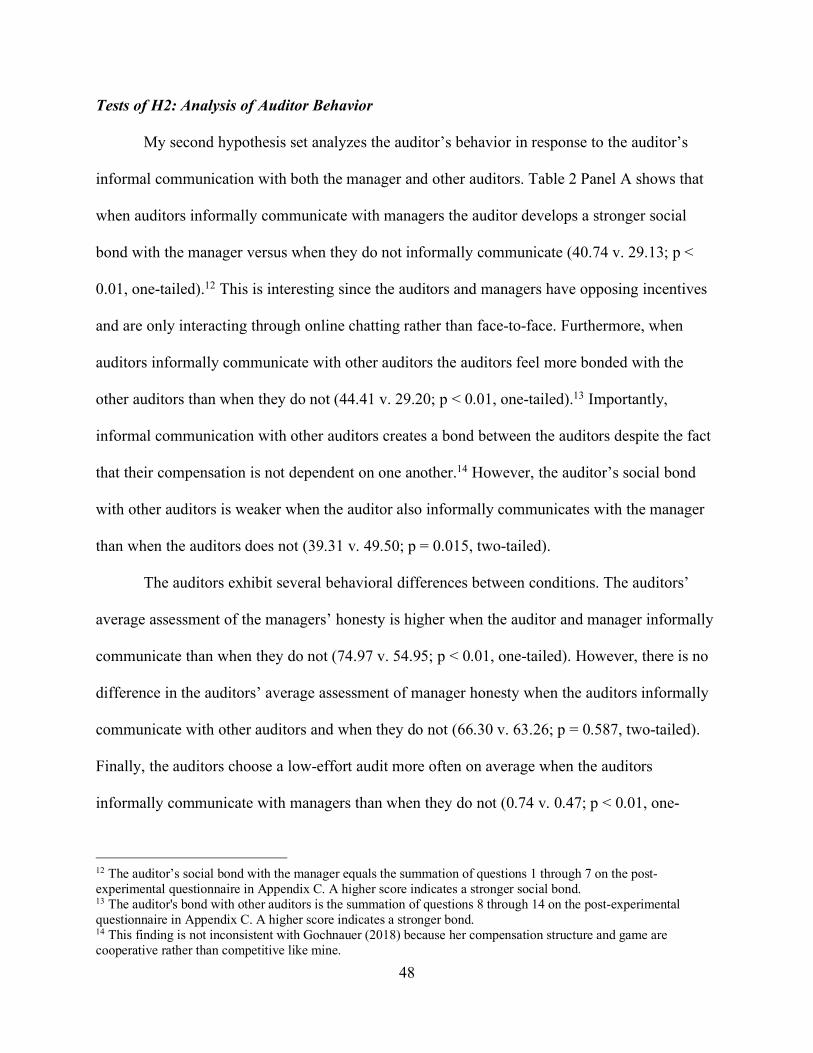
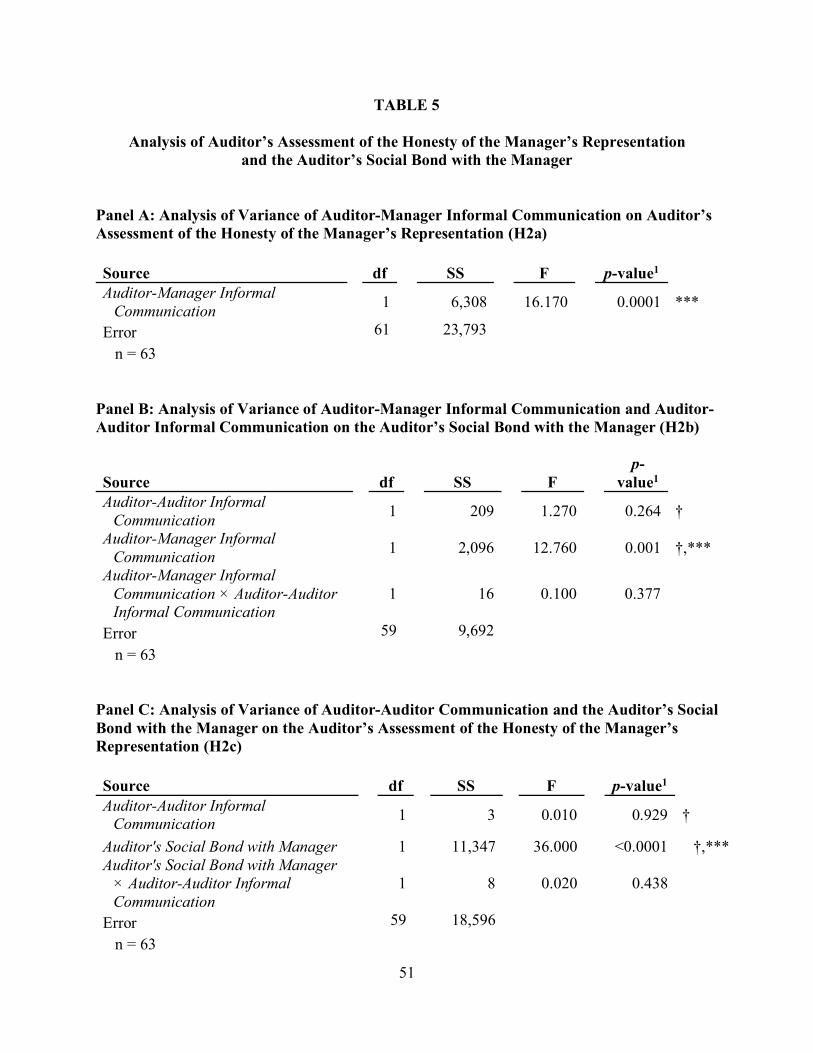
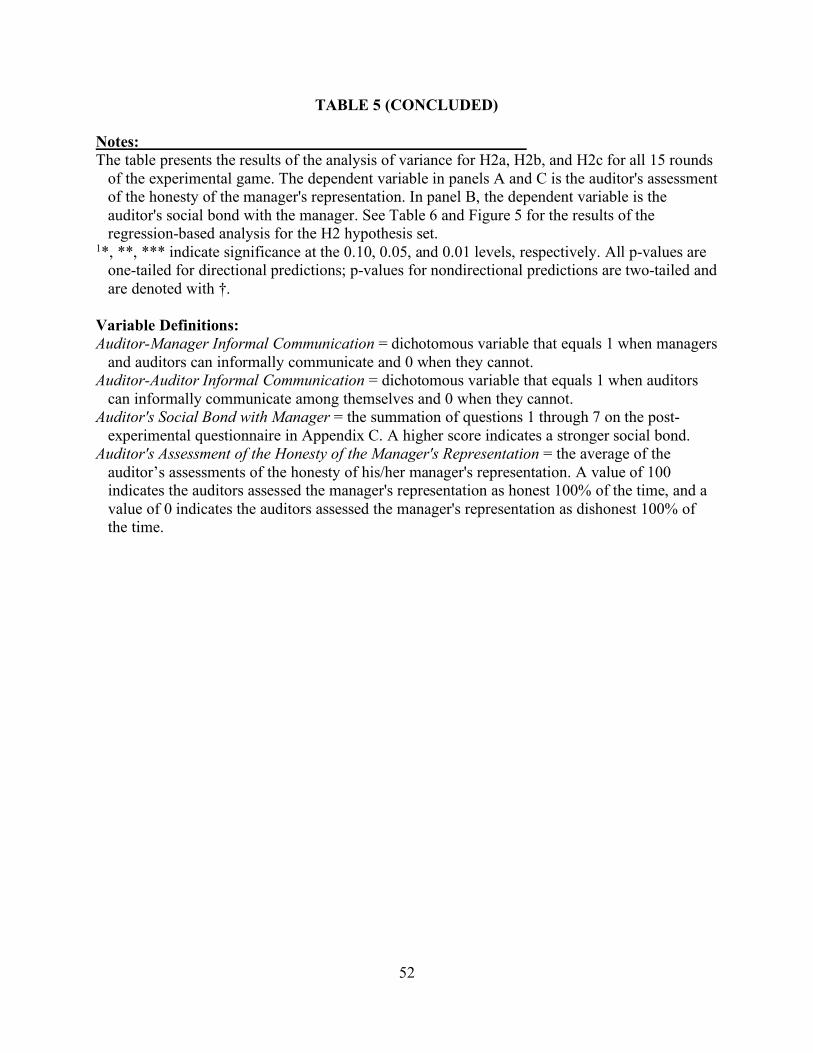
Table 5: Analysis of Auditor’s Assessment of the Honesty of the Manager’s Representation and the Auditor’s Social Bond with the Manager ......................................................... 51
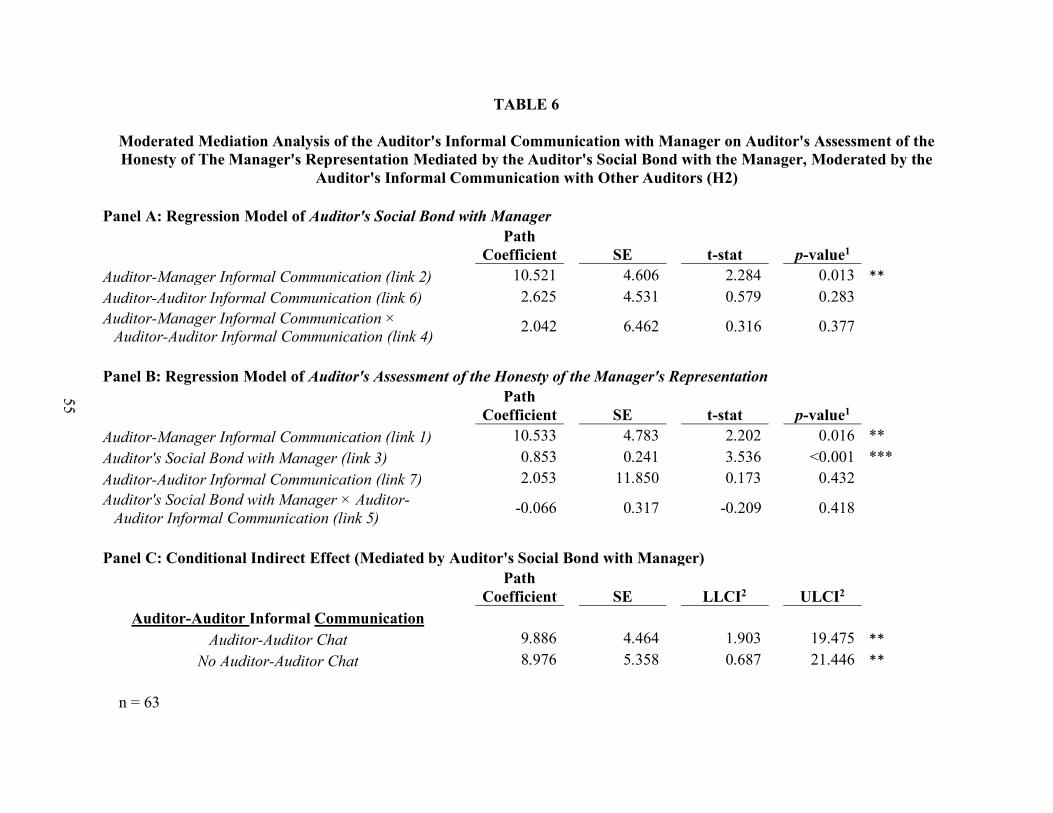
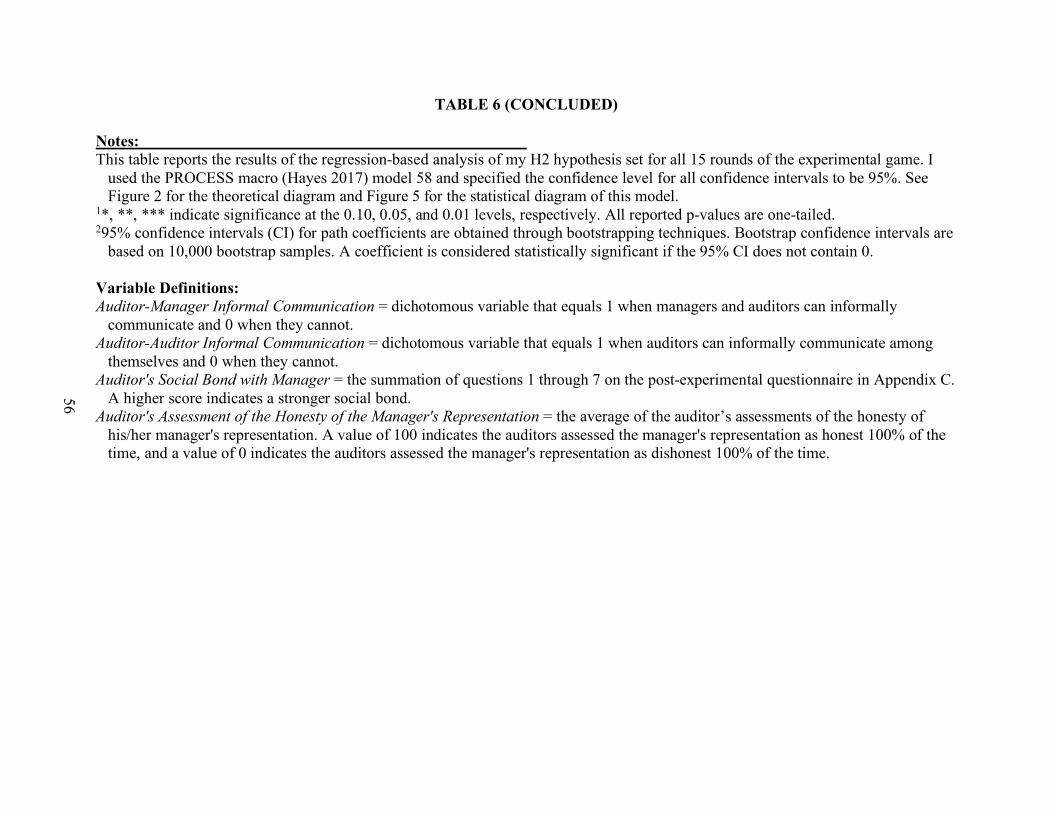
Table 6: Moderated Mediation Analysis of the Auditor's Informal Communication with Manager on Auditor's Assessment of the Honesty of The Manager's Representation Mediated by the Auditor's Social Bond with the Manager, Moderated by the Auditor's Informal Communication with Other Auditors (H2) ..................................... 55
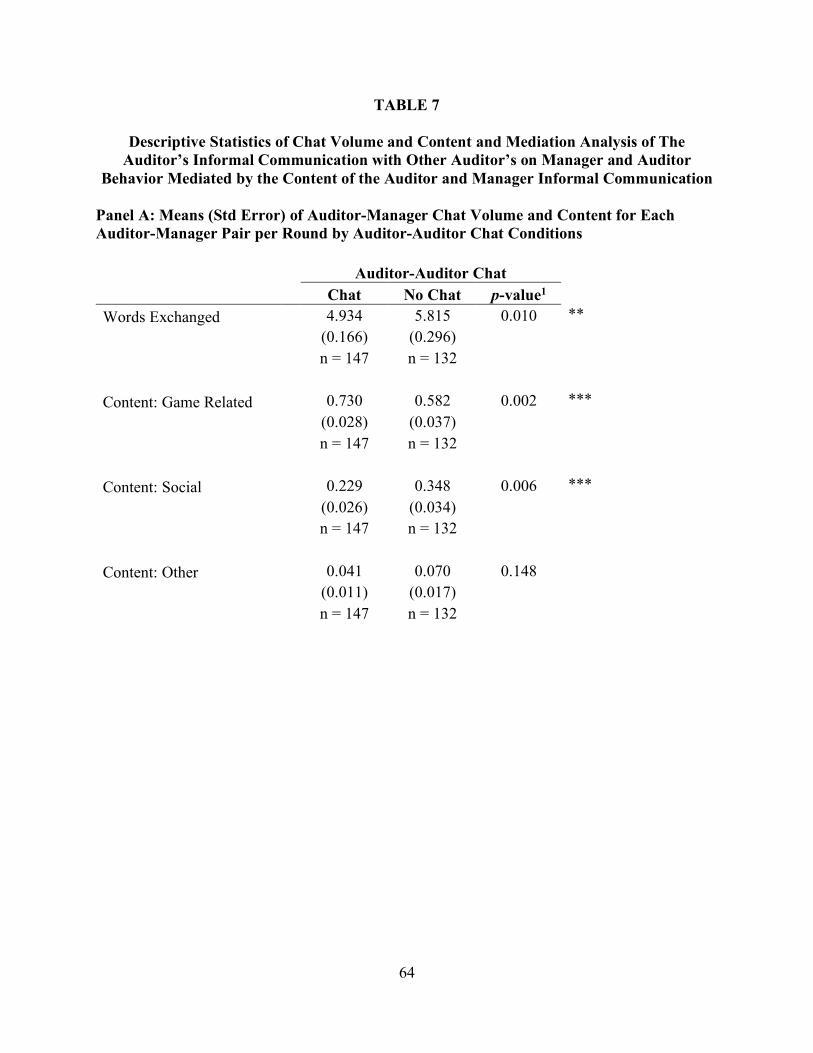
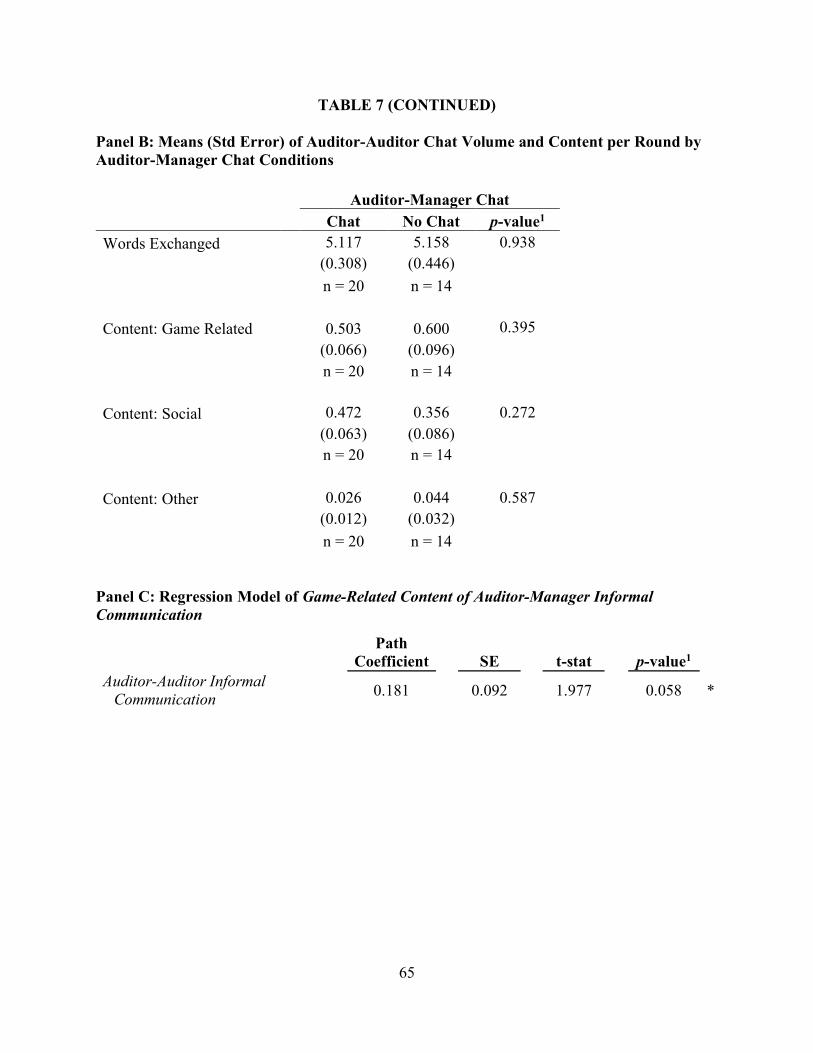
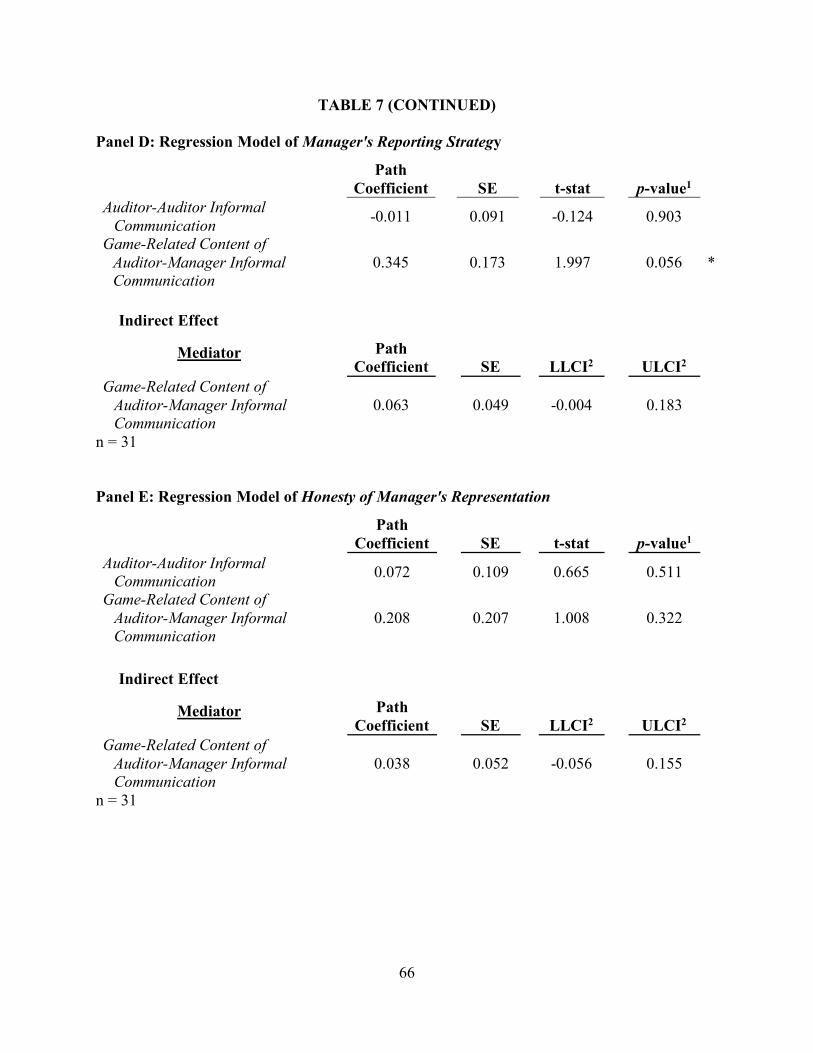
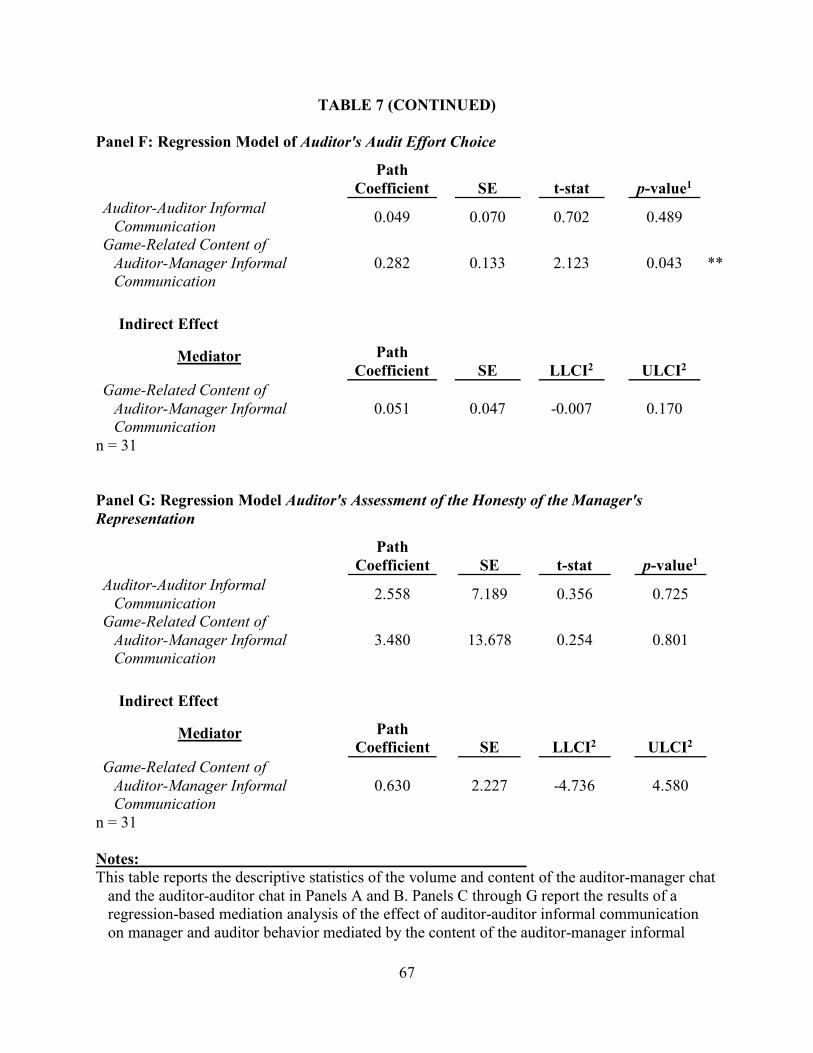
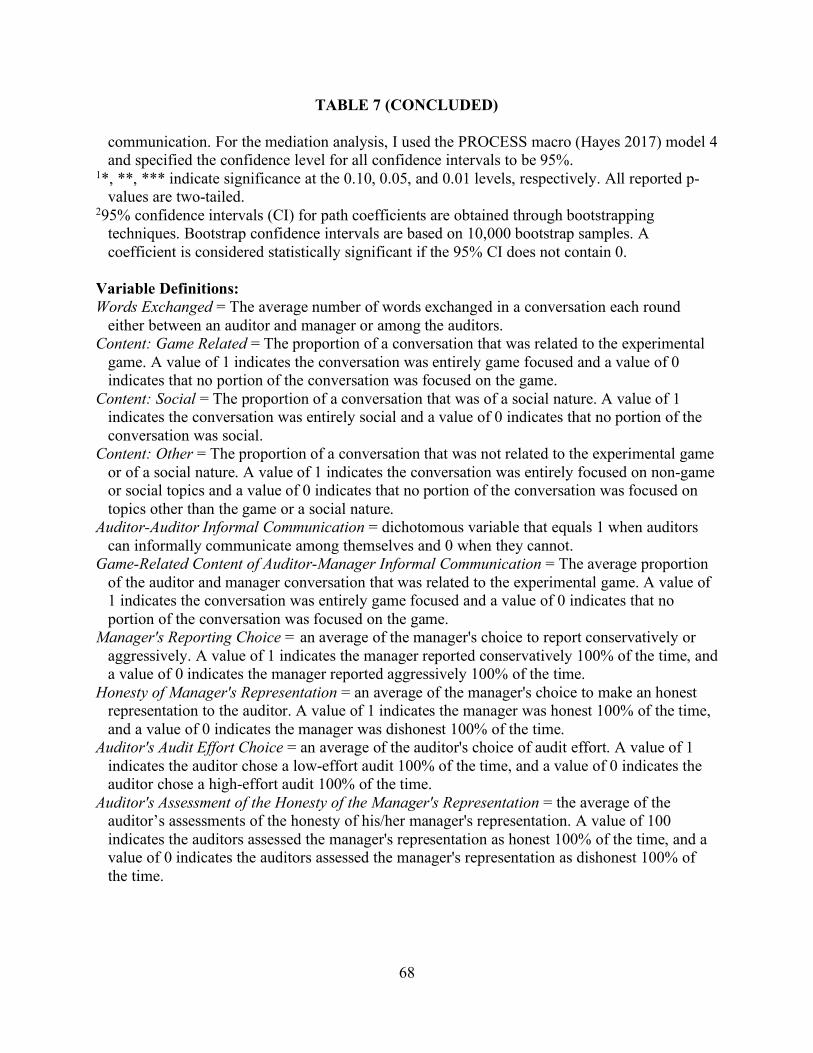
Table 7: Descriptive Statistics of Chat Volume and Content and Mediation Analysis of The Auditor’s Informal Communication with Other Auditor’s on Manager and Auditor Behavior Mediated by the Content of the Auditor and Manager Informal Communication .......................................................................................................... 64
x
LIST OF FIGURES
Figure 1: Process Model for the Effect of the Auditor’s Informal Communication with the Manager on the Honesty of the Manager’s Representation (H1) .................................. 17
Figure 2: Process Model for the Effect of the Auditor’s Informal Communication with the Manager on the Auditor’s Assessments of the Honesty of the Manager’s Representation (H2) .................................................................................................... 21
Figure 3: Progression of Experimental Game ............................................................................ 29
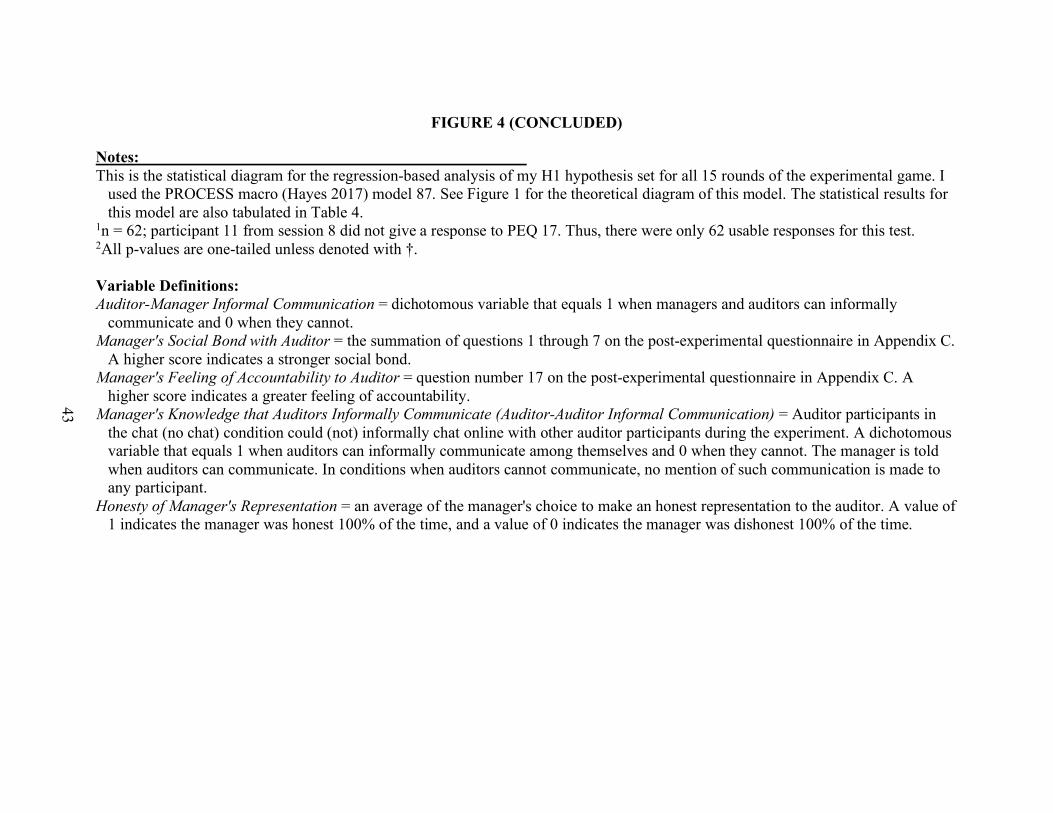
Figure 4: Statistical Diagram for the Effect of the Auditor’s Informal Communication with the Manager on the Honesty of the Manager’s Representation (H1) .................................. 42
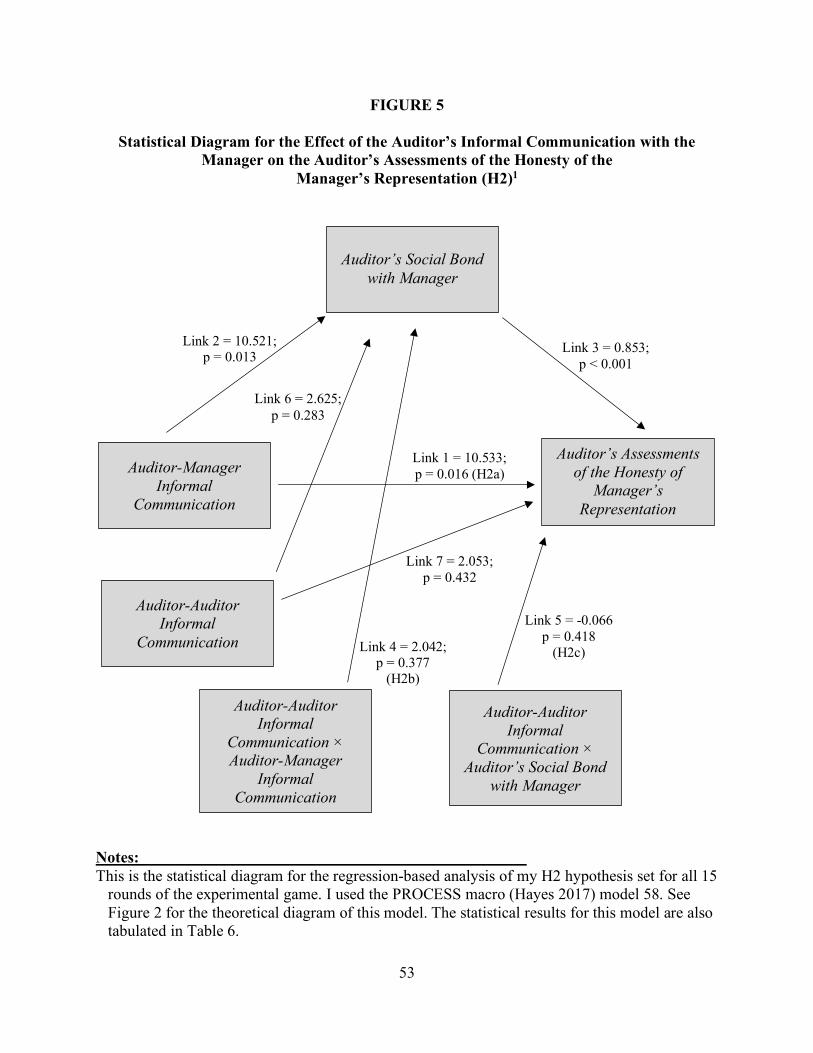
Figure 5: Statistical Diagram for the Effect of the Auditor’s Informal Communication with the Manager on the Auditor’s Assessments of the Honesty of the Manager’s Representation (H2) .................................................................................................... 53
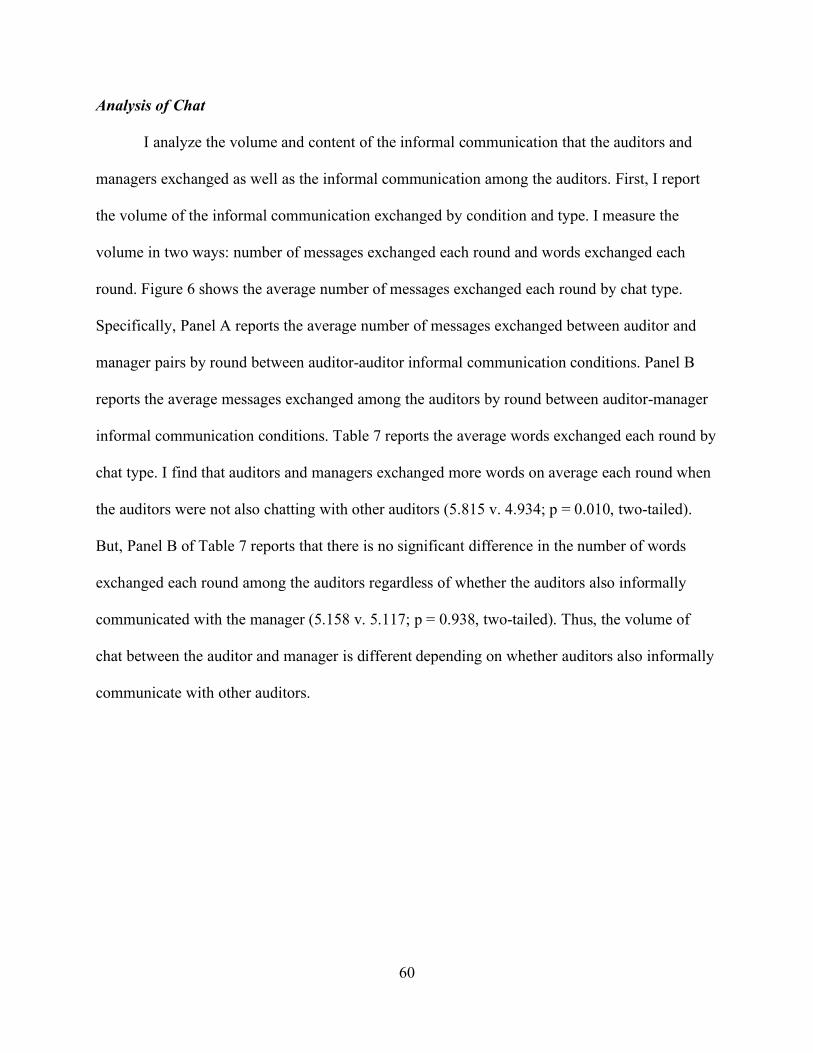
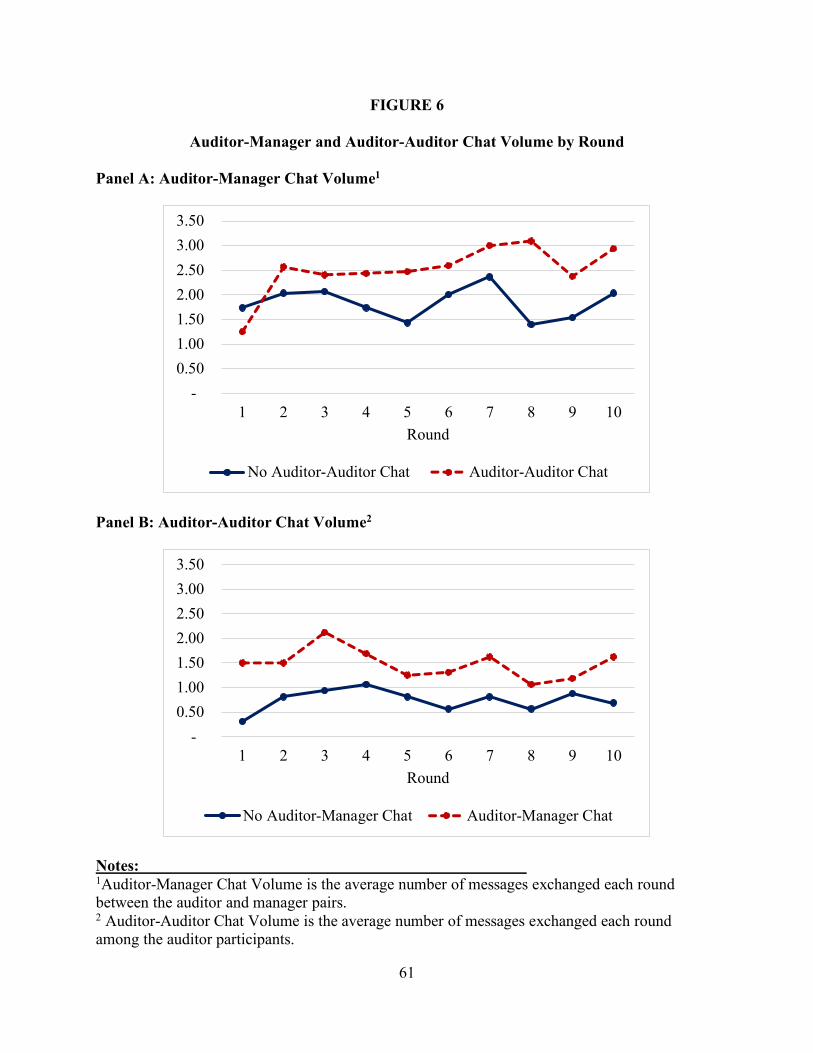
Figure 6: Auditor-Manager and Auditor-Auditor Chat Volume by Round ................................. 61
1
I. INTRODUCTION
My study explores the effect of auditors’ recurring, informal communication in the audit
environment on certain financial reporting outcomes. The financial reporting outcomes I
specifically consider are the honesty of client management representations, auditor beliefs about
client manager honesty, and audit quality (Gaynor et al. 2016). I study why the auditor’s
informal communication with the client manager affects both auditor and manager choices.
Furthermore, I examine how and why the auditor’s recurring, informal communication with
other auditors impacts both auditor and client manager (hereafter, manager) decisions.
Due to the service-nature of the audit industry, auditors likely have informal and personal
conversations with both client managers and other auditors. Audit partners suggest that building
good relationships between the auditor and client management through communication is
necessary for providing quality service to the client (Bennett and Hatfield 2018). Additionally,
with the rise of telecommuting, understanding how informal auditor communication, or the lack
thereof, affects audit outcomes is important. This study focuses on the effects of auditors’
informal conversations on auditor and manager decisions.
Prior research demonstrates that interactions between auditors and client managers affect
audit quality (Bennett and Hatfield 2013; Bennett and Hatfield 2018; Bowlin et al. 2015;
Bhattacharjee and Brown 2018; Hobson, Stern, and Zimbelman 2018; King 2002). King (2002)
finds that when a client manager communicates that he or she will choose a conservative
reporting strategy, the auditor is more trusting of the manager and in turn selects a lower level of
2
audit effort. Similarly, Bowlin et al. (2015) find when auditors are able to informally
communicate with client managers, auditors are more likely to choose lower levels of audit
effort. These studies suggest that auditors’ interactions with client managers can lead to
increased levels of trust in management that potentially impair audit quality. However, prior
research does not examine the process by which informal communication between the auditor
and manager affect auditor decisions. Furthermore, prior research does not consider that auditors
in practice also have recurring, informal communication with other auditors throughout the
audit.
Financial reporting outcomes include more than just the audit process (Gaynor et al.
2016). Management’s initial financial reporting decisions impact decisions auditors make later in
the audit process. Although management decisions are impacted by the nature of auditor-
manager interactions (Saiewitz and Kida 2018), prior research employs high risk, fraud settings,
in which researchers intentionally prompt managers’ aggressive financial reporting, to focus on
auditor behavior rather than management behavior (King 2002; Bowlin et al. 2015). King (2002)
and Bowlin et al. (2015) not only encourage managers to choose the aggressive financial
reporting option, but also prompt the managers to make dishonest representations about their
choices. Thus, the effect of auditor-manager interactions on management choices, specifically
manager honesty, and whether that relationship depends on the auditor’s informal
communication with other auditors is poorly understood.
I contribute to the auditing literature by demonstrating that informal communication
between the auditor and manager results in a social bond between the two individuals that
operates as a two-way street. Importantly, the social bond, which I define as an individual’s
shared identity with another individual, leads the manager to be more honest with the auditor.
3
Then, consistent with prior literature, the auditor in turn trusts the manager. While prior literature
characterized this trust as a negative consequence of auditor-manager interactions, my results
demonstrate the negative characterization is unwarranted if indeed the manager is more honest.
Thus, my study provides evidence about the process by which informal communication between
the auditor and manager in the audit process affect financial reporting outcomes.
I use the effects of communication and social identity theory to develop my predictions.
First, communication research suggests communication allows individuals to become acquainted
with one another (Dawes et al. 1977) and develop a group identity (Bicchieri 2002). Social
identity theory suggests that an individual draws his or her self-identity from group membership,
and an individual’s identity can impact his or her behavior (Tajfel 1974). Linking these theories
together, communication can have psychological effects that can impact behavior. Second,
communication allows coordination through discussion and promises (Bicchieri 2002; Charness
and Dufwenberg 2006; Crawford 1998; Dawes et al. 1977), which create expectations about
other individuals’ choices (Bicchieri 2002). Thus, in the instance of repeated interactions
communication may be an accountability mechanism.
To address my research questions, I conduct an interactive experiment according to the
traditions of experimental economics. My setting models important elements of the audit process
in a stylized audit game, in which the auditor- and manager-participants are paired together and
make incentivized choices that characterize the natural audit setting. My experiment incorporates
a 2×2 between-subjects design that manipulates the auditors’ ability to chat in two ways. First, I
manipulate whether auditors are able to informally chat with their manager-counterpart. Second,
I manipulate whether the auditors are able to informally chat among themselves. To control the
information environment when the auditors informally chat, I tell the managers that the auditors
4
are chatting. I measure financial reporting outcomes in three ways: the honesty of the manager’s
representation, the auditor’s assessment of the honesty of the manager’s representation, and joint
outcome of the manager’s reporting choice and the auditor’s selected audit effort. I also measure
the social bond between the auditor and manager, the social bond among the auditors, the
auditor’s perceived risk about the choice of audit effort, and the manager’s feelings of
accountability to the auditor. These additional measures allow me to test the process by which
informal communication impacts auditor and manager decisions.
I find that when auditors and managers informally communicate the manager develops a
social bond with the auditor, which then increases the manager’s feelings of accountability to the
auditor and results in more honest representations from the manager. Interestingly, the direct
effect of informal communication between the auditor and manager on manager honesty is
negative. This suggests that absent the social bond, the manager uses the communication as form
of cheap talk to take advantage of the auditor. But, my results show that the social bond mitigates
the effect of the cheap talk. Thus, managers are more honest when they informally communicate
with auditors because of the social bond. Finally, while the manager’s feelings of accountability
to the auditor do not directly impact the honesty of the manager’s representations, I find the
manager’s knowledge that the auditors informally communicate marginally enhances the effect
of the manager’s feelings of accountability on the honesty of the manager.
I find the auditor also develops a social bond with the manager when the auditor and
manager informally communicate, and this social bond causes the auditor to assess the
manager’s representations as more honest. I also find that when the auditor informally
communicates with other auditors, the auditor forms a bond with the other auditors. While the
auditor’s informal communication with other auditors has no impact on auditor assessments of
5
manager honesty, I observe fewer instances of audit failure, which occurs in my setting when the
manager chooses aggressive financial reporting and the auditor chooses a low-effort audit, when
auditors informally communicate with each other.
The experiment gives my study three comparative advantages. First, because I am able to
observe elements of the audit process that are unobservable in the natural audit setting (e.g.
manager representations, etc.), this methodology allows me to test a question that archival
research cannot. Second, consistent with Friedman and Sunder (1994), I construct an abstract
setting in which participants behave in response to incentives and information rather than
according to the expectations associated with their role assignments, which allows me to test the
participants’ underlying behavior. Finally, the interactive setting gives me the ability to
simultaneously examine auditors’ and managers’ endogenous behavior (Kachelmeier 2018).
My research contributes to the current auditing literature in several important ways. First,
my study demonstrates how the auditor’s recurring, informal communication has an effect on
financial reporting outcomes. I show that informal communication between the auditor and
manager creates a social bond between the individuals and how this bond in turn alters auditor
and manager decisions. Importantly, I show that the auditor and manager bond despite their
opposing incentives and despite only communicating electronically. Bennett and Hatfield (2018)
note that partners are concerned the computer-mediated communication does not allow staff
auditors to develop client relationships. However, my results demonstrate that such relationships
form even when informal communication occurs electronically. Second, prior research largely
concentrates on one element of the auditor’s informal communication—communication with the
manager. I examine informal auditor-auditor communication to determine how it affects auditor
and manager behavior. I find that informal auditor-auditor communication does not impact the
6
auditor’s assessments of the manager’s honesty. Thus, auditors appear to behave similarly
regardless of whether they informally communicate with other auditors. This finding is
meaningful for practitioners as it expands the understanding of how the structure of the audit
team (traditional on-site team structure v. off-shoring or telecommuting) impacts financial
reporting outcomes. Third, I find that the social bond between the auditor and the manager leads
the manager to make more honest representations despite the manager’s option to make
dishonest choices without penalty. My study provides new insights about the auditor-manager
relationship. These insights are important for practitioners as they plan and conduct audits,
regulators as they set standards for practice, and academia as it continues to build its
understanding about auditor-manager interactions.
The remainder of this paper is as follows: Section II outlines the background literature
and hypotheses development; Section III describes the research design; Section IV discusses the
results; and Section V concludes.
7
II. BACKGROUND AND HYPOTHESES DEVELOPMENT
Background
Throughout the audit process, auditors carry on multiple, recurring conversations. The
audit standards mandate some of these conversations making them task-oriented and formal in
nature. For example, AS 2110 and AS 1201 require auditors to have and document certain
conversations with client management (e.g. fraud inquiries) and the audit team (e.g. fraud
brainstorming) during the audit (PCAOB 2010a; PCAOB 2010b). Yet, because auditing is a
service-oriented industry, informal conversations likely occur between an auditor and client
manager as well as among the audit team. Part of an auditor’s job is to get to know the client
manager and develop rapport to maintain a smooth business relationship. Bennett and Hatfield
(2018) provide evidence that audit partners are concerned that audit staff who only communicate
with client management via email are not developing necessary and appropriate client
relationships to aid in conducting the audit. Additionally, the rise of telecommuting impacts
auditors’ opportunity to have informal conversations with both the client and the audit team.
Auditor’s informal conversations likely occur throughout the audit process. The informal
nature implies that these conversations are not comprised of any specific content (task-oriented
or otherwise). The effect of the auditors’ recurring, informal conversations on auditor and
manager choices are of interest in this study.
8
Social Identity Theory
Social identity theory posits that an individual’s identity is drawn from his or her group
membership (Tajfel 1974). Group membership can be from either a physical or cognitive group,
and belonging in a group can occur because there is an outgroup (Tajfel 1974). An individual’s
identity can impact his or her behavior; specifically, when group membership is salient, an
individual will make decisions that are preferential to the other members of his or her group
(Tajfel 1974).
A number of accounting researchers examine the relationship between the auditor and the
client manager though the lens of social identity (e.g. Bamber and Iyer 2007; Bauer 2015;
Bhattacharjee and Brown 2018; Bowlin et al. 2017; Kachelmeier and VanLanduyt 2017).
Bamber and Iyer (2007) demonstrate that the greater an auditor’s client identity is, the more
likely the auditor will acquiesce to the client’s preferences. An auditor’s identity with the client
can be developed through shared values (Bauer 2015), trivial tasks (Kachelmeier and
VanLanduyt 2017), longer auditor tenure (Bowlin et al. 2017), and affiliation with the same audit
firm office (Bhattacharjee and Brown 2018). In my study, social bond refers to an individual’s
shared identity with another individual, and I allow the social bond to develop through informal
communication.
Bamber and Iyer (2002) use the social identity framework to examine an auditor’s
professional and organizational identity. Bamber and Iyer (2007) and Bauer (2015) show that an
increase in an auditor’s professional identity can constrain the auditor’s tendency to acquiesce to
the client. An auditor’s professional identity is developed from a variety of sources including
accounting firms, accounting associations, and interactions with society (i.e. clients, governing
bodies, and other professions among several other stakeholders) (Brouard et al. 2017). However,
9
in my study, I isolate the social bond between auditors from the auditor’s professional identity to
determine whether the social bond itself impacts auditor choices. I can make this distinction
because of the abstract nature of my experimental setting, which does not include context cues
from the audit profession. Consequently, my auditor-participants are not subject to the behavioral
expectations associated with the auditor role.
Communication
Outside of the accounting literature, both economics and psychology researchers have
investigated the effects of communication on individuals’ decisions. Economics researchers
suggest communication increases coordination and allows individuals to signal their intended
actions (Crawford 1998). However, as the difference in incentives increases, communication
between individuals becomes less informative (Cai and Wang 2006). This suggests that in
strategic settings, incentives impact the effectiveness of communication since individuals may
become less trusting of one another (Cai and Wang 2006).
In psychology, researchers argue that communication has three effects: 1) communication
provides the opportunity for individuals to get to know each other; 2) it allows individuals to
coordinate; and 3) it provides a medium for individuals to reassure one another about their
intentions (Dawes et al. 1977). Additionally, Bicchieri (2002) suggests that communication has
many effects including increasing social identity, increasing the salience of social norms, and
creating shared information about a situation, which allows cooperation and creates
understanding and expectations about the choices other individuals will make. Importantly, both
indicate that communication appears to operate as a means for developing group-identity, but
neither study attempts to measure the identity that is formed by communication.
10
In the behavioral-economics literature, Cason et al. (2012) find that communication leads
to behavior that is consistent with social identity theory (Tajfel 1974).1 In their study, they find
when groups communicated with another group, but not with their own group privately, the
outcomes suggested that the two groups came together and acted as one group (Cason et al.
2012). Thus, communication appears to have psychological effects, specifically through group
identity that can impact behavior above and beyond individual incentives. However, Cason et al
(2012) do not directly measure the individuals’ feelings of group membership. Consequently, it
is still an open question whether communication will form a measurable social bond between
individuals.
As noted above, communication also provides a medium for individuals to signal their
intended choices (Bicchieri 2002; Crawford 1998; Dawes et al. 1977). These signals may occur
through promises (Charness and Dufwenberg 2006) and create expectations about what choice
the other individual will make (Bicchieri 2002). Waymire et al. (2014) demonstrate that
communication can be used as a tool to conceal self-dealing because of an individual’s promises.
This supports the notion that cheap talk increases coordination. However, in situations with
repeated interactions and feedback, the message recipient would know if the sender kept the
promise he or she made, which makes dishonest behavior less feasible. Thus, communication
may operate as an accountability mechanism in the presence of repeated interactions.
Setting
Prior accounting research examines interactions between auditors and managers as well
as among auditors and finds that these interactions impact auditor and manager decisions (e.g.
1 While the manipulations in this study are similar to those I employ in my study, the group set-up and the nature of the strategic game and incentives are different than my setting.
11
Bennett and Hatfield 2013; Bennett and Hatfield 2018; Bhattacharjee and Brown 2018; Bowlin
et al. 2015; Brazel et al. 2004; Hobson et al. 2018; Kachelmeier and VanLanduyt 2017; Kadous,
Leiby, and Peecher 2013; King 2002; Wilks 2002). Bennett and Hatfield (2013) find that when a
staff-auditor interacts with a more experienced client manager, the staff-auditor collects
inadequate audit evidence suggesting a lack of social bond leads to suboptimal audit outcomes.
Expanding on this, Bennett and Hatfield (2018) demonstrate that staff auditors ask fewer
questions and exhibit less professional skepticism when they communicate with client
management by email rather than face-to-face, which suggests the mode of communication can
have a real impact for certain, complex audit tasks. Kachelmeier and VanLanduyt (2017) show
that when an auditor and manager bond through a trivial task, the auditor gives the manager the
benefit of the doubt when there is uncertainty about an accounting estimate.
The previous studies have results that suggest auditor-manager interactions can lead to
poor audit outcomes. Yet, two studies find that instances where auditors are less sensitive to
auditor-manager interactions. Bhattacharjee and Brown (2018) find that auditors who are
affiliated with the manager are less susceptible to persuasion attempts by the manager. In fact,
the manager’s persuasion attempt backfires in this situation. Hobson et al (2018) show that
auditors who exhibit higher levels of The Dark Triad personality traits trust the managers less
than auditors who have lower levels of those same personality traits. Together these studies on
auditor-manager interactions demonstrate auditors are sensitive to these interactions.
Prior research also demonstrates that auditor-to-auditor interactions impact financial
reporting outcomes. For example, Brazel et al. (2004) find the nature of the review process (face-
to-face or electronic) impacts the preparers’ expectations of the reviewer, and, in turn, the overall
effectiveness of audit documentation. Similarly, audit workpapers may suffer from predecisional
12
distortion effects when the preparer has been made aware of the audit partner’s particular area of
concern in a real-time review situation (Wilks 2002). Kadous et al. (2013) find that non-
specialist auditors do not objectively consider advice they receive from peer auditors with whom
they share a social bond. Thus, because these interactions within the audit process impact audit
outcomes, they are important to examine and understand.
While some studies address these general, task-related interactions, two prior studies
address communication between the auditor and manager. King (2002) examines the impact of
standardized, non-verifiable communication (cheap talk) from the manager to the auditor and
finds the auditor trusts the manager more when the manager communicates with the auditor than
when the manager does not. Because only the managers are able to send messages in his study,
King’s setting is not fully interactive between the auditor and manager. Building on this, Bowlin
et al. (2015) employ a fully interactive setting between the auditor and manager and find the
auditor’s ability to engage in informal, electronic communication with the manager leads the
auditor to trust the manager more than when they do not informally communicate. In both studies
the auditor’s increased trust in the manager results in negative effects on audit quality. However,
it is unclear from these two prior studies why communication leads the auditor to trust the
manager. Furthermore, the auditor’s increased trust in the manager is only a problem to the
extent that the manager takes advantage of the auditor’s trust. These studies employ a high-risk,
fraud setting that does not allow the results to speak to a situation where the auditor’s increased
trust in management is not problematic. My study isolates the auditor’s informal communication
with the manager and tests whether this informal communication forms a social bond between
the auditor and manager, and whether this bond might alter auditor behavior.
13
There is limited evidence from prior literature about the effect of informal
communication among auditors on audit decisions. Bowlin et al. (2015) do not consider that
auditors also informally communicate with other auditors. King (2002) employs a two-part
manipulation to create a “strong group” identity for his auditor-participants that curbs the
auditor’s trust in the manager. First, King’s auditors interact informally at the beginning of his
setting, but the interaction is not recurring. Second, the name of the auditor with the highest
penalty at the end of each experimental session was posted publicly for all participants to see.
Because King’s manipulation includes both features, it is not clear whether the auditors’ pre-
experimental, informal interaction or the potential for public shaming reduced the auditors’ trust
in the managers. Additionally, neither of these studies address how such informal
communication among auditors may interact with the effects of informal communication
between the auditor and manager.
Gochnauer (2018) studies informal communication between auditors and specialists and
finds it results in a stronger social bond than when there is no informal communication. An
important point to make about Gochnauer’s finding is that her subjects participate in a
cooperative game in which their compensation is co-dependent. Her setting is different from
mine in which the auditor-participants have a common objective, but their compensation is not
tied together. Consequently, it is an open question whether informal communication among
auditors forms a bond between auditors when their compensation is not co-dependent.
Finally, although the preceding discussion has primarily focused on auditor decisions, the
audit is not the only input to financial reporting outcomes (Gaynor et al. 2016). Importantly, the
manager makes decisions that affect financial reporting outcomes. Prior research provides mixed
results on whether interactions within the audit process impact management’s decisions (e.g.
14
Bowlin et al. 2015; Kachelmeier and VanLanduyt 2017; King 2002; Saiewitz and Kida 2018).
Although Kachelmeier and VanLanduyt (2017) focus on just the auditor’s choices, their results
do include some observations about the manager’s choices. They find managers, who have a
social bond with the auditor, make less aggressive reporting choices than when there is no social
bond. Specifically related to communication, Saiewitz and Kida (2018) examine client
management responses to auditor-manager interactions and find that the client provides more
biased information when an auditor makes a request by email rather than in a face-to-face
interaction.
In contrast, while King (2002) focuses on the joint decisions of the auditor and manager,
he does not detect any differences in management’s reporting choices when standardized
communication is available. Bowlin et al. (2015) do not make any direct observations on the
effect of informal communication on the manager’s choices and do not detect a significant effect
of the informal communication on the joint outcome of a low-effort audit by the auditor and
aggressive reporting by management. However, these two studies either trained or prompted the
managers to make aggressive choices and deceptive representations, and consequently any
observed effects on manager behavior are unreliable. Unlike King (2002) and Bowlin et al.
(2015), I employ a neutral setting where I incentivize, but do not prompt, my manager-
participants to make dishonest or aggressive reporting choices, which allows me to explore
whether the manager’s informal communication with the auditor affects the manager’s decisions
and whether this relationship depends on the auditor’s informal communication with other
auditors.
15
Hypotheses
The Effect of Informal Communication on Manager Decisions
I rely on social identity theory and the effects of communication to explore the effect of
auditors’ informal communication on financial reporting outcomes. I first discuss my predictions
for how the auditor’s recurring, informal communication impacts manager decisions because
these decisions are the initial inputs into the audit and have a downstream effect on the audit
process. Prior literature provides mixed results on the effect of interactions between the auditor
and manager on the manager decisions (Bowlin et al. 2015; Kachelmeier and VanLanduyt 2017;
King 2002). Specifically, King (2002) finds no effect, and Bowlin et al. (2015) do not
specifically test the effects of communication on manager choices. However, in each of these
studies, the focus was primarily on how the auditor behaved in a high-risk fraud setting.2
Despite these mixed results, I expect informal communication to develop a social bond
between the auditor and manager. Communication allows individuals to get to know one another
(Dawes et al. 1977) and develop a shared identity (Bicchieri 2002). Joining this with social
identity theory, I expect that when the auditor and manager informally communicate, they will
develop a social bond with one another (Cason et al. 2012).
Social identity theory suggests members of a group make decisions that are favorable
towards one another (Tajfel 1974). Kachelmeier and VanLanduyt (2017) find that a social bond
between the auditor and manager leads the manager to make less aggressive reporting choices,
indicating that managers are sensitive to the social bond. I expect the social bond between the
manager and the auditor to result in more honest, that is truthful, representations by the manager.
2 The manager participants in these studies were trained or prompted to make false representations to the auditor making tests of their behavior less meaningful.
16
Furthermore, individuals likely feel more accountable to others with whom they have
developed a social bond. Results from studies in both psychology and economics support this
notion. Specifically, DePaulo and Kashy (1998) find that individuals lie less to friends than
strangers, and Chakravarty et al. (2011) observe in a sender-receiver game that individuals lied
more to strangers than friends. Furthermore, Chakravarty et al. (2011) suggest that building a
relationship between individuals can deter dishonesty. Thus, I expect the feelings of
accountability to result in more honest representations from the manager. I predict the following:
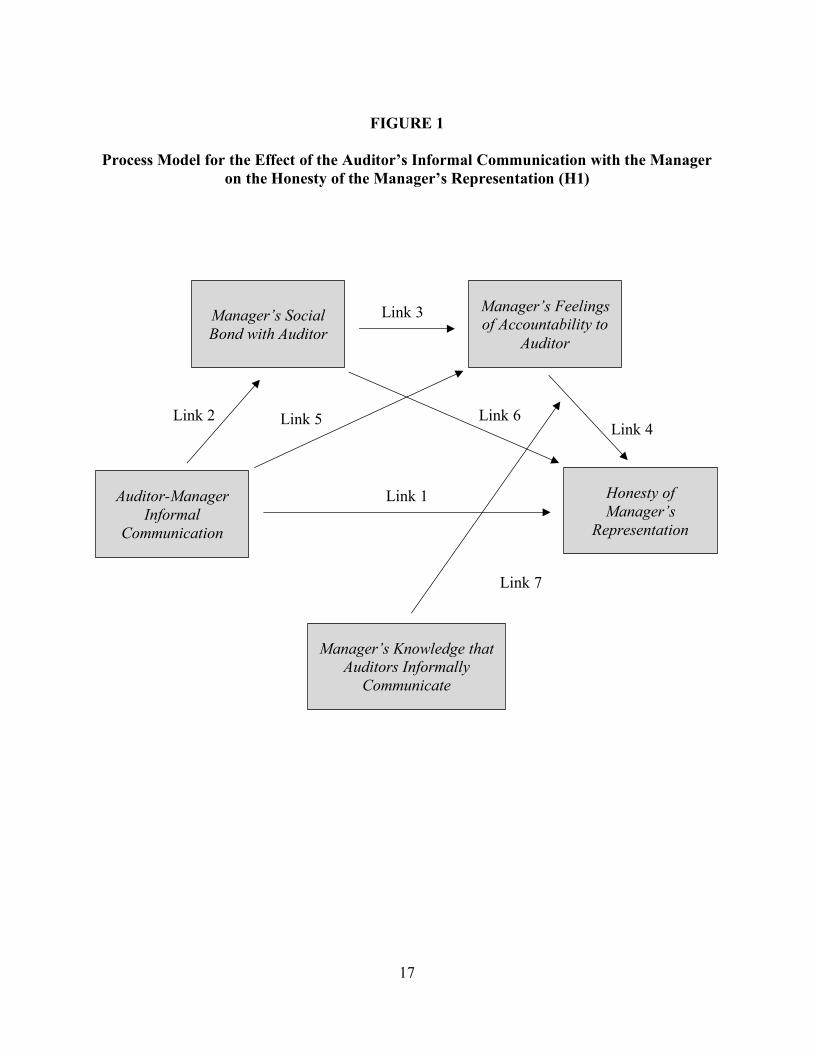
H1a: The manager will make more honest representations to the auditor when the manager and auditor informally communicate than when the manager and auditor do not informally communicate.
During the audit, auditors have informal conversations among themselves. The extent to
which the manager is aware of this and believes the auditors are discussing audit evidence
provided by the manager could impact whether the manager reports honestly. Specifically, it
could incite feelings of self-consciousness within the manager. Self-consciousness is both one’s
sense of self and the “awareness of oneself as an object of someone else’s observation” (Laing
1969). If the manager believes that he is the object of the auditors’ conversations, then the
manager will likely become more conscious of his or her actions. I expect this to enhance the
effect of the manager’s feelings of accountability to the auditor on the honesty of the manager’s
representations.
H1b: The manager’s knowledge that the auditors informally communicate will have a positive moderating effect on the relationship between the manager’s feelings of accountability to the auditor and the honesty of the manager’s representation.
17
FIGURE 1
Process Model for the Effect of the Auditor’s Informal Communication with the Manager on the Honesty of the Manager’s Representation (H1)
Auditor-Manager Informal
Communication
Manager’s Knowledge that Auditors Informally
Communicate
Manager’s Social Bond with Auditor
Honesty of Manager’s
Representation
Link 5 Link 4
Link 3
Link 2
Link 1
Manager’s Feelings of Accountability to
Auditor
Link 6
Link 7
18
The Effect of Informal Communication on Auditor Decisions
Prior literature finds communication between the auditor and manager leads the auditor to
trust the manager more when perhaps the auditor should not (Bowlin et al. 2015; King 2002).
However, the prior accounting literature has not examined the process by which communication
between auditors and managers alters auditor behavior. Communication allows individuals to get
to know one another (Dawes et al. 1977) and develop a shared identity (Bicchieri 2002). Using
the social identity framework, I expect that when the auditor and manager informally
communicate, the auditor will develop a social bond with the manager (Cason et al. 2012).
According to social identity theory, members of a group make decisions that are
favorable towards one another (Tajfel 1974). Kachelmeier and VanLanduyt (2017) find socially
bonded auditors gave managers the benefit of the doubt when there was uncertainty about an
accounting estimate. Similarly, the stronger an auditor’s client identity is, the more likely the
auditor will acquiesce to the client (Bamber and Iyer 2007; Bauer 2015). Thus, I expect the
auditor’s social bond with the manager, which is accrued through informal communication, to
result in the auditor rating the manager’s representations as more honest.
An alternative mechanism for the auditor’s heightened beliefs about the manager’s
honesty is a potential illusory feeling of control. Bowlin et al. (2015) suggest that the auditor’s
ability to informally communicate with the manager contributes to an illusory feeling of control
on behalf of the auditor that results in less diligent auditing, yet they do not formally test this
theory. The illusion of control suggests the individuals believe that they have control over
chance-dependent situations when, in fact, they do not (Langer 1975). The informal
communication with the manager may incline the auditor to feel more control over the
circumstance because of a perceived reduction in uncertainty about what choice the manager will
19
make. The perceived reduction in uncertainty likely occurs because communication allows
individuals to make non-verifiable statements, and even promises, about their intended play
(Bicchieri 2002; Charness and Dufwenberg 2006; Dawes et al. 1977). As such, the feeling of
illusory control could also result in the auditor assessing the manager’s representations as more
honest. Thus, I predict the following:
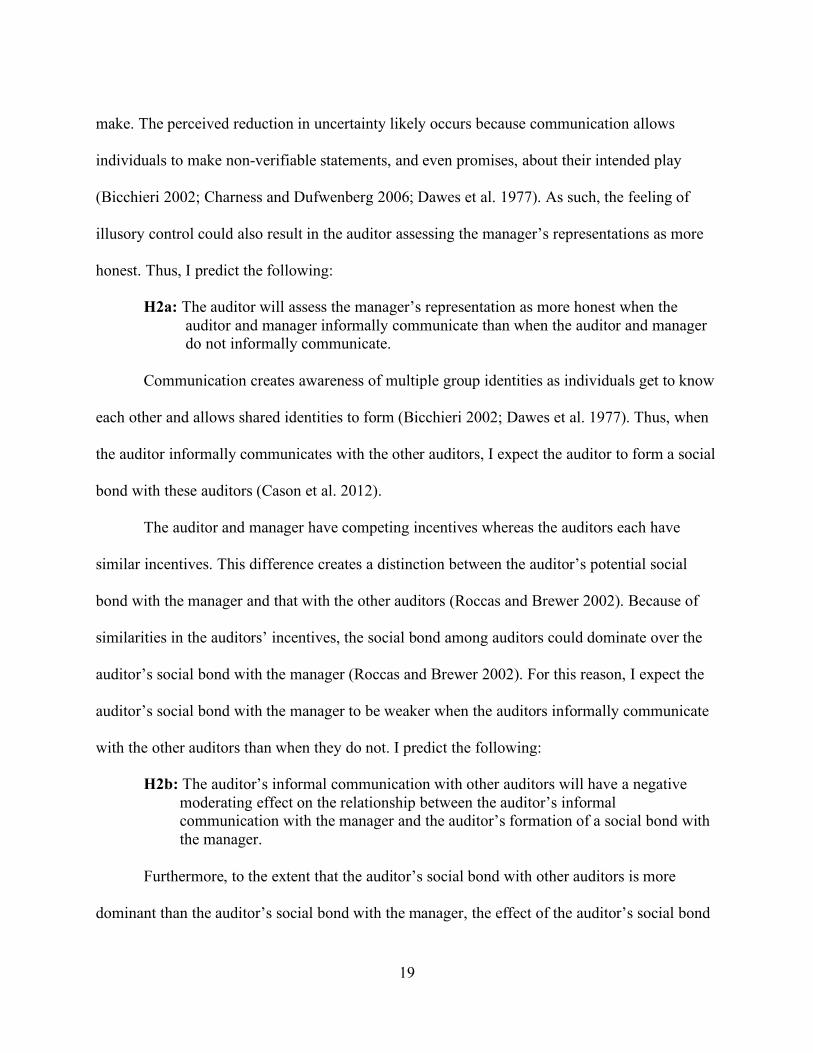
H2a: The auditor will assess the manager’s representation as more honest when the auditor and manager informally communicate than when the auditor and manager do not informally communicate.
Communication creates awareness of multiple group identities as individuals get to know
each other and allows shared identities to form (Bicchieri 2002; Dawes et al. 1977). Thus, when
the auditor informally communicates with the other auditors, I expect the auditor to form a social
bond with these auditors (Cason et al. 2012).
The auditor and manager have competing incentives whereas the auditors each have
similar incentives. This difference creates a distinction between the auditor’s potential social
bond with the manager and that with the other auditors (Roccas and Brewer 2002). Because of
similarities in the auditors’ incentives, the social bond among auditors could dominate over the
auditor’s social bond with the manager (Roccas and Brewer 2002). For this reason, I expect the
auditor’s social bond with the manager to be weaker when the auditors informally communicate
with the other auditors than when they do not. I predict the following:
H2b: The auditor’s informal communication with other auditors will have a negative moderating effect on the relationship between the auditor’s informal communication with the manager and the auditor’s formation of a social bond with the manager.
Furthermore, to the extent that the auditor’s social bond with other auditors is more
dominant than the auditor’s social bond with the manager, the effect of the auditor’s social bond
20
with the manager on the auditor’s decisions will be altered. Similar to the findings in Bamber
and Iyer (2007), as an auditor’s social bond with other auditors develops, the auditor’s tendency
to choose client-preferred outcomes may diminish. I expect the auditor’s informal
communication with other auditors to moderate any remaining effect of the auditor’s social bond
with the manager on the auditor’s assessments of the manager’s honesty. Therefore, I predict:
H2c: The auditor’s informal communication with other auditors will have a negative moderating effect on the relationship between the auditor’s social bond with the manager and the auditor’s assessment of the honesty of the manager’s representation.
21
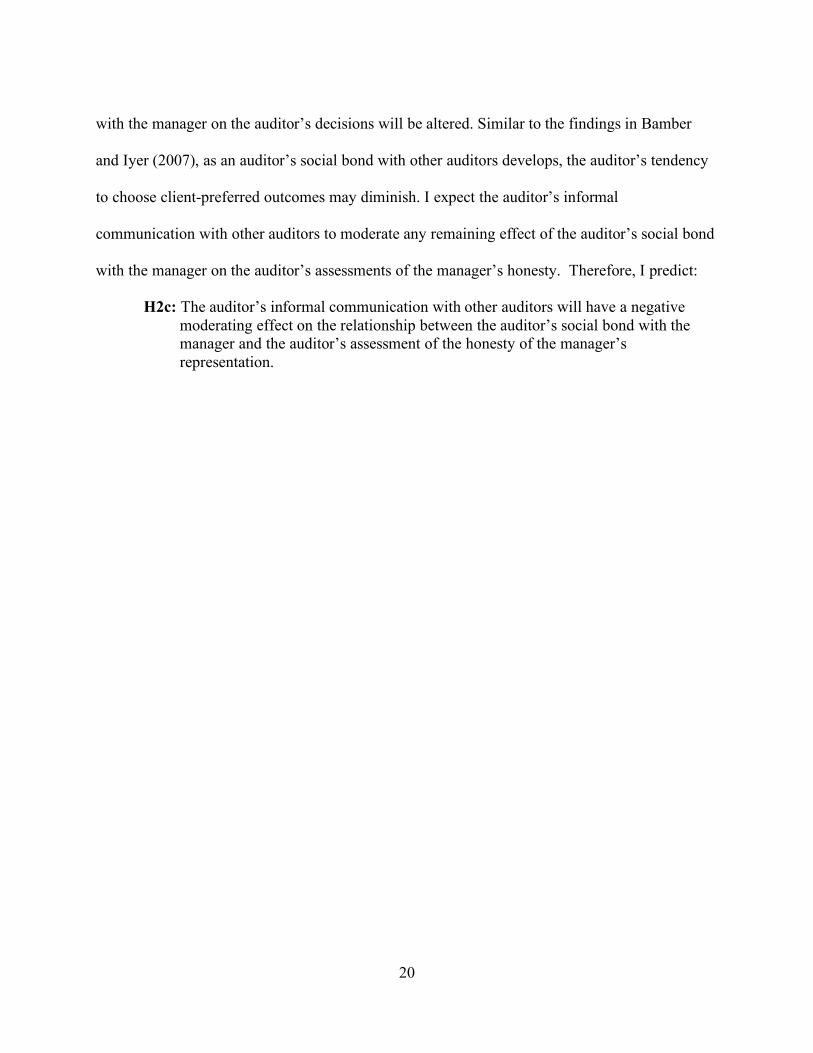
FIGURE 2 Process Model for the Effect of the Auditor’s Informal Communication with the Manager
on the Auditor’s Assessments of the Honesty of the Manager’s Representation (H2)
Auditor-Manager Informal
Communication
Auditor-Auditor Informal
Communication
Auditor’s Social Bond
with Manager
Auditor’s Assessments of the Honesty of
Manager’s Representation
Link 5 Link 4
Link 3 Link 2
Link 1
22
III. METHODOLOGY AND DESIGN
Experimental Setting
To address my research questions, I conduct an experiment according the traditions of
experimental economics. I construct a stylized audit setting and model the auditor-manager
relationship as an interactive, strategic game consistent with prior experimental accounting
research (Bowlin 2011; Bowlin et al. 2015; Bowlin et al. 2017; Kachelmeier and VanLanduyt
2017; King 2002). Specifically, I adapt the game and payoff structure from Bowlin et al. (2015).
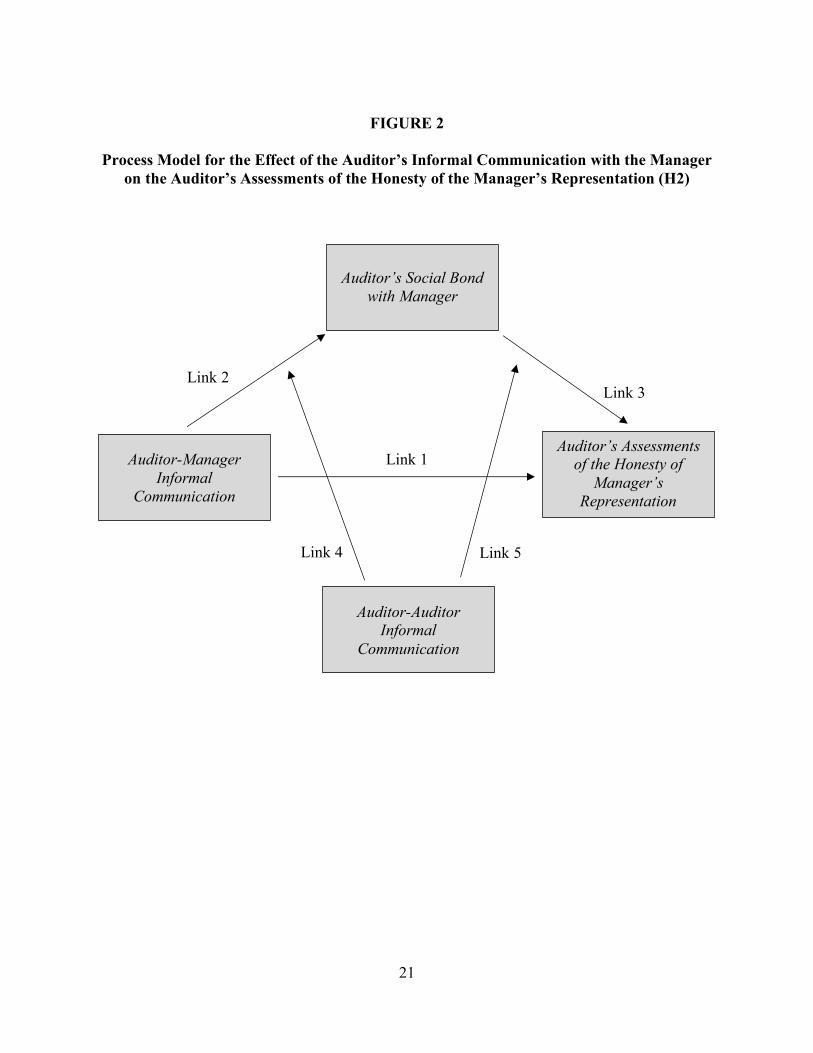
In the game I adapt from Bowlin et al. (2015), there are two players—the auditor and the
manager—and each auditor is randomly and anonymously paired with a manager. Each player
can make one of two choices: the manager chooses an aggressive or conservative reporting
option, and the auditor chooses to conduct either a high-effort audit or a low-effort audit. The
joint decisions of each player determine one of four possible outcomes. However, each player’s
final outcome is determined by not only the joint decisions but also external probabilities. As I
discuss below, the incentives for each player’s choice are patterned after the real-world
incentives present in the audit context. The potential payoffs and external probabilities are
structured in such a way that each player’s preferred choice is dependent on the other player’s
choice resulting in a mixed-strategy game.
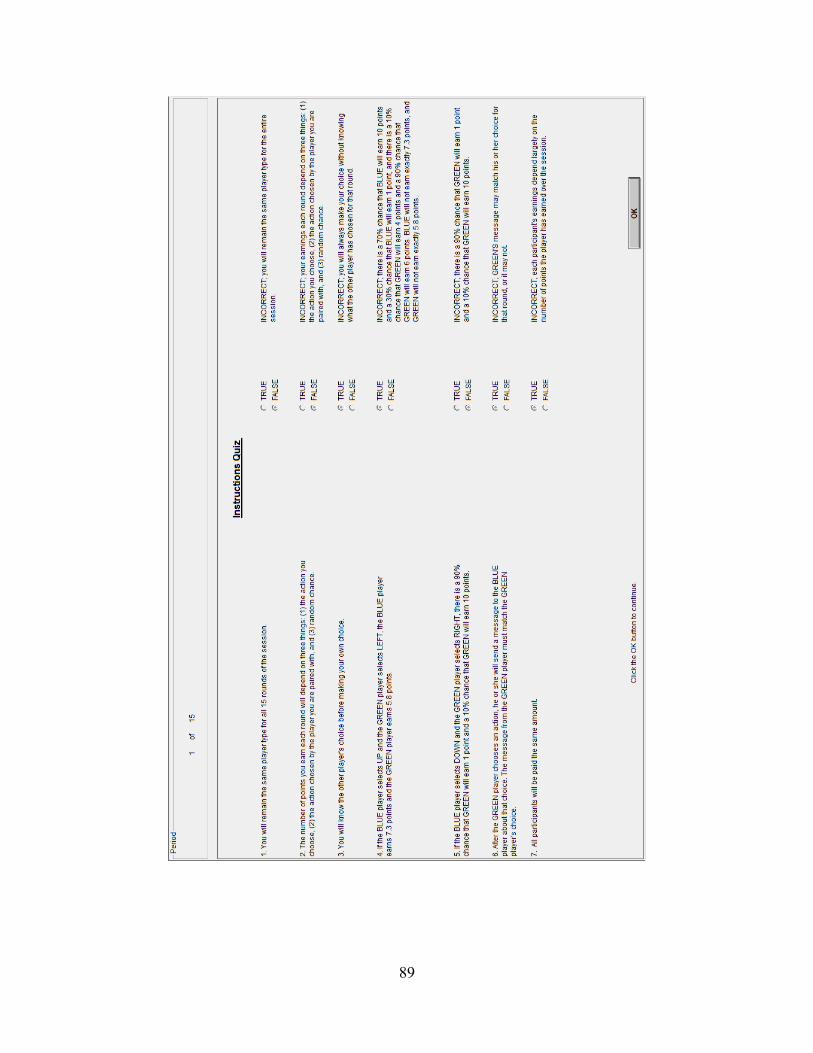
As shown in Table 1, the auditor has a higher potential payoff when he or she conducts a
low-effort audit than when he or she chooses a high-effort audit. This is analogous to the lower
(higher) costs associated with conducting a lax (diligent) audit. However, the likelihood of the
23
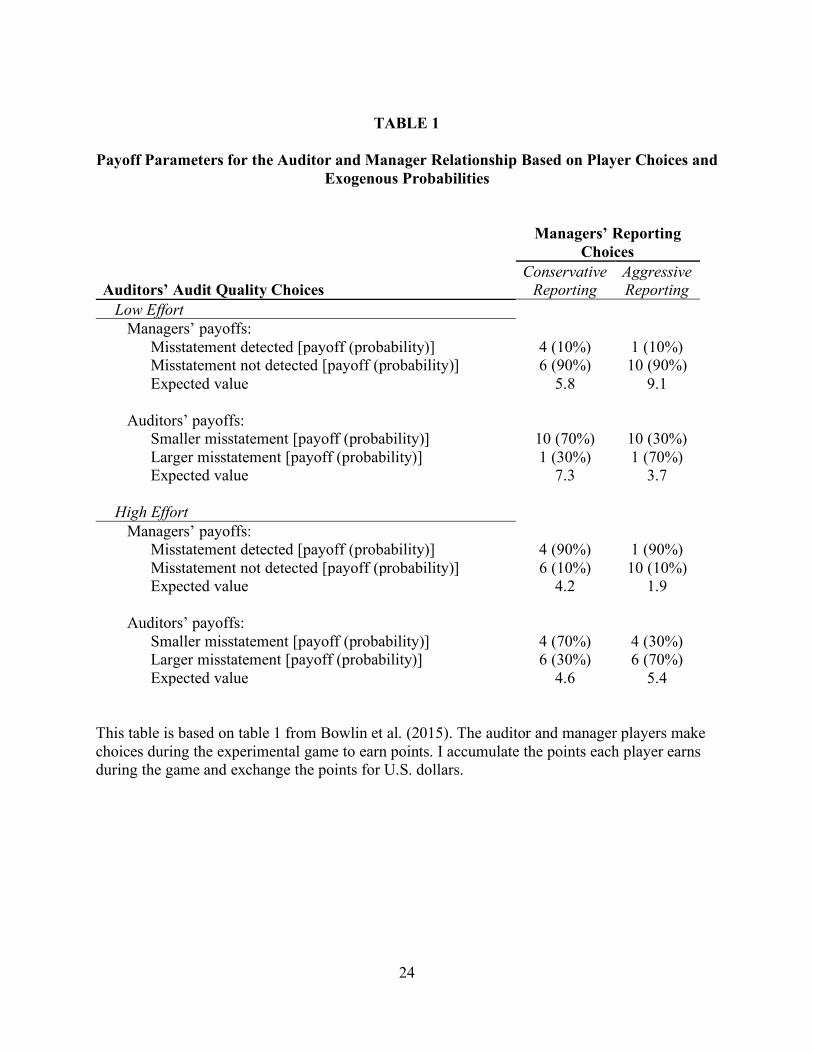
auditor receiving the higher payoff is determined by the manager’s reporting choice. The
external probability represents the likelihood that a misstatement existed and was not identified
by the audit. Specifically, when the auditor chooses a low-effort audit and the manager chooses
to report conservatively, the auditor has a 70% chance of earning 10 points and a 30% chance of
earning 1 point, which results in an expected value of 7.3 points on average. However, when the
auditor chooses a low-effort audit and the manager reports aggressively, the auditor has a 30%
chance of earning 10 points and a 70% chance of earning 1 point, which results in an expected
value of 3.7 on average. Thus, the auditor prefers the low-effort audit only when the manager
chooses to report conservatively. When the auditor conducts a high-effort audit and the manager
chooses to report aggressively, the auditor has a 70% chance of earning 6 points and a 30%
chance of earning 4 points in this situation, which results in an expected outcome of 5.4 points
on average. In contrast, when the auditor conducts a high-effort audit and the manager reports
conservatively, the auditor has a 70% chance of earning 4 points and a 30% chance of earning 6
points, which results in an expected outcome of 4.6 points on average. Thus, the auditor prefers
the high-effort audit only when the manager chooses to report aggressively.
24
TABLE 1
Payoff Parameters for the Auditor and Manager Relationship Based on Player Choices and Exogenous Probabilities
This table is based on table 1 from Bowlin et al. (2015). The auditor and manager players make choices during the experimental game to earn points. I accumulate the points each player earns during the game and exchange the points for U.S. dollars.
25
The manager has a higher potential payoff when he or she chooses to report aggressively
rather than conservatively. This is analogous to the benefits received when an earnings target is
met because of aggressive accounting decisions. Yet, the manager’s final payoff is determined
by the auditor’s effort choice. For the manager, the external probabilities represent the likelihood
that a misstatement existed and was uncovered. As shown in Table 1, when the manager chooses
to report aggressively, and the auditor chooses a low-effort audit, the manager has a 90% chance
of earning 10 points and a 10% chance of earning 1, which leads to an expected outcome of 9.1
points on average. If the manager chooses to report conservatively when the auditor conducts a
low-effort audit, the manager will have a 90% chance of earning 6 points and a 10% chance of
earning 4 points, which results in an expected outcome of 5.8 points on average. Thus, the
manager prefers to report aggressively when the manager believes that the auditor will perform a
low-effort audit. However, if the manager chooses to report aggressively and the auditor chooses
a high-effort audit, the manager has a 10% chance of earning 10 points and a 90% chance of
earning 1 point, which results in an expected outcome of 1.9 points on average. Thus, the
manager will prefer to report conservatively when the auditor conducts a high-effort audit since
the manager will have a 90% chance of earning 4 points and a 10% chance of earnings 6 points,
or an expected outcome of 4.2 points on average.
This setting gives my study three comparative advantages. First, this methodology allows
me to test a question that archival research cannot because I am able to observe elements of the
audit process that are unobservable in the real world. Second, the abstract setting allows
participants to behave in response to incentives and information rather than according to the
expectations associated with their role assignments (Friedman and Sunder 1994). This enables
me to test the theory and motivation underlying the participants’ behavior. Third, the interactive
26
nature of the game allows me to simultaneously examine the auditors’ and managers’ exogenous
behavior (Kachelmeier 2018).
Participants
Participants in my study consist of 126 students enrolled in upper-level, accounting
courses at a large, public university.3 Because the setting of my study is abstract and does not
require background knowledge in accounting, students are appropriate participants (Peecher and
Solomon 2001; Libby et al. 2002). The participants are 21.7 years old on average and have an
average of 0.44 years of accounting-related work experience. Fifty-two of the participants are
female. The majority (97%) of the participants are accounting majors. Forty-seven percent of the
participants are juniors, 40% are seniors, 10% are graduate students, and the remaining 3% are
sophomores or did not report a classification. In exchange for approximately 51 minutes of their
time, participants earned between $15 and $29 with an average of $21.14.
Experimental Procedures
I conduct eight research sessions in a controlled computer lab. Each session lasts
approximately 51 minutes of which the first 10 minutes is dedicated to instructions.4 As
participants enter the computer lab, I randomly assign them to a computer where they play the
experimental game I describe below. I implement the game, which lasts for fifteen rounds, with
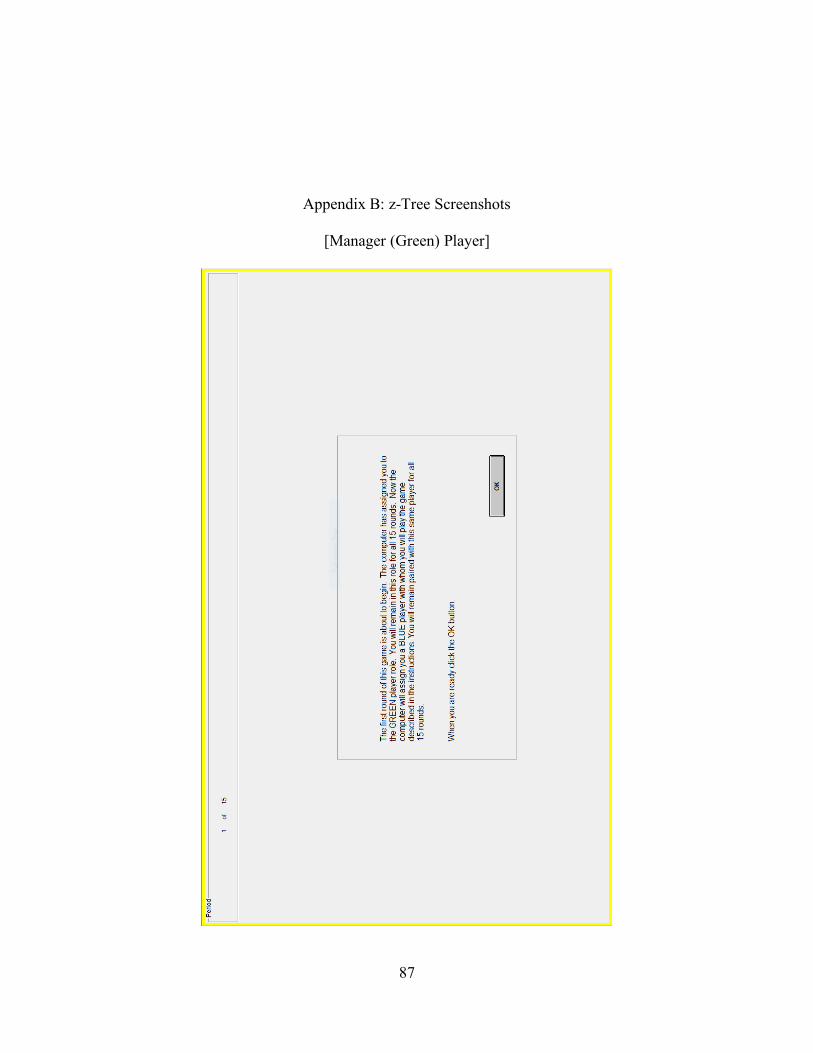
z-Tree (Fischbacher 2007).5
I begin each session by reading the instructions aloud while the participants follow along
with a written copy. The instructions describe the game procedures and incentives. To maintain
the abstract setting, I use neutral terminology to describe the participant roles. This eliminates
3 The university’s Institutional Review Board approved the study prior to recruiting participants. 4 See Appendix A for a copy of the participant instructions. 5 See Appendix B for a screenshots of the experimental game in z-Tree.
27
demand effects from expectations about how auditors and managers should behave and allows
participants to respond to the information and incentives of the game (Haynes and Kachelmeier
1998). Specifically, the instructions and computer software label each auditor-participant as a
“BLUE” player and each manager-participant as a “GREEN” player. However, in the remainder
of this manuscript, I refer to the players as auditors and managers for expository convenience.
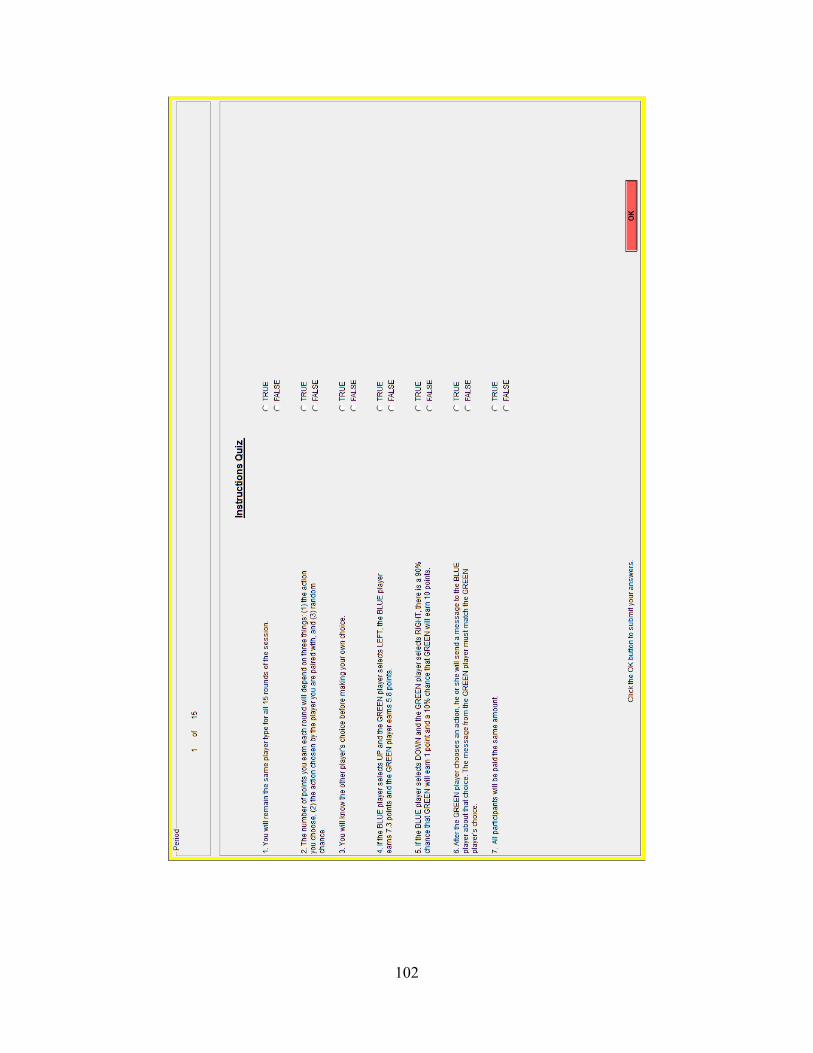
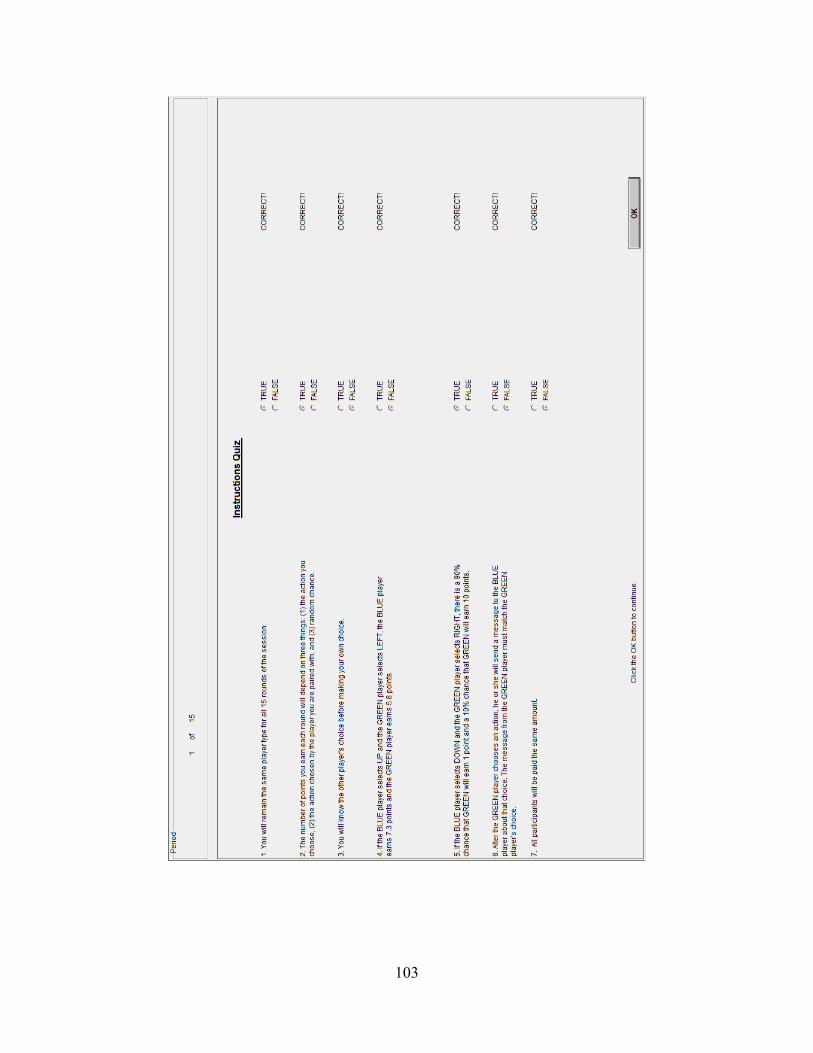
After reading the instructions, but prior to the start of the first round, participants
complete a true-false quiz over the instructions. The quiz covers important elements of the game
including decisions players can make and the incentive structure. I do not require participants to
correctly answer all questions to begin the game. However, for any questions that they do not
answer correctly, I give the correct answer along with an explanation for that correct answer.
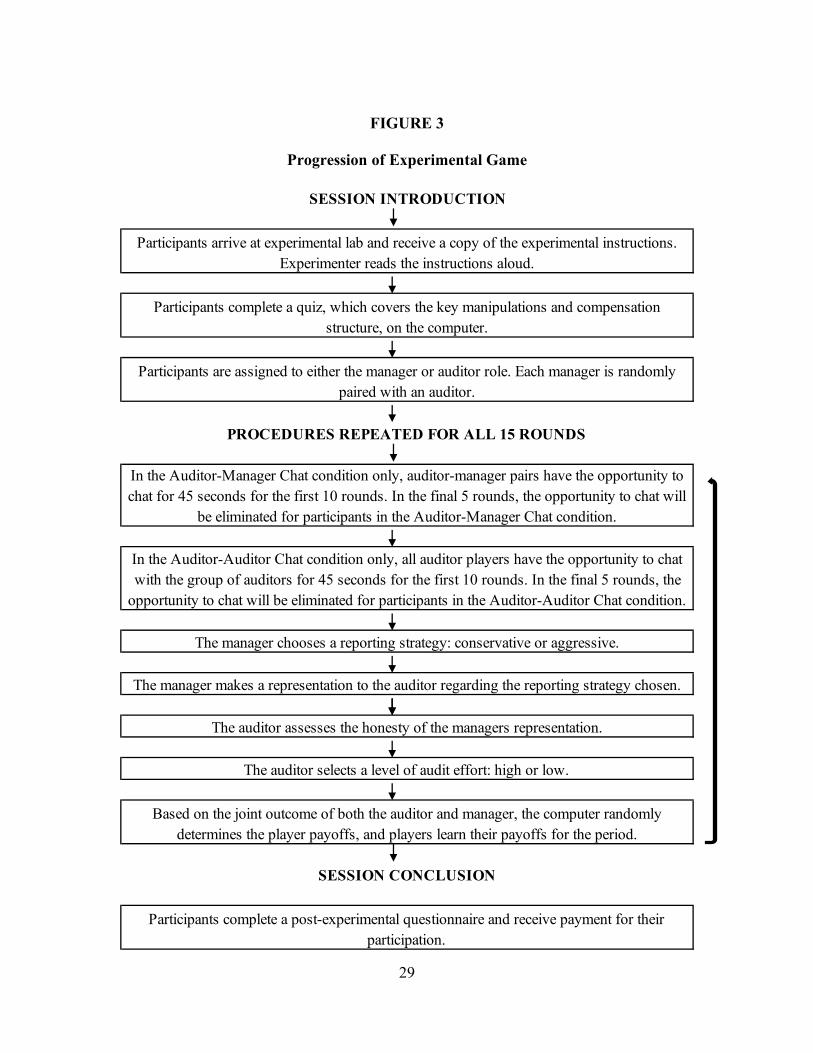
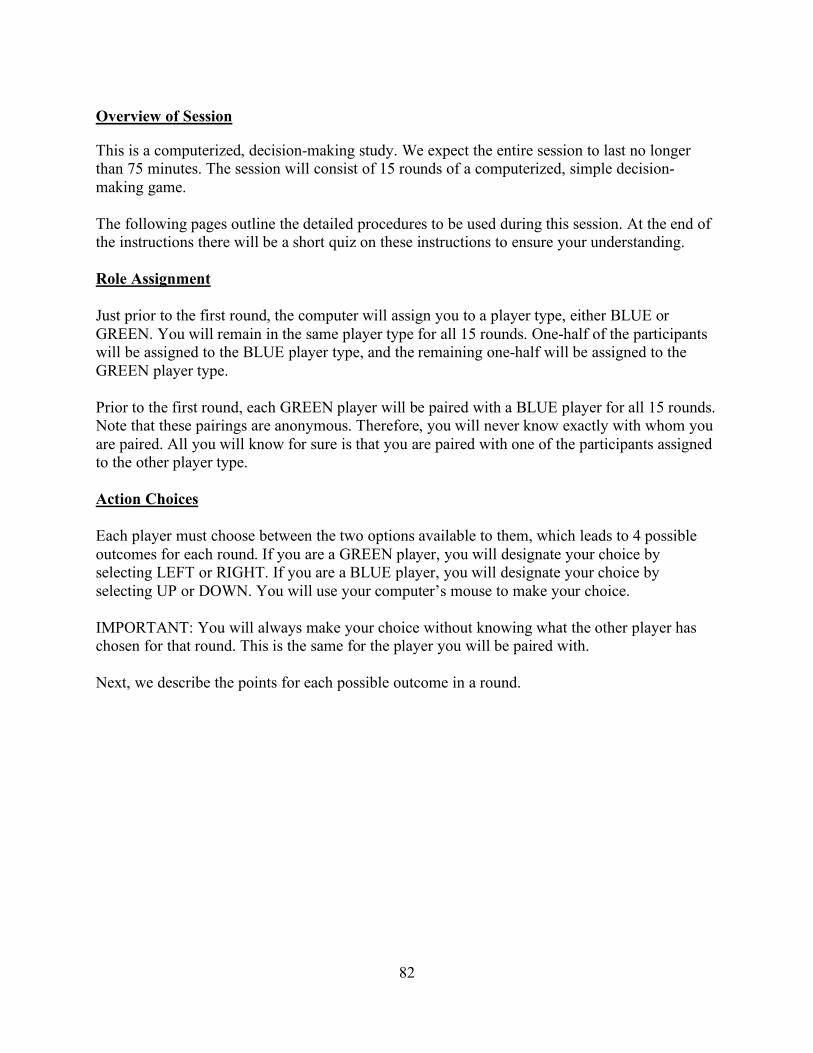
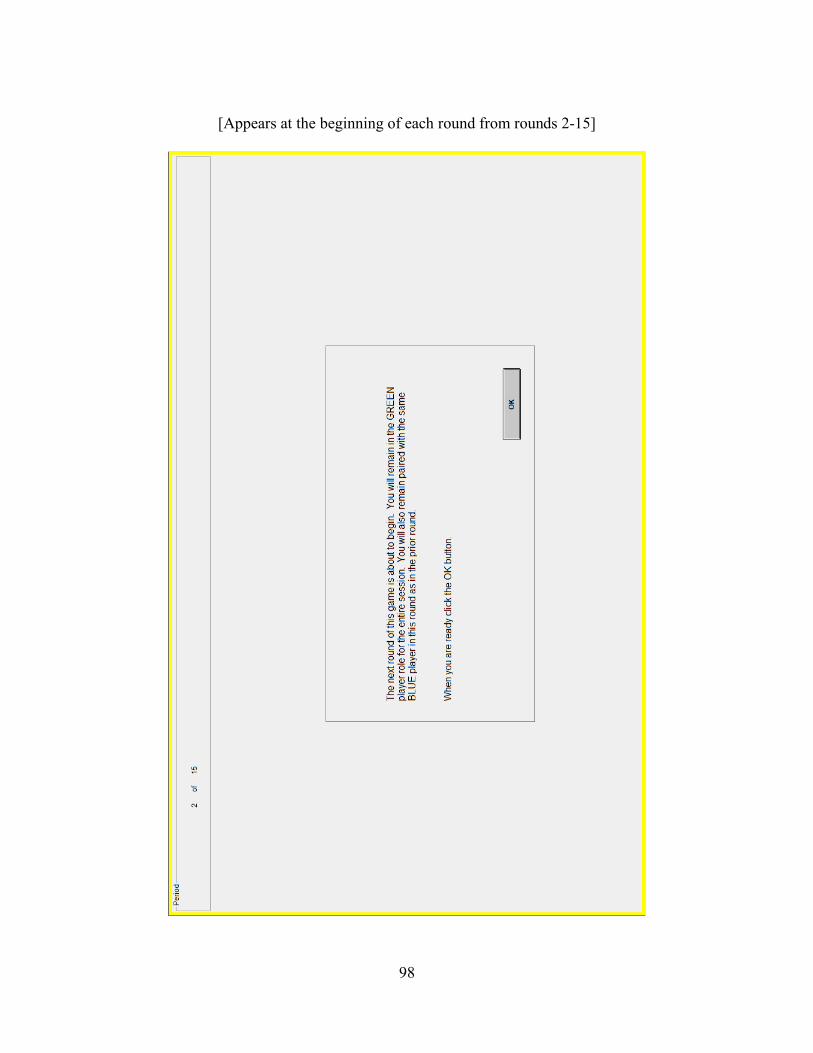
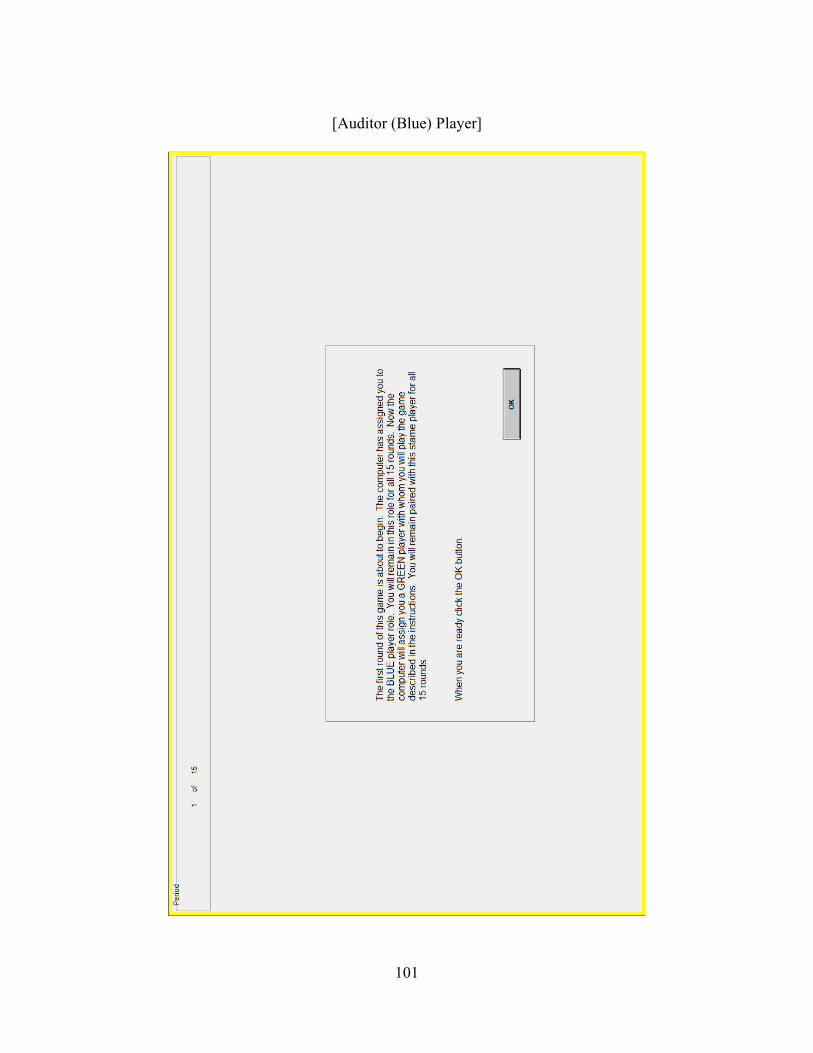
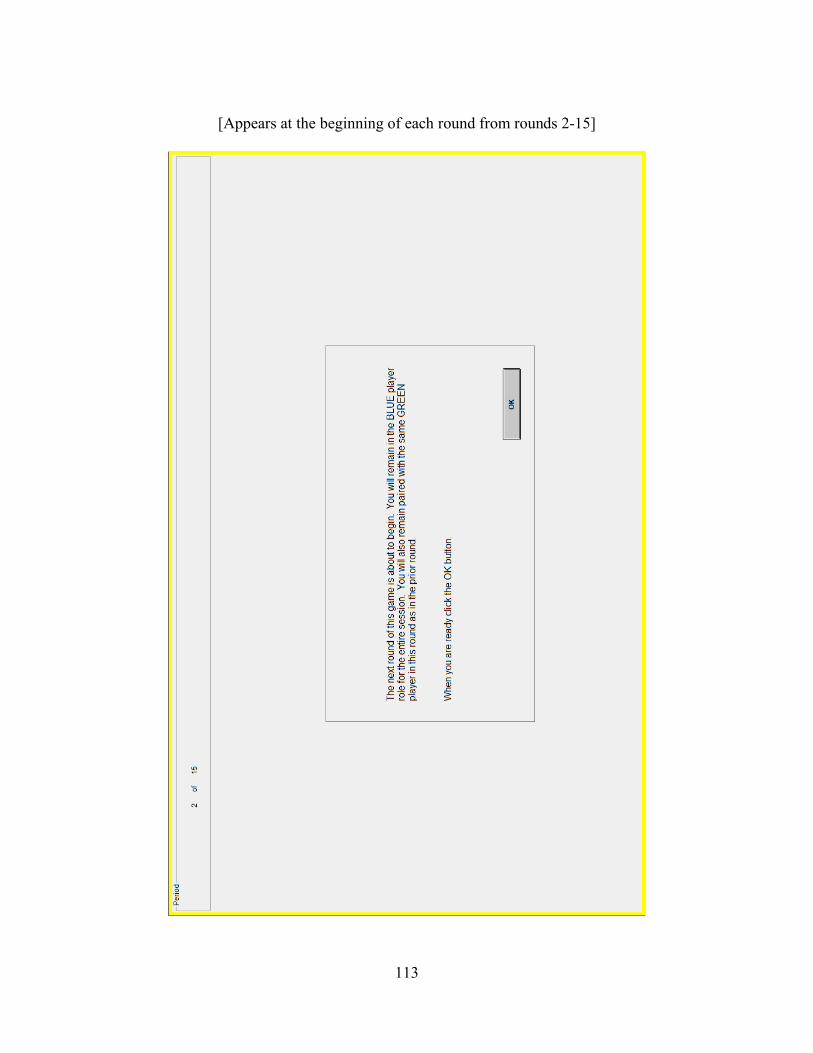
The first round begins with the computer assigning each player to either the role of
auditor or manager. Then, one auditor is paired with one manager. These players remain paired
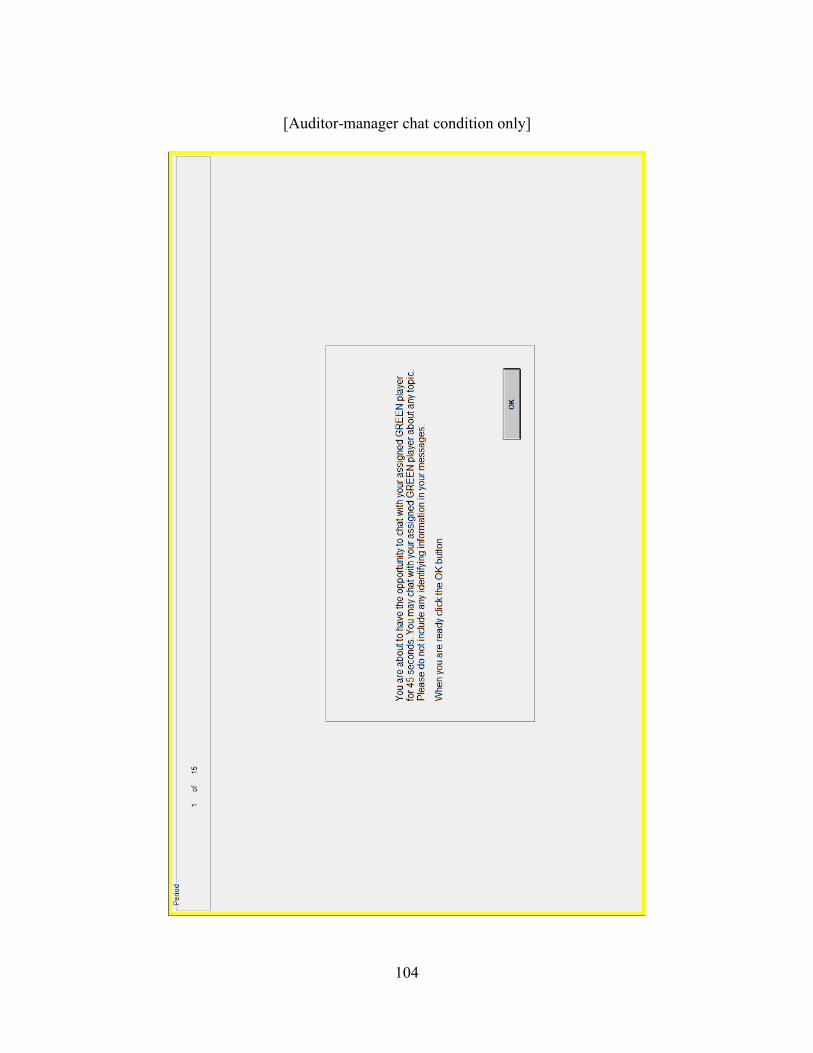
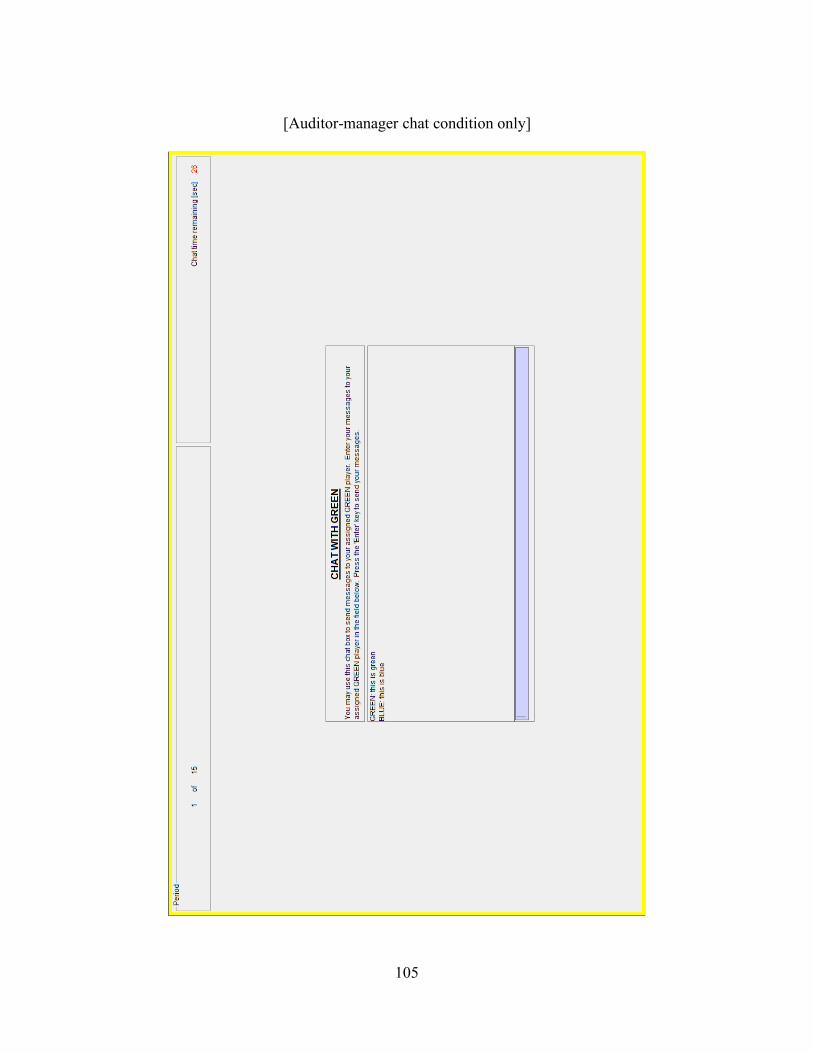
together for the entire session. As shown in Figure 3, for rounds 1-10 participants have the
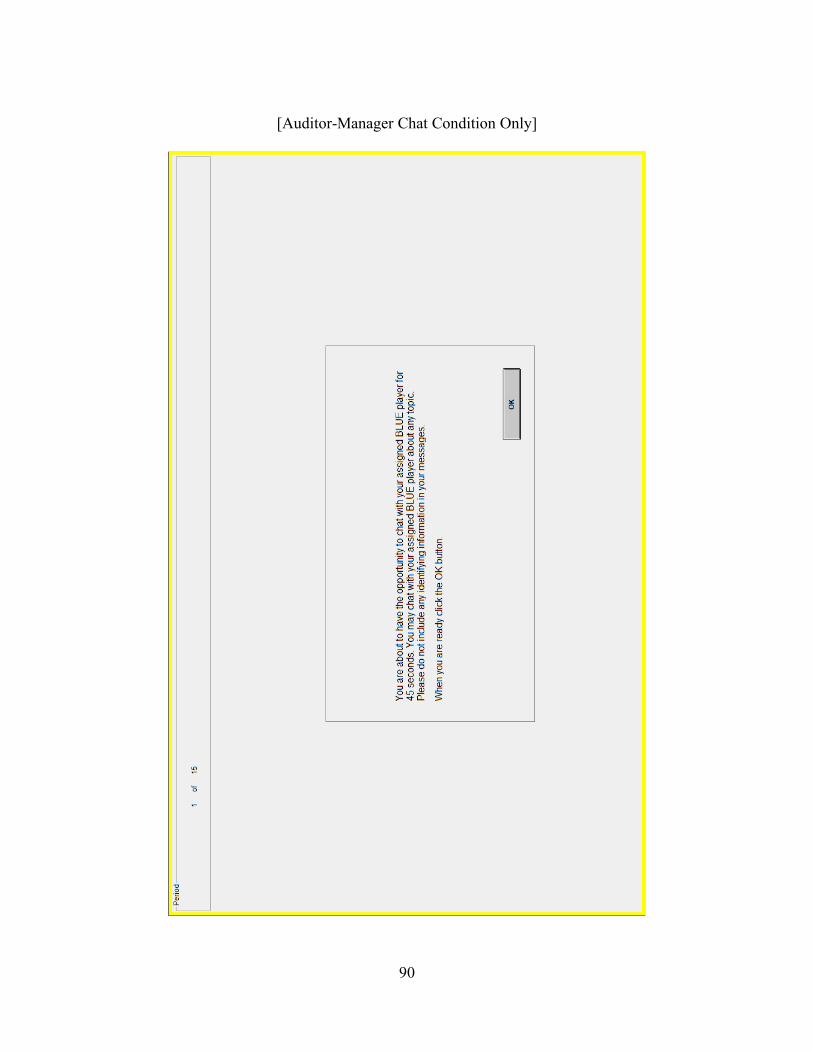
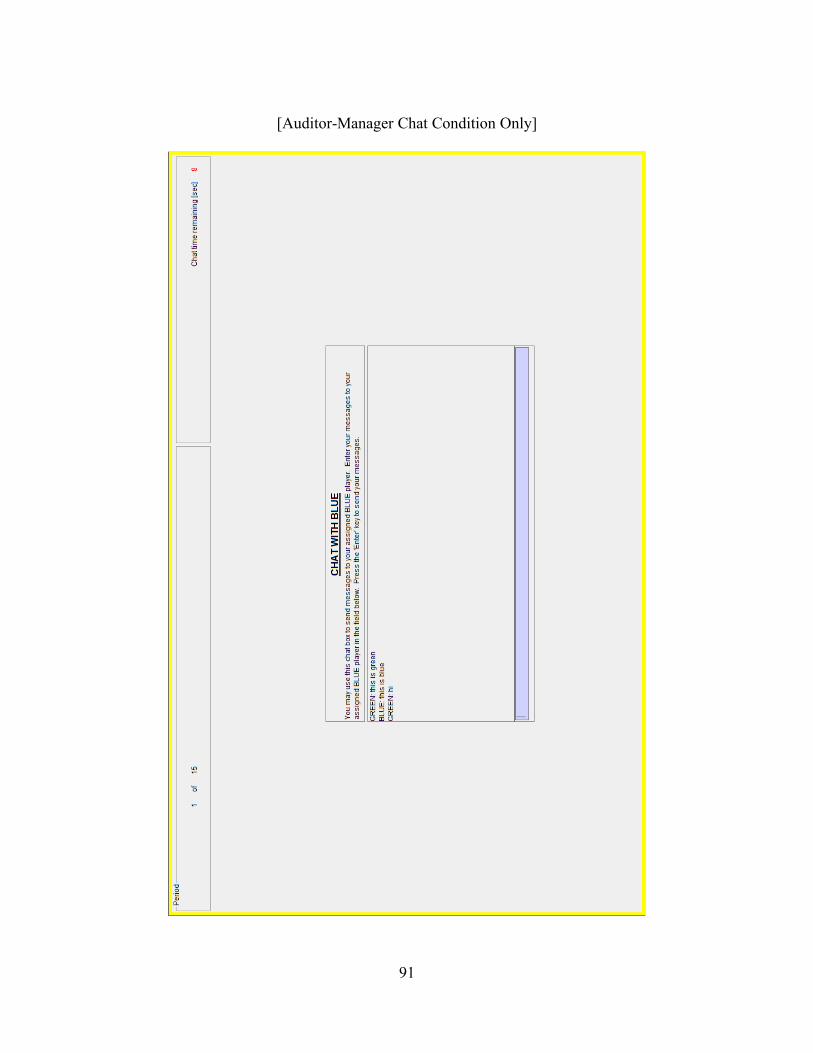
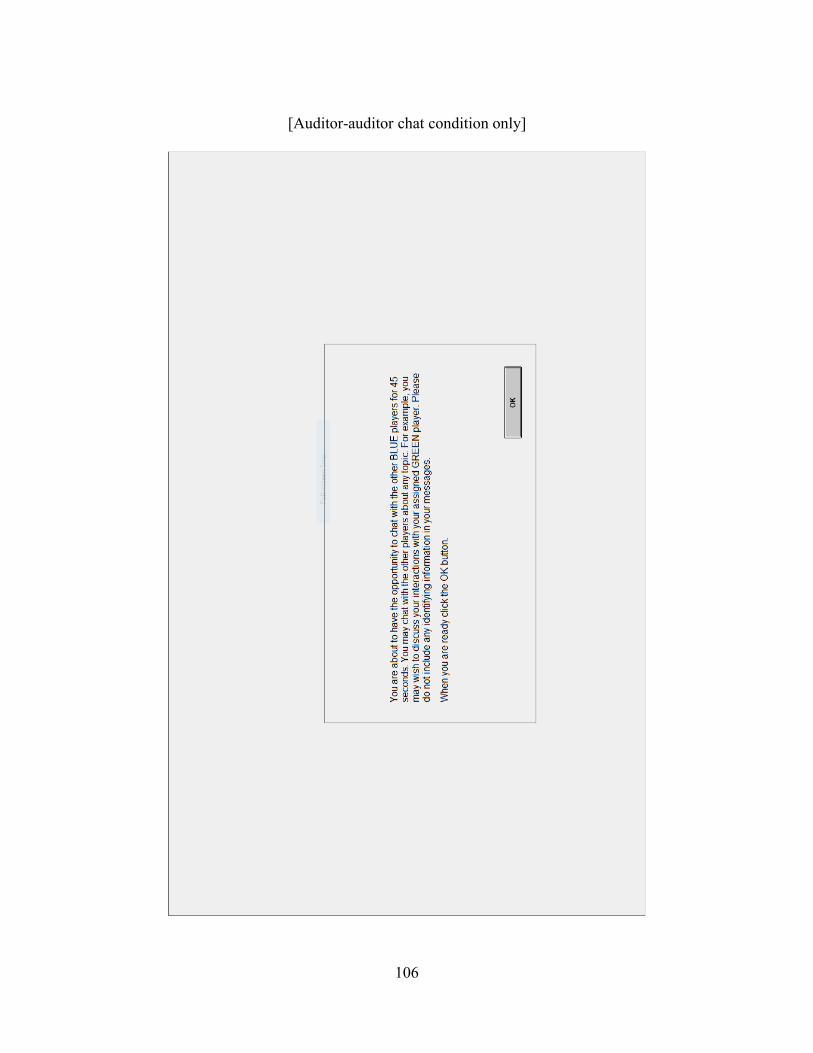
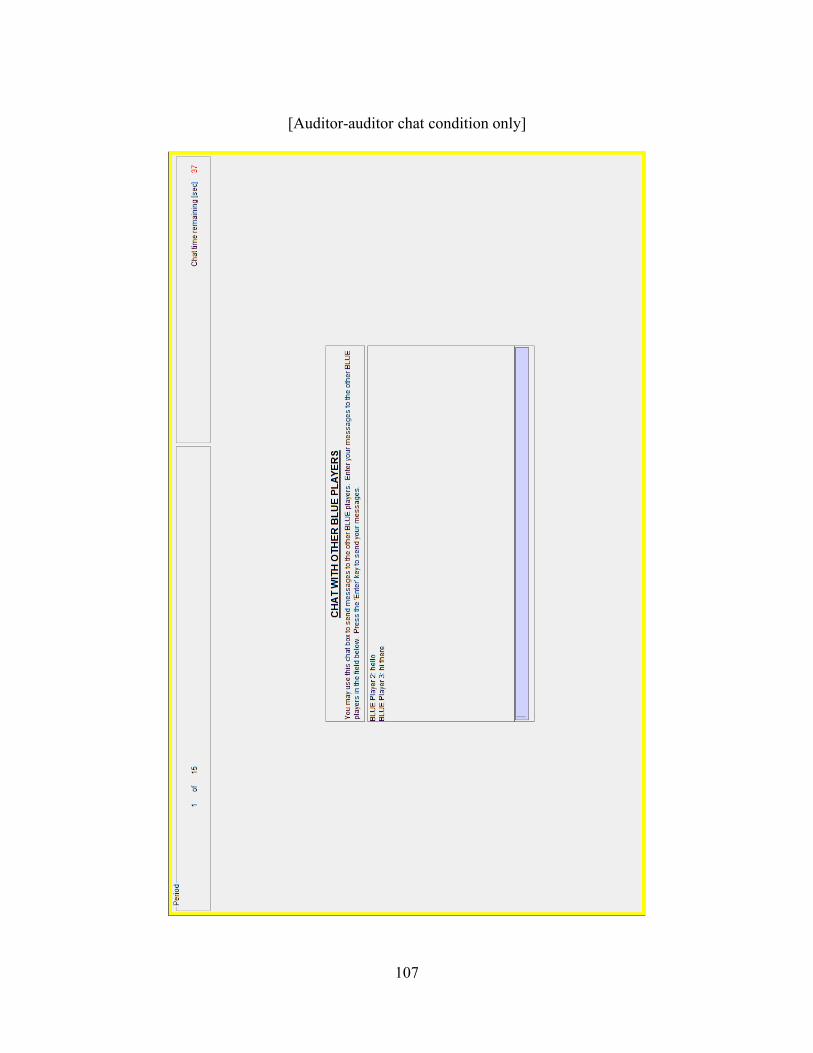
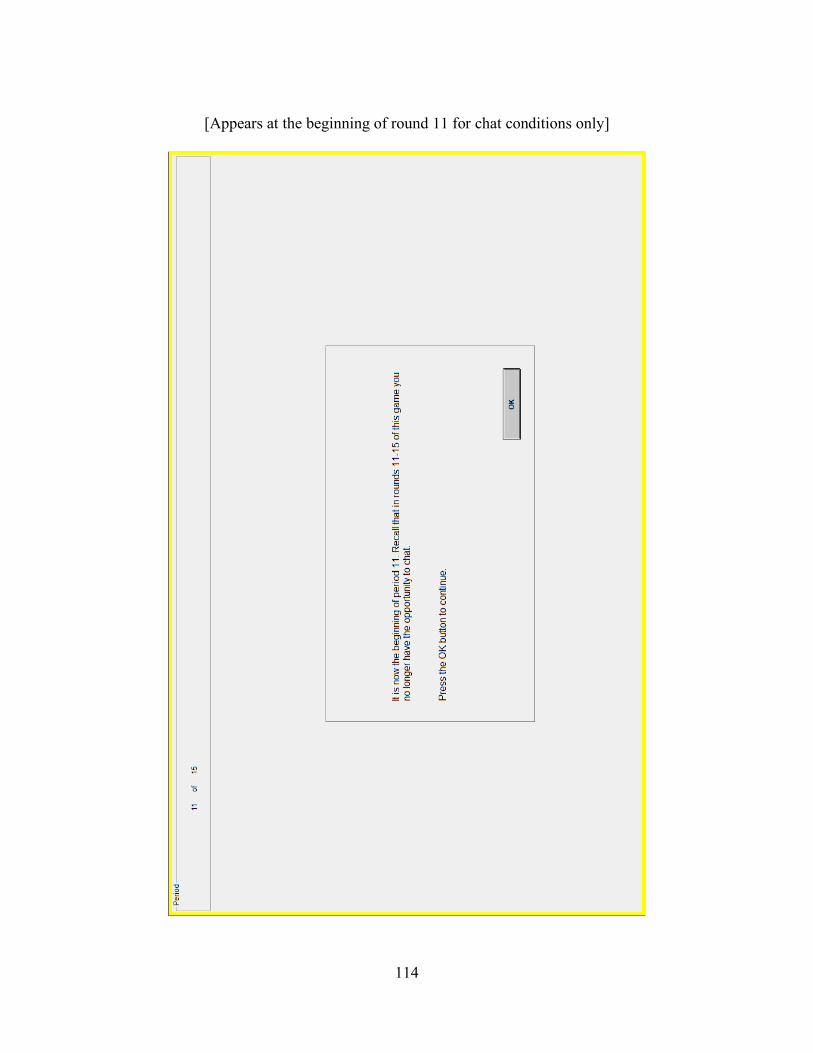
opportunity to chat electronically for forty-five seconds depending on which condition they are
in. Specifically, when the auditors and managers are able to chat, rounds 1-10 begin with this
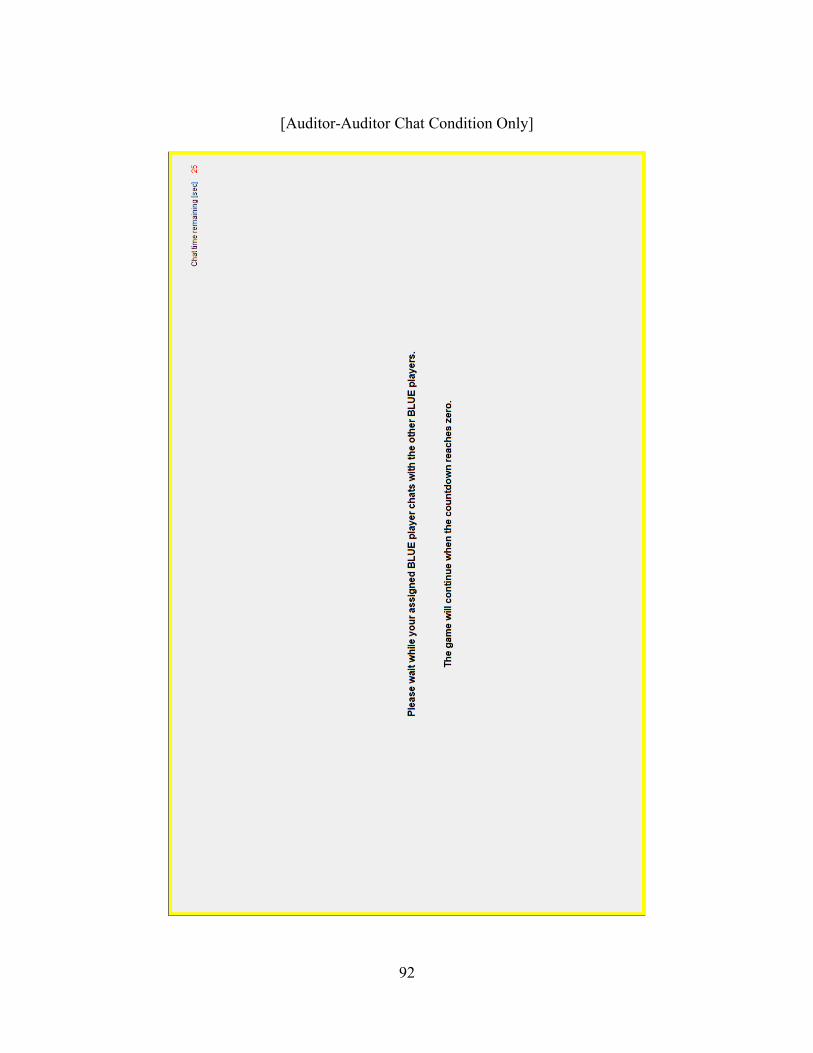
chat session. In conditions when each auditor player is able to chat with the other auditors, this
forty-five-second chat session will follow the auditor-manager chat session, when present. I
order the chat session in this way to model the typical order of events in the audit process. That
is, auditors obtain evidence from the manager and then return to the audit room or firm office
with other auditors. In the final five rounds of all conditions, no players have the opportunity to
chat. I eliminate the chatting in these rounds to analyze the nature of any lingering effects of
communication. In conditions with no chatting, each round begins with the manager’s reporting
choice, which I describe next.
28
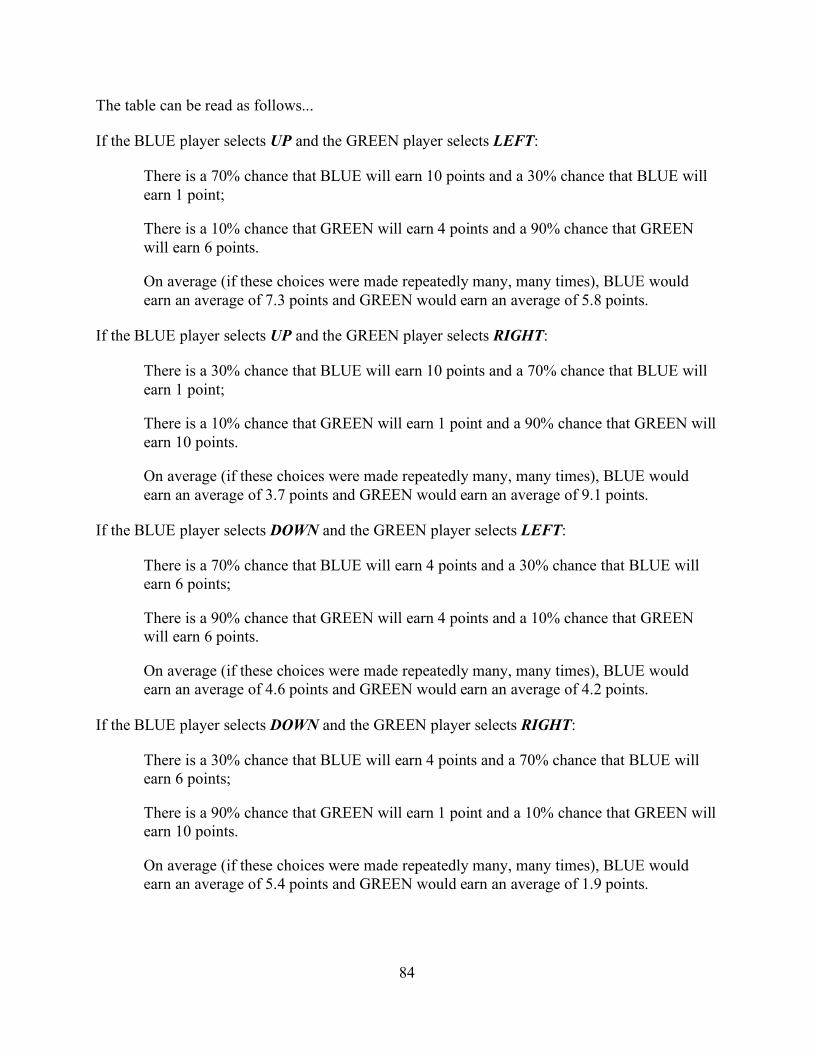
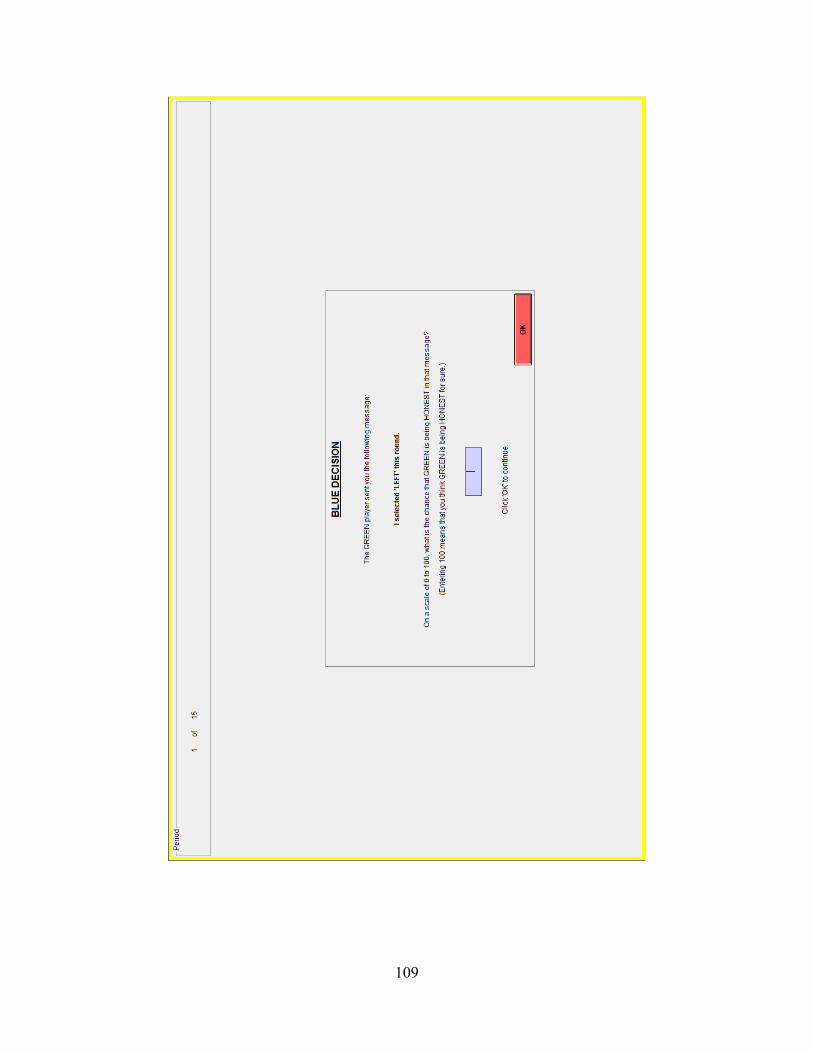
Following the chat sessions (when present), each manager chooses from two possible
strategy choices, “LEFT” or “RIGHT”, which are analogous to conservative or aggressive
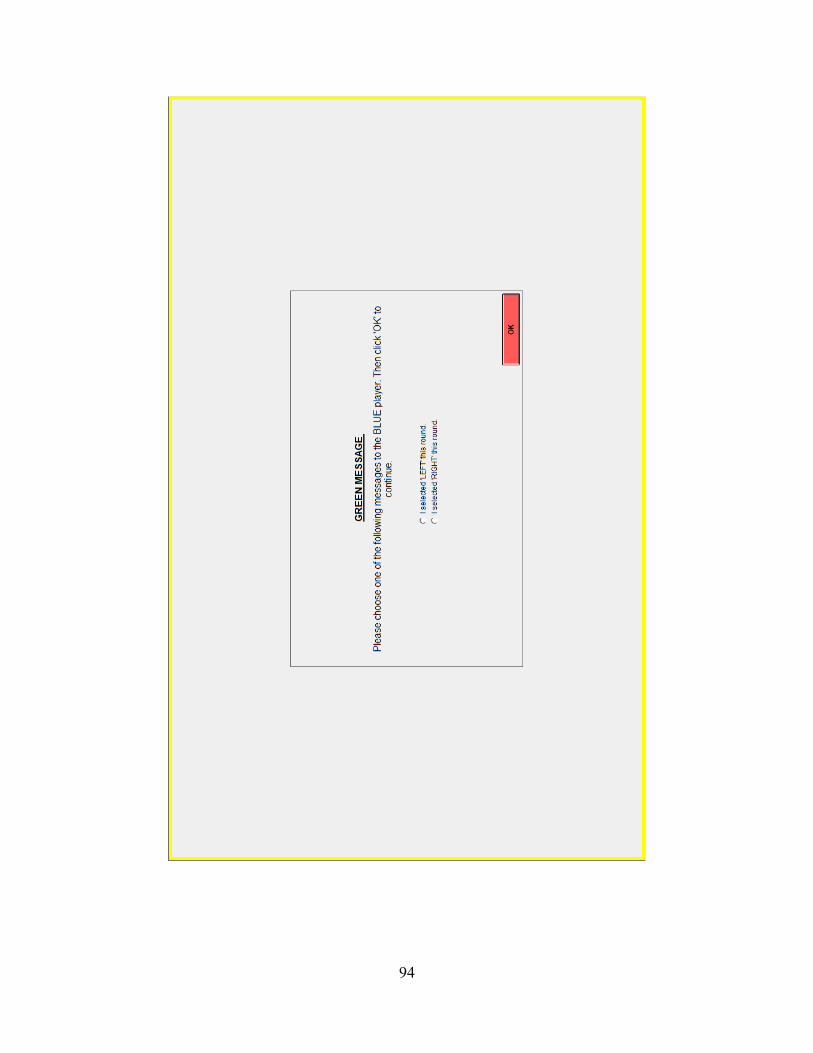
reporting, respectively. Next, the manager sends one of two standardized messages to the
auditor: “I selected LEFT this round.” or “I selected RIGHT this round.” Importantly, I inform
both the managers and auditors that this message is not required to match the manager’s actual
choice, which allows the manager to report dishonestly without a direct penalty. After receiving
this message from the manager, each auditor assesses the honesty of the manager’s message.
Next, the auditor selects a level of audit effort: low effort or high effort, which is characterized as
“UP” and “DOWN”, respectively. Finally, each round concludes with each player learning his or
her own payoff for the round. Importantly, players are never told what choices the other players
make or the payoffs of the other players, and the probabilistic nature of the payoff structure
makes it impossible for a player to know his/her partner’s choice with any certainty. This is
consistent with prior accounting research (King 2002; Bowlin et al. 2017; Bowlin et al. 2015)
and models real-world auditing.
29
FIGURE 3
Progression of Experimental Game
SESSION INTRODUCTION
Participants arrive at experimental lab and receive a copy of the experimental instructions. Experimenter reads the instructions aloud.
Participants complete a quiz, which covers the key manipulations and compensation structure, on the computer.
Participants are assigned to either the manager or auditor role. Each manager is randomly paired with an auditor.
PROCEDURES REPEATED FOR ALL 15 ROUNDS
In the Auditor-Manager Chat condition only, auditor-manager pairs have the opportunity to chat for 45 seconds for the first 10 rounds. In the final 5 rounds, the opportunity to chat will
be eliminated for participants in the Auditor-Manager Chat condition.
In the Auditor-Auditor Chat condition only, all auditor players have the opportunity to chat with the group of auditors for 45 seconds for the first 10 rounds. In the final 5 rounds, the
opportunity to chat will be eliminated for participants in the Auditor-Auditor Chat condition.
The manager chooses a reporting strategy: conservative or aggressive.
The manager makes a representation to the auditor regarding the reporting strategy chosen.
The auditor assesses the honesty of the managers representation.
The auditor selects a level of audit effort: high or low.
Based on the joint outcome of both the auditor and manager, the computer randomly determines the player payoffs, and players learn their payoffs for the period.
SESSION CONCLUSION
Participants complete a post-experimental questionnaire and receive payment for their participation.
30
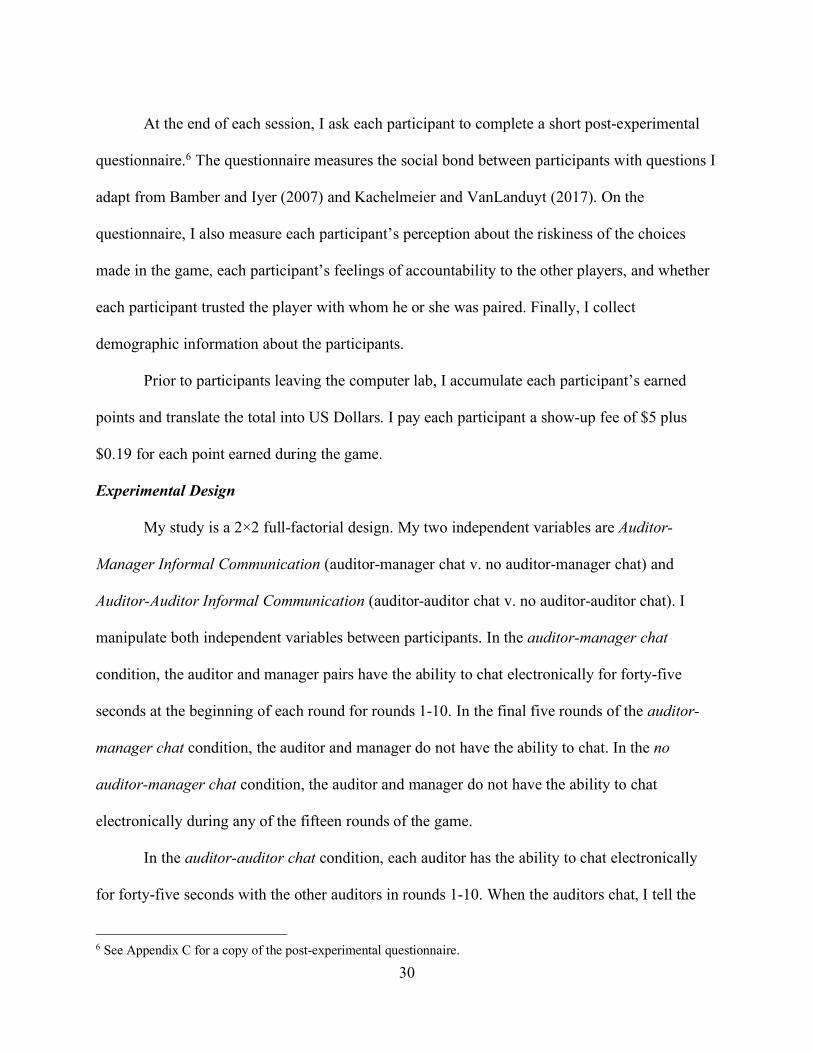
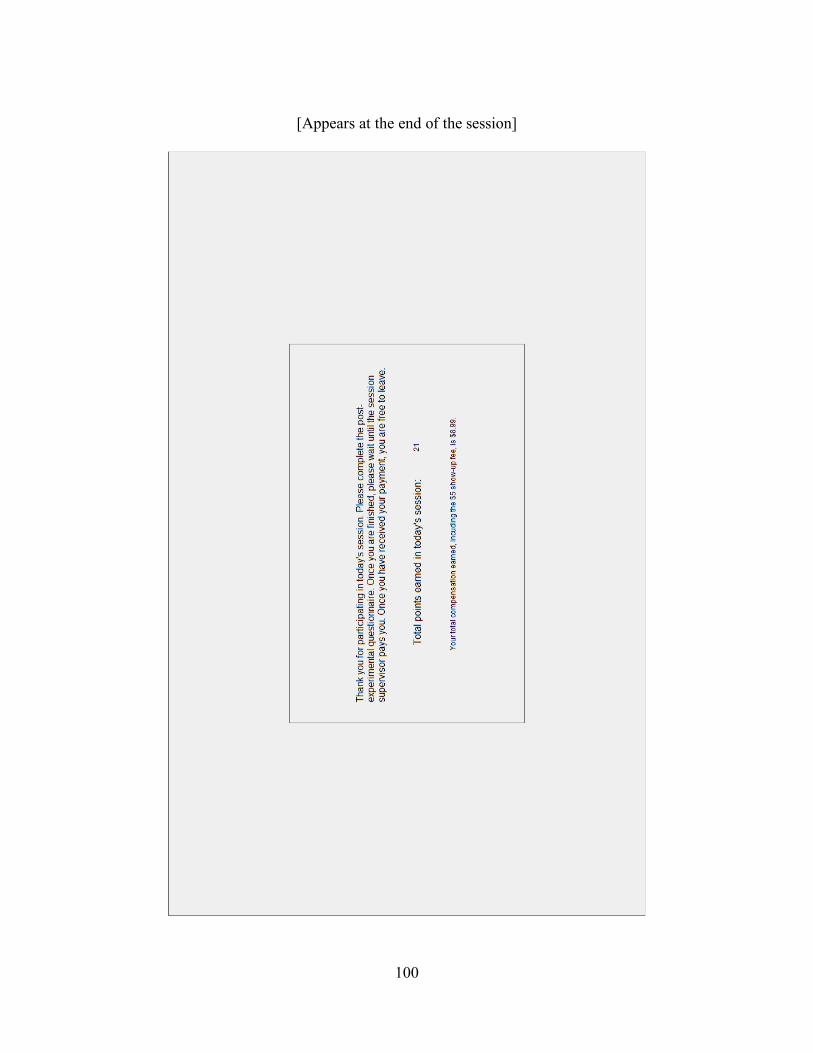
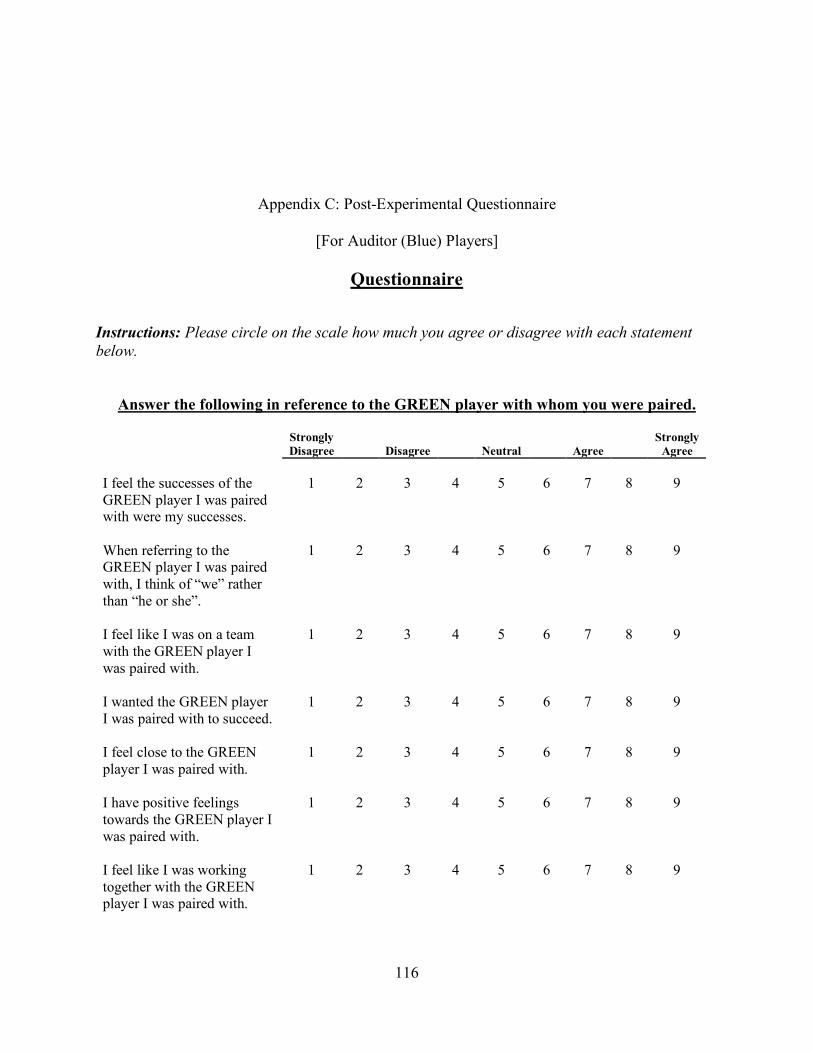
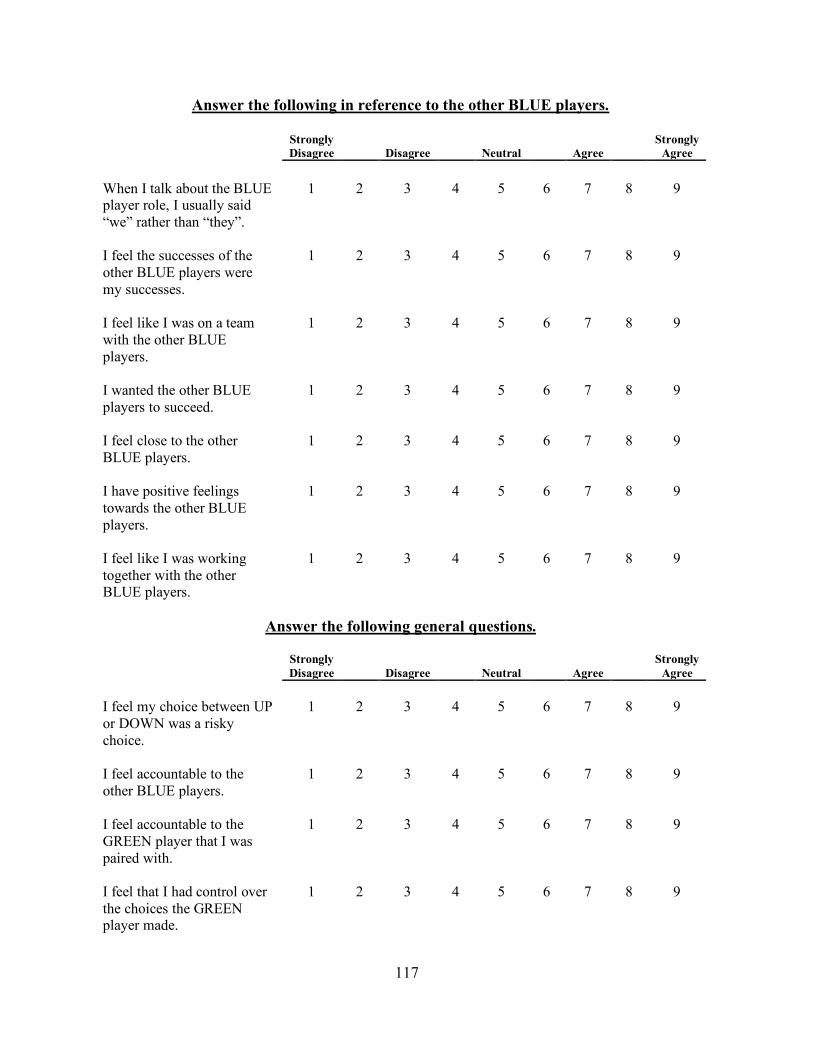
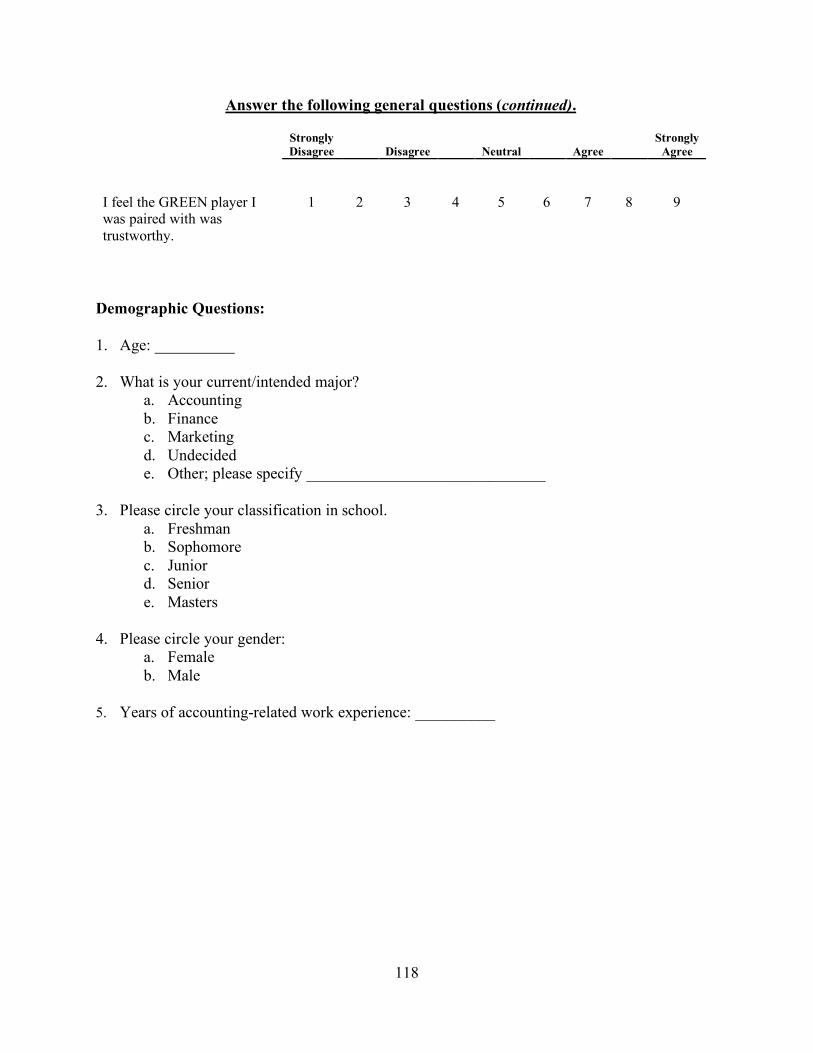
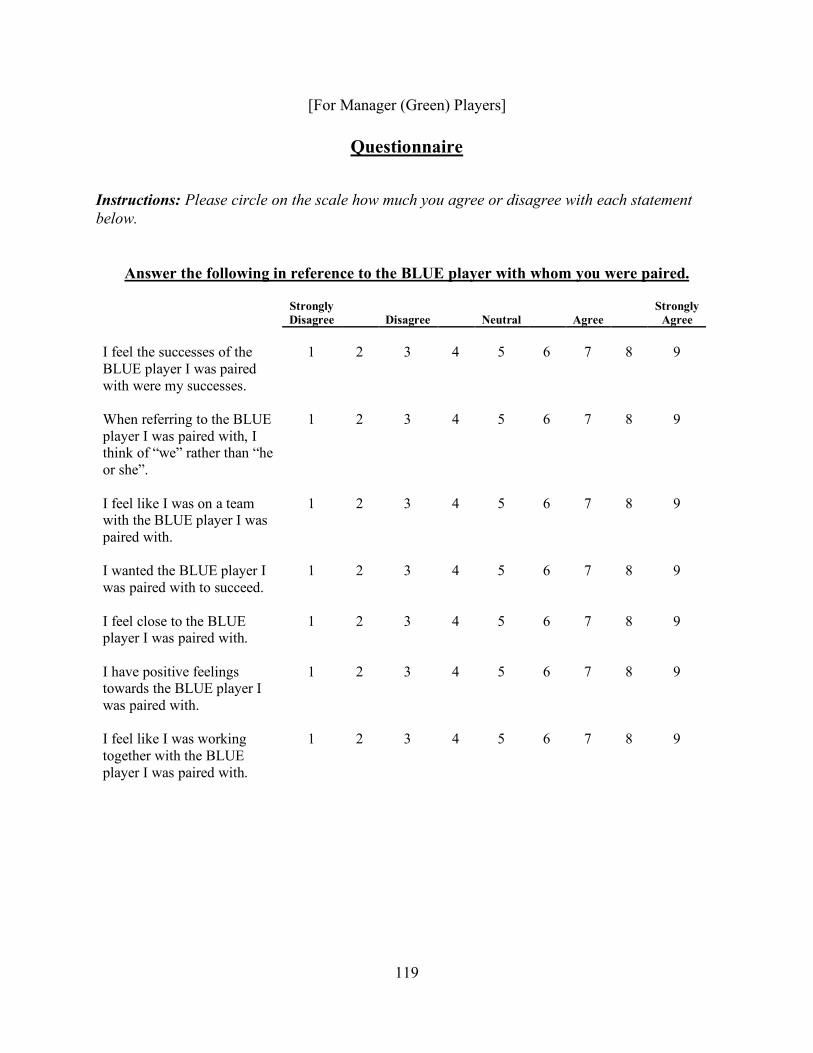
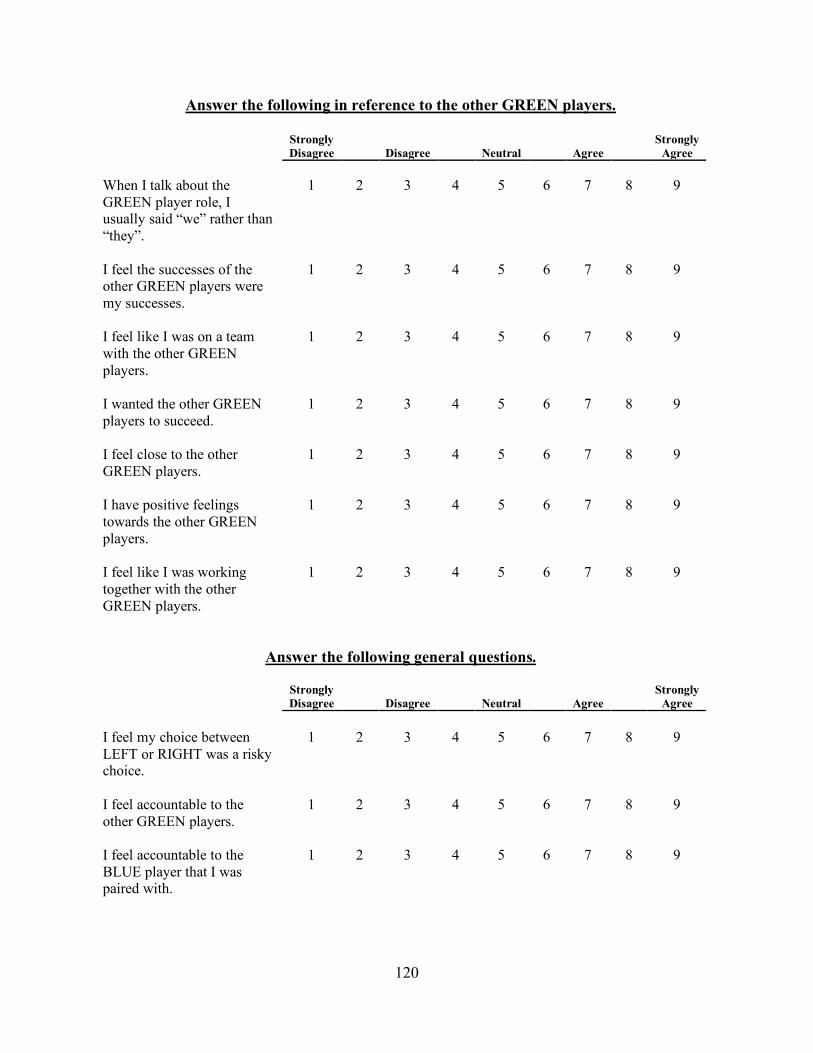
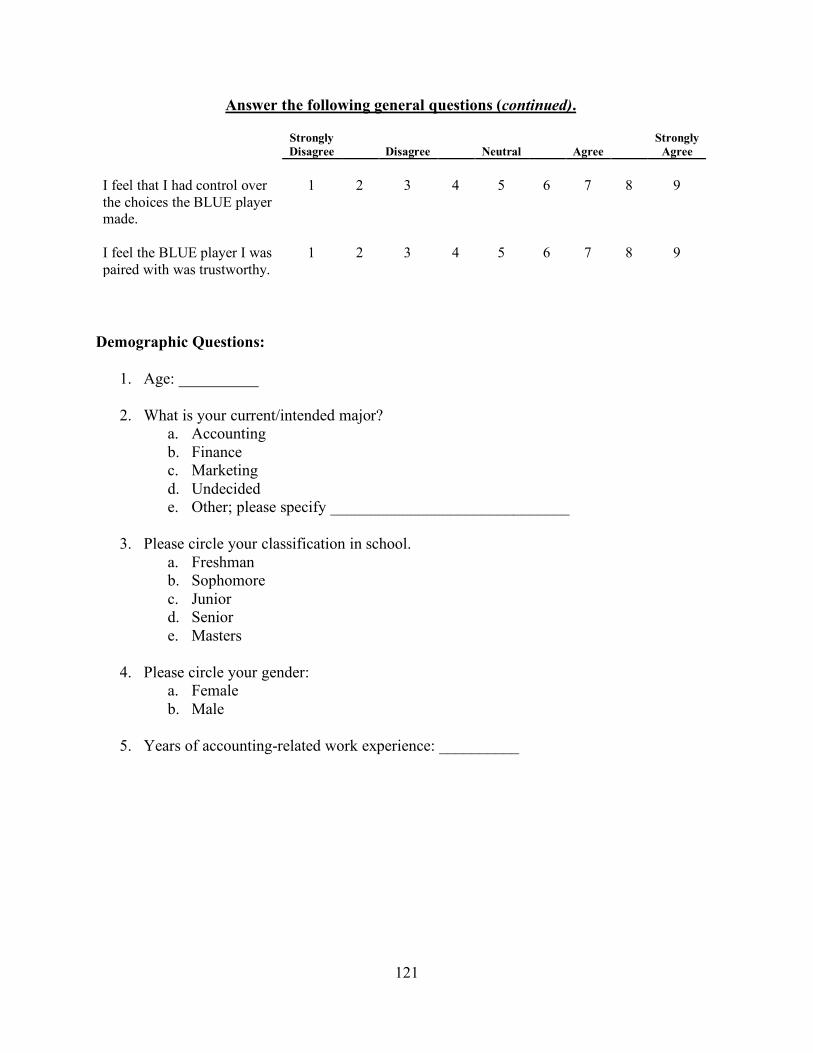
At the end of each session, I ask each participant to complete a short post-experimental
questionnaire.6 The questionnaire measures the social bond between participants with questions I
adapt from Bamber and Iyer (2007) and Kachelmeier and VanLanduyt (2017). On the
questionnaire, I also measure each participant’s perception about the riskiness of the choices
made in the game, each participant’s feelings of accountability to the other players, and whether
each participant trusted the player with whom he or she was paired. Finally, I collect
demographic information about the participants.
Prior to participants leaving the computer lab, I accumulate each participant’s earned
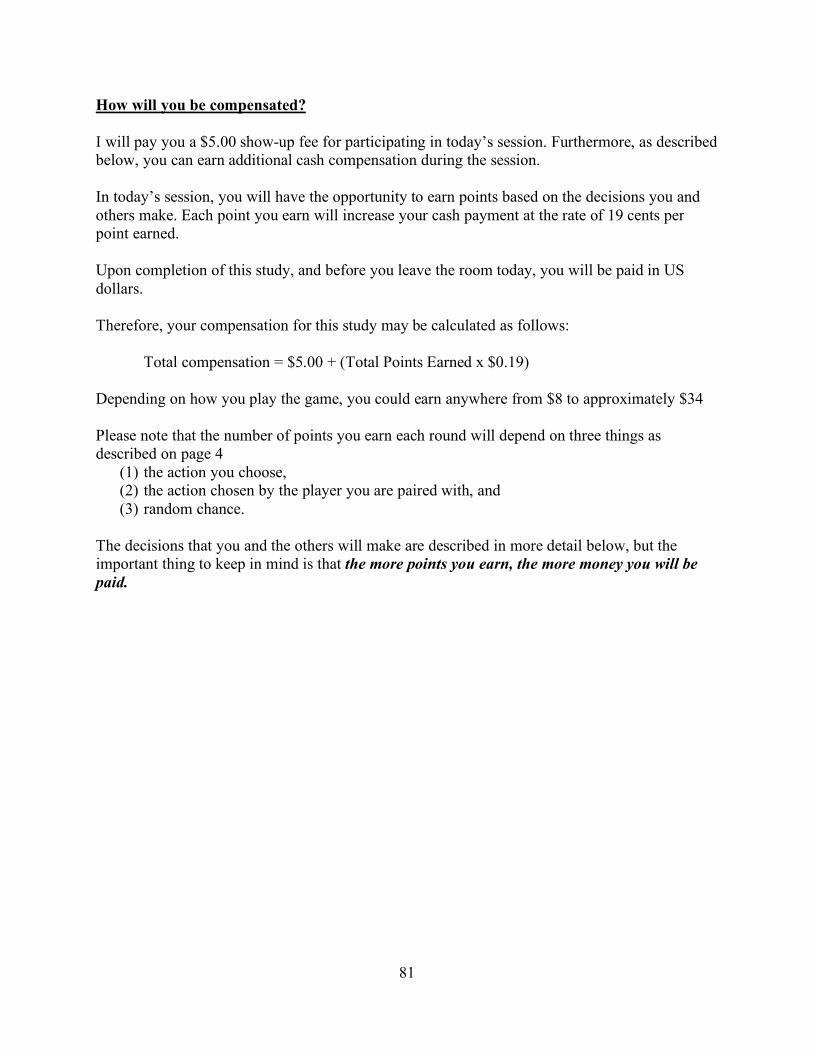
points and translate the total into US Dollars. I pay each participant a show-up fee of $5 plus
$0.19 for each point earned during the game.
Experimental Design
My study is a 2×2 full-factorial design. My two independent variables are Auditor-
Manager Informal Communication (auditor-manager chat v. no auditor-manager chat) and
Auditor-Auditor Informal Communication (auditor-auditor chat v. no auditor-auditor chat). I
manipulate both independent variables between participants. In the auditor-manager chat
condition, the auditor and manager pairs have the ability to chat electronically for forty-five
seconds at the beginning of each round for rounds 1-10. In the final five rounds of the auditor-
manager chat condition, the auditor and manager do not have the ability to chat. In the no
auditor-manager chat condition, the auditor and manager do not have the ability to chat
electronically during any of the fifteen rounds of the game.
In the auditor-auditor chat condition, each auditor has the ability to chat electronically
for forty-five seconds with the other auditors in rounds 1-10. When the auditors chat, I tell the
6 See Appendix C for a copy of the post-experimental questionnaire.
31
managers that the auditors are chatting. In the final five rounds of the auditor-auditor chat
condition, the auditors do not have the ability to chat among themselves. In the no auditor-
auditor chat condition, the auditors never have the ability to chat among themselves.
Dependent Variables
Because financial reporting outcomes include both the auditor and manager’s decisions,
my dependent variables are honesty of management representations, auditor beliefs about
manager honesty, and audit quality (Gaynor et al. 2016). I measure the honesty of the manager’s
representation as the absolute difference between the reporting choice the manager makes and
the representation the manager provides to the auditor. I measure the auditor’s beliefs about
manager honesty as the average of each auditor’s assessments of the honesty of his/her
manager's representation. Finally, I measure audit quality as the joint outcome of the manager’s
reporting choice and the auditor’s selected audit effort.
32
IV. ANALYSIS OF RESULTS
Tests of H1: Analysis of Manager Behavior
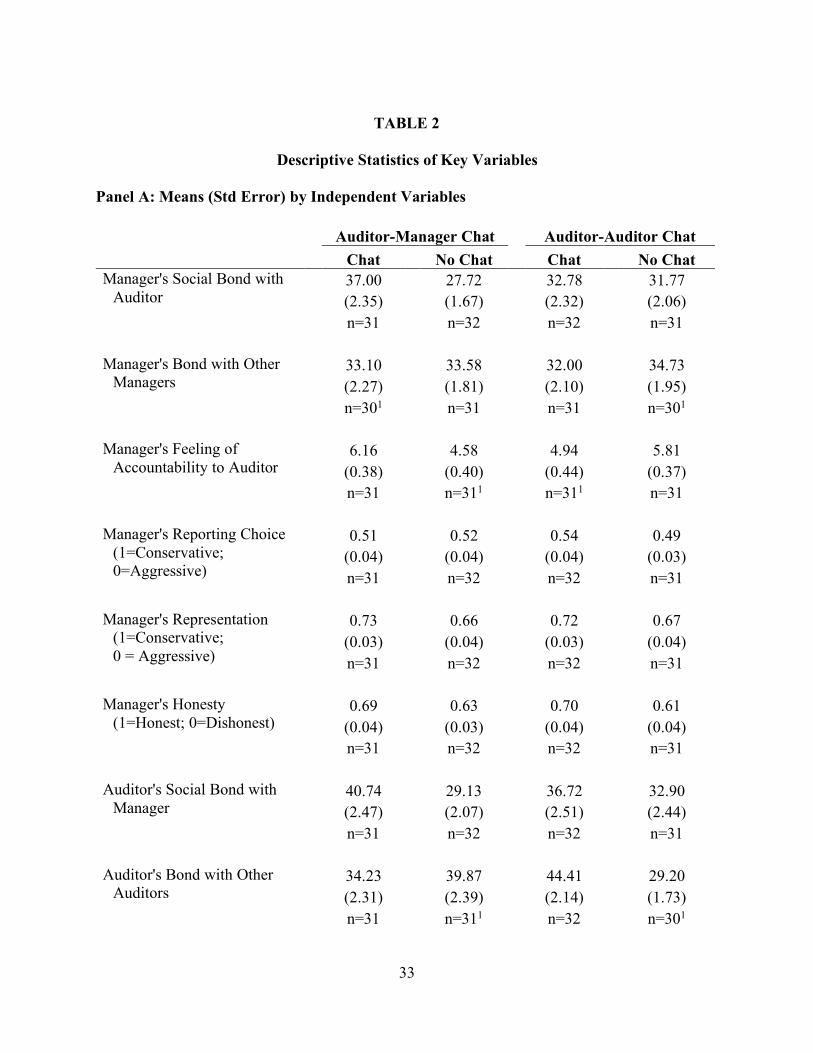
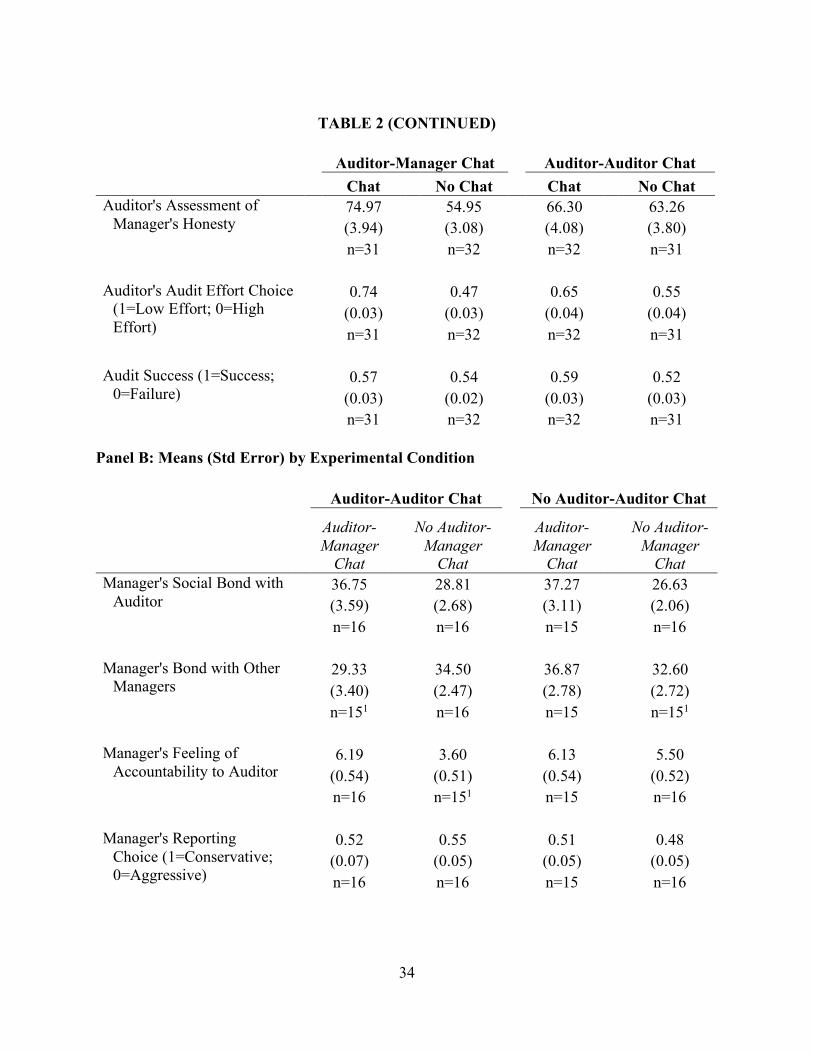
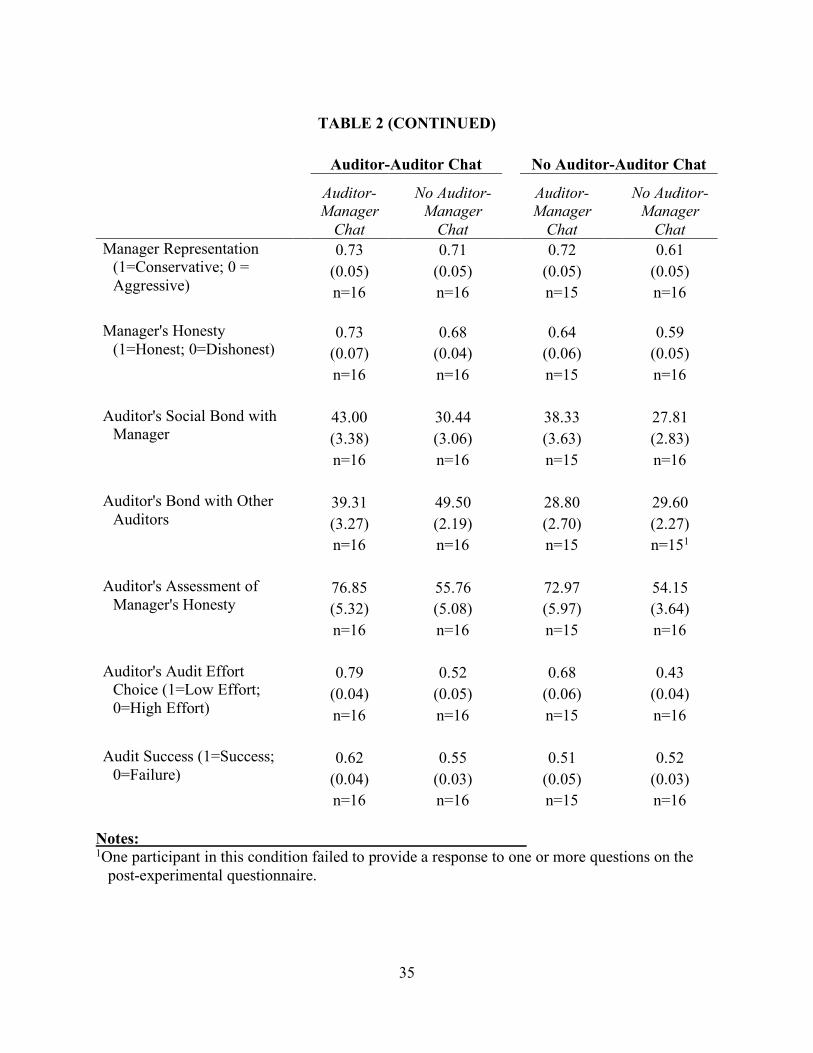
I analyze the managers’ behavior first. Table 2 includes the means and standard errors of
my key variables. Panel A reports means by my independent variables and shows managers
developed a stronger social bond with the auditors when the managers were able to informally
communicate with the auditors than when they were not (37.00 v. 27.72; p = 0.001, one-tailed).7
Importantly, the manager bonds with the auditor even though the manager and auditor have
competing incentives. Furthermore, the managers made slightly more honest representations to
the auditor on average when the auditors and managers informally communicated than when
they did not (0.69 v. 0.63; p = 0.174, one-tailed), but this difference is not statistically
significant. Managers are more honest when the auditors were able to informally communicate
with each other versus when the auditors did not informally communicate with each other (0.70
v. 0.61; p = 0.051, one-tailed). Managers report higher feelings of accountability toward their
auditor counterparts when the managers informally communicated with the auditors than when
they did not (6.16 v. 4.58; p < 0.01; one-tailed).8
7 The manager's social bond with the auditor equals the summation of questions 1 through 7 on the post-experimental questionnaire included in Appendix C. A higher score indicates a stronger social bond. 8 The manager's feeling of accountability toward the auditor is obtained from question 17 on the post-experimental questionnaire in Appendix C. A higher score indicates a greater feeling of accountability.
33
TABLE 2
Descriptive Statistics of Key Variables
Panel A: Means (Std Error) by Independent Variables Auditor-Manager Chat Auditor-Auditor Chat
Chat No Chat Chat No Chat Manager's Social Bond with
Notes: 1One participant in this condition failed to provide a response to one or more questions on the
post-experimental questionnaire.
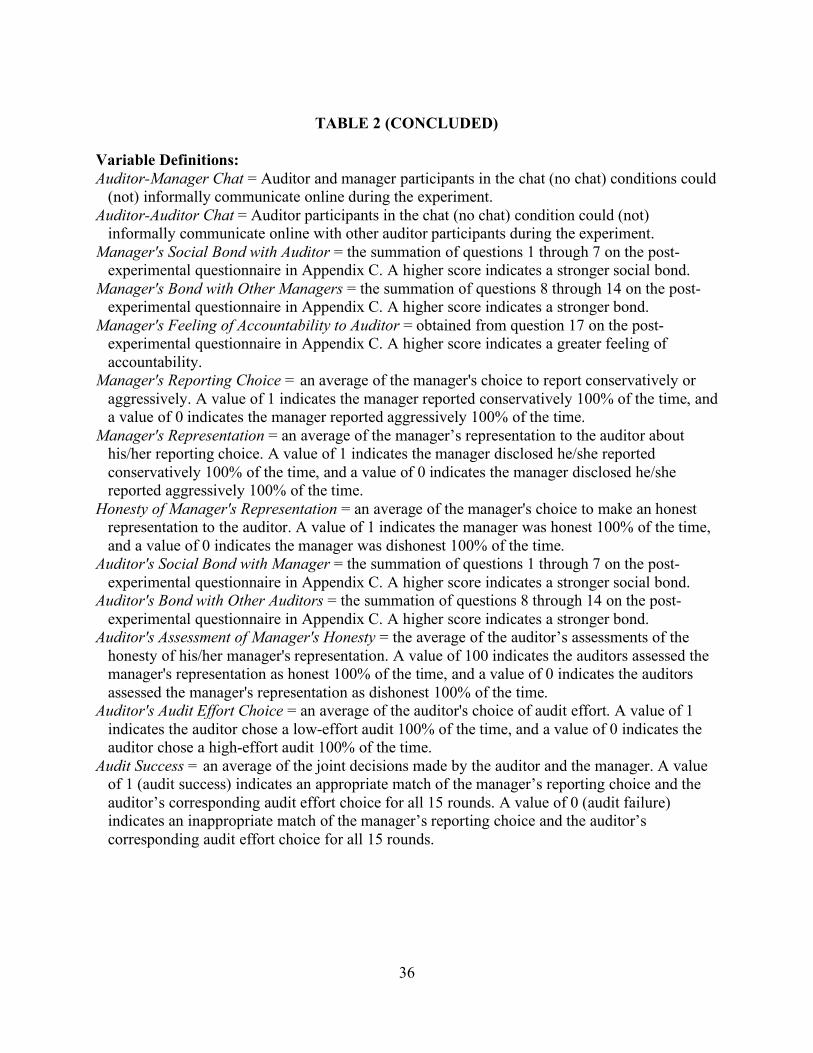
36
TABLE 2 (CONCLUDED) Variable Definitions: Auditor-Manager Chat = Auditor and manager participants in the chat (no chat) conditions could
(not) informally communicate online during the experiment. Auditor-Auditor Chat = Auditor participants in the chat (no chat) condition could (not)
informally communicate online with other auditor participants during the experiment. Manager's Social Bond with Auditor = the summation of questions 1 through 7 on the post-
experimental questionnaire in Appendix C. A higher score indicates a stronger social bond. Manager's Bond with Other Managers = the summation of questions 8 through 14 on the post-
experimental questionnaire in Appendix C. A higher score indicates a stronger bond. Manager's Feeling of Accountability to Auditor = obtained from question 17 on the post-
experimental questionnaire in Appendix C. A higher score indicates a greater feeling of accountability.
Manager's Reporting Choice = an average of the manager's choice to report conservatively or aggressively. A value of 1 indicates the manager reported conservatively 100% of the time, and a value of 0 indicates the manager reported aggressively 100% of the time.
Manager's Representation = an average of the manager’s representation to the auditor about his/her reporting choice. A value of 1 indicates the manager disclosed he/she reported conservatively 100% of the time, and a value of 0 indicates the manager disclosed he/she reported aggressively 100% of the time.
Honesty of Manager's Representation = an average of the manager's choice to make an honest representation to the auditor. A value of 1 indicates the manager was honest 100% of the time, and a value of 0 indicates the manager was dishonest 100% of the time.
Auditor's Social Bond with Manager = the summation of questions 1 through 7 on the post-experimental questionnaire in Appendix C. A higher score indicates a stronger social bond.
Auditor's Bond with Other Auditors = the summation of questions 8 through 14 on the post-experimental questionnaire in Appendix C. A higher score indicates a stronger bond.
Auditor's Assessment of Manager's Honesty = the average of the auditor’s assessments of the honesty of his/her manager's representation. A value of 100 indicates the auditors assessed the manager's representation as honest 100% of the time, and a value of 0 indicates the auditors assessed the manager's representation as dishonest 100% of the time.
Auditor's Audit Effort Choice = an average of the auditor's choice of audit effort. A value of 1 indicates the auditor chose a low-effort audit 100% of the time, and a value of 0 indicates the auditor chose a high-effort audit 100% of the time.
Audit Success = an average of the joint decisions made by the auditor and the manager. A value of 1 (audit success) indicates an appropriate match of the manager’s reporting choice and the auditor’s corresponding audit effort choice for all 15 rounds. A value of 0 (audit failure) indicates an inappropriate match of the manager’s reporting choice and the auditor’s corresponding audit effort choice for all 15 rounds.
37
My first hypothesis set makes predictions about how informal communication between
the auditor and manager affects the honesty of the manager’s representations to the auditor and
whether informal communication among auditors moderates that effect. I first perform an
analysis of variance (ANOVA) for both hypotheses.9 Table 3 contains the results of the
ANOVAs. Next, I use a regression-based analysis method which allows me to simultaneously
test my hypotheses and the underlying theory. Specifically, I use model 87 from the PROCESS
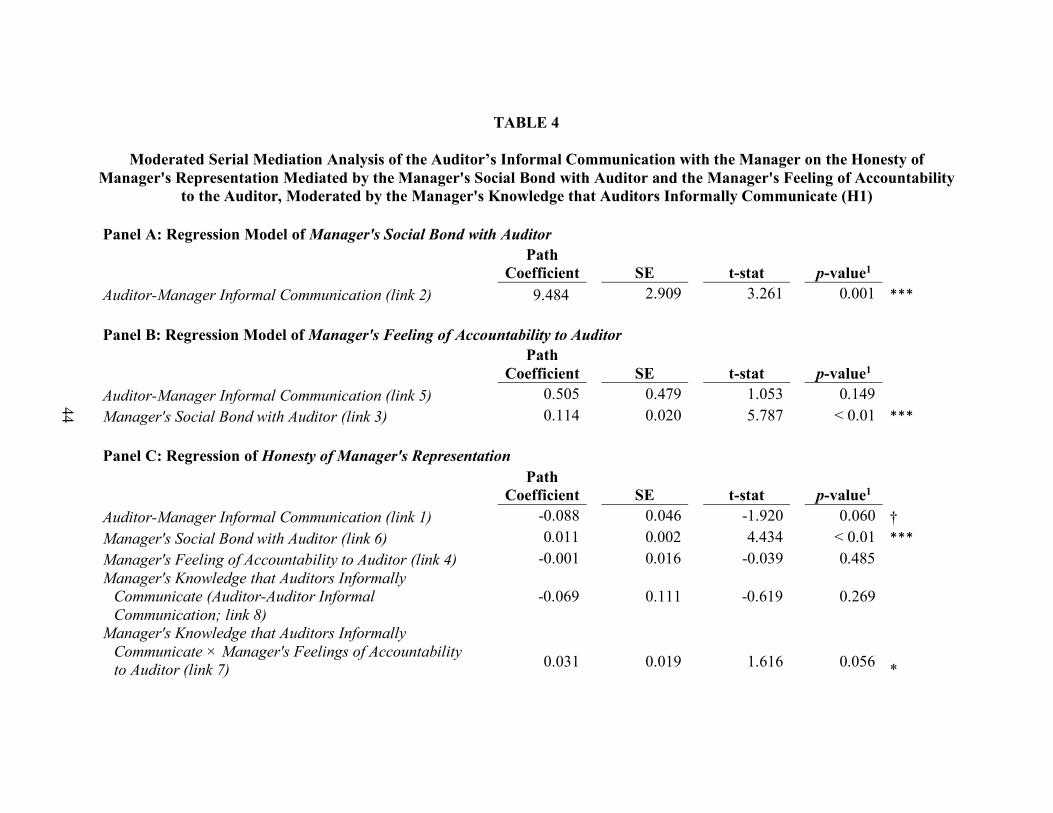
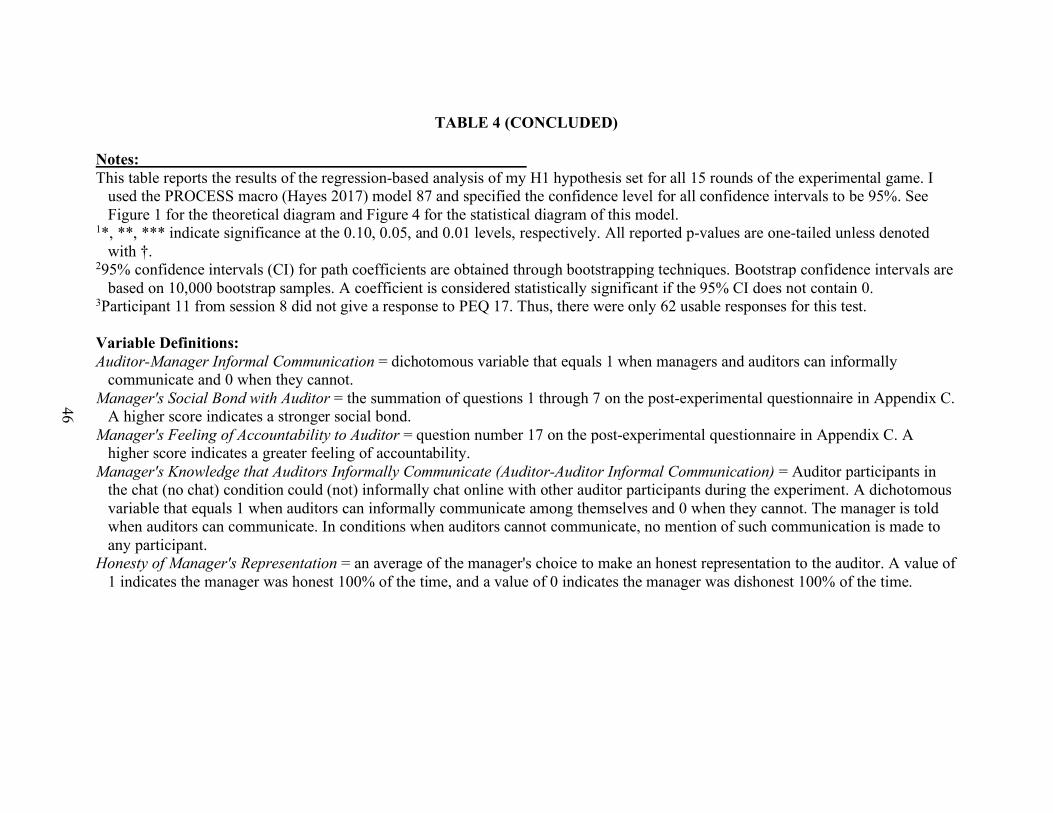
macro (Hayes 2017), which models my theory. Table 4 and Figure 4 contain the statistical results
for my process model.10
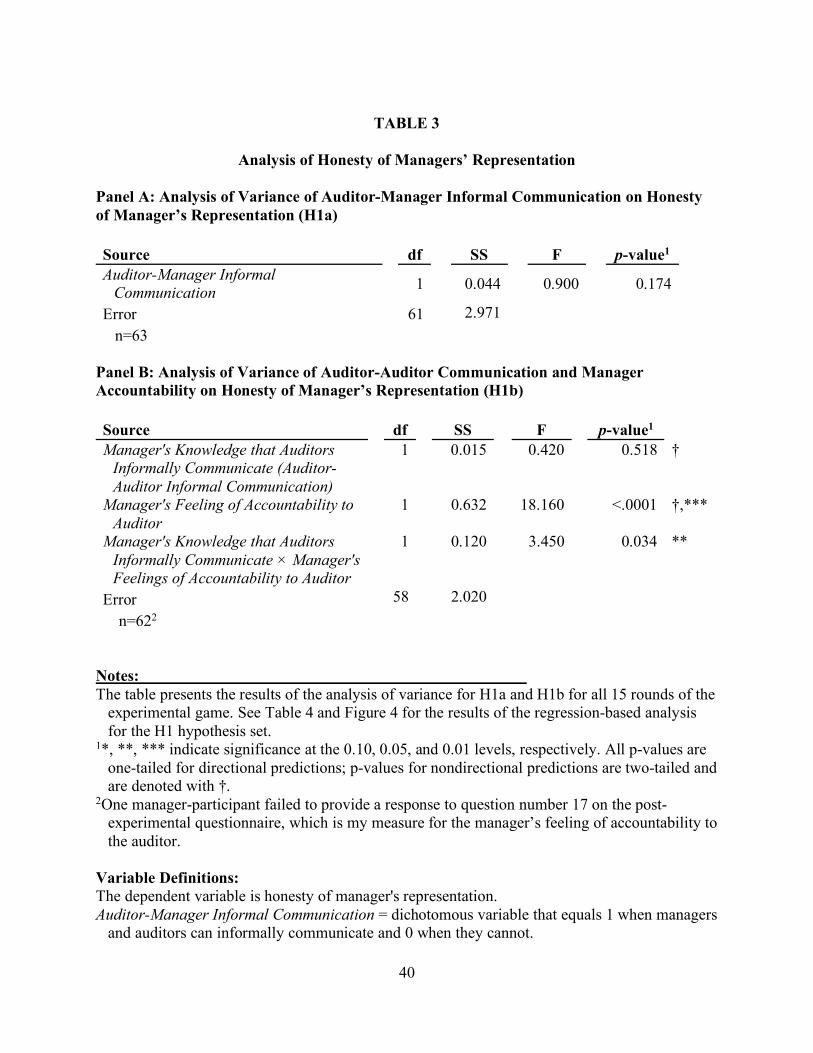
H1a predicts managers will make more honest representations to the auditors when the
manager and auditor informally communicate than when they do not. The result of the ANOVA
in Panel A of Table 3 is the total effect of auditor-manager informal communication on the
honesty of the manager’s disclosure and shows that managers are not more honest when they
informally communicate with the auditor than when they do not (F = 0.90; p = 0.174, one-tailed).
However, the results of the regression-based analysis in Table 4 and Figure 4 provide more detail
about the effect of the manager’s informal communication with the auditor on the honesty of the
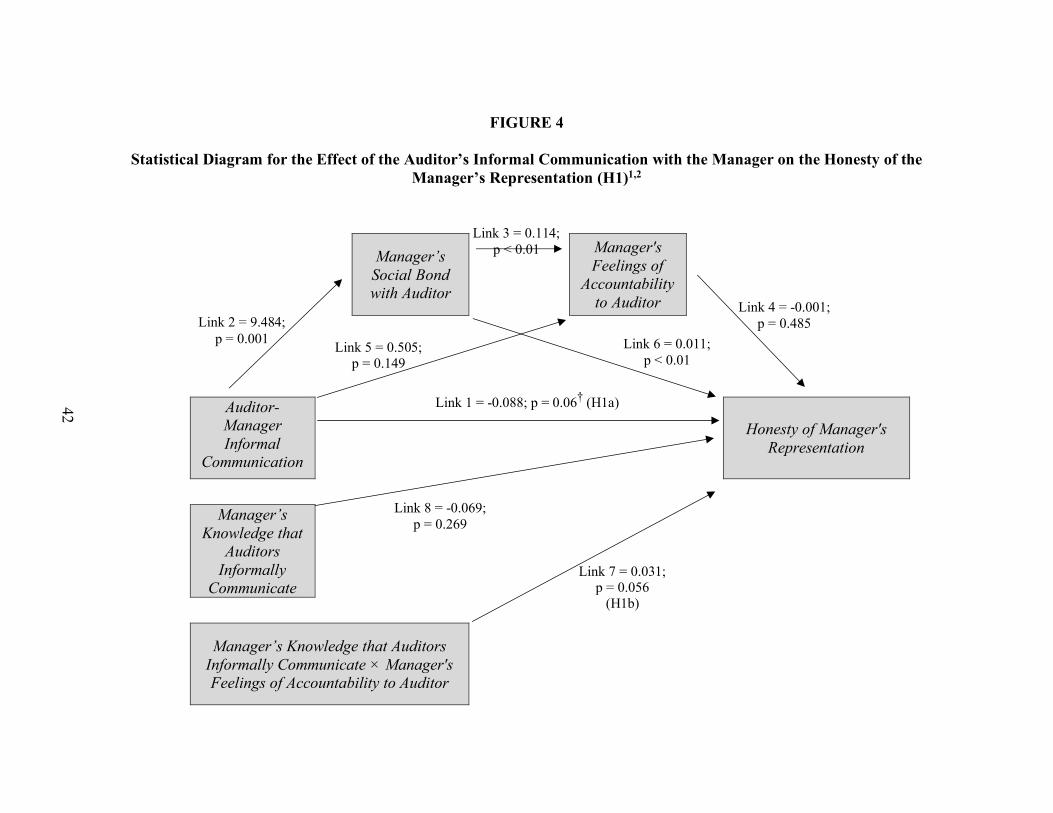
manager’s disclosure. First, there is a negative direct effect of the manager’s informal
communication with the auditor on the manager’s honesty (link 1; coeff = -0.088; p = 0.06, two-
tailed), which is the opposite direction from what I predict. Thus, the direct effect suggests that
9 I perform an analysis of covariance (ANCOVA) for each of my hypotheses and include participant demographics (age, gender, classification in school, major, and work experience) in the model as covariates. While some demographic variables are significant covariates, the results are qualitatively the same as when I exclude the demographic variables. For example, in my test for H1a, I find that gender is a significant covariate of manager honesty; specifically, I find that females are more honest than males. This is the only analysis in which gender is a significant covariate. 10 The regression-based analysis for H1 is based only on 62 of the 63 manager-participants because one participant failed to provide a response to question 17 on the post-experimental questionnaire, which is my measure of how accountable the manager felt to the auditor.
38
holding all other factors in the model constant, the manager is more dishonest when the manager
and auditor informally communicate, because the manager is better off lying about his/her
reporting choice. That is, absent the social bond, the manager’s disclosures to the auditor appear
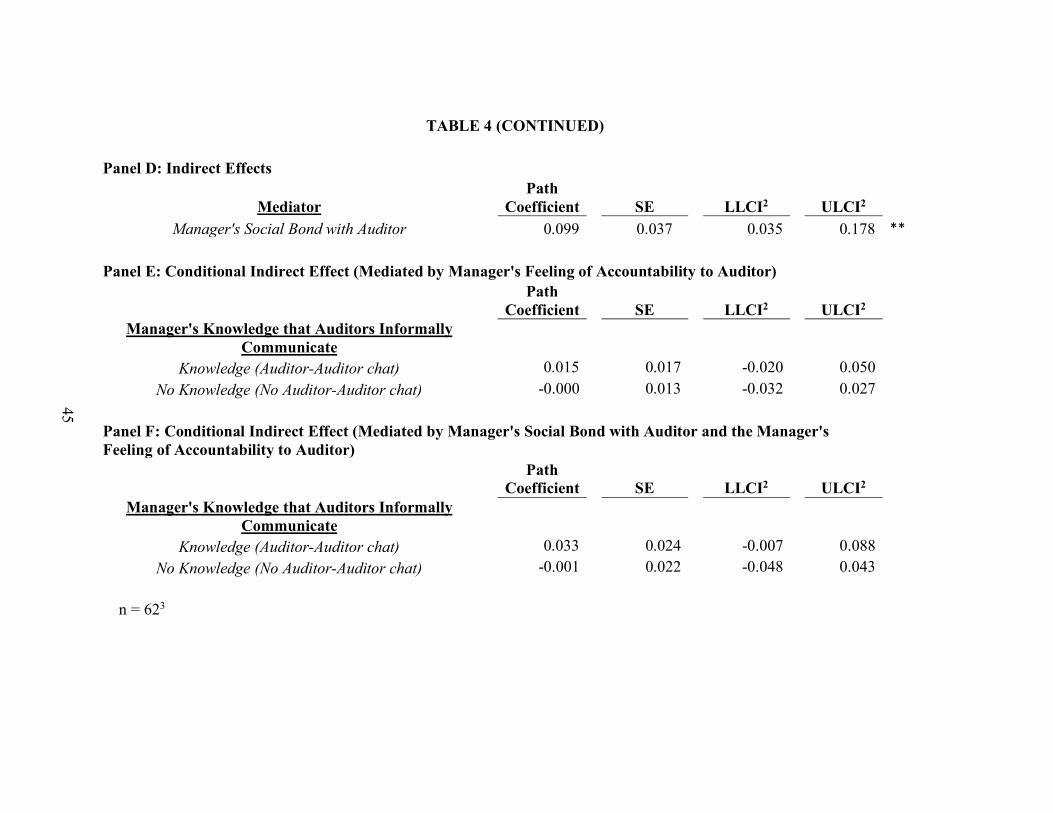
to be cheap talk. However, there is a significant, positive indirect effect of the manager’s
informal communication with the auditor on the honesty of the manager’s representation through
the manager’s social bond with the auditor (links 2 and 6). The indirect effect suggests that when
the auditor and manager informally communicate the manager makes more honest
representations to the auditor because of the social bond the manager has with the auditor (coeff
= 0.099; LLCI = 0.035, ULCI = 0.178; Table 4 Panel D).11 The indirect effect is consistent with
my prediction. Auditor-manager interactions have a positive impact on manager behavior.
Specifically, the indirect effect suggests that the effect of the social bond cancels out the negative
effect of cheap talk. H1a is supported because of the significant indirect effect I observe.
H1b predicts that the manager’s knowledge that auditors informally communicate with
one another will have a positive moderating effect on the relationship between the manager’s
feelings of accountability toward the auditor and the honesty of the manager’s representations.
The interaction reported in Panel B of Table 3 support H1b (F = 3.450; p = 0.034, one-tailed).
Furthermore, in the regression-based analysis reported in Table 4 and Figure 4, the interaction
between the manager’s knowledge that auditors informally communicate and the managers
feeling of accountability to the auditor is marginally significant (link 7; coeff = 0.031; p = 0.056,
one-tailed). Thus, H1b is supported, and the auditor’s informal communication with other
auditors has a positive effect on the relationship between the manager’s feeling of accountability
to the auditor and the manager’s honesty. The conditional indirect effect of the manager’s
11 The 95% confidence interval does not contain zero indicating statistical significance.
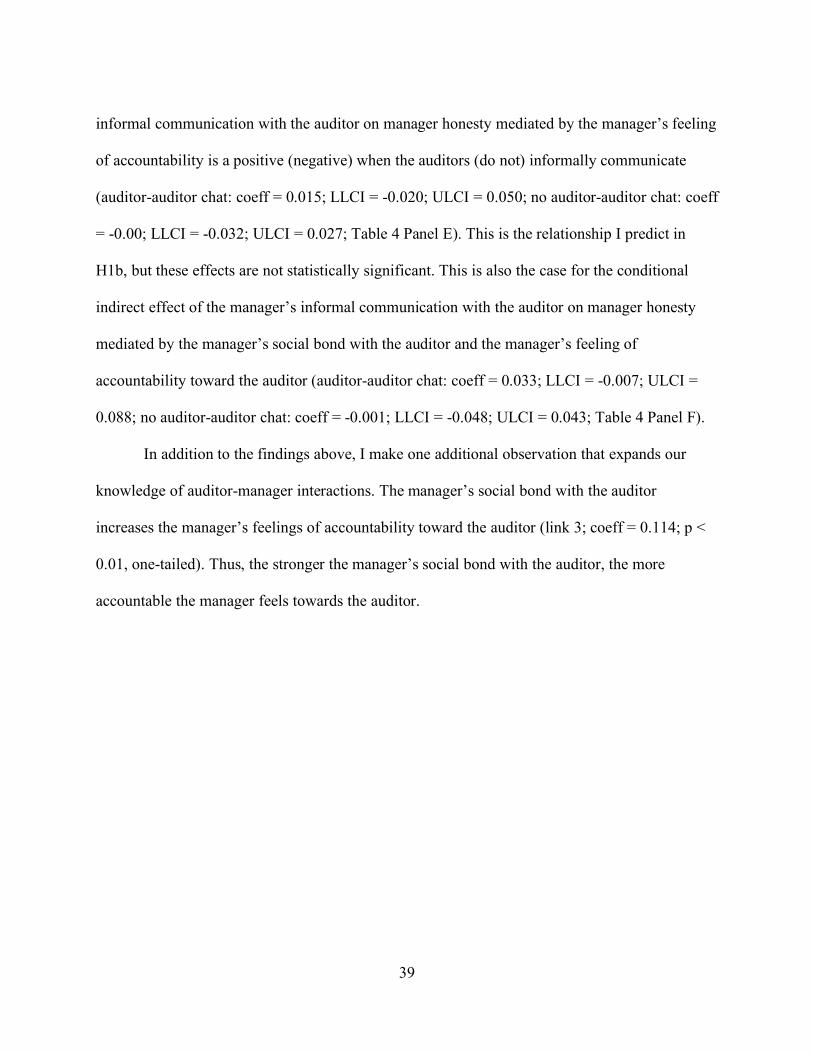
39
informal communication with the auditor on manager honesty mediated by the manager’s feeling
of accountability is a positive (negative) when the auditors (do not) informally communicate
In addition to the findings above, I make one additional observation that expands our
knowledge of auditor-manager interactions. The manager’s social bond with the auditor
increases the manager’s feelings of accountability toward the auditor (link 3; coeff = 0.114; p <
0.01, one-tailed). Thus, the stronger the manager’s social bond with the auditor, the more
accountable the manager feels towards the auditor.
40
TABLE 3
Analysis of Honesty of Managers’ Representation Panel A: Analysis of Variance of Auditor-Manager Informal Communication on Honesty of Manager’s Representation (H1a) Source df SS F p-value1 Auditor-Manager Informal
Communication 1 0.044 0.900 0.174
Error 61 2.971 n=63
Panel B: Analysis of Variance of Auditor-Auditor Communication and Manager Accountability on Honesty of Manager’s Representation (H1b) Source df SS F p-value1 Manager's Knowledge that Auditors
Manager's Knowledge that Auditors Informally Communicate × Manager's Feelings of Accountability to Auditor
1
0.120
3.450
0.034 **
Error 58
2.020
n=622 Notes: The table presents the results of the analysis of variance for H1a and H1b for all 15 rounds of the
experimental game. See Table 4 and Figure 4 for the results of the regression-based analysis for the H1 hypothesis set.
1*, **, *** indicate significance at the 0.10, 0.05, and 0.01 levels, respectively. All p-values are one-tailed for directional predictions; p-values for nondirectional predictions are two-tailed and are denoted with †.
2One manager-participant failed to provide a response to question number 17 on the post-experimental questionnaire, which is my measure for the manager’s feeling of accountability to the auditor.
Variable Definitions: The dependent variable is honesty of manager's representation. Auditor-Manager Informal Communication = dichotomous variable that equals 1 when managers
and auditors can informally communicate and 0 when they cannot.
41
TABLE 3 (CONCLUDED) Manager's Social Bond with Auditor = the summation of questions 1 through 7 on the post-
experimental questionnaire in Appendix C. A higher score indicates a stronger social bond. Manager's Feeling of Accountability to Auditor = question number 17 on the post-experimental
questionnaire in Appendix C. A higher score indicates a greater feeling of accountability. Manager's Knowledge that Auditors Informally Communicate (Auditor-Auditor Informal
Communication) = Auditor participants in the chat (no chat) condition could (not) informally chat online with other auditor participants during the experiment. A dichotomous variable that equals 1 when auditors can informally communicate among themselves and 0 when they cannot. The manager is told when auditors can communicate. In conditions when auditors cannot communicate, no mention of such communication is made to any participant.
Honesty of Manager's Representation = an average of the manager's choice to make an honest representation to the auditor. A value of 1 indicates the manager was honest 100% of the time, and a value of 0 indicates the manager was dishonest 100% of the time.
42
42
FIGURE 4
Statistical Diagram for the Effect of the Auditor’s Informal Communication with the Manager on the Honesty of the Manager’s Representation (H1)1,2
Manager’s Social Bond with Auditor
Manager's Feelings of
Accountability to Auditor
Auditor-Manager Informal
Communication
Honesty of Manager's Representation
Manager’s Knowledge that
Auditors Informally
Communicate
Manager’s Knowledge that Auditors
Informally Communicate × Manager's Feelings of Accountability to Auditor
Link 1 = -0.088; p = 0.06† (H1a)
Link 6 = 0.011; p < 0.01
Link 5 = 0.505; p = 0.149
Link 4 = -0.001; p = 0.485
Link 3 = 0.114; p < 0.01
Link 2 = 9.484; p = 0.001
Link 7 = 0.031; p = 0.056
(H1b)
Link 8 = -0.069; p = 0.269
43
43
FIGURE 4 (CONCLUDED) Notes: This is the statistical diagram for the regression-based analysis of my H1 hypothesis set for all 15 rounds of the experimental game. I
used the PROCESS macro (Hayes 2017) model 87. See Figure 1 for the theoretical diagram of this model. The statistical results for this model are also tabulated in Table 4.
1n = 62; participant 11 from session 8 did not give a response to PEQ 17. Thus, there were only 62 usable responses for this test. 2All p-values are one-tailed unless denoted with †. Variable Definitions: Auditor-Manager Informal Communication = dichotomous variable that equals 1 when managers and auditors can informally
communicate and 0 when they cannot. Manager's Social Bond with Auditor = the summation of questions 1 through 7 on the post-experimental questionnaire in Appendix C.
A higher score indicates a stronger social bond. Manager's Feeling of Accountability to Auditor = question number 17 on the post-experimental questionnaire in Appendix C. A
higher score indicates a greater feeling of accountability. Manager's Knowledge that Auditors Informally Communicate (Auditor-Auditor Informal Communication) = Auditor participants in
the chat (no chat) condition could (not) informally chat online with other auditor participants during the experiment. A dichotomous variable that equals 1 when auditors can informally communicate among themselves and 0 when they cannot. The manager is told when auditors can communicate. In conditions when auditors cannot communicate, no mention of such communication is made to any participant.
Honesty of Manager's Representation = an average of the manager's choice to make an honest representation to the auditor. A value of 1 indicates the manager was honest 100% of the time, and a value of 0 indicates the manager was dishonest 100% of the time.
44
44
TABLE 4
Moderated Serial Mediation Analysis of the Auditor’s Informal Communication with the Manager on the Honesty of Manager's Representation Mediated by the Manager's Social Bond with Auditor and the Manager's Feeling of Accountability
to the Auditor, Moderated by the Manager's Knowledge that Auditors Informally Communicate (H1) Panel A: Regression Model of Manager's Social Bond with Auditor
Path
Coefficient SE t-stat p-value1 Auditor-Manager Informal Communication (link 2) 9.484 2.909 3.261 0.001 *** Panel B: Regression Model of Manager's Feeling of Accountability to Auditor
Path
Coefficient SE t-stat p-value1 Auditor-Manager Informal Communication (link 5) 0.505 0.479 1.053 0.149 Manager's Social Bond with Auditor (link 3) 0.114 0.020 5.787 < 0.01 *** Panel C: Regression of Honesty of Manager's Representation
Path
Coefficient SE t-stat p-value1 Auditor-Manager Informal Communication (link 1) -0.088 0.046 -1.920 0.060 † Manager's Social Bond with Auditor (link 6) 0.011 0.002 4.434 < 0.01 *** Manager's Feeling of Accountability to Auditor (link 4) -0.001 0.016 -0.039 0.485 Manager's Knowledge that Auditors Informally
Communicate (Auditor-Auditor Informal Communication; link 8)
-0.069 0.111 -0.619 0.269
Manager's Knowledge that Auditors Informally Communicate × Manager's Feelings of Accountability to Auditor (link 7)
0.031 0.019
1.616
0.056 *
45
45
TABLE 4 (CONTINUED)
Panel D: Indirect Effects
Mediator Path
Coefficient SE LLCI2 ULCI2 Manager's Social Bond with Auditor 0.099 0.037 0.035 0.178 **
Panel E: Conditional Indirect Effect (Mediated by Manager's Feeling of Accountability to Auditor)
Path
Coefficient SE LLCI2 ULCI2 Manager's Knowledge that Auditors Informally
No Knowledge (No Auditor-Auditor chat) -0.000 0.013 -0.032 0.027 Panel F: Conditional Indirect Effect (Mediated by Manager's Social Bond with Auditor and the Manager's Feeling of Accountability to Auditor)
Path
Coefficient SE LLCI2 ULCI2 Manager's Knowledge that Auditors Informally
No Knowledge (No Auditor-Auditor chat) -0.001 0.022 -0.048 0.043
n = 623
46
46
TABLE 4 (CONCLUDED)
Notes: This table reports the results of the regression-based analysis of my H1 hypothesis set for all 15 rounds of the experimental game. I
used the PROCESS macro (Hayes 2017) model 87 and specified the confidence level for all confidence intervals to be 95%. See Figure 1 for the theoretical diagram and Figure 4 for the statistical diagram of this model.
1*, **, *** indicate significance at the 0.10, 0.05, and 0.01 levels, respectively. All reported p-values are one-tailed unless denoted with †.
295% confidence intervals (CI) for path coefficients are obtained through bootstrapping techniques. Bootstrap confidence intervals are based on 10,000 bootstrap samples. A coefficient is considered statistically significant if the 95% CI does not contain 0.
3Participant 11 from session 8 did not give a response to PEQ 17. Thus, there were only 62 usable responses for this test. Variable Definitions: Auditor-Manager Informal Communication = dichotomous variable that equals 1 when managers and auditors can informally
communicate and 0 when they cannot. Manager's Social Bond with Auditor = the summation of questions 1 through 7 on the post-experimental questionnaire in Appendix C.
A higher score indicates a stronger social bond. Manager's Feeling of Accountability to Auditor = question number 17 on the post-experimental questionnaire in Appendix C. A
higher score indicates a greater feeling of accountability. Manager's Knowledge that Auditors Informally Communicate (Auditor-Auditor Informal Communication) = Auditor participants in
the chat (no chat) condition could (not) informally chat online with other auditor participants during the experiment. A dichotomous variable that equals 1 when auditors can informally communicate among themselves and 0 when they cannot. The manager is told when auditors can communicate. In conditions when auditors cannot communicate, no mention of such communication is made to any participant.
Honesty of Manager's Representation = an average of the manager's choice to make an honest representation to the auditor. A value of 1 indicates the manager was honest 100% of the time, and a value of 0 indicates the manager was dishonest 100% of the time.
47
Supplemental Analysis of Manager Behavior
Recall that in my experiment, when the managers and auditors informally communicate
they are only able to informally communicate for rounds 1-10, and I take away the ability to
informally communicate in rounds 11-15. I split the data into “chat” and “no chat” rounds, which
are rounds 1-10 and 11-15, respectively. I perform the same analysis from above on both the chat
and no chat rounds. The outcome for the chat rounds is qualitatively the same as the analysis
above on all the rounds combined. However, I find two differences between the analysis on the
no chat rounds and the analysis on all the rounds combined. First, I find that there is no
significant direct effect of the manager’s informal communication with the auditor on the
honesty of the manager’s representation (coeff = -0.029; p = 0.344, one-tailed; untabulated).
Thus, a manager’s past informal communication with the auditor did not have a lingering effect
on the manager’s behavior when the manager was not actively engaged in informal
communication with the auditor. Second, there is marginally significant direct effect of the
manager’s social bond with the auditor on the honesty of the manager’s representation (coeff =
0.005; p = 0.097, one-tailed; untabulated). Yet, there is no significant indirect effect of the
manager’s informal communication with the auditor on the honesty of the manager’s
representation mediated by the manager’s social bond with the auditor (coeff = 0.047; LLCI = -
0.025, ULCI = 0.146; untabulated). The second difference suggests that although the manager
develops a social bond with the auditor when they informally communicate, the bond only
marginally impacts manager behavior when there is no repeated interaction with the auditor.
Thus, it appears that the social bond itself cannot alter manager behavior, but repeated
interactions are also important for maintaining manager honesty.
48
Tests of H2: Analysis of Auditor Behavior
My second hypothesis set analyzes the auditor’s behavior in response to the auditor’s
informal communication with both the manager and other auditors. Table 2 Panel A shows that
when auditors informally communicate with managers the auditor develops a stronger social
bond with the manager versus when they do not informally communicate (40.74 v. 29.13; p <
0.01, one-tailed).12 This is interesting since the auditors and managers have opposing incentives
and are only interacting through online chatting rather than face-to-face. Furthermore, when
auditors informally communicate with other auditors the auditors feel more bonded with the
other auditors than when they do not (44.41 v. 29.20; p < 0.01, one-tailed).13 Importantly,
informal communication with other auditors creates a bond between the auditors despite the fact
that their compensation is not dependent on one another.14 However, the auditor’s social bond
with other auditors is weaker when the auditor also informally communicates with the manager
than when the auditors does not (39.31 v. 49.50; p = 0.015, two-tailed).
The auditors exhibit several behavioral differences between conditions. The auditors’
average assessment of the managers’ honesty is higher when the auditor and manager informally
communicate than when they do not (74.97 v. 54.95; p < 0.01, one-tailed). However, there is no
difference in the auditors’ average assessment of manager honesty when the auditors informally
communicate with other auditors and when they do not (66.30 v. 63.26; p = 0.587, two-tailed).
Finally, the auditors choose a low-effort audit more often on average when the auditors
informally communicate with managers than when they do not (0.74 v. 0.47; p < 0.01, one-
12 The auditor’s social bond with the manager equals the summation of questions 1 through 7 on the post-experimental questionnaire in Appendix C. A higher score indicates a stronger social bond. 13 The auditor's bond with other auditors is the summation of questions 8 through 14 on the post-experimental questionnaire in Appendix C. A higher score indicates a stronger bond. 14 This finding is not inconsistent with Gochnauer (2018) because her compensation structure and game are cooperative rather than competitive like mine.
49
tailed).15 This finding is consistent with Bowlin et al. (2015). This is also true when auditors
informally communicate with other auditors (0.65 v. 0.55; p = 0.041, one-tailed). This finding
stands in contrast to King (2002), who finds that when auditors are a part of his “strong group”
setting, the auditors choose to perform higher effort audits. However, King’s two-part
manipulation confounds the effect he observes. Thus, perhaps it was the threat of public shaming
that altered the auditors’ behavior rather than the social aspect of his manipulation. Finally, I
observe more instances of audit success16 when auditors informally communicate than when they
do not (0.59 v. 0.52; p = .039, one-tailed).
My second hypothesis set makes predictions about how informal communication between
the auditor and manager affects the auditor’s assessments of the manager’s honesty and whether
informal communication among auditors moderates the effect. To test my hypotheses, I use both
ANOVAs and a regression-based analysis method which allows me to test all three hypotheses
along with the underlying theory. Specifically, I use model 58 from the PROCESS macro (Hayes
2017). Table 5 reports the results of the ANOVA, and Table 6 and Figure 5 contain the statistical
results for my process model.
H2a predicts that when auditors informally communicate with managers, the auditor will
assess the manager’s representation as more honest than when they do not informally
communicate. As predicted, auditors assess manager representations as more honest on average
when they informally communicate than when they do not (F = 16.170; p = 0.0001, one-tailed;
Table 5 Panel A). This effect also holds in the regression-based analysis, which controls for the
15 A value of 1 indicates the auditor chose a low-effort audit for all 15 rounds of the game, and a value of 0 indicates the auditor chose a high-effort audit for all 15 rounds of the game. 16 I define audit success as a match of the manager’s reporting choice and the auditor’s corresponding audit effort choice (e.g. the manager chooses the aggressive reporting strategy and the auditor performs a high-effort audit). Audit failure is a mismatch of the manager’s reporting choice and the auditor’s corresponding audit effort choice (e.g. the manager chooses the aggressive reporting strategy and the auditor performs a low-effort audit).
50
auditors’ social bond with the manager and the informal communication among auditors (link 1;
coeff = 10.533; p = 0.016, one-tailed). Consistent with my prediction, there is also an indirect
effect of the auditor’s informal communication with the manager on the auditor’s assessment of
manager honesty through the auditor’s social bond with the manager. The indirect effect is
positive and statistically significant regardless of whether the auditors informally communicate
among themselves or not (auditor-auditor chat: coeff = 9.886; LLCI = 1.903; ULCI = 19.475; no
discussed in more detail below, the auditor’s informal communication with other auditors has no
impact on this relationship. Thus, H2a is supported.
H2b predicts that an auditor’s informal communication with other auditors will have a
negative moderating effect on the relationship between the auditor’s informal communication
with the manager and the auditor’s social bond with the manager. Based on the results of the
ANOVA reported in Table 5 Panel B, I find an auditor’s informal communication with other
auditors does not have a significant effect on the auditor’s social bond with the manager (F =
0.100; p = 0.377, one-tailed). This is also the case in the regression-based analysis (link 4; coeff
= 2.042; p = 0.377, one-tailed). Thus, H2b is not supported.
Finally, H2c predicts that the auditor’s informal communication with other auditors will have a
negative moderating effect on the relationship between the auditor’s social bond with the
manager and the auditor’s assessment of the manager’s honesty. However, H2c is not supported
as the interaction reported in Table 5 Panel C is not significant (F = 0.020; p = 0.438, one-tailed).
This is also the case for the regression-based analysis (link 5; coeff = -0.066; p = 0.418, one-
tailed). Thus, the auditor’s informal communication with other auditors does not have any effect
on the auditor’s behavior.
51
TABLE 5
Analysis of Auditor’s Assessment of the Honesty of the Manager’s Representation and the Auditor’s Social Bond with the Manager
Panel A: Analysis of Variance of Auditor-Manager Informal Communication on Auditor’s Assessment of the Honesty of the Manager’s Representation (H2a) Source df SS F p-value1 Auditor-Manager Informal
Communication 1 6,308 16.170 0.0001 ***
Error 61
23,793
n = 63
Panel B: Analysis of Variance of Auditor-Manager Informal Communication and Auditor-Auditor Informal Communication on the Auditor’s Social Bond with the Manager (H2b)
Source df SS F p-
value1 Auditor-Auditor Informal
Communication 1 209 1.270 0.264 †
Auditor-Manager Informal Communication
1 2,096 12.760 0.001 †,***
Auditor-Manager Informal Communication × Auditor-Auditor Informal Communication
1 16 0.100 0.377
Error 59
9,692
n = 63
Panel C: Analysis of Variance of Auditor-Auditor Communication and the Auditor’s Social Bond with the Manager on the Auditor’s Assessment of the Honesty of the Manager’s Representation (H2c) Source df SS F p-value1 Auditor-Auditor Informal
Communication 1 3 0.010 0.929 †
Auditor's Social Bond with Manager 1 11,347 36.000 <0.0001 †,*** Auditor's Social Bond with Manager × Auditor-Auditor Informal Communication
1 8 0.020 0.438
Error 59
18,596
n = 63
52
TABLE 5 (CONCLUDED) Notes: The table presents the results of the analysis of variance for H2a, H2b, and H2c for all 15 rounds
of the experimental game. The dependent variable in panels A and C is the auditor's assessment of the honesty of the manager's representation. In panel B, the dependent variable is the auditor's social bond with the manager. See Table 6 and Figure 5 for the results of the regression-based analysis for the H2 hypothesis set.
1*, **, *** indicate significance at the 0.10, 0.05, and 0.01 levels, respectively. All p-values are one-tailed for directional predictions; p-values for nondirectional predictions are two-tailed and are denoted with †.
Variable Definitions: Auditor-Manager Informal Communication = dichotomous variable that equals 1 when managers
and auditors can informally communicate and 0 when they cannot. Auditor-Auditor Informal Communication = dichotomous variable that equals 1 when auditors
can informally communicate among themselves and 0 when they cannot. Auditor's Social Bond with Manager = the summation of questions 1 through 7 on the post-
experimental questionnaire in Appendix C. A higher score indicates a stronger social bond. Auditor's Assessment of the Honesty of the Manager's Representation = the average of the
auditor’s assessments of the honesty of his/her manager's representation. A value of 100 indicates the auditors assessed the manager's representation as honest 100% of the time, and a value of 0 indicates the auditors assessed the manager's representation as dishonest 100% of the time.
53
FIGURE 5
Statistical Diagram for the Effect of the Auditor’s Informal Communication with the Manager on the Auditor’s Assessments of the Honesty of the
Manager’s Representation (H2)1
Notes: This is the statistical diagram for the regression-based analysis of my H2 hypothesis set for all 15
rounds of the experimental game. I used the PROCESS macro (Hayes 2017) model 58. See Figure 2 for the theoretical diagram of this model. The statistical results for this model are also tabulated in Table 6.
Link 2 = 10.521; p = 0.013
Link 5 = -0.066 p = 0.418
(H2c) Link 4 = 2.042; p = 0.377
(H2b)
Link 3 = 0.853; p < 0.001
Link 1 = 10.533; p = 0.016 (H2a)
Link 7 = 2.053; p = 0.432
Auditor-Manager Informal
Communication
Auditor-Auditor Informal
Communication
Auditor’s Social Bond
with Manager
Auditor’s Assessments of the Honesty of
Manager’s Representation
Auditor-Auditor Informal
Communication × Auditor’s Social Bond
with Manager
Auditor-Auditor Informal
Communication × Auditor-Manager
Informal Communication
Link 6 = 2.625; p = 0.283
54
FIGURE 5 (CONCLUDED) 1All p-values are one-tailed. Variable Definitions: Auditor-Manager Informal Communication = dichotomous variable that equals 1 when managers
and auditors can informally communicate and 0 when they cannot. Auditor-Auditor Informal Communication = dichotomous variable that equals 1 when auditors
can informally communicate among themselves and 0 when they cannot. Auditor's Social Bond with Manager = the summation of questions 1 through 7 on the post-
experimental questionnaire in Appendix C. A higher score indicates a stronger social bond. Auditor's Assessment of the Honesty of the Manager's Representation = the average of the
auditor’s assessments of the honesty of his/her manager's representation. A value of 100 indicates the auditors assessed the manager's representation as honest 100% of the time, and a value of 0 indicates the auditors assessed the manager's representation as dishonest 100% of the time.
55
TABLE 6
Moderated Mediation Analysis of the Auditor's Informal Communication with Manager on Auditor's Assessment of the Honesty of The Manager's Representation Mediated by the Auditor's Social Bond with the Manager, Moderated by the
Auditor's Informal Communication with Other Auditors (H2) Panel A: Regression Model of Auditor's Social Bond with Manager
Path
Coefficient SE t-stat p-value1 Auditor-Manager Informal Communication (link 2) 10.521 4.606 2.284 0.013 ** Auditor-Auditor Informal Communication (link 6) 2.625 4.531 0.579 0.283 Auditor-Manager Informal Communication ×
Auditor-Auditor Informal Communication (link 4) 2.042 6.462 0.316 0.377
Panel B: Regression Model of Auditor's Assessment of the Honesty of the Manager's Representation
Path
Coefficient SE t-stat p-value1 Auditor-Manager Informal Communication (link 1) 10.533 4.783 2.202 0.016 ** Auditor's Social Bond with Manager (link 3) 0.853 0.241 3.536 <0.001 *** Auditor-Auditor Informal Communication (link 7) 2.053 11.850 0.173 0.432
Auditor's Social Bond with Manager × Auditor-Auditor Informal Communication (link 5)
-0.066 0.317 -0.209 0.418
Panel C: Conditional Indirect Effect (Mediated by Auditor's Social Bond with Manager)
Path
Coefficient SE LLCI2 ULCI2 Auditor-Auditor Informal Communication
Auditor-Auditor Chat 9.886 4.464 1.903 19.475 **
No Auditor-Auditor Chat 8.976 5.358 0.687 21.446 **
n = 63
55
56
TABLE 6 (CONCLUDED) Notes: This table reports the results of the regression-based analysis of my H2 hypothesis set for all 15 rounds of the experimental game. I
used the PROCESS macro (Hayes 2017) model 58 and specified the confidence level for all confidence intervals to be 95%. See Figure 2 for the theoretical diagram and Figure 5 for the statistical diagram of this model.
1*, **, *** indicate significance at the 0.10, 0.05, and 0.01 levels, respectively. All reported p-values are one-tailed. 295% confidence intervals (CI) for path coefficients are obtained through bootstrapping techniques. Bootstrap confidence intervals are
based on 10,000 bootstrap samples. A coefficient is considered statistically significant if the 95% CI does not contain 0. Variable Definitions: Auditor-Manager Informal Communication = dichotomous variable that equals 1 when managers and auditors can informally
communicate and 0 when they cannot. Auditor-Auditor Informal Communication = dichotomous variable that equals 1 when auditors can informally communicate among
themselves and 0 when they cannot. Auditor's Social Bond with Manager = the summation of questions 1 through 7 on the post-experimental questionnaire in Appendix C.
A higher score indicates a stronger social bond. Auditor's Assessment of the Honesty of the Manager's Representation = the average of the auditor’s assessments of the honesty of
his/her manager's representation. A value of 100 indicates the auditors assessed the manager's representation as honest 100% of the time, and a value of 0 indicates the auditors assessed the manager's representation as dishonest 100% of the time.
56
57
Supplemental Analysis of Auditor Behavior
Recall again that I remove the opportunity to informally communicate for all players in
the final five rounds of the experiment. I split the data between the chat and no chat rounds
(rounds 1-10 and 11-15, respectively) and perform the same analysis as above. I find no
qualitative differences in the chat rounds from the analysis on all 15 rounds. However, in the
analysis of the no chat rounds I find that the direct effect of an auditor’s (past) informal
communication with the manager does not affect the auditor’s assessment of the manager’s
honesty (coeff = 3.767; p = 0.291, one-tailed, untabulated) while holding the other factors
constant. Thus, while there is still a positive relationship, the effect is not significant, which
suggests that an auditor’s past informal communication with a manager itself does not impact
future assessments of manager honesty. Yet, the indirect effect (for both auditor-auditor informal
communication conditions) is still significant (untabulated) suggesting that the auditor’s social
bond with the manager has a lingering effect resulting in higher assessments of manager honesty
even after informal communication has ended.
Next, I investigate the relationship between the auditor’s assessment of the honesty of the
manager’s representation and the auditor’s choice of audit effort. For this analysis, I first divide
the data between instances where the manager represented to the auditor that he/she chose the
conservative reporting option and where the manager represented that he/she chose the
aggressive reporting option. Next, I examine the correlation coefficients between the auditor’s
assessment of the manager’s honesty and the auditor’s audit effort choice. I find that when the
manager represents to the auditor that he/she chose the conservative reporting option, there is a
positive association between the auditor’s assessment and effort choice (r = 0.295; p<0.001, two-
tailed; untabulated). Specifically, a higher assessment of honesty is associated with instances of
58
low effort audits, which is the rational choice of audit effort if the auditor believes the manager is
honest. However, when the manager represents to the auditor that he/she chose the aggressive
reporting option, there is a no significant association between the auditor’s assessment and effort
choice (r = 0.081; p = 0.1683, two-tailed; untabulated). Two potential explanations for this
include first, in instances when the manager discloses that he/she chose the aggressive reporting
option, the only rational choice for the auditor is a high effort audit regardless of whether the
auditor believes the manager is honest or not. Or second, it could be evidence that the auditor
and manager chose to collude to maximize individual payoffs. Consequently, an auditor’s
assessment of the manager’s honesty is only associated with the auditor’s action when the
manager represents that he/she chose the conservative option.
Finally, I perform a separate mediation analysis to determine if an auditor’s illusion of
control mediates the relationship I find between the auditor’s informal communication with the
manager and the auditor’s assessment of the manager’s honesty. I perform a separate mediation
analysis for this and do not find a significant indirect effect (coeff = -0.275-; LLCI = -2.339,
ULCI = 1.738; untabulated). I measure the auditor’s illusion of control with question 15 on the
post-experimental questionnaire, which asks participants to rate how risky they believed the
experimental choice to be. I expect that a participant who believed to have control over the
outcome to have rated the choice as not risky.17 Informal communication between the auditor
and manager does not create an illusory feeling of control for the auditor (coeff = 0.206; p =
0.687, two-tailed; untabulated). Thus, it appears that it is the auditor’s social bond and not an
17Furthermore, because the auditor’s outcome is dependent on the manager’s choice, I also perform this analysis using question 18 from my post-experimental questionnaire, which asks how much control the auditor felt over the manager. I do not find a significant indirect effect with this analysis either.
59
illusory feeling of control affecting auditor behavior when the auditor and manager informally
communicate.
60
Analysis of Chat
I analyze the volume and content of the informal communication that the auditors and
managers exchanged as well as the informal communication among the auditors. First, I report
the volume of the informal communication exchanged by condition and type. I measure the
volume in two ways: number of messages exchanged each round and words exchanged each
round. Figure 6 shows the average number of messages exchanged each round by chat type.
Specifically, Panel A reports the average number of messages exchanged between auditor and
manager pairs by round between auditor-auditor informal communication conditions. Panel B
reports the average messages exchanged among the auditors by round between auditor-manager
informal communication conditions. Table 7 reports the average words exchanged each round by
chat type. I find that auditors and managers exchanged more words on average each round when
the auditors were not also chatting with other auditors (5.815 v. 4.934; p = 0.010, two-tailed).
But, Panel B of Table 7 reports that there is no significant difference in the number of words
exchanged each round among the auditors regardless of whether the auditors also informally
communicated with the manager (5.158 v. 5.117; p = 0.938, two-tailed). Thus, the volume of
chat between the auditor and manager is different depending on whether auditors also informally
communicate with other auditors.
61
FIGURE 6
Auditor-Manager and Auditor-Auditor Chat Volume by Round
Panel A: Auditor-Manager Chat Volume1
Panel B: Auditor-Auditor Chat Volume2
Notes: 1Auditor-Manager Chat Volume is the average number of messages exchanged each round between the auditor and manager pairs. 2 Auditor-Auditor Chat Volume is the average number of messages exchanged each round among the auditor participants.
- 0.50 1.00 1.50 2.00 2.50 3.00 3.50
1 2 3 4 5 6 7 8 9 10Round
No Auditor-Auditor Chat Auditor-Auditor Chat
- 0.50 1.00 1.50 2.00 2.50 3.00 3.50
1 2 3 4 5 6 7 8 9 10Round
No Auditor-Manager Chat Auditor-Manager Chat
62
Next, I examine the content of the chat. I first code the content of each message
exchanged as one of three mutually exclusive categories. The three categories are ‘game related,’
‘social,’ and ‘other.’ I create a dichotomous variable for each content category and set the value
of the variable to 1 if the message contains that content and 0 otherwise. Specifically, I code a
message as ‘game-related’ if the message discusses strategy, a player decision, or payoff (e.g. “I
don’t trust my green so I’m going down every time”, “okay I put up”, or “10 points three times
in a row”). If the message contains a greeting (e.g. “hey” or “what’s up”) or a subject matter that
is not game related (e.g. “Did you get your football tickets yesterday” or “Kind of a cold day
we’re having.”), then I code the message as ‘social.’ Finally, if a message contains a statement of
boredom, frustration, or confusion (e.g. “I hope this doesn’t take longer than an hour”, “I hate
that its partially up to chance…” or “tbh [to be honest] kind of clueless how this works”, I code
the content of the message as ‘other.’
Table 7 reports the average content of the informal conversation exchanged by chat type.
Specifically, Panel A shows the average content of the conversation exchanged each round
between the auditor and manager. I find that the auditor and manager discuss the game more
when the auditors are also talking to other auditors (0.730 v. 0.582; p = 0.002, two-tailed).
Furthermore, the informal conversation between the auditors and managers is less social when
auditors are also communicating with other auditors (0.229 v. 0.348, p = 0.006, two-tailed).
However, there is no difference in proportion of the conversation that is related to boredom,
frustration, or confusion. Panel B of Table 7 reports the average content of the informal
conversation exchanged among the auditors each round between the auditor-manager informal
communication conditions. I find no significant differences in the content of the conversations
63
the auditors have each round regardless of whether the auditors also informally communicate
with the managers.
64
TABLE 7
Descriptive Statistics of Chat Volume and Content and Mediation Analysis of The Auditor’s Informal Communication with Other Auditor’s on Manager and Auditor
Behavior Mediated by the Content of the Auditor and Manager Informal Communication
Panel A: Means (Std Error) of Auditor-Manager Chat Volume and Content for Each Auditor-Manager Pair per Round by Auditor-Auditor Chat Conditions Auditor-Auditor Chat
Chat No Chat p-value1 Words Exchanged 4.934 5.815 0.010 **
(0.166) (0.296)
n = 147 n = 132
Content: Game Related 0.730 0.582 0.002 ***
(0.028) (0.037)
n = 147 n = 132
Content: Social 0.229 0.348 0.006 ***
(0.026) (0.034)
n = 147 n = 132
Content: Other 0.041 0.070 0.148
(0.011) (0.017)
n = 147 n = 132
65
TABLE 7 (CONTINUED) Panel B: Means (Std Error) of Auditor-Auditor Chat Volume and Content per Round by Auditor-Manager Chat Conditions Auditor-Manager Chat
Chat No Chat p-value1 Words Exchanged 5.117 5.158 0.938 (0.308) (0.446) n = 20 n = 14 Content: Game Related 0.503 0.600 0.395
(0.066) (0.096) n = 20 n = 14 Content: Social 0.472 0.356 0.272
(0.063) (0.086)
n = 20 n = 14
Content: Other 0.026 0.044 0.587 (0.012) (0.032)
n = 20 n = 14 Panel C: Regression Model of Game-Related Content of Auditor-Manager Informal Communication
Path Coefficient SE t-stat p-value1
Auditor-Auditor Informal Communication
0.181 0.092 1.977 0.058 *
66
TABLE 7 (CONTINUED) Panel D: Regression Model of Manager's Reporting Strategy
Path Coefficient SE t-stat p-value1
Auditor-Auditor Informal Communication
-0.011 0.091 -0.124 0.903 Game-Related Content of
Auditor-Manager Informal Communication
0.345 0.173 1.997 0.056 *
Indirect Effect
Mediator
Path Coefficient SE LLCI2 ULCI2
Game-Related Content of Auditor-Manager Informal Communication
0.063 0.049 -0.004 0.183
n = 31 Panel E: Regression Model of Honesty of Manager's Representation
Path Coefficient SE t-stat p-value1
Auditor-Auditor Informal Communication
0.072 0.109 0.665 0.511
Game-Related Content of Auditor-Manager Informal Communication
0.208 0.207 1.008 0.322
Indirect Effect
Mediator
Path Coefficient SE LLCI2 ULCI2
Game-Related Content of Auditor-Manager Informal Communication
0.038 0.052 -0.056 0.155
n = 31
67
TABLE 7 (CONTINUED) Panel F: Regression Model of Auditor's Audit Effort Choice
Path Coefficient SE t-stat p-value1
Auditor-Auditor Informal Communication
0.049 0.070 0.702 0.489 Game-Related Content of
Auditor-Manager Informal Communication
0.282 0.133 2.123 0.043 **
Indirect Effect
Mediator
Path Coefficient SE LLCI2 ULCI2
Game-Related Content of Auditor-Manager Informal Communication
0.051 0.047 -0.007 0.170
n = 31 Panel G: Regression Model Auditor's Assessment of the Honesty of the Manager's Representation
Path Coefficient SE t-stat p-value1
Auditor-Auditor Informal Communication
2.558 7.189 0.356 0.725
Game-Related Content of Auditor-Manager Informal Communication
3.480 13.678 0.254 0.801
Indirect Effect
Mediator
Path Coefficient SE LLCI2 ULCI2
Game-Related Content of Auditor-Manager Informal Communication
0.630 2.227 -4.736 4.580
n = 31 Notes: This table reports the descriptive statistics of the volume and content of the auditor-manager chat
and the auditor-auditor chat in Panels A and B. Panels C through G report the results of a regression-based mediation analysis of the effect of auditor-auditor informal communication on manager and auditor behavior mediated by the content of the auditor-manager informal
68
TABLE 7 (CONCLUDED)
communication. For the mediation analysis, I used the PROCESS macro (Hayes 2017) model 4 and specified the confidence level for all confidence intervals to be 95%.
1*, **, *** indicate significance at the 0.10, 0.05, and 0.01 levels, respectively. All reported p-values are two-tailed.
295% confidence intervals (CI) for path coefficients are obtained through bootstrapping techniques. Bootstrap confidence intervals are based on 10,000 bootstrap samples. A coefficient is considered statistically significant if the 95% CI does not contain 0.
Variable Definitions: Words Exchanged = The average number of words exchanged in a conversation each round
either between an auditor and manager or among the auditors. Content: Game Related = The proportion of a conversation that was related to the experimental
game. A value of 1 indicates the conversation was entirely game focused and a value of 0 indicates that no portion of the conversation was focused on the game.
Content: Social = The proportion of a conversation that was of a social nature. A value of 1 indicates the conversation was entirely social and a value of 0 indicates that no portion of the conversation was social.
Content: Other = The proportion of a conversation that was not related to the experimental game or of a social nature. A value of 1 indicates the conversation was entirely focused on non-game or social topics and a value of 0 indicates that no portion of the conversation was focused on topics other than the game or a social nature.
Auditor-Auditor Informal Communication = dichotomous variable that equals 1 when auditors can informally communicate among themselves and 0 when they cannot.
Game-Related Content of Auditor-Manager Informal Communication = The average proportion of the auditor and manager conversation that was related to the experimental game. A value of 1 indicates the conversation was entirely game focused and a value of 0 indicates that no portion of the conversation was focused on the game.
Manager's Reporting Choice = an average of the manager's choice to report conservatively or aggressively. A value of 1 indicates the manager reported conservatively 100% of the time, and a value of 0 indicates the manager reported aggressively 100% of the time.
Honesty of Manager's Representation = an average of the manager's choice to make an honest representation to the auditor. A value of 1 indicates the manager was honest 100% of the time, and a value of 0 indicates the manager was dishonest 100% of the time.
Auditor's Audit Effort Choice = an average of the auditor's choice of audit effort. A value of 1 indicates the auditor chose a low-effort audit 100% of the time, and a value of 0 indicates the auditor chose a high-effort audit 100% of the time.
Auditor's Assessment of the Honesty of the Manager's Representation = the average of the auditor’s assessments of the honesty of his/her manager's representation. A value of 100 indicates the auditors assessed the manager's representation as honest 100% of the time, and a value of 0 indicates the auditors assessed the manager's representation as dishonest 100% of the time.
69
Finally, to determine whether the content of the chat is related to manager and auditor
behavior, I perform several mediation analyses. I employ a regression-based approach and use
model 4 of the PROCESS Macro (Hayes 2017). Because I find that there is a difference in the
amount of game-related content the auditors and managers exchange depending on whether the
auditors are also talking to other auditors, I examine whether that content leads to any differences
in auditor and manager behavior. Specifically, I analyze the manager’s behavior through two
variables: the manager’s reporting choice and the honesty of the manager’s representation. I also
analyze the auditor’s behavior with two variables: the auditor’s choice of audit effort and the
auditor’s assessment of the manager’s honesty. My independent variable is the auditor-auditor
informal communication, and the game-related content is the mediator.
Table 7 Panels C through E report the results of my mediation analyses on the manager’s
behavior. I find that when the auditors also talk to other auditors, there is a marginally significant
increase in the game-related content of the informal conversation between the auditor and
manager (coeff = 0.181; p = 0.058, two-tailed). The results reported in Panel D show that the
content of the auditor and manager conversations have a significant effect on the manager’s
reporting choice (coeff = 0.345; p = 0.056, two-tailed). Specifically, more game related
discussions lead the manager to choose the conservative reporting option. However, the indirect
effect is not significant at the 95% level. Panel E shows that there is no relationship between the
content of the auditor and manager conversations and the manager’s honesty. Thus, the content
seems to affect the manager’s reporting choice, but not the representations the manager makes
about those choices.
Panels C, F, and G report the results of my mediation analysis on the auditor’s behavior.
The results of Panel C are discussed above. Panel F shows that the content of the auditor and
70
manager conversations have a significant effect on the auditor’s choice of audit effort (coeff =
0.282; p = 0.043, two-tailed). Specifically, the auditor chooses more lax audits following
informal conversations that have higher levels of game-related content. However, the indirect
effect is not significant at the 95% level. Finally, Panel G shows that there is no relationship
between the content of the auditor and manager conversations on the auditor’s assessment of the
manager’s honesty. Thus, again the content appears to impact the auditor’s choice of effort, but
not the auditor’s beliefs about the manager.
71
V. CONCLUSION
This study examines the effect of auditors’ recurring, informal communication in the
audit process on financial reporting outcomes. Specifically, this study explores how an auditor’s
informal conversations with fellow auditors interacts with the auditor’s informal conversations
with client management and impacts auditor and manager behavior. The behavior I examine is
the manager’s honesty, the auditor’s beliefs about the manager’s honesty, and the audit outcome.
To address my research question, I conduct an experiment according the traditions of
experimental economics and use a 2×2 full factorial design where I manipulate the auditor’s
ability to informally communicate in two ways. First, I manipulate the auditor’s ability to chat
online with the manager. And second, I manipulate the auditor’s ability to chat online with other
auditors. Participants are assigned the role of either auditor or manager and play an interactive,
strategic game that models the auditor-manager relationship in a stylized audit setting.
Participants play this game for 15 rounds during which I observe the manager’s honesty, the
auditor’s beliefs about the manager’s honesty, and the final audit outcome.
In my first hypothesis, I predict that when the auditor and manager informally
communicate, the manager will make more honest representations to the auditor and this will
occur because of the social bond that will form between the auditor and manager through their
informal communication. As predicted, I find that managers make more honest representations
on average when they informally communicate with the auditor because of the social bond the
manager forms with the auditor. However, the direct effect of the manager’s informal
72
communication with the auditor on the manager’s honesty is negative. Thus, without the social
bond, the manager uses the communication as cheap talk, but the social bond undoes this effect. I
also predict that the manager’s knowledge that auditors also informally communicate will have a
positive moderating effect on the relationship between the manager’s feeling of accountability to
the auditor and the manager’s honesty. I find marginal support for this hypothesis. My findings
suggest that managers are sensitive to interactions with the auditors, and these interactions can
have a positive impact on manager behavior.
My second hypothesis predicts that when the auditors informally communicate with the
managers, they will believe the managers are more honest. As predicted, I find that auditors
believe the managers are more honest when the auditors and managers informally communicate
because of the social bond formed through communication. I also posit that the auditor’s
informal communication with other auditors will have a negative moderating effect on both the
formation of the auditor’s social bond with the manager and the relationship between the
auditor’s social bond with the manager and the auditor’s beliefs about the manager’s honesty.
However, neither of these predictions are supported. Thus, the auditor’s informal communication
with other auditors appears to have no impact on auditor behavior.
I also perform supplemental analysis on the volume and content of the conversations
between the auditor and manager participants and among the auditors. I find that when the
auditors also talk to other auditors, the auditors and managers exchange significantly fewer
words per conversation. But, a significantly larger proportion of the auditor’s conversation with
the manager is game-related when the auditors also informally communicate with other auditors.
In further analysis, I find that this game-related content has an impact on both the manager’s
73
reporting choice and the auditor’s choice of audit effort, but neither the manager’s honesty nor
the auditor’s beliefs about the manager’s honesty.
This study makes several important contributions to the accounting literature, accounting
profession, and accounting regulators. First, this paper examines the process by which the
auditor’s informal conversations in the audit environment affects financial reporting outcomes.
Specifically, I demonstrate how informal communication impacts audit quality and management
reporting choices through the mechanisms of social bonds. I show that informal communication
between auditors and managers forms social bonds that impact auditor and manager decisions
despite their opposing incentives. Furthermore, the social bond is formed even when their
informal communication takes place electronically rather than face-to-face. Second, prior
research in accounting that includes communication primarily focuses on the communication
between the auditor and manager. My study incorporates informal auditor-auditor
communication and finds that it develops a social bond among auditors. This informal
communication does not impact auditor assessments of manager honesty, which is meaningful
for auditing firms that allow audit teams to be physically separated during the audit (e.g.
telecommuting or off-shoring). Third, prior research has not placed a direct focus on how
informal conversations between the auditor and client manager impact management’s decisions.
My study creates a setting that allows managers to be dishonest without penalty, and my findings
demonstrate that the manager’s social bond with the auditor causes the manager to be more
honest. My findings provide a better understanding of the social nature of the auditor-manager
relationship, which informs regulators as they set standards for practice. My study also has
implications for practitioners as they structure audit teams and plan audits.
74
REFERENCES
75
Bamber, E. M., and V. M. Iyer. 2002. Big 5 auditors’ professional and organizational identification: Consistency or conflict? Auditing: A Journal of Practice & Theory 21 (2): 21–38.
———. 2007. Auditors’ identification with their clients and its effect on auditors’ objectivity. Auditing: A Journal of Practice & Theory 26 (2): 1–24.
Bauer, T. D. 2015. The Effects of Client Identity Strength and Professional Identity Salience on Auditor Judgments. The Accounting Review 90 (1): 95–114.
Bennett, G. B., and R. C. Hatfield. 2013. The Effect of the Social Mismatch between Staff Auditors and Client Management on the Collection of Audit Evidence. The Accounting Review 88 (1): 31–50.
———. 2018. Staff auditors’ proclivity for computer-mediated communication with clients and its effect on skeptical behavior. Accounting, Organizations and Society 68-69: 42-57.
Bhattacharjee, S. and J.O. Brown. 2018. The Impact of Management Alumni Affiliation and Persuasion Tactics on Auditors' Internal Control Judgments. The Accounting Review 93 (2): 97-115.
Bicchieri, C. 2002. Covenants without swords: Group identity, norms, and communication in social dilemmas. Rationality and Society 14 (2): 192–228.
Bowlin, K. 2011. Risk-Based Auditing, Strategic Prompts, and Auditor Sensitivity to the Strategic Risk of Fraud. The Accounting Review 86 (4): 1231–1253.
Bowlin, K. O., J. B. Griffin, and E. K. Hornok. 2017. The Effects of Auditor Tenure and Predictability of the Client’s Information Environment on Management Representations. Working Paper, Oxford, MS: University of Mississippi.
Bowlin, K. O., J. L. Hobson, and M. D. Piercey. 2015. The effects of auditor rotation, professional skepticism, and interactions with managers on audit quality. The Accounting Review 90 (4): 1363–1393.
Brazel, J. F., C. P. Agoglia, and R. C. Hatfield. 2004. Electronic versus face-to-face review: The effects of alternative forms of review on auditors’ performance. The Accounting Review 79 (4): 949–966.
Brouard, F., M. Bujaki, S. Durocher, and L. C. Neilson. 2017. Professional accountants’ identity formation: an integrative framework. Journal of Business Ethics 142 (2): 225–238.
76
Cai, H., and J. T.-Y. Wang. 2006. Overcommunication in strategic information transmission games. Games and Economic Behavior 56 (1): 7–36.
Cason, T. N., R. M. Sheremeta, and J. Zhang. 2012. Communication and efficiency in competitive coordination games. Games and Economic Behavior 76 (1): 26–43.
Chakravarty, S., Y. Ma, S. Maximiano, and others. 2011. Lying and friendship.
Charness, G., and M. Dufwenberg. 2006. Promises and partnership. Econometrica 74 (6): 1579–1601.
Crawford, V. 1998. A survey of experiments on communication via cheap talk. Journal of Economic theory 78 (2): 286–298.
Dawes, R. M., J. McTavish, and H. Shaklee. 1977. Behavior, communication, and assumptions about other people’s behavior in a commons dilemma situation. Journal of Personality and Social Psychology 35 (1): 1–11.
DePaulo, B. M., and D. A. Kashy. 1998. Everyday lies in close and casual relationships. Journal of Personality and Social Psychology 74 (1): 63–79.
Fischbacher, U. 2007. z-Tree: Zurich toolbox for ready-made economic experiments. Experimental economics 10 (2): 171–178.
Friedman, D., and S. Sunder. 1994. Experimental methods: A primer for economists. Cambridge University Press.
Gaynor, L. M., A. S. Kelton, M. Mercer, and T. L. Yohn. 2016. Understanding the relation between financial reporting quality and audit quality. Auditing: A Journal of Practice & Theory 35 (4): 1–22.
Gochnauer, S. 2018. How Do Specialist Expertise, Auditor-Specialist Communication, and Time Pressure Affect Auditors’ Use of Specialists’ Valuations? Dissertation, Oxford, MS: University of Mississippi.
Hayes, A. F. 2017. Introduction to mediation, moderation, and conditional process analysis: A regression-based approach. 2nd ed. New York City, NY: Guilford Publications.
Haynes, C. M., and S. J. Kachelmeier. 1998. The effects of accounting contexts on accounting decisions: A synthesis of cognitive and economic perspectives in accounting experimentation. Journal of Accounting Literature 17: 97.
77
Hobson, J. L., M. Stern, and A. F. Zimbelman. The Benefit of Mean Auditors: The Influence of Social Interaction and the Dark Triad on Unjustified Auditor Trust (August 31, 2018). Available at SSRN: https://ssrn.com/abstract=3038950.
Kachelmeier, S.J. 2018. Testing auditor-client interactions without letting auditors and clients fully interact: Comments on Bennett and Hatfield (2018). Accounting, Organizations and Society 68-69: 58-62.
Kachelmeier, S. J., and B. W. VanLanduyt. 2017. Prompting the Benefit of the Doubt: The Joint Effect of Auditor-Client Social Bonds and Measurement Uncertainty on Audit Adjustments. Journal of Accounting Research 55 (4): 963–994.
Kadous, K., J. Leiby, and M.E. Peecher. 2013. How do auditors weight informal contrary advice? The joint influence of advisor social bond and advice justifiability. The Accounting Review, 88(6), pp.2061-2087.
King, R. R. 2002. An experimental investigation of self-serving biases in an auditing trust game: The effect of group affiliation. The Accounting Review 77 (2): 265–284.
Laing, R. D. 1969. The divided self. New York: Pantheon Books.
Langer, E. J. 1975. The illusion of control. Journal of personality and social psychology 32 (2): 311.
Libby, R., R. Bloomfield, and M. W. Nelson. 2002. Experimental research in financial accounting. Accounting, Organizations and Society 27 (8): 775–810.
PCAOB, P. C. A. O. B. 2010a. AS 2110: Identifying and Assessing Risks of Material Misstatement. PCAOB: Washington, D.C.
———. 2010b. AS 1201: Supervision of the Audit Engagement. PCAOB: Washington, D.C.
Peecher, M. E., and I. Solomon. 2001. Theory and experimentation in studies of audit judgments and decisions: Avoiding common research traps. International Journal of Auditing 5 (3): 193–203.
Roccas, S., and M. B. Brewer. 2002. Social identity complexity. Personality and Social Psychology Review 6 (2): 88–106.
Saiewitz, A., and T. Kida. 2018. The effects of an auditor’s communication mode and professional tone on client responses to audit inquiries. Accounting, Organizations and Society 65: 33–43.
78
Tajfel, H. 1974. Social identity and intergroup behaviour. Information (International Social Science Council) 13 (2): 65–93.
Waymire, G. B., R. Lunawat, and B. Xin. 2014. A Peek Behind the Curtain that Conceals Self-Dealing. Working Paper.
Wilks, T. J. 2002. Predecisional Distortion of Evidence as a Consequence of Real-Time Audit Review. The Accounting Review 77 (1): 51–71.
79
APPENDIX
80
Appendix A: Participant Instructions Ground Rules
• NO TALKING I hope that you enjoy participating in this study, but it is serious research. Accordingly, I ask that you refrain from talking to each other during the session—comments, even if intended in jest, could contaminate others’ decisions. If you have a question, please raise your hand. Finally, please keep your eyes on your own screen and do not look at other’s screens.
• NO DECEPTION
I promise that I will conduct the experiment in the exact manner described in these instructions, without any form of deception.
Please do not remove these instructions or other materials from the laboratory, except for
the copy of your information sheet.
81
How will you be compensated? I will pay you a $5.00 show-up fee for participating in today’s session. Furthermore, as described below, you can earn additional cash compensation during the session. In today’s session, you will have the opportunity to earn points based on the decisions you and others make. Each point you earn will increase your cash payment at the rate of 19 cents per point earned. Upon completion of this study, and before you leave the room today, you will be paid in US dollars. Therefore, your compensation for this study may be calculated as follows: Total compensation = $5.00 + (Total Points Earned x $0.19) Depending on how you play the game, you could earn anywhere from $8 to approximately $34 Please note that the number of points you earn each round will depend on three things as described on page 4
(1) the action you choose, (2) the action chosen by the player you are paired with, and (3) random chance.
The decisions that you and the others will make are described in more detail below, but the important thing to keep in mind is that the more points you earn, the more money you will be paid.
82
Overview of Session
This is a computerized, decision-making study. We expect the entire session to last no longer than 75 minutes. The session will consist of 15 rounds of a computerized, simple decision-making game. The following pages outline the detailed procedures to be used during this session. At the end of the instructions there will be a short quiz on these instructions to ensure your understanding. Role Assignment Just prior to the first round, the computer will assign you to a player type, either BLUE or GREEN. You will remain in the same player type for all 15 rounds. One-half of the participants will be assigned to the BLUE player type, and the remaining one-half will be assigned to the GREEN player type. Prior to the first round, each GREEN player will be paired with a BLUE player for all 15 rounds. Note that these pairings are anonymous. Therefore, you will never know exactly with whom you are paired. All you will know for sure is that you are paired with one of the participants assigned to the other player type. Action Choices Each player must choose between the two options available to them, which leads to 4 possible outcomes for each round. If you are a GREEN player, you will designate your choice by selecting LEFT or RIGHT. If you are a BLUE player, you will designate your choice by selecting UP or DOWN. You will use your computer’s mouse to make your choice. IMPORTANT: You will always make your choice without knowing what the other player has chosen for that round. This is the same for the player you will be paired with. Next, we describe the points for each possible outcome in a round.
83
Earning Points As described in the table below, the number of points you will earn in each round will depend on the decisions you and the other player you are paired with make. Feel free to refer to this table during the session. GREEN LEFT RIGHT
BLUE
UP
GREEN earns: 4 (10% chance)
or 6 (90% chance)
5.8 average
BLUE earns: 10 (70% chance)
or 1 (30% chance)
7.3 average
GREEN earns: 1 (10% chance)
or 10 (90% chance)
9.1 average
BLUE earns: 10 (30% chance)
or 1 (70% chance)
3.7 average
DOWN
GREEN earns: 4 (90% chance)
or 6 (10% chance)
4.2 average
BLUE earns: 4 (70% chance)
or 6 (30% chance)
4.6 average
GREEN earns: 1 (90% chance)
or 10 (10% chance)
1.9 average
BLUE earns: 4 (30% chance)
or 6 (70% chance)
5.4 average
Notice from the table above that each player’s earnings depend not only on his/her own choice, but also the other player’s choice.
84
The table can be read as follows...
If the BLUE player selects UP and the GREEN player selects LEFT:�
There is a 70% chance that BLUE will earn 10 points and a 30% chance that BLUE will earn 1 point;
There is a 10% chance that GREEN will earn 4 points and a 90% chance that GREEN will earn 6 points.
On average (if these choices were made repeatedly many, many times), BLUE would earn an average of 7.3 points and GREEN would earn an average of 5.8 points.
If the BLUE player selects UP and the GREEN player selects RIGHT:�
There is a 30% chance that BLUE will earn 10 points and a 70% chance that BLUE will earn 1 point;
There is a 10% chance that GREEN will earn 1 point and a 90% chance that GREEN will earn 10 points.
On average (if these choices were made repeatedly many, many times), BLUE would earn an average of 3.7 points and GREEN would earn an average of 9.1 points.
If the BLUE player selects DOWN and the GREEN player selects LEFT:�
There is a 70% chance that BLUE will earn 4 points and a 30% chance that BLUE will earn 6 points;
There is a 90% chance that GREEN will earn 4 points and a 10% chance that GREEN will earn 6 points.
On average (if these choices were made repeatedly many, many times), BLUE would earn an average of 4.6 points and GREEN would earn an average of 4.2 points.
If the BLUE player selects DOWN and the GREEN player selects RIGHT:�
There is a 30% chance that BLUE will earn 4 points and a 70% chance that BLUE will earn 6 points;
There is a 90% chance that GREEN will earn 1 point and a 10% chance that GREEN will earn 10 points.
On average (if these choices were made repeatedly many, many times), BLUE would earn an average of 5.4 points and GREEN would earn an average of 1.9 points.
85
Communication
[MANAGER CHAT CONDITION ONLY] For 45 seconds at the beginning of each round, you will be able to chat online with the other player you are paired with. You may chat about anything you wish including the game or other topics, but since you are paired with the other player anonymously, please do not communicate identifying information about yourself. Once the timer in the upper right-hand corner gets to zero the chat will be over.
[AUDITOR CHAT CONDITION ONLY] For 45 seconds at the beginning of each round, each BLUE player will be able to chat online with the other BLUE players. You may chat about anything you wish including the game or other topics, but please do not communicate identifying information about yourself. Once the timer in the upper right-hand corner gets to zero the chat will be over.
[AUDITOR CHAT CONDITION FOLLOWING MANAGER CHAT] For 45 seconds after the chat between the GREEN and BLUE players, each BLUE player will be able to chat online with the other BLUE players. You may chat about anything you wish including the game or other topics, but please do not communicate identifying information about yourself. Once the timer in the upper right-hand corner gets to zero the chat will be over.
[ALL CONDITIONS] Each round the GREEN player will first submit his/her action choice (LEFT or RIGHT). After the GREEN player submits his/her action choice, but before the BLUE player submits his/her action choice, the GREEN player will send one of the following messages to the BLUE player:
• “I selected LEFT this round.” • “I selected RIGHT this round.”
Note: the GREEN player may submit either message regardless of their action choice. That is, the submitted message may match GREEN’s actual choice, or it may not.
After the BLUE player receives the GREEN player’s message, the BLUE player will make his/her action choice (UP or DOWN).
Feedback
After each player has made his/her action choice, you will learn how many points you earned in that round based on the table on page 4. Each person will only be told their own point outcome, but will not be told the number of points earned by any other player. After you receive this report, click “OK” to continue on to the next round. Post-Session Questionnaire and Payment At the end of the session, I will ask you to complete a short questionnaire about your experience. When you have completed the questionnaire, please wait patiently and the supervisor will pay you for your participation.
86
Please do not remove these instructions or other materials from the laboratory, except for your copy of the information sheet.
87
Appendix B: z-Tree Screenshots
[Manager (Green) Player]
88
89
90
[Auditor-Manager Chat Condition Only]
91
[Auditor-Manager Chat Condition Only]
92
[Auditor-Auditor Chat Condition Only]
93
94
95
96
97
98
[Appears at the beginning of each round from rounds 2-15]
99
[Appears at the beginning of round 11 for chat conditions only]
100
[Appears at the end of the session]
101
[Auditor (Blue) Player]
102
103
104
[Auditor-manager chat condition only]
105
[Auditor-manager chat condition only]
106
[Auditor-auditor chat condition only]
107
[Auditor-auditor chat condition only]
108
109
110
111
112
113
[Appears at the beginning of each round from rounds 2-15]
114
[Appears at the beginning of round 11 for chat conditions only]
115
[Appears at the end of the session]
116
Appendix C: Post-Experimental Questionnaire
[For Auditor (Blue) Players]
Questionnaire Instructions: Please circle on the scale how much you agree or disagree with each statement below.
Answer the following in reference to the GREEN player with whom you were paired.
Strongly Disagree Disagree Neutral Agree
Strongly Agree
I feel the successes of the GREEN player I was paired with were my successes.
1 2 3 4 5 6 7 8 9
When referring to the GREEN player I was paired with, I think of “we” rather than “he or she”.
1 2 3 4 5 6 7 8 9
I feel like I was on a team with the GREEN player I was paired with.
1 2 3 4 5 6 7 8 9
I wanted the GREEN player I was paired with to succeed.
1 2 3 4 5 6 7 8 9
I feel close to the GREEN player I was paired with.
1 2 3 4 5 6 7 8 9
I have positive feelings towards the GREEN player I was paired with.
1 2 3 4 5 6 7 8 9
I feel like I was working together with the GREEN player I was paired with.
1 2 3 4 5 6 7 8 9
117
Answer the following in reference to the other BLUE players.
Strongly Disagree Disagree Neutral Agree
Strongly Agree
When I talk about the BLUE player role, I usually said “we” rather than “they”.
1 2 3 4 5 6 7 8 9
I feel the successes of the other BLUE players were my successes.
1 2 3 4 5 6 7 8 9
I feel like I was on a team with the other BLUE players.
1 2 3 4 5 6 7 8 9
I wanted the other BLUE players to succeed.
1 2 3 4 5 6 7 8 9
I feel close to the other BLUE players.
1 2 3 4 5 6 7 8 9
I have positive feelings towards the other BLUE players.
1 2 3 4 5 6 7 8 9
I feel like I was working together with the other BLUE players.
1 2 3 4 5 6 7 8 9
Answer the following general questions. Strongly
Disagree Disagree Neutral Agree Strongly
Agree I feel my choice between UP or DOWN was a risky choice.
1 2 3 4 5 6 7 8 9
I feel accountable to the other BLUE players.
1 2 3 4 5 6 7 8 9
I feel accountable to the GREEN player that I was paired with.
1 2 3 4 5 6 7 8 9
I feel that I had control over the choices the GREEN player made.
1 2 3 4 5 6 7 8 9
118
Answer the following general questions (continued). Strongly
Disagree Disagree Neutral Agree Strongly
Agree I feel the GREEN player I was paired with was trustworthy.
1 2 3 4 5 6 7 8 9
Demographic Questions:
1. Age: __________ 2. What is your current/intended major?
a. Accounting b. Finance c. Marketing d. Undecided e. Other; please specify ______________________________
3. Please circle your classification in school.
a. Freshman b. Sophomore c. Junior d. Senior e. Masters
4. Please circle your gender:
a. Female b. Male
5. Years of accounting-related work experience: __________
119
[For Manager (Green) Players]
Questionnaire Instructions: Please circle on the scale how much you agree or disagree with each statement below.
Answer the following in reference to the BLUE player with whom you were paired.
Strongly Disagree Disagree Neutral Agree
Strongly Agree
I feel the successes of the BLUE player I was paired with were my successes.
1 2 3 4 5 6 7 8 9
When referring to the BLUE player I was paired with, I think of “we” rather than “he or she”.
1 2 3 4 5 6 7 8 9
I feel like I was on a team with the BLUE player I was paired with.
1 2 3 4 5 6 7 8 9
I wanted the BLUE player I was paired with to succeed.
1 2 3 4 5 6 7 8 9
I feel close to the BLUE player I was paired with.
1 2 3 4 5 6 7 8 9
I have positive feelings towards the BLUE player I was paired with.
1 2 3 4 5 6 7 8 9
I feel like I was working together with the BLUE player I was paired with.
1 2 3 4 5 6 7 8 9
120
Answer the following in reference to the other GREEN players.
Strongly Disagree Disagree Neutral Agree
Strongly Agree
When I talk about the GREEN player role, I usually said “we” rather than “they”.
1 2 3 4 5 6 7 8 9
I feel the successes of the other GREEN players were my successes.
1 2 3 4 5 6 7 8 9
I feel like I was on a team with the other GREEN players.
1 2 3 4 5 6 7 8 9
I wanted the other GREEN players to succeed.
1 2 3 4 5 6 7 8 9
I feel close to the other GREEN players.
1 2 3 4 5 6 7 8 9
I have positive feelings towards the other GREEN players.
1 2 3 4 5 6 7 8 9
I feel like I was working together with the other GREEN players.
1 2 3 4 5 6 7 8 9
Answer the following general questions.
Strongly
Disagree Disagree Neutral Agree Strongly
Agree I feel my choice between LEFT or RIGHT was a risky choice.
1 2 3 4 5 6 7 8 9
I feel accountable to the other GREEN players.
1 2 3 4 5 6 7 8 9
I feel accountable to the BLUE player that I was paired with.
1 2 3 4 5 6 7 8 9
121
Answer the following general questions (continued). Strongly
Disagree Disagree Neutral Agree Strongly
Agree I feel that I had control over the choices the BLUE player made.
1 2 3 4 5 6 7 8 9
I feel the BLUE player I was paired with was trustworthy.
1 2 3 4 5 6 7 8 9
Demographic Questions:
1. Age: __________
2. What is your current/intended major? a. Accounting b. Finance c. Marketing d. Undecided e. Other; please specify ______________________________
3. Please circle your classification in school. a. Freshman b. Sophomore c. Junior d. Senior e. Masters
4. Please circle your gender:
a. Female b. Male
5. Years of accounting-related work experience: __________
122
VITA
EMILY K. HORNOK, CPA 200 Conner Hall | University, MS 38677 | [email protected]
EDUCATION AND CERTIFICATION
University of Mississippi, Oxford, MS May 2019 (anticipated) Doctor of Philosophy, Accountancy
University of Arkansas, Fayetteville, AR May 2010
Master of Accountancy John Brown University, Siloam Springs, AR December 2008
Bachelor of Science in Accounting CPA License, State of Arkansas, April 2011–Present PROFESSIONAL EXPERIENCE
University of Mississippi August 2014–Present Patterson School of Accountancy
Teaching and Research Assistant John Brown University March 2014–August 2016 Donald G. Soderquist College of Business
Adjunct Instructor Rasco Winter Abston Moore & Associates, LLP September 2010–July 2014
Staff and Senior Auditor University of Arkansas August 2009–May 2010 Sam M. Walton College of Business
Interests Auditing, Strategic Interactions between the Auditor and Manager, Auditor Communication, Audit Quality, Auditor Learning & Knowledge Acquisition (Behavioral) Dissertation “The Effect of Auditors’ Informal Communication in The Audit Environment on Financial Reporting Outcomes”
Committee: Kendall O. Bowlin (chair), John P. Bentley, Jeremy B. Griffin, and Rachna Prakash of the University of Mississippi
Working Paper “The Effects of Auditor Tenure and Complexity of the Information Environment on Auditor and Manager Behavior” with Kendall O. Bowlin and Jeremy B. Griffin of the University of Mississippi. Preparing for journal submission. “The Initial Bridge Between Academia and the Accounting Profession: The AAUIA From 1916-1920” with Dale L. Flesher of the University of Mississippi. Revise and resubmit at Accounting Historians Journal. Presentations Hornok, E.K. The Effect of Auditors’ Informal Communication in The Audit Environment on Financial Reporting Outcomes
• Dissertation defense; University of Mississippi; Oxford, Mississippi; February 1, 2019. (successfully defended)
• Three Minute Thesis (3MT) Competition, University of Mississippi; Oxford, Mississippi; October 23, 2018.
• Invited presentation; Ball State University; Muncie, Indiana; October 10, 2018. • Invited presentation; East Carolina University; Greenville, North Carolina; October
2, 2018. • Invited presentation; Baylor University; Waco, Texas; September 28, 2018. • Dissertation proposal; University of Mississippi; Oxford, Mississippi; March 9, 2018.
(successfully defended) • Invited presentation; East Carolina University Accounting Research Roundtable
Gathering; Greenville, North Carolina; February 9, 2018. • Small Group Presentation; Deloitte Doctoral Consortium; Westlake, Texas; June
2017.
124
Bowlin, K.O., Griffin, J.B., and Hornok, E.K. The Effects of Auditor Tenure and Complexity of the Information Environment on Auditor and Manager Behavior
• Accepted paper; AAA Annual Meeting; San Diego, California; August 8, 2017. • Graduate Student Council 7th Annual Research Symposium, University of
Mississippi; Oxford, Mississippi; March 2, 2017. • Workshop paper; University of Mississippi; Oxford, Mississippi; November 4, 2016. • Three Minute Thesis (3MT) Competition, University of Mississippi; Oxford,
Mississippi; November 3, 2016.
Hornok, E.K. and Flesher, D.L., The American Association of University Instructors of Accounting: The First Five Years.
• Accepted paper; AAA Annual Meeting; New York City, New York; August 9, 2016. • Accepted paper; AAA SE Regional Meeting; Asheville, North Carolina; April 18,
2015. CONFERENCE PARTICIPATION
AAA Auditing Section Mid-Year Meeting; Nashville, Tennessee; January 2019. AAA 2018 Accounting Behavior and Organizations Research Conference and Doctoral
Consortium; Phoenix, Arizona; October 2018. AAA Annual Meeting; National Harbor, Maryland; August 2018. AAA Auditing Section Mid-Year Meeting and Doctoral Consortium; Portland, Oregon;
January 2018. AAA Accounting PhD Rookie Recruiting & Research Camp (observer only); Miami, Florida;
December 2017. AAA Annual Meeting; San Diego, California; August 2017. AAA/Deloitte Foundation/J. Michael Cook Doctoral Consortium; Westlake, Texas; June
2017. AAA Auditing Section Meeting and Doctoral Consortium; Orlando, Florida; January 2017. AAA Annual Meeting; New York City, New York; August 2016. AAA SE Regional Meeting; Asheville, North Carolina; April 2015. TEACHING
Courses Instructed • ACCY 309: Cost Control
University of Mississippi Patterson School of Accountancy Spring 2018 – 2 sections (55 and 50 students) Fall 2017 – 2 sections (63 and 88 students)
• ACCY 201: Introduction to Accounting Principles I
University of Mississippi Patterson School of Accountancy Spring 2017 – 2 sections (56 and 54 students)
125
Fall 2016 – 2 sections (53 and 54 students) Spring 2016 – 1 section (50 students) Fall 2015 – 2 sections (52 and 48 students) Summer 2015 – 1 section (47 students) Spring 2015 – 2 sections (57 and 52 students) Fall 2014 – 1 section (45 students)
• BUS 7013: Managerial Accounting (for MBA students) John Brown University Donald G. Soderquist College of Business
Teaching Interests Auditing, Managerial Accounting, and Financial Accounting PROFESSIONAL SERVICE
American Accounting Association • Volunteer reviewer, 2019 AAA Auditing Section Mid-Year Meeting • Volunteer reviewer and discussant, AAA 2018 Accounting Behavior and
Organizations Research Conference • Volunteer discussant, Auditing Section, 2018 AAA Annual Meeting • Volunteer reviewer and discussant, 2018 AAA Auditing Section Mid-Year Meeting • Volunteer reviewer and discussant, Auditing and ABO (reviewer only) Sections,
2017 AAA Annual Meeting • Volunteer reviewer and discussant, 2017 AAA Auditing Section Mid-Year Meeting • Auditing Research Summaries Database Instructional Video, Auditing Section of
AAA (2016) Academic Journals
• Ad hoc reviewer, Research in Accounting Regulation, 2017 Community
• Member, John Brown University Board of Trustees, July 2017–June 2020 o Finance, Facilities, and Audit Committee and Audit Sub-committee
PROFESSIONAL AFFILIATIONS
• Member, American Accounting Association: Auditing Section, 2016–Present • Member, American Accounting Association: Accounting, Behavior and Organizations
Section, 2016–Present • Member, American Accounting Association, 2015–Present • Member, American Institute of Certified Public Accountants, 2011–2015 • Member, Arkansas State Society of Certified Public Accountants, 2011–2015
126
SKILLS
• z-Tree Software HONORS, AWARDS, AND GRANTS
• University of Mississippi Graduate School Dissertation Fellowship, Spring 2019 • University of Mississippi Graduate School Dissertation Fellowship, Fall 2018 • University of Mississippi 2016 Three Minute Thesis (3MT) Competition Finalist • 2016 University of Mississippi Graduate Student Council Research Grant (1 of 23
awards among all academic disciplines) • Graduate Achievement Award, Patterson School of Accountancy, April 2016 • Phi Kappa Phi Honor Society, inducted April 2016 • 2010 Glezen Award Winner, Sam M. Walton College of Business • Member, Beta Gamma Sigma Academic Honor Society, 2010–Present • 1st Place—Donald W. Reynolds Arkansas Governor’s Cup 2009 Business Plan
Competition • Member, Alpha Chi National College Honor Society, 2007–Present
SCHOLARSHIPS AND ACTIVITIES
• Faculty Guest Coach for the University of Mississippi Football Team, November 2015
• Member, Committee for the Future benefiting Arkansas Children’s Hospital, 2013–2014
• Member, Master of Accountancy Student Advisory Board, Sam M. Walton College of Business, 2009–2010
• Arkansas Society of Certified Public Accountants Student Education Scholarship Recipient, 2008
• Director of Finance and Administration, John Brown University Student Ministries Leadership Team, 2007–2008
• Leadership Scholar, John Brown University, 2005–2008 • President’s List of Distinguished Students for 7 of 7 semesters, John Brown