* Corresponding author, Mercu Buana University, Jakarta, Indonesia Contact details: Mercu Buana University, 11650, Jakarta, Indonesia
** Mercu Buana University, Jakarta, Indonesia
1. INTRODUCTION
The existence of the capital market is very important for investors as a place to see and assess the performance of a company, so investors are interested in investing in companies that are considered profitable and can provide value to the company. The purpose of the establishment of the company is first to achieve optimal profits, second is to prosper the owner of the company or shareholders and third is to maximize the value of the company that is reflected in the share price. The three goals of the company are actually substantially not much different, it’s just that the emphasis to be achieved by each company is different from one company to another (Martono & Harjito, 2015).
Profitability is the company’s ability to make a profit in relation to sales, total assets and own capital. Thus for the long term, investors will be very interested in this profitability analysis. For example, shareholders will see profits that will actually be received in the form of dividends (Sartono, 2010, p. 123).
A manager must be able to raise funds both sourced from within the company and from outside the company efficiently, in the sense that the funding decision is a funding decision that is able to minimize the cost of capital that must be borne by the company. Capital costs arising from the funding decision are consequences that directly arise from the decisions made by managers. When managers use debt, obviously the capital costs incurred in the amount of interest costs charged by creditors,
This study aims to examine the influence of capital expenditure variables, company growth, and company size on firm value through financial performance is moderated by the capital structure of the company in LQ 45 companies listed on the Indonesia Stock Exchange. The research methodology uses quantitative methods, the number of observations as many as 50 sourced from 45 companies over 5 annual periods. The results of this study found that: (1) Capital Expenditure (Capex), Company Growth (Growth) and Company Size (Size) had no effect on Company Value (PBV), (2) Capital Expenditure (Capex) does not affect Financial Performance (ROE), (3) Company Growth (Growth) and Company Size (Size) have a significant effect on ROE, (4) Financial Performance (ROE) has a significant positive effect on Value Company (PBV), (5) Financial Performance (ROE) does not mediate the effect of Capital Expenditure (Capex), Company Growth (Growth) and Company Size (Size) on Firm Value (PBV), (6) Capital Structure (DER) moderates the influence of Financial Performance (ROE) to Company Value (PBV). Keywords: Capital Expenditure, Company Growth, Company Size, Financial Performance, Capital Structure, Firm Value Authors’ individual contribution: Conceptualization - S.; Methodology - S.; Writing – S.; Investigation – S.; Funding – S.; Resources – S.; Supervision – Y.H.
whereas if the manager uses internal funds or his own funds will arise opportunity costs (opportunity costs) that is the costs incurred when choosing an alternative investment from funds or own capital used. Funding decisions made inaccurately will result in fixed costs in the form of high capital costs, which in turn can result in low profitability of the company.
From the perspective of shareholders the profitability ratio used is return on equity (ROE), this ROE measures the ability of the company to obtain available profits for the company’s shareholders, the higher the ROE value indicates a high level of profitability, which means it will also provide higher profits to shareholders, so that shareholder prosperity will increase.
The company size expressed by the total value of assets, according to Ferry and Jones (in Sujianto, 2001) states that the size of the company describes the size of a company as indicated by total assets. So, the size of the company is the size of the assets owned by the company, larger size companies have greater access to get funding from various sources and have a greater probability to win the competition or survive in the industry.
Company growth is the company’s ability to increase size. The company’s growth is basically influenced by several factors, namely external, internal, and the influence of the local industrial climate. Company growth can be measured in several ways, for example by looking at sales growth. The company’s sales growth has implications for the profits derived by the company. The higher sales growth obtained by the company means that it will also provide higher profits to shareholders so that the prosperity of shareholders will also increase.
The literature, framework and hypotheses of the study are described in Section 2, while the design and methodology developed to analyze capital expenditure, growth and size of companies is explained in Section 3. Section 4 describes the result and discussion. The study ends with conclusions and an overview of future achievable research areas by applying the research method adopted in this paper (Section 5).
2. LITERATURE, FRAMEWORK AND HYPOTHESES DEVELOPMENT
Research on firm value was conducted by Pantow (2015). The results of this study prove that sales growth, company size, ROA, and capital structure simultaneously have a significant effect on firm value in the company. In line with the research results of Salim and Yadaf (2012) it is showed that company performance has a negative relationship with short-term debt (STD), long-term debt (LTD), as an independent variable. Sam and Hoshino (2013) proved that Japan has a good performance in the level of sales growth compared to ASEAN, but experienced a decline in 2008 to 2010 due to economic recession and the effects of the semiconductor industry. Cordis and Kirby (2015) prove that there is a negative correlation between investment and subsequent stock returns. Kodongo (2014) showed that tangibility of assets, sales growth and company size are important determinants of profitability. Iavorskyi (2013) results found that the relationship between leverage
and firm performance is actually negative. Meanwhile Chen and Chen (2011) proved that profitability has a positive effect on firm value, and a negative effect on leverage, while leverage has a negative effect on value, and profitability has a significant mediating effect. Babalola (2013) also proved both in terms of total assets and in terms of total sales, company size have a positive impact on the profitability of Nigerian manufacturing companies.
Myers (1997) and Hasnawati (2005) mention the value of the company as the main goal depending on the company’s expenses in the future. To reach investment decisions that produce positive net present value (Modigliani & Miller, 1961; Brigham & Houston, 2001). Fama (2001) and Delira (2007) state the value of a company is solely determined by investment decisions. Research conducted by Hidayah (2015) suggests that CAPBVA has a positive and significant effect on Price Book Value. Based on the description above, the researcher makes the following hypothesis.
Capital expenditure is used by companies to create benefits in the future; capital expenditure is used to buy fixed assets in the form of property, plants, equipment to add value to existing fixed assets with a useful life of more than one year. The results of Wachanga (2014) mention that capital expenditure has a positive and significant effect on financial performance.
Based on research conducted by Fista and Widyawati (2017), sales growth has a significant and positive effect on firm value, while research conducted by Mandalika (2016) states that sales growth has no effect on firm value. Based on this explanation, the hypothesis can be formulated as follows:
The higher the company’s growth, the more the company will rely on capital. High sales growth shows an increase in revenue obtained by the company from product sales in the company's operational activities. Sales growth from the previous year on a regular basis can be used to predict sales growth in the coming year.
According to Mualifah, Oemar, and Hartono (2017) revealed that sales growth had a positive and significant effect on profitability. In contrast to research conducted by Rinny (2016) where sales growth has no effect on profitability.
To measure the size of the company, Jogiyanto (2013) suggests that the size of the asset is used to measure the size of the company; the size of the asset is measured as a logarithm of total assets. Previous research conducted by Novari and Lestari (2017), Wahyuni (2013), Sofyaningsih and Hardiningsih (2011) stated that company size has a significant influence on firm value.
In a study conducted by Kasih (2014) company size did not significantly influence company performance. Because the greater the assets of the company, the more complex the agency problems faced. Based on research conducted by Theacini and Wisadha (2014), Novisari (2019) shows that company size influences company performance, because a large size of the company will benefit the company more in the company’s financing activities in the capital market.
Financial statements are records of a company’s financial information in an accounting period that can describe the company’s performance
(Ikatan Akuntan Indonesia 2015, p. 4). Muliani, Yuniarta and Sirnawati (2014) and Nuriwan (2018) explained that financial performance had a positive effect on firm value.
Capital expenditure is the expenditure of money for long-term capital financing, the results of which will only be obtained in a few years later. Research conducted by Andrian (2012), Cordis and Kirby (2014) stated that capital expenditure has a positive effect on the profitability of manufacturing companies listed on the IDX.
Sales growth reflects the company’s achievements in the past, where sales growth is used to predict the company’s achievement in the future. Investors use sales growth as an indicator to see the prospects of the company they will invest in later. Based on research conducted by Fista and Widyawati (2017), sales growth has a significant and positive effect on firm value, while research conducted by Mandalika (2016) and Pantow (2015) states that sales growth has no effect on firm value. However, this study contradicts the research conducted and research conducted by Fista and Widyawati (2017) which states that sales growth has a significant effect on firm value.
The size of the company can be measured by using the natural log of the total assets of the company which is able to explain the effectiveness of the company in utilizing working capital that comes from company assets to maximize the value of the company (Laksitaputri, 2012). According to Fakhruddin (as cited in Marwah Noor, 2015), the greater the company’s assets generally will attract more investors to own the company’s shares. The results of research by Marwah Noor (2015) and Triyono, Raharjo, and Arifati (2015) show that company size influences firm value. Similarly, the results of the research by Dogan (2013) along with Niresh and Velnampy (2014) show that there is an influence between company sizes on company profitability, the study hypotheses are formed as follows:
H1: Capital expenditure has a positive effect on firm value.
H2: Capital expenditure has a positive effect on
financial performance. H3: Company growth has a positive effect on
firm value.
H4: Company growth has a positive effect on financial performance.
H5: Company size has a positive effect on firm value.
H6: Company size has a positive effect on financial performance.
H7: Financial performance has a positive effect on firm value.
H8: Financial performance mediates the effect of capital expenditure on firm value.
H9: Financial performance mediates the effect of company growth on firm value.
H10: Financial performance mediates the effect of firm size on firm value.
H11: Capital structure moderates the effect of financial performance on firm value.
3. RESEARCH DESIGN AND METHODOLOGY The method used in this study is to use a type of causal research, namely research that aims to test hypotheses about one or several variables (independent variables) against other variables.
3.1. Sample and data collection
The population in this study is LQ-45 companies listed on the Indonesia Stock Exchange (IDX) for the period of 2013-2017 and publishes its report on w.w.w.idx.co.id. Sample selection uses purpose sampling where the sample doesn’t have a public ownership structure and financial statements in rupiah.
Hypotesis testing using the macro syntax command as follows:
modmedvars = PBV ROE DER Capex/dv = PBV/med = ROE/dv model = ROE DER/mmode = Capex/jn = 1 modmed vars = PBV ROE DER Growth/dv = PBV/ med = ROE/dv model = ROE DER/mmodel = Growth/jn = 1 modmed vars = PBV ROE DER Size/dv = PBV/med = ROE/dv model = ROE DER/mmodel = Size/jn = 1
3.2. Dependent variable
According to Sugiyono (2016, p. 39), Dependent Variables/Bound Variables are: Variables that are affected or that are due, because of the independent variables. The dependent variable in this study is the value of the company.
3.3. Independent variables
According to Sugiyono (2016, p. 39), Independent Variables are Variables that influence or are the cause of changes or the emergence of dependent variables (bound). The independent variables in this study are capital structure, profitability, company size and company growth. The definitions and operations of each variable are as follows:
Table 1. Definition and measurement of variables
No. Variable Definition Measurement
1. Capex Capital Expenditure Total Fixed Asset
2. Growth Company Growth Total Sales
3. Size Firm Size Total Asset
4. DER Capital Structure Total Debt/Total Equity
5. ROE Financial Performance Net Income After Tax/Total Equity
6. PBV Firm Value Market Price per Share/Book Value per Share
Note: **. Correlation is significant at the 0.01 level (2-tailed).
Descriptive statistics provide a description of a
data that is seen through the minimum/maximum value, the mean (average) standard deviation (Ghozali, 2016, p. 19). Table 3 presents descriptive statistics for the full sample of 114 firm-year observations. The average value of capital expenditure (Capex) is 15.8406, the average growth of the company (Growth) is 15.4%. The average value of company size (Size) is 17.33374, the average value of financial performance (ROE) is 0.7896, and the average value of capital structure (DER) is 0.1592. The average value of the firm’s value (PBV) of 2.8540 indicates that the company that has become a sample in its investment activities can already
generate profits that provide a higher value than investment expenses.
4.2. Testing hypotheses
Moderator and Mediator (Modmed) Variable Analysis basically shows how far the influence of independent variables on the dependent variable. The result of modmed analysis is Capital Expenditurem (Capex), Company Growth (Growth) and Company Size (Size) had no effect on Company Value (PBV). It meant H1, H2, H3 rejected. Capital Expenditure (Capex) does not affect financial performance (ROE) H2 rejected, Company Growth (Growth) and Company Size (Size) have a significant effect on ROE its mean Ha4 and Ha6 accepted. Financial Performance (ROE) has a significant positive effect on Value Company (PBV) its mean H7 accepted. Financial Performance (ROE) does not mediate the effect of Capital Expenditure (Capex), Company Growth (Growth) and Company Size (Size) on Firm Value (PBV) its mean H8, H9 and H10 rejected. Capital Structure (DER) moderates the influence of Financial Performance (ROE) to company value (PBV) its mean H11 accepted. The results of the modmed analysis can be seen in the in the groups of tables presented below:
1. Test Modmed Effect of Capital Expenditure (Capex) (X1) on Company Value (PBV) (Z) through Financial Performance (ROE) (Y) moderated by Capital Structure (DER) (M)
Table 4. Dependent variable model
Coeff SE t P>|t|
Constant -3.2382 4.8146 -0.6726 0.5047
Capex 0.0565 0.2466 0.2292 0.8198
ROE 4.7895 1.9952 2.4005 0.0206
DER 38.8443 10.6007 3.6643 0.0007
Inter2 -41.6667 15.7762 -2.6411 0.0113
Note: Interaction Terms: Inter2: ROE * DER.
Table 5. Mediator variable model
Coeff SE t P>|t|
Constant 2.9881 1.1553 2.5864 0.0128
Capex -0.1388 0.0728 -1.9072 0.0625
Table 6. Conditional indirect effect at specific
value(s) of the moderator(s)
DER Ind Eff SE Z P>|Z|
0.1045 -0.0602 0.091 -0.6611 0.5085
0.1592 0.2559 0.1766 1.4494 0.1472
0.2139 0.572 0.3815 1.4994 0.1338
Note: Moderator values listed are the sample mean and +/- 1 SD.
2. Modmed Test The Effect of Company Growth (X2) on Company Value (PBV) (Z) through Financial Performance (ROE) (Y) moderated by Capital Structure (DER) (M).
Table 7. Dependent variable model
Coeff SE t P>|t|
Constant -2.7008 1.4560 -1.8550 0.0702
Growth -1.8159 1.5183 -1.1960 0.2380
ROE 5.1992 1.8065 2.8781 0.0061
DER 40.5493 9.7170 4.1730 0.0001
Inter2 -41.2933 14.0768 -2.9334 0.0053
Note: Interaction Terms: Inter2: ROE * DER.
Table 8. Mediator variable model
Coeff SE t P>|t|
Constant 0.5259 0.0787 6.6846 0.000
Growth 1.7126 0.3099 5.5263 0.000
Table 9. Conditional indirect effect at specific
value(s) of the moderator(s)
DER Ind Eff SE Z P>|Z|
0.1045 1.5108 1.1455 1.3189 0.1872
0.1592 -2.3543 1.4563 -1.6166 0.1060
0.2139 -6.2194 2.7375 -2.2719 0.0231
Note: Moderator values listed are the sample mean and +/- 1 SD.
3. Modmed Test Effect of Company Size (X3) on Company Value (PBV) (Z) through Financial Performance (ROE) (Y) moderated by Capital Structure (DER) (M).
Note: Moderator values listed are the sample mean and +/- 1 SD.
Table 4 shows that the Capital Expenditure
(Capex) variable has no effect on the company value (PBV) with a coefficient of 0.565 and is significant at 0.8198 or greater than 0.05. So it can be concluded that H1 is rejected.
Table 5 shows that the Capital Expenditure
variable (Capex) does not have a significant effect on Financial Performance (ROE) with a coefficient value of -0,1386 and significant at 0.0625 or greater than 0.05 so it can be concluded that H2 is rejected.
Table 7 explain the Growth variable has no
influence on Company Value (PBV) with a coefficient value of -1.8159 and significant at 0.2380. So it can be concluded that H3 is rejected.
Table 8 shows that the Growth variable has a
significant effect on ROE with a coefficient value of 1.7126 and significant at 0,000. So it can be concluded that H4 is accepted.
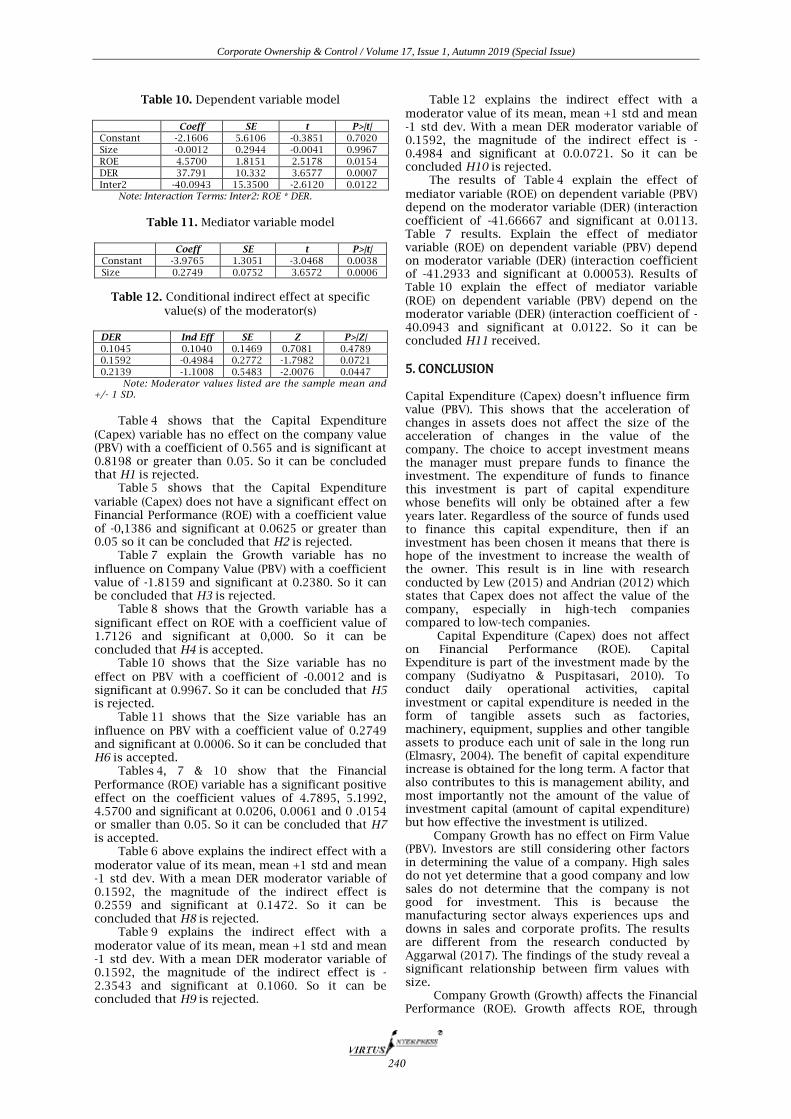
Table 10 shows that the Size variable has no
effect on PBV with a coefficient of -0.0012 and is significant at 0.9967. So it can be concluded that H5 is rejected.
Table 11 shows that the Size variable has an
influence on PBV with a coefficient value of 0.2749 and significant at 0.0006. So it can be concluded that H6 is accepted.
Tables 4, 7 & 10 show that the Financial
Performance (ROE) variable has a significant positive effect on the coefficient values of 4.7895, 5.1992, 4.5700 and significant at 0.0206, 0.0061 and 0 .0154 or smaller than 0.05. So it can be concluded that H7 is accepted.
Table 6 above explains the indirect effect with a
moderator value of its mean, mean +1 std and mean -1 std dev. With a mean DER moderator variable of 0.1592, the magnitude of the indirect effect is 0.2559 and significant at 0.1472. So it can be concluded that H8 is rejected.
Table 9 explains the indirect effect with a
moderator value of its mean, mean +1 std and mean -1 std dev. With a mean DER moderator variable of 0.1592, the magnitude of the indirect effect is -2.3543 and significant at 0.1060. So it can be concluded that H9 is rejected.
Table 12 explains the indirect effect with a
moderator value of its mean, mean +1 std and mean -1 std dev. With a mean DER moderator variable of 0.1592, the magnitude of the indirect effect is -0.4984 and significant at 0.0.0721. So it can be concluded H10 is rejected.
The results of Table 4 explain the effect of
mediator variable (ROE) on dependent variable (PBV) depend on the moderator variable (DER) (interaction coefficient of -41.66667 and significant at 0.0113. Table 7 results. Explain the effect of mediator variable (ROE) on dependent variable (PBV) depend on moderator variable (DER) (interaction coefficient of -41.2933 and significant at 0.00053). Results of Table 10 explain the effect of mediator variable (ROE) on dependent variable (PBV) depend on the moderator variable (DER) (interaction coefficient of -40.0943 and significant at 0.0122. So it can be concluded H11 received.
5. CONCLUSION
Capital Expenditure (Capex) doesn’t influence firm value (PBV). This shows that the acceleration of changes in assets does not affect the size of the acceleration of changes in the value of the company. The choice to accept investment means the manager must prepare funds to finance the investment. The expenditure of funds to finance this investment is part of capital expenditure whose benefits will only be obtained after a few years later. Regardless of the source of funds used to finance this capital expenditure, then if an investment has been chosen it means that there is hope of the investment to increase the wealth of the owner. This result is in line with research conducted by Lew (2015) and Andrian (2012) which states that Capex does not affect the value of the company, especially in high-tech companies compared to low-tech companies.
Capital Expenditure (Capex) does not affect on Financial Performance (ROE). Capital Expenditure is part of the investment made by the company (Sudiyatno & Puspitasari, 2010). To conduct daily operational activities, capital investment or capital expenditure is needed in the form of tangible assets such as factories, machinery, equipment, supplies and other tangible assets to produce each unit of sale in the long run (Elmasry, 2004). The benefit of capital expenditure increase is obtained for the long term. A factor that also contributes to this is management ability, and most importantly not the amount of the value of investment capital (amount of capital expenditure) but how effective the investment is utilized.
Company Growth has no effect on Firm Value (PBV). Investors are still considering other factors in determining the value of a company. High sales do not yet determine that a good company and low sales do not determine that the company is not good for investment. This is because the manufacturing sector always experiences ups and downs in sales and corporate profits. The results are different from the research conducted by Aggarwal (2017). The findings of the study reveal a significant relationship between firm values with size.
Company Growth (Growth) affects the Financial Performance (ROE). Growth affects ROE, through
assets owned so that it affects the productivity and efficiency of the company which in turn affects the Financial Performance (ROE). The faster the company’s growth, the company’s ability to produce higher profits, which means that the assessment of the Financial Performance ratio (ROE) is also high. Because sales growth has a positive effect on a company’s financial performance, management focusing on profits and reinvesting profits into the company may be a better strategy in the long run. Other possible strategies to increase sales include the use of resources to invest in new technology, product diversification, diversification and penetration in regional and international markets. The results of this study are supported by research conducted by Kouser et al. (2012) and Odalo (2016) which show that Growth has a positive effect on ROE.
Company Size (Size) has no influence on the value of the company (PBV). The results of this study indicate that investors in making decisions for investment do not make the size of the company as a weight in decision making, but rather choose the profit that will be generated by the company. This is because the sample studied is companies listed as LQ 45 on the Indonesia Stock Exchange which are large category companies. Research Purwohandoko (2017) and Tui (2017) have different results the company has an influence on company values. Large companies have large market capitalization; book value is also big and big profit. Investors tend to be more interested in large-scale companies. This is because large companies tend to have more stable conditions. This stability attracts investors to own shares in the company, and this will cause an increase in share prices in the capital market.
Company Size (Size) has an influence on Financial Performance (ROE). This is due to the greater size of the company which is seen from the total assets will encourage an increase in the portion of funds that the company uses to increase production activities. Like, doing innovation, business development and investing. The maximum utilization of assets will bring opportunities for companies to earn profit and improve financial performance. The results are the same as a study conducted by Ruslan (2018) that Company Size has an influence on Financial Performance.
Financial Performance (ROE) has a significant positive effect on Company Value (PBV). The relevant ROE information gives a positive signal for investors to react, the greater the ROE ratio produced, the better, because the company’s ability to achieve profits is considered high enough which will have an
impact on increasing PBV. This condition affects the positive market perception of the value of the company. These results indicate that the increase in return on equity affects the value of the company. Investors invest because they think the company has good prospects in increasing long-term profits in the form of dividends.
Financial Performance (ROE) does not mediate the influence of Capital Expenditure (Capex), Company Growth (Growth), and Company Size (Size) on firm value (PBV). Capital expenditure giveslong-term benefits for more than one year so it can not be directly enjoyed in the current year. Investor's decision to buy shares of a company does not consider the amount of capital expenditure but rather considers the company’s performance so that it is expected to provide profits for investors in the form of dividends. The company in this study is a large LQ 45 company whose sales value is more stable so the decision to invest takes into account an increase in growth that is balanced with an increase in financial performance. Investors in this study do not make company size a factor in investment decisions. But it must also be supported by good financial performance. The results are the same as a study conducted by Sucuahi and Cambarihan (2016), that profitability has a significant positive impact on firm value.
Capital Structure (DER) moderates the relationship between Financial Performance (ROE) and Firm Value (PBV). A high DER value indicates that the company uses quite a lot for its operational activities. High debt will generate a net profit that will receive the company because high debt will provide high interest will also reduce the net profit earned by the company, so that it will further weaken financial gain. From the results of data processing, it can also be concluded that the DER variable is a pseudo moderation variable (Quasi Moderator). Quasi moderation is a variable that moderates the relationship between the independent variable and the dependent variable which also becomes the independent variable. Hoque et al. (2014) capital structure (CS), have influenced value of the firm (VF) on Dhaka Stock Exchange.
This study has limitations so that next research needs to consider a wider sample, using a longer study period of more than 5 years and adding back new variables that are thought to have an effect on company value. This is so that the conclusions drawn from the researchers have broader scope and are not only LQ 45 companies listed on the IDX but also need to cover all small and large companies from various countries.
REFERENCES 1. Afrizal, A., & Rohman, A. (2012). Pengaruh keputusan investasi, keputusan pendanaan, dan kebijakan dividen
terhadap nilai perusahaan. Diponegoro Journal of Accounting, 1(2), 1-9. 2. Aggarwal, D. (2017). Impact of capital structure on firm value: evidence from Indian hospitality industry.
Theoretical Economics Letters, 7(4), 982-1000. https://doi.org/10.4236/tel.2017.74067 3. AlGhusin, N. (2015). The impact of financial leverage, growth, and size on profitability of Jordanian industrial
listed companies. Research Journal of Finance and Accounting, 6(16), 86-93. Retrieved from https://www.iiste.org/Journals/index.php/RJFA/article/view/24978
4. Andrian, J. (2012). Pengaruh Struktur Modal, Pertumbuhan Perusahaan, Capital Expenditure dan Insentif Manager Terhadap Nilai Perusahaan Dengan Profitabilitas Sebagai Variabel Intervening. Jurnal Bisnis Strategi, 21(2), 18-45. https://doi.org/10.14710/jbs.21.2.18-45
5. Ayuba, H. (2019). Effects of financial performance, capital structure and firm size on firms’ value of insurance companies in Nigeria. Kano, Nigeria: Department of Business Administration and Entrepreneurship Studies Bayero University
6. Babalola, Y. A. (2013). The effect of firm size on firms’ profitability in Nigeria. Journal of Economics and Sustainable Development, 4(5). Retrieved from: https://pdfs.semanticscholar.org/4143/a1f3b174a5 1728d85901092b899047d97e6b.pdf
7. Belkaoui, A. R. (2010). Accounting Theory (Buku 2). Jakarta: Salemba Empat. 8. Besley, S., & Brigham, E. F. (2005). Essentials of managerial finance. Mason, the USA: Thompson South-Western. 9. Brigham, E. F., & Houston, J. (2006). Dasar-dasar manajemen keuangan (10th ed.). Jakarta, Indonesia: Salemba Empat. 10. Bukit, R. (2012). Pengaruh struktur modal terhadap nilaiPerusahaan melalui profitabilitas: Analisis data panel
perusahaan manufaktur di bursa efek Indonesia. Jurnal Keuangan dan Bisnis, 4(3), 205-218. 11. Chaidir. (2015). Pengaruh struktur modal, profitabilitas, dan pertumbuhan perusahaan terhadap nilai
perusahaan pada perusahaan sub sektor transportasi yang tercacat di bursa efek Indonesia periode 2012-2014. Jurnal Ilmiah Manajemen Fakultas Ekonomi, 1(2). https://doi.org/10.34203/jimfe.v1i2.557
12. Chen, L.-J., & Chen, S.-U. (2011). The influence of profitability on firm value with capital structure as the mediator and firm size and industry as moderators. Investment Management and Financial Innovations, 8(3).
13. Cordis, A. S., & Kirby, C. (2017) Capital expenditures and firm performance: Evidence from a cross‐sectional analysis of stock returns. Accounting & Finance, 57(4), 1019-1042. https://doi.org/10.1111/acfi.12193
14. Delira, N. (2007). Pengaruh IOS dan Manajemen Laba terhadap Nilai Perusahaan. Skripsi, Padang: Unp 15. Devi, B., Khairunnisa, K., & Budiono, E. (2017). Pengaruh intellectual capital terhadap kinerja keuangan
perusahaan (studi kasus pada perusahaan elektronik, otomotif dan komponen yang terdaftar di bursa efek Indonesia (BEI) periode 2011-2015). Proceedings of Management, 4(1). https://doi.org/10.31000/ competitive.v1i1.106
16. Dogan, M. (2013). Does firm size firm profitability affect? Evidence from Turkey. Research Journal of Finance and Accounting, 4(4), 53-59. Retrieved from https://pdfs.semanticscholar.org/ 5360/29a44ed8dd384cbcde67f9d60bc10cf5c775.pdf
17. Elmasry, H. (2007). Capital intensity and stock returns (Working Papers, Morgan Stanley Investment Management).
18. Fachrudin, K. A. (2011). Analisis pengaruh struktur modal, ukuran perusahaan dan agency cost terhadap kinerja perusahaan. Jurnal Akuntansi dan Keuangan, 13(1), 37–46. https://doi.org/10.9744/jak.13.1.37-46
19. Fahmi, I. (2012). Pengantar manajemen keuangan.teori dan soal jawab. Bandung: Alfabeta. Retrieved from http://wineebali.com/buku/wp-content/uploads/2018/05/IRHAM-FAHMI
20. Fakhruddin, H. M. (2008). Istilah pasar modal A-Z. Jakarta: Elex Media Komputindo 21. Fama, E. F., & French, K. R. (2001). Disappearing dividends: Changing firm characteristics or lower propensity to
pay? Journal of Financial Economics, 14(1), 67-79 https://doi.org/10.1111/j.1745-6622.2001.tb00321.x 22. Fista, B. F., & Widyawati, D. (2017). Pengaruh Kebijakan Dividen, Pertumbuhan Penjualan, Profitabilitas Dan
Ukuran Perusahaan Terhadap Nilai Perusahaan. Jurnal Ilmu dan Riset Akuntansi, 6(5), 2051-2070. 23. Fitri, I. N. (2014). Analisis pengaruh tingkat kenaikan penggunaan capital expenditure terhadap kinerja
perusahaan (studi empiris pada perusahaan manufaktur yang terdaftar di bursa efek Indonesia). Retrieved from: https://jurnalmahasiswa.unesa.ac.id/index.php/jurnal-akuntansi/article/view/7076/3569
24. Ghozali, I. (2016). Aplikasi analisis mulitivariet dengan program IBM SPSS 23. Jakarta, Indonesia: Badan Penerbit Universitas Diponegoro.
25. Godfrey, J., Hodgson, A., & Holmes, S. (2010). Accounting theory. Queensland: John Wiley &Sons. 26. Gudono. (2014). Teori Organisasi. Yogyakarta: BPFE Universitas Gadjah Mada. 27. Gujarati, D. (2003). Ekonometrika Dasar (2nd ed.). Jakarta: Erlangga. 28. Gusaptono, H. (2010). Faktor-faktor yang mendorong penciptaan nilai perusahaan di BEI. Buletin Ekonomi,
8(2), 70-170. Retrieved from: http://repository.upnyk.ac.id/2434/1/hendri_g_sri_susilo082011juli.pdf 29. Hanafi, M. (2014). Manajemen Keuangan (1st ed.).Yogyakarta: BPFE. 30. Harjito, A., & Martono, A. (2015). Managemen Keuangan. Cetakan Ketiga. Penerbit: Ekonisia. Yogyakarta 31. Hasnawati, S. (2005). Dampak set peluang investasi terhadap nilai perusahaan publik di Bursa Efek Jakarta.
Jurnal Akuntansi dan Auditing Indonesia, 9(2), 117-126. Retrieved from https://journal.uii.ac.id/ JAAI/article/view/805/723
32. Hery (2012). Analisis laporan keuangan. Jakarta: Bumi Aksara. 33. Hidayah, N. (2015). Pengaruh investment opportunity set (IOS) dab Kepemilikan Managerial Terhadap Nilai
Perusahaan Pada Perusahaan Property Dan Real Estate Di Bursa Eefek Iindonesia. Jurnal Akuntansi, 19(3), 420-432. https://media.neliti.com/media/publications/76103-ID-none.pdf
34. Hoque, J., Hossain, A., & Hossain, K. (2014). Impact of capital structure policy on value of the firm – a study on some selected corporate manufacturing firms under Dhaka stock exchange. Ecoforum, 3(2). Retrieved from http://www.ecoforumjournal.ro/index.php/eco/article/view/84
35. Iavorskyi, M. (2013). The impact of capital structure on firm performance: Evidence from Ukraine. Retrived from http://www.kse.org.ua/download.php?downloadid=306
36. Ikatan Akuntan Indonesia (IAI). (2013). Standar akuntansi keuangan entitas tanpa akuntabilitas public (3rd ed.). Jakarta, Indonesia
37. Ikatan Akuntan Indonesia (IAI). (2015). Pernyataan standar akuntansi keuangan. Jakarta: Ikatan Akuntan Indonesia.
38. Indriyani, E. (2017). Pengaruh ukuran perusahaan dan profitabilitas terhadap nilai perusahaan: Akuntabilitas. Jurnal Ilmu Akuntansi, 10(2), 333-348. https://doi.org/10.15408/akt.v10i2.4649
39. Javed, T. (2014). Impact of capital structure on firm performance: Evidence from Pakistani firms. International Journal of Academic Research in Economics and Management Sciences, 3(5). https://doi.org/10.6007/ IJAREMS/v3-i5/1141
40. Jitaree, W. (2015). Corporate social responsibility disclosure and financial performance: Evidence from Thailand. Retrieved from http://ro.uow.edu.au/cgi/viewcontent. cgi?article=5421&context=theses
41. Jogiyanto, & Hartono, M. (2013). Teori portofolio dan analisis investasi (8th ed.). Yogyakarta: BPFE. 42. Kartikasari, D., & Merianti, M. (2016). The effect of leverage and firm size to profitability of public
manufacturing companies in Indonesia. International Journal of Economics and Financial Issues, 6(2), 409-413. Retrieved from https://www.econjournals.com/index.php/ijefi/article/view/1763/pdf
43. Kasih, A. P. (2014). Pengaruh good corporate governance dan Ukuran Perusahaan terhadap Kinerja Perusahaan (Thesis, Universitas Muhammadiah Surakarta). Retrieved from http://eprints.ums.ac.id/30365/ 16/09_NASKAH_PUBLIKASI.pdf
44. Kodongo, O. (2014). Capital structure, profitability and firm value: panel evidence of listed firms in Kenya. https://doi.org/10.2139/ssrn.2465422
45. Kouser, R., Bano, T., Azeem, M., & Masood-ul-Hassan (2012). Inter-Relationship between Profitability, growth and size : A Case of non-financial companies from Pakistan. Pakistan Journal of Commerce & Social Sciences, 6(2), 405-419. Retrieved from https://pdfs.semanticscholar.org/b58f/ 3588101d12625d7b3fde16406cecece1bb60.pdf
46. Kusumajaya, D. K. O. (2011). Pengaruh struktur modal dan pertumbuhan perusahaan terhadap profitabilitas dan nilai perusahaan pada perusahaan manufaktur di bursa efek Indonesia (Tesis Program Pascasarjana Universitas Udayana, Denpasar, Indonesia). Retrived from: https://docplayer.info/30215886-Pengaruh-struktur-modal-dan-pertumbuhan-perusahaan-terhadap-profitabilitas-dan-nilai-perusahaan-pada-perusahaan-manufaktur-di-bursa-efek-indonesia.html
47. Laksitaputri, I. M. (2012). Analisis faktor-faktor yang mempengaruhi nilai perusahaan dengan profitabilitas sebagai variabel intervening (studi pada perusahaan manufaktur yang terdaftar di bursa efek Indonesia periode 2008-2010). Jurnal Bisnis Strategi, 21(2), 1-17. Retrieved from https://ejournal.undip.ac.id/index.php/ jbs/article/view/14220/10813
48. Lew, S. H. (2015). Investment expenditures and firm value in Korea. https://doi.org/10.2139/ssrn.2695674 49. Mandalika, A. (2016). Pengaruh struktur aktiva, struktur modal, dan pertumbuhan penjualan terhadap nilai
perusahaan pada perusahaan publik yang terdaftar di bursa efek Indonesia (studi pada sektor otomotif). Jurnal Berkala Ilmiah Efisiensi, 16(1). https://doi.org/10.24964/ja.v1i2.15
50. Mardiyati, U. (2012). Pengaruh kebijakan dividen, kebijakan hutangdan profitabilitas terhadap nilai perusahaan manufaktur yang terdaftardibursa efek Indonesia (BEI) periode 2005-2010. JurnalRiset Manajemen Sains Indonesia (JRMSI), 3(1), 1-17. Retrieved from http://journal.unj.ac.id/unj/index.php/jrmsi/article/view/770/679
51. Marwah Noor, F. (2015). Pengaruh profitabilitas dan ukuran perusahaan terhadap nilai perusahaan (studi kasus pada perusahaan makanan dan minuman yang terdaftar di bursa efek Indonesia periode tahun 2010-2014) (Diploma work). Retrieved from: https://repository.unikom.ac.id/21354/
52. Meidiawati, K. (2016). Pengaruh size, growth, profitabilitas, struktur modal, kebijakan dividen terhadap nilai perushaan. Jurnal Ilmu dan Riset Akuntansi, 5(2). Retrived from https://docplayer.info/36947222-Pengaruh-size-growth-profitabilitas-struktur-modal-kebijakan-dividen-terhadap-nilai-perusahaan.html
53. Miller, M. H., & Modigliani, F. (1961). Dividend policy, growth, and the valuation of shares. The Journal of Business, 34(4), 411-433. https://doi.org/10.1086/294442
54. Mualifah, S., Oemar, A., & Hartono, H. (2017). Pengaruh financial leverage, modal kerja, pertumbuhan penjualan, ukuran perusahaan dan leverage terhadap profitabilitas pada perusahaan manufaktur yang terdaftar di bursa efek Indonesia (BEI) 2011-2015. Jurnal Ilmiah Mahasiswa S1 Akuntansi Universitas Pandanaran, 3(3). Retrieved from: https://jurnal.unpand.ac.id/index.php/ AKS/article/view/811
55. Muliani, L. E., Yuniarta, G. A., & Sirnawati, K. (2014). Pengaruh kinerja keuangan terhadap nilai perusahaan dengan pengungkapan corporate social responsibility dan good corporate governance sebagai variabel pemoderasi (studi kasus di bursa efek Indonesia periode 2010-2012). E-journal S1 Ak Universitas Pendidikan Ganesha Jurusan Akuntansi S1, 2(1). Retrieved from https://ejournal.undiksha.ac.id/index.php/S1ak/ article/view/3423/2784
56. Myers, S. C. (1997). Determinants of corporate borrowing. Journal of Financial Economics, 5, 147-175. Retrieved from https://core.ac.uk/download/pdf/4379575.pdf
57. Nainggolan, N. E. (2015). Pengaruh struktur corporate governance terhadap pengungkapan lingkungan. Semarang, Indonesia: Universitas Diponegoro. Retrieved from http://eprints.undip.ac.id/ 45755/1/NAINGGOLAN.pdf
58. Nekhili, M., Boubaker, S., & Lakhal, F. (2012). Ownership structure, voluntary R&D siasclosure ANF market value of firms the frech case. International Journal of Business, 17(2), 126-140.
59. Niresh, J., & Velnampy, T. (2014). Firm size and profitability: A study of listed manufacturing firms in Sri Lanka. International Journal of Business and Management, 9(4), 57-64. https://doi.org/10.5539/i jbm.v9n4p57
60. Novari, P. M., & Lestari, P. V. (2016). Pengaruh Ukuran Perusahaan, Leverage, Dan Profitabilitas Terhadap Nilai Perusahaan Pada Sektor Properti Dan Real Estate. E-Jurnal Manajemen, 5(9), 5671-5694. Retrieved from https://ojs.unud.ac.id/index.php/Manajemen/article/view/22690
61. Novisari (2019). Pengaruh struktur kepemilikan, struktur modal, dan ukuran perusahaan terhadap kinerja perusahaan (studi empiris pada perusahaan manufaktur yang terdaftar di bursa efek Indonesia periode 2013-2017) (Thesis). Retrieved from https://repository.mercubuana.ac.id/48913/
62. Nuriwan (2018). Pengaruh kinerja keuangan terhadap nilai perusahaan yang dimoderasi oleh corporate social responsibility (CSR) dan good corporate governance (GCG). Jurnal Riset Akuntansi Dan Keuangan, 6(1), 11-24. Retrieved from https://ejournal.upi.edu/index.php/JRAK/article/view/10225
63. Nurminda, A., Deannes, I., & Annisa, N. (2017, April). Pengaruh profitabilitas, leverage dan ukuran perusahaan terhadap nilai perusahaan. E-Proceesing of Management, 4(1).
64. Odalo, S. K. (2016). Relatirelating sales growth and financial performance in agricultural firms listed in the Nairobi securities exchange in Kenya. https://doi.org/10.5539/ijef.v8n9p34
65. Pantow, M. S. R. (2015). Analisa pertumbuhan penjualan, ukuran perusahaan, return on asset, dan struktur modal terhadap nilai perusahaan yang tercatat di INDEX LQ 45. Jurnal Emba: Jurnal Riset Ekonomi, Manajemen, Bisnis Dan Akuntansi, 3(1). Retrieved from: https://ejournal.unsrat.ac.id/ index.php/emba/article/view/7801
66. Prasetyo, A. H. (2011). Evaluasi Perusahaan. Jakarta: PPM. 67. Purwohandoko. (2017). The influence of firm’s size, growth, and profitability on firm value with capital structure
as the mediator: A study on the agricultural firms listed in the Indonesian stock exchange. Retrieved from http://www.ccsenet.org/journal/ index.php/ijef/article/download/69347/37713
68. Rinny, M. (2016). Pengaruh modal kerja, ukuran perusahaan, pertumbuhan penjualan dan likuiditas terhadap profitabilitas pada perusahaa manufaktur sektor industri barang konsumsi yang terdaftar di bursa efek
Indonesia (BEI) periode tahun 2010-2014. Jurnal Akuntansi Dan Keuangan Fe Universitas Budi Luhur, 5(2). Retrieved from: https://journal.budiluhur.ac.id/index.php/akeu/article/view/405
69. Ruslan, S. M. (2018). Firm performance: Case of Malaysian logistics companies. Academy of Strategic Management Journal, 17(4).
70. Salim, M., & Yadav, R. (2012). Capital structure and firm performance evidence from Malaysian listed companies. Procedia - Social and Behavioral Sciences, 65, 156-166. https://doi.org/10.1016/ j.sbspro.2012.11.105
71. Sam, M. F. M., & Hoshino, Y. (2013). Sales growth, profitability and performance, empirical study of Japanese ICT industries with three Asian countries. Interdisciplinary Journal of Contemporary Research in Business, 4(6).
72. Sartono, A. R. (2010). Manajemen Keuangan teori dan Aplikasi. Edisi Keempat. Yogyakarta: BPFE. 73. Sofyaningsih, S., & Hardiningsih, P. (2011). Pengaruh struktur kepemilikan, kebijakan dividen, kebijakan utang,
ukuran perusahaan, dan profitabilitas terhadap nilai perusahaan. Jurnal Dinamika Keuangan dan Perbankan, 3(5), 68-87. Retrieved from: https://www.unisbank.ac.id/ojs/index.php/fe1/article/view/195
74. Sucuahi, W., & Cambarihan, J. M. (2016). Influence of profitability to the firm value of diversified companies in the Philippines. Sciedu Press, 5(2). https://doi.org/10.5430/afr.v5n2p149
75. Sudana, M. (2011). Manajemen keuangan perusahaan: Teori dan praktik. Jakarta: Penerbit Erlangga. 76. Sudiyatno, B., & Puspitasari, E. (2010). Pengaruh Kebijakan Perusahaan Terhadap Nilai Perusahaan Dengan
Kinerja Perusahaan Sebagai Variabel Intervening. Dinamika Keuangan dan Perbankan, 2(1), 1-22. Retrived from https://www.unisbank.ac.id/ojs/index.php/fe1/article/view/179
77. Suffah, R., & Riduwan, A. (2016). Pengaruh profitabilitas, leverage, ukuran perusahaan dan kebijakan deviden pada nilai perusahaan. Jurnal ilmu dan riset akuntansi, 5(2), 1-17.
78. Sugiarto. (2013). Struktur modal, struktur kepemilikanperusahaan, permasalahan keagenan dan informasi asimetri. Yogyakarta: GrahaIlmu.
79. Sugiyono. (2016). Metode penelitian bisnis. Bandung: Alfabeta. 80. Sujianto (2001). Analisis variabel-variabel yang mempengaruhi struktur Keuangan Pada Perusahaan Manufaktur
Yang go public di Bursa Efek Jakarta. Jurnal Ekonomi dan Manajemen, 2(2). 81. Sukirni, D. (2012). Kepemilikan manajerial, kepemilikan institusional, kebijakan deviden dan kebijakan hutang
analisis terhadap nilai perusahaan. Accounting Analysis Journal, 1(2), 1-12. Retrieved from https://journal.unnes.ac.id/sju/ index.php/aaj/article/view/703
82. Taipi, E. (2017). Capital expenditure and firm performance evidence from Albanian construction sector. European Scientific Journal, 13(28). https://doi.org/10.19044/esj.2017.v13n28p231
83. Theacini, D. A. M., & Wisadha, I. G. S. (2014). Pengaruh good corporate governance, kualitas laba dan ukuran perusahaan pada kinerja perusahaan. E-Jurnal Akuntansi, 7(3), 733-746.
84. Torang, S. (2012). Metode riset struktur dan perilaku organisasi. Bandung: Alfabeta. 85. Triyono, Raharjo, K., & Arifati, R. (2015). Pengaruh kebijakan dividen, struktur kepemilikian, kebijakan hutang,
profitabilitas dan ukuran perusahaan terhadap nilai perusahaan pada perusahaan manufaktur di bursa efek Indonesia. Jurnal Ilmiah Mahasiswa S1 Akuntansi Universitas Pandanaran, 1(1). Retrieved from: https://jurnal.unpand.ac.id/ index.php/AKS/ article/view/328
86. Tui, S. (2017). Determinants of profitability and firm value: evidence from Indonesian banks. IRA-International Journal of Management & Social Sciences, 7(1), 84-95. https://doi.org/10.21013/ jmss.v7.n1.p10
87. Wachanga, M. R. (2014). The effect of capital expenditure on financial performance of firms listed at the Nairobi securities exchange. Retrieved from https://pdfs.semanticscholar.org/c00b/ddc42abaca6997fa 5b871053 f2684601a267.pdf
88. Wahyuni, T. (2013). Faktor-faktor yang mempengaruhi nilai perusahaan di sector property, real estate & building construction yang terdaftar di BEI periode 2008-2012. Jurnal Ilmiah Mahasiswa Universitas Surabaya, 2(1), 1-18. Retrieved from http://journal.ubaya.ac.id/index.php/jimus/article/view/380
89. Wijayanti, P. (2013). Pengaruh intellectual capital terhadap harga saham melalui kinerja keuangan pada perusahaan perbankan yang terdaftar di bursa efek Indonesia pada tahun 2009-2011. Jurnal Ekonomi Universitas Brawijaya, 1(2). Retrieved from https://jimfeb.ub.ac.id/index.php/jimfeb/article/view/323
90. Winarto, J. (2015). The determinants of manufacturer firm value in Indonesia stock exchange. International Journal of Information, Business and Management, 7(4), 323–349. Retrieved from https://ijibm.elitehall.com/ IJIBM_Vol7 No4_Nov2015.pdf