236 ISSN 1392–1320 MATERIALS SCIENCE (MEDŽIAGOTYRA). Vol. 16, No. 3. 2010 The Effect of Coal Ash on Synthesis and Properties of Tricalcium Silicate Rimvydas KAMINSKAS ∗ , Raimonda KUBILIŪTĖ Department of Silicate Technology, Kaunas University of Technology, Radvilenu str. 19, LT-50254 Kaunas, Lithuania Received 22 February 2010; accepted 11 April 2010 The aim of the research is to investigate the effect of coal ash on tricalcium silicate synthesis and properties of synthesis products. Tricalcium silicate was obtained as a result of the synthesis of limestone (CaCO 3 ) and amorphous SiO 2 ⋅nH 2 O stoichiometric mixture. The synthesis was carried out by burning the mixture treble at 1500 °C for 1, 3 and 5 h. In order to determine the influence of the coal ash on the synthesis of tricalcium silicate 5, 10 and 15 wt. % of coal ash were added to the prepared C 3 S mixture. The effect of coal ash was determined on composition of synthesis products and its properties during hydration of samples. It was found that coal ash additive significantly changed the composition of the products of tricalcium silicate synthesis that is essentially different from the theoretically calculated composition. It was observed that in samples with 5 % of coal ash additive formed amount of dicalcium silicate was larger three times than it had been calculated by Bogue method. However, the compressive strength of these samples (42.35 MPa) was higher to compare with alite samples and only slightly lower than samples of pure tricalcium silicate. Keywords: tricalcium silicate, alite, belite, coal ash, compressive strength, calcium silicate hydrate, portlandite. 1. INTRODUCTION ∗ Depending on the raw materials and process, a cement plant consumes fuel amounting to about 3200 MJ/t to 5500 MJ/t clinker. Historically, the primary fuel used is coal. A wide range of other primary fuels are also used, including petroleum coke, natural gas and oil. The main constituents of fuel ash are silica and alumina compounds which combine with the raw materials to become part of the clinker. Like other natural products fuel ashes contain a wide range of trace elements which are also incorporated in the cement clinker [1]. When coal is used as the fuel for clinker-making, its ash content, composition and fineness affect burnability. Generally the composition of coal ash varies within the limits (wt. %): SiO 2 35 % – 60 %, Al 2 O 3 15 % – 35 %, Fe 2 O 3 5 % – 20 %, CaO 0 % – 10 % and MgO, SO 3 , and alkalies are often present in the ash in small amounts. In general, the ash composition shows a very high S/C ratio and moderately high A/F ratio. On the whole, the effects of ash absorption on burning are as follows [2]: 1. Lime Saturation Factor (LSF) decreases and silica module (SM) increases; 2. The composition of silicate phases changes; 3. Liquid content increases with reduced viscosity and increased ionic mobility; 4. Molten ash penetrates rapidly from the outer surface into cracks and openings in the clinker minerals by permitting the ash to react in pockets, resulting in C 2 S-rich areas. On the other hand, Portland cement is a complex conglomerate therefore the individual minerals of the cement are tested. Tricalcium silicate is the main mineral of Portland cement clinker, and it determines the maximum strength of the cement stone [3]. The tricalcium silicate mineral is obtained by solid-phase reaction method in high ∗ Corresponding author. Tel.: +370-37-300161; fax: +370-37-300150. E-mail address: [email protected](R. Kaminskas) temperature [4 – 6]. The amount of minor and trace elements that can be incorporated into the crystal structure of C 3 S and its influence on the crystal structure has been analysed by several authors [7 – 10]. No references data found on the influence of the coal ash upon the synthesis of tricalcium silicate and its products properties. The objective of this research was to analyse the influence of the coal ash additive on C 3 S synthesis and to determine the properties of hydrated synthesis products. 2. MATERIALS AND METHODOLOGY Chemical analysis and characteristics of the raw materials are shown in Table 1. Table 1. Chemical composition and properties of the raw materials Materials Parameter SiO 2 ·nH 2 O CaCO 3 γ-Al 2 O 3 MgO Purity, % > 99 > 99 > 99 > 99 Loss on ignition, % 24.6 43.56 0.59 0.41 Specific surface area, m 2 /kg 353 1199 174 1492 Tricalcium silicate was obtained as a result of the syn- thesis of limestone (CaCO 3 ) and amorphous SiO 2 ⋅nH 2 O stoichiometric mixture in a Nabertherm HTC 03/16 furnace. Raw materials were grinded and homogenized in a laboratory ball mill for 3 hours. The specific surface area of raw mix was 820 m 2 /kg. 45 g of powder mixture was wetted with water (10 % of the dry weight) and at 295 MPa compressed into tablet. The synthesis was carried out by burning the above mentioned mixture treble at 1500 °C for 1, 3 and 5 h. Prior to the second burning, the material was crushed, ground in a laboratory mill and again compressed into tablet. In order to compare synthesis data, alite had been synthesized using the formula
Transcript
236
ISSN 1392–1320 MATERIALS SCIENCE (MEDŽIAGOTYRA). Vol. 16, No. 3. 2010 The Effect of Coal Ash on Synthesis and Properties of Tricalcium Silicate Rimvydas KAMINSKAS ∗, Raimonda KUBILIŪTĖ
Department of Silicate Technology, Kaunas University of Technology, Radvilenu str. 19, LT-50254 Kaunas, Lithuania
Received 22 February 2010; accepted 11 April 2010
The aim of the research is to investigate the effect of coal ash on tricalcium silicate synthesis and properties of synthesis products. Tricalcium silicate was obtained as a result of the synthesis of limestone (CaCO3) and amorphous SiO2⋅nH2O stoichiometric mixture. The synthesis was carried out by burning the mixture treble at 1500 °C for 1, 3 and 5 h. In order to determine the influence of the coal ash on the synthesis of tricalcium silicate 5, 10 and 15 wt. % of coal ash were added to the prepared C3S mixture. The effect of coal ash was determined on composition of synthesis products and its properties during hydration of samples. It was found that coal ash additive significantly changed the composition of the products of tricalcium silicate synthesis that is essentially different from the theoretically calculated composition. It was observed that in samples with 5 % of coal ash additive formed amount of dicalcium silicate was larger three times than it had been calculated by Bogue method. However, the compressive strength of these samples (42.35 MPa) was higher to compare with alite samples and only slightly lower than samples of pure tricalcium silicate. Keywords: tricalcium silicate, alite, belite, coal ash, compressive strength, calcium silicate hydrate, portlandite.
1. INTRODUCTION∗
Depending on the raw materials and process, a cement plant consumes fuel amounting to about 3200 MJ/t to 5500 MJ/t clinker. Historically, the primary fuel used is coal. A wide range of other primary fuels are also used, including petroleum coke, natural gas and oil. The main constituents of fuel ash are silica and alumina compounds which combine with the raw materials to become part of the clinker. Like other natural products fuel ashes contain a wide range of trace elements which are also incorporated in the cement clinker [1].
When coal is used as the fuel for clinker-making, its ash content, composition and fineness affect burnability. Generally the composition of coal ash varies within the limits (wt. %): SiO2 35 % – 60 %, Al2O3 15 % – 35 %, Fe2O3 5 % – 20 %, CaO 0 % – 10 % and MgO, SO3, and alkalies are often present in the ash in small amounts. In general, the ash composition shows a very high S/C ratio and moderately high A/F ratio.
On the whole, the effects of ash absorption on burning are as follows [2]:
2. The composition of silicate phases changes; 3. Liquid content increases with reduced viscosity
and increased ionic mobility; 4. Molten ash penetrates rapidly from the outer
surface into cracks and openings in the clinker minerals by permitting the ash to react in pockets, resulting in C2S-rich areas.
On the other hand, Portland cement is a complex conglomerate therefore the individual minerals of the cement are tested. Tricalcium silicate is the main mineral of Portland cement clinker, and it determines the maximum strength of the cement stone [3]. The tricalcium silicate mineral is obtained by solid-phase reaction method in high
temperature [4 – 6]. The amount of minor and trace elements that can be incorporated into the crystal structure of C3S and its influence on the crystal structure has been analysed by several authors [7 – 10]. No references data found on the influence of the coal ash upon the synthesis of tricalcium silicate and its products properties. The objective of this research was to analyse the influence of the coal ash additive on C3S synthesis and to determine the properties of hydrated synthesis products.
2. MATERIALS AND METHODOLOGY Chemical analysis and characteristics of the raw
materials are shown in Table 1.
Table 1. Chemical composition and properties of the raw materials
Materials Parameter
SiO2·nH2O CaCO3 γ-Al2O3 MgO
Purity, % > 99 > 99 > 99 > 99 Loss on ignition, % 24.6 43.56 0.59 0.41
Specific surface area, m2/kg 353 1199 174 1492
Tricalcium silicate was obtained as a result of the syn-thesis of limestone (CaCO3) and amorphous SiO2⋅nH2O stoichiometric mixture in a Nabertherm HTC 03/16 furnace. Raw materials were grinded and homogenized in a laboratory ball mill for 3 hours. The specific surface area of raw mix was 820 m2/kg. 45 g of powder mixture was wetted with water (10 % of the dry weight) and at 295 MPa compressed into tablet. The synthesis was carried out by burning the above mentioned mixture treble at 1500 °C for 1, 3 and 5 h. Prior to the second burning, the material was crushed, ground in a laboratory mill and again compressed into tablet. In order to compare synthesis data, alite had been synthesized using the formula
237
proposed by Jeffrey [11]. The raw materials were mixed using CaCO3 (71.9 % CaO), amorphous SiO2 (25.7 %), MgO (1.8 %) and Al2O3 (0.6 %). Specific surface area was 1200 m2/kg (by Blaine). The synthesis conditions were the same as tricalcium silicate synthesis.
Coal from Russia was used as raw material. Coal properties are as following: caloric content – 7500 kcal/kg, moisture content – 5 wt.%, sulphur content – 0.4 wt. %, ash-content 11 wt. %. In order to obtain the ash, the coal was ground (S = 550 m2/kg) and burnt in metal container with a gas burner. The composition of coal ash was (wt. %): SiO2 – 57.2, Al2O3 – 24.73, Fe2O3 – 3.79, CaO – 3.69, other – 10.59 %, specific surface area – 837 m2/kg. Figure 1 presents XRD data of coal ash.
5 10 15 20 25 30 35 40 45 50 55 60 65 70
2θ (o)
Q
HQ Q
H
Q S
K
Q
Q
Q HQ
QH QQ
H
FS
F
S FSF
H
Fig. 1. XRD patterns of coal ash. Indexes: Q – quartz, H – hema-
tite, K – calcium sulphate, S – muscovite, F – potassium iron silicate
In order to determine the influence of the coal ash on the synthesis of tricalcium silicate 5, 10 and 15 wt. % of coal ash were added to the prepared C3S mixture. Specific surface area of mixes was (860 – 910) m2/kg. The synthesis conditions were the same as tricalcium silicate synthesis.
The content of free calcium oxide in synthesis products was determined by Franke's method.
Samples for the compressive strength analysis (20×20×20 mm) were prepared without usually used sand. The water to C3S ratio was 0.5. During the first day, the samples were kept in moulds at 20 °C ±1 °C and 100 % air humidity. After 24 hours of formation, the samples were transferred into distilled water and stored there for 27 days at 20 °C ±1 °C. Hydration of the samples was stopped using acetone.
Scanning electron microscopy (SEM) (FEI Quanta 200 FEG) was performed using an accelerating voltage of 15 kV and a working distance of 10 mm for SEM observation.
The X-ray powder diffraction data (XRD) were colleted with DRON-6 powder X-ray diffractometer with Bragg-Brentano geometry using Ni filtered CuKα radiation,
operating voltage 30 kV and emission current – 24 mA. The step-scan covered the angular range 5°– 70° (2θ) in steps of 2θ = 0.02°. Quantitative determination of the mineralogical composition of samples was performed by means of the Rietveld method (software AutoQuan) using XRD data.
FT-IR spectra have been measured by the spectrometer Perkin Elmer FT-IR system Spectrum X. Samples were prepared by mixing 1 mg of the sample in 200 mg of KBr. The spectral analysis was performed in the range 4000 cm–1
÷ 400 cm–1 with spectral resolution of 1 cm–1. Simultaneous thermal analysis (STA: differential
scanning calorimetry – DSC and thermogravimetry – TG) was carried out on a Netzsch instrument STA 409 PC Luxx with ceramic sample handlers and crucibles of Pt-Rh. Heating rate of 15 °C/min, the temperature ranged from 30 °C up to 1000 °C under the ambient atmosphere.
3. RESULTS AND DISCUSSIONS In first stage of this work the free lime quantity in
burned synthesis product was estimated (content of free CaO should not exceed 1 %). The test results are summarized in Table 2.
It was observed that tricalcium silicate had the largest
amount of free lime after the third step (1+3+5 h.) of the synthesis. There was much less of free CaO remaining in alite samples. Moreover the coal ash additive substantially changed the amounts of free CaO in the synthesis products. In the samples with 10 % of coal ash already after the second step (1+3 h.) of synthesis free CaO was not identified (0.04 %) in products. In case of 15 % of additive, all CaO had reacted during the first hour of synthesis.
The patterns of XRD analysis of the synthesis products are shown in Figure 2.
The peaks of pure C3S (d-spacing: 0.304, 0.278, 0.260, 0.218 nm) and a very low intensity basic reflection typical for CaO (d-spacing: 0.278, 0.240, 0.169, 0.145 nm) and dicalcium silicate (d-spacing: 0.275, 0.272, 0.240, 0.191 nm) were identified in the sample of tricalcium silicate (Fig. 2, curve 1). In alite sample (Fig. 2, curve 2) the intense peaks characteristic of alite (tricalcium silicate) are identified. Very low intensity peaks typical of calcium oxide and periclase (d-spacing: 0.211 nm) were observed. Meanwhile the X-ray patterns of the synthesis products with the coal ash additive mainly differ from the pure materials. The diffraction peaks characteristic for both tricalcium silicate (d-spacing: 0.304, 0.278, 0.260,
238
0.218 nm) and dicalcium silicate (d-spacing: 0.275, 0.272, 0.240, 0.191 nm) were found in the samples with 5 % and 10 % of coal ash additives (Fig. 2, curve 3, 4). However, the intensity of C3S basic reflection decreased with increasing ash amounts, while the intensity of C2S peaks increased. Upon adding 15 % of coal ash, in the synthesis products only dicalcium silicate was identified.
The XRD results were confirmed by FT-IR spectroscopy data (Fig. 3).
The absorption bands in 925 – 930, 888, 524 and 462 cm–1 frequency range, which are characteristic of tricalcium silicate, were found in FT-IR spectrum of synthesized tricalcium silicate (Fig. 3, curve 1) and alite (Fig. 3, curve 2). Meanwhile in the samples with 5 % of coal ash additive (Fig. 3, curve 3) the absorption bands of low intensity were found in the frequency range 925, 888, 462 cm–1, which are typical of tricalcium silicate and intense absorption band in the 522 cm–1 frequency range, which is characteristic for dicalcium silicate. The FT-IR spectrum of the sample with 10 % of coal ash additive (Fig. 3, curve 4) was similar however the intensity of C3S bands decreases as C2S increases. Moreover, in the sample with 15 % of coal ash additive (Fig. 3, curve 5) only the absorption bands in the 996, 877, 845, 522 cm–1 frequency range characteristic for dicalcium silicate were found.
In order to compare theoretical composition of C3S and C2S with obtained synthesis products the Rietveld analysis was carried out.
40080012001600200024002800320036004000
T (%
)
wavenumber (cm-1)
1
2
3
4
524
888
930
462
454
522
522
522
888
925
845
925
888
845
877
996
5
845
454
925
462
888
524
3644
1482
1412
Fig. 3. The FT – IR spectra of synthesis products: 1 – C3S, 2 – alite, 3 – C3S + 5 % coal ash, 4 – C3S + 10 % coal ash, 5 – C3S + 15 % coal ash
The quantification accuracy of cement minerals has been reported in [12]. A maximum difference from the true value of the quantified amount of C2S was 2.2 mass % and that of C3S was 1.2 mass %. XRD/Rietveld analysis data is provided in Figure 4.
0102030405060708090
100
OtherCaO
C2SC3SQ
uant
ity, %
C3S Alite C3S+5% add.
C3S+10% add.
C3S+15% add.
Fig. 4. Rietveld analysis of synthesis products
The quantitative composition of both C3S and C2S were calculated by Bogue method [3]: C3S = 4.071CaO–7.602SiO2–6.719Al2O3–1.439Fe2O3; (1) C2S = –3.071CaO+8.602SiO2+5.068Al2O3+1.079Fe2O3. (2)
239
The oxide composition of the samples with coal ash additive is presented in Table 3. Table 3. Chemical composition of samples with coal ash additive
Amount of coal ash Compounds
5 % 10 % 15 %
SiO2 26.533 27.927 29.2 Al2O3 1.177 2.248 3.225
Fe2O3 0.18 0.335 0.494
CaO 71.604 68.517 65.698
Table 4 shows the comparison between theoretical calculations and the data obtained from XRD/Rietveld quantitative analysis.
Table 4. Comparison potential composition of C3S and C2S minerals with synthesis products
It was observed that the composition of the synthesis products fundamentally differs from that calculated theoretically. The results are particularly different in the samples with 5 % of coal ash additive because formed amount of dicalcium silicate was larger three times than it had been calculated by Bogue method.
The obtained data allow us to state that by using the ground coal as fuel in the cement manufacturing process, only the theoretical evaluation of oxide amounts coming from the coal ash is insufficient.
According to the data obtained from the Rietveld analysis in alite sample 1.5 % of free MgO remained. Thus, keep in mind the potential quantification accuracy of this method, only a very small part of magnesium oxide inserts in to alite composition.
SEM analysis of the synthesis products was carried out and the micrographs are shown in Figure 5.
The crystals of synthesized tricalcium silicate (Fig. 5, a)) were melted and merged together into a mas-sive conglomerate (average diameter >20 µm). The SEM micrograph of alite (Fig. 5, b)) shows more discrete and sharp-edged crystals merged into smaller conglomerates (average diameter ~10 µm). Irregular shape crystals are seen in SEM micrograph of the sample with 5 % of coal ash additive (Fig. 5, c)). Their size is similar to tricalcium silicate crystals (average diameter is about 20 µm). Upon adding a larger amount of the coal ash in the system, the finer crystals were formed. In the sample with 15 % of coal ash (Fig. 5, e)) were obtained crystals with average diameter of 2 µm – 5 µm.
In order to evaluate the quality of synthesis products, hydration tests the samples were carried out. Compressive strength of the samples after 28 days of hydration is shown in Figure 6.
Fig. 5. Micrographs of synthesis products: a – tricalcium silicate;
b – alite; c – C3S + 5 % coal ash; d – C3S + 10 % coal ash; e – C3S + 15 % coal ash
0
10
20
30
40
50
MPa
C3S Alite C3S+5% add.
C3S+10% add.
C3S+15% add.
Fig. 6. The compressive strength of samples after 28 days of hydration
As seen in Fig. 6, the highest compressive strength (45.74 MPa) after 28 days of hydration showed the sample of tricalcium silicate. The lower compressive strength of alite samples (39.45 MPa) might be influenced by periclase hydration process which is proceed later, and increasing stresses in the sample reduces the strength properties. Meanwhile, the compressive strength of samples with coal ash depends on the amount of additive. The compressive strength of samples with 5 % of coal ash additive (42.35 MPa) is even higher than that of alite samples and
a b
c d
e
240
only slightly lower than of tricalcium silicate samples. Thus, 5 % of coal ash additive almost does not reduce the compressive strength of the samples although only 55 % of tricalcium silicate was formed during the synthesis process. The compressive strength of samples with 10 % of coal ash additive was considerably (20 %) lower than that of pure C3S samples. It should be noted that samples with 15 % of coal ash additive show a very low compressive strength (2.15 MPa) after 28 days of hydration.
In order to explain the strength properties of samples, XRD and thermal analysis of the hydrated samples was carried out. The XRD data is provided in Figure 7.
5 10 15 20 25 30 35 40 45 50 55 60 65 70
1
5
4
3
2P
TH
TTT TT T
P
PP P P
P
P
P
P
P
PP
P
P
P
P
TMP T
TT
P
T
T
TT
HT
T
P
P PDP PP
D
TDP
TTH TT
DD
T
D
DT
D
P
P
D
P
PP
P PPP
P
D
D
D
D
D
D
D DDD
D
D
HD
T
T
DH
P DD PHD DD DD
D
D DDD D D
H
DT
T
DT
P
D
2θ (o)
H
T
Fig. 7. XRD patterns of samples hydrated for 28 days: 1 – trical-
cium silicate, 2 – alite, 3 – sample with 5 % coal ash, 4 – sample with 10 % coal ash, 5 – sample with 15 % coal ash. Indexes: P – portlandite, T – tricalcium silicate, D – dicalcium silicate, H – calcium silicate hydrate, M – magnesium oxide
After 28 days of hydration in all samples portlandite (d-spacing: 0.491, 0.262, 0.192, 0.179 nm) was identified. However, in the sample with 15 % of coal ash (Fig. 7, curve 5) only portlandite traces are observed. In addition, the diffraction peaks characteristic for calcium silicate hydrates (d-spacing: 0.467, 0.297, 0.287, 0.184 nm) were identified in the curves. The unhydrated primary synthesis products such as of C3S (d-spacing: 0.304, 0.278, 0.260, 0.218 nm), MgO (d-spacing: 0.211 nm) and C2S (d-spacing: 0.275, 0.272, 0.240, 0.191 nm) also were seen in all samples. The most intensive peaks of unhydrated dicalcium silicate were observed in the sample with 15 % of coal ash additive (Fig. 7, curve 5). Moreover, the peaks of unhydrated compounds in alite sample (Fig. 7, curve 2) were found to be more intensive than those of tricalcium
silicate and those of the sample with 5 % of coal ash additive (Fig. 7, curves 1, 3 respectively).
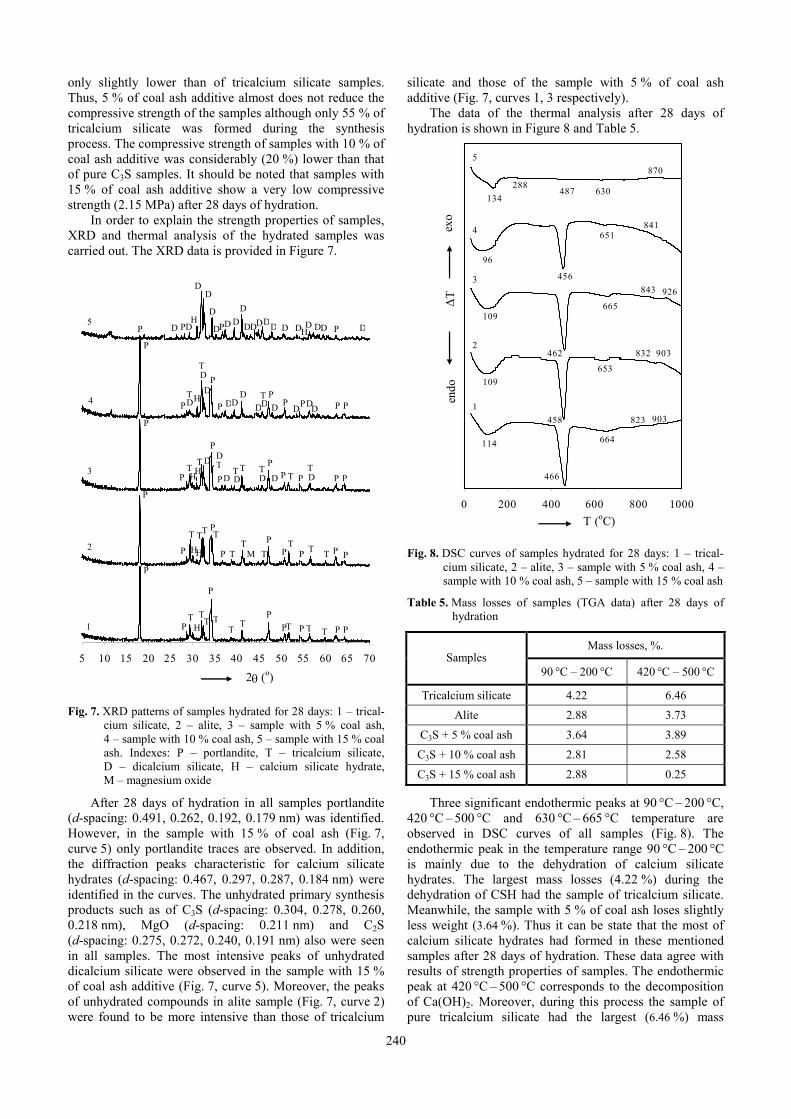
The data of the thermal analysis after 28 days of hydration is shown in Figure 8 and Table 5.
0 200 400 600 800 1000
exo
∆T
endo
T (oC)
1
2
3
4
5
114
466
664
823 903
109
458
653
832 903
109
462
665
843 926
96
456
651841
134288
870
630487
Fig. 8. DSC curves of samples hydrated for 28 days: 1 – trical-
cium silicate, 2 – alite, 3 – sample with 5 % coal ash, 4 – sample with 10 % coal ash, 5 – sample with 15 % coal ash
Table 5. Mass losses of samples (TGA data) after 28 days of hydration
Mass losses, %. Samples
90 °C – 200 °C 420 °C – 500 °C
Tricalcium silicate 4.22 6.46 Alite 2.88 3.73
C3S + 5 % coal ash 3.64 3.89
C3S + 10 % coal ash 2.81 2.58
C3S + 15 % coal ash 2.88 0.25
Three significant endothermic peaks at 90 °C – 200 °C, 420 °C – 500 °C and 630 °C – 665 °C temperature are observed in DSC curves of all samples (Fig. 8). The endothermic peak in the temperature range 90 °C – 200 °C is mainly due to the dehydration of calcium silicate hydrates. The largest mass losses (4.22 %) during the dehydration of CSH had the sample of tricalcium silicate. Meanwhile, the sample with 5 % of coal ash loses slightly less weight (3.64 %). Thus it can be state that the most of calcium silicate hydrates had formed in these mentioned samples after 28 days of hydration. These data agree with results of strength properties of samples. The endothermic peak at 420 °C – 500 °C corresponds to the decomposition of Ca(OH)2. Moreover, during this process the sample of pure tricalcium silicate had the largest (6.46 %) mass
241
losses. Meanwhile, in the sample with 15 % of coal ash additive a very small quantity of portlandite was formed, because this sample lost only 0.25 wt. %. This phenome-non explains a very low compressive strength of this sample (Fig. 6). Beside a low intensity endothermic peak at 288 °C indicate the calcium aluminate hydrate (C2AH8) being formed in this sample (Fig. 8, curve 5). In addition, a low intensity endothermic effect at 630 °C – 665 °C indicates the decarbonisation of CaCO3. The exothermic peaks at 832 °C – 870 °C and 903 °C – 926 °C in all DSC curves are associated with formation of wollastonite.
4. CONCLUSIONS 1. The additive of coal ash considerably changes the
composition of the synthesis products of tricalcium silicate. Upon adding 5 % of coal ash, only 55 % C3S were formed. Meanwhile, a large amount of this additive has negative influence on the synthesis of C3S because by using 15 % of coal ash only 1.7 % C3S were indicated in the product.
2. The composition of the synthesis products fundamentally differs from that calculated theoretically. In the samples with 5 % of coal ash formed amount of dicalcium silicate was larger three times than it had been calculated by Bogue method.
3. It was determined that after 28 days of hydration sample of tricalcium silicate has the highest compressive strength (45.74 MPa), whereas the compressive strength of samples with coal ash depends on the amount of additive. The compressive strength of the samples with 5 % additive is only slightly lower than of tricalcium silicate samples as the samples with 10 % of coal ash additive was already considerably lower (20 %). Samples with 15 % coal ash additive show a very low compressive strength (2.15 MPa) after 28 days of hydration.
4. The most amounts of calcium silicate hydrates and portlandite were formed in both C3S and with 5 % of coal ash additive samples which provide the large strength of these samples. However the sample with 15 % of coal ash additive has a low compressive strength because during hydration a very small quantity of portlandite was formed.
REFERENCES
1. CEMBUREAU. Cement Alternative Fuels in Cement Manufacture.http://www.groundwork.org.za/Cement/Alternative_Fuels_in_Cement_Manufacture_CEMBUREAU_Brochure_EN.pdf
2. Ghosh, S. N. Cement and Concrete Science and Technology. ABI Books Private Limited, New Delhi 1991: p. 23.
3. Taylor, H. F. W. Cement Chemistry. Second Edition. Oxford, 1997.
4. Maki, I., Fukuda, K., Imura, T., Yoshida, H., Ito, S. Formation of Belite Clusters from Quartz Grains in Portland Cement Clinker Cement and Concrete Research 25 1995: pp. 835 – 840.
5. Long, S., Liu, C., Wu, Y. ESCA Study on the Early C3S Hydration in NaOH Solution and Pure Water Cement and Concrete Research 28 1998: pp. 245 – 249.
6. Chen, Y. Q. et al. Characterisation of Products of Tricalcium Silicate Hydration in the Presence of Heavy Metals Journal of Hazardous Materials 147 2007: pp. 817 – 825.
7. Liu, X. et al. Influence of MgO on the Formation of Ca3SiO5 and 3CaO·3Al2O3·CaSO4 Minerals in Alite-Sulphoaluminate Cement Cement and Concrete Research 32 2002: pp. 1125 – 1129.
8. Ghose, A., Barnes, P. Electron Microprobe Analysis of Portland Cement Clinkers Cement and Concrete Research 9 1979: pp. 747 – 755.
9. Stephan, D. et al. Influence of Cr, Ni and Zn on the Properties of Pure Clinker Phases: Part I. C3S Cement and Concrete Research 29 1999: pp. 545 – 552.
10. Maki, I., Kato, K. Phase Identification of Alite in Portland Cement Clinker Cement and Concrete Research 12 1982: pp. 93 – 100.
11. Jeffrey, J. W. The Crystal Structure of Tricalcium Silicate Acta Crystallographica 5 1952: pp. 26 – 35.
12. Hoshino, S., Yamada, K., Hirao, H. XRD/Rietveld Analysis of the Hydration and Strength Development of Slag Limestone Blended Cement Journal of Advanced Concrete Technology 4 2006: pp. 357 – 367.