KEYWORDS: Plant circuits, maceral fractiona- tion, coal quality, coal petrography, thermal rhe- ology, coke quality, coke strength after reaction (CSR). INTRODUCTION Coal preparation plants are designed to control clean coal quality to meet contract qual- ity specifications and normally focus on ash, sulphur, calorific value, size and moisture con- tents of the clean coal. The coking quality of clean metallurgical coal is evaluated, but gen- erally only limited attempts are made to influ- ence it by changing operating conditions in the plant. Plants size the feed coal into different frac- tions, which are processed in individual circuits before being combined into the final clean coal. In western Canada, the coarsest (+0.6mm) coal is cleaned in combinations of heavy media ves- sels, drums and cyclones, while the finer coal (- 0.6mm by 0.0mm) is cleaned using water-only- cyclones (WOC), spirals and/or froth flotation (FF) (Romaniuk, 1986). These processes are chosen to maximize the recovery of clean coal and for ease of control. Run-of-mine coal deliv- ered to a plant is more complex than a mixture of three uniform materials (coal, rock and water). The coal is composed of a mixture of macerals and the rock a mixture of minerals with different chemical compositions. The type of association of the minerals and macerals, and the ability of each to be liberated by crushing, influences the size fraction and therefore the circuit into which they are concentrated. It is possible to adjust coal recovery from individual circuits to decrease ash content, and improve maceral composition and/or ash chemistry in the clean coal product. Whether this is eco- nomic depends in part on the characteristics of the run-of-mine coal and on the washing cir- cuits available in the plant. BACKGROUND In the mid 1970s, the Canadian Carbonization Research Association (CCRA) undertook laboratory-scale coal washing (float/sink) tests of Canadian metallurgical coals to investigate changes in coal quality and petrographic and thermal rheological properties at varying ash concentrations for clean coal (Price and Gransden, 1987). It was found that as ash content decreased, the reactives content of the coal increased and thermal rheological properties improved. However, it has been know for some time that using laboratory scale results to predict the coking quality of western Canadian coals is difficult (Gransden et al., 1980). Four bulk samples of western Canadian coals were subsequently washed in a pilot plant and both the coal and coke quality determined for clean coals with varying ash contents (Gransden and Price, 1982). The results were similar to the earlier laboratory scale studies and there was a general improvement in coke quality. Generally finer sized coal produced from the pilot scale tests had higher reactives content and better thermal rheological proper- ties than coarser clean coal fractions, however, their relative influence on the coking quality of the coal was not investigated. Following these two programs, the CCRA initiated the a detailed investigation of the per- formance of several coal preparation plants belonging to member companies. The objectives of the program were: s to determine if it is technically possible to improve the coking characteristics of the over- all product coals; s to determine if general trends occurred that would assist coal preparation engineers design or modify plant methods of operations to improve the clean coal coking characteristics. This paper presents and discusses the results Geological Fieldwork 1998, Paper 1999-1 247 THE EFFECT OF COAL PREPARATION ON THE QUALITY OF CLEAN COAL AND COKE By Barry Ryan (B.C. Geological Survey Branch), Ross Leeder (Industrial Leader - Canadian Carbonization Research Association and Teck) and John T. Price and John F. Gransden (CETC, CANMET Energy Technology Centre)
Coal preparation plants are designed tocontrol clean coal quality to meet contract qual-ity specifications and normally focus on ash,sulphur, calorific value, size and moisture con-tents of the clean coal. The coking quality ofclean metallurgical coal is evaluated, but gen-erally only limited attempts are made to influ-ence it by changing operating conditions in theplant.
Plants size the feed coal into different frac-tions, which are processed in individual circuitsbefore being combined into the final clean coal.In western Canada, the coarsest (+0.6mm) coalis cleaned in combinations of heavy media ves-sels, drums and cyclones, while the finer coal (-0.6mm by 0.0mm) is cleaned using water-only-cyclones (WOC), spirals and/or froth flotation(FF) (Romaniuk, 1986). These processes arechosen to maximize the recovery of clean coaland for ease of control. Run-of-mine coal deliv-ered to a plant is more complex than a mixtureof three uniform materials (coal, rock andwater). The coal is composed of a mixture ofmacerals and the rock a mixture of mineralswith different chemical compositions. The typeof association of the minerals and macerals, andthe ability of each to be liberated by crushing,influences the size fraction and therefore thecircuit into which they are concentrated. It ispossible to adjust coal recovery from individualcircuits to decrease ash content, and improvemaceral composition and/or ash chemistry inthe clean coal product. Whether this is eco-nomic depends in part on the characteristics ofthe run-of-mine coal and on the washing cir-cuits available in the plant.
BACKGROUND
In the mid 1970�s, the CanadianCarbonization Research Association (CCRA)undertook laboratory-scale coal washing(float/sink) tests of Canadian metallurgicalcoals to investigate changes in coal quality andpetrographic and thermal rheological propertiesat varying ash concentrations for clean coal(Price and Gransden, 1987). It was found thatas ash content decreased, the reactives contentof the coal increased and thermal rheologicalproperties improved. However, it has beenknow for some time that using laboratory scaleresults to predict the coking quality of westernCanadian coals is difficult (Gransden et al.,1980). Four bulk samples of western Canadiancoals were subsequently washed in a pilot plantand both the coal and coke quality determinedfor clean coals with varying ash contents(Gransden and Price, 1982). The results weresimilar to the earlier laboratory scale studiesand there was a general improvement in cokequality. Generally finer sized coal producedfrom the pilot scale tests had higher reactivescontent and better thermal rheological proper-ties than coarser clean coal fractions, however,their relative influence on the coking quality ofthe coal was not investigated.
Following these two programs, the CCRAinitiated the a detailed investigation of the per-formance of several coal preparation plantsbelonging to member companies. The objectivesof the program were: s to determine if it is technically possible to
improve the coking characteristics of the over-all product coals;
s to determine if general trends occurred thatwould assist coal preparation engineers designor modify plant methods of operations toimprove the clean coal coking characteristics.
This paper presents and discusses the results
Geological Fieldwork 1998, Paper 1999-1 247
THE EFFECT OF COAL PREPARATION ON THE QUALITY OFCLEAN COAL AND COKE
By Barry Ryan (B.C. Geological Survey Branch), Ross Leeder (Industrial Leader -Canadian Carbonization Research Association and Teck) and John T. Price and John F.
Gransden (CETC, CANMET Energy Technology Centre)
ldegroot
1998
of the CCRA study.
VARIATIONS IN COAL QUALITY ANDASH CHEMISTRY IN PLANT CIRCUITS
Maceral trends in wash plants
If all circuits in a plant recover all the coal,then the product coal will have the maceral com-position of the run-of-mine coal but will beaccompanied by less ash. However, if there issome coal loss, then it is possible to influencethe maceral composition of the clean coal.Vitrinite is more friable than inert coal maceralsand concentrates in the finer sizes. Thereforefeed for coarse circuits is enriched in inert mac-erals compared to run-of-mine coal and feed tofine coal circuits is progressively enriched in vit-rinite. Coarse circuits are generally not good atretaining vitrinite in clean coal. It appears thatin these circuits some vitrinite is present in finevitrain bands associated with in-seam splits.There is therefore a tendency for it to be lost inthe rejects and the vitrinite content of the cleancoal is less than that of the feed coal.
Vitrinite is less dense than the inert macer-als, and once liberated in the feed coal, concen-trates in the clean coal from the finer circuits,which use density separation. Bustin (1982)found that the maceral composition of washedcoal varies based on the specific gravity (SG) ofthe split (Figure 1). The inert macerals tend toconcentrate in the intermediate SG splits and thevitrinite in the lower SG splits. In detail there isa weak tendency in plants for vitrinite to con-centrate in the clean 0.6 to 0.15 mm size frac-tion, and a stronger tendency for it to concen-trate in the clean minus 0.15 mm material com-pared to the amount in the feed coal to these cir-cuits (Table 1, Figure 2). In contrast the inertmacerals concentrate in the clean coal fromcoarse circuits. It is therefore possible to influ-ence the maceral composition of the clean coalby varying the cut points in the various circuits.
When documenting maceral trends, data canbe presented as macerals in the total sample,which can be misleading because of varying ashcontent, or as maceral content as a percentage ofthe coal only part of the sample (mineral matterfree basis). This second method is more repre-sentative of maceral changes in the various prod-
ucts. Also it is possible to track vitrinite as themain reactive maceral or to track vitrinite plusreactive semifusinite as the total reactives in thesample. The later method requires an assump-tion on how to divide the semifusinite into reac-tive and non-reactive components.
Controls on ash chemistry in wash plants
Coal wash plants cannot reduce the ash con-tent of the clean coal to zero, there is therefore,always the possibility of improving the ashchemistry of the clean coal. Ash chemistry has
248 British Columbia Geological Survey Branch
Figure 1. Variation of the reactives/inerts ratio withspecific gravity split for a number of Mist MountainFormation coals. Numbers refer to specific seams(data from Bustin, 1982).
0.0
0.2
0.4
0.6
0.8
1.0
1.2
1.4
1.0 1.1 1.2 1.3 1.4 1.5 1.6 1.7 1.8 1.9 2.0
Specific Gravity increment
Iner
ts/r
eact
ives
rat
io
5NS
5S
7S
7N
Figure 2. Variations in vitrinite content (total sample)in clean coal from the various circuits of the 5 plantsstudied, VsVDP=heavy medium vessels and drums,HMC=heavy medium cyclones, WOCSP=water onlycyclones and spirals, Tlt Fines=total fines, FF=frothfloatation.
30
40
50
60
70
80
90
100
Vsl
/DP
HM
C
WO
C/S
p*
Tlt
Fin
es FF
% V
itri
nite
P lant A Plant B Plant C
Plant D Plant E
always been an important parameter for thermalcoals but it is also becoming an important para-meter for metallurgical coals. This is becauseash chemistry influences coke reactivity and
coke strength at high temperatures. The cokestrength after reaction (CSR) test is used to eval-uate coke strength at high temperatures and isused to assess the coking quality of hard cokingcoals, with ranks in the range 1.0% to 1.7%Rmax. In fact as PCI replaces coke in the blastfurnace even more emphasis is likely to beplaced on CSR values. A number of authors(Goscinski et al, 1985, Price et al., 1988) haveillustrated that CSR is strongly influenced by ashchemistry measured as alkalinity, base/acid ratio(B/A) or the modified basicity index (MBI)(Table 2).
There are a number of empirical equations,many listed in Coin (1995), that use only coalquality parameters to predict CSR. Generallythe equations use rank, coal ash chemistry, rhe-ology, and petrography, in that rough order ofsignificance. It is important to recognize thatrheology and petrography are in fact not inde-pendent variables and that CSR has a non linearrelationship to rank, decreasing at high and lowranks and reaching a maximum value in therange Rmax%=1.35-1.43% (Coin, 1995). Thereappears to be an optimum amount of inerts, at agiven rank, for maximum CSR and this amountincreases as rank increases (Gill, 1982). Thismeans that any linear regression of CSR againstrheology, petrography and rank can only beeffective over a limited range. CSR probablyhas a better linear correlation to ash basicity thanany other factor, depending on how it is defined.Todoschuk et. al. (1998) uses coke basicity andother coke derived properties to predict CSRover a wide range of rank.
WOC =water only cyclones(1) data calculated from 0.6 by 0.0mm and 0.6 by 0.15mm materialtotal reactives =% of organic materialcoal rec= ratio coal recovered / coal in raw sample
Table 2. Abbreviations for plant data.
Gieseler Plastometer
startC° =temp of softening, fusC°=temp of fusion, max C°=temp of max fluidity, finalC°=temp at end of fluidity
solidC°=temp at solidification, maxC°= fluid temp range, ddpm= max fluidity
Dilatometer
sf TC°= temperature of start of fusion in a dilatometer, max C C° = temperature at maximum contraction,
max D C° = temperature at maximum dilatation, C=maximum contraction, D=maximum dilatation,
Ash Chemistry
B/A=base/acid ratio = (CaO+MgO+Fe2O3+Na2O+K2O)/(SiO2+Al2O3+TiO2), MBI=B/A x Ash/ (100-MV) x 100Alkalinity=base/acid ratio x Ash/100
Petrography
vit =vitrinite, ex=exinite, SF=semifusinite, Mic=micrinite, Fus=Fusinite, MM=Mineral Matter, TR=total reactives
Plant
cl=clean, hm=heavy medium, sb=sieve bend, sbo=sieve bend oversize, bp=bird product, woc=water only cyclone, m=mesh
CarbonizationH2O=moisture of charge, ASTM BD=bulk density of charge kg/m3, Max wl P kPa=max wall pressure, SI=Stability Index
There have been a number of studies inves-tigating the relationship of CSR to ash chem-istry. Some studies have attempted to differenti-ate alkalies in terms of their ability to effect CSRand to determine whether mineral form influ-ences the ability of an alkali element to effectCSR. Price et al., (1992) found that additions ofpyrite (FeS2), siderite (FeCO3) or calcite(CaCO3) to coal samples decreased CSR in pro-portion to the amount they increased MBI.Goscinski and Patalsky (1989) emphasize theimportance of Fe2O3 and CaO contents. Whenthese oxides are present in eutectic proportionsthe ash fusion temperature is lowered and thecatalytic effect of the ash on coke reactivity isenhanced.
The oxides CaO and Fe2O3 may be releasedby the dissociation of carbonates or pyrite in thecoke oven. If the carbonates are finely dispersedin coal macerals the resulting oxides will behighly reactive. A plot of the concentration ofFe2O3 versus CaO in the total samples for 3 ofthe suits of medium-volatile coals studied in thispaper (Figure 3) illustrates the devastatingeffects of iron and calcium on CSR and the ten-dency of CaO to be more harmful than Fe2O3 .Suite B contains increased concentrations ofCaO, probably occurring as calcite (CaCO3) oncleats in vitrinite. The Fe2O3 total sample con-centrations in coals A, B and C do not correlatewith sulphur (Table 3) and many of the samplesplot above the pyrite line (Figure 4) indicatingthat the iron is probably present as siderite not aspyrite. Microscope work has identified siderite(FeCO3) dispersed as oolites through the coal.Apparently the dispersion of calcite in vitrinite
has increased the reactivity of CaO over that ofFe2O3 ,which is not as finely dispersed in thecoal macerals.
It is possible using a CSR predictive equa-tion to illustrate the effects on CSR of additionsof small amounts of calcite or siderite. The equa-tion derived by Price et al. (1988) is a relativelyconsistent empirical approach to estimating CSR
250 British Columbia Geological Survey Branch
Figure 3. Fe2O3 total sample versus S% for plants A,B illustrating lack of relationship; plot indicates asiderite origin for most of the iron and an organic ori-gin for the sulphur. Samples containing only pyriteplot on pyrite line.
0
0.5
1
1.5
2
2.5
3
3.5
0 0.2 0.4 0.6 0.8 1
S% total sample
Fe2O
3to
tal
sam
ple
pyrite line
coal A raw
coal A clean
coal B clean
Figure 4. Fe2O3 and CaO data for plants A, B and Cillustrating relative effect of oxides on CSR. CSRvalues are divided as follows Squares<40,triangles40-50, diamonds 50-60, circles 60-70 solid cir-cles>70. Plant B ash contains calcite plant C ashcontains siderite.
0
0.1
0.2
0.3
0.4
0.5
0.6
0.7
0 0.2 0.4 0.6 0.8 1
CaO total sample
70
60
5040
Fe2O
3 t
otal
sam
ple
0.1
0.2
0.3
0.4
0.5
0.6
0.7
0.8
0.9
1
0.1 0.2 0.3 0.4 0.5 0.6 0.7 0.8 0.9
CaO total sample
Fe2O
3 t
otal
sam
ple
B
C
A
Table 3. Linear correlation matrix for clean coal data,Plant C, illustrating effect of Fe2O3 on base/acid ratio(B/A).
values, though it tends to predict on the high side(Coin, 1995). The equation emphasizes the sen-sitivity of CSR to changes in ash chemistry. Itcan be used to illustrate the effect of adding 1%calcite to a raw coal. If the original sample hasvalues of 10% ash, 50 ddpm fluidity, base/acidratio 0.07 and a rank of Rmax=1.3% then thecalculated CSR is 67. The CSR value drops to49 and the base/acid ratio changes to 0.13 afteraddition of 1 weight % calcite. The 1% additionof calcite added about 0.56% CaO to the samplebut all of this is concentrated into the 10% ashchanging the CaO % in ash from 1.4% to 6.6%.It is not uncommon to find 1% calcite in coaleither along cleat surfaces in vitrain bands or incells in semifusinite. The situation is even moreextreme if siderite (FeCO3) is added to the sam-ple, because this will report to the ash as Fe2O3
and requires addition of oxygen because it ispresent in calcite as Fe+2 but is oxidized to Fe+3in the ash:
2(FeCO3)+O à Fe2O3+2(CO2)
This means that 1 gram of siderite in thesamples adds 0.7 grams of Fe2O3 to the ash pro-ducing an increase in the percentage of Fe2O3 inthe ash of over 7%. Or conversely surprisinglyhigh Fe2O3 concentrations in ash result fromquite small concentrations of siderite in the totalsample.
It is important to know what minerals areinfluencing the ash chemistry and where they arelocated in the coal, before attempting, in a plant,to change the ash chemistry of the product coal,.Coals with no marine influence generally con-tain high proportions of kaolinite and quartz;coals with some marine influence contain lessdegraded clays and more pyrite. Most of theCretaceous coals in western Canada have kaoli-nite based ash, which ensures low base/acidratios, unless there have been syngenetic or epi-genetic additions of carbonate minerals.Scanning electron microscope work indicatesthat there are three primary locations for difficultto remove mineral matter in coal.
s Finely dispersed mineral matter occurs indesmocollinite (vitrinite B). In westernCanadian coals this appears to be kaoliniterich though quartz and sometimes crandillite(aluminum phosphate) occur. If pyrite is pre-
sent it is often finely dispersed in reactivemacerals (Ryan and Ledda, 1998) because itusually forms by bacterial reduction of SO4 inmoderate pH anaerobic conditions favourableto the preservation of vitrinite.
s A number of minerals (kaolinite, carbonatesand sometimes apatite) fill the cell voids insemifusinite and fusinite. In some coals withhigh macrinite contents the amount of inherentmineral matter is low because these sites arenot available.
s Some minerals are external to maceral grainsbut are too finely dispersed to be easily liber-ated by crushing. Calcite and other carbonatessometimes coat cleat and microfracture sur-faces in vitrain bands. Calcite can be unex-pectedly difficult to remove because it impreg-nates the vitrinite along microfractures associ-ated with cleats. Oolites of siderite can occurrandomly dispersed in the coal. Siderite canalso coat cleat surfaces.
It is important to realize that these mineralsare associated with the coal and not with the in-seam rock splits.
Calcite is one of the most important mineralsinfluencing the ash chemistry of British Columbiacoals. It is deposited on cleats and in the cellstructure of semifusinite. The deposition of cal-cite into semifusinite cells must occur as the coalis forming and before compaction closes the cellopenings. It has been suggested that fires in thecoal swamps form charred vegetation, latter toform semifusinite and at the same time increasethe pH of the swamp water, probably by deposi-tion of soluble ash (Lamberson and Bustin, 1996).The higher pH causes calcite to precipitate intothe porous semifusinite. This often effects upperparts of seams, producing a hard dull looking coalin outcrop. The occurrence of calcite-rich semi-fusinite will vary based upon depositional fea-tures. Once filled with calcite the semifusinitecells are protected from compaction and deforma-tion and provide a location, from which it isalmost impossible to remove the calcite. A simi-lar problem can occur in some coals where apatitefills semifusinite cells.
If the calcite coats the surfaces of cleats, itmust have been deposited after the coal was suf-ficiently indurated to fracture. Probably calciumrich water percolated down through the coal
Geological Fieldwork 1998, Paper 1999-1 251
from marine strata higher in the section. In thiscase the calcium will be associated with thebright vitrinite rich bands in the coal and may, onthe regional scale, vary based on the extent ofcleat development related to folding. Crushingthe coal to a finer size may help to liberate someof the calcite.
Based on the association of minerals withcoal and the type of minerals present, thebase/acid ratio of ash changes with the size con-sist of raw coal and by specific gravity of washfractions. This leads to the possibility of chang-ing the ash chemistry of the clean coal. Coalsthat have carbonates on cleats and micro fracturesurfaces have higher base/acid ratios in coarsersized coal, caused by increased contents of cal-cium, iron and magnesium associated with theminerals calcite (CaCO3), dolomite (CaMgCO3),ankerite (CaMgFeCO3) and siderite (FeCO3).These minerals are associated with coal ratherthan in-seam rock splits. They report to SGsplits based on the average SG of the coal plusmineral matter plus carbonate mixture. Themaximum amount of carbonate can occur in anySG split when it is associated only with purecoal. As the inherent mineral matter contentincreases in the sample the carbonate content hasto decrease to maintain the same SG. In coalswith high inherent ash contents, the carbonate isforced into the higher SG splits and tends to beremoved with the rejects. In coals with lowinherent mineral matter contents it can occur inlower SG spits and end up in the product coal.
A previous study looked at the distributionof calcite in a high-volatile bituminous coal(Ryan, 1994). Using washability data it is possi-ble to convert analyses of CaO content by SGincrement into approximate concentrations ofcalcite in the total sample (Table 4). Estimatedcontents of calcite increased to the range 10% to20% in SG splits 1.45 to 1.7. These high con-centrations were achieved because this coal hasa low inherent mineral matter content. Thereported ash concentrations include the CaOfrom the calcite, which has to be removed beforecalculating the content of non calcite derived ashin the coal. It should be noted that when car-bonate concentrations are high, ash values arevery deceptive because of the loss of CO2 fromcarbonate component of the non coal part of thesample during ashing. In fact in the calcite dis-tribution study (Ryan, 1994) the reported ash
concentrations for intermediate SG values andcoarse size fractions are 23% and 36%; thesevalues are actually closer to 30% and 42% min-eral matter when the oxides are reconstituted tomake carbonates.
It is also possible to estimate the SG of thematerial in each split by assigning densities tocoal, mineral matter and calcite. When this isdone in the study (Ryan, 1994), it is found that inorder to derive an average SG for the material ineach SG split that is bracketed by the SG incre-ment range, a low density for calcite has to beused in the calculations. It is difficult to derivean accurate number but the effective density ofthe calcite appears to be low by about 20%. Itappears that the actual density for carbonates oncleats and micro fractures may be less than theideal density of the pure minerals. Possibly larg-er coal fragments (i.e. >5 mm), which containmicrofractures have increased porosity, which isonly partially filled by carbonate material. Thiscould help explain the difficulty in removingcarbonate material from coal, unless it is crushedto a fine (<1 mm) size. Obviously it is easier toremove calcite from finer sized coal, as morecalcite is liberated. Also because the grains aresmaller more of them contain higher amounts of
252 British Columbia Geological Survey Branch
Table 4. Calcite distribution by size and SG incre-ment. Data from a high-volatile bituminous coal(Ryan, 1994).
included calcite so that the calcite occurs inhigher SG splits (Table 4).
Variations in ash chemistry are very impor-tant and can only be fully understood in the con-text of the mineralogy of the mineral matter inthe coal. A powerful and cost effective way ofdoing this is to use a linear correlation matrix ofoxide data. This is illustrated using data from adetailed study, which analyzed all major oxidesin a bulk sample by size and SG increment.Data from this study are used to infer the min-eralogy of the ash in each increment (Table 5).It should be noted that because Al2O3 and SiO2
are major components of the ash they willalways tend to be negatively correlated and thisdoes not necessarily reflect changes in mineral-ogy. Calcium, iron and magnesium are concen-
trated in the coarser sizes and in these sizes theycorrelate with each other and not with SiO2 orAl2O3 indicating that they are present as car-bonates. In the fine size, concentrations ofthese elements decrease; CaO correlates withP2O5 indicating an apatite connection; MgOcorrelates with ash and not with Fe2O3 or CaOindicating a clay connection; Fe2O3 does notcorrelate with CaO, MgO or ash indicating aprobable pyrite connection. Maximum carbon-ate content of the samples can be estimated bycombining the oxides of Ca, Mg and Fe withCO2 and recalculating the weights as carbonates(XCO2). This indicates that in the coarser sizescarbonate contents are in the range 1 to 15% butin the fine size, contents decrease to less than3% except in the plus 2.17 SG split.
It is obvious, that for the coal represented inTable 5 the base/acid ratio is controlled by car-bonate material on cleats. It is not easily liber-ated because a lot of the carbonate material iscontained in particles with SG values in the mid-dlings range. Small increases in the cut point ofthe coarse circuit or crushing the coal to a finersize may remove more carbonate material,reduce the base/acid ratio of the clean coal andimprove the CSR values, with out a majordecrease in plant yield.
In coals that do not contain carbonates oncleats, carbonate material can occur as cell fill-ing in fusinite and semifusinite; though theamount present will be much less than in cleated
Geological Fieldwork 1998, Paper 1999-1 253
Table 5. Linear correlation matrix for ash chemistryand petrographic data for incremental wash samplesfrom 3 size ranges; TR=total reactives.
Figure 5. Relationship of base/acid ratio to size,clean, raw or reject coal and petrography in plant A.Diamonds are raw and reject samples.
.00
.05
.10
.15
.20
.25
0 20 40 60 80 100
reactives% of total organics
base
/aci
d ra
tio
clean coal 3 size fractions50x0.6 .6x.15 .15x0
0
0.05
0.1
0.15
0.2
0.25
1 2 3
base
/aci
d ra
tio
feed clean reject
fine
mediumcoarse
coals. In these coals base/acid ratios have a neg-ative correlation with reactive maceral contentsand also decrease in the fine circuits becausecoal in these circuits tends to be enriched inreactive macerals (Table 1). A plot of reactivescontent (mineral matter free basis) versusbase/acid ratio for clean coal from a number ofcircuits (Figure 5) provides a good negative cor-relation indicating a zero base/acid ratio forreactives and a ratio of about 0.2 to 0.25 for theorganic inerts plus ash. A zero base/acid ratiosuggests a mineralogy of kaolinite and quartz inthe vitrinite. The ratio can be decreased byadjusting the cut point of coarse circuits to retainless inertinite.
CCRA PLANT EVALUATION PROGRAM
Coal was sampled from five Canadiancoal preparation plants. The size fractionstreated in the individual circuits of these fiveplants are summarized in Table 6. The sam-pling program varied at each plant because ofsomewhat different objectives and varyingplant design and as the program unfolded thesampling program at each plant tended tobecame more detailed as information from theprevious plants became available. Attemptswere made to sample product coal, coal fromeach circuit as well as a number of blends ofmaterial from different circuits at each plant.Sampling at each plant occurred over a rela-tively short period and therefore quality doesnot necessarily reflect average product coalquality. It should also be noted that thisCCRA project has been on going for a numberof years and product quality from the plantshas changed considerably since the projectstarted.
Each of the bulk samples taken from theplants was evaluated for both coal and cokequality, and the impact of the coal producedfrom individual circuits on the coking quality ofthe overall clean coal was also evaluated.Testing of samples for coal and coking qualitywas conducted in the laboratories and pilot scalecoke ovens at the CANMET laboratories(Ottawa). Because of differences in the sam-pling programs, the detailed results for eachplant vary somewhat and are discussed separate-ly. All the abbreviations used in tables contain-ing the plant results are in Table 2.
Plant A
Basic analytical data for Plant A (Tables7,8) indicate the distribution of ash and varia-tions in petrography between the three size cir-cuits in the plant. The coal is screened to50mm by 0.6 mm and 0.6mm by 0.0mm. Thecoarse size is washed in heavy mediumcyclones. The finer coal is partially cleaned inwater only cyclones then screened to 0.6 by0.15 mm and 0.15 mm by 0.0 mm. The 0.6mm by 0.15 mm material goes to clean coaland 0.15 by 0 mm material is cleaned in floata-tion cells.
Some general comments can be made aboutthe plant. Raw coal ash concentration is mini-mum in the 0.6 mm by 0.15 mm size; sulphurand reactive macerals concentrate in the finersizes. Ash chemistry varies little with size,though there seems to be a concentration ofkaolinite, probably associated with vitrinite, inthe fine coal. The cleaning efficiency of the cir-cuits decreases as the size decreases and thisprovides some flexibility to influence the pet-rography of the clean coal. The 0.15 mm by 0.0mm clean coal, which is a combination of mate-rial from water only cyclones and floatation isenriched in vitrinite, possibly because these cir-cuits reject about 25% of the feed coal.Consequently the reject coal must be enriched ininertinite.
Base/acid ratios are generally low anddecrease as coal size decreases and as theamount of vitrinite increases (Figure 5). Theytend to increase as the amount of inertinite or ashincrease in the sample Figure 6. An indicationof the ability of a plant to effect the base/acidratio of the product coal is given by the percent-
254 British Columbia Geological Survey Branch
Table 6. Coal sizes treated in the five plant circuits.
Plant Circuits
Plant Heavy Media Fines
Vessels or Cyclones WOC/Sp* Froth
Drum Flotation
A - 50x 0.6 0.6x0.15 0.15x0
B 50x16 16x0.65 0.65x0.15 0.15x0
C 40x10 10x0.65 0.65x0.15 0.15x0
D - 50x0.65 0.65x0.15 0.15x0
E - 40x0.65 - 0.65x0
*Water-only-cyclones (WOC) and/or Spirals (Sp)
Geological Fieldwork 1998, Paper 1999-1 255
plant feed
hm feed
woc feed 0.15 x 0
hm reject
bird reject 0.6 x 0.15
bp reject 0.15x0.0
cl coal #1
cl coal #2
hm prod
sbo 0.6 x 0.15
bird prod 0.6 x 0
bird prop 0 x 0.15
cl c 0x0.15 only
new cl c 0x0.15 only
90%hm+10%sb
75%hm+25%sb
85%ncl+15%bp 0x.15
bird -100m n dried
cl -100m thru drier
ncl -100m thru drier
Ash
%23
.529
18.7
21.3
6841
.543
.910
.110
10.5
8.3
8.8
9.6
9.1
10.6
10.3
9.9
9.9
S%0.
270.
20.
370.
520.
090.
40.
40.
320.
330.
360.
330.
360.
480.
340.
310.
30.
350.
38
VM
%18
.818
.320
.519
.813
.317
.617
.120
.521
.120
.221
.821
.821
.421
.721
.420
.220
.220
.8
VM
%da
f24
.58
25.7
725
.22
25.1
641
.56
30.0
930
.48
22.8
23.4
422
.57
23.7
723
.923
.67
23.8
723
.94
22.5
222
.42
23.0
9
FC%
57.7
52.7
60.8
58.9
18.7
40.9
3969
.468
.969
.369
.969
.469
69.2
69.2
69.5
69.9
69.3
H%
3.5
3.3
3.8
3.7
1.6
2.7
2.6
3.9
4.2
3.9
4.2
4.2
4.1
4.3
4.3
O%
4.2
4.6
4.5
45.
55.
75.
44.
33.
83.
74.
14.
34.
14
3.6
FSI
2.5
1.5
7.5
40.
51
3.5
73
87.
57.
58
7.5
33.
57
7.5
87.
5
star
tC°
455
450
434
437
453
445
457
433
443
444
445
441
451
452
446
444
445
441
fusC
°45
046
746
344
945
946
446
546
4
max
C°
470
467
471
469
467
472
468
470
470
470
469
471
468
468
470
470
469
471
fina
l C°
479
477
492
482
476
484
479
493
486
483
481
486
480
478
484
483
481
486
solid
C°
488
483
495
486
485
490
489
497
492
490
487
491
486
486
490
490
487
491
rang
e C
°24
2758
4523
3922
6043
3936
4529
2638
3936
45
ddpm
1.8
1.9
395.
42.
19.
21.
664
14.4
4.4
3.8
7.5
1.3
2.1
5.4
4.4
3.8
7.5
sf T
C°
426
429
416
417
416
411
422
410
416
417
416
417
423
422
419
417
416
417
max
C C
°49
246
747
448
346
948
545
946
746
946
746
648
348
347
446
946
746
6
max
D C
°49
148
349
048
949
149
249
349
149
049
249
349
1
C20
1728
2327
2821
3025
2828
2425
2527
2828
24
D-2
0-1
7-1
-22
-27
-7-2
119
6-7
-85
-25
-25
-19
-7-8
5
vit%
46
38.5
58.4
55.4
23.8
41.7
46.8
42.5
5039
.663
.667
.464
.265
.871
.847
49.8
58.5
64.2
65.8
71.8
SF%
3234
.624
.823
15.4
22.4
1637
.436
44.2
24.6
20.8
21.6
21.2
17.5
37.2
3727
21.6
21.2
17.5
Mic
%3.
34.
43.
73.
71.
73.
12.
75.
23.
74.
73.
82.
43.
93.
22.
24.
83.
24.
13.
93.
22.
2
Fus%
4.6
4.6
2.2
5.2
4.1
54.
69.
34.
75.
63.
44.
54.
94.
72.
65.
24.
54.
94.
94.
72.
6
MM
%14
.117
.910
.912
.755
27.8
29.9
5.6
5.6
5.9
4.6
4.9
5.4
5.1
5.9
5.8
5.5
5.5
5.4
5.1
5.9
Rm
ax%
1.34
1.34
1.36
1.35
1.32
1.35
1.34
1.35
1.34
1.35
1.35
1.35
1.33
1.33
1.33
1.37
1.34
1.33
1.33
1.33
1.33
TR
%62
55.8
70.8
66.9
31.5
52.9
54.8
61.2
6861
.775
.977
.875
76.4
80.5
565
.668
.372
7576
.480
.55
Tabl
e 7.
Pro
xim
ate,
ulti
mat
e, r
heol
ogic
al a
nd p
etro
grap
hic
data
for
Pla
nt A
.
256 British Columbia Geological Survey Branch
Table 8. Ash chemistry and carbonization data for Plant A.
(baC-baF)/bacoalx100: Where baC isbase/acid ratio of product from thecoarse circuit, baF is ratio for finecircuit and bacoal is the ratio forproduct coal.
The value for Plant A is about 70%. This isquite high though in general the ratios are lowfor all circuits. The ratios correlate strongly withthe presence of Fe2O3 and are high in the coarsecircuit because of the presence of siderite, whichis inferred from the lack of correlation of Fe2O3
with Al2O3 , SiO2 or sulphur (Table 9). Sideriteis removed by crushing but probably does nothave a strong maceral association in the coal andtherefore may not be concentrated with the inertmacerals in the intermediate SG splits.
Phosphorus contents in coals from Plant Aare moderately high and have an ambiguousassociation with ash. At high ash concentrationsthere is some correlation with ash contents, butat low ash concentrations phosphorus content isnot related to ash content. Phosphorus is con-centrated in the coarse size fraction and is in partremoved with the ash from this fraction. In thefiner fractions it is not removed by washing andin the clean coal its concentration correlates withthe fusinite plus semifusinte content (Figure 7).Most of the phosphorus is in these macerals andvery little is associated with reactive macerals orash. This means that phosphorus will concen-trate in the intermediate SG splits (Figure 1) andin the coarser size fractions tracking the inerti-nite concentrations in the coal.
Geological Fieldwork 1998, Paper 1999-1 257
Figure 6. Triangular plot for Plant A data illustratingthat base elements tend to be associated with miner-al matter and inert macerals. Posted values arebase/Acid ratios. A=reactives%, B=inerts%,C=ash%.
.033.081
.081
.09
.106
.098 .099
.082.0480
9
17
26
35
43
52
61
69
78
87
0 10 20 30 40 50 60 70 80 90 100
80
60
40
20
100
80
60
40
20
A
C
B
PLANT A
Table 9. Linear correlation matrix for ash chemistrydata, Plant A.
x Si0 2
Al 2
O3
Fe2O
3
P2O
5
CaO
MgO
B/A
K2O
Ash
S/as
h
Si02 1.
Al2O3 -.42 1.
Fe2O3 -.02 -.77 1.
P2O5 -.59 .85 -.55 1.
CaO -.70 .68 -.35 .94 1.
MgO .61 -.82 .69 -.82 -.70 1.
B/A -.02 -.79 .99 -.53 -.29 .70 1.
K2O .76 -.83 .55 -.91 -.84 .94 .56 1.
Ash .55 -.73 .60 -.71 -.56 .78 .65 .85 1.
S/ash -.53 .84 -.72 .78 .63 -.96 -.75 -.92 -.86 1.Figure 7. Phosphorus in Plant A. Phosphorus andinerts distribution by circuit and phosphorus relation-ship to ash and semifusinite+fusinite. Solid pointsare clean coal samples.
.00
.02
.04
.06
.08
.10
.12
0 10 20 30 40 50
semifusinite+fusinite
P% to
tal s
ampl
e
.00
.04
.08
.12
P% to
tal s
ampl
e
feed clean reject
coarse
medium
fine
0
0.02
0.04
0.06
0.08
0.1
0.12
0 20 40 60 80
Ash%
P% to
tal s
ampl
e
0
10
20
30
40
50
60
feed clean reject
coarse
medium
fineiner
tsor
gani
c%
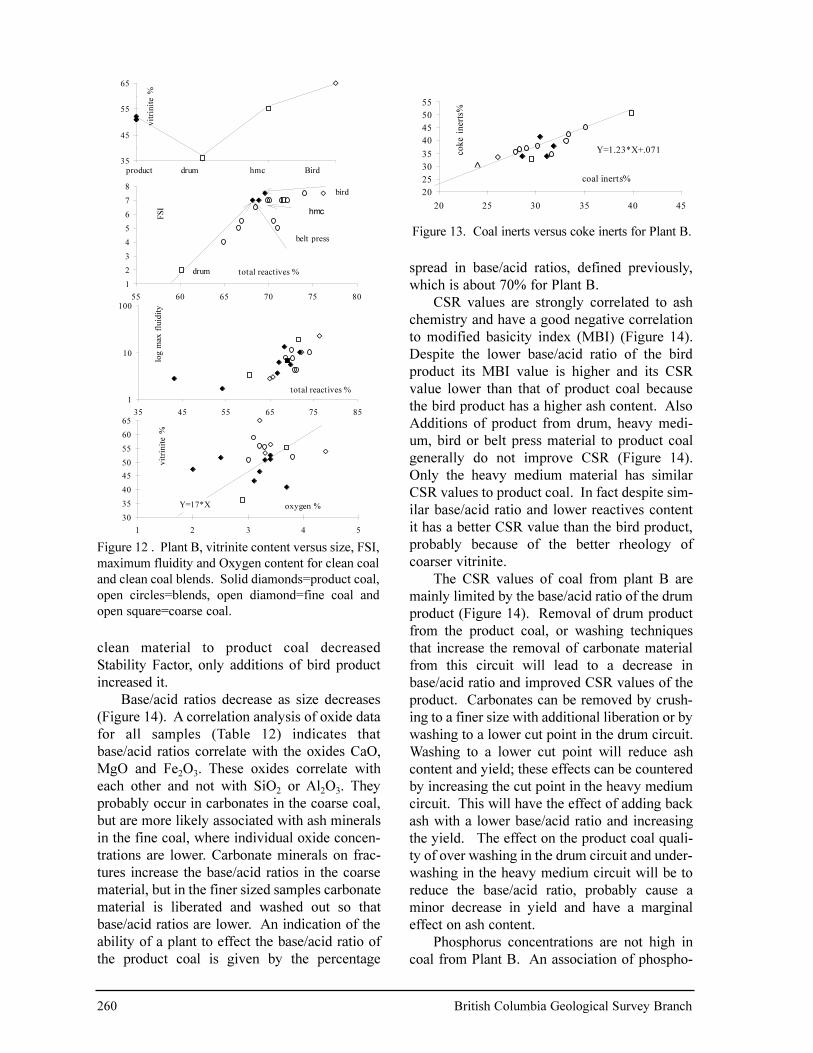
Fluidity and FSI values for the product 0.6mm by 0.15 mm and 0.15 mm by 0.0 mm mate-rial are generally better than for the 50 mm by0.6 mm material. This is to be expected basedon the increased vitrinite content of this materi-al (Figure 8). However on closer inspection itappears that fluidity and to a lesser extent FSIvalues of the 0.mm by 0.0 mm material are lessthan anticipated based on the high total reactivescontent (Figure 8). This is important because ithad been assumed that the fine coal with itsincreased reactives content was important inmaintaining and improving the coking quality ofthe product coal.
A partial explanation may relate to the finesize of the coal particles. A number of papershave indicated that fluidity and to a lesser extentFSI values are decreased if the coal is crushed toa finer size (Price and Gransden, 1987). It alsoappears that vitrinite in the fine coal forms a dif-ferent population in terms of oxygen contentthan vitrinite in the product and coarse coal. Theoxygen content of macerals increases from semi-fusinite to vitrinite and possibly from desmo-collinite to tellinite (Mastalerz and Bustin,1993). The fine coal samples plot to the left of aline of positive slope drawn through the productsamples in the vitrinite versus oxygen plotimplying that these samples are deficient in oxy-gen based on their vitrinite content. One would
expect the opposite trend because tellinite ismore friable and contains more oxygen thandesmocollinite. If the fine coal samples are defi-cient in oxygen, then probably some of the finevitrinite is more inert than coarse vitrinite. Thismay be because it experienced shearing, whichincreased its friability and decreased its reactiv-ity, or it may be of higher rank. The effect is notrelated to the thermal drier because the sampleswere collected before the drier, nor is it relatedto ash because the effect is apparent in samplesof similar ash content. The differences musttherefore originate in the raw coal.
When coal is coked there are some changesin the mineralogy of the mineral matter, whichresult in a volume decrease, but the main effectis loss of volatile matter, mostly from the reac-tive macerals. This has the effect of decreasingthe relative percentage of reactive macerals inthe coke compared to the coal. The effect isgreater for coals with high inertinite contentsand decreases to zero as the reactive maceralcontent approaches 100%. In the mid range itcan account for a 5% to 10% increase in the iner-tinite content in coke compared to coal. Forplant A, a comparison of coke and coal petrog-raphy indicates that when 15% 0.15 mm by 0.0mm material is added to the clean coal, the coalreactives maceral content increases but decreas-es in the coke (solid arrow in Figure 10) where-as when 0.6 by 0.15 mm material was added toheavy medium coal and coke reactives increased(dashed arrow). Obviously petrography of finesamples is miss leading. It appears that the finesize and lower (?) oxygen content of vitrinite inthe fine circuits makes it, in part, act like an inertcoke maceral.
In an attempt to determine the contributions
258 British Columbia Geological Survey Branch
Figure 8. Relationship of FSI and fluidity to totalreactives content for Plant A. Solid diamonds =totalproduct or 50 by 0.6 mm material, open dia-monds=samples with all or some additional 0.15 mmmaterial, open squares=0.6 by 0.15 material.
0
2
4
6
8
30 40 50 60 70 80 90
total reactives %
FSI
1
10
100
40 50 60 70 80 90
total reactives
log
max
ddp
m
Figure 9. Oxygen versus vitrinite relationship.
20
40
60
80
0 1 2 3 4 5 6
oxygenvi
trin
ite
Y=10*X
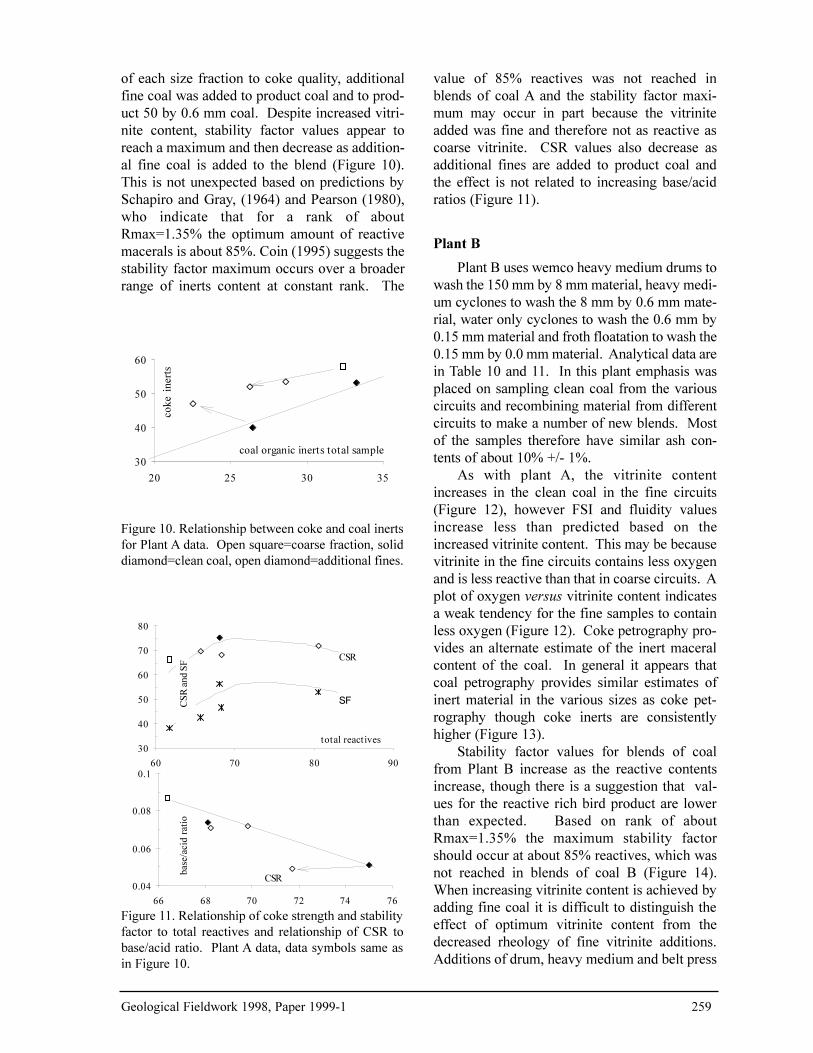
of each size fraction to coke quality, additionalfine coal was added to product coal and to prod-uct 50 by 0.6 mm coal. Despite increased vitri-nite content, stability factor values appear toreach a maximum and then decrease as addition-al fine coal is added to the blend (Figure 10).This is not unexpected based on predictions bySchapiro and Gray, (1964) and Pearson (1980),who indicate that for a rank of aboutRmax=1.35% the optimum amount of reactivemacerals is about 85%. Coin (1995) suggests thestability factor maximum occurs over a broaderrange of inerts content at constant rank. The
value of 85% reactives was not reached inblends of coal A and the stability factor maxi-mum may occur in part because the vitriniteadded was fine and therefore not as reactive ascoarse vitrinite. CSR values also decrease asadditional fines are added to product coal andthe effect is not related to increasing base/acidratios (Figure 11).
Plant B
Plant B uses wemco heavy medium drums towash the 150 mm by 8 mm material, heavy medi-um cyclones to wash the 8 mm by 0.6 mm mate-rial, water only cyclones to wash the 0.6 mm by0.15 mm material and froth floatation to wash the0.15 mm by 0.0 mm material. Analytical data arein Table 10 and 11. In this plant emphasis wasplaced on sampling clean coal from the variouscircuits and recombining material from differentcircuits to make a number of new blends. Mostof the samples therefore have similar ash con-tents of about 10% +/- 1%.
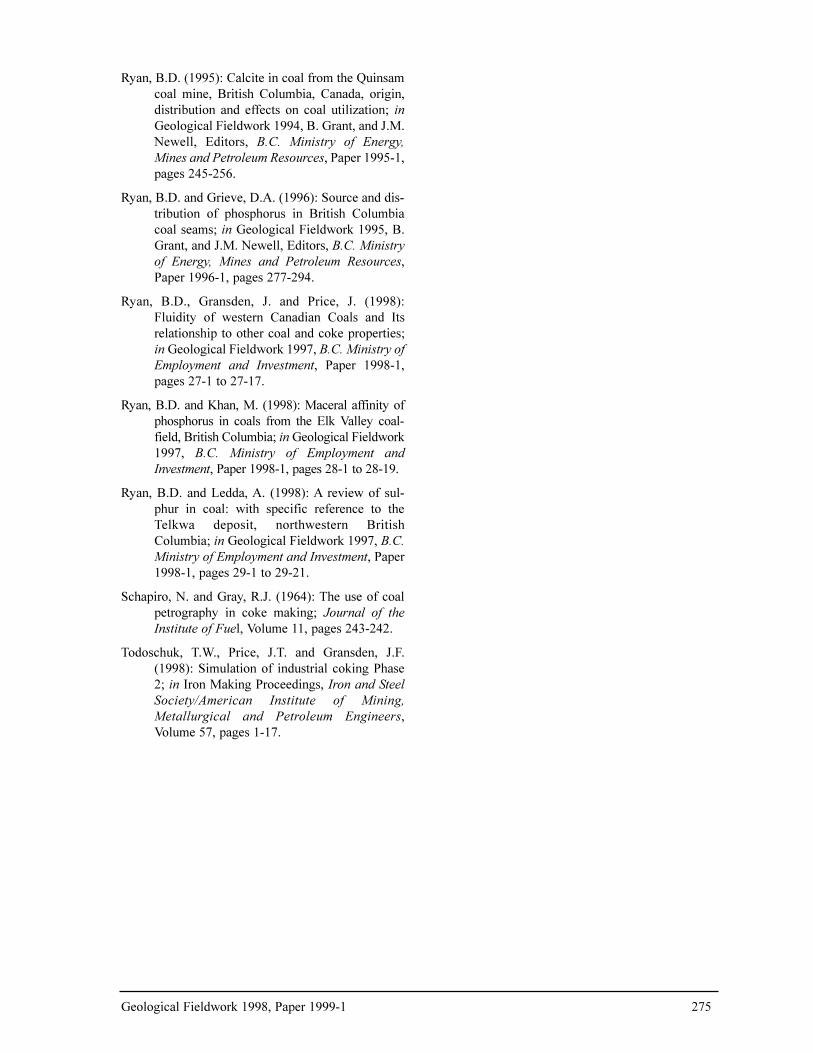
As with plant A, the vitrinite contentincreases in the clean coal in the fine circuits(Figure 12), however FSI and fluidity valuesincrease less than predicted based on theincreased vitrinite content. This may be becausevitrinite in the fine circuits contains less oxygenand is less reactive than that in coarse circuits. Aplot of oxygen versus vitrinite content indicatesa weak tendency for the fine samples to containless oxygen (Figure 12). Coke petrography pro-vides an alternate estimate of the inert maceralcontent of the coal. In general it appears thatcoal petrography provides similar estimates ofinert material in the various sizes as coke pet-rography though coke inerts are consistentlyhigher (Figure 13).
Stability factor values for blends of coalfrom Plant B increase as the reactive contentsincrease, though there is a suggestion that val-ues for the reactive rich bird product are lowerthan expected. Based on rank of aboutRmax=1.35% the maximum stability factorshould occur at about 85% reactives, which wasnot reached in blends of coal B (Figure 14).When increasing vitrinite content is achieved byadding fine coal it is difficult to distinguish theeffect of optimum vitrinite content from thedecreased rheology of fine vitrinite additions.Additions of drum, heavy medium and belt press
Geological Fieldwork 1998, Paper 1999-1 259
Figure 10. Relationship between coke and coal inertsfor Plant A data. Open square=coarse fraction, soliddiamond=clean coal, open diamond=additional fines.
30
40
50
60
20 25 30 35
coal organic inerts total sample
coke
ine
rts
Figure 11. Relationship of coke strength and stabilityfactor to total reactives and relationship of CSR tobase/acid ratio. Plant A data, data symbols same asin Figure 10.
0.04
0.06
0.08
0.1
66 68 70 72 74 76
CSR
base
/aci
d ra
tio
30
40
50
60
70
80
60 70 80 90
total reactives
CSR
SFCSR
and
SF
clean material to product coal decreasedStability Factor, only additions of bird productincreased it.
Base/acid ratios decrease as size decreases(Figure 14). A correlation analysis of oxide datafor all samples (Table 12) indicates thatbase/acid ratios correlate with the oxides CaO,MgO and Fe2O3. These oxides correlate witheach other and not with SiO2 or Al2O3. Theyprobably occur in carbonates in the coarse coal,but are more likely associated with ash mineralsin the fine coal, where individual oxide concen-trations are lower. Carbonate minerals on frac-tures increase the base/acid ratios in the coarsematerial, but in the finer sized samples carbonatematerial is liberated and washed out so thatbase/acid ratios are lower. An indication of theability of a plant to effect the base/acid ratio ofthe product coal is given by the percentage
spread in base/acid ratios, defined previously,which is about 70% for Plant B.
CSR values are strongly correlated to ashchemistry and have a good negative correlationto modified basicity index (MBI) (Figure 14).Despite the lower base/acid ratio of the birdproduct its MBI value is higher and its CSRvalue lower than that of product coal becausethe bird product has a higher ash content. AlsoAdditions of product from drum, heavy medi-um, bird or belt press material to product coalgenerally do not improve CSR (Figure 14).Only the heavy medium material has similarCSR values to product coal. In fact despite sim-ilar base/acid ratio and lower reactives contentit has a better CSR value than the bird product,probably because of the better rheology ofcoarser vitrinite.
The CSR values of coal from plant B aremainly limited by the base/acid ratio of the drumproduct (Figure 14). Removal of drum productfrom the product coal, or washing techniquesthat increase the removal of carbonate materialfrom this circuit will lead to a decrease inbase/acid ratio and improved CSR values of theproduct. Carbonates can be removed by crush-ing to a finer size with additional liberation or bywashing to a lower cut point in the drum circuit.Washing to a lower cut point will reduce ashcontent and yield; these effects can be counteredby increasing the cut point in the heavy mediumcircuit. This will have the effect of adding backash with a lower base/acid ratio and increasingthe yield. The effect on the product coal quali-ty of over washing in the drum circuit and under-washing in the heavy medium circuit will be toreduce the base/acid ratio, probably cause aminor decrease in yield and have a marginaleffect on ash content.
Phosphorus concentrations are not high incoal from Plant B. An association of phospho-
260 British Columbia Geological Survey Branch
Figure 12 . Plant B, vitrinite content versus size, FSI,maximum fluidity and Oxygen content for clean coaland clean coal blends. Solid diamonds=product coal,open circles=blends, open diamond=fine coal andopen square=coarse coal.
35
45
55
65
0 1 2 3
vitr
init
e %
product drum hmc Bird
1
2
3
4
5
6
7
8
55 60 65 70 75 80
total reactives %
FSI
drum
belt press
bird
hmc
1
10
100
35 45 55 65 75 85
total reactives %
log
max
flu
idit
y
30
35
40
45
50
55
60
65
1 2 3 4 5
oxygen %
vitr
init
e %
Y=17*X
Figure 13. Coal inerts versus coke inerts for Plant B.
20253035
40455055
20 25 30 35 40 45
coal inerts%
coke
ine
rts%
Y=1.23*X+.071
Tabl
e 10
. Pro
xim
ate,
ash
che
mis
try
and
rheo
logi
cal d
ata
for
Plan
t B.
Geological Fieldwork 1998, Paper 1999-1 261
test1clean prod coal #1
clean prod coal #2
75% clean coal+25% drum
75% cl coal+25%hmc
100% drum plant
100% hmc
75%cl coal+25%bird
100% bird
5%bltp+20%d+25%b+50%hm
75% cl coal+25% belt P
100% clean
100% clean
100% drum
100% hmc
100% bird
50% clean+50% drum
50% clean+50% hmc
50% clean+50% drum
50% clean+50% bird
60% clean+40% belt
5%b+25%brd+50%hmc+20%d
100% clean
100% raw coal fines
100% raw coal
75% clean+25%raw fines
100% clean
Ash
%9.
79.
810
.49.
610
.98.
810
.111
.210
.311
.29.
79.
810
.89.
111
.210
.49.
49.
710
.411
.99.
99.
623
38.2
13.2
9.8
VM
%21
.221
.521
.419
.718
.421
.321
.122
21.5
21.4
21.8
20.9
2021
.622
.220
.622
19.9
20.8
20.9
21.6
21.7
19.2
16.4
20.9
21.2
FC%
69.1
68.7
68.2
70.7
70.7
69.9
68.3
66.8
68.2
67.4
68.5
69.3
69.2
69.3
66.6
6965
.670
.468
.867
.268
.568
.757
.845
.465
.969
H%
4.1
4.2
4.1
4.1
4.1
4.3
4.3
4.2
4.3
4.1
4.3
4.2
4.4
4.2
4.3
4.1
4.2
4.2
3.7
2.9
4.1
S%0.
370.
360.
330.
390.
290.
410.
410.
470.
40.
40.
390.
380.
340.
390.
450.
330.
380.
380.
410.
40.
410.
390.
440.
340.
39O
%3.
42.
52
3.4
2.9
3.7
3.3
3.2
34.
42.
53.
13.
23.
23.
13.
33.
83.
33.
43.
73.
5Si
O2
59.5
6058
.159
.956
.759
61.1
62.2
58.5
5958
.657
.158
.656
.960
60.3
59.9
59.2
64.1
67.3
61A
l 2O
321
.722
20.6
22.2
17.8
22.9
22.3
22.6
21.3
21.9
21.4
19.8
22.5
20.9
22.2
23.8
23.2
21.6
20.9
18.6
21.1
Fe2O
34.
84.
75.
64.
56.
24.
64.
23.
74.
84.
54.
65.
34.
45.
13.
64.
34.
34.
23.
23.
13.
9T
iO2
1.3
1.3
1.2
1.2
11.
21.
31.
41.
21.
21.
21.
11.
21.
21.
31.
31.
21.
21
0.9
1.1
P2O
50.
60.
70.
60.
60.
80.
70.
50.
40.
60.
50.
60.
70.
60.
90.
40.
30.
60.
60.
30.
30.
4C
aO4.
44.
35.
24.
28
4.2
4.1
3.3
4.6
3.9
4.2
6.2
4.2
5.7
3.4
3.2
4.3
4.1
3.1
2.6
3.6
MgO
1.3
1.3
1.4
1.2
21.
11.
31.
21.
41.
41.
31.
71.
21.
61.
21.
41.
51.
31.
31.
41.
3SO
33.
53.
13.
52.
93.
83.
12.
92.
43.
72.
93.
24.
83.
84.
63.
12.
42.
74.
12.
41.
63.
1N
a 2O
0.6
0.6
0.6
0.6
0.7
0.6
0.6
0.5
0.6
0.5
0.6
0.6
0.6
0.6
0.6
0.5
0.6
0.6
0.4
0.3
0.4
K2O
11
0.9
0.9
0.5
0.8
1.2
1.7
1.1
1.4
0.9
0.7
0.9
0.8
1.3
1.7
1.2
12.
22.
31.
5B
aO0.
60.
60.
60.
60.
50.
70.
60.
60.
60.
60.
60.
60.
60.
60.
60.
60.
70.
60.
50.
30.
5B
/A0.
160.
150.
180.
150.
240.
150.
140.
130.
160.
150.
150.
20.
150.
190.
130.
140.
150.
150.
130.
120.
14st
art
C°
435
436
436
429
449
429
432
432
433
435
435
434
439
432
430
441
431
436
432
441
433
433
438
440
435
432
fusi
on C
°45
145
145
545
244
744
944
745
345
345
244
944
748
450
453
456
453
451
max
C°
462
462
461
463
459
465
462
462
460
463
463
459
458
462
461
460
480
458
462
461
458
460
459
455
459
459
fina
l C°
483
483
478
481
471
483
480
481
477
475
479
478
469
480
481
473
478
478
479
475
476
477
472
466
475
477
solid
C°
489
486
483
488
480
486
485
485
482
484
483
483
478
486
485
482
486
482
485
479
486
483
481
475
480
483
rang
e48
4742
5222
5448
4944
4044
4430
4851
3247
4147
3443
4443
2640
45dd
pm13
.510
.36.
211
.63.
319
10.2
22.8
7.9
4.4
5.6
8.7
2.2
11.4
16.4
2.8
10.3
3.7
10.1
4.2
7.6
6.8
31.
75.
17.
5so
ft T
402
412
415
411
421
406
401
401
402
399
399
399
411
399
399
405
399
402
408
411
405
406
416
428
408
404
max
C C
°45
245
745
845
247
944
745
444
845
545
445
645
447
345
244
947
045
446
445
645
745
845
647
950
046
545
6m
ax D
C°
481
481
482
479
481
479
479
479
477
479
480
476
478
480
478
480
479
482
481
483
480
C28
2425
2621
2729
2926
2927
3027
2929
2628
2626
2827
2822
626
30D
-3-8
-16
-10
7-4
8-1
1-1
2-8
-50
-75
0-5
-25
-3-1
0-1
1-7
00
-21
-10
FSI
77
5.5
72
77
7.5
6.5
57.
57
2.5
77.
54
75
7.5
5.5
77
4
262 British Columbia Geological Survey Branch
test1clean prod coal #1
clean prod coal #2
75% clean coal+25% drum
75% cl coal+25%hmc
100% drum plant
100% hmc
75%cl coal+25%bird
100% bird
5% belt+20%drum+25%bird+50%hm
75% cl coal+25% belt P
100% clean
100% clean
100% drum
100% hmc
100% bird
50% clean+50% drum
50% clean+50% hmc
50% clean+50% drum
50% clean+50% bird
60% clean+40% belt
5%belt+25% bird50%hm+20% drum
100% clean
100% raw coal fines
100% raw coal
75% clean+25%raw fines
100% clean
Coa
l pet
rogr
aphy
Vit
%51
4752
3655
5665
5154
5243
5646
5953
5251
5641
ex%
0.1
0.1
0.1
0.1
SF%
340
3935
4833
3322
3634
3643
3240
3034
3636
2426
Mic
%7.
95.
84.
57.
75.
43.
24.
85.
23.
75.
15.
15
4.6
3.6
3.8
4.4
54.
66
Fus%
1.3
22.
61.
92
2.5
1.5
2.6
1.9
1.7
2.5
2.1
3.1
1.5
1.7
1.7
2.6
0.7
1.3
MM
%5.
55.
85.
46.
14.
95.
76.
45.
86.
35.
55.
85.
35.
55.
96.
85.
65.
414
25R
max
%1.
31.
41.
41.
41.
31.
41.
31.
31.
31.
31.
41.
31.
41.
31.
31.
31.
31.
31.
3T
R%
6867
7060
7172
7669
7170
6572
6774
7170
6966
54SI
5554
5745
5859
6255
5757
5258
5461
5757
5655
34C
arbo
niza
tion
res
ults
H2O
2.7
2.7
2.7
2.7
2.9
2.8
3.3
22.
72.
12.
82.
92.
52.
81.
83
2.8
33
22
2.6
3.2
2.6
AST
M B
D78
278
278
378
278
278
278
377
878
378
578
278
278
077
878
278
277
877
778
077
877
877
877
877
8m
ax w
all K
pa2.
91.
62.
13.
81.
93.
12.
92.
63.
53.
53.
42.
91.
92.
44.
81
2.3
2.8
3.7
3.8
3.8
2.8
2.9
3.1
max
gas
Kpa
3.4
91.
77.
60.
73.
42.
83.
67.
92.
62.
26.
91
0.3
5.5
2.4
2.4
0.9
5.5
coke
yld
7878
7880
7879
7978
7778
8078
7679
7877
7879
7877
7778
7779
Ash
%12
1212
1213
1112
1413
1412
1213
1114
1312
1213
1513
1216
12V
M%
0.5
0.6
0.8
0.8
1.1
0.7
0.7
0.5
0.6
0.7
0.7
0.6
0.9
0.7
0.7
0.7
0.6
0.6
0.7
0.7
0.6
0.5
0.6
0.7
S%0.
40.
40.
40.
40.
30.
40.
40.
40.
40.
40.
40.
40.
40.
40.
50.
30.
40.
40.
40.
40.
40.
40.
40.
4m
ean
coke
siz
e54
5257
5664
5754
4956
5355
5464
5850
6058
6151
5456
5559
56St
abili
ty52
5343
5129
4850
6146
4653
5225
4360
3347
4653
4446
4844
50ha
rdne
ss69
6965
6954
6469
7066
6269
6753
6270
5364
6868
6466
6260
67C
RI
3030
3430
4029
3232
3235
3140
3034
3631
3533
3634
3135
32C
SR56
5644
5327
5653
5147
4252
2155
4935
4942
4841
4449
3549
Cok
e pe
trog
raph
ym
osai
c26
2029
1727
3643
3640
2927
3229
3946
3241
flow
2517
2010
2313
1515
1219
1220
1814
820
11do
mai
n11
2313
2316
1612
1512
1116
1212
1314
1414
iner
ts38
4038
5134
3631
3537
4145
3743
3332
3435
Tabl
e 11
. Coa
l and
cok
e pe
trog
raph
y an
d ca
rbon
izat
ion
data
for
Pla
nt B
.
rus with semifusinite plus fusinite in the cleancoal is apparent (Figure 15). The high phospho-rus contents in two raw samples (star and cross)indicate that there is some easy to remove phos-phorus in the ash but in the clean samples thephosphorus correlates positively with semifusi-nite+fusiinite and negatively with ash.Therefore concentrations are higher in coarseand intermediate sized fractions and in interme-diate SG splits where the inert macerals tend toconcentrate, and lower in the fine coal and lowSG splits.
Plant C
Plant C uses a tromp bath to wash the plus10 mm material and heavy medium cyclones for
Geological Fieldwork 1998, Paper 1999-1 263
Figure 14. Stability Factor and CSR versus totalreactives and MBI, CSR, B/A and SF versus addi-tions to clean coal of material from different circuits;Plant B. Drum=solid square, bird=open square,hmc=solid circle, belt press=open triangle, blend=open diamond, clean coal=solid diamond.
1.5
2
2.5
3
3.5
20 30 40 50 60
CSR
MB
I
20
30
40
50
60
60 65 70 75 80
total reatives
CSR
20
30
40
50
60
0 20 40 60 80 100
% addition
CSR drum
bird
hmc
belt
20
30
40
50
60
70
0 20 40 60 80 100
% addition
Stab
ilit
y fa
ctor
belt
bird
hmc
drum
0
0.05
0.1
0.15
0.2
0.25
0 20 40 60 80 100
% addition
base
/aci
d ra
tio
belt
drum
birdhmc
20
30
40
50
60
70
60 65 70 75 80
total reactives
Stab
ilit
y fa
ctor
Table 12. Linear correlation matrix for clean coal ashchemistry, Plant B.
Table 13. Coal quality, ash chemistry, rheology and carbonization data for plant C. A=clean coal,B=tromp clean coal, C=heavy medium cyclones clean coal, D=filter cake.
the 10.0 mm by 0.6 mm material. The 0.6 mmby 0.0 mm material is classified using wateronly cyclones and the 0.15 mm by 0.0 mm mate-rial is washed in floatation cells. Spirals are alsoused to clean the fine coal. The sampling pro-gram was similar to that at plant B. Productcoal, clean coal from the various circuits, andseveral combinations of product coal and coalfrom various circuits were analyzed (Table 13).
The reactive maceral content of the clean coalincreases and base/acid ratios decreases as the sizedecreases and consequently base/acid ratios have agood negative correlation with reactive maceralcontent (Figure 16). This is not because of an asso-ciation of alkali rich minerals with inert macerals,but rather because the vitrinite concentrates in thefine circuits and the base/acid ratio is influenced bythe probable presence of siderite and ankeriteoccurring in the coarse clean coal. This is inferredfrom the strong correlation of Fe2O3 with CaO andlack of correlation with ash (Table 3).
The stability factor reaches a maximum atabout 80% reactives and despite additions of finecoal that increase the reactive content, it thendecreases as reactive content increases (Figure17). In fact the best stability factor appears to beachieved with the present mix of material from
the various circuits. It is not clear if this is because80% is the optimum amount of reactives or thefine virinite has poor rheology. The vitrinite ver-sus oxygen relationship is ambiguous and there isno clear evidence that the fine vitrinite containsless oxygen than the coarse vitrinite. Removal ofdrum product from the clean coal may increasestability factor by increasing the reactives contentof the product but it is possible that at about 80%reactives the coal is close to the optimum reac-tives content for maximum stability factor.
Decrease in base/acid ratio in the fine coal(Figure 17) does not translate into a noticeableimprovement in CSR, probably because the per-centage spread in base/acid ratios is only 25%and also in part because the main oxide effectingMBI values is Fe2O3 , which may be less detri-mental to CSR than CaO. CSR values are moresensitive to changes in ash content than ashchemistry (Table 3) and ash content in the cleancoal is not correlated to base/acid ratio. Thismeans that a noticeable improvement in CSRvalues may be achieved by reducing the ash con-tent of the clean coal. Indications are that a 1%
Geological Fieldwork 1998, Paper 1999-1 265
Figure 16. Plant C; Variation of petrography andbase/acid ratio with size. Solid diamond=clean coal,solid circle=hmc, open square=fines or additionalfines, solid square=drum, open diamond=additionalcoarse coal.
40
50
60
70
80
90
100
0 1 2 3
tota
l re
acti
ves
product tromp hmc filter press
0.07
0.15
0.11
Bas
e/ac
id r
atio
0.08
0.10
0.12
0.14
60 70 80 90 100
total reactivesbase
/aci
d ra
tio
Figure 17. Stability Factor and CSR versus total reac-tives and CSR versus MBI for coal from Plant C.Solid diamond=clean coal, solid circle=hmc, opensquare=fines or additional fines, solid square=drum,open diamond=additional coarse coal.
0
0.5
1
1.5
2
50 55 60 65 70
CSR
MB
I
50
55
60
65
70
65 75 85
total reactives
CSR
45
50
55
60
65 75 85
total reactives
stab
ilit
y fa
ctor
decrease in ash content could increase of CSRvalues of up to 5.
Phosphorus correlates with the inert maceralcontent of the clean coal and is therefore con-centrated in the coarse and intermediate sizes(Figure 18). Because phosphorus minerals(mainly apatite) occur in cells in the inert mac-erals, crushing the coarse coal to a finer size willnot liberate much apatite. Over washing thecoarse material and underwashing the fine mate-rial may reduce the phosphorus content. Basedon the calculated distribution of phosphorusbetween inerts, reactives and ash in similar coals(Ryan and Grieve, 1995) and the variation of thereactives/inerts ratio by SG (Figure 1), it is pos-sible to model the distribution of phosphorus bysize and SG and compare the results to the actu-al phosphorus versus inerts distribution (Figure18). The model washability data predicts a sim-ilar phosphorus distribution to that seen and cantherefore be used to estimate the effect of overwashing the coarse circuit. The predicted prod-uct coal has 7.1% ash, 0.062% phosphorus and ayield of 66%. If the SG in the coarse circuit islowered the new product is predicted to have6.6% ash, 0.059% phosphorus and a yield of
59%. These numbers are based on modelingash, phosphorus and inerts distributions andtherefore only reflect trends. It appears thatphosphorus can only be reduced a little bychanging cut points in circuits, which incurs ayield penalty.
The various blends of product, tromp, heavymedium and filter cake coals are displayed in atriangular plot (Figure 19) from which it isapparent that the best quality is obtained from amixture of all three components (the plottedposition of the product coal is approximate).
Plant D
Plant D uses heavy medium cyclones, wateronly cyclones and froth floatation to producethermal and metallurgical grade products bywashing medium-volatile bituminous coal fromtwo mines ( coal A and coal B). The plant oper-ating strategy is to produce acceptably low sul-phur metallurgical and thermal coal products byblending the products from the various plant cir-cuits and the two source coals, which generally
266 British Columbia Geological Survey Branch
Figure 18. Phosphorus versus fusinite+semifusinitefor Plant C, with model washability data and calcu-lated theoretical phosphorus contents for three cir-cuits (solid line and crosses). Symbols same asFigure 17.
0
10
20
30
40
50
60
70
5 4 3 2 1
reactives
P% total sample x100
inerts
ash
inerts/reactives x10
<1.5 1.5-1.6 1.6-1.7 1.7-1.8 >1.8
0.01
0.03
0.05
0.07
0.09
0 5 10 15 20 25 30 35 40 45
fusinite+semifusinite %
P%
tota
l sa
mpl
e
Figure 19. Variations of Stability Factor and CSR forblends of material from different circuits, Plant C.
0
9
17
26
35
43
52
61
69
78
87
0 10 20 30 40 50 60 70 80 90 100
80
60
40
20
100
80
60
40
20
tromp
heavy mediumfilter cake
posted values = SF
46.4
55
54.552.153.3 52.8
52.5
0
9
17
26
35
43
52
61
69
78
87
0 10 20 30 40 50 60 70 80 90 100
80
60
40
20
100
80
60
40
20
tromp
heavy medumfilter cake
posted CSR values
54.6
64.7
58.959.4
58.8
61.9
60.6 62
have quite high run of mine sulphur contents.The sampling program was comprehensiveinvolving sampling of raw coal, feed coal andproduct coal from the circuits. Samples weretaken while the plant was washing the two sourcecoals (A and B) separately. This enabled differ-ent qualities and washing characteristics of thetwo coals to be determined. Previously it wasassumed that the two coals had similar washingcharacteristics, but data from this study revealeda number of differences. The analytical data forcoals A and B and the coal quality and car-bonization data for blends are in Tables 14, 15.
The petrography of the two coals is slightly
different both are vitrinite rich, but coal A con-tains less vitrinite and more micrinite than coalB and consequently has a lower reactive macer-al content. Though both coals contain about thesame amount of exinite in the raw feed, coal Aretains more exinite in the various componentclean coals and this partially explains the higherfluidity. Most samples of coal A have maximumfluidities over 28 000 ddpm (Table 14).Fluidity for coal B is generally lower and valuescorrelate with total reactives content, though thevitrinite enriched finer coals tend to have lowerthan expected fluidities.
Raw coal A contains slightly less sulphur than
Geological Fieldwork 1998, Paper 1999-1 267
Table 14. Coal quality, ash chemistry, petrography and rheological data for Plant D. ASCF=secondary cyclonefeed, SCOF=screen over flow, TP=thermal product, FT=float tails, FC=filter cake, PC=primary cyclone.
coal B, but washes to a slightly higher sulphurcontent and contains much more Fe2O3 than coalB. The Fe2O3 probably occurs in the mineralsiderite. Sulphur is liberated somewhat into thefine feed but less than half is removed by wash-ing, producing product metallurgical coals withsulphur contents in the range of 1% to 1.5% andthermal coals in the range 3% to 4%. Plots of S%
versus Fe2O3 % in total sample (Figure 20) pro-vide some indication of how much of the iron andsulphur are combined as pyrite, how much excessiron exists as siderite and the concentration oforganic sulphur. The slope of the line in Figure 20(1.245) is that of the ratio of Fe/S in pyrite (FeS2),taking into account that the Y axis is Fe2O3 andnot Fe. The band, defined by the two lines, inter-
268 British Columbia Geological Survey Branch
RA
W C
OA
L P
CM
ET
PR
OD
UC
TSC
FC
oars
e
T
PSC
OF
FC
FT
size mm
50x0
25x12.5
12.5x3.35
<3.35
feed
50x0.7
50x6.3
6.3x0.2
10x0.2
50x0.07
reject
50x0.07
50x6.3
6.3x0.2
0.2x0.0
.07x.015
<0.015
<0.015
Ash
%40
.948
35.3
26.6
40.9
2.5
3.5
2.2
2.5
72.5
90.3
8.1
12.8
8.4
7.1
9.9
13.1
90.4
VM
%23
.421
.525
.427
.423
.335
.135
.536
34.9
13.8
7.7
33.3
32.6
33.6
33.7
32.7
309.
6
FC35
.730
.539
.346
35.8
62.4
6161
.862
.613
.72
58.6
54.6
5859
.257
.456
.90
H%
3.1
33.
53.
93.
15.
35.
35.
35.
21.
70.
64.
94.
74.
94.
94.
74.
40.
7
S%2.
051.
781.
812.
091.
71.
21.
211.
131.
192.
171.
663.
153.
823.
353.
031.
942.
040.
7
O%
4.6
4.3
4.2
4.3
3.8
6.9
6.1
6.6
6.1
34
5.5
4.2
5.5
5.3
6.5
4.8
3.3
SiO
259
61.2
59.5
5460
41.1
52.4
46.1
41.2
56.6
61.1
3442
.834
.632
.545
.845
.355
.9
Al 2
O3
22.6
22.9
22.8
21.9
22.6
18.1
19.9
19.8
17.7
21.5
2314
.916
.614
.815
.119
.219
.322
Fe2O
39.
98.
49.
611
.68.
926
.520
.223
.629
.312
.67.
340
.334
41.8
43.3
19.8
188.
9
TiO
21
11
11.
11.
21.
21.
21.
41.
21
0.9
1.1
0.9
0.8
0.9
0.9
1.1
P 2O
50.
20.
40.
20.
30.
20.
50.
40.
50.
50.
20.
10.
50.
60.
50.
60.
30.
20.
1
P%.0
36.0
84.0
31.0
35.0
36.0
05.0
06.0
05.0
05.0
63.0
39.0
18.0
34.0
18.0
19.0
13.0
11.0
39
CaO
10.
60.
82.
50.
73.
92.
23.
84.
40.
50.
42.
61.
92
3.1
4.6
5.9
3.2
MgO
1.7
1.7
1.7
1.6
1.7
0.7
0.9
0.7
0.8
1.6
1.7
0.5
0.6
0.5
0.6
1.2
1.3
1.6
SO3
1.4
0.9
0.9
3.1
13.
21.
22
2.4
11.
23.
31.
91.
93.
44.
15.
12.
2
Na 2
O0.
50.
40.
50.
70.
51.
20.
81.
11.
30.
40.
40.
50.
30.
50.
61
0.7
0.7
K2O
3.8
3.7
3.8
3.4
3.7
1.3
1.9
1.4
1.3
3.6
3.9
1.2
1.5
1.2
1.2
2.5
2.6
3.5
B/A
0.21
0.18
0.20
0.26
0.19
0.57
0.36
0.46
0.63
0.24
0.16
0.92
0.64
0.93
1.03
0.45
0.44
0.23
Vit
%85
.582
.784
.687
.387
.488
.286
.686
.989
.880
.477
78.3
6779
.383
.187
.388
.4
ex%
5.3
4.4
4.7
2.4
2.6
2.2
3.8
3.9
1.8
4.6
74.
58
4.7
2.3
3.5
1.6
SF%
4.6
6.3
4.9
4.6
5.1
3.9
4.7
3.1
3.7
8.2
910
.213
7.4
6.5
2.7
314
Mic
%2.
32.
73.
13.
32.
12.
51.
32.
42.
73.
26.
02.
05.
42.
73.
03.
95.
1
Fus%
2.3
3.9
2.7
2.4
2.8
3.2
3.6
3.7
23.
61
56.
65.
95.
12.
61.
93
TR
%93
.190
.391
.892
.092
.692
.492
.892
.493
.589
.188
.587
.981
.587
.788
.792
.291
.57.
0
Rm
ax%
0.94
0.94
0.95
0.97
0.96
0.97
0.95
0.96
0.97
0.96
0.96
0.94
0.95
0.94
0.97
0.96
SI41
.624
.447
.149
.643
.726
.724
.823
.821
.242
.247
41.7
38.6
37.1
39
star
tC°
398
398
397
403
398
393
391
395
393
394
396
393
394
388
403
fusC
°40
740
740
641
340
840
540
340
340
740
740
940
440
540
241
3
max
C°
436
436
435
440
437
438
432
432
438
437
437
438
436
438
439
fina
l C°
465
466
467
468
467
473
473
474
472
467
468
468
469
471
466
soli
d C
°46
846
947
047
147
047
647
647
747
547
047
147
147
247
446
9
rang
e C
°67
6870
6569
8082
7979
7372
7575
8363
ddpm
900
1110
1510
690
1120
6640
1559
012
150
4300
1680
2120
2750
1810
3450
400
sf T
C°
390
408
387
383
399
369
369
368
371
362
366
363
363
369
372
max
C C
°43
844
442
442
443
840
940
840
841
041
141
741
341
141
442
3
max
D C
°44
744
845
444
744
945
244
944
945
045
044
944
945
245
5
C18
1324
2717
3128
3030
3231
2930
2930
D-1
30
618
-11
151
174
167
144
7328
7178
110
33
FSI
88
88.
58
88
88.
58
0.5
Table 15. Coal quality, ash chemistry, petrography and rheological data for Plant D. BSCF=secondary cyclonefeed, SCOF=screen over flow, P=thermal product, FT=float tails, FC=filter cake, PC=primary cyclone
sects the X axis from 0.0% sulphur to about 0.6%sulphur and encloses samples containing pyriteand 0.0% to 0.6% organic sulphur. Points to theleft and above this band contain excess Fe2O3,which probably occurs as siderite, because Fe2O3
does not correlate with Al2O3 or SiO2 (Table 16).The raw coal B appears to contain more sideritethan A, though siderite tends to be removed by allcircuits and is concentrated in the coarse and finereject material (square symbols). Clean blends ofeach coal are represented by crosses and feed coalby solid symbols.
Coking tests were performed on number ofblends each composed of one of the coals butmade from different combinations of size frac-tions (Table 17). Maximum wall pressure wasdistinctly higher for blends using coal B. Theblend composition, rank and bulk density werethe same for the two coals, though the chargemoisture for coal B was about 1% higher and theash about 2% absolute higher. Usually a higherash content will reduce pressure. In this case var-ious sizes of washed coal A, which produced less
pressure, contain more exinite and less vitrinitethan coal B and this has the effect of increasingthe VMdaf value for coal A by 1.5% absolute(VMdaf 37.5% for coal A and 36% for coal B).Increased vitrinite content increases pressure,whereas exinite reduces pressure and because ofits very high volatile content will decrease cokeyield. The exinite contents of the raw coals aresimilar and it appears that more exinite is lostfrom coal B during washing, possibly indicatinga fundamental difference in the lithotypes.Exinite in both coals tends to concentrate in thecoarser size fractions The exinite content of high-volatile coals probably plays an important role inreducing maximum wall pressure. In this study asmall average increase in the exinite content ofthe washed blends of coal A seems to be respon-sible for a pressure decease from 7.3 kPa forblends of coal B to 1.1 kPa for blends of coal A.
Generally CSR has a negative correlation tothe alkalinity of samples, but in this case there isa positive correlation between MBI and CSR(Figure 21). Compared to coal B, Coal A hashigher CSR values associated with higher con-centrations of Fe2O3 and lower concentrations ofCa, Mg Na and K. The Fe2O3 probably occurs aspyrite and it appears that in this form it is lessdamaging to CSR than the other alkalies espe-cially CaO, which dominates Mg, Na and K inthe chemistry of coals A and B and probablyoccurs as calcite on cleats in vitrinite. In experi-ments additions of pyrite to coals produced thesame relative decrease in CSR as additions ofcalcite on a CSR versus MBI plot (Price et al.,1992) so it appears that the association of these
Geological Fieldwork 1998, Paper 1999-1 269
Figure 20. Approximate distribution of sulphur andiron between siderite, pyrite and organic sulphur.Coals A and B plant D. Open squares= reject mater-ial, solid diamonds=raw coal, open points =individ-ual circuits, x= blend of sizes, solid squares=metal-lurgical coal.
0
2
4
6
8
10
12
0 1 2 3 4
S%
Fe2O
3 t
otal
sam
ple
coal A
organic
pyrite
siderite
0
2
4
6
8
10
0 1 2 3 4
S%
Fe2O
3 to
tal
sam
ple
coal B
Table 16. Linear correlation matrix for ash chemistryand CSR data, blend coals A and B from Plant D.
Table 17. Plant D, Coal quality, ash chemistry, rheology, carbonization and coke texture data for blends of coalsA and B. HV= high volatile blend coal, E=coal from Plant E.
minerals in the natural samples influences howthey effect CSR. The empirical rule seems to bethat iron minerals are less destructive to CSRthan calcite.
The best correlation for CSR is with SO3
(Table 16, Figure 21), probably because SO3
represents the formation of sulphates in the ashfrom organic sulphur and alkalies as they arereleased during the destruction of carbonates andother minerals. Obviously this is an approximatemeasure of the more mobile alkali componentsin the ash. For this particular plant it might offerthe best way of estimating the CSR values ofpossible production blends. A similar though notas well defined trend is apparent in coals fromthe other plants (Figure 21).
Plant E
Plant E washes a low-volatile coal using 2circuits, a heavy medium cyclone circuit toprocess the plus 0.6 mm material and frothfloatation to process the minus 0.6 mm material.Product coal and a number of blends of productcoal with coal from individual plant circuitswere analyzed (Table 18).
Vitrinite is concentrated in the clean coaland fine coal feed (Figure 22). Despite the mod-
erate enrichment of vitrinite in the froth floata-tion feed and product, adding 10% product frothmaterial to clean coal did not increase vitrinitecontent and did no improve stability factor(Figure 22). It appears that the best improvementin stability can be achieved by removing theinert rich plus 20 mm material from the cleancoal, which accounts for about 5% of product.
The coal washes to a low ash ( 6% to 7%).Some blends were constructed to see what effectincreased product ash content would have oncoke quality. Blends composed of product coalplus additional feed or reject material were ana-lyzed to see if ash content and yield could beincreased without causing a major decrease incoke quality. It appears that a 2% increase in ashcontent reduces stability factor by about 20points (Figure 23). Obviously at this rank(Rmax = 1.6 %) coking properties are easilydestroyed by the addition of inert material.
The maximum wall pressure of the productcoal is quite high, as expected based on the highrank of the coal, but additions of small amountsof clean fine coal decrease pressure substantial-ly while having only a minor negative effect onstability factor (Figure 23). In terms of pressurethis is probably a good compromise but theincreased fines content will make the coal more
Geological Fieldwork 1998, Paper 1999-1 271
Figure 21. Relationship of CSR to SO3 for differentcoals with different sulphur contents from plantsA,B, C and D and relationship of CSR to MBI forcoals A and B from Plant D.
20
30
40
50
60
70
80
0 1 2 3 4 5 6
SO3 total sampleCSR Plant D
Plant B
Plant C
Plant A
0
1
2
3
4
5
6
7
8
0 10 20 30 40 50
CSR
mod
ifie
d ba
sici
ty i
ndex
solid diamonds=coal B
Figure 22. Vitrinite versus size and raw, feed andclean coal. Vitrinite versus stability factors, opendiamonds=blends, open square=clean coal with plus20 mm material removed, solid diamond=clean coal,solid square=clean coal with additional fines. Datafrom Plant E.
30
35
40
45
50
55
60
65
50 60 70 80
Vitrinite%
Stab
ilit
y Fa
ctor
40
45
50
55
60
65
70
1 1.5 2 2.5 3
viri
nite
%
raw
coa
l
froth floatation
clean coal
Raw cleanfeed
HMC
difficult to transport and handle.
CONCLUSIONS
Generally economics dictate that plants haveto maximize yield at a given specified clean ashcontent. Plants can not remove all the ash fromthe clean coal. This means that if the ash chem-istry varies by size consist or specific gravity, thenthere is the possibility of changing the ash chem-istry of product coal while at the same time hav-ing only a marginal effect on ash content and
yield. Before this is attempted it is important toknow what minerals are effecting the ash chem-istry and where they hide in the coal matrix. Thiscan be achieved using standard microscope tech-niques, but the process is helped by using linearcorrelation matrixes of oxide data. In some coals,carbonates in the clean coal increase the base/acidratio and decrease CSR values. A better under-standing of the coal plus carbonate associationwith regards to size and SG splits gives the plantoperator some flexibility to reduce base/acidratios without incurring a major loss of yield and
272 British Columbia Geological Survey Branch
Table 18. Coal quality, rheology, petrography and carbonization data, Plant E.
this has the potential to improve CSR values.Coal macerals fractionate in plants in at least
two ways. Firstly the vitrinite tends to concen-trate in the finer sizes and secondly if the macer-als are separated by crushing and washed usingdensity separation, then the inert macerals tendto concentrate in the intermediate SG fractionsand the vitrinite in the low density fractions.This pattern is confused in the coarser coal byincomplete liberation of the macerals and it issuspected that vitrinite tends to remain attachedto in-seam rock material while the inert maceralstend to be liberated. Fine coal is washed by frothfloatation using a wetting principle and it is notclear how this effects concentration of vitriniteinto the clean coal. It appears that compared tofine feed coal there is an enrichment of vitrinitein the fine clean coal.
Plants are becoming very efficient at recov-ering coal from the various circuits and it istherefore difficult to influence the maceral com-position of the clean coal. However it may bepossible to increase the recovery of vitrinite richcoal from the fine circuit while decreasing therecovery in the more inert rich coarse circuit.This will probably require accepting a loweryield and it appears that increasing the content offine vitrinite in the clean coal does not necessar-ily improve coke quality. Vitrinite enriched coalfrom fine circuits does not have the coke makingproperties that one would expect based on itsreactive content. The problem does not seem torelate to the predicted optimum amount of reac-
tives in a sample because most of the coals stud-ied are inert rich. Part of the effect may be sizerelated but there may also be a chemical compo-nent to the problem. It is possible that alterednon reactive vitrinite is concentrating in the finematerial. There is some indication that fine vit-rinite is oxygen deficient and may have experi-enced devolatilization or increase in rank causedby shearing or other geological process.
The size consist or Hardgrove Index of runof mine coal may indicate quality problems notapparent in proximate or petrographic analyses.Handling may not be the only problem associat-ed with sheared coal. Shearing may increasethe friability of vitrinite and decrease the rheol-ogy of some fine vitrinite grains. This is notunlike what is seen in artificial oxidation oralteration in underground mines where therehave been fires. Over production of fines at themine site may degrade coke quality by separat-ing reactive and non reactive vitrinite, with thenon reactive vitrinite concentrating in the finecoal. Addition of fine vitrinite rich coal is notguarantied to increase coke quality despite thefact that it improves FSI and possibly fluidity ofthe product.
In addition to the above general conclusions,a number of other more coal specific insightswere gained during the study.
Phosphorus is associated with the inert coalmacerals in the coarse and intermediate sizedcircuits. Unfortunately the fractionation of phos-phorus into the inert macerals is not completeand it is difficult to alter the washing character-istics of the various circuits to effect a decreasein phosphorus contents with out causing a sub-stantial decrease in yield.
Sulphur content is a concern in some high-volatile coals studied. Washing these coals sep-arately illustrates what each coal is contributingto the clean coal blend and by changing blendproportions possibly reduce the sulphur content.The sulphur is associated with high iron concen-trations indicating the presence of siderite.
In most coals there is a good negative corre-lation between base/acid ratio and CSR.However in coals rich in Fe2O3 this is not truebecause high iron concentrations in the ash, havea positive correlation with CSR. In fact in thesecoals the SO3 content in the sample is the bestindicator of the CSR value.
The low-volatile coal washes to a low ash
Geological Fieldwork 1998, Paper 1999-1 273
Figure 23. Variation of Stability Factor, CSR, ash andpressure (Kpa) for different blends of coal from plant E.
0
10
20
30
40
50
60
70
1 2 3 4 5 6 7 8 9
cl c
oal
30%
cl E
+ 7
0% H
V
24%
Ecl
+6%
Efd
+70
%H
V
30%
fee
d E
+70
% H
V
80%
cl+
20%
fee
d
95%
cl+
5% r
ejec
t
90%
cl+
10%
cl
fine
s
cl c
oal
<20
mm
90%
cl+
10%
fin
e re
ject
s
CSR
pressure Kpa
Ash
SF
content, and yield could be improved if a higherash product were produced. Unfortunately cokeproperties decrease markedly when the ash con-tent of the clean coal increases. Coke oven wallpressure is reduced with only small decreases instability factor values when small quantities ofclean fine coal are added to the product coal.
ACKNOWLEDGMENTS
Data for this study was collected as part of aCanadian Carbonization Research Associationproject and though not mentioned individuallymany members past and present of the technicalcommittee of the CCRA have provided ideas.As is apparent from the amount of data present-ed, the project represents the efforts of manypeople from plant engineers who helped collectbulk samples from difficult locations in theplants to the staff at the CANMET laboratorieswho performed the analyses. The fact that theproject proceeded emphasizes the importancethat coal mining companies in Canada place onthese types of cooperative industry governmentprojects. The paper benefited from the editorialcomments of Dave Lefebure.
REFERENCESBustin, R.M. (1982): The effect of shearing on the
quality of some coals in the southeasternCanadian Cordillera; Canadian Institute ofMining and Metallurgy Bulletin, Volume 75,pages 76-83.
Coin, D.A. (1995): Statistical analysis of industrial plantdata of coke production; ACARP Project C1605,Report Number OCA-0320, pages 1-10.2.
Gransden, J.F., Price, J.T. and Leeder, W.R. (1980):Coke making with Canadian medium and high-volatile commercial coking coals; CANMET,Report 80-4E.
Gransden, J.F., Price, J.T. (1982): Effect of mineralmatter on the coking properties of four westernCanadian coals; in Proceedings of the SecondTechnical Conference on western Canadiancoals, Canadian Institute of Mining, Paper 10,Edmonton June 2-4 1982.
Gill, W. W. (1982): Coke quality production models;Unpublished Report, BHP Central ResearchLaboratories, TC/39/82.
Goscinski, J.S., Gay, R.J. and Robinson, J.W. (1985):A review of American coal quality and itseffects on coke reactivity and after reaction
strength of cokes; Journal of Coal Quality,Volume 2 Part 1, pages 21-29.
Goscinski, J.S., Gay, R.J. and Robinson, J.W. (1985):A review of American coal quality and itseffects on coke reactivity and after reactionstrength of cokes; Journal of Coal Quality,Volume 4 Part 2, pages 35-43.
Goscinski, J.S. and Patalsky, R.M. (1989): CSR con-trol: a coal producers point of view; in IronMaking Proceedings, Iron and Steel Society/American Institute of Mining, Metallurgical andPetroleum Engineers, Volume 48, pages 50-65.
Lamberson, M.N. and Bustin, R.M. (1996): TheFormation of inertinite-rich peats in MidCretaceous Gates Formation: implications forinterpretation of Mid Albian history of paleow-ildfire; Paleogeography, Paleoclimatology,Paleoecology, 120, pages 235-260.
Mastalerz, M. and Bustin, R.M. (1993): Variation inelemental composition of macerals, an exam-ple of the application of electron microscopeto coal studies; International Journal of CoalGeology, Volume 22, pages 83-99.
Pearson, D.E. (1980): The quality of westernCanadian coking coal; Canadian Mining andMetallurgical Bulletin, pages 1-15.
Price, J.T. and Gransden, J.F. (1987): Metallurgicalcoals in Canada: resources, research, and uti-lization; Canadian Centre for Mineral andEnergy Technology, Report Number 87-2E,pages 1-71.
Price, J.T., Gransden, J.F., Khan, M A. and Ryan, B.D.(1992): Effect of selected minerals on high tem-perature properties of coke; Proceedings of the2nd International Cokemaking Congress,Volume 1, pages 286-292.
Price, J.T., Gransden, J.F. and Khan, M.A. (1988):Effect of the coking properties of westernCanadian coals on their coking behaviour; inProceedings of the 47th IronmakingConference, Iron and Steel Society/AmericanInstitute of Mining, Metallurgical andPetroleum Engineers, 47, pages 1545-1562.
Romaniuk, A.S. (1986): Canadian coal preparationplants; CANMET Energy and Mines Canada,Report Number 86-5, pages 1-45.
Ryan, B.D. and Price J,T. (1993): The predicted cokestrength after reaction values of BritishColumbia coals, with comparisons to interna-tional Coals; in Geological Fieldwork 1992,B.C. Ministry of Energy, Mines and PetroleumResources, Paper 1993-1, pages 507-516.
274 British Columbia Geological Survey Branch
Ryan, B.D. (1995): Calcite in coal from the Quinsamcoal mine, British Columbia, Canada, origin,distribution and effects on coal utilization; inGeological Fieldwork 1994, B. Grant, and J.M.Newell, Editors, B.C. Ministry of Energy,Mines and Petroleum Resources, Paper 1995-1,pages 245-256.
Ryan, B.D. and Grieve, D.A. (1996): Source and dis-tribution of phosphorus in British Columbiacoal seams; in Geological Fieldwork 1995, B.Grant, and J.M. Newell, Editors, B.C. Ministryof Energy, Mines and Petroleum Resources,Paper 1996-1, pages 277-294.
Ryan, B.D., Gransden, J. and Price, J. (1998):Fluidity of western Canadian Coals and Itsrelationship to other coal and coke properties;in Geological Fieldwork 1997, B.C. Ministry ofEmployment and Investment, Paper 1998-1,pages 27-1 to 27-17.
Ryan, B.D. and Khan, M. (1998): Maceral affinity ofphosphorus in coals from the Elk Valley coal-field, British Columbia; in Geological Fieldwork1997, B.C. Ministry of Employment andInvestment, Paper 1998-1, pages 28-1 to 28-19.
Ryan, B.D. and Ledda, A. (1998): A review of sul-phur in coal: with specific reference to theTelkwa deposit, northwestern BritishColumbia; in Geological Fieldwork 1997, B.C.Ministry of Employment and Investment, Paper1998-1, pages 29-1 to 29-21.
Schapiro, N. and Gray, R.J. (1964): The use of coalpetrography in coke making; Journal of theInstitute of Fuel, Volume 11, pages 243-242.
Todoschuk, T.W., Price, J.T. and Gransden, J.F.(1998): Simulation of industrial coking Phase2; in Iron Making Proceedings, Iron and SteelSociety/American Institute of Mining,Metallurgical and Petroleum Engineers,Volume 57, pages 1-17.