The Effect of Criteria Pollutant and GHG Damage Based Fees on Emissions from the US Energy System. Kristen E. Brown*, Daven K. Henze, Jana B. Milford University of Colorado Boulder Mechanical Engineering Dept. CMAS Conference 2014. - PowerPoint PPT Presentation
The Effect of Criteria Pollutant and GHG Damage Based Fees on Emissions from the US Energy System Kristen E. Brown*, Daven K. Henze, Jana B. Milford University of Colorado Boulder Mechanical Engineering Dept. CMAS Conference 2014
Transcript
The Effect of Criteria Pollutant and GHG Damage Based Fees on
Emissions from the US Energy System
Kristen E. Brown*, Daven K. Henze, Jana B. MilfordUniversity of Colorado Boulder Mechanical Engineering Dept.
CMAS Conference 2014
2Photo Credits: Commons.wikimedia.org/wiki/File:Air.pollution_1.jpg National Parks ServiceCommons.wikimedia.org/wiki/File:Respiratory_system.svg Drawn by Theresa Knott
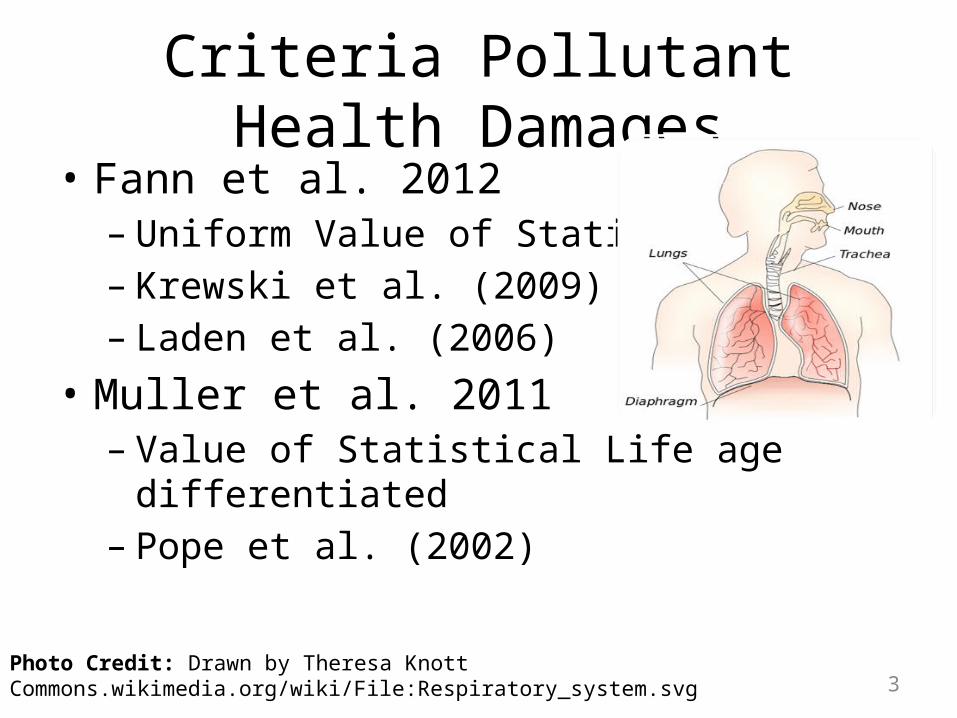
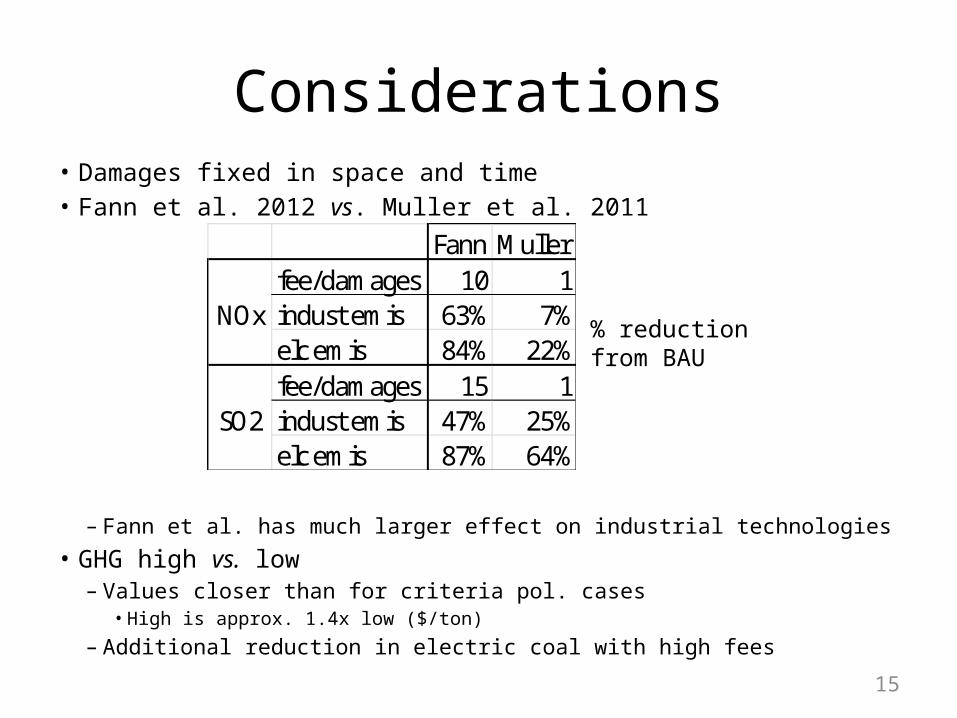
Criteria Pollutant Health Damages• Fann et al. 2012– Uniform Value of Statistical Life– Krewski et al. (2009) – Laden et al. (2006)
• Muller et al. 2011– Value of Statistical Life age differentiated– Pope et al. (2002)
3Photo Credit: Drawn by Theresa Knott Commons.wikimedia.org/wiki/File:Respiratory_system.svg
Elec
tric
Indu
stria
l
Tran
spor
tatio
n
Ups
trea
m
Refin
ery
Elec
tric
Indu
stria
l
Tran
spor
tatio
n
Ups
trea
m
Refin
ery
Resi
denti
al
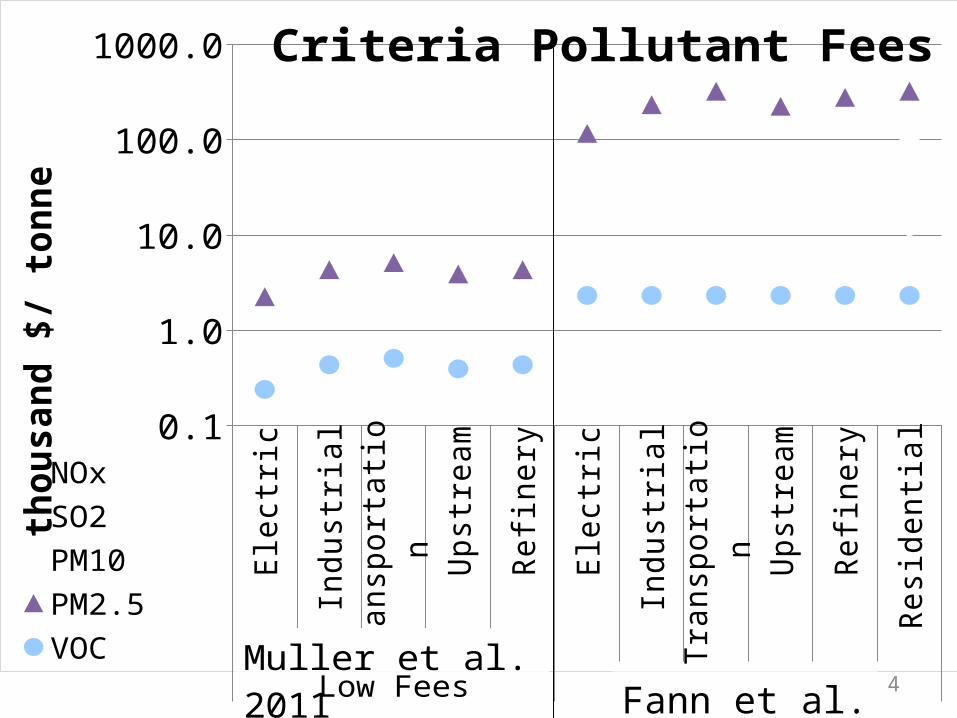
Low Fees High Fees
0.1
1.0
10.0
100.0
1000.0 Criteria Pollutant Fees
NOxSO2PM10PM2.5VOC
thou
sand
$/
tonn
e
Muller et al. 2011 4Fann et al. 2012
5
Climate Change Damages• Social Cost of Carbon– Interagency Working Group of the US Government
• Discount Rates– Central 2 of 4 estimates in report– 3% for low– 2.5% for high
• Applied to CH4 using GWP(100) = 28 (Myhre et al. 2013)
2015 2020 2025 2030 2035 2040 2045 2050 20550
20
40
60
80
100 GHG Fees
GHG LowGHG High
$(yr
200
5)/t
on C
O2
Uranium
Fossil Fuels
OilRefining & Processing
H2 Generation
Direct Electricity Generation
BiomassCombustion-BasedElectricity Generation
Nuclear Power
Gasification
Wind, Solar, Hydro
Carbon Sequestration
Industry
Industry
Commercial
Residential
Transportation
Primary Energy
Processing and Conversion of Energy Carriers End-Use Sectors
Conversion & Enrichment
6Dan Loughlin US EPA ORD 2011
MARKAL finds least cost way to meet energy demand
MARKAL
7
MARKAL updates• Results shown here use an edited version of EPAUS9R_12_v1.1• Emissions
– Upstream emissions• Better natural gas representation• Renewable technologies including biomass
– Sector specific emissions definitions– Calcination CO2 emissions from cement are included
• More industrial technologies – Solar process heat– Emissions controls (NOx, SO2, PM, CO2)– Efficiency improvements (boiler optimization)– Refinery emissions controls (SO2, PM, NOx, VOC)
• Light duty vehicle hurdle rate reduced to 18%• Coal EGU lifetime limited to 75 years from initial use
• Applicable changes made to 2012 database are currently being incorporated into 2014 release– Renewable cost projections from NREL
• Greg Frost• Shelly Miller• Mike Hannigan• EPA for the EPA US 9-
region MARKAL database
• Dan Loughlin • Nick Flores• Garvin Heath• NASA for funding• You for your
attention
17
References• Brown K.E., Henze D.K., Milford J.B., (2013): Accounting for
Climate and Air Quality Damages in Future U.S. Electricity Generation Scenarios. Environmental Science & Technology 47, pp. 3065–3072.
• Fann N., Lamson A.D., Anenberg S.C., Wesson K., Risley D., Hubbell B.J., (2012): Estimating the National Public Health Burden Associated with Exposure to Ambient PM2.5 and Ozone. Risk Analysis 32, pp. 81–95.
• Interagency Working Group on Social Cost of Carbon. (2013): Technical Support Document: Technical Update of the Social Cost of Carbon for Regulatory Impact Analysis Under Executive Order 12866.
• Muller N.Z., Mendelsohn R., Nordhaus W., (2011): Environmental accounting for pollution in the United States economy. American Economic Review, 101(5), pp. 1649–1675.
18
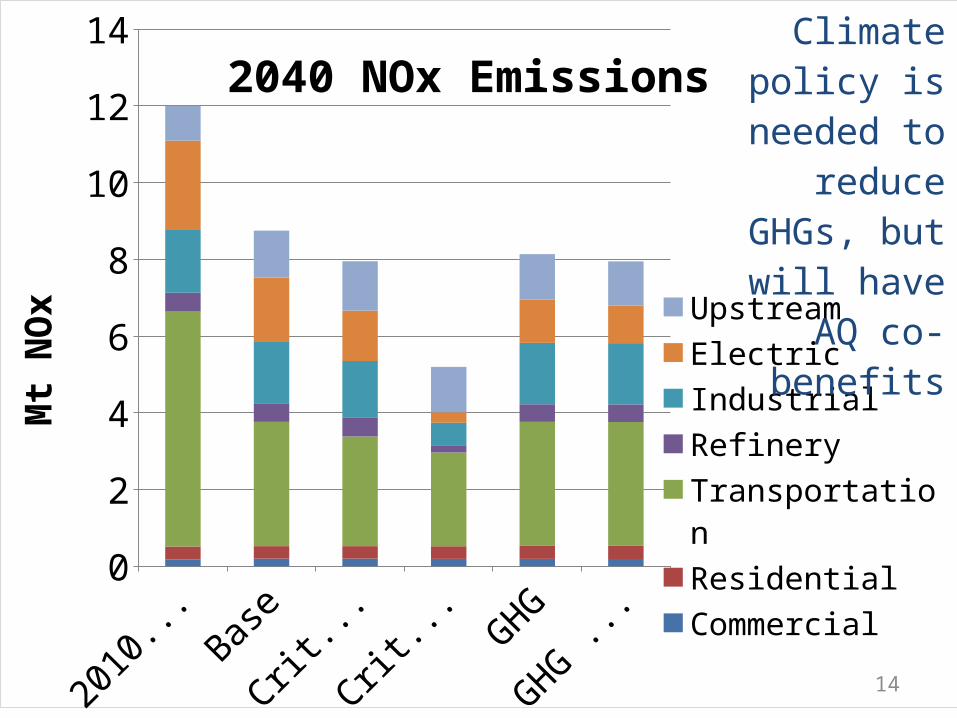
SO2
NO
x
SO2
NO
x
SO2
NO
x
SO2
NO
x
PM SO2
NO
x
SO2
NO
x
2010 Base
. Base . Crit Low
. Crit High . GHG Low
. GHG High
0
2000
4000
6000
8000
10000
12000
14000
16000
18000
20000
Electric Sector Controls
LNB+SCRLNB+SNCRSNCR onlyLNBFGDFabric Filtercoal use