Page 1
Dissertations and Theses
5-2007
The Effect of Display Design on Pilot Performance in Controlled The Effect of Display Design on Pilot Performance in Controlled
Flight into Terrain Scenarios Flight into Terrain Scenarios
Jeremy Charles Smith Embry-Riddle Aeronautical University - Prescott
Follow this and additional works at: https://commons.erau.edu/edt
Part of the Aviation Safety and Security Commons
Scholarly Commons Citation Scholarly Commons Citation Smith, Jeremy Charles, "The Effect of Display Design on Pilot Performance in Controlled Flight into Terrain Scenarios" (2007). Dissertations and Theses. 8. https://commons.erau.edu/edt/8
This Thesis - Open Access is brought to you for free and open access by Scholarly Commons. It has been accepted for inclusion in Dissertations and Theses by an authorized administrator of Scholarly Commons. For more information, please contact [email protected] .
Page 2
THE EFFECT OF DISPLAY DESIGN ON PILOT PERFORMANCE IN
CONTROLLED FLIGHT INTO TERRAIN SCENARIOS
THESIS
Presented to the MSSS Graduate Committee of Embry Riddle Aeronautical University in Partial Fulfillment of the Requirements
For the Degree of
Master of Science in Safety Science
By
Jeremy Charles Smith, BS
Prescott, Arizona May 5, 2007
Page 3
UMI Number: EP31860
INFORMATION TO USERS
The quality of this reproduction is dependent upon the quality of the copy
submitted. Broken or indistinct print, colored or poor quality illustrations
and photographs, print bleed-through, substandard margins, and improper
alignment can adversely affect reproduction.
In the unlikely event that the author did not send a complete manuscript
and there are missing pages, these will be noted. Also, if unauthorized
copyright material had to be removed, a note will indicate the deletion.
®
UMI UMI Microform EP31860
Copyright 2011 by ProQuest LLC All rights reserved. This microform edition is protected against
unauthorized copying under Title 17, United States Code.
ProQuest LLC 789 East Eisenhower Parkway
P.O. Box 1346 Ann Arbor, Ml 48106-1346
Page 4
THE EFFECT OF DISPLAY DESIGN ON PILOT PERFORMANCE IN CONTROLLED FLIGHT INTO TERRAIN SCENARIOS
The thesis of Jeremy C. Smith, in contribution to the College of Aviation, Embry Riddle Aeronautical University, under the title The Effect of Display Design On Pilot Performance in Controlled Flight Into Terrain Scenarios, is approved as partial fulfillment of the Master of Science in Safety Science.
Approval of Committee:
Committee Chair
Brian Peacock, Ph.D., PE, CPE Professor, Department of Safety Science
Committee Member
(well Fogleman, Ph.D., M.P.H. Assistant Professor, Department of Safety Science
Committee Member
/yCHmcy J. Currie, Ph.D. Deputy Director, Engineering Directorate
NASA - Johnson Space Center
-ii
Page 5
Table of Contents
List of Tables vii
List of Figures ix
Acknowledgements x
Abstract xi
Chapter 1 1
Introduction 1
Statement of the Problem 4
Need for the Study 4
Hypothesis 5
Limitations 5
Delimitations 7
Goals 7
Definitions of Terms 8
Chapter 2 10
Controlled Flight Into Terrain in General Aviation 10
Creation of the Synthetic Vision System Project 11
Synthetic Vision System Research 12
SVS Research in the General Aviation Context 12
Chapter 3 16
Methods 16
Participants 16
Experimental Apparatus Structure 17
-iii
Page 6
Experimental Design 20
Display Conditions 20
Scenarios 22
Participant Assignment Matrix 23
Experimental Procedures 25
Pre-Experiment Testing 25
Experimental Conduct 26
Data Capture 27
Data Reduction and Conditioning 27
Determination of CFIT 28
Determination of Display Safety Margin 28
Recognition Time Advantage 28
Avoidance Time Advantage 29
Data Analysis 30
Chapter 4 31
Data Refinement 31
CFIT Data Analysis and Results 31
CFIT Data Conditioning 31
CFIT Histograms and Main Factors Analyses 32
Logistic Regression of Display Condition with Respect to CFIT 35
Safety Margin Data Analysis and Results 37
Recognition Advantage Data Conditioning 37
Analysis of Display Use in Recognition 39
IV
Page 7
Analysis of Recognition Time Advantage 40
Avoidance Advantage Data Conditioning 41
Analysis of Display Use in Avoidance 43
Analysis of Avoidance Time Advantage 43
Chapter 5 46
Summary and Discussion of CFIT Data Analysis and Results 46
Discussion of CFIT Main Factors Results 46
Discussion of Logistic Regression of Display Condition
with Respect to CFIT Results 47
Summary and Discussion of Recognition Safety Margin Analysis
and Results 49
Summary and Discussion of Avoidance Safety Margin Analysis
and Results 50
General Discussion 52
Relationship to Existing Literature 52
Critique of Experiment 53
Implications of Results 54
Conclusion 56
Recommendations 57
References 58
Appendices 61
Appendix A: Complete Participant Description 62
Appendix B: Completed Experimental Matrix 63
v -
Page 8
Appendix C: ERAU Non-Disclosure Agreement
Appendix D: Experimental Training Script 65
Appendix E: Participant Simplified Approach Plate 73
Appendix F: Experimental Script for Scenario One 74
Appendix G: First and Last Data Points in Trial Data File
of 690 Data Points 78
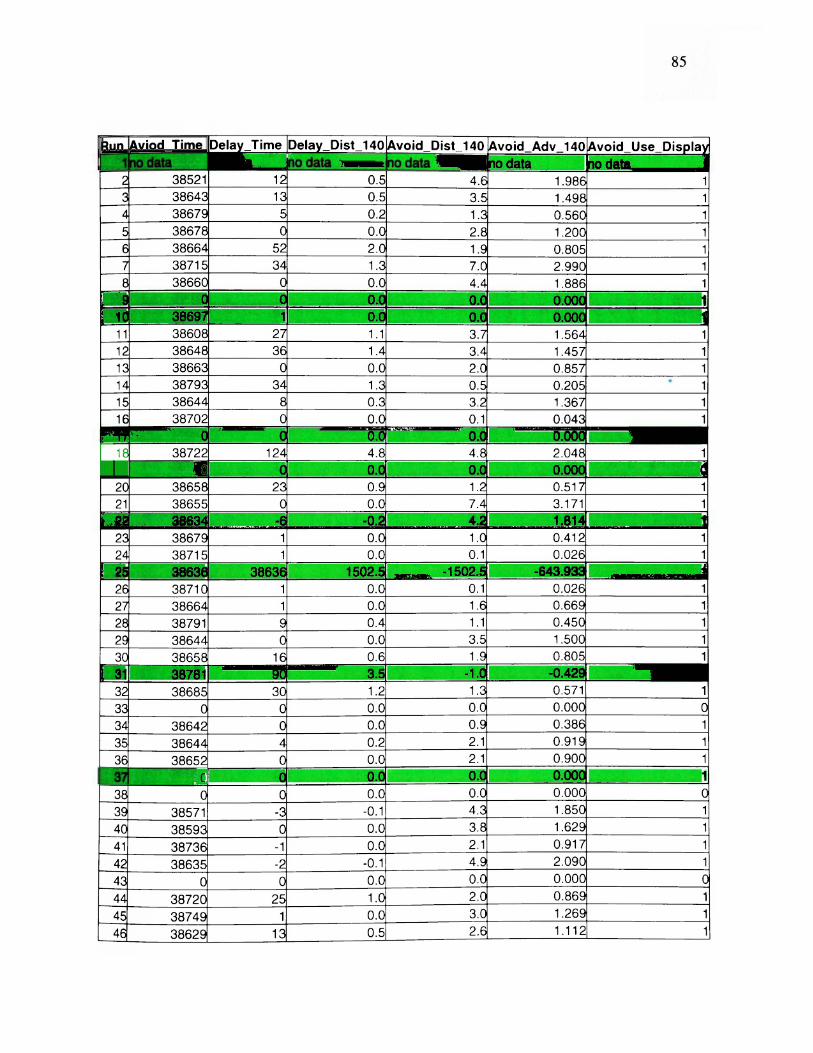
Appendix H: Full Data Table 79
Research Bibliography 93
- VI
Page 9
List of Tables
Table 1: Participant Descriptive Statistics Summary 17
Table 2: Experimental Matrix 24
Table 3: Summary of Data Points Removed From All Analysis 31
Table 4: Summary of CFIT Occurrences Across Each of the Main Factors 32
Table 5: Main Factor Chi-Square Test Results 35
Table 6: Results of SAS Logistic Regression CFIT Model One 36
Table 7: Results of SAS Logistic Regression CFIT Model Two 36
Table 8: Summary of Data Removed From Display Use in
Recognition Analysis 38
Table 9: Summary of Data Removed From Display Recognition Time
Advantage Analysis 39
Table 10: Results of SAS Logistic Regression For Display Use in
Recognition (Baseline as Reference) 40
Table 11: Results of SAS Logistic Regression For Display Use in
Recognition (KMD-540 EGPWS as Reference) 40
Table 12: Results of SAS ANOVA For Recognition Time Advantage 41
Table 13: Summary of Data Removed From Display Avoidance Use
Analysis 42
Table 14: Summary of Data Removed From Display Avoidance
Time Advantage Analysis 42
Table 15: Results of SAS ANOVA For Avoidance Time Advantage 44
- vii
Page 10
Table 16: Least Squares Difference Test Results 44
Table 17: Summary of Significant Least Squares Difference
Significant Condition Comparisons 51
- viii
Page 11
List of Figures
Figure 1: Schematic of Experimental Apparatus Structure 19
Figure 2: Experimental Apparatus 19
Figure 3: Baseline Display Condition (Display Condition One) 20
Figure 4: KMD-540 EGPWS Display Condition (Display Condition Two) 20
Figure 5: SVS Terrain Display Condition (Display Condition Three) 21
Figure 6: Enhanced PFD (E-PFD) Display Condition (Display Condition Four) 21
Figure 7: Summary Depiction of All Four Scenarios 23
Figure 8: Histogram of CFIT vs Trial 33
Figure 9: Histogram of CFIT vs Experience Category 33
Figure 10: Histogram of CFIT vs Display Condition 34
Figure 11: Histogram of CFIT vs Scenario 34
Figure 12: Plot of Recognition Time Advantage Per Display Condition 41
Figure 13: Plot of Avoidance Time Advantage Per Display Condition 43
Figure 14: Standardized Residuals Plot For Avoidance Time
Advantage ANOVA 45
Figure 15: Histogram of Recognition and Avoidance Time Advantages
for All Display Conditions 49
-ix
Page 12
Acknowledgements
I would like to thank Honeywell Aerospace for their funding of this project.
Without their dedication of equipment and financial resources this effort would not have
been possible. A special thank you is extended to Ms. Thea Feyereisen, Honeywell's
technical advisor for this project, for her constant support.
I would also like to thank my committee for educating and mentoring me during
the research experience. Dr. Peacock spent many hours explaining and concept mapping
the subtle intertwining of human factors concepts and this research effort. Dr. Fogelman
assisted with the numerous data analyses that had to be run, and more often than not
eventually run again. Dr. Currie took time from her official duties at NASA to ask the
telling questions. Her insight and experience helped me put my efforts into the real world
context of aviation and aerospace research. I would also like to thank Dr. Lawrence, an
Embry Riddle Aeronautical University professor, for her expertise in the APA style, and
Mr. Ken May for assisting in conducting many of the experimental runs.
My most heartfelt thanks go to my wife for her undying support for me during
this project. Through all the late nights and monologues, she never told me to stop
working or talking. She supported me while continuing to care for our three children and
family dog. As for the children, they provided the comic relief that only small children
can. Without trying, they too helped me complete this thesis.
x -
Page 13
Abstract
New technologies are being developed to prevent the continuing problem of
Controlled Flight Into Terrain (CFIT) accidents. One such technology, the Synthetic
Vision System, seems to hold the solution. While it is readily adapted to the commercial
aviation instrument environment, it may not be intuitive enough for the General Aviation
private pilot with minimal instrument training. This experiment attempted to examine
how pilots of every experience level use and interpret the depiction of synthetic terrain to
recognize and avoid potential CFIT situations. The outcome of CFIT was measured
against pilot experience and display condition.
-xi
Page 14
1
Chapter 1
Introduction
The Federal Aviation Administration (FAA) defines Controlled Flight Into
Terrain (CFIT) as "when an airworthy aircraft is flown, under the control of a qualified
pilot, into terrain (water or obstacles) with inadequate awareness on the part of the pilot
of the impending collision" (FAA, 2003). This definition, while it adequately describes
the factual circumstances of the event, does not consider why a pilot might lack the
requisite situational awareness (SA) to prevent such a collision. The pilot's SA may be
deficient due to any combination of the following features: insufficient processing of
available information, misinterpretation of available information, or information startle.
All of these possibilities share information processing in shortened time cycles. For
CFIT to occur, the ultimate outcome of these factors is either inappropriate control inputs
or a lack of time in which to make appropriate control inputs. The underlying common
characteristic is timely human information processing. For a CFIT to occur, the pilot
must have inadequate SA and insufficient time in which to reconstruct an accurate mental
picture of the surroundings. In these situations, when too much information is presented
with too little time for adequate processing, the result is high pilot workload. Therefore a
potential solution may lie in "augmented cognition," such as the presentation of synthetic
terrain images. By augmenting the pilot's SA with synthetic terrain, the display allows
the pilot more time to process the information and make an appropriate control input.
Although CFIT accidents occur in all areas of aviation, they are most prevalent in
General Aviation (GA). According to FAA records, 81% of all CFIT accidents occur in
GA operations. CFIT accidents are also the most deadly category of GA accidents.
Page 15
While 17% of GA fatalities are due to CFIT, 58% of GA CFIT accidents are fatal (FAA,
2002).
The United States military is not immune from CFIT accidents. In naval military
flight operations from 1983 to 1995, the U.S. Navy and U.S. Marine Corps lost roughly
ten aircraft per year to CFIT (Shappell and Wiegmann, 2001). During roughly the same
period, from 1987 to 1996, the U.S. Air Force calculated their losses to be almost two
billion dollars, 200 fatalities, and 100 aircraft (Moroze and Snow, 1999).
Commercial aviation also suffers from CFIT accidents. Between 1987 and 2004
CFIT was responsible for 25% of the worldwide jet fleet's fatal accidents, and these
accidents accounted for 38% of worldwide airline fatalities (Boeing, 2005). Despite the
descent and approach to landing phases of flight accounting for only 27% of a flight's
total time, 70% of CFIT accidents occur during these final phases (Scott, 1997). Clearly,
another tool to assist pilots in making critical time dependent decisions and avoid CFIT
would be invaluable to the aviation industry.
Initial efforts to curtail CFIT accidents centered on "warn and respond" style
terrain awareness and warning systems (TAWS). The first such system, mandated for
commercial aircraft use in the mid 1970s by the FAA, was the Ground Proximity
Warning Systems (GPWS). However, GPWS design limitations made the system only
marginally effective. When rising terrain and projected flight path criteria were met, the
flight crew was "warned" via an aural alert. Based on usage and experience, the pilots
knew they then had 10-15 seconds to "respond" by initiating a control input. Although
false warnings, no warnings, and delayed crew response plagued the imperfect system,
Page 16
3
GPWS can account for a CFIT reduction from about nine per year before its
implementation to about four per year afterwards (Gurevich, 1991).
CFIT accidents continued; in 1997 the Gore Commission on Aviation Safety
identified CFIT as a significant risk to aviation safety. The report recommended that all
commercial and military passenger aircraft be equipped with an Enhanced GPWS
(EGPWS) (Gore, 1997). EGPWS is GPWS with a "look-ahead" component that uses the
aircraft's current flight path and the system's terrain database to predict a potential
aircraft impact with terrain. It has been shown to provide the flight crew up to 60
seconds of time in which to react. Despite these advances in technology CFIT accidents
continue to occur.
As computers become faster, less costly, and more reliable, state of the art
computerized avionics and their displays are integrated more completely with proven
cockpit instrumentation. To provide pilots more advanced TAWS, several companies are
developing different avionics systems that integrate existing cockpit displays with the
latest in terrain mapping technology. By assimilating EGPWS with the Flight
Management System (FMS) and Heads Up Display (HUD) symbology, then combining
the display with a terrain depiction display, these technologies are then fully integrated
into the pilot's electronic Primary Flight Display (PFD). This new type of PFD is
generally referred to as a Synthetic Vision System (SVS). Concerning terrain awareness,
SVS is different from EGPWS in its fundamental philosophy of information presentation.
While available terrain avoidance systems have been built on "warn and respond"
architecture, SVS shows the existing terrain as one would see it from the cockpit. The
terrain on the PFD is always depicted as if it were day with clear skies and unlimited
Page 17
4
visibility, regardless of reality's time of day or meteorological conditions. By constantly
providing a digital reproduction of the surrounding terrain, SVS designers intend to
provide pilots with the information required to avoid a CFIT situation. Most importantly,
the display recreates what the pilot expects to see from the cockpit window in an easy to
understand and timely format. This "augmented reality" should assist in reducing pilot
workload to maintain SA.
Statement of the Problem
Despite continued TAWS development, CFIT accidents still occur in all
categories of aviation. To prevent these events, a display that enhances a pilot's ability to
maintain situational awareness in all meteorological conditions under any flight regime
must be developed. Integral to such a display's development is the knowledge if a single
instrument, or a particular combination of instruments contained within an avionics
package, assists pilots in making timely decisions to avoid CFIT. The research challenge
is to reliably quantify the time advantage of such innovative displays regarding terrain
awareness and CFIT prevention.
Need for the Study
Current research concentrates on how combinations of technologies and their
associated symbology improve the instrument rated pilot's performance in commercial
aviation CFIT scenarios. However, little experimentation has been conducted to
investigate if the technology is effective enough for both experienced and inexperienced
pilots; or to investigate the effect each single technology has on pilot performance. This
Page 18
5
study will add to our understanding of how effective the SVS display concept is at
preventing CFIT among all pilots at any level of experience and training. It will also
examine each addition of technology individually to study their respective effects on pilot
performance.
Hypothesis
The most complex primary flight display, the one that incorporates both EGPWS
and SVS components, will provide pilots of all experience levels the most effective
information needed to assist in the timely identification and avoidance of potential CFIT
situations.
Limitations
The following limitations are identified:
• This study will use a commercially available low fidelity flight simulation
program, Microsoft Flight Simulator (MSFS), on a fixed base platform as
the main investigative medium. Therefore, no vestibular or proprioceptive
cues are available to the participants during the simulation. The
simulation will be conducted in a quiet room, but lacks any aircraft mock-
ups. This combined lack of ecological validity may influence some
participants not to exhibit the same behavior in the simulation as they
would in a real aircraft. Therefore, the acknowledgement of impending
terrain, or a reaction to it, may be inconsistent with real world behaviors.
Page 19
6
• Only one company's SVS system will be tested. The purpose of the
experiment is to test participant's reaction to depicted terrain. Since there
are limited sources for digital maps of the earth's surface, and all are on
the same relative scale, the inter-company differing styles of terrain
depiction was not deemed a significant factor in determining when
participants would react to the terrain. The accuracy of the terrain
depiction was not identified as being overly important, just that terrain was
present and readily identifiable.
• Data capture will be via FLTREC v9.0, a third party software plug-in for
MSFS 2004. Data capture rate is set at once per second. Based on
preliminary tests, the data capture software has minimal, if any, impact on
the performance of the MSFS software.
• The majority of participants will be selected from the flight instructors and
flight students of Embry Riddle Aeronautical University's Prescott,
Arizona (AZ) flight instruction program. The sample population
identified represents the population of interest and no adverse impacts are
anticipated.
• Experienced participants will be selected from the Prescott, AZ area's
population of rated Airline Transport Pilots. These participants are
currently flying for or have recently retired from the commercial airline
industry and have extensive job experience flying for major commercial
airline carriers.
Page 20
Delimitations
The following delimitations are identified:
• Each participant will fly all display conditions. The displays contain
various combinations of the advanced display symbology, engine
instruments, a plan view moving map, an EGPWS, and a SVS. Since all
scenarios contain a CFIT element, it is anticipated that as the participants
progress through the experiment they will learn the general context of the
experiment and adapt their behavior and responses accordingly.
• The study requires the participants to follow simulated Air Traffic Control
(ATC) vectors to intercept an Instrument Landing System (ELS) final
approach course into a terrain challenged airport in simulated Instrument
Meteorological Conditions (IMC).
Goals
The results of this research should provide data useful in the evaluation of this
new technology with regard to CFIT and aid in the comparison of the individual display
technologies. Specifically, data collected should:
• Provide the means to conclude if a particular display configuration is best
at aiding the pilot in avoiding a CFIT event; and
• Quantify the Safety Margin, defined as the time advantage available to a
pilot to recognize and avoid a potential CFIT situation, for each display
configuration.
Page 21
8
Definitions of Terms
ANOVA- Analysis of Variance
ATC- Air Traffic Control
ATP- Airline Transport Pilot
AZ- Arizona
Baseline Display Condition (Display Condition 1)- The experimental display condition
that included the advanced symbology, engine instruments, gear and flap indicators, and
a plan view moving map.
CFIT- Controlled Flight Into Terrain- CFIT occurs when an airworthy aircraft is flown,
under the control of a qualified pilot, into terrain (water or obstacles) with inadequate
awareness on the part of the pilot of the impending collision (FAA 2003)
EGPWS- Enhanced Ground Proximity Warning System
ERAU- Embry Riddle Aeronautical University
E-PFD- Enhanced Primary Flight Display (Display Condition 4)- The experimental
display condition that included both the EGPWS on the KMD-540 display and the
synthetic terrain being depicted on the PFD. It was an amalgamation of Display
Conditions 2 and 3.
FAA- Federal Aviation Administration
FLTREC v9.0- A third party software plug-in for MSFS 2004 used to collect data
FMS- Flight Management System
GA- General Aviation
GPS- Global Positioning System
GPWS- Ground Proximity Warning System
Page 22
9
HUD- Heads Up Display
IFR- Instrument Flight Rules
ILS- Instrument Landing System
IMC- Instrument Meteorological Conditions
JSAT- Joint Safety Implementation Team
KMD-540 EGPWS Display Condition (Display Condition 2)- The experimental display
condition that added the EGPWS information on a Bendix/ King KMD-540 multi
function display to the Baseline Display Condition. It is analogous to current commercial
aviation cockpit displays that incorporate an EGPWS component.
MFD- Multi-Function Display
MSFS- Microsoft Flight Simulator
NASA- National Aeronautics and Space Administration
PFD- Primary Flight Display
S A- Situational Awareness- S A means the pilot is aware of what is happening around the
pilot's aircraft at all times in both the vertical and horizontal plane. This includes the
ability to project the near term status and position of the aircraft in relation to other
aircraft, terrain, and other potential hazards (FAA 2003)
SVS- Synthetic Vision System
SVS Terrain Display Condition (Display Condition 3)- The display condition that added
the synthetic vision system terrain to the Baseline Display Condition. It has no computer
enhanced EGPWS component.
TAWS- Terrain Awareness and Warning System
VMC- Visual Meteorological Conditions
Page 23
10
Chapter 2
Controlled Flight Into Terrain in General Aviation
In the context of General Aviation (GA) Controlled Flight Into Terrain (CFIT)
accidents, one must understand how these accidents occur before a potential solution is
developed. A Volpe Institute study (1997) of GA accidents from 1983 to 1994 found that
4.7% occur due to CFIT and 32% of GA IMC accidents were CFIT. Examination of the
cases found that IFR-rated pilots over the age of 50 had significantly more CFIT
accidents than those under 50 years of age. They also found that the number of CFIT
accidents in IMC were significantly greater than those occurring in Visual
Meteorological Conditions (VMC).
Shappell and Wiegmann (1998) took a different approach to analyzing GA CFIT
accidents. Looking at accidents from 1990-1998, they used the Human Factors Analysis
and Classification System (HFACS) to find where causal factors exist. They found
significant results in Unsafe Acts of Operators, classified as Perceptual Errors and
Violations, and in Substandard Conditions of Operators, classified as Adverse Mental
Stress, Physical/ Mental Limitations, Crew Resource Management, and Personal
Readiness. When they examined analyzed the accidents in the context of meteorological
conditions, they found the same causal factors to be significant. This suggests that
lighting and weather may not influence a CFIT accident to the extent many believe.
However, they offer several explanations of the data that support the conclusion that
lighting and meteorological conditions do increase the risk for a CFIT event. Chief
among these is that pilots who flew from VMC to IMC committed more mistakes that
eventually led to a CFIT event.
Page 24
11
Shappell and Wiegmann (1998) and the Volpe Institute (1997) both found IMC to
be a risk factor for CFIT accidents. While the 1997 Volpe Institute study also found age
in instrument rated pilots to be a risk factor, Shappell and Wiegmann did not investigate
age or training in their HFACS analysis. The effect of pilot training on CFTT occurrence
is not specifically investigated as a stand alone factor in either study. These two
comprehensive studies of GA CFIT accidents seem to suggest that age and
meteorological conditions are the predictive factors to a CFIT event.
Creation of the Synthetic Vision System Project
Recognizing the importance of implementing effective solutions to combat CFIT
accidents, the Federal Aviation Administration (FAA) created the CFIT Joint Safety
Implementation Team (JSAT) as part of their Safer Skies program. Chartered to reduce
accidents rates from 1996 to 2007, the CFIT JSAT created a list of program priorities
educate pilots and raise CFIT accident awareness (FAA, 2000).
The CFIT JSAT also identified equipment development and installation as a
priority in preventing CFIT. To this end, the National Aeronautics and Space
Administration (NASA) researchers at Langley Research Center began development of a
new technology called the Synthetic Vision System (SVS). The general objective is "to
develop cockpit display systems with intuitive visual cues that replicate the safety and
operational benefits of flight operations in clear day Visual Meteorological Conditions"
(Baize, 2000, p. 5). According to the project plan, the end goal is to "develop
technologies with practical applications that will eliminate low visibility conditions as a
causal factor to civil aircraft accidents" (Baize, 2000, p. 5).
Page 25
12
Synthetic Vision System Research
In developing the SVS display much effort has been devoted to the technical
engineering and design aspects of the SVS display. Studies to analyze display size, field
of view, symbology and other details, with respect to clutter and attention tunneling, have
yielded a plethora of information for display engineers to consider in their designs. The
addition of terrain and how to best depict it has further broadened the scope of research.
However, by augmenting reality the intent is to increase the time allotted to pilots in
which to make decisions by decreasing their workload. To effectively demonstrate the
concepts viability, SVS displays must be evaluated in the flight environment by their
intended users.
The efficacy of the SVS concept is readily accepted by most. Seemingly, based in
part on the volume of research in the area, of particular interest is the application of SVS
displays in commercial aviation. This may be due in part to the high visibility of this
subset of the aviation industry; or it may be due to the financial impact a major CFIT
event has on commercial aviation and the nation's economy. This research has
demonstrated its effectiveness in aiding skilled Airline Transport Pilots in recognizing
and avoiding potential CFIT situations in commercial flight operations. What is not as
well documented is how well inexperienced private pilots perform with SVS displays.
SVS Research in the General Aviation Context
The effort to reduce GA CFIT accidents has adopted a two prong approach. One,
the human centered approach, was the focus of the FAA JSAT. Shappell and Wiegmann
Page 26
13
(1998) conclude that many of the intervention strategies recommended by the JSAT
directly address some of the CFIT causal factors identified in their HFACS analysis.
The other avenue to prevent CFIT has been led by NASA. That agency has
conducted a multitude of studies to explore many facets of the SVS concept. Their
efforts in developing the synthetic vision display have been shown to be effective for
commercial aviation. Since in-depth analyses of GA CFIT accidents indicate that
meteorological conditions and pilot age are important factors in GA CFIT accidents, a
more thorough understanding of the effectiveness of the technology in these contexts
needs to be developed.
An early study by Uhlarik, Peterson, and Herold (1998) investigated how
responses to depicted terrain varied by pilot experience. Their study examined how high
time, low time, and non-pilots perceived differences in depictions of static two and three
dimensional terrain renderings on the primary flight display. Using Signal Detection
Theory, they examined each group's ability to detect a potential CFIT situation and the
strategy employed to eliminate the hazard. They found that a pilot's ability to detect and
avoid a potential CFIT increased with their experience, and that the actions taken to avoid
the CFIT event differed between high time pilots and low time and non-pilots. They
concluded that a "terrain enhanced primary flight display" had the potential to assist in
CFIT occurrence reductions. While the study suggests that high time pilots will benefit
most from this display type, it was limited in that only static terrain was shown to
participants. As the display technology matured the experiments started incorporating
moving visuals.
Page 27
14
A more recent investigation into how effective SVS displays are at preventing
CFTT during VMC to IMC transitions was conducted by Takallu, Wong and Uenking
(2002). In their experiment they specifically investigated how 18 low time general
aviation pilots performed a series of basic flight maneuvers as they transitioned from
VMC to IMC. The flight maneuvers were conducted with three displays of increasing
complexity and the differences in performance were measured between the displays to
calculate flight errors. The results indicate increased pilot performance, in the form of
fewer flight errors, when pilots had the SVS display. This study shows that the SVS
concept is intuitive enough for pilots with no formal instrument training to maintain the
situational awareness required to avoid CFIT.
Prinzel et al. (2003) conducted an experiment to analyze the effect of pilot
experience in CFIT avoidance when transitioning from VMC to IMC. Their study of low
time VFR pilots, with minimal instrument training, and experienced instrument rated
pilots started with an altimeter setting error. As the participants transitioned from VMC
to IMC the error placed the aircraft below the terrain altitude depicted on the SVS
display. Only two of the 14 VFR pilots, and none of the 13 instrument rated pilots,
committed a CFIT error. One of those pilots who experienced a CFIT event recorded
flight parameters well outside the accepted standards. Contrary to Uhlarik's et al. (op
cit.) findings, their study effectively demonstrated the effectiveness of the SVS display at
preventing CFIT in low time VFR pilots. However, their study does support Takallu's et
al. (op cit.) conclusion that SVS displays are effective at preventing CFIT during VMC to
IMC transitions.
Page 28
15
In 1999, Barrows, Alter, Jennings, and Powell conducted a series of flight trials in
Alaska to test a Stanford University developed PC-based synthetic vision system. Their
system incorporated navigation guidance in the "tunnel-in-the-sky" format and was test
flown on approaches in mountainous terrain. The system, flown onboard both a Piper
Dakota and Beechcraft Queen Air, allowed the pilots to fly precise navigation paths with
small vertical and horizontal error. The study documents the applicability of a low-cost
SVS system in the GA instrument environment; however it does not mention the
experience levels or ages of the pilots who participated in the study.
All of the studies found demonstrate the effectiveness of the SVS concept at
preventing CFIT in specific contexts. Takallu et al. (op cit.) and Prinzel et al. (op cit.)
found the displays effective for low time VFR pilots when transitioning from VMC to
IMC. Contrary to Uhlarik et al. (op cit.), Prinzel et al. (op cit.) also concluded the
displays were just as effective for low time VFR pilots as when used by experienced
instrument rated pilots. Barrows et al. (op cit.) showed that the synthetic vision display
can be effectively implemented in a cost effective manner in the general aviation
environment. However, the experiments have included multiple SVS displays, each with
different characteristics. This study will examine how effective a single SVS display,
designed for use in the instrument environment, is when used by pilots of varying
experience levels.
Page 29
16
Chapter 3
Methods
The experiment's goal was twofold. One objective was to statistically conclude if
a particular display configuration was best at aiding the pilot in avoiding a CFIT event.
The other was to quantify the increase in time available to a pilot to recognize and avoid
a potential CFIT situation for each display configuration. These outcomes were
measured against trial, experience, scenario, and display condition to determine if those
were significant factors in pilot performance.
Participants
Four categories of participants, to collect data for pilots of varying training and
experience levels, were defined based on their total instrument time. Total instrument
time was considered to be instrument time logged in either actual or simulated conditions.
The baseline subject group, the private pilots, had minimal formal instrument training
beyond that required for a private pilot license. These pilots were recruited from the
student pilots at Embry Riddle Aeronautical University's (ERAU) flight instruction
program in Prescott, Arizona. The second two groups were instrument rated pilots of
different experience levels. Based on the sample's average total instrument time, a cutoff
point of 100 hours was selected. This was done to divide the participants into low time
instrument pilots and high time instrument pilots. Members of these participant groups
were also recruited from ERAU's flight instruction program in Prescott, AZ. The
majority of these pilots, all except for three, were current Certified Flight Instructors with
an Instrument endorsement. The fourth participant group consisted of rated Airline
Page 30
17
Transport Pilots (ATP) who were currently employed by, or had recently retired from,
commercial airline carriers. ATPs were recruited from the local area via faculty and
student contacts. Due to limitations in recruiting ATPs for the experiment, only six were
included. For the remaining two participants, one was a private pilot and the other was a
high time instrument pilot. Only two participants were female. Table 1 summarizes the
participants' descriptive statistics.
Participant Group
Private Pilot Number of Participants Average Standard Deviation
Low Time Instrument Pilot Number of Participants Average Standard Deviation
High Time Instrument Pilot Number of Participants Average Standard Deviation
Airline Transport Pilot Number of Participants Average Standard Deviation
Age
n=9 22.2 2.4
n=8 24.5 5.1
n=9 25.3 2.5
n=6 57.2 8.1
Total Time
163.1 115.9
866.3 975.6
821.4 430.7
20000 4939.6
Instrument Time
26.7 31.3
65.5 25.7
153.9 72.7
16708.3 3083.9
Table 1: Participant Descriptive Statistics Summary
A complete description of the participants is in Appendix A.
Experimental Apparatus Structure
The experimental apparatus consisted of two computers with displays and user
input devices, an EGPWS displayed on a Bendix/ King KMD-540 multi-function display
(MFD), and a CH Products Flight Sim USB yoke. The first computer was a laptop
Page 31
18
computer and ran the flight simulation software Microsoft Flight Simulator 2004
(MSFS). Also running was a third party plug-in that collected data for analysis called
FLTREC v9.0. The first computer was linked by an ethernet cable to a second that
incorporated the received MSFS data with its own SVS program to display the integrated
information to the participant. This second computer also received data input from the
EGPWS that was included in the fully enhanced SVS display.
The participant's PFD was displayed on a twenty-three inch flat screen monitor
set at 1920 x 1200 dpi resolution. The USB yoke, used by the participant to fly the
simulation, was connected back to the first computer (since it was running MSFS).
Depending on the display condition flown, the participant may also have had a KMD-540
multi-function display that provided the EGPWS information directly (before inclusion in
the enhanced PFD) to the participant.
The first computer was used to control the experimental scenarios and interact
with the participant via MSFS. The participant was unable to view the first computer's
display and the researcher's inputs were unnoticed by the participant. Figure 1 illustrates
the apparatus set-up. Figure 2 shows the actual experimental apparatus set-up as it was
tested.
Page 32
19
Participant's Display
PFD: Advanced symbology always depicted
May or may not have Terrain (SVS) or EGPWS displayed
Eng Inst
Flaps Gear
Moving Map
2nd PC w/ SVS
software
a a
KMD-540 MFD
EGPWS
Participant's USB Yoke
First PC w/ MSFS and data collection
Figure 1: Schematic of Experimental Apparatus Structure
Participant's Display
KMD-540 Display
SVS Computer
USB Yoke Laptop Computet
Figure 2: Experimental Apparatus
Page 33
20
Experimental Design
Display Conditions
Four display conditions were developed. The display with the least information
was defined as the Baseline Display Condition, or Display Condition One. It consisted of
the PFD with advanced symbology, a plan view moving map, the engine instruments, and
gear and flaps indicators. It is depicted in Figure 3.
PFD: Advanced symbology always depicted
Eng Inst
Flaps Gear
Moving Map
Figure 3: Baseline Display Condition (Display Condition One)
The next increase in complexity was the Baseline Display Condition with the
Enhanced Ground Proximity Warning System (EGPWS) displayed on the KMD-540
MFD and is shown in Figure 4. It was called the KMD-540 EGPWS Display Condition
or Display Condition Two.
PFD: Advanced symbology always depicted
Eng Inst
Flaps Gear
Moving Map
EGPWS on KMD-540 MFD
Figure 4: KMD-540 EGPWS Display Condition (Display Condition Two)
Page 34
21
The third display tested was the Baseline Display Condition with the SVS terrain
depicted on the PFD. This condition did not include an EGPWS component; therefore
the KMD-540 MFD was not energized and EGPWS warnings were not integrated into
the PFD. Depicted in Figure 5, it was called the SVS Terrain Display Condition or
Display Condition Three.
PFD: Advanced symbology always depicted
Includes synthetic terrain (SVS) without EGPWS integration
Eng Inst
Flaps Gear
Moving Map
Figure 5: SVS Terrain Display Condition (Display Condition Three)
The final display condition was the Baseline Display Condition with both
EGPWS and SVS components. This fully enhanced display had the EGPWS portrayed
on the KMD-540 MFD and on the terrain on the PFD. It was called the Enhanced
Primary Flight Display (E-PFD) Display Condition, or Display Condition Four, and is
illustrated in Figure 6.
PFD: Advanced symbology always depicted
Includes synthetic terrain (SVS) with EGPWS integration
Eng Inst
Flaps Gear
Moving Map
EGPWS on KMD-540 MFD
Figure 6: Enhanced PFD (E-PFD) Display Condition (Display Condition Four)
Page 35
22
Scenarios
The four scenarios were developed to test the identification of a CFIT situation
and its final outcome under different circumstances. The intent was to develop four
statistically not different scenarios to add to the robustness of the experimental design
and the conclusions.
All scenarios started from the same initial conditions and required the participant
to intercept an Instrument Landing System (ILS) final approach course. At a
predetermined point in each scenario the researcher induced deviations by issuing go
around instructions. In the first, third, and fourth scenarios the participant flew the
approach to a defined end point and was given missed approach instructions. The
instructions included a heading and altitude that placed the aircraft on a flight path into
rising terrain. The scenario was complete when the participant either experienced a CFIT
event or maneuvered the aircraft clear of the terrain. The second scenario required the
participant to leave the ILS approach and fly assigned vectors for simulated emergency
traffic inbound to the airport. The vectors given placed the participant in a CFIT
situation. This scenario was complete once the participant either impacted the terrain or
completed the necessary control inputs to avoid the CFIT. The four scenarios are
summarized in Figure 7.
Page 36
23
Scenario 1
Scenario 4
Scenario 2
Scenario 3
Figure 7: Summary Depiction of All Four Scenarios
Participant Assignment Matrix
Based on a Greco-Latin square design, each participant was assigned a different
display condition and scenario for each of the four trials. With 32 participants, two
replications of each experience, condition, and scenario order were designed. The
experimental design matrix is shown in Table 2.
Page 37
24
Replicate 1
Replicate 2
1
2 3 4 5 6 7 8 9 10 11 12 13 14 15 16 17
18 19 20 21 22 23 24 25 26 27 28 29 30 31 32
T1 E1
E2
E3
E4
E1
E2
E3
E4
E1
E2
E3
E4
E1
E2
E3
E4
E1
E2
E3
E4
E1
E2
E3
E4
E1
E2
E3
E4
E1
E2
E3
E4
C1
C1
C1
C1
C4
C4
C4
C4
C3
C3
C3
C3
C2
C2
C2
C2
C1
C1
C1
C1
C4
C4
C4
C4
C3
C3
C3
C3
C2
C2
C2
C2
S1
S2
S3
S4
S4
S3
S2
S1
S2
S4
S1
S3
S3
S1
S4
S2
S1
S2
S3
S4
S4
S3
S2
S1
S2
S4
S1
S3
S3
S1
S4
S2
T2 E1
E2
E3
E4
E1
E2
E3
E4
E1
E2
E3
E4
E1
E2
E3
E4
E1
E2
E3
E4
E1
E2
E3
E4
E1
E2
E3
E4
E1
E2
E3
E4
C2
C2
C2
C2
C3
C3
C3
C3
C1
C1
C1
C1
C4
C4
C4
C4
C2
C2
C2
C2
C3
C3
C3
C3
C1
C1
C1
C1
C4
C4
C4
C4
S4
S3
S2
S1
S2
S4
S1
S3
S3
S1
S4
S2 S1
S2
S3
S4
S4
S3
S2
S1
S2
S4
S1
S3
S3
S1
S4
S2 S1
S2
S3
S4
T3 E1
E2
E3
E4
E1
E2
E3
E4
E1
E2
E3
E4
E1
E2
E3
E4
E1
E2
E3
E4
E1
E2
E3
E4
E1
E2
E3
E4
E1
E2
E3
E4
C3
C3
C3
C3
C2
C2
C2
C2 C4
C4
C4
C4
C1
C1
C1
C1
C3
C3
C3
C3
C2
C2
C2
C2
C4
C4
C4
C4
C1
C1
C1
C1
S2
S4
S1
S3
S3
S1
S4
S2
S1
S2
S3
S4
S4
S3
S2
S1
S2
S4
S1
S3
S3
S1
S4
S2 S1
S2
S3
S4
S4
S3
S2
S1
T4 E1
E2
E3
E4
E1
E2
E3
E4
E1
E2
E3
E4
E1
E2
E3
E4
E1
E2
E3
E4
E1
E2
E3
E4
E1
E2
E3
E4
E1
E2
E3
E4
C4
C4
C4
C4
C1
C1
C1
C1
C2
C2
C2
C2
C3
C3
C3
C3
C4
C4
C4
C4
C1
C1
C1
C1
C2
C2
C2
C2
C3
C3
C3
C3
S3
S1
S4
S2
S1
S2
S3
S4
S4
S3
S2
S1
S2
S4
S1
S3
S3
S1
S4
S2
S1
S2
S3
S4
S4
S3
S2
S1
S2
S4
S1
S3
Page 38
25
Legend:
Condition
C1
C2
C3
C4
Baseline PFD
B + EGPWS
B + SVS
B + EGPWS +
SVS
Experience
E1
E2
E3
E4
PP
CFII Low Hours
CFII High Hours
ATP
Scenario
S1
S2
S3
S4
Go Around L
Diversion Lon
Approach
Go Around R
Go Around L
Trial
T1
T2
T3 j
T4 |
Table 2: Experimental Matrix
The actual matrix with participant assignments is in Appendix B.
Experimental Procedures
Pre-Experiment Testing
Prior to conducting the actual experiment several pre-experiment studies were
completed. During these trial runs the scenario scripts and data collection methods were
further refined. The pre-experiment studies also provided insight into the amount of
training required to understand the new symbology and to learn to fly the simulation
software. It was during this stage that a generic approach plate was created and
researcher techniques were practiced.
Page 39
26
Experimental Conduct
The experiment started with a confidentiality briefing that required the participant
to sign a non-disclosure agreement (Appendix C) and progressed into an introduction to
the advanced display symbology and MSFS controls. Participants were then coached
through three training scenarios, contained in Appendix D, designed to allow the
participant to practice flying the software with the new symbology. The training
scenarios exposed the participants to each of the display conditions and the approach to
be used in the experiment. Other than the terrain over which they would fly, participants
saw and practiced the maneuvers to be performed during the experiment. At various
times in the training scenarios the simulation was paused to explain the symbology and
the software's response to control inputs. The participants were also given a simplified
approach plate for reference. It is in Appendix E.
Once the participant was comfortable with the symbology and simulation
software, usually no more than 20 minutes, participants then flew each of the four display
conditions through the same four scenarios. Since two researchers conducted the
experiment, detailed scripts were developed to minimize potential impacts. As an
example, Appendix F contains the script for Scenario One. Following each scenario the
participant completed a NASA TLX questionnaire; after the last scenario the participant
completed an in-depth questionnaire designed to assess their comfort with and acceptance
of the E-PFD.
Page 40
27
Data Capture
The FLTREC software collected a number of variables, the most salient being:
aircraft performance parameters, aircraft position, localizer and glide slope deviations,
times, and tuned navigation aids. Several other variables were included as data markers.
These data markers were changes to aircraft configuration made by the researcher, such
as turning on the pitot heat, and were not observable to the participant. These markers
were activated in response to the participant's behavior. They marked such events as
CFIT recognition, aural EGPWS cautions and warnings, and initiation of a CFIT
avoidance maneuver.
Data Reduction and Conditioning
Much more data were collected than required for the analysis. To distill the
whole to analyzable data certain filters were employed. The first step was to convert
each of the 128 trial files from xml format to a Microsoft Excel spreadsheet. A data
sample, the first and last data points from a single .xml data file for one trial, is in
Appendix G. Since data capture rate was once per second, and each scenario required
about 20 minutes, the resultant Excel files had over 600 rows of data (one data row per
second of scenario length). The data files also had 40 columns, one column per variable
per second. Each of these files was then inspected to find the embedded data marker
variables. When each data marker was found, the corresponding row was copied to a
second Excel workbook. These data were then manipulated to create the analyzable data.
Page 41
28
Determination of CFIT
Two methods were used to determine if a CFIT occurred. At the end of each
scenario the researcher annotated the scenario script if a CFIT occurred. A second
method was to subtract the aircraft's recorded altitude from the recorded ground level. If
that number, measured when an avoidance maneuver was initiated, was less than 200 feet
then a CFIT was considered to have occurred. The 200 foot limit was determined by
considering a 100 foot altimeter error, tree heights that were not depicted on the display,
and a 100 foot GPS and database tolerance error.
Determination of Display Safety Margin
The Safety Margin for each display was subdivided into two analyzable
components: the display's Recognition Time Advantage and the display's Avoidance
Time Advantage. To quantify the time advantages a series of data manipulations were
executed.
Recognition Time Advantage
First the time and aircraft position when CFIT recognition occurred was
determined from the data file and the corresponding aircraft position was extracted,
converted to a recognizable latitude and longitude, and plotted on a map. For this
analysis, the maps were Joint Operations Graphic (Air) of Montrose, CO (Series 1501
Air, Sheet NJ 13-4, Edition 1) with a scale of 1:250,000. Based on the scenario's
assigned heading, a straight line to the nearest 9,000 foot contour was drawn. This was
Page 42
29
surmised to be the distance to the obstacle that presented the CFIT hazard that the
participant had identified as the problem. The distance from the recognition point to the
contour line was measured, and using the scenario's assigned airspeed of 140 knots, the
distance was converted into a time to impact. This time represents the Recognition Time
Advantage the participant had when they recognized the potential CFIT accident.
Avoidance Time Advantage
For those participants who recorded a recognition time and an avoidance time, the
Avoidance Time Advantage was computed by the relationship Speed = Distance / Time.
In this analysis, the speed was an assigned speed of 140 knots and time was the elapsed
time in seconds between the recorded recognition and avoidance times. The computation
yielded the distance traveled between CFIT recognition and avoidance. To find the
distance to the hazard that prompted the recognition and subsequent avoidance maneuver,
the computed distance was subtracted from the distance to the hazard at the recorded time
of recognition. The distance remaining to impact at the time of the CFIT avoidance
maneuver was converted to a time to impact and labeled the Avoidance Time Advantage
for that trial.
If no recognition time was recorded, then the Avoidance Time Advantage was
calculated in the same manner as the Recognition Time Advantage, ie that the latitude
and longitude at the time of avoidance maneuver initiation were extracted and plotted.
The distance to the nearest 9000 foot contour was measured and converted to a time to
impact. This was the Avoidance Time Advantage for that trial.
Page 43
Data Analysis
Two main analyses were of interest. Of primary concern was the CFIT question.
Since the CFIT variable had a binary outcome, CFIT or no CFIT, a logistic regression
was used. The second analysis was the Safety Margin afforded by the different display
conditions. The Recognition Time Advantage and Avoidance Time Advantage for each
display condition were analyzed with an Analysis of Variance (ANOVA). Secondary to
these analyses were questions regarding interaction between trial, scenario, and condition
across participant and experience.
Page 44
31
Chapter 4
Data Refinement
Once all data were condensed into a single spreadsheet (Appendix H), it was
inspected for inconsistencies. Several missteps in experiment execution were made that
required removal of certain data. Runs 10 and 51 had wrong missed approach headings
recorded and were therefore considered to have participated in a different experiment and
were removed from all analysis. Runs 17, 19, 53, 116, and 121 produced no possibility
of CFIT and were also removed from all analysis. Runs 22, 25, and 109 were non-
EGPWS enabled display conditions, but the data showed EGPWS annunciations and
were therefore deleted from the analysis. Run pairs 90 and 91, 95 and 96, and 97 and
100, had reversed display conditions. While this did degrade the replication of trial,
experience, display condition, and scenario, it was deemed minor enough to allow the
data to be included in the analysis. Table 3 summarizes data excluded from all analysis.
Runs Excluded 10&51
17,19,53,116,121 22, 25, 109
Reason Wrong Missed Approach Heading
No CFTT Possibility Wrong Display Condition
Table 3: Summary of Data Points Removed From All Analysis
CFIT Data Analysis and Results
CFIT Data Conditioning
Appendix H, minus the data in Table 3, was reexamined within the context of
CFIT analysis. Although several runs had missing or erroneous data, it was determined
that in the CFIT context the data were valid for inclusion in this analysis. Runs 16, 32,
Page 45
32
54, 67, 82, 102, 117, and 127 were assigned as CFIT based on radar altimeter readings.
Table 4 summarizes the CFIT occurrences across each of the four main factors.
Factor CFIT No CFIT
Trial
Experience
Display Condition
Scenario
1 2 3 4
7 6 6 5
1 2 3 4
7 6 5 6
20 24 24 26
24 26 28 16
1 2 3 4
19 1 4 0
9 30 24 31
1 2 3 4
5 10 7 2
26 17 25 26
Table 4: Summary of CFIT Occurrences Across Each of the Main Factors
CFIT Histograms and Main Factors Analyses
Table 4 was used to construct histograms of CFIT against each of the four main
factors. Figures 8, 9, 10, and 11 are the histograms for CFIT occurrences in each of the
main factors.
Page 46
CFIT vs Trial
33
8 7
£ 6
O 4 o 3 * 2
1 0
2 3
Trial
Figure 8: Histogram of CFIT vs Trial
CFIT vs Experience Category
2 3
Experience Category
Figure 9: Histogram of CFIT vs Experience Category
Page 47
34
O 10
CFIT vs Display Condition
i i
Baseline KMD-540 EGPWS SVS Terrain
Display Condition
Figure 10: Histogram of CFIT vs Display Condition
E-PFD
12
10
.2 8 O 6
2
n u
CFIT vs Scenario
1 2 3 4
Scenario
Figure 11: Histogram of CFIT vs Scenario
Prior to the experiment three of the four factors were expected to have an effect
on the presence of the CFIT outcome. One would expect the trial number, experience
category, and display condition to all significantly influence whether a CFIT occurred.
However, the histograms reveal that two of these expected factors, trial and experience
category, may not have had significant effects on the experiment outcome. The
histograms reveal possible differences only in factors display condition and scenario. To
Page 48
35
confirm these observations a Chi-Square test was performed on each of the four factors.
Those results confirmed that display condition and scenario were significant factors while
trail number and experience category were not. Table 5 summarizes the Chi-Square
analysis results.
Main Factor Trial
Experience Category Display Condition
Scenario
Chi-Square Statistic 2.128736 3.47627 52.6999
8.041521
Significance Level p < 0.546 p < 0.323
p< 2.124 E-11 p < 0.045
Table 5: Main Factor Chi-Square Test Results
Logistic Regression of Display Condition with Respect to CFIT
Chi-Square analysis resulted in discounting trial number and participant category
as significant factors in the outcome variable. Although Chi-Square tests found scenario
to be a significant factor, it was excluded from further because experimental scenario
development and pre-experiment testing attempted to minimize any potential scenario
effects. Therefore, only the display condition factor lent itself to in-depth analysis.
Based on the binary nature of the outcome variable, a logistic regression using
The SAS System was deemed appropriate. To examine how the display conditions
compared to each other two models were constructed. Due to the result of no CFIT
occurrences in the E-PFD Display Condition, that particular display condition was
excluded from both models. Inclusion in the model prevented the software from
producing analyzable results.
The first CFIT analysis model used the Baseline Display Condition as the
reference condition. The test for model adequacy produced results significant at
Page 49
36
p < 0.0001. The KMD-540 EGPWS and SVS Terrain Display Conditions were
compared to the reference condition. The results of the analysis show that there is a
significant protective effect of having either the KMD-540 EGPWS Display Condition or
the SVS Terrain Display Condition over the Baseline Display Condition. Table 6
summarizes the analysis results from the first model.
Effect KMD-540 EGPWS to Baseline SVS Terrain to Baseline
Point Estimate 0.016 0.079
95% Confidence Limits 0.002-0.135 0.021-0.296
Table 6: Results of SAS Logistic Regression CFIT Model One
The second CFIT analysis model constructed used the KMD-540 EGPWS
Display Condition as the reference condition. Again, the test for model adequacy
produced results significant at p < 0.0001. This model was used to test the difference
between adding the SVS terrain to the primary flight display, vice having the KMD-540
EGPWS alone, when identifying and avoiding CFIT. The analysis shows that there is no
significant difference between the KMD-540 EGPWS Display Condition and the SVS
Terrain Display Condition. Table 7 summarizes the model results.
Effect Baseline to KMD-540 EGPWS
SVS Terrain to KMD-540 EGPWS
Point Estimate 63.333
5.000
95% Confidence Limits 7.419-540.675
0.524-47.728
Table 7: Results of SAS Logistic Regression CFIT Model Two
Page 50
37
Safety Margin Data Analysis and Results
The objective of the Safety Margin data analysis was to determine the time
advantages in CFIT recognition and avoidance afforded by each of the different display
conditions. The Safety Margin was divided into two components: the display condition's
Recognition Time Advantage and its Avoidance Time Advantage. Each of the
components was a time to either stated recognition or an avoidance maneuver initiation
for each display condition. The times were analyzed via a one factor Analysis of
Variance with the display condition being the factor.
Recognition Advantage Data Conditioning
The first part of this analysis was determining the recognition time associated
with each display condition. A participant's recognition time was dependent upon that
individual verbalizing that they perceived a potential CFIT situation to exist. If no
positive statement or behavior to that effect was made then no recognition time was
recorded and the participant was deemed to not have recognized the potential CFIT.
Analysis began with inspecting the full data table contained in Appendix H minus
the data already excluded in Table 3. Examination of the remaining data exposed a
potential flaw in the proposed analysis. In many runs no recognition time was recorded.
These data would not be used in an analysis to determine an average time. Yet, other
participants did recognize the potential CFIT given the same trial, condition, and
scenario. Not analyzing the difference between these participants would discount
valuable data. Given the need to investigate this difference, another analysis was
required and a new question was asked: How effective was a display condition at
Page 51
38
presenting the information needed by the participant to recognize the potential CFIT
situation? The data were inspected with respect to these two analyses.
When examining the data in the Safety Margin context several new
inconsistencies were discovered. Data capture files for runs 1, 100, and 110 contained no
data and were removed from analysis. Runs 9, 37, 48, and 94 were incomplete and
contained no information as to when the participant recognized the potential CFIT.
However, the researcher notes annotated if the display was used by the participant to
recognize a potential CFIT. These runs were included in the Display Use in Recognition
analysis but removed from the Recognition Time Advantage analysis. Run 31 time data
can not be explained, but contains valid use information, and was used the same as runs
9, 37, 48, and 94. Runs 5, 8, 9, 13, 16, 29, 33, 34, 36, 37, 38, 40, 47,48, 49, 56, 57, 58,
65, 66, 72, 77, 94, 113, 115, 118, 122, 123, 124, and 125 had no recognition time
recorded. In these runs the participant never verbally acknowledged the potential CFIT
situation, therefore there was no recognition of the situation on their part. The data were
included in the Display Use in Recognition analysis but removed from the Recognition
Time Advantage analysis. Runs in which a CFIT occurred but also had a recognition
time recorded were included in the analysis. Table 8 summarizes data removed for the
Display Use in Recognition analysis and Table 9 summarizes the data removed for the
Recognition Time Advantage analysis.
Runs Excluded 1,100,110
Reason No Data File Recorded
Table 8: Summary of Data Removed From Display Use in Recognition Analysis
Page 52
39
Runs Excluded 1,100,110
9, 37,48, and 94 31
5, 8, 9, 13, 16, 29, 33, 34, 36, 37, 38,40, 47,48, 49, 56, 57, 58, 65, 66, 72, 77, 94,
113, 115, 118, 122, 123, 124, and 125
Reason No Data File Recorded
No Time Recorded in File Bad Data File
Participant Never Recognized Potential CFIT Situation
Table 9: Summary of Data Removed From Display Recognition Time Advantage Analysis
Analysis of Display Use in Recognition
A participant's use of a display condition in CFIT recognition was determined by
either a recognition time being present in the data file or researcher notes indicating that
the participant recognized the developing CFIT situation. Since the outcome was binary
a logistic regression approach was used. Again using SAS, two models were developed.
The first used the Baseline Display Condition as the reference, the second used the
KMD-540 EGPWS Display Condition as the reference.
The Display Use in recognition Model One was analyzed to see if a particular
display condition gave the participant a better opportunity to recognize a potential CFIT
situation over the Baseline Display Condition. The test for model adequacy was
significant at p < 0.01. However, tests on the individual display conditions resulted in
only the SVS Terrain Display Condition being significant at p < 0.01. The Point
Estimate shows that there is an elevated risk when using the SVS Terrain Display
Condition when compared to the Baseline Display Condition. Table 10 summarizes the
analysis results.
Page 53
40
Effect
KMD-540 EGPWS Display SVS Terrain Display E-PFD Display
Point Estimate
2.259 17.866 2.865
95% Confidence Limits Lower Upper 0.721 7.080 2.103 151.743 0.884 9.286
Table 10: Results of SAS Logistic Regression For Display Use in Recognition (Baseline as Reference)
Display Use in Recognition Model Two analyzed the effect of adding SVS terrain
to the EGPWS display. Does SVS terrain in a display significantly improve a user's
chance to recognize a CFIT situation? The test for model adequacy was significant at p <
0.01. However, when analyzing the Point Estimates, all of the confidence intervals
included 1 and were therefore non-significant. Table 11 summarizes the analysis.
Effect
Baseline Display SVS Terrain Display E-PFD Display
Point Estimate
0.443 7.909 1.268
95% Confidence Limits Lower Upper 0.141 1.388 0.904 69.176 0.371 4.333
Table 11: Results of SAS Logistic Regression For Display Use in Recognition (KMD-540 EGPWS as Reference)
Analysis of Recognition Time Advantage
A plot of the average Recognition Time Advantage for each display condition was
constructed and is in Figure 12.
Page 54
41
Recognition T ime Advantage per Display Condition
2.5
Baseline KMD-540 EGPWS SVS Terrain
Display Condition E-PFD
Figure 12: Plot of Recognition Time Advantage Per Display Condition
The plot does not show any great differences. To confirm this observation, and
based on the assumption of normality, a one factor Analysis of Variance (ANOVA) was
determined best suited to test for significance. Using the SAS program the ANOVA was
run using the Recognition Time Advantage as the dependent variable and the four display
conditions as the treatments. The model was based on those participants who recognized
the potential CFIT; there had to be a recorded time in the data file for inclusion in this
analysis. The model was not significant and the results are summarized in Table 12.
Source
Model Error Corrected Total
Degrees of Freedom 3 80 83
Sum of Squares 3.998 116.337 120.335
Mean Square 1.333 1.454
F Value
0.92
Significance Level 0.437
Table 12: Results of SAS ANOVA For Recognition Time Advantage
Avoidance Advantage Data Conditioning
The second component to the measurable Safety Margin was the amount of time
the display gave the participant to make an avoidance maneuver. The calculation of this
parameter was completed in a similar manner to that of the Recognition Time Advantage.
Page 55
42
The analyzable data table, Appendix H with the data from Table 3 excluded, was again
examined for inconsistencies.
While an avoidance time was recorded by the researcher if the participant made a
control input that maneuvered away from terrain, avoidance times were also recorded for
participants who had no recognition times. In these instances, something in the display
condition provided a warning to the participant that a potential CFIT condition was
present prior to the participant's verbally acknowledging such a situation existed. Like
the Display Use in Recognition Advantage analysis, a trial that resulted in CFIT was
included in the analysis if an avoidance time was recorded. Even though the maneuver
may not have been successful in avoiding the CFIT, that the participant used the display
condition to initiate an avoidance maneuver was sufficient for inclusion in this analysis.
However, runs 33, 38, 43, 47, 49, 56, 57, 72, 73, 118, 123, and 125 were all runs that
ended in CFIT in which the participant never made an avoidance maneuver and were
removed from the Avoidance Time Advantage analysis. Tables 13 and 14 summarize the
data removed from each of the Avoidance Advantage analyses.
Runs Excluded 1,100, 110
Reason No Data File Recorded
Table 13: Summary of Data Removed From Display Avoidance Use Analysis
Runs Excluded 1,100,110
9,37,48, and 94 31 & 127
33, 38,43,47,49, 56,57, 72,73,118, 123, and 125
Reason No Data File Recorded
No Time Recorded in File Bad Data File
Participant Never Avoided Potential CFIT Situation
Table 14: Summary of Data Removed From Display Avoidance Time Advantage Analysis
Page 56
43
Analysis of Display Use in Avoidance
Similar to the logistic regression models utilized in testing significance of display
use in CFIT recognition, two models were constructed to test the use of each display
condition in avoiding the CFIT. However, neither model was significant. This was
probably due to the low number of non-cases; most participants used the displays to
avoid CFIT.
Analysis of Avoidance Time Advantage
The average Avoidance Time Advantage for each display condition was plotted
and is in Figure 13. This plot shows a possible difference between two or more of the
display conditions.
Avoidance Time Advantage per Display Condition
Baseline KMD-540 EGPWS SVS Terrain
Display Condition
E-PFD
Figure 13: Plot of Avoidance Time Advantage Per Display Condition
Again assuming normality, the Avoidance Time Advantage was analyzed via a
one factor Analysis of Variance (ANOVA). Including only those participants who
recorded an avoidance time, the SAS program was utilized to run the ANOVA with the
Avoidance Time Advantage as the dependent variable and the four display conditions as
Page 57
44
the treatments. The model was significant at p < 0.05. The actual significance level of p
< 0.0229 is corroborated by the model's weak R-square value of 0.0981 and high
coefficient of variation of 77.1934. Table 15 summarizes the model results.
Source
Model Error Total
Degrees of Freedom 3 92 95
Sum of Squares 10.1727 93.5779 103.7507
Mean Square 3.3909 1.0172
F Value
3.33
Significance Level 0.0229
Table 15: Results of SAS ANOVA For Avoidance Time Advantage
A Post Hoc Least Squares Difference test resulted in certain condition
comparisons as being significant at p < 0.05 level. The test comparisons are in Table 16.
The bold italic entries are the significantly different pairs.
Condition Comparison
1-2 1-3 1-4 2-1 2-3 2 - 4 3 - 1 3-2 3 - 4 4-1 4 - 2 4 - 3
Difference Between Means -0.8694 -0.3062 -0.8139 0.8694 0.5632 0.0554 0.3062 -0.5632 -0.5078 0.8139 -0.0554 0.5078
95% Confidence Interval Limits Lower Upper -1.5345 -0.2042 -1.0069 0.3946 -1.4758 -0.1521 0.2042 1.5345 0.0010 1.1254 -0.4576 0.5684 -0.3946 1.0069 -1.1254 -0.0010 -1.0662 0.0506 0.1521 1.4758 -0.5684 0.4576 -0.0506 1.0662
Table 16: Least Squares Difference Test Results
The test shows that when the Baseline Display Condition (referent 1) is compared
to the other display conditions it is significantly smaller than referent 2, the KMD-540
EGPWS Display Condition, and referent four, the E-PFD Display Condition. However,
it is not different from referent three, the SVS Terrain Display Condition.
Page 58
45
An analysis of the residuals showed the data to be distributed normally with the
exception of the last 14 data points. Figure 14 is a plot of the residuals. Those data were
analyzed for commonalities. It was determined that the majority of the data were
recorded in scenario four (11 of the 14 points). This was expected since the analysis of
CFIT occurrences across the four main factors showed that scenario had a significant
effect on CFIT occurrence. While in-depth analysis of the scenario factor was not
conducted, cursory examination of Figure 11 suggests that scenario four was easier than
the others (since it had a low occurrence of CFIT). It is a logical conclusion that if
participants recognized and avoided CFIT in this scenario then it would have an affect on
the Avoidance Time Advantage analysis in the form of increased times for that scenario.
This is what appears to be evident in the residuals analysis.
Standardized Residuals Plot for Avoidance Time Advantage ANOVA
48
CO 75 28 3 •o "5 • OC 8 •o "S -12 CO
S 55 -32
-52
m*mm*mmmmmm mmmmmm B 6 11 16 21 26 31 36 41 46 51 56 61 66 71 76 81 86 91 96
Figure 14: Standardized Residuals Plot For Avoidance Time Advantage ANOVA
Page 59
46
Chapter 5
Summary and Discussion of CFIT Data Analysis and Results
The logistic regression analysis of CFIT with respect to display condition showed
that participants with the KMD-540 EGPWS or SVS Terrain Display Conditions were
less likely to have a CFIT event than when using the Baseline Display Condition.
However, there was no significant difference between the KMD-540 EGPWS and SVS
Terrain Display Conditions at preventing CFIT. Due to no CFITs with the E-PFD
display, it could not be statistically compared to the other three display conditions.
Discussion of CFIT Main Factors Results
The logic for considering the factor trial number as important was based on the
anticipation of the participant's learning during the experiment. Why no learning effect
was observed might be explained by the participant's pre-experiment idea that any SVS
system must be used for terrain avoidance. Participants would then be hyper-aware of
any such developing situation and take action prior to real recognition. This notion of the
participant's preconceived idea of the experiment's purpose becomes more important
when conducting the Safety Margin analysis.
The other factor that was shown to be important in the literature, and therefore
considered to be important in identifying and avoiding a potential CFIT situation, was the
pilot's training and experience, which was modeled by our experience category. One
would reason that a more experienced pilot with many flight hours in an Instrument
Meteorological Conditions environment would be more adept at building and maintaining
situational awareness. Since this is thought to be a key component in CFIT detection and
Page 60
47
avoidance, it follows that the more experienced pilot would have significantly fewer
CFIT occurrences. This was not evident in experimental data; our results show no effect
by participant experience category. An explanation of this result is most logically based
on ecological validity. This experiment was conducted in a well lit room using PC-based
gaming software. Every effort was made to transport the participant into an aircraft
flying in actual airspace, but the lack of realism may have influenced the participant's
thoughts and actions. The lack of realism and video game effect also become important
considerations when conducting the Safety Margin analysis.
During experimental design development and pre-experiment testing, each
scenario was constructed and refined so as to present the participants with a CFIT
condition. Given the great differences between each participant's ability to fly the flight
simulation software and the limitations of the software upon which the system was based,
the point in space where each participant flew to after the same missed approach
instructions varied greatly. Therefore, any differences between scenarios are artificially
created by the design and cannot be satisfactorily explained. A detailed analysis of the
scenario effect was not completed.
Discussion of Logistic Regression of Display Condition with Respect to CFIT Results
CFIT Model One produced results consistent with expectations. One would
expect that including any form of terrain awareness technology in a primary flight display
will reduce the number of CFIT occurrences. There is little new information in this
analysis, but it serves as an important confirmation of the prior evidence.
Page 61
48
CFIT Model Two produced an unexpected result. Our hypothesis was that
participants would perform better with the advanced display. We theorized that with the
terrain presented in the primary flight display participants would easily recognize a
potential CFIT and take appropriate corrective action. This was not the result the
analysis produced. The most likely explanation is that a video game effect may have
influenced the data. When using the SVS Terrain Display Condition, some pilots were
observed to fly closer to the terrain and displayed "nap of the earth" or "terrain flying"
behaviors. These same pilots, when flying with a TAWS display condition that
incorporated an aural warning, were observed to strictly follow the instrument's terrain
warning annunciations. The realistic depiction of terrain may have influenced these
pilots to break established habits and fly in a regime in which they would not normally
operate.
Another interesting qualitative observation regarding the introduction of the SVS
terrain can be drawn from the data. Of the 118 analyzable trails 24 CFITs were observed.
Of those 24, 19 occurred as expected with the Baseline Display Condition. Of the
remaining five, only one occurred with a display condition that incorporated an aural
ground proximity warning, the KMD-540 EGPWS Display Condition. Explained another
way- when only the visual terrain information was presented to the participants, when
participants were using the SVS Terrain Display Condition, four CFIT occurrences were
observed. This suggests that warning modality is important. The participants seemed to
be waiting for an annunciation of some modality to prompt for corrective action. When
left to decide for themselves, four participants flew lower and committed a CFIT event.
Page 62
49
This observation is supported by two other data points. First, all four of the CFIT
occurrences under the SVS Terrain Display Condition resulted from the participant being
within 200 feet of the ground. Second, there were no CFIT occurrences when
participants used the E-PFD, the only display condition incorporating both aural warnings
and visual depiction modes. The question of which display conditions performed the best
in allowing the participant to recognize and avoid a potential CFIT situation is
reexamined when attempting to quantify each display's Safety Margin.
Summary and Discussion of Recognition Safety Margin Analysis and Results
Each display's individual Recognition Safety Margin was divided into two
components, its usefulness at aiding in CFIT recognition and the associated Recognition
Time Advantage. Figure 15 shows the Recognition and Avoidance Time Advantages for
each display condition.
Average Times Per Display Condition
Baseline KMD-540 EGPWS SVS Terrain E-PFD Display Condition
• Recognition Time • Avoidance Time
Figure 15: Histogram of Recognition and Avoidance Time Advantages for All Display Conditions
Page 63
The logistic regression analysis of Display Use in Recognition showed no
significant difference between the Baseline Display Condition and the KMD-540
EGPWS or E-PFD Display Conditions; or between the KMD-540 EGPWS Display
Condition and the Baseline, SVS Terrain, or E-PFD Display Conditions. The only
significant difference between displays was an elevated risk for participants using the
SVS Terrain Display Condition compared to the Baseline Display Condition. While
unexpected, this result is consistent with the CFIT analysis with respect to adding SVS
terrain to a display condition. Instead of aiding the participant in recognizing the
potential CFIT, and providing them the opportunity to avoid it, there was no difference
when including the SVS terrain in either analysis (preventing a CFIT or aiding in its
recognition).
When analyzing the time advantage gained by those participants who used the
display to recognize a potential CFIT the model was non-significant. This was attributed
to the variance within the recognition times.
Summary and Discussion of Avoidance Safety Margin Analysis and Results
The low number of non-cases caused the logistic regression model for display use
in avoiding CFIT to be non-significant and no conclusions were drawn. The model for
determining which display conditions produced better Avoidance Time Advantages was
significant. The Post Hoc test showed the KMD-540 EGPWS Display Condition was
better than the Baseline Display Condition and SVS Terrain Display Condition, but not
the E-PFD Display Condition. It also showed that the E-PFD Display Condition was
Page 64
51
better than the Baseline Display Condition, but not significantly different from the KMD-
540 EGPWS or SVS Terrain Display Conditions.
While contrary to expectations, this is consistent with the rest of the experimental
analysis. Analysis of the data consistently shows that having SVS terrain instead of the
EGPWS does not significantly improve participant performance as measured by CFIT
avoidance or our Safety Margin statistics. Table 17 summarizes the significant pairs and
which display condition had a greater Avoidance Time Advantage.
Condition Comparison
2 - 1 2 - 3 4 - 1
Difference Between Means
0.8694 0.5632 0.8139
Condition with Greater Avoidance Time 2 2 4
Does Condition « Incorporate an Aural Warning
Yes Yes Yes
Table 17: Summary of Significant Least Squares Difference Significant Condition Comparisons
When examining the display conditions that incorporate aural warnings, it is
noted that referents one and three (the Baseline Display Condition and the SVS Terrain
Display Condition) are not different and that referents two and four (the KMD-540
EGPWS Display Condition and E-PFD Display Condition) are not different. This
supports the conclusion that the participants are relying on the aural warning to recognize
and avoid the potential CFIT, regardless of the amount of information contained within
the display. Contrary to our hypothesis, it also discounts the notion that adding SVS
terrain to existing EGPWS displays will significantly improve CFIT recognition or
avoidance.
The other pair comparison that supports this conclusion is the referent two to
referent three (the KMD-540 EGPWS and SVS Terrain Display Conditions respectively).
Page 65
52
Referent two incorporates the aural warning while in referent three there is only the
terrain. Examining the difference between the means shows that referent two has a better
avoidance time than referent three. This suggests that the aural warning is the
discriminating factor in display effectiveness when comparing these two display
conditions.
General Discussion
Relationship to Existing Literature
This study was an attempt to examine the same display's effectiveness across all
experience levels. The importance of examining a single display's effectiveness across a
broad range of experience levels is important when considering how effective a single
display design is at preventing CFIT in all flight regimes for any pilot.
Shappell and Wiegmann (op cit.) found that pilots committed CFITs more often
when they transitioned from VMC to IMC. In their 2002 study, Takallu et al. (op cit.)
concluded that SVS displays enabled private pilots to avoid CFIT accidents while
maneuvering when transitioning from VMC to IMC. While this study did not address the
visual and vestibular challenges associated with VMC to IMC transitions, since the entire
experiment was conducted in a simulated instrument environment and without motion,
the private pilots were just as capable as the ATPs in CFIT recognition and avoidance
when using the SVS display.
This study used instrument hours as an experience variable. Our analysis showed
no effect of experience category on CFIT occurrence. The display tested was sufficiently
simple to be effective across all pilot experience levels. This finding contradicts
Page 66
53
Uhlarik's et al. (op cit.) finding that a terrain enhanced PFD is more effective for
experienced pilots. The difference may lie in the realistic nature of the newer displays or
that this experiment was a flight simulation and not a "snap-shot" measurement of terrain
proximity.
Critique of Experiment
One modification to the experiment that would improve all data would be to
improve the simulation to make it more realistic. This could be achieved through a more
robust simulator that incorporates high fidelity visuals with a motion base all in a
simulated aircraft cockpit. By making the simulation atmosphere more realistic
participants may exhibit behavior consistent with their real-world actions.
The experimental design may also have influenced the data. Due to time
constraints in which to conduct the experiment and the limited number of participants
available to the researchers, this study economized data collection by adopting a within-
participant approach with a potential CFIT event designed into each scenario. This was
intended to allow maximum exposure of participants to each of the display conditions
and to maximize the potential CFIT data.
A better design for true CFIT modeling is a rare event scenario where each
participant is only presented with the potential CFIT once. Since all scenarios contained
a CFIT element, it was anticipated that as the participants progressed through the
experiment they would learn the general context of the experiment and adapt their
behavior and responses accordingly. This was not seen in the analysis; however the
participants might have been predisposed to expecting CFIT due to the nature of the
Page 67
54
display changes. Another design, such as a between-participant approach where each
participant flew only one display condition, may have improved data in the Safety
Margin Analysis by repeated exposure of the participant to the same display condition.
However, this would require many more participants to provide the data required to
achieve a level of statistical significance.
Implications of Results
This study demonstrated the effectiveness of the SVS concept at preventing CFIT
in pilots of all experience levels. However, the analysis also showed no incremental
increase in the increased time afforded pilots by having the synthetic terrain. The
addition of synthetic terrain in aviation avionics may be analogous to the addition of air
bags in automobiles. Similar to how the addition of EGPWS in aviation initially reduced
the number of commercial aviation CFIT accidents, the addition of seat belts in
automobiles significantly reduced the severity of accidents to passengers. Since that
time, as the automobile industry introduces additional safety devices like self-adjusting
air bags and around-the-bend imaging, the severity of accident injuries has not
significantly decreased. Likewise, with the addition of synthetic terrain to the PFD, the
increase in measurable safety margins may not be statistically significant. As with any
new technology, training and user acceptance will be key factors in its successful
implementation.
This study also separated the synthetic terrain from the EGPWS to examine how
those two technologies compared. When analyzing for CFIT prevention, the SVS Terrain
Display Condition was not significantly better than the KMD-540 EGPWS Display
Page 68
55
Condition. When analyzed in the Safety Margin context, there was no difference in use
of display for CFIT recognition between the KMD-540 EGPWS and SVS Terrain
Display Conditions, but there was an elevated risk for SVS Terrain Display Condition
users over the Baseline Display Condition users. This suggests that having the visual
information of terrain may have created a hazard. The data for this is that with SVS
alone, all of the recorded CFITs resulted from arbitrarily defining CFIT as descending
below 200 ft above ground level.
This is further corroborated when examining the Avoidance Time Advantage for
the two displays. In this analysis the KMD-540 EGPWS Display Condition was better
than the SVS Terrain Display Condition. It also showed that the Baseline Display
Condition was the same as the SVS Terrain Display Condition and the KMD-540
EGPWS Display Condition was the same as the E-PFD Display Condition. The obvious
difference between the displays is the aural warning incorporated in the EGPWS. The
Baseline and SVS Terrain Display Conditions had no aural warning, while the KMD-540
EGPWS and E-PFD Display Conditions did.
While separating the two components of the E-PFD may seem unfair to the
manufacturers it may become significant in specialized applications such as military
operations, search and rescue or emergency medical service operations, and unmanned
aerial vehicle operations. Discussion of these in detail is beyond the scope of this study;
however it bears mentioning that as the SVS technologies and their associated terrain
data base mature, issues such as user depth perception, terrain accuracy, real-time sensor
information, and operator field of view become increasingly important.
Page 69
In conjunction with this experiment, participants qualitatively evaluated each
display condition in questionnaires. While that analysis is not specifically included as
part of this thesis, analysis of the responses show the participants enthusiastically
endorsing the E-PFD Display Condition as being much better than any other display.
However, when participants used the display it did not significantly improve their
performance. The data suggests that despite the terrain information, participants relied on
the aural cue to recognize and avoid CFIT situations.
This raises an important question addressed by some researchers. Do display
users really know what is the most effective way of presenting information in a display?
And, should display designers tailor their displays to meet the desires of the user or
should they engineer the display to adhere to most effective design principles? A recent
article by Smallman and St. John (2005, p. 6) coined this "misplaced faith in realistic
displays" as Naive Realism. The author asserts that users tend to feel the more realistic
display enables them to perform better but that experimentation has shown this not to be
the case. This experiment's results appear to support this theory.
Conclusion
The hypothesis, that the E-PFD Display Condition would provide participants of
all experience levels the most effective information needed to assist in the timely
identification and avoidance of potential CFIT situations, was not supported or rejected
by the data. Due to no CFITs occurring in the E-PFD Display Condition it could not be
included in the analysis. Qualitatively, one can assert that since no CFITs occurred with
the E-PFD Display Condition, and CFITs did occur in the other three conditions, it must
Page 70
57
be better than the other displays. However, further testing is needed to statistically
conclude the effectiveness of the display at preventing CFIT.
Recommendations
Future experiments to investigate the effectiveness of Synthetic Vision Systems
across such a broad experience continuum need to be carefully planned to answer a
focused question. Single experiments to investigate CFIT prevention should follow a
rare event experiment model. Other experiments to explore the Recognition and
Avoidance Time Advantages should limit the participant to one display used in a variety
of terminal area environments that offer different terrain features.
More experimentation needs to be conducted to more fully understand the theory
of Naive Realism. Display designers should carefully balance the wishes of the
participant with effective display design principles resulting from this research.
Finally, training on displays that incorporate synthetic terrain seems to be an
important component in effective display use. Manufactures and companies should
assume the responsibility of investing sufficient efforts in initial training opportunities.
Page 71
References
Baize, D. G. (2000). Synthetic Vision Systems Project Plan. NASA Langley Research
Center.
Barrows, A. K., Alter, K. W., Jennings, C. W., & Powell, J. D. (1999). Alaskan Flight
Trials of A Synthetic Vision System For Instrument Landings of A Twin Piston
Aircraft. Proceedings ofSPIE, Synthetic Vision Conference, Volume 3691.
Boeing (2005). Statistical Summary of Commercial Jet Airplane Accidents: Worldwide
Operations 1959-2004. Retrieved February 23, 2006 from
http://www.boeing.com/news/techissues/pdf/statsum.pdf
Federal Aviation Administration (2000). General Aviation Controlled Flight into Terrain
Joint Safety Implementation Team: Final Report.
Federal Aviation Administration (2002). Prevention of Controlled Flight Into Terrain in
General Aviation Operations. Report No. DOT/FAA/AM-400-02/2, 2002.
Retrieved November 16, 2005, from
http://www.freewebs.com/instruction/CFIT.doc
Federal Aviation Administration (2003). General Aviation Controlled Flight Into
Terrain Awareness. Advisory Circular 61-134, 2003. Retrieved May 24, 2006
from http://www.faasafetv.gov/ALC/libview normal.aspx?id=6583
Gore, A. (1997). White House Commission on Aviation Safety, February 12, 1997.
Retrieved February 23, 2006 from http://www.fas.0rg/irp/threat/212 fin- 1 .html
Gurevich, A. (1991). Pull up pull up- The When and How of GPWS pull ups. British
Airways Flight Deck, Issue 1, Autumn 1991.
Page 72
59
Moroze, M. L., & Snow, M. P. (1999). Causes and Remedies of Controlled Flight Into
Terrain (CFIT) In Military and Civil Aviation. Proceedings of the 10th
International Symposium on Aviation Psychology. Columbus, OH: Ohio State
University.
Prinzel, L. J., Hughes, M. F., Arthur, J. J., Kramer, L. J., Glaab, L. J., Bailey, R. E.,
Parrish, R. V., et al, (2003). Synthetic Vision CFIT Experiments for GA and
Commercial Aircraft: "A Picture Is Worth A Thousand Lives." Proceedings of the
Human Factors and Ergonomics Society 47th Annual Meeting. Denver, CO:
Human Factors and Ergonomics Society.
Scott, W. (1997). New Research Identifies Causes of CFIT. Aviation Week & Space
Technology, June 17, 1997.
Shappell, S. A., & Wiegmann, D. A. (1998). A Human Error Analysis of General
Aviation Controlled Flight into Terrain Accidents Occurring Between 1990-1998.
Federal Aviation Administration, Office of Aerospace Medicine Report No.
DOT/FAA/AM-03/4. Office of Aerospace Medicine, Washington, D.C.
Shappell, S. A., & Wiegmann, D. A. (2001). Unraveling the Mystery of General
Aviation Controlled Flight Into Terrain Accidents Using HFACS. Proceedings of
the 11th International Symposium on Aviation Psychology. Columbus, OH: Ohio
State University.
Smallman, H. S. & St. John, M. (2005). Naive Realism: Misplaced Faith in Realistic
Displays. Ergonomics in Design, Volume 13, Number 3, Summer 2005, 6-13.
Takallu, M. A., Wong, D. T., & Uenking, M. D. (2002). Synthetic Vision Systems in GA
Cockpit- Evaluation of Basic Maneuvers Performed By Low Time GA Pilots
Page 73
60
During Transition From VMC To IMC. Proceedings of the International
Advanced Aviation Technology Conference. Anchorage, AK.
U.S. Department of Transportation, Volpe National Transportation Systems Center
(1997). General Aviation Accidents, 1983-1994: Identification of Factors Related
to Controlled-Flight-Into-Terrain (CFIT) Accidents. Cambridge, MA.
Uhlarik, J. J., Peterson, D. A., & Herold, J. M. (1998). Terrain Awareness Using a
Terrain Enhanced Primary Flight Display. Proceedings of the Human Factors
and Ergonomics Society 42nd Annual Meeting. Human Factors and Ergonomics
Society.
Page 74
Appendices
Appendix A: Complete Participant Description 62
Appendix B: Completed Experimental Matrix 63
Appendix C: ERAU Non-Disclosure Agreement 64
Appendix D: Experimental Training Script 65
Appendix E: Participant Simplified Approach Plate 73
Appendix F: Experimental Script for Scenario One 74
Appendix G: First and Last Data Points in Trial Data File
of 690 Data Points 78
Appendix H: Full Data Table 79
Page 75
62
Appendix A: Complete Participant Description
Participant
1 2 3 4 5 6 7 8 9 10 11 12 13 14 15 16 17 18 19 20 21 22 23 24 25 26 27 28 29 30 31 32
Age 24 23 25 34 23 22 20 22 21 20 27 23 28 20 25 20 20 27 21 26 30 24 22 44 22 56 63 60 25 26 67 53
Gender
M M M M M M M M M F M M M M M M M M M M M M M M M M M M F M M M
Private Pilot
X
X
X
X
X
X
X
X
X
Instrument Rated
X
X
CFM X
X
X
X
X
X
X
X
X
X
X
X
X
X
X
ATP
X
X
X
X
X
X
Total Hours
1004
534 935 3045
274 156 100 95 79 259 486 448 700 56 1500 162 205 1750 236 421 461 705 519 15000
436 26000
25000
14000
1100
125 20000
20000
Instrument Hours
108 107 120 23 10 40 24 6 9 51 105 .
100 210 4 75 47 42 225 94 98 86 61 92
13000
110 20000
20000
13250
300 2
17000
17000
Page 76
63
Appendix B: Completed Experiment Matrix
Participant
5 15 1
32
6 4 2
24
7 10 3
26
8 17 11
27
9 19 13
28
14 23 18
29
16 21 25
30
20 22 12
31
Date
5-Apr 7-Apr 12-Apr
10-Apr
9-Apr 13-Apr 24-Apr
17-May 10-Apr 19-Apr 26-Apr
11-May
5-Apr 1-May 15-Apr
25-Apr
18-Apr 17-Apr 1-May
19-Apr
10-May 11-Apr 5-May
2-Jun
22-Apr 16-Apr 9-Apr
6-Jun
16-Apr 6-Apr 9-May
5-Jun
T1
E1 C1 S1 E2 C1 S2 E3 C1 S3 E4 C1 S4
E1 C4 S4 E2 C4 S3 E3 C4 S2 E4 C4 S1
E1 C3 S2 E2 C3 S4 E3 C3 S1 E4 C3 S3
E1 C2 S3 E2 C2 S1 E3 C2 S4 E4 C2 S2
E1 C1 S1 E2 C1 S2 E3 C1 S3 E4 C1 S4
E1 C4 S4 E2 C4 S3 E3 C4 S2 E3 C4 S1
E1 C3 S2 E2 C3 S4 E3 C3 S1 E1 C3 S3
E1 C2 S3 E2 C2 S1 E3 C2 S4 E4 C2 S2
T2
E1 C2 S4 E2 C2 S3 E3 C2 S2 E4 C2 S1
E1 C3 S2 E2 C3 S4 E3 C3 S1 E4 C3 S3
E1 C1 S3 E2 C1 S1 E3 C1 S4 E4 C1 S2
E1 C4 S1 E2 C4 S2 E3 C4 S3 E4 C4 S4
E1 C2 S4 E2 C2 S3 E3 C2 S2 E4 C2 S1
E1 C3 S2 E2 C3 S4 E3 C3 S1 E4 C3 S3
E1 C1 S3 E2 C1 S1 E3 C1 S4 E4 C1 S2
E1 C4 S1 E2 C4 S2 E3 C4 S3 E4 C4 S4
T3
E1 C3 S2 E2 C3 S4 E3 C3 S1 E4 C3 S3
E1 C2 S3 E2 C2 S1 E3 C2 S4 E4 C2 S2
E1 C4 S1 E2 C4 S2 E3 C4 S3 E4 C4 S4
E1 C1 S4 E2 C1 S3 E3 C1 S2 E4 C1 S1
E1 C3 S2 E2 C3 S4 E3 C3 S1 E4 C3 S3
E1 C2 S3 E2 C2 S1 E3 C2 S4 E4 C2 S2
E1 C4 S1 E2 C4 S2 E3 C4 S3 E4 C4 S4
E1 C1 S4 E2 C1 S3 E3 C1 S2 E4 C1 S1
T4
E1 C4 S3 E2 C4 S1 E3 C4 S4 E4 C4 S2
E1 C1 S1 E2 C1 S2 E3 C1 S3 E4 C1 S4 E1 C2 S4 E2 C2 S3 E3 C2 S2 E4 C2 S1
E1 C 3 ' S2 E2 C3 S4 E3 C3 S1 E4 C3 S3
E1 C4 S3 E2 C4 S1 E3 C4 S4 E4 C4 S2
E1 C1 S1 E2 C1 S2 E3 C1 S3 E4 C1 S4
E1 C2 S4 E2 C2 S3 E3 C2 S2 E4 C2 S1
E1 C3 S2 E2 C3 S4 E3 C3 S1 E4 C3 S3
Page 77
64
Appendix C: ERAU Non-Disclosure Agreement
EXPERIMENTAL DESIGN AND PARTICIPATION CONFIDENTIALITY AGREEMENT
THIS EXPERIMENTAL DESIGN AND PARTICIPATION CONFIDENTIALITY AGREEMENT (this "Agreement") is made and entered into as of the "Effective Date") by and between Embry Riddle Aeronautical University, Department of Safety Science ("ERAU"), and ("Participant's Name & Address").
RECITALS
1. Certain information related to the experimental design and its conduct will be presented during the ERAU Human Factors experiment (the "Experiment").
2. The parties recognize that the information is a valuable asset of ERAU, and that misuse or unauthorized disclosure will substantially impair the value of the Experiment.
AGREEMENT
NOW THEREFORE, the parties agree as follows: Limitation on the Use of Confidential Information. All data and information presented by ERAU or parties acting on behalf or under contract with ERAU during the Experiment is Confidential Information (as defined below) to ERAU, and Participant shall not duplicate, use or disclose in whole or in part the Confidential Information for any purposes without the written consent of ERAU. All data and information presented during the Experiment is protected by this Agreement and can be used only for the purpose of participating in the Experiment and not for any other use. Any dissemination, distribution or copying of this information to any third party is illegal and strictly prohibited.
As used in this Agreement, but except as provided below, the term "Experimental Design" means any and all data and information (including, without limitation, documents, materials, models, exhibits, samples, demonstrations, computer data or programs and source codes) imparted to Participant directly or indirectly by or on behalf of ERAU, whether orally, in writing or in some other form, with respect to ERAU and its services, business, assets, customers, clients, suppliers, financial condition or otherwise, whether furnished prior to or after the date hereof, including, without limitation, financial statements and other financial information, information regarding past, present or future business or prospects, agreements, trade secrets, methods or policies, formulas, processes, procedures, manuals, instructions, techniques, devices, records, drawings, specifications, designs, technology, computer hardware and software, computer programs, materials and parts lists, test criteria, customer lists, design data, manufacturing and operating specifications and any other information designated as confidential by ERAU. Notwithstanding the foregoing, the following information shall not be deemed Confidential Information for purposes of this Agreement: (1) any information which, at the time of disclosure, is a part of the public domain; or (2) any information which subsequently becomes a part of the public domain by publication or otherwise through no fault of Participant.
IN WITNESS WHEREOF, the parties have entered into this Agreement as of the date first written above. ERAU, Dept of Safety Science Participant
Signature Signature
Printed Name Printed Name
Title Date
Page 78
65
Appendix D: Experimental Training Script
TRAINING SCENARIOS ONE THRU THREE
Participant #:
KPHX ILS 26 TRAINING WITH BASELINE DISPLAY
basic instructions to train for ILS approach scenarios
1. Boot Equipment for E-PFD display condition
2. Turn "Scenario Card" to 'Training"
3. Put participant at start of training, reset to KPHX:
a. From MSFS menu bar, select "Flight" then "Select A Flight" to open
flight dialog box (same as when MSFS first opened on initial start)
b. Select "KPHX Train" flight
c. From configuration utility, verify "KPHX" and "26" entered into airport
and runway text boxes and correct settings for baseline display condition.
4. Start the Flight Recorder utility:
a. Click on "Recorder" in menu bar
i. Select "Settings"
ii. Verify set is "a_vars"
iii. Click "Browse" button
1. From save dialog box, create a new folder with subj
number as name
2. Save file to format "subj_n_run_T"
3. "n" is participant number from front page
4. "T" is training scenario
iv. Click "Save" then "OK"
b. Click on "Recorder" again, then select "Not Recording" with black square
in front of it
c. Click on "Recorder" again, verify has changed to "Recording" with a red
circle in front of it
5. Reset the MSFS clock seconds to XX:XX:00
Page 79
66
a. Click on :00 to reset to :00
Start video recording
TRAINING SCENARIO ONE
participant flies KPHX ILS 26 to over-fly airport w/ Baseline Display
KPHX/ RWY 26/ ILS 111.75/ FAC 258/ Field Elevation 1135 MSL
• Objective:
o With terrain off, intercept and track localizer to over-fly airport at 5000 FT
MSL
START SCENARIO
• Participant starts paused with AP and FD engaged with the following
parameters set:
• Power = 53 %Ni
D Airspeed = 140 KIAS
• Attitude = 7 degrees nose up
• Flaps = 20 degrees
• Gear = Up
• Altitude = 5,000 MSL
• Distance = 28 DME
• Heading = 230 M
• ATC: "Lear 3XY, tower, you are 28 miles from the airport, maintain heading
230, and 5000 feet until established on the approach. You are cleared for the
ILS 26 approach."
• CHECK ALL DATA MARKER SWITCHES OFF!!!
• Un-pause scenario
• Warn participant about power setting
• Warn participant that AP and FD are being turned off, then turn them
off
• 22.5 DME
• "CAPT, LOC course bar coming alive."
• Participant should commence 10-15 deg AOB turn to right to intercept
258M
Page 80
67
• Set heading bug to 258, tell participant
• 20.5 -19.0 DME
• LOC course should be centered
• Track Localizer inbound, if participant is performing well, skip to
Training Scenario Two and add glide slope intercept and tracking
• If continuing with Training Scenario One, continue to track localizer and
coach as necessary.
• Stop scenario when past airport
To reset flight to starting point, "CTRL ;" or use MSFS menu
TRAINING SCENARIO TWO
participant flies KPHX ILS 26 to missed approach w/ E-PFD
KPHX/ RWY 26/ ILS 111.75/ FAC 258/ Field Elevation 1135 MSL
• Objective:
o With terrain on, intercept and track localizer and glide slope to missed
approach instructions
From configuration utility, verify "KPHX" and "26" entered into airport and
runway text boxes and correct settings for E-PFD display condition.
START SCENARIO
• Participant starts paused with AP and FD engaged with the following
parameters set:
• Power = 53 % Ni
• Airspeed = 140 KIAS
• Attitude = 7 degrees nose up
• Flaps = 20 degrees
• Gear = Up
• Altitude = 5,000 MSL
• Distance = 28 DME
• Heading = 230 M
• ATC: "Lear 3XY, tower, you are 28 miles from the airport, maintain heading
230, and 5000 feet until established on the approach. You are cleared for the
ILS 26 approach."
Page 81
• CHECK ALL DATA MARKER SWITCHES OFF!!!
• Un-pause scenario
• Warn participant about power setting
• Warn participant that AP and FD are being turned off, then turn them
off
• 22,5 DME
• "CAPT, LOC course bar coming alive."
• Participant should commence 10-15 deg AOB turn to right to intercept
258M
• Set heading bug to 258, tell participant
• 20.5-19.0 DME
• LOC course should be centered
• 16.5 DME
• "CAPT, GS coming alive."
• 15.5 DME
• "CAPT, 1 dot below GS. Checklist calls for lowering the gear."
• Advise and drop landing gear if participant does not
• 14 DME
• "Gear indicates 3 down and locked."
• Aircraft should be on GS and descending
• "CAPT, on GS. Checklist calls for flaps 40."
• Advise and lower flaps to 40 if participant does not
• "Lear 3XY, tower, you are cleared to land runway 06."
• Tracking LOC and GS
• Aircraft should be on LOC and GS with
• Power = 53% Ni
• Airspeed = 140 KIAS
• Attitude = 2 deg nose up
• Flaps = 40 degrees
• Gear = Down
• VSI = 500-600 FPM descent
Page 82
o Bnef Missed Approach procedure
• Set power to about 65% N\
• Nose 10 degrees up
• Set Flaps 20
• 3 DME = MUST BE EXECUTED FOR TRAINING!!!
• Missed Approach instructions
• Right turn to 300M or
• Left turn to 230M
• And climb to 5000 FT MSL
• Scenario is complete when missed approach instructions are complete
7. Stop the Flight Recorder utility:
a. Click on "Recorder" in menu bar, then select "Recording" with a red
circle in front of it
b. Click on "Recorder" again, verify has changed to "Not Recording" with
black square in front of it
TRAINING SCENARIO THREE
participant flies KGUC ILS 06 to landing with E-PFD
KGUC/ RWY 06/ ILS 110.50/ FAC 062/ Field Elevation 7673 MSL
8. To reset to KGUC:
a. From MSFS menu bar, select "Flight" then "Select A Flight" to open
flight dialog box (same as when MSFS first opened on initial start)
b. Select "KGUC Start-AP On" flight
c. From configuration utility, verify "KGUC" and "06" entered into airport
and runway text boxes and verify correct settings for E-PFD display
condition.
9. Objective:
a. With terrain on, intercept and track localizer and glide slope to landing
b. Look at different terrain and how it displays
c. Same style approach, but to different airport
i. Same airport as experimental scenarios
ii. New DME for configuration changes
Page 83
70
10. Start the Flight Recorder utility:
a. Click on "Recorder" again, then select "Not Recording" with black square
in front of it
b. Click on "Recorder" again, verify has changed to "Recording" with a red
circle in front of it
11. Reset the MSFS clock seconds to XX:XX:00
a. XX:XX will be auto-selected from PC's system time and is not selectable
b. Click on :00 to reset to :00
12. Participant starts paused with AP and FD engaged with the following parameters
set:
• Power = 53 % Ni
• Airspeed = 140 KIAS
• Attitude = 7 degrees nose up
• Flaps = 20 degrees
• Gear = Up
• Altitude = 10,500 MSL
• Distance = 23 DME
• Heading = 030 M
• ATC: "Lear 3XY, tower, you are 24 miles from the airport. Maintain
heading 030 and 10500 until established on the approach. You are cleared
for the ILS 06 approach."
• CHECK ALL DATA MARKER SWITCHES OFF!!!
• Un-pause scenario
• Warn participant about power setting
• Warn participant that AP and FD are being turned off, then turn them
off
Page 84
20.5 DME
• "CAPT, LOC course bar coming alive."
• Participant should commence 10-15 deg AOB turn to right to
intercept 062M
• Set heading bug to 062, tell participant
19.5 - 19.0 DME
• LOC course should be centered
11.5-11.3 DME
• "CAPT, GS coming alive."
10.5 DME
• "CAPT, 1 dot below GS. Checklist calls for lowering the
gear."
• Advise and drop landing gear if participant does not
10 DME
• "Gear indicates 3 down and locked."
• Aircraft should be on GS and descending
• "CAPT, on GS. Checklist calls for flaps 40."
• Advise and lower flaps to 40 if participant does not
• "Lear 3XY, tower, you are cleared to land runway 06."
Tracking LOC and GS
• Aircraft should be on LOC and GS with
• Power = 53% Ni
• Airspeed = 140 KIAS
• Attitude = 2 deg nose up
• Flaps = 40 degrees
• Gear = Down
• VSI = 600-700 FPM descent
6 DME
• Aircraft should be at 9300 MSL
Page 85
72
• 3 DME= Missed Approach Point
• DH is 8250, aircraft should be at 8200 MSL
• Landing is communicated
a. At MAP:
i. "Lear 3XY, tower, you are cleared to land runway 06."
ii. Use the "." (period) key to apply brakes
iii. Scenario is over when aircraft is stopped
13. Press "Crtl;" on keyboard to reset scenario
14. Stop the Flight Recorder utility:
a. Click on "Recorder" in menu bar, then select "Recording" with a red
circle in front of it
b. Click on "Recorder" again, verify has changed to "Not Recording" with
black square in front of it
15. Administer practice between run questionnaire
16. Administer practice between run NASA TLX
17. Pause video camera & note time remaining:
18. Set-up display condition for next scenario
19. Ask participant their comfort level with MSFS aircraft control and response
a. Record at bottom of between run questionnaire
Page 86
Appendix E: Participant Simplified Approach Plate
Final Approach Course = 062
DH = 7950 FT
73
MSA
12 DME G/S Active
19-20 DME Localizer Centered FAC: 062M
10 DME Intercept G/S— Flaps 40
11 DME 1 Dot Above G/S—Lower Gear
Right Turn to 062M
21 DME Localizer Active Begin Intercept
START
Dist: 24 DME Alt: 10,500 MSL Flaps: 20 Gear: Up HDG: 030
Page 87
74
Appendix F: Experimental Script for Scenario One
Participant #: Experience Level:
Trial #: Display Condition:
EXPERIMENTAL SCENARIO ONE
Participant flies KGUC ILS 06 to missed approach to left
20. Boot equipment for appropriate display condition
a. Explain display condition to Participant
21. Turn "Scenario Card" to "SCENARIO 1"
22. To reset to beginning point for KGUC:
a. Press "CTRL;"
b. From configuration utility, verify "KGUC" and "06" entered into airport
and runway text boxes and verify correct settings for display condition.
23. Start the Flight Recorder utility:
a. Click on "Recorder" in menu bar
i. Rename data file according to guide
ii. Click "Save" then "OK"
b. Click on "Recorder" again, then select "Not Recording" with black square
in front of it
c. Click on "Recorder" again, verify has changed to "Recording" with a red
circle in front of it
24. Reset the MSFS clock seconds to XX:XX:00
25. Start video recording
26. Participant starts paused with AP and FD engaged with the following parameters
set:
• Power = 53 % Ni
• Airspeed = 140 KIAS
• Attitude = 7 degrees nose up
• Flaps = 20 degrees
• Gear = Up
Page 88
• Altitude = 10,500 MSL
• Distance = 23 DME
• Heading = 030 M
• ATC: "Lear 3XY, tower, you are 24 miles from the airport. Maintain
heading 030 and 10500 until established on the approach. You are cleared
for the ILS 06 approach."
• CHECK ALL DATA MARKER SWITCHES OFF!!!
• Especially De-Ice and Generators (ON)
• Un-pause scenario
• Warn Participant about power setting
• Warn Participant that AP and FD are being turned off, then turn them*
off
• 20.5 DME
• "CAPT, LOC course bar coming alive."
• Participant should commence 10-15 deg AOB turn to right to
intercept 062M
• Set heading bug to 062, tell Participant
• 19.5-19.0 DME
• LOC course should be centered
• 11.5-11.3 DME
• "CAPT, GS coming alive."
• 10.5 DME
• "CAPT, 1 dot below GS. Checklist calls for lowering the
gear."
• Advise and drop landing gear if Participant does not
• 10 DME
• "Gear indicated 3 down and locked."
• Aircraft should be on GS and descending
• "CAPT, on GS. Checklist calls for flaps 40."
• Advise and lower flaps to 40 if Participant does not
• "Lear 3XY, tower, you are cleared to land runway 06."
Page 89
• 3 DME = MAP
i. "Lear 3XY, tower, clearance cancelled for an aircraft on the
runway. Turn left to 010 and climb to 9000 ft." pause for
Participant response "Expect turn to downwind for sequencing
in three minutes."
ii. Turn on Pitot Heat = Missed Approach instructions given
iii. Back up Participant's missed approach as appropriate:
1. Power to about 65% Ni
2. Nose 10 degrees up
3. Set Flaps 20
4. Set heading bug to 010
iv. Insert data markers as appropriate:
v. !!! De-ice = Missed Approach Instructions Complete !!!
• Note Time
• Add three minutes : :
• Navigation Lights = CFIT recognition time
• Beacon Lights = CFIT avoidance maneuver initiated
• Left Generator Switch = "CAUTION- TERRAIN," yellow alert
• Right Generator Switch = EGPWS "PULL UP," red alert
• Scenario is over when CFIT occurs or 3 minutes has elapsed from time or
Participant completing missed instructions
27. Press "Ctrl;" on keyboard to reset scenario
28. Verify the Flight Recorder utility has stopped:
a. Click on "Recorder" in menu bar, verify has changed to "Not Recording"
with black square in front of it
b. !!!!!DO NOT START RECORDING AGAIN!!!!!
Page 90
77
29. Administer between run questionnaire
30. Administer between run NASA TLX
31. Pause video & note time remaining: minutes
32. Fill out below table:
Did Potential for CFIT Exist?
Did Participant Recognize Potential?
Did Participant Take Evasive Action?
Did a CFIT occur?
Yes
Yes
Yes
Yes
No
No
No
No
33. Set-up for next display condition
34. Ask if Participant needs a break (rest eyes or use restroom)
Page 91
78
Appendix G: First and Last Data Points in Trial Data File of 690 Data Points
<?xml version="1.0" ?> <flydata xmlns= "ht tp: / /www.avsim.com/hangar /ut i ls /nav /F l t rec /VO"
xmlns:xsi = "ht tp: / /www.w3.org /2001/XMLSchema- instance" xsi:schemaLocation= h t tp : / /www.avs im.com/hangar /u t i l s /nav /F l t rec /VO ht tp : / /www.xml .org /xml /schema/a7c9855f /F l tRec_fs2002 .xsd" fltrecversion="9.0.0.0" >
<setname>a_vars</setname> <d GR0UND_ALTITUDE="9187.52869" CL0CK_H0UR="10" CL0CK_MINUTE="34"
CLOCK_SECOND="0" STROBE_LIGHTS="false" PITOT_HEAT= "false" VOR1_GS_NEEDLE="0.00000" VORl_GS_FLAG="false" V0R1_IDENTITY="IGUC" AIRCRAFT_ON_GROUND="false" AIRSPEED="138.11504" VERTICAL_SPEED="-614" ATTITUDE_INDICAT0R_PITCH_DEGREES="-4.69491" ATTITUDE_INDICATOR_BANK_DEGREES="0.00000" PLANE_HEADING_DEGREES_GYRO="30.00183" AUTOPILOT_ACTIVE="true" FLAPS_HANDLE_POS="66.66667" GEAR_HANDLE_POS="0.00000" CLOCK_TOTAL_SECONDS="38040.00000" ELAPSED_SECONDS="6313.27401" . RADIO_HEIGHT= "429.51980" NAV_LIGHTS="false" TURB_ENGINE_1_N1 = "59.89986" PANEL_ANTIICE_SWITCH = "false" GENERATOR_ALTERNATOR_1_BUS_VOLTAGE = "13.80000" GENERATOR_ALTERNATOR_1_BUS_AMPS="3.50000" GENERATOR_ALTERNATOR_2_BUS_VOLTAGE="13.80000" GENERATOR_ALTERNATOR_2_BUS_AMPS="3.50000" GPS_POSITION_LAT= "38.39055550" GPS_POSITION_LON = "-107.37420508" GPS_POSITION_ALT="10596.78317" HSI_VERTICAL_NEEDLE="-1.00000" HSI_HORIZONTAL_NEEDLE="0.00000" HSI_VERTICAL_VALID="true" HSI_HORIZONTAL_VALID="false" HSI_DESIRED_HEADING_NEEDLE="30.00000" HSI_BEARING = "0.00000" HSI_SIGNAL_LOCALISER="true" HSI_DISTANCE = "23 .56551" / >
<d GROUND_ALTITUDE = "0.00000" CL0CK_H0UR="10" CL0CK_MINUTE="34" CL0CK_SEC0ND="48" STROBE_LIGHTS="false" PITOT_HEAT= "false" VOR1_GS_NEEDLE="0.00000" VORl_GS_FLAG="false" V0R1_IDENTITY="IGUC" AIRCRAFT_0N_GR0UND="false" AIRSPEED="186.51778" VERTICAL_SPEED="0" ATTITUDE_INDICATOR_PITCH_DEGREES="0.00000" ATTITUDE_INDICATOR_BANK_DEGREES="0.00000" PLANE_HEADING_DEGREES_GYRO="0.00000" AUTOPILOT_ACTIVE="true" FLAPS_HANDLE_P0S="66.66667" GEAR_HANDLE_POS="0.00000" CLOCK_TOTAL_SECONDS="38088.00000" ELAPSED_SECONDS="7006.21805" RADI0_HEIGHT="3225.69839" NAV_LIGHTS="false" TURB_ENGINE_1_N1 = "77.05915" PANEL_ANTIICE_SWITCH = "true" GENERATOR_ALTERNATOR_1_BUS_VOLTAGE="12.00000" GENERATOR_ALTERNATOR_1_BUS_AMPS="3.50000" GENERAT0R_ALTERNAT0R_2_BUS_V0LTAGE = " 12.00000" GENERATOR_ALTERNATOR_2_BUS_AMPS="3.50000" GPS_POSITION_LAT= "38.38657036" GPS_P0SITI0N_L0N = "-107.37879625" GPS_P0SITI0N_ALT="10583.51643" HSI_VERTICAL_NEEDLE="-1.00000" HSI_HORIZONTAL_NEEDLE="0.00000" HSI_VERTICAL_VALID="true" HSI_HORIZONTAL_VALID="false" HSI_DESIRED_HEADING_NEEDLE = "30.00000" HSI_BEARING = "0.00000" HSI_SIGNAL_LOCALISER="true" HSI_DISTANCE="23.85801" / > </flydata>
Page 92
79
Appendix H: Full Data Table
Run 1 2 3 4 5 6 7 8 9 10 11 12 13 14 15 16 17 18 19 20 21 22 23 24 25 26 27 28 29 30 31 32 33 34 35 36 37 38 39 40 41 42 43 44 45 46
Subj 1 1 1 1 2 2 2 2 3 3 3 3 4 4 4 4 5 5 5 5 6 6 6 6 7 7 7 7 8 8
8 9 9 9 9 10 10 10 10 11 11 11 11 12 12
Exp 3 3 3 3 3 3 3 3 3 3 3 3 2 2 2 2
4
2 2 2 2 3 3 3 3 3 3
Trial 1 Cond
1 Scenario
3 2 | 2 2 3f 3 1 4| 4 4 l| 2 2 3 1 3| 2 4 4 1 2
1 3 1
3 1 4
3| 4| 3 4l 2 l| 4: 3 2 ~~3j 4 3| 2 1 4 1
1 1
2 1
2l 2 4 3f 3 2 4| 3 l| 4 4 2f 3 2 3| 3 4 1 2
1 3 1
3JI 4 4 l 2
I 2 2l 4
3 4 1
3 1
1 2 3 1 4 3 1 4 2 1
2 | 2 4 3 3 2 4| 4 3 1 3 4 2 1 1
3| 4 2 4| 2
11 2 2 l 4
3 4
1 3
3 4 3 2 1
1 | 2 4 2 | 4 3
Ttl_Hrs 1004 1004 1004 1004 935 935 935 935 985 985 985 985
3045 3045 3045 3045 124 124 124 124 156 156 156 156 129 129 129 129 95 95
95 79 79 79 79 253 253 253 253 486 486 486 486 348 348
lnst_Hrs 108 108 108 108 107 107 107 107 120 120 120 120 23 23 23 23 10 10 10 10 40 40 40 40 24 24 24 24 6 6 6 6 9 9 9 9 51 51 51 51 105 105 105 105 100 100
Age 24 24 24 24 23 23 23 23 25 25 25 25 34 34 34 34 23 23 23 23 22 22 22 22 20 20 20 20 22 22 22 22 21 21 21 21 20 20 20 20 27 27 27 27 23 23
Rschr 1 1 1 1 2 2 2 2 1 1 1 1 2 2 2
CFIT 1
0 0 0 0 0 0 0 0 0 0 0 0 0 0
1 1
Jj ° 0 0 0
1 0|
1 2 2 2 2
0 0 0
0 0 0 0 0 • 0 0 0 0 1 0 0 0 0 1 0 0 0
Page 93
80
47 48 49 50 51 52 53 54 55 56 57 58 59 60 61 62 63 64 65 66 67 68 69 70 71 72 73 74 75 76 77 78 79 80 81 82 83 84 85 86 87 88 89 90 91 92 93 94 95 96 97
12 12 13 13 13
3| 3| 1 1 1 3
3 3
3 13| 3 14 14 14 14 15 15 15 15 16 16 16 16 17 17 17 17 18 18 18 18 19 19 19 19 20 20 20 20 21 21 21 21 22 22 22 22 23 23 23 23 24 24 24 24 25
1 1 1 1 2 2 2 2 1 1 1 1 2 2 2 2 3 3 3 3 2 2 2 2 1 1 1 1 2 2 2 2 2 2 2 2 2 2 2 2 4 4 4 4 3
4 3 1 1 2 3 4 1 2
2 3 4 4
2' 348 100 23 1 3 2 1
348 100 23 700 210 28 700i 210, 28 700 210 28
4| 700 210 28 4
3| 2 3| 2 4 1 2 3 4 1 2
1 1
2 3 4 3 1
3 1 2 3 4 1 1 3
3| 4| 1 4[ 2
1 2 3 4
4 1 3
4 1 2 3 4
1| ,.4| 2 2 3| 1 31 2 4 4 1
1 1
3 2
2! 2| 3 3i 3 4| 4 1 2 3 4 1 2
2 4 1 3 3 1
3 | 4 4 1 2 3 4 1
2 2 4 1 3 4
2 2 3 4 1 2 3
3 1 4 3 1
4F 2
1 2
4 1 3 1 4 2 4 1 2 3 1 2 3 4 3 4 1 2 1 3 4 2 1
56 56 56 56
1500 1500 1500 1500 204 204 204 204 204 204 204 204 1092 1092 1092 1092 266 266 266 266 421 421 421 421 461 461 461 461 705 705 705 705 519 519 519 519
15000 15000 15000 15000 434
4 4 4 4 75 75 75 75 47 47 47 47 42 42 42 42 69 69 69 69 94 94 94 94 98 98 98 98 86 86 86 86 61 61 61 61 92 92 92 92
13000 13000
20 20 20 20 25 25
2 0|
o 1| 0
1 2 2
25 2 25 20 20 20 20 20 20
2 1 1 1 1 2 2
20 • 2 20l 2 27 27 27
2 2 2
271 2 21 21 21 21 26 26 26 26 30 30 30 30 24 24 24 24 22 22 22 22 44 44
130001 44 13000 110
44 22
2 2 2 2
J • • •
0 0 0 0 0 0 0 0 0
0 0 0 0
0 0 0 0 0 0 0 0
0 0 0 0 0 0 0 0 0 0
1] 0
o M 1 0
Page 94
81
98 99 100 101 102 103 104 105 106 107 108 109 110 111 112 113 114 115 116 117 118 119 120 121 122 123 124 125 126 127 128
25 25 25 26 26 26 26 27 27 27 27 28 28 28 28 29 29 29 29 30 30 30 30 31 31 31 31 32 32 32 32
3 3 3 4 4 4 4 4 4 4 4 4 4 4 4 3 3 3 3 1 1 1 1 4 4 4 4 4 4 4 4
2 3 4 1 2
1
4 3 3 1
3| 4 4t 2 1| 2 2l 4 3 4 1 2 3 4 1 2 3 4 1 2
1 3 1 2 3
3 p 1 3 1
3 4 4 | 1 2 3 4 1
2
1 3 1
2 2
-C 4 4
4 3 2 3 2 4 1 2 4
1 3 4 1 3 2 1 3 2 4 3 2 4 1 2 4 1 3 4
1 3 2
434 434 434
26000 26000 26000 26000 25500 25500 25500 25500 14000 14000 14000 14000 1100 1100 1100 1100 125 125 125 125
20000 20000 20000 20000 20000 20000 20000 20000
110 110 110
20000 20000 20000 20000 20000 20000 20000 20000 13250 13250 13250 13250 300 300 300 300 4 4 4 4
17000 17000 17000 17000 17000 17000 17000 17000
22 22 22 56 56 56 56 63 63 63 63 60 60 60 60 25 25 25 25 26 26 26 26 67 67 67 67 53 53 53 53
1 1 1 2 2 2 2
2 2 2 2
1 1 1 1 2 2 2 2 1 1
0 0 0 0
0 0 0 0 0 0 n
*̂ 0 0 0 0 0
o
0 0 0 0
o|
o| 1l 1 o|
Page 95
82
|Run |Recog_Time
2 3 4
5 6 7 8
9 10 11 12
13 14
15
16 17 18
19 20 21
2? 23 24
25 26 27
28 29
30
31 32
33 34
35
36
37 38
39
40
41
42
43
44
45
38509 38630
38674
0 38612
38681
0
0 38696 38581 38612
0
38759 38636
0
C 38598
38635 38655
38640 38678 38714
0 38709
38663 38782
0 38642
38691 38655
0 0
38640 0
0
0 38574
0 38737
38637
38657
38695
38748
Recog_Dist|Recog_Adv_140Recoq Use Display no data
5.1 4
1.5 0
3.9
8.3
0
0 0
4.7
4.8 0
1.8 3.5
0
0 9.6
2.1 7.4
4 1
0.1
0 0.1 1.6 1.4
0 2.5
2.5 2.5
0
0
2.3
0
0 0
4.2
0
2.1
4.8
4.7
3
3
2.186 1.714
0.643
0.000 1.671
3.557
0.000
0.000 0.000 2.014 2.057 0.000
0.771 1.500 0.000
0.000 4.114
1.414 0.900 3.171
1.714 0.429 0.043
o.ooo ^_ 0.043
0.686 0.600 0.000 1.071
1.071 1.071
0.000
0.000
0.986 0.000
O.OOC
0.000
1.800
0.000
0.900 2.057
2.014
1.286
1.286
1 1
1
0 1
1 1
1 1 1 1
0 1 1
0
A 1
1 1 1 1
1 1
0 1 1
1
0 1
1 1
0 0 1
0
1 0
1
0 1
1
1
1
1
Page 96
46 ! 47 1 48 ! 49
50 1 51 I 52 | 53 i 54
i 55 | 56
57 58
< 59 i 60 61 62
! 63 I 64 65 66
! 67 ; 68
I 69 ! 70 1 71
72 73 74
i 75
i 76 77 78
I 79 80 81
' 82
83 84 85 86 87 88 89 90 91 92 93
38616 0 0 0
38602 38743
38633
0 38737
38696 0 0 0
38699
38663 38668
38670 38659 38645
0 0
38732 38776 38708 38634 38627
0 38767
38666 38556
38580 0
38710 38711
38638
38671 38582
38614
38616
38666
38552
38599
38592
38685
38702
38691
38659
38668
3.1 0 0 0
4.3 0
5.9 0 2
2.4 0 0 0
5.6 1.8 0.9 1.1 3.8 10.2 0 0
0.1 4.3 6.4 2
11.5 0
3.4 4.3 11.4
5 0
6.2 4.3 3.7 7.1 4.5 4.1 4.3 1.7 3.6 4.8 11.5
3.6 7.7 3
3.7 1.8
1.329
0.000
0.000 0.000
1.843
0.000 2.529
0.000 0.857
1.029
o.ooq 0.000 0.000 2.400 0.771
0.386 0.471
1.629 4.371
0.000 0.000 0.043 1.843 2.743 0.857 4.929
0.000 1.457
1.843 4.886 2.143 0.000 2.657
1.843 1.586
3.043 1.929 1.757
1.843 0.729
1.543 2.057
4.929
1.543
3.300
1.286
1.586
0.771
1 0
L _j 0
1J 1 1
~~q 1 1 a ol a 1
*|
Cj a
a
a
Page 97
94 95 96 97 98 99 100 101 102 103 104 105 106 107 108 109 110 111 112 113 114 115 116 117 118 119 120 121 122 123 124 125 126 127 128
0 38639
38649
38710
38638 38694
no data 38597
38634
38593
38689
38668 38608 38553
38591
38693 no data
38660 38557
0 38693
0 0
38712
0 38669
38626
C 0 0 0 0
38660 38777
38637
0 2 9
1.2 7.8 3.6
no data 5.7 3.7 9.7 2.3 4.1 8.2 5.3 4.9 1.3
no data 0.1 4.7 0
3.2 0 0
0.2 0 10 2.7
0 0 0 0
1.6 0.3 1.9
0.000 0.857
3.857 0.514
3.343 1.543
no data
2.443 1.586 4.157
0.986 1.757 3.514 2.271
2.100 0.557
no data 0.043 2.014 0.000 1.371
0 0
0.086 0.000 4.286 1.157
o.ooc 0.000 0.000 0.000 0.000 0.686 0.129 0.814
I 1 1 1 1 1 1
no data
1 1 1 1 1 1 1 1 1
no data 1 1 0 1 0 0 1 0 1 1 0 d 0 0 0 1 1 1
Page 98
85
IjnWlEWTffKifflJI :
2 3 4 5 6 7 8
9 10 11 12 13 14 15 16
38521 38643 38679 38678 38664 38715 38660
0 38697 38608 38648 38663 38793 38644 38702
I 17| 0
he 20 21 22 23 24 25 26 27 28 29 30 31 32 33 34 35 36
K 38 39 40 41 42 43 44 45 46
38722
38658 38655 38634 38679 38715 38636 38710 38664 38791 38644 38658 38781 38685
0 38642 38644 38652
wmiML 0
38571 38593 38736 38635
0 38720 38749 38629
Delay_Time Delay_Dist_140 Avoid_Dist_140
12 13 5 0
52 34 0 0 1
27 36
0 34
8 0 C
124
o 23
0 -6 1 1
38636 1 1 9 0
16 90 30
0 0 4 0 0 0
-3 0
-1 -2 0
25 1
13
PVHVWPHH H * P W V P V
0.5 0.5 0.2 0.0 2.0 1.3 0.0 0.0 0.0 1.1 1.4 0.0 1.3 0.3 0.0 0.0 4.8 0.0 0.9 0.0
-0.2 0.0 0.0
1502.5 0.0 0.0 0.4 0.0 0.6 3.5 1.2 0.0 0.0 0.2 0.0 0.0 0.0
-0.1 0.0 0.0
-0.1 0.0 1.0 0.0 0.5
4.6 3.5 1.3 2.8 1.9 7.0 4.4 0.0 0.0 3.7 3.4 2.0 0.5 3.2 0.1 0.0 4.8 0.0 1.2 7.4 4.2 1.0 0.1
-1502.5 0.1 1.6 1.1 3.5 1.9
-1.0 1.3 0.0 0.9 2.1 2.1 0.0 0.0 4.3 3.8 2.1 4.9
L_ °-° 2.0 3.0 2.6
Avoid Adv 140 no data
1.986 1.498 0.560 1.200 0.805 2.990 1.886 0.000 0.000 1.564 1.457 0.857 0.205 1.367 0.043 0.000 2.048 0.000 0.517 3.171 1.814 0.412 0.026
-643.933 0.026 0.669 0.450 1.500 0.805
-0.429 0.571 0.000 0.386 0.919 0.900 0.000 0.000 1.850 1.629 0.917 2.090 0.000 0.869 1.269 1.112
Avoid_Use_Display no data !
"J
"|
1
1
a i] o
1
1
1
0
1 0
1
0
Page 99
86
47| 0 0 0.0
H48 4 0 49 50 51 52 53 54 55 56 57 58 59 60 61 62 63 64 65 66 67 68 69 70 71 72 73 74 75 76 77 78 79 80 81 82 83 84 85 86 87 88 89 90 91 92 93
0 38608
0 6
q 0 38688
o 38742
38695 0 0
38626 38794 38669 38680 38679 38723 38703 38692 38620 38736 38819 38779 38657 38669
0 0
38665 38587 38597 38621 38761 38750 38722 38751 38672 38648 38625
38678 38613 38651 38660 38677 38702
38703
38660 38673
94 0 95 38666
55
o 5 -1 0 0 0 95 6 12 9 64 58 0 0 4 43 71
I 23 42 0 0 -1 31 17 0 51 39 84 80 90 34 9 12 61 52 68 -8 0 12 1 5 0 27
0.0 0.2 0.0 2.1
0.2 0.0 0.0 0.0 0.0 3.7 0.2 0.5 0.4 2.5 2.3 0.0 0.0 0.1 1.7 2.8 0.9 1.6 0.0 0
0.0 1.2 0.7 0.0 2.0 1.5 3.3 3.1 3.5 1.3 0.4 0.5 2.4 2.0 2.6 -0.3 0.0 0.5 0.0 0.2 0.0 1.1
0.0 0.0 0.0 4.1 o.Q 3.8 o.o 1.8 2.4 0.0 0.0 3.5 1.9 1.6 0.4 0.8 1.3 7.9 0.9 2.7 0.0 2.6 3.6 1.1 9.9 0.0 0
4.3 10.2 4.3 2.7 4.2 2.8 0.4 4.0 1.0 2.8 4.0 1.2 1.2 2.8 8.9 3.9 7.7 2.5 3.7 1.6 0.0 1.0
0.000 0.000 0.000 1.743 0.000 1.612 0.000 0.774
1.045 0.000 0.000 1.500 0.817 0.671 0.186 0.321 0.562 3.405 0.386 1.157 0.000 1.126 1.560 0.474 4.229 0.000
0 1.860 4.369 1.860 1.157 1.807 1.193 0.186 1.710 0.429 1.190 1.693 0.529 0.526 1.190 3.795 1.676 3.300
1.086 1.569 0.688
0.000 0.407
0
0
0
0
0 0
0 0
1 1
Page 100
87
96 97
98 99
100 101 102 103 104 105 106 107 108 109 110 111 112 113 114 115
116 117 118 119 120 121 122 123 124
125 126 127
128
38648 38711
38772 38704
no data 38741 38721 38651 38723 38693 38638 38642 38611 38693
no data 38660 38607 38727 38722 38695
0 38717
0 38682 38633
0 38709
0 38761
0 38657 38785 38638
-1
1 134 10
no data 144 87 58 34 25 30 89 20 0
no data 0 50 0 29 0
5 0 13 7 0 0 0 0 0 -3 8 1
0.0
0.0 5.2 0.4
no data 5.6 3.4 2.3 1.3
1.0 1.2 3.5 0.8 0.0
no data 0.0 1.9 0.0 1.1 0.0 0.0 0.2 0.0 0.5 0.3 0.0 0.0 0.0 0.0 0.0 -0.1 0.3 0.0
9.0 1.2
2.6 3.2
no data
0.1 0.3 7.4
1.0 3.1 7.0 1.8 4.1
1.3 no data
0.1 2.8 2.0 2.1 4.6 O.C 0.0 0.0 9.5 2.4
0.0 9.1 0.0 0.1 0.0 1.7 0.0 1.9
3.874 0.498
1.110 1.376
no data 0.043
0.136 3.190 0.419 1.340 3.014 0.788 1.767 0.557
no data 0.043 1.181 0.857 0.888 1.971
0.000 0.002 0.000 4.069 1.040 0.000 3.900 0.000 0.043 0.000 0.736
^_ -0.005 0.798
1
no data
•j
1 no data
J 0
0
0
0
Page 101
Run EGPWS_Ctn EGPWS_Wrn
2 3 4 5 6 7 8 9 10 11 12 13 14 15 16 17 18. 19 20 21 22 23 24 25 26 27 28 29
i 30 1 31
32 1 33
34 35 36 37
! 38
39 40 41 42 43 44 45
38515 0
38676 38659
0 0 0 0 0
38606 38647
38655 0 0 0
I 0 38701
0 38645 38630
0 —o1
38629 0
38655 0
38642
38656
0 0 0
38622
0 38644
0 0
38562 38587
38730
38633
0 0
38743
Ino data 38520
L 0 38681 38670
r Zs d
I i \ i 1 _ q
q 38649 38659
d d q
L Zg 38719
d 38653 38638
(3 d
38631 q
38661 d d d d q d
3863q
d 3865q
d q q
3859q 38734
38634
— 9 d d
Page 102
46 I 47
38627
0 1 48| 0 ; 49
! 50
51 i 52 | 53 I 54 ! 55 ! 56
57 ! 58
I 59 i 60
I 61 i 62
I 63 ! 64
65 I 66 ! 67 | 68
! 69 I 70 I 71 ! 72 | 73
I 74 r 75
i 76
! 77
I 78 ! 79 ! 80
81 82 83
i 84
85 | 86
87 j 88
89 90 91 92 93
0 38600
0 38681
38706 0
38679
0 0 0 0
38666 0 0
38716 38697
,_ 38678 38605
r~ o 0
L 38774 0
38668 0 0
38661 0 0
38615 38757
d o| 0 d
38641
38622
38663
38612 0 d
38672
38697
d 0
38661
38628]
[ q d q
38607̂
d q
38708 ol
3869q
d q
38623
d d d d
38721 38709 38684
38608 d ol q d d ol d
38663
d d
38624
d ol d d q
38650 38623
3868q
d d d d
38704
d d
38672|
Page 103
94 95 96 97 98 99 100 101 102 103 104 105 106 107 108 109 110 111 112 113 114 115 116 117 118 119 120 121 122 123 124 125 126 127 128
0 0 38644
38690
0 38696
no data 0 0
38643 38711
38685 38635
0 0
38690 no data
0 38604
38709 0
38688 0 0 0
38680 0 0
38696 0 0 0
38642
0 38630
0 0
38646
0 0
38700
no data 0 0
38649 38721
38691 38636
0 0
38695 no data
0 38605
0 0
38700
0 0 0
38680 0 0 0 0 0 0
38652 0
38633
Legend:
Run: Sequentially increasing data row marker, from 1-128.
Subj: Participant Number, from 1-32.
Exp: Participant's Experience Category, from 1-4.
1 = Private Pilot
2 = Low-time Instrument rated pilot
3 = High-time Instrument rated pilot
Page 104
91
4 = Airline Transport Pilot
Trial: Experimental trial number, from 1-4.
Cond: Experimental Display Condition, from 1-4.
1 = Baseline Display Condition
2 = KMD-540 EGPWS Display Condition
3 = SVS Terrain Display Condition
4 = Fully Enhanced Display Condition
Scenario: Experimental Scenario, from 1-4.
Ttl_Hrs: Participant's total number of flight hours.
Inst_Hrs: Participant's total instrument flight hours, simulated and actual.
Age: Participant's age.
Rschr: Used to identify which researcher conducted the experiment, either 1 or 2.
CFIT: Record CFIT occurrence, either 0 or 1.
0 = No CFIT
1=CFIT
Recog_Time: From data file, time at which participant recognized potential CFIT
situation existed.
Recog_Dist: Plotted distance to nearest 9000 ft contour at time of CFIT recognition.
Recog_Adv_140: Time to impact, at 140 kts, from recognition position.
Recog_UseJDisplay: Record of participant's use of the display in recognizing potential
CFIT situation, either 0 or 1.
0 = Not Used
1 = Used
AvoidJTime: From data file, time at which participant initiated CFIT avoidance
maneuver.
Delay_Time: Elapsed time between participant's recognition of CFIT potential and
initiation of an avoidance maneuver.
Page 105
Delay_Dist_140: Distance covered, at 140 kts, during the participant's delay in initiating
an avoidance maneuver.
Avoid_Dist_140: Distance from participant's position to CFIT obstacle when avoidance
maneuver was initiated.
Avoid_Adv_140: Time to impact, at 140 kts, from avoidance maneuver position.
Avoid_Use_Display: Record of participant's use of display in avoiding potential CFIT
situation, either 0 or 1.
0 = Not Used
1 = Used
EGPWS_Ctn: From data file, time when EGPWS displayed yellow terrain caution.
EGPWS_Wrn: From data file, time when EGPWS displayed red terrain warning.
Page 106
93
Research Bibliography
Arthur, J. J., Prinzel, L. J., Kramer, L. J., Bailey, R. E., & Parrish, R. V. (2003). CFIT
Prevention Using Synthetic Vision. Proceedings ofSPIE, Enhanced and
Synthetic Vision 2003\ Editor Jacques G. Verly, Volume 5081, 146-157.
Arthur, J. J., Prinzel, L. J., Kramer, L. J., Parrish, R. V., & Bailey, R. E. (2004). Flight
Simulator Evaluation of Synthetic Vision Display Concepts to Prevent Controlled
Flight Into Terrain (CFIT). NASA Langley Research Center: NASA Technical
Paper TP-2004-213008.
Bailey, R. E., Parrish, R. V., Kramer, L. J., Harrah, S., & Arthur, J. J. (2002). Technical
Challenges In the Development of a NASA Synthetic Vision System Concept.
Proceedings of the North Atlantic Treaty Organization Symposium on Enhanced
and Synthetic Vision Systems. Ottawa, Canada.
Bartolone, A. P., Glaab, L. J., Hughes, M. F., & Parrish, R. V. (n.d.). Initial
Development of a Metric To Describe the Level of Safety Associated with
Piloting An Aircraft with Synthetic Vision Systems (SVS) Displays. Retrieved
January 19, 2006 from
http://techreports.larc.nasa.gov/ltrs/PDF/2005/mtg/NASA-2005-spiedss-apb.pdf
Boy, G. A., & Ferro, D. (2003). Using Cognitive Function Analysis to Prevent
Controlled Flight Into Terrain. In D. Harris (Ed.), Human Factors and Flight
Deck Design. Ashgate, UK.
Page 107
Campbell, J. L., de Haag, M. U., Vadlamani, A., Young, S. (2003). The Application of
LIDAR to Synthetic Vision System Integrity. Proceedings of the 22nd Digital
Avionics Systems Conference. Indianapolis, IN.
Dowell, S. R., Foyle, D. C , Hooey, B. L., & Williams, J. L. (2002). The Effect of Visual
Location on Cognitive Tunneling with Superimposed HUD Symbology.
Proceedings of the 46th Annual Meeting of the Human Factors and Ergonomics
Society. Santa Monica, CA: Human Factors and Ergonomics Society.
Federal Aviation Administration. "Synthetic Vision and Pathway Depictions of the
Primary Flight Display." Advisory Circular 23-26, December 22, 2005.
Foyle, D. C , Ahumada, A. J., Larimer, J., & Sweet, B. T. (1992). Enhanced/ Synthetic
Vision Systems: Human Factors Research and Implications for Future Research.
SAE Transactions: Journal of Aerospace, Volume 101, 1734-1741.
Foyle, D. C, Hooey, B. L., Byrne, M. D., Corker, K. M., Deutsch, S., Lebiere, C , et al.
(2005). Human Performance Models of Pilot Behavior. Proceedings of the
Human Factors and Ergonomics Society 49th Annual Meeting, 1109-1113. Santa
Monica: Human Factors and Ergonomics Society.
Glaab, L. J., Kramer, L. J., Arthur, T., Parrish, R. V., & Barry, J. S. (2003). Flight Test
Comparison of Synthetic Vision Display Concepts at Dallas/ Forth Worth
International Airport. NASA Langley Research Center: NASA Technical Paper
TP-2003-212177.
Hooey, B. L„ Foyle, D. C , & Andre, A. D. (2002). A Human-Centered Methodology
For The Design, Evaluation, And Integration Of Cockpit Displays. Proceedings
Page 108
95
of the NATO RTO SCI and SET Symposium On Enhanced And Synthetic Vision
Systems.
Hughes, D. (2005, November 28). Virtual VFR Is Coming. Aviation Week & Space
Technology, 58-59.
Jennings, C, Alter, K, W., Barrows, A. K., Bernier, K., & Guell, J. (n.d.). Synthetic
Vision as an Integrated Element of an Enhanced Vision System. Retrieved
December 15, 2005 from
http://www.ascension-tech.com/applications/pdt7Aerosense02.pdf
Keller, J., Leiden, K. (2002). Information to Support the Human Performance Modeling
of a B757 Flight Crew During Approach and Landing: SVS Addendum.
Keller, J., Leiden, K., & Small, R. (2003). Cognitive Task Analysis of Commercial Jet
Aircraft Pilots During Instrument Approaches for Baseline And Synthetic Vision
Displays. Proceedings of the 2003 Conference on Human Performance Modeling
of Approach and Landing with Augmented Displays, 15-19. Moffett Field, CA:
NASA.
Keller, M., Schnell, T., Lemos, K., Glaad, L., & Parrish, R. (2003). Pilot Performance as
A Function of Display Resolution and Field of View In A Simulated Terrain
Following Flight Task Using a Synthetic Vision System. Proceedings of the 22
Digital Avionics Systems Conference. Indianapolis, IN.
Kerr, J. R., Luk, C. H., Hammerstrom, D., & Pavel, M. (n.d.). Advanced Integrated
Enhanced Vision Systems. Retrieved December 15, 2005 from
http://www.cecs.pdx.edu/~strom/papers/spie03.pdf
Page 109
96
Kramer, L. J., Prinzel, L. J., Bailey, R. E., & Arthur, J. J. (2003). Synthetic Vision
Enhances Situation Awareness And RNP Capabilities for Terrain-Challenged
Approaches. Proceedings of the American Institute of Aeronautics and
Astronautics Third Aviation Technology, Integration, and Operational Technical
Forum, AIAA 2003-6814, 1-11.
Kramer, L. J., Prinzel, L. J., Arthur, J. J., & Bailey, R. E. (2005). Advanced Pathway
Guidance Evaluations on a Synthetic Vision Head-Up Display. NASA Langley
Research Center: NASA Technical Paper TP-2005-213782.
Kramer, L. J., Prinzel, L. J., Arthur, J. J., & Bailey, R. E. (n.d.). Pathway Design Effects
on Synthetic Vision Head-Up Displays. Retrieved January 19, 2006 from
http://techreports.larc.nasa.gov/ltrs/PDF/2004/mtg/NASA-2004-dss-lik.pdf
Lemos, K., Schnell, T., Etherington, T., Vogel, T., & Postikov, A. (2003). Synthetic
Vision Systems: Human Performance Assessment of the Influence of Terrain
Density and Texture. Proceedings of the 22nd Digital Avionics Systems
Conference. Indianapolis, IN.
Lemos, K., Schnell, T., Gordon, D., & Etherington, T. (n.d.). "Bye-Bye Steam Gages,
Welcome Glass:" A Review of New Display Technology for General Aviation
Aircraft. Retrieved February 11, 2006 from
http://opl.ecn.uiowa.edu/ampm/Displav%20Paper%20Lemos%20DASC%202002
.pdf
Levy, J. L., Foyle, D. C , & McCann, R. S. (1998). Performance Benefits with Scene-
Linked HUD Symbology: An Attentional Phenomenon? Proceedings of the 42nd
Page 110
97
Annual Meeting of the Human Factors and Ergonomics Society, 11-15. Santa
Monica, CA: Human Factors and Ergonomics Society.
Mortimer, R. G., & von Thaden, T. L. (1999). Examination of Part 135 Controlled Flight
Into Terrain Accidents As A Basis for Enhanced Ground Proximity Warning
Systems. Proceedings of the 43rd Annual Meeting of the Human Factors and
Ergonomics Society, 11-15. Santa Monica, CA: Human Factors and Ergonomics
Society.
Newman, R. L. & Foyle, D.C. (2003). Test Scenarios for Rare Events. Proceedings of
the 12th International Symposium on Aviation Psychology, 873-882. Dayton,
OH: Wright State University.
Prinzel, L. J., Kramer, L. J., Comstock, J. R., Bailey, R. E., Hughes, M. F., & Parrish, R.
V. (2002). NASA Synthetic Vision EGE Flight Test. Proceedings of the Human
Factors and Ergonomics Society 46th Annual Meeting, 135-139. Santa Monica,
CA: Human Factors and Ergonomics Society.
Prinzel, L. J., Comstock, J. R., Glaab, L. J., Arthur, J. J., & Barry, J. S. (2004). The
Efficacy of Head-Down and Head-Up Synthetic Vision Display Concepts for
Retro- And Forward-Fit of Commercial Aircraft. The International Journal of
Aviation Psychology, 14(1), 53-57.
Prinzel, L. J., Kramer, L. J., Arthur, J. J., Bailey, R. E., & Sweeters, J. L. (n.d.).
Development and Evaluation of 2-D and 3-D Exocentric Synthetic Vision
Navigation Display Concepts for Commercial Aircraft. Retrieved January 19,
2005 from http://techreports.larc.nasa.gov/ltrs/PDF/2005/mtg/NASA-2005-
spiedss-ljp.pdf
Page 111
Schnell, T., Etherington, T., Vogel, & T., Postnikov, A. (n.d.). Field Evaluation of a
Synthetic Vision Information System Onboard the NASA Aries 757 at Eagle
County Regional Airport. Retrieved January 19, 2006 from
http://opl.ecn.uiowa.edu/ampm/Displav%20Paper%20Eagle%20Test%20DASC%
202002.pdf
Schnell, T., Kwon, Y., Merchant, S., & Eterington, T. (2004). Improved Flight Technical
Performance In Flight Decks Equipped With Synthetic Vision Information
System Displays. The International Journal Of Aviation Psychology, 14(1), 79-
102.
Shelden, S. G., Foyle, D. C, & McCann, R. S. (1997). Effects of Scene-Linked
Symbology on Flight Performance. Proceedings of the 41st Annual Meeting of the
Human Factors and Ergonomics Society, 294-298. Santa Monica: Human
Factors and Ergonomics Society.
Snow, M. P., & Reising, J. M. (1999). Effect of Pathway-In-The-Sky and Synthetic
Terrain Imagery on Situation Awareness in a Simulated Low-level Ingress
Scenario. Proceedings of the 4n Annual Symposium on Situation Awareness in
the Tactical Air Environment 198-207. Patuxent River, MD: Naval Air Warfare
Center Aircraft Division.
Theunissen, E., Koeners, G. J. M., Roefd, F. D., Rademaker, R. M., Jinkins, R. D., &
Etherington, T. J. (2005). Guidance, Situation Awareness and Integrity
Monitoring With A SVS+EVS. American Institute of Aeronautics and
Astronautics Guidance, Navigation, and Control Conference. San Francisco:
AIAA 2005-6441.
Page 112
Thomas, L. C , & Wickens, C. D. (2004). Eye-Tracking And Individual Differences In
Off-Normal Event Detection When Flying With A Synthetic Vision System
Display. Proceedings of the Human Factors and ergonomics Society 48th Annual
Meeting. Santa Monica: Human Factors and Ergonomics Society.
Wickens, C. D., Alexander, A. L., Horrey, W. J., Nunes, A., & Hardy, T. J. (2004).
Traffic and Flight Guidance Depiction on a Synthetic Vision System Display: The
Effects of Clutter on Performance and Visual Attention Allocation. Proceedings
of the Human Factors and Ergonomic Society 48* Annual Meeting. Santa
Monica: Human Factors and Ergonomics Society.
Wickens, C. D. (2005). Attentional Tunneling and Task Management. Proceedings of
the 13 International Symposium on Aviation Psychology. Dayton, OH.
Wickens, C. D., McCarley, J. S., Alexander, A. L., Thomas, L. C, Ambinder, M., &
Zheng, S. (2005). Attention-Situation Awareness (A-SA) Model of Pilot Error.
Technical Report AHFD-04-15/ NASA-04-5. Savoy, IL: University of Illinois,
Aviation Human Factors Division.
Wilson, J. R., Hooey, B. L., Foyle, D. C , & Williams, J. L. (2002). Comparing Pilots'
Taxi Performance, Situation Awareness and Workload Using Command-
Guidance, Situation-Guidance and Hybrid Head-up Display Symbologies.
Proceedings of the 46th Annual Meeting of the Human Factors and Ergonomics
Society. Santa Monica, CA: Human Factors and Ergonomics Society.
Yang, S., Schnell, T., & Lemos, K. (2003). Spatial Image Content Bandwidth
Requirements for Synthetic Vision Displays. Proceedings of the 22 Digital
Avionics Systems Conference. Indianapolis, IN.