The effect of fire regime on tropical savannas of north-eastern Australia: interpreting floristic patterns through critical life events. Thesis submitted by Paul Richard Williams BSc (Hons) University of New England in June 2002 for the degree of Doctor of Philosophy in Tropical Plant Sciences School of Tropical Biology James Cook University
Transcript
The effect of fire regime on tropical savannas of
north-eastern Australia: interpreting floristic
patterns through critical life events.
Thesis submitted by
Paul Richard Williams BSc (Hons) University of New England
in June 2002
for the degree of Doctor of Philosophy
in Tropical Plant Sciences
School of Tropical Biology
James Cook University
Statement of access.
Statement of Access.
I, the undersigned, the author of this thesis, understand that James Cook University will
make it available for use within the University library and, by microfilm or other
means, allow access to users in other approved libraries. All users consulting this thesis
will have to sign the following statement:
In consulting this thesis I agree not to copy or closely paraphrase it in whole or
in part without the written consent of the author; and to make proper public
written acknowledgement for any assistance which I have obtained from it.
Beyond this, I do not wish to place any restriction on access to this thesis.
…………………………………………. ……………………….
Paul Williams
i
Statement on sources declaration.
Statement on Sources Declaration.
I declare that this thesis is my own work and has not been submitted in any form for
another degree or diploma at any university or other institution of tertiary education.
Information derived from published or unpublished work of others has been
acknowledged in the text and a list of references is given.
…………………………………………. ……………………….
Paul Williams
ii
Acknowledgements.
Acknowledgements.
This thesis greatly benefited from the complete support and expert advice provided
throughout the project by my three supervisors, whom I thank sincerely for their
friendship and dedication: Dr Bob Congdon (James Cook University), Dr Tony Grice
(CSIRO) and Dr Peter Clarke (University of New England). This research would not
have occurred if were not for the enthusiastic support of the Townsville staff of
Queensland Parks and Wildlife Service, who implemented the fires at the Cape
Cleveland, Mt Elliot and Many Peaks Range sites, and maintained the fire breaks at
Cape Cleveland: Col Adams, Steve Brooker, Graeme Bulley, Michael Dicketts, Jim
Denison, Brett Galloway, Rob Graham, Doug Harrison and Denis Masters.
Mike Lloyd (Kings Park Botanic Gardens, Perth) kindly provided advice on the design
of the apparatus to produce the smoke exposure treatments and Brett Galloway
(Queensland Parks and Wildlife Service) expertly welded the smoke equipment
together.
James Cook University generously provided funding for field equipment, travel to
Christchurch to present some of the results of this research at the Bushfire 2001
conference, and to finalise the completion of the thesis. Queensland Parks and Wildlife
Service gave permission for the research to be undertaken at Bowling Green Bay
National Park and Town Common Conservation Park, and allowed me time during
work to implement the fires and undertake the annual floristic surveys (Chapter 2).
Townsville City Council, with particular thanks to Greg Bruce, provided permission to
survey plant regeneration on Castle Hill.
Thanks to Drs Malcolm Gill and Gay Crowley for providing valuable comments on a
draft of Chapter 1, and to the Queensland Herbarium staff, particularly Russell
Cumming, for taxonomical advice and identifying several specimens for me. Drs Mike
Steele (James Cook University) and Bob Mayer (Queensland Department of Primary
Industries) provided expert statistical advice. I appreciate the input from the many
friends with whom I discussed this project and fire management of savannas in general,
including Col Adams, Grant Anchen, Graeme Bulley, Greg Calvert, Gay Crowley, Tim
iii
Acknowledgements.
iv
Devlin, Leasie Felderhof, Adam Felton, Annika Felton, Malcolm Gill, Rob Graham,
Dave Green, John Hunter, Janice Jackson, Shayne Kimlin, Ken McMahon, Mark
Parsons, Jeremy Russell-Smith and Eddie Staier. Thanks also to Adam Felton for
producing the scanning electron microscope images of the Crotalaria montana seed
(Figure 4.1 and the inside-cover image), to Kate O’Donnell (CRC Tropical Savannas)
for producing Figure 1.1 and to Sharon King (Environmental Protection Agency) for
producing Figure 2.1.
I give special thanks to my wonderful girlfriend, Eleanor Collins, for your full support
throughout the project, assistance in the field, skill in scanning all photographs, as
general thesis editor, and for enduring my absence at Cape Cleveland during weekends
and holidays for 5 years. Most importantly of all, you kept things in perspective so that
I could continue to enjoy life while producing this thesis. Thank you.
I dedicate this thesis to the memory of my late father, John Cambell Williams, for his
commitment as a father and because his 48 years service with the one company
demonstrated to me perseverance.
Abstract.
Abstract.
The degree to which fire influences plant species composition and abundance (referred
to in this thesis as floristic patterns) in Australian tropical savannas has been the subject
of debate. Available information emphasises floristic patterns rather than the
mechanisms that determine patterns. The assessment of critical events in a plant’s life
cycle (referred to in this thesis as critical life events) is necessary to understand
population dynamics and therefore the processes that determine floristic patterns. Fire
may affect population size through its influence on one or more critical life events
including seed dormancy release, seed bank dynamics, seedling emergence, seedling
survival and the survival and growth of juvenile and mature plants.
This thesis presents data on floristic patterns in response to fire regimes in savannas of
north-eastern Australia, a region with limited quantitative information on fire response
at a community level; and contributes to the broader understanding of savanna function,
through an examination of life cycle processes. The aims of the research were to
examine the effect of fire regime on:
a) floristic patterns in eucalypt savannas in the vicinity of Townsville, north-eastern
Australia; and
b) critical life events, to investigate mechanisms determining floristic patterns.
To achieve these objectives, laboratory and shadehouse experiments were carried out
and surveys of seedling emergence and vegetative post-fire regeneration were
undertaken at four sites in the Townsville region. At one of these sites, Cape Cleveland,
floristic patterns and critical life events were studied in detail using a manipulative fire
experiment which examined three fire regimes between 1997 and 2001:
1. Control: savanna burnt in the mid dry season (July) 1997 only.
2. Early burnt: savanna burnt in the mid dry season 1997 and early dry season (May)
1999.
3. Late burnt: savanna burnt in the mid dry season 1997 and late dry season (Oct)
1999.
v
Abstract.
Five annual surveys of permanent plots at Cape Cleveland demonstrated a high degree
of stability in species composition, however the abundance of several species was
affected by fire regime. A significant increase in the abundance of various subshrubs,
ephemeral and twining perennial forbs, and grasses was detected in the first year after
fire, particularly following late dry season burning. The abundance of these species
declined towards pre-fire levels in the second year after fire. The dominant grass
Heteropogon triticeus significantly declined in abundance, and tree density increased,
with fire intervals of four years.
Investigations of critical life events detected mechanisms that determine floristic
patterns. A pulse of seedling emergence of subshrubs and herbaceous species occurred
in the post-fire wet season, with greatest seedling density following late dry season
fires. This pulse of seedling emergence explained the increase in plant abundance
documented in the year following fire. It resulted from seed dormancy release,
triggered by multiple fire-related agents, including the removal of herbaceous cover,
which increased germination of a range of species; and the exposure to: heat-shock,
which increased the germination of a range of forbs; smoke, which promoted the
germination of upright perennial forbs and grasses; and nitrate, which interacted with
heat shock to increase germination of at least two forbs.
The germinable soil seed bank was dominated by grasses and forbs, and seed banks of
trees and shrubs were scarce and short-lived. Seasonal fluctuations were evident in the
seed bank, which increased through the dry season to a maximum density in the late dry
season, and declined to a minimum by the mid wet season. The high intensity late dry
season fires reduced seed production by the dominant tree Corymbia clarksoniana in
the year following burning, however the effect of fire on soil seed bank dynamics was
limited due to the annual wet season decline in seed reserves that occurred irrespective
of fire. These data indicate that late dry season fires promoted the emergence of a
greater density of herb seedlings, compared with early dry season fires, by stimulating
seed dormancy release in a higher proportion of seeds, and because more soil seed
reserves were available in the late dry season to be affected by fire.
vi
Abstract.
Seedling survival of herbaceous species was higher for those that emerged from
recently burnt rather than unburnt savanna. High rates of seedling mortality of
perennial species, and the short lifespan of ephemeral forbs, explained the decline in
plant abundance documented in the second year following fire. A moderate proportion
of seedlings of common sprouter species developed the capacity to survive fire within
one year of germination. Only five percent of C. clarksoniana seedlings survived in
unburnt, and fewer in burnt savanna, three years after germination.
In savanna that remained unburnt for four years, growth of juvenile trees above 2 m in
height accounted for the observed increase in tree density. The capacity of the majority
of species to sprout after fire, and rapid seed production of non-sprouter species,
explained the stability in species composition documented in the annual floristic
surveys at Cape Cleveland. Fire-promoted stem reproduction via root-suckering
explained the increase in abundance detected in the subshrub Breynia oblongifolia
following burning.
This thesis provides important information on the processes that drive tropical savanna
function. It indicates that seedling recruitment is a process that limits population
growth. Seedling recruitment of trees and shrubs is scarce and episodic, apparently
linked to high rainfall years. The seedling recruitment of subshrubs and herbaceous
species is driven by opportunities for seed dormancy release, which are primarily
restricted to fire events, and limited by the low to moderate soil seed bank density and
poor levels of seedling survival. Growth of juvenile trees beyond 2 m in height, and
hence to reproductive maturity, requires fire-free intervals of at least four years and is
therefore an event that is restricted by fire and limits population growth. The high
proportion of sprouting species enables plant persistence, so that juvenile and mature
plant survival are life events that provide population resilience. For ephemeral species,
the soil seed bank provides a storage mechanism that provides population resilience.
This thesis provides practical information to improve the management of this
widespread and important ecosystem. Conservation management of these savannas will
need to balance the role of regular fires in maintaining the diversity of herbaceous
species with the requirement of fire intervals of at least four years for allowing
vii
Abstract.
viii
recruitment, and therefore population maintenance, of trees. While late dry season fires
may cause some tree mortality, the use of occasional late fires will promote dense
seedling recruitment of herbaceous species, which may be necessary to maintain
sustainable populations of many grasses and forbs.
Table of contents.
Table of Contents.
Statement of Access ………………………………..………………….….……………i
Statement on Sources Declaration ……….…………………………………………..ii
Table 4.2. Mean (standard error) seed weight, percentage viability and size
ranking of each species examined in the laboratory experiment…………..90
Table 4.3. Statistical results of one- and two-factor ANOVAs for the laboratory
experiment of seed germination …………………………………………...92
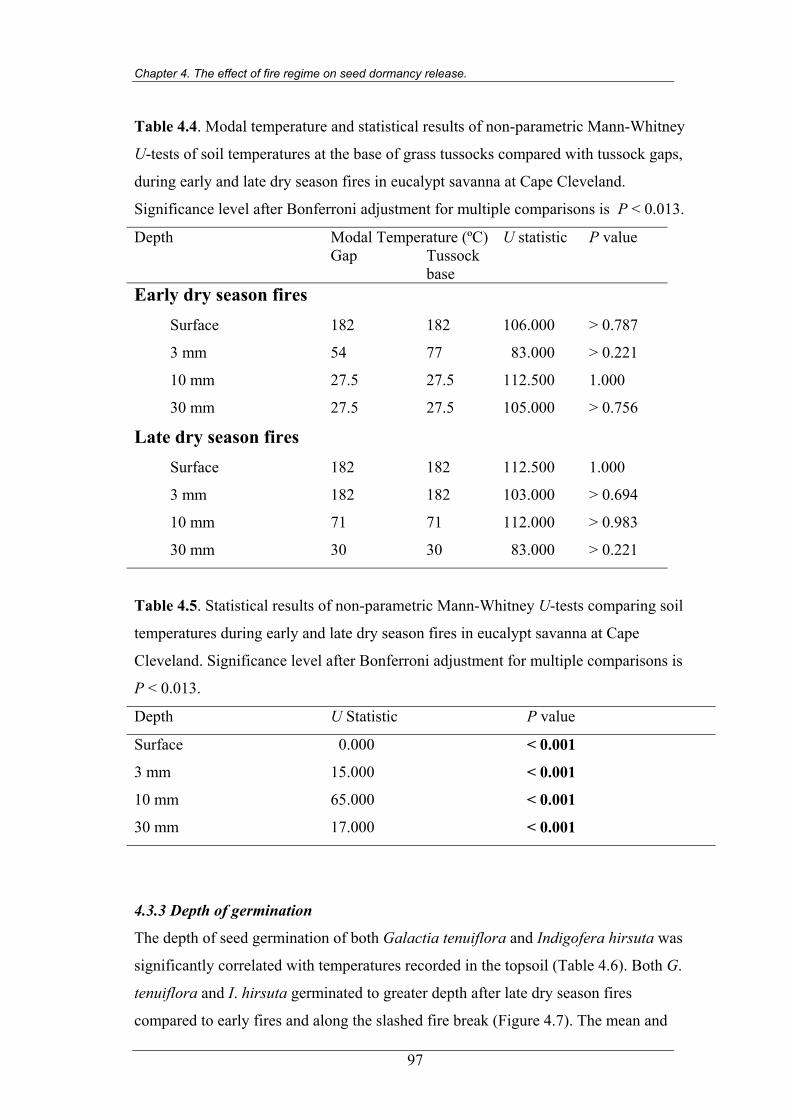
Table 4.4. Statistical results of non-parametric Mann-Whitney U-tests of soil
temperatures at the base of grass tussocks compared with grass gaps,
during early and late dry season fires in eucalypt savanna at Cape
Cleveland…………………………………………………………………..97
Table 4.5. Statistical results of non-parametric Mann-Whitney U-tests comparing
soil temperatures during early and late dry season fires in eucalypt
savanna at Cape Cleveland ………………………………………………..97
Table 4.6. Results of the Spearman rank correlation analysis of seed germination
depth with temperatures recorded at four separate soil depths ……………99
xvii
List of tables.
Table 5.1. ANOVA results of soil treatment and depth of germinable soil seed
bank collected before and after fire in July 1997 at Cape Cleveland .…….124
Table 5.2. Mean (standard error) germinable soil seed bank density of native and
exotic species, growth form groups and common species, collected at
three soil depths before and after the July 1997 fire at Cape Cleveland ….125
Table 5.3. Statistical significance of differences between soil treatment, annual and
seasonal fluctuations in germinable soil seed bank collected between
February 1998 and October 2000 in eucalypt savanna last burnt in July
1997, at Cape Cleveland …………………………………..……………..128
Table 5.4a. Mean (standard error) untreated and heated germinable soil seed bank
density (m-2) of species, collected in the wet season, early, mid and late
dry seasons of 1998 at Cape Cleveland, in savanna last burnt in July
1997 ……………………………………………………………………...130
Table 5.4b. Mean (standard error) untreated and heated germinable soil seed bank
density (m-2) of species, collected in the wet season, early, mid and late
dry seasons of 1999 at Cape Cleveland, in savanna last burnt in July
1997 ……………………………………………………………………...131
Table 5.4c. Mean (standard error) untreated and heated germinable soil seed bank
density (m-2) of species, collected in the wet season, early, mid and late
dry seasons of 2000 at Cape Cleveland, in savanna last burnt in July
1997 ……………………………………………………………………...132
Table 5.5. ANOVA of the statistical significance of differences between fire
treatment, soil treatment and season of soil seed bank collection, before
and after the 1999 fire season treatments in eucalypt savanna at Cape
Cleveland ………………………………………………………………...135
Table 5.6a. Mean (standard error) germinable soil seed bank density (m-2) of
untreated and heated soil samples collected between May 1999 and
February 2000 at Cape Cleveland, from the control treatment …………137
Table 5.6b Mean (standard error) germinable soil seed bank density (m-2) of
untreated and heated soil samples collected between May 1999 and
February 2000 at Cape Cleveland, from early burnt savanna …………138
xviii
List of tables.
Table 5.6c. Mean (standard error) germinable soil seed bank density (m-2) of
untreated and heated soil samples collected between May 1999 and
February 2000 at Cape Cleveland, from late burnt savanna ……………139
Table 5.7. Results of an independent t-test of untreated germinable soil seed bank
after early dry season fire (control vs early burnt of July 1999 soil
collection) and late dry season fire (control vs late burnt of October
1999 soil collection) at Cape Cleveland …………………………………140
Table 5.8. ANOVA results of fire treatment, soil treatment, and seasonal of
collection in germinable soil seed bank collected in the year following
fire, between May and October 2000, at Cape Cleveland ………………143
Table 5.9a. Mean (standard error) germinable soil seed bank density (m-2)
collected from control treatment (i.e. savanna last burnt in July 1997),
at Cape Cleveland between May and October 2000 ……………………146
Table 5.9b. Mean (standard error) germinable soil seed bank density (m-2)
collected from early burnt savanna (last burnt in May 1999), at
Cape Cleveland between May and October 2000 ………………………147
Table 5.9c. Mean (standard error) germinable soil seed bank density (m-2)
collected from late burnt savanna (last burnt in October 1999), at
Cape Cleveland between May and October 2000 ………………………148
Table 5.10. Phenology of seed production of eucalypt savanna plants at Cape
Cleveland ……………………………………………………………….150
Table 5.11. Response to soil treatments, total number of species, seed density and
the most abundant growth form detected in germinable soil seed bank
studies undertaken in eucalypt communities across Australia …………157
Table 6.1. Mean (standard error) seedling density (m-2) and results of the Mann-
Whitney U-tests comparing seedling density in recently burnt, and
longer unburnt eucalypt savanna of Mt Elliot, Many Peaks Range and
Castle Hill, Townsville …………………………………………………176
Table 6.2. Mean (standard error) species richness and seedling density (m-2),
and results of statistical analyses of fire treatment and year of survey
in eucalypt savanna at Cape Cleveland, between 1997 and 2001 ………178
xix
List of tables.
xx
Table 6.3. Results of two-factor ANOVA of the effect of micro-site disturbance
and seed burial on seedling emergence of Corymbia clarksoniana in
eucalypt savanna at Cape Cleveland ……………………………………191
Table 6.4. Mean (standard error) species richness and total seedling density (m-2),
and Kruskal-Wallis ANOVA results, in undisturbed, early burnt, late
burnt, early cut and late cut plots at Cape Cleveland …………………...192
Table 7.1. Mean (standard error) percentage survival after at least 18 months,
and ANOVA results, of seedlings of native and exotic species, growth
form groups and common species emerging from eucalypt savanna at
Cape Cleveland …………………………………………………………219
Table 7.2. ANOVA results of fire season treatments on the survival of Corymbia
clarksoniana seedlings that emerged seven months prior to the early
dry season fire ……………………………………………………………224
Table 8.1 Summary of post-fire regeneration of growth form groups in eucalypt
savanna in the vicinity of Townsville ……………………………………239
Table 8.2. Repeated measures ANOVA results for the effect of fire on the density
of all trees (> 2m height) and the four most abundant trees, between
1997 to 2001 at Cape Cleveland …………………………………………240
Table 8.3. Repeated measures ANOVA results for the effect of fire (control, early
burnt, late burnt) on the basal area of all trees (> 2m height) and the
four dominant species, between 1998 to 2001 at Cape Cleveland ………243
Table 8.4. Repeated measures ANOVA results of Corymbia clarksoniana
juvenile density and height between 1999 and 2001 in control, early
and late burnt blocks …………………………………………………….244
Table 8.5. Kruskal-Wallis ANOVA by ranks statistical results for the percentage
survival of common herbaceous species after burning and cutting in the
early and late dry seasons in eucalypt savanna at Cape Cleveland ……...246
Table 8.6. Comparison of the percentage of sprouting species within a range of
Australian vegetation types ………………………………………………249
List of figures.
List of Figures.
Figure 1.1 The distribution of Australian tropical savannas.…………………………3
Figure 1.2 Diagrammatic model of the influence of fire regime on critical life
events and floristic patterns in tropical savannas ……………………….16
Figure 2.1 Map of study sites ……………………………………………………….21
Figure 2.2 Mean monthly rainfall, and mean daily minimum and maximum
temperatures per month, at Townsville ………………………………….22
Figure 2.3 Eucalypt savanna at the Cape Cleveland fire regime experimental site …23
Figure 2.4 Schematic diagram of the experimental fire regime layout at the Cape
Cleveland study site …………………………………………………..….25
Figure 3.1 Species-area curve of the mean (± 1 standard error) number of species
per unit area within 20 plots in eucalypt savanna………………………...32
Figure 3.2 Diagrammatic key to the distinction of growth form groups used
throughout this thesis …………………………………………………….39
Figure 3.3 Mean (± 1 standard error) fuel accumulation with years since fire in
eucalypt savanna at Cape Cleveland……………………………………...42
Figure 3.4 Mean (± 1 standard error) fuel load in unburnt, early burnt and late
dry season burnt eucalypt savanna at Cape Cleveland in (a) 2000 and
(b) 2001 …………………………………………………………………..42
Figure 3.5. Intensity of the mid dry season (1997), early dry season (1999) and late dry season (1999) fires in eucalypt savanna at Cape Cleveland …...43
Figure 3.6. Cluster analysis dendrogram from the 180 surveys in eucalypt
savanna at Cape Cleveland, based on species composition data only …...45 Figure 3.7. Cluster analysis dendrogram from the 180 surveys in eucalypt savanna
at Cape Cleveland, based on species composition and abundance data ….47 Figure 3.8. PCA scatter plot of the 180 surveys in eucalypt savanna at Cape
Cleveland, from 1997 to 2001 ……………………………………………50 Figure 3.9. Simplified PCA scatter plot showing the pattern of floristic change
from 1997 to 2001 ………………………………………………………..51 Figure 3.10. Biplot from the partial RDA of the entire 180 surveys in eucalypt
savanna at Cape Cleveland from 1997 to 2001 …………………………..54
xxi
List of figures.
Figure 3.11. Biplot from the partial RDA of surveys in eucalypt savanna at Cape Cleveland in 1999 and 2000 ……………………………………………...58
Figure 4.1 Scanning electron microscope image of the strophiolar plug, magnified
350 times, of an untreated Crotalaria montana seed. ……………….…..80
Figure 4.2 Mean (± 1 standard error) percentage seed germination at different
incubation temperatures during the pilot trial for Chamaecrista
mimosoides, Crotalaria lanceolata and Crotalaria pallida.……………...83
Figure 4.3. Apparatus used to produce smoke at ambient temperature. ……………...84
Figure 4.4. Placement of a temperature measurement strip at the 30 mm depth.……..86
Figure 4.5. Mean (± 1 standard error) percentage germination of viable seed after
exposure to various levels of heat shock, as well smoke and nitrate …….91
Figure 4.6. Modal temperatures recorded at four depths in the topsoil during
(a) early and (b) late dry season fires in eucalypt savanna at Cape
Cleveland during 1999 …………………………………………………...96
Figure 4.7. Depth of seed germination in eucalypt savanna that has been slashed,
or burnt early or late in the dry season for (a) Galactia tenuiflora and
(b) Indigofera hirsuta ……………………………………………………98
Figure 4.8. Mean seedling density (± 1 standard error) of Galactia tenuiflora and
Indigofera hirsuta at four temperature measurement points in early
and late dry season burnt eucalypt savanna at Cape Cleveland ………….99
Figure 5.1. Model of the influence of fire on soil seed bank dynamics……………..110
Figure 5.2. Schematic diagram of the sampling design used in the July 1997
germinable soil seed bank study in eucalypt savanna at Cape
Cleveland ...……………………………………………………………...113
Figure 5.3. Schematic diagram of the sampling design used in the soil seed bank
study of eucalypt savanna at Cape Cleveland between October 1997
and October 2000 ……………………………………………………….115
Figure 5.4. Image of smoke application to soil seed bank samples collected from
eucalypt savanna at Cape Cleveland in May, July and October 2000 ….116
Figure 5.5 Mean (± 1 standard error) (a) species richness per sample and (b) total
seed density of germinable soil seed bank, collected in eucalypt savanna
at Cape Cleveland, before and after the 1997 mid dry season fire ……..123
xxii
List of figures.
Figure 5.6. Mean (± 1 standard error) (a) species richness per sample and (b) total
seed density of germinable soil seed bank, collected in eucalypt
savanna at Cape Cleveland, between February 1998 and October 2000,
in sites last burnt in July 1997 …………………………………………..127
Figure 5.7. Mean (± 1 standard error) (a) species richness and (b) total seed density of
germinable soil seed bank, collected in eucalypt savanna at Cape Cleveland,
between May 1999 and February 2000 ……………………134
Figure 5.8. Mean (± 1 standard error) (a) species richness and (b) total seed
density of germinable soil seed bank, collected in eucalypt savanna
at Cape Cleveland, between May and October 2000 …………………...142
Figure 5.9. PCA scatter plot of species composition in the 288 soil seed bank
samples and 180 floristic surveys ………………………………………153
Figure 5.10. Mean (± 1 standard error) seed production of Corymbia clarksoniana
at Cape Cleveland in December 2000, in savanna with different fire
histories …………………………………………………………………154
Figure 6.1. Mean (± 1 standard error) seedling density of Corymbia clarksoniana
in eucalypt savanna in December 1999, at Cape Cleveland ……………183
Figure 6.2. PCA scatter plot of species composition within floristic surveys, soil
seed bank samples and seedling emergence surveys in eucalypt
savanna at Cape Cleveland ……………………………………………...188
Figure 6.3. Mean (± 1 standard error) percentage seedling emergence of viable
seeds of Corymbia clarksoniana in eucalypt savanna at Cape
Cleveland ………………………………………………………………..190
Figure 6.4. Mean (± 1 standard error) percentage seedling emergence of surface
sown and buried viable seeds of Corymbia clarksoniana in eucalypt
savanna at Cape Cleveland ……………………………………………...190
Figure 6.5. Rate of seedling emergence in eucalypt savanna at Cape Cleveland …...191
Figure 6.6. Mean (± 1 standard error) percentage seedling emergence of soil
seed bank at Cape Cleveland ………………………………………… 195
Figure 7.1. Mean (± 1 standard error) percentage (a) species survival and
(b) seedling survival, at least 18 months after seedling emergence in
eucalypt savanna at Cape Cleveland ……………………………………218
xxiii
List of figures.
xxiv
Figure 7.2. Correlation between percentage seedling survival and seedling density 221
Figure 7.3. Mean (± 1 standard error) percentage survival of seedlings that
emerged less than eight months prior to an early dry season fire
(May 1999) in eucalypt savanna at Cape Cleveland ……………………222
Figure 7.4. Mean (± 1 standard error) percentage (a) seedling survival and
(b) seedling height with age of Corymbia clarksoniana in eucalypt
savanna at Cape Cleveland ……………………………………………..223
Figure 8.1. Mean (± 1 standard error) tree density in control, early and late dry
season burnt eucalypt savanna at Cape Cleveland, between 1997
and 2001 ………………………………………………………………241
Figure 8.2. Mean (± 1 standard error) tree basal area in control, early burnt and
late dry season burnt eucalypt savanna at Cape Cleveland between
1997 and 2001 ……………………………………………………..242
Figure 8.3. Mean (± 1 standard error) (a) density and (b) height of Corymbia
clarksoniana juveniles between 1999 and 2000 in control, early and
late dry season burnt savanna at Cape Cleveland ………………………244
Figure 8.4. Mean (± 1 standard error) growth of Corymbia clarksoniana juveniles
(< 2 m tall in 1999) with years since fire in eucalypt savanna at Cape
Cleveland ………………………………………………………………..245
Figure 8.5. Mean (± 1 standard error) Breynia oblongifolia stem density before,
and after treatments in eucalypt savanna at Cape Cleveland …………...246
Figure 8.6. Mean (± 1 standard error) % survival of (a) Galactia tenuiflora, (b)
(e) Pycnospora lutescens in eucalypt savanna at Cape Cleveland ……..247
Figure 9.1. Critical life events that limit population growth and provide stability
to populations …………………………………………………………...266
Chapter 1. Introduction to the effect of fire regime on Australian tropical savannas.
Chapter 1. Introduction to the effect of fire regime on floristic
patterns and critical life events in Australian tropical
savannas.
FIREREGIME
Seed dormancy release
Floristic patterns
Seed bankdynamics
Seedlingemergence
Survival andgrowth ofjuveniles
Survival andgrowth of
mature plants
Seedling survival
1
Chapter 1. Introduction to the effect of fire regime on Australian tropical savannas.
1.1 Context
This thesis examines the influence of fire regime on plant species composition and
abundance (referred to as floristic patterns) within tropical eucalypt savannas of north-
eastern Australia. The mechanisms determining floristic patterns are investigated
through an assessment of critical events in a plant’s life cycle (referred to as critical life
events). These include seed dormancy release, soil seed bank dynamics, seedling
emergence, seedling survival and the survival and growth of juvenile and mature plants.
The relative importance of key factors that drive savanna function, including climate,
soils, biological interactions and fire, is debated (Scholes and Archer 1997; Higgins et
al. 2000). An examination of life cycle processes that produce floristic patterns is
critical for understanding how savannas function and allows predictions of how
savannas will respond to fire regimes, and forecast climate change (Whelan et al.
2002).
There has been only limited research into the influence of fire regimes on floristic
patterns in savannas of north-eastern Australia. Therefore floristic patterns within
eucalypt savannas of this region were examined using manipulative field and laboratory
experiments, coupled with surveys of seedling and vegetative regeneration after a range
of fires in several locations in the vicinity of Townsville, north-east Queensland (19°
15’S, 146° 46’E; Figure 1.1). These data contribute to our broader understanding of
how tropical savannas function and provide essential information to aid the
management of this widespread ecosystem.
1.2 The effect of fire regime on floristic patterns in Australian tropical savannas
1.2.1 Australian tropical savannas
Tropical savannas cover approximately 13% of the world’s land surface (Scholes and
Archer 1997). The “dual significance” of herbaceous and woody species is a
characteristic feature of these savannas, which possess a sparse to moderate tree canopy
and an abundance of grasses and forbs (Mott et al. 1985; Walker 1985; Higgins et al.
2000).
2
Chapter 1. Introduction to the effect of fire regime on Australian tropical savannas.
Figure 1.1. The distribution of Australian tropical savannas (courtesy of the Tropical
Savannas CRC).
Australian tropical savannas are dominated by eucalypts (Eucalyptus and Corymbia,
Myrtaceae) and cover a large proportion of northern Australia (Mott et al. 1985;
Williams et al. 2002a; Figure 1.1). They experience intense summer wet seasons
(December to March) and prolonged winter dry seasons (Mott et al. 1985; Williams et
al. in press). The strong seasonal variation in rainfall is a critical factor influencing
ecological processes within these communities (Williams et al. 1999a; Woinarski
1999). Long-term climatic fluctuations, including irregular severe droughts, also
influence savanna structure and composition (Fensham and Holman 1999).
3
Chapter 1. Introduction to the effect of fire regime on Australian tropical savannas.
1.2.2 Fire in Australian tropical savannas
The intense summer wet seasons in Australian tropical savannas yield a large biomass
of grass, which cures during the subsequent dry season (Walker 1981). The consistency
of this cycle leads to frequent and extensive fires (Wilson and Bowman 1987; Gill et al.
1996). Grasses rapidly regenerate after fire in northern Australia, re-establishing fuel
loads and creating the potential for fire intervals as low as one or two years (Walker
1981; Gill et al. 2000). Contemporary fire intervals typically range from one to three
years in the high rainfall region of the Northern Territory and Kimberley, and two to
five years in the north and central coast of Queensland (Burrows and Burrows 1992;
Crowley 1995; Craig 1997; Russell-Smith et al. 1997; Crowley and Garnett 2000).
As a consequence of progressive grass curing through the dry season, the timing of fire
has a strong influence on intensity (Bowman 1988). Low intensity, patchy fires are
typical of the early dry season, with higher intensity and extensive fires produced by
later dry season burning (Gill et al. 1990). Fire intensity in Australian tropical savannas
is typically lower than in southern Australia and crown fires are rare (Craig 1997).
Annual early dry season fire intensities can be in the order of < 1000 to 2200 kWm-1
and annual mid to late dry season fires from 1000 to 7700 kWm-1 (Williams et al.
1999b; Russell-Smith et al. in press). A single late dry season fire in a savanna unburnt
for seven years was estimated to have an intensity of approximately 20 000 kWm-1
(Williams et al. 1999b).
Soils of many Australian tropical savannas are low in nutrients (Mordelet et al. 1996;
Morgan et al. 2000; Jackson and Ash 2001). Volatilization of nutrients occurs during
fire, although most are returned via rain and ash redistribution (Cook 1994). Repeated
annual burning may be too frequent to allow the replacement of lost nitrogen in
savannas of the Northern Territory (Cook 1994; Russell-Smith et al. in press). However
the dynamics of soil nutrition may vary significantly between fires and communities, as
the nitrogen content of a south-eastern Queensland eucalypt forest burnt annually for
thirty years was similar to that of adjacent unburnt forest (Lamb et al. 1989).
4
Chapter 1. Introduction to the effect of fire regime on Australian tropical savannas.
1.2.3 Structural and floristic patterns
The high fire frequency experienced in tropical savannas may be expected to impact on
community structure and composition. Indeed, frequent fire is often linked with
reduced tree densities in tropical savannas throughout the world, including southern
Africa (Trollope 1982; Skowno et al. 1999), India (Puyravaud et al. 1995) South
America (Hoffman 1996) and Australia (Sandercoe 1988; Williams et al. 1999b). The
season and intensity of fire can be as important in affecting floristic patterns as fire
frequency. Annual late dry season fires can lead to reduced tree densities, while early
annual fires can promote tree density (Trapnell 1959).
Increases in tree density typically result from the growth of stunted juvenile trees (< 2
m in height) with fire intervals of greater than two or three years (Bowman and Panton
1995; Russell-Smith et al. in press). The release of stunted juveniles following fire
protection may be most rapid for non-eucalypts, such as Acacia spp., Melaleuca
viridiflora and other broad-leaved species (Bowman et al. 1988; Fensham 1990;
Crowley and Garnett 1998). The release of eucalypt juveniles in the absence of fire is
often slow and in some species not apparent after a fire interval of 21 years (Russell-
Smith et al. in press).
Charcoal and pollen records indicate the distributions of rainforest and eucalypt-
dominated communities in northern Australia has been dynamic over thousands of
years (Kershaw et al. 1991; Hopkins et al. 1993). Rainforest invasion into eucalypt
forests has occurred in the Wet Tropics region of north-eastern Australia (Harrington
and Sanderson 1994) and parts of Cape York Peninsula (Stanton and Roeger 2001).
However, the establishment of rainforest, or vine thicket, species in savannas away
from the east coast is generally limited, or at least slow (Bowman et al. 1988; Fensham
1990; Bowman 1993; Bowman 1994; Williams et al. in press; Russell-Smith et al. in
press). In fact, across much of northern Australia, many rainforests and stands of
Callitris intratropica and Acacia shirleyi, have declined in distribution as a result of
damage from repeated high intensity fires that spread from adjacent eucalypt savannas
(Price and Bowman 1994; Woinarski and Fisher 1995; Bowman 2000; Russell-Smith
and Stanton 2002).
5
Chapter 1. Introduction to the effect of fire regime on Australian tropical savannas.
The herbaceous component of tropical savannas is a diverse and important feature, yet
assessment of fire effects has been largely confined to the dominant grasses. Many of
these perennial and annual grasses maintain high densities with fire intervals of one to
three years, although a few grasses are favoured by less frequent burning (Shaw 1957;
Mott and Andrew 1985; Mott et al. 1985; Russell-Smith et al. in press). The season of
fire may have a significant impact, with early and late dry season fires promoting
different grasses, and wet season burning reducing the abundance of both perennial and
annual species (Stocker and Sturtz 1966; Walker et al. 1989; Williams and Lane 1999).
Although there has been limited research into the effects of fire on forbs in Australian
tropical savannas, it is apparent that fire can affect their abundance. Many are most
abundant with high fire frequency or in recently burnt savanna (Hoare et al. 1980;
Sandercoe 1988; Fensham 1990; Williams et al. 2002b). Forb composition can also be
affected by the season of fire (Bowman et al. 1988; Williams and Lane 1999).
1.3 The assessment of critical life events for interpreting floristic patterns
1.3.1 The value of examining critical life events To understand how a community functions in response to fire, details are required of
the mechanisms that drive floristic patterns. The assessment of critical events in a
plant’s life cycle provides an understanding of population, and therefore community,
dynamics (Harper 1977; Whelan et al. 2002). Population changes can be driven by the
variation in fire intervals, the unique characteristics of each fire event, and/or density-
dependent processes (Bond and van Wilgen 1996). Fire can influence the persistence of
standing plants and seeds; the density of seed germination; the establishment of
seedlings; the progression from seedling to mature plant; and seed production (Whelan
1995; Keith 1996; Whelan et al. 2002).
There is currently very little data on the effect of fire on the demographics of Australian
tropical savanna species. The most detailed information has been collected for Sorghum
intrans, which dominates some savannas of the Northern Territory and Western
Australia, and highlights the value of a demographic assessment. Knowledge of the
mass recruitment of this annual grass at the onset of the wet season, the fire-sensitivity
of seedlings, and the transient nature of the soil seed bank provide an insight into the
6
Chapter 1. Introduction to the effect of fire regime on Australian tropical savannas.
mechanisms that cause a decline in this species after wet season burning (Stocker and
Sturtz 1966; Andrew and Mott 1983; Andrew 1986).
Further work is needed to assess the influence of fire on critical life events in the life
cycle of a wider range of savanna species, to provide data on seed production, seed
dispersal, seed dormancy, seed bank dynamics, seedling emergence, and the survival
and growth of seedlings, juveniles and mature plants. Hence this thesis aims to
investigate fire effects on critical life events of a range of savanna species, which will
improve the current understanding of processes that govern savanna function. The
following discussion introduces the current knowledge of fire effects on these life
events.
1.3.2 The effect of fire regime on seed production and dispersal
Plants in Australian tropical savanna are pollinated by a wide range of vectors
including bats, gliders, birds, insects and wind (House 1997; Franklin and Noske 2000;
Hansman 2001). Their reproductive phenology reflects the annual wet-dry cycle
(Burrows and Burrows 1992; Setterfield and Williams 1996; Williams et al. 1999a).
Peak seed fall of grasses occurs from the middle of the wet to the early dry season
(Tothill 1977a; Andrew and Mott 1983; Mott and Andrew 1985). Forb seed fall peaks
in the late wet to mid dry season, while the late dry season and onset of the wet season
is the major period of seed fall for woody species (Brennan 1996; Setterfield and
Williams 1996; Williams et al. 1999a).
Fire influences seed production of tropical savanna plants by promoting flowering,
affecting pollinator abundance and by damaging reproductive structures before seed set
(Woinarski 1990; Brennan 1996; Setterfield 1997a). The pattern of seed production can
vary with fire response, as vegetative regenerating “sprouter” species tend to put fewer
resources into seed production compared with fire-killed, “obligate seeder” species
(Pate et al. 1990; Bond and van Wilgen 1996; Bond and Midgley 2001).
Seed of savanna plants are dispersed by non-biotic agents, including gravity, wind and
water (Grice 1996; Pettit and Froend 2001). Biotic seed dispersers (and predators)
include ants, cattle, birds, feral pigs and wallabies (Andersen 1991; Grice 1996;
7
Chapter 1. Introduction to the effect of fire regime on Australian tropical savannas.
Setterfield 1997b). Explosive capsules can also increase the distance of seed dispersal
(Auld 1996). Fire can influence seed dispersal and predation. For instance, seed
harvesting ants in the Northern Territory, which both consume seed and disperse seed
undamaged, can be most abundant with high fire frequency (Andersen 1991).
Several dominant grasses of tropical savannas possess awns with a hygroscopic
mechanism that buries seed into the topsoil, so that they are insulated from lethal
temperatures during the passage of fire (Tothill 1969; Andrew and Mott 1983).
1.3.3 The effect of fire regime on seed dormancy release
Viable, fresh seeds are considered to possess a primary, or “innate”, dormancy if they
will not germinate without a further stimulus when provided with moisture and
temperatures suitable for germination (Harper 1977; Bell 1999). A secondary dormancy
may develop if environmental conditions are inappropriate for germination (Bell 1999).
Secondary dormancy may be induced in buried seed by darkness or temperature regime
and may explain why viable seeds that lack an innate dormancy remain stored in the
soil seed bank (Bell et al. 1999; Auld et al. 2000).
Seed dormancy can allow a seed to persist through unfavourable environmental
conditions until climatic and micro-site factors favour seedling establishment (Bell
1999). Cues for releasing seeds from a state of dormancy are often linked with seasonal
conditions, including day length and exposure to high or low temperatures (Beardsell
and Mullett 1984; Bell et al. 1993; Battaglia 1996; Clarke et al. 2000).
Fire can improve micro-site conditions that influence seedling survival and growth,
such as increased nutrient and light availability (Whelan 1995). It is not surprising then
that many plants of fire-prone environments have dormancy mechanisms that cue seeds
to germinate after fire. Fire-related cues found to break seed dormancy include
exposure to heat shock (i.e. a short duration of elevated temperature), smoke, charcoal
and nitrate (Bell et al. 1987a; Auld and O’Connell 1991; Dixon et al. 1995; Bell et al.
1999; Clarke et al. 2000).
8
Chapter 1. Introduction to the effect of fire regime on Australian tropical savannas.
Some species show enhanced germination after exposure to multiple germination cues,
such as heat shock and smoke (Keith 1997; Kenny 2000; Morris 2000). Several
different factors may be required to cue the germination of co-existing species and a
germination trigger for one species may inhibit the recruitment of an adjacent species
(Clarke et al. 2000; McIvor and Howden 2000). Such variation in germination
requirements may help explain levels of species diversity (Grubb 1977).
Several grasses of northern Australia show an after-ripening requirement, whereby the
embryo of fresh seed requires further time to mature before the seed will germinate
(Bell 1999). The after-ripening dormancy in these species expires during the dry season
allowing dense germination with the onset of the wet season (Andrew and Mott 1983;
McIvor and Howden 2000). Some tropical eucalypts and grasses have no apparent
innate seed dormancy, being capable of germination immediately after seed fall
(Setterfield 1997b; Crowley and Garnett 2001).
Few studies have quantified the link between fire and seed dormancy of tropical
savanna plants. Smoke-triggered germination has been documented for several tropical
species including Themeda triandra (Baxter et al. 1994), Callitris intratropica (Roche
et al. 1997) and Heteropogon contortus (Campbell et al. 1996). Heat shock has been
shown to promote several semi-arid shrubs, including Acacia aneura and Senna
nemophila (Hogkinson and Oxley 1990). Clearly fire plays a role in seed dormancy
release of some tropical savanna species, and therefore savanna function, and further
research is required to examine additional species.
1.3.4 The effect of fire regime on soil seed bank dynamics
Seed dormancy allows the development of seed storage, typically referred to as “seed
banks” (Harper 1977). Seed banks bridge the temporal gap between seed production
and seed germination, provide a storage mechanism for regeneration after disturbance
and can be essential where limited seed dispersal distances result in little seed
immigration from adjacent areas (Whelan 1986; Lunt 1997).
Seed can be stored on the plant or in the soil (Whelan 1995). The storage of seed in the
canopy is generally referred to as “serotiny” or “bradyspory” (Lamont et al. 1991;
9
Chapter 1. Introduction to the effect of fire regime on Australian tropical savannas.
Whelan 1995). Seed storage on or below the soil surface is referred to as the “soil seed
bank” and is the principal means of seed storage in Australian tropical savanna species
(Shaw 1957; Mott and Andrew 1985; Andrew 1986; McIvor 1987; Williams et al. in
press).
Many species do not produce a seed bank, as their seeds either germinate, rot or are
eaten by predators soon after seed fall (Crowley and Garnett 2001; Pettit and Froend
2001). Species whose seeds remain viable in the seed bank for less than a year are
referred to as possessing a “transient” seed bank (Thompson and Grime 1979). To
remain within a community, these species rely on the persistence of standing plants or
annual recruitment and seed production, or seed dispersal from outside the community.
Some species produce seeds that remain viable within a seed bank for many years. This
is referred to as a “persistent” seed bank and is an important storage mechanism,
especially for annual species that do not germinate every year (Thompson and Grime
1979; Bond and van Wilgen 1996).
Research into the seed banks of Australian tropical savanna species has primarily
focused on dominant grasses. While some, such as Alloteropsis semialata and
Dichanthium fecundum, produce no apparent seed bank, many annual and perennial
grasses produce a transient seed bank that expires just prior to further seed input during
the wet season (Andrew and Mott 1983; Mott and Andrew 1985; Crowley and Garnett
2001). Soil seed banks of tropical savanna trees and shrubs are rarely detected, and
when present, tend to be transient (McIvor 1987; Higgins et al. 2000; Rogers 2000;
Pettit and Froend 2001).
Fire can affect seed bank dynamics by influencing seed input, killing stored seed, or
promoting germination (Keith 1996). While the bradysporous seed banks tend to
increase with fire interval (e.g. Witkowski et al. 1991; Pannell and Myerscough 1993),
the effect of fire on soil seed banks is more variable. Zammit and Zedler (1988) found
fire interval influenced soil seed banks of one shrub and nine herbs in California
chaparral. The soil seed bank of several South African fynbos shrubs decline
immediately after fire, but do not show annual increases with time since fire (Pierce
and Cowling 1991).
10
Chapter 1. Introduction to the effect of fire regime on Australian tropical savannas.
Research in tropical savannas has indicated that, in addition to affecting seed
production (Setterfield 1997a), fire can affect soil seed banks through direct mortality
of surface seeds and enhanced seed predation (Crowley and Garnett 1999). Further
research is required to address the influence of fire on soil seed bank dynamics at a
community level in Australian tropical savannas.
1.3.5 The effect of fire regime on seedling emergence
The term “seedling emergence” is used throughout this thesis to signify the emergence
of seedlings above the soil surface, following seed germination. Micro-site, seed
dispersers and predators, seed dormancy triggers, and seasonal conditions influence the
density and rate of seedling emergence (Ashton 1979; McIvor and Gardener 1985;
Wellington 1989; Stoneman and Dell 1994; Clarke and Davidson 2001).
Seedling emergence may be cued to seasonal cycles, irregular climatic events or
disturbance. Many Australian tropical savanna trees and shrubs, including the dominant
eucalypts, are known to recruit seedlings episodically (Lacey 1974; Fensham 1992).
The emergence of many annual grass and forb seedlings occurs at the start of each wet
season, irrespective of fire (Andrew and Mott 1983; Brennan 1996; Crowley and
Garnett 1999; Crowley and Garnett 2001).
The influence of fire on seedling emergence varies, depending on many factors. These
include the size of the seed bank at the time of fire; the level of seed mortality during
fire; the proportion of the seed bank released from dormancy; and the loss of seed due
to predation, disease and desiccation before germination (Whelan 1995; Bond and van
Wilgen 1996; Keith 1996). While seedling emergence of some Australian tropical trees
may be greater in unburnt rather than burnt savanna (Setterfield 1997b), seedling
density of several perennial grasses, most notably Heteropogon contortus, is increased
by fire (Shaw 1957; Tothill 1969).
There are limited data on the complex factors promoting seedling emergence of
savanna species (Higgins et al. 2000) and more information is required on the influence
of fire on seedling emergence in northern Australia. Fire frequency and season affect
11
Chapter 1. Introduction to the effect of fire regime on Australian tropical savannas.
seedling emergence through their influence on seed bank size and fire intensity. Fire
intensity affects seed mortality and the release from seed dormancy.
1.3.6 The effect of fire regime on seedling survival
Seedling survival is an important process that can limit population growth (Keith
1996). Conditions that promote seedling survival may differ from those that increase
the density of seedling emergence (Lamont et al. 1993; Stoneman and Dell 1994;
Stoneman et al. 1994; Keith 2002). Seedling mortality can result from desiccation,
herbivory, insufficient nutrients, disease, shading, and disturbance (Lacey 1974;
Hoffman 1998; Facelli et al. 1999). Both inter- and intra-specific competition for
resources can be high for seedlings (Morgan 1998). Conversely, the establishment of
seedlings may be facilitated by adjacent plants (Kellman 1985). Resource competition,
herbivory and disease can lead to density-dependent mortality of seedlings (Andrew
1986; Whelan 1995; Bond and van Wilgen 1996).
Seedling survival can be strongly influenced by fire (Pate et al. 1990; Keith 1996).
Seedlings recruited into the immediate post-fire environment can benefit from reduced
competition and enhanced nutrient and light availability (Ashton and Chinner 1999).
Herbivore pressure may be either magnified or diminished, depending on species and
fire characteristics (Whelan and Main 1979; Keith 1996).
Percentage seedling survival in Australian tropical savannas varies between species,
sites and seasons (Andrew and Mott 1983; Setterfield 1997b; Crowley and Garnett
1999). Further information is required on the interaction of burning with other factors
that limit survival and the time required for seedlings to develop the capacity to survive
fire and to produce seed (i.e. the primary juvenile period, Gill 1975).
1.3.7 The effect of fire regime on the survival and growth of juvenile and mature
plants
The persistence of standing plants provides stability to a community (Bond and
Midgley 2001). Longevity of Australian tropical savanna species ranges from annuals
that survive as standing plants for less than one year, to trees that can survive for more
than one hundred years (Mucha 1979; Watkinson et al. 1989). Growth rates are related
12
Chapter 1. Introduction to the effect of fire regime on Australian tropical savannas.
to environmental factors, especially temperature, rainfall, and soil fertility (Barbour
1987). Both soil moisture and nutrients have been found to limit plant growth in
tropical savannas (Cook and Andrew 1991; Jackson and Ash 1998).
Fire can have a significant impact on the survival and longevity of plants. The mode of
post-fire regeneration forms the basis of several life history classifications (e.g. Noble
and Slatyer 1980; Gill 1981; Bond and van Wilgen 1996). Species that survive and
vegetatively regrow after complete canopy scorch are described as “sprouters” or
“resprouters” (Gill 1981; Whelan 1995; Bond and van Wilgen 1996; Keith 1996).
Vegetative regrowth can result from subterranean buds, located in rhizomes, roots and
the base of stems, which are insulated from lethal temperatures by the soil (Gill 1981).
Post-fire regeneration from subterranean buds can result in the proliferation of stems
(Lacey 1974; Hoffman 1998).
Sprouting may also originate from aerial buds, located on the trunk or branches. This is
described as “epicormic” sprouting and the insulation of aerial buds is provided by the
bark (Gill 1975; Burrows 2002). An additional sprouting mechanism, most notably
found in Xanthorrhoea spp., involves bud protection within the stem apex (Gill 1981).
Plants that are killed by fire when completely scorched are often described as “non-
sprouters” or “obligate seeders”, in reference to their reliance on regeneration via
seedlings (Gill 1981; Whelan 1995; Bond and van Wilgen 1996). The term “fire
ephemerals” is also used, in reference to plants that germinate in response to fire and
complete their life cycle within a few years (Pate et al. 1985; Whelan 1995).
Both plant survival and growth are affected by fire regime. High fire frequencies can
stunt juvenile plant growth by repeated top kill (Midgley and Bond 2001). Suppression
of juveniles through regular burning in savannas in high rainfall regions may be an
important factor limiting tree density and allowing the coexistence of grasses and trees
(Higgins et al. 2000). In the absence of fire, the growth of juveniles of tropical
eucalypts may be slower than that of other trees and may also require release from
overstorey competition (Bowman et al. 1988; Fensham 1990; Fensham and Bowman
1992; Russell-Smith et al. in press).
13
Chapter 1. Introduction to the effect of fire regime on Australian tropical savannas.
Frequent fire can cause mortality of sprouters if they are unable to replenish the
necessary bud or carbohydrate reserves, or protective tissue, within fire intervals
(Whelan 1995; Keith 1996). Perennial grasses, such as Heteropogon contortus and
Themeda triandra, may senesce during long fire intervals (e.g. more than five years),
and their populations decline due to an absence of fire-promoted seedling recruitment
to replace senesced individuals (Mott and Andrew 1985; Mott et al. 1985; Morgan and
Lunt 1999).
The intensity of a fire can affect plant mortality. Obligate seeders may survive low
intensity fires, when their canopy is not completely scorched (Gill 1981). Percentage
stem and whole-plant mortality of sprouter species is proportional to fire intensity
(Williams et al. 1999b). Fire season can also influence survival and re-growth (Bond
and van Wilgen 1996). The higher intensity, late dry season fires tend to produce
greater plant mortality than early fires in tropical savannas (Williams et al. 1999b). Soil
moisture at the time of burning and the period before post-fire rain can be critical for
plant survival. Up to 50% mortality of the perennial grass, Aristida latifolia, can result
from burning during the mid dry season, when there is no follow-up rain for two or
three months (Phelps 2001). Burning during a period of rapid growth may also cause
greater damage than when the plant is in a state of dormancy (Whelan 1995), and the
season of fire that causes the least damage to standing plants may be the very season
that produces the lowest density of seedling emergence and establishment (Keith 1996).
Further research is required to examine processes governing survival and growth in
tropical savannas. Variation in survival after different fire events may result from
differences in the survival of regenerative buds and/or the quantity of stored carbon
reserves (Bond and van Wilgen 1996). The dominance of sprouting species may
provide stability to savanna composition and therefore the survival of the passage of
fire by juveniles and mature plants may be a critical life event that maintains savanna
function.
14
Chapter 1. Introduction to the effect of fire regime on Australian tropical savannas.
1.4 This study
1.4.1 Aims of this study
The degree to which fire influences floristic patterns in Australian tropical savannas is
debated (Duff and Braithwaite 1989; Williams et al. 2002a). It has been argued that the
long history of frequent fire has lead to savanna communities that are resilient to fire
regimes and driven by edaphic and climatic factors (Wilson and Bowman 1987;
Bowman et al. 1988). While a high level of stability in floristic composition has been
demonstrated in response to a range of fire regimes, fire effects on species abundance
and savanna structure are apparent (Bowman and Panton 1995; Williams and Lane
1999; Russell-Smith et al. in press). Research into the influence of fire on floristic
patterns has primarily been carried out in the monsoonal regions of the Northern
Territory and Cape York Peninsula, so that less is known about the savannas of north-
eastern Australia, south of Cape York Peninsula.
Available information emphasises floristic patterns rather than the mechanisms that
determine patterns in Australian tropical savannas. Fire may limit population growth,
and therefore affect floristic patterns, through its influence on one or more life cycle
processes, including plant survival during the fire event and intervals between fires,
seed production and seedling recruitment (Whelan et al. 2002). Higgins et al. (2000)
proposed that the seedling emergence of trees, governed by rainfall, and the release of
stunted juvenile trees to the canopy, controlled by fire, may be critical events limiting
tree density in savannas and allowing the coexistence of grasses and trees. This
hypothesis requires testing in a range of savannas and further information is required on
the factors driving seedling recruitment of grasses and forbs. The ability of established
plants to sprout after fire may be a critical process that provides population stability
(Bond and Midgley 2001) and may explain reports of resilience in species composition
in frequently burnt savannas (e.g. Bowman et al. 1988; Williams et al. in press).
Given this theoretic context, this thesis focuses on patterns and processes in Australian
tropical savannas to:
1. determine the effect of a series of fires on floristic patterns in a tropical savanna in
north-eastern Australia; and
15
Chapter 1. Introduction to the effect of fire regime on Australian tropical savannas.
2. investigate the effect of fire on critical life events to investigate mechanisms that
determine floristic patterns.
1.4.2 Thesis structure
The various components of this thesis will be presented with reference to a
diagrammatic model (Figure 1.2). The model portrays the critical life events influenced
by fire, that will be addressed in this study, and their role in driving floristic patterns. It
is based on the critical “events”, “hurdles” and “processes” in a plant’s life cycle, as
expressed in previous work, such as Harper (1977); Keith (1996); Midgley and Bond
(2001) and Whelan et al. (2002). The model deliberately depicts life events rather than
life cycle stages, such as the seed, seedling and adult phases, to focus the investigation
on fire impacts on dynamic life cycle processes. This study examines whether the
influence of fire on any or all of these life events limits population growth, and
therefore investigates central processes that drive savanna function.
FIREREGIME
Seed dormancy release(Chapters 4 and 5)
Floristic patterns (Chapter 3)
Seed bankdynamics
(Chapter 5)
Seedlingemergence(Chapter 6)
Survival andgrowth ofjuveniles
(Chapter 8)
Survival andgrowth of
mature plants(Chapter 8)
Seedling survival(Chapter 7)
Figure 1.2. Diagrammatic model of the influence of fire regime on critical life events and floristic patterns in tropical savannas, and the chapters of the thesis in which they are investigated.
16
Chapter 1. Introduction to the effect of fire regime on Australian tropical savannas.
Chapter 2 describes the study site, climate and the design of a manipulative fire regime
experiment. Chapter 3 examines the dynamic patterns in species composition and
abundance in response to variation in fire regime. The assessment of floristic patterns is
based on changes detected over five years using annual plot surveys. Multivariate
analyses are used to detect community-level changes, and univariate analyses to
examine fire effects on the abundance of species groups and common species. Fuel load
dynamics and fire intensities are also examined.
Chapters 4 to 8 examine the effect of fire regime on critical life events to investigate the
way in which fire affects floristic patterns (Figure 1.2). The effect of fire on seed
production is only directly assessed for the dominant tree, Corymbia clarksoniana, and
seed dispersal is not specifically examined, however the outcome of these important
events are examined in the study of soil seed bank dynamics.
Chapter 4 examines the effect of fire on seed dormancy release of ten legumes (both
native and exotic) in a laboratory experiment that investigates the effects of exposure to
heat shock, smoke and nitrate on seed germination. These factors are related to the
passage of fire and have been shown to break seed dormancy in species of fire-prone
communities (Bell 1999). The temperatures during the passage of early and late dry
season fires are documented and the link between temperature elevation and depth of
seed germination in the topsoil is examined and interpreted with reference to the results
of the laboratory experiment.
Chapter 5 broadens the investigation of seed dormancy to examine a wide range of
species while investigating the effect of fire on seasonal and annual fluctuations in the
germinable soil seed bank. The dynamics in soil seed bank are related to fruiting
phenology and the species composition is also compared with that of the standing
vegetation documented in Chapter 3.
Chapter 6 assesses patterns of seedling emergence. It examines whether germination is
an annual wet season event or primarily a response to fire. An assessment is made of
the influence of fire season on seedling emergence, and the experimental removal of
herbaceous biomass is used to test the importance of ground cover removal during fire
17
Chapter 1. Introduction to the effect of fire regime on Australian tropical savannas.
18
on seedling emergence. A further experiment examines the safe site requirements for
the germination of the dominant tree, Corymbia clarksoniana. The species composition
of the seedling surveys is compared with that of the standing vegetation and germinable
soil seed bank detected in Chapters 3 and 5, to help determine processes involved with
seedling emergence.
Chapter 7 examines the influence of fire regime on seedling survival. It compares the
survival of seedlings that germinated from recently burnt savanna, unburnt savanna
with the herbaceous layer removed or undisturbed savanna. The fire tolerance of
seedlings of common perennial species is documented. The survival of seedlings of the
dominant tree C. clarksoniana is assessed three years after a mass germination event.
Chapter 8 documents the sprouting ability of all species and assesses the influence of
fire on the survival and growth of juvenile and mature trees, and the survival of
common herbs. This chapter also examines the effect of disturbance type (burning and
cutting) and season of disturbance on stem reproduction in a root suckering subshrub,
Breynia oblongifolia.
Chapter 9 ties together information on the effect of fire on critical life events to
interpret floristic patterns. The implications of the results are discussed in terms of
current concepts of the role of fire in tropical savanna function and the management of
tropical eucalypt savannas in north-eastern Australia.
Chapter 2. Study sites, climate and design of the Cape Cleveland fire regime experiment.
Chapter 2. Study sites, climate and design of the Cape
Cleveland fire regime experiment.
Eucalypt savanna of the Townsville region.
19
Chapter 2. Study sites, climate and design of the Cape Cleveland fire regime experiment.
2.1 Study sites and climate
This thesis examines the impact of fire regime in tropical eucalypt savannas in the
vicinity of Townsville, north-eastern Australia (19° 15’S, 146° 46’E; Figure 1.1). The
primary field site of this study is located at Cape Cleveland, Bowling Green Bay
National Park, approximately 25 km east of Townsville (19° 16’ 30”S, 147° 02’ 30”E;
Figure 2.1). Seedling emergence and post-fire vegetative regeneration data were
collected at additional sites in the Townsville region. These were: Castle Hill, a
Townsville City Council reserve (19° 15’S, 146° 48’E); Many Peaks Range, within
Townsville Town Common Conservation Park (19° 11’ 30”S, 146° 45’ 30”E) and Mt
Elliot, within Bowling Green Bay National Park (19° 27’S, 146° 57’E; Figure 2.1). All
sites have been protected from stock grazing for at least 20 years and are based on soils
derived from a granitic parent material, with the exception of Many Peaks Range,
which is primarily based on a metamorphosed acid volcanic parent material (Paine and
Smith 1972). The soils at each site are free draining and loamy, and are not seasonally
water logged.
Townsville experiences summer wet seasons, with 78% of the 1143 mm mean annual
rain falling between December and March (Figure 2.2). The highest mean daily
maximum temperature per month, recorded between 1940 and 2001 by the Australian
Bureau of Meteorology at the Townsville airport, approximately 4 km west of Castle
Hill, was 31.3°C in both December and January. The lowest mean daily minimum
temperature per month was 13.6°C, recorded in July.
The annual rainfall in Townsville was higher than average during 1997, 1998 and 2000,
and below average for 1999 and 2001 (Table 2.1a). Rainfall records for Cape Cleveland
during the study period were recorded by the Australian Bureau of Meteorology at a
location approximately 10 km south of the study site (Table 2.1b).
20
Chapter 2. Study sites, climate and design of the Cape Cleveland fire regime experiment.
Figure 2.1. Map of study sites in the vicinity of Townsville, north-eastern Australia:
Many Peaks Range, Castle Hill, Mt Elliot and Cape Cleveland. Townsville road
network and Australian map grids indicated.
21
Chapter 2. Study sites, climate and design of the Cape Cleveland fire regime experiment.
Figure 2.2. Mean monthly rainfall, and mean daily minimum (▲) and maximum
temperatures (■) per month, recorded by the Australian Bureau of Meteorology at the
Townsville airport between 1940 and 2001.
050100150200250300350
Jan Feb Mar Apr May Jun Jul Aug Sep Oct Nov Dec
Month
Rai
nfal
l (m
m)
05101520253035
Tem
pera
ture
(ºC
)
Table 2.1. Monthly rainfall between 1997 and 2001 recorded by the Australian Bureau
of Meteorology at (a) the Townsville airport and (b) Cape Cleveland, 10 km from the
Chapter 2. Study sites, climate and design of the Cape Cleveland fire regime experiment.
2.2 Design and implementation of the Cape Cleveland manipulative fire
experiment
In 1997, a manipulative fire experiment was established within a 10 ha section of
eucalypt savanna on level ground, at approximately 5 m altitude at Cape Cleveland
(Figure 2.1). The site contains eucalypt savanna typical of the Townsville region and is
dominated by the trees Corymbia clarksoniana, C. tessellaris and Eucalyptus
platyphylla, approximately 15 to 20 m in height and which form a 20 to 30% canopy
cover (Figure 2.3). The ground stratum is dominated by the perennial grasses
Heteropogon triticeus, H. contortus and Themeda triandra. There is also an abundance
of twining forbs, particularly Galactia tenuiflora, Glycine tomentella and Pycnospora
lutescens. Taxonomy for the thesis follows the Queensland Herbarium (Henderson
1997).
Figure 2.3. Eucalypt savanna at the Cape Cleveland fire regime experimental site.
23
Chapter 2. Study sites, climate and design of the Cape Cleveland fire regime experiment.
The Cape Cleveland site was grazed by a low density of free ranging cattle from the
early 1900’s to the 1970’s (C. Adams pers. com. 1997). Queensland Parks and Wildlife
Service records indicate the eucalypt savanna of Cape Cleveland has a history of
regular fires, with intervals ranging from one to five years and typically occurring
between May to December. The trial site was burnt prior to this study by unplanned
fires in December 1990 and December 1994.
Three experimental fire regimes were implemented across the Cape Cleveland site,
between 1997 and 2001:
1. Control: savanna burnt mid dry season (July) 1997 only.
2. Early burnt: savanna burnt July 1997 and early dry season (May) 1999.
3. Late burnt: savanna burnt July 1997 and late dry season (Oct) 1999.
The benefit of this experimental design is that it examines fire regimes of mixed
intervals, intensity and season, typical of the Townsville region. One of the criticisms
of previous savanna fire trials has been the repeated implementation of fixed fire
regime treatments (e.g. successive annual early dry season fires), which were not true
representations of contemporary fire regimes (Russell-Smith et al. in press).
The entire 10 ha study site was deliberately burnt in the mid dry season of 1997, after
the establishment of permanent survey plots (Chapter 3). The fire was ignited at 1 pm,
15th July. The air temperature at ignition was 25º C, relative humidity was 54% and a
north-easterly wind was fluctuating around 8 km hr -1. Ignition began in the south-west
corner of the block and drip torches were used to guide the fire around the site
perimeter in both clock-wise and anti-clockwise directions along slashed fire lines. This
initial mid dry season fire was undertaken across the entire 10 ha area to provide
valuable pre-fire floristic data for all plots, including those that remained unburnt for
the remainder of the study (Chapter 3). While it is acknowledged that burning the
whole site as one unit in 1997 fire does not adequately replicate the mid dry season fire,
the unit of comparison for the experiment is the fire regime encompassing the five
years of study and no analyses were undertaken on responses to the 1997 fire in
isolation.
24
Chapter 2. Study sites, climate and design of the Cape Cleveland fire regime experiment.
Following the July 1997 fire, the site was split into nine parallel blocks of
approximately 1 ha in area (80 m width by 130 m length); by slashing 4 m wide fire
lines between the blocks (Figure 2.4). A 20 m wide buffer zone was established along
the roadside boundary, perpendicular to the main blocks, and was burnt annually during
the dry season from 1997 to 2000, to create a fire break. Each fire treatment was
imposed on three of the nine, 1 ha blocks. The blocks were allocated to treatments
using a randomised block design. One replicate of each treatment was randomly
allocated a position in each of blocks 1 - 3, 4 - 6 and 7 - 9 (Figure 2.4). Blocking was
undertaken rather than a full randomisation to account for a floristic gradient across the
study site detected in initial field inspections, prior to establishing plots in 1997. That
is, a few common species, most notably Eucalyptus platyphylla and Heteropogon
contortus, occurred in greatest abundance in blocks 7 - 9. Surface soil samples
indicated no corresponding gradient in the topsoil.
150
m
North
E2 L2 C2 C1 L1 E1
Road
Fire break
C3 L3 E3
750 m
Figure 2.4. Schematic diagram of the layout of experimental fire regimes at the Cape
Cleveland study site. Control (■); Early burnt (■); Late burnt (■). C1, Control block 1;
E2, Early burnt block 2; L3, Late burnt block 3, etc.; a 20 m wide fire break was burnt
annually from 1997 to 2000 (■).
The three 1 ha blocks assigned to the early burnt treatment (Figure 2.4) were burnt on
the 24th May 1999, with ignition commencing at 10.30 am. At the time of ignition, the
air temperature was 27.5ºC, relative humidity was 70% and a north-easterly wind
25
Chapter 2. Study sites, climate and design of the Cape Cleveland fire regime experiment.
26
remained < 5 km hr -1. The three 1 ha blocks assigned to the late burnt treatment
(Figure 2.4) were burnt on the 13th October 1999, with ignition commencing at 8.10
am. At the time of ignition, the air temperature was 28ºC, relative humidity was 53%
and a north-easterly wind typically ranged from 5 to 10 km hr -1. The implementation
technique used for the early and late dry season fires was the same as that described for
the July 1997 fire. Ignition began in the south-west corner of the relevant block and the
fire was guided around the perimeter of the block in both clock-wise and anti-clockwise
directions using drip-torches.
Surveys of standing plants and seedlings were undertaken across the Cape Cleveland
study site between 1997 and 2001. The specific methodologies for assessing floristic
patterns and the effect of fire on critical life events at Cape Cleveland and additional
sites, at Castle Hill, Many Peaks Range and Mt Elliot (Figure 2.1), are described in
Chapters 3 to 7.
Chapter 3. The effect of fire regime on floristic patterns.
Chapter 3. The effect of fire regime on floristic patterns in a
tropical savanna of north-eastern Australia.
FIREREGIME
Seed dormancy release
Floristic patterns
Seed bankdynamics
Seedlingemergence
Survival andgrowth ofjuveniles
Survival andgrowth of
mature plants
Seedling survival
27
Chapter 3. The effect of fire regime on floristic patterns.
3.1 Introduction
Australian tropical savannas display stability of floristic composition in response to a
range of fire regimes (Bowman et al. 1988; Williams et al. in press). However, fire
regime can affect floristic patterns, primarily through changes in species abundance
rather than significant species replacement (Bowman et al. 1988; Fensham 1990;
Lonsdale and Braithwaite 1991; Russell-Smith et al. in press).
Contrasting responses to fire frequency have been detected in savanna species. For
instance, the annual grass Sorghum stipoideum, and the sprouting shrub Grevillea
goodii increase in density with annual burning, while the perennial grass Alloteropsis
semialata and the obligate seeder shrub Acacia holosericea show a preference for
longer fire intervals (Russell-Smith et al. in press; Williams et al. in press). The density
of some savanna trees, especially non-eucalypts, also increase with fire intervals of
three or more years (Sandercoe 1988; Pressland et al. 1989; Fensham 1990; Bowman
and Panton 1995; Williams et al. 1999b). Eucalypts vary in their response to fire
protection, with increased tree density documented in several species, including
Eucalyptus tetrodonta, whereas the density of E. miniata remains stable, even after 21
years of fire exclusion (Fensham 1990; Bowman and Panton 1995; Russell-Smith et al.
in press).
The timing and intensity of fire can affect floristic patterns in Australian tropical
savannas. The mortality of woody species is directly related to fire intensity (Williams
et al. 1999b). Late dry season fires can promote some grasses, such as Heteropogon
contortus, while earlier dry season fires may promote others, including Themeda
triandra (Shaw 1957; Walker et al. 1989; Orr et al. 1991). Wet season fires can reduce
the abundance of both annual and perennial grasses, while promoting some annual
forbs (Williams and Lane 1999). The abundance of many woody and herbaceous
species is also correlated with climatic, edaphic and topographic variables (Fensham
1990; Williams et al. 2002a).
Much of the research into fire effects on floristic patterns in Australian tropical
savannas has centred on the monsoonal regions of the Northern Territory and, to a
lesser extent, Cape York Peninsula (e.g. Bowman et al. 1988; Fensham 1990; Crowley
28
Chapter 3. The effect of fire regime on floristic patterns.
and Garnett 1998; Williams and Lane 1999; Williams et al. 1999b; Crowley and
Garnett 2000). Data are also more prevalent for dominant woody and grass species,
with less information on the influence of fire on forbs and other sub-dominant species.
This chapter examines the influence of fire regime on floristic patterns in a tropical
savanna of north-eastern Australia, south of Cape York Peninsula. Questions that are
addressed are:
1. What is the rate of fuel load accumulation after fire?
2. Does fire intensity vary with fire season?
3. Does fire regime influence species composition and abundance?
4. Does fire regime influence species richness?
5. Are these patterns similar to those observed in other regions of northern Australia?
3.2 Methods
3.2.1 Study site
The influence of fire regimes on the floristic patterns, fuel loads and fire intensity in
eucalypt savanna in north-eastern Australia was assessed at the Cape Cleveland
experimental site, 25 km east of Townsville (Figure 2.1), using the fire regimes
described in Chapter 2 (Figure 2.4). Rainfall data for Cape Cleveland over the period of
study are provided in Table 2.1.
3.2.2 Sampling methods
3.2.2a Fuel load sampling
Fuel dynamics were assessed from 1997 to 2001 (Table 3.1). Ground layer fine fuels,
including herbaceous material, leaf litter and twigs < 6 mm in diameter, were sampled
to a height of 2 m. Fuel load samples were collected from randomly located 0.5 m2
quadrats. Fifteen samples were collected prior to the July 1997 fire, and 15 samples in
June 1998, from across the entire 10 ha study site. In May 1999, prior to the early dry
season fires, three samples were collected from each of the three relevant 1 ha blocks.
Likewise, three samples were taken from each of the three late burnt 1 ha blocks, prior
to the late fires in October 1999. In June 2000 and August 2001, three fuel load
samples were taken from each of the nine 1 ha blocks. To provide additional samples
29
Chapter 3. The effect of fire regime on floristic patterns.
from recently burnt savanna, four samples were collected from the annually burnt
roadside fire break block in September 1998 and three in May 1999. All fuel load
samples were oven dried at 65ºC for at least 48 hours prior to weighing.
Table 3.1. Summary of fuel samples from eucalypt savanna at Cape Cleveland. Date of collection Number of
samples (0.5m2)
Fire regime Years since fire
July 1997 15 Combined 3
June 1998 15 Combined 1
September 1998 4 Annual fire (roadside fire break) 1
May 1999 9 Early burnt 2
May 1999 3 Annual fire (roadside fire break) 1
October 1999 9 Late burnt 2
June 2000 9 Control 3
June 2000 9 Early burnt 1
June 2000 9 Late burnt 1
August 2001 9 Control 4
August 2001 9 Early burnt 2
August 2001 9 Late burnt 2
3.2.2b Fire intensity sampling
The entire 10 ha study site was burnt in a single fire implemented in the mid dry season
of 1997 (Chapter 2) and the rate of spread was determined at ten separate locations
across the site. At each location, two metal markers, spaced between 2 m and 7 m apart,
were dropped in front of, and perpendicular to, the fire front. The time taken for the fire
front to move between markers was recorded. The exact distance between the markers
was measured after the fire and the rate of spread calculated by dividing the distance
between the markers by the time taken for the fire to move between them. The mean
from the ten measurements was used as the rate of spread in the calculation of fire
intensity for the 1997 fire.
The rate of spread estimates of the early and late dry season 1999 fires differed from
that of the 1997 fire. The time taken for the fire front to move between two or three
pairs of trees was measured from the fire line. This is a less precise, although still
effective, measure of fire spread than that of the July 1997 fire, but was necessary as all
30
Chapter 3. The effect of fire regime on floristic patterns.
personnel were involved in implementing the 1999 fires. While the ground layer was
completely combusted during the October 1999 fires, there were unconsumed grass
stalks after the May 1999 fires, up to 0.75 m in height. Three 0.5 m2 samples of the
remaining fuel were collected and used to subtract from the original fuel load to
provide a figure of fuel actually consumed in the fire. The post-fire fuel load after the
July 1997 fire was not quantified, and therefore is a slightly high estimate of fire
intensity.
Fire intensity was calculated using the standard equation (Byram’s fire line intensity):
Fire intensity = heat yield of burnt fuel (constant of 20 000 kJ kg-1) X fuel consumed in
fire (g m-2) X rate of fire spread (m sec-1) (Byram 1959; Gill and Knight 1991).
3.2.2c Floristic sampling
Species composition and abundance data were sampled at Cape Cleveland to determine
the effect of fire on floristic patterns. Studies of fire regimes in tropical savannas of the
Northern Territory have detected only subtle and sometimes variable species responses
(e.g. Bowman et al. 1998). This lead Lonsdale and Braithwaite (1991) to recommend
the use of repeated surveys of permanent plots to document species change over time,
rather than once-off comparative studies of plots with different recent fire histories.
Repeated surveys have been successful in detecting significant floristic patterns in
response to fire regimes in savannas of the Northern Territory (Hoare et al. 1980;
Russell-Smith et al. in press; Williams et al. in press).
Changes in species abundance were determined using annual surveys of permanently
marked plots at the Cape Cleveland study site. A pilot study was used to determine an
appropriate plot size, through an assessment of the relationship between species
richness and plot area. A species-area curve was produced using 20 separate plots, each
with nested sub-plots increasing in size from 1 m2 to 400 m2 (Figure 3.1). The point
where the species- area curve begins to plateau, in this case at 100 m2, is considered the
minimal area required for effective samples, although the value of “minimal area” has
been debated (Barbour et al. 1987). Plots of 100 m2 have successfully detected floristic
patterns in previous studies in Australian tropical savannas (Bowman et al. 1988;
Fensham 1990). Four spatially separate plots were used to sample the variation across
31
Chapter 3. The effect of fire regime on floristic patterns.
each 1 ha block at Cape Cleveland. Therefore, four 100 m2 plots were used to sample
each of the nine, 1 ha blocks, providing a total of 36 plots. This sampling effort is
considered effective for assessing the herbaceous layer and hence community
composition, although it is acknowledged that larger plots may be more useful for
documenting changes in tree densities.
s
eci
f sp
er o
mb
Nu
0
10
20
30
40
0 100 200 300 400
Area (m-2)
e
Figure 3.1. Species-area curve of the mean number (± 1 standard error) of species per
unit area within 20 plots in eucalypt savanna, unburnt for three years, at Cape
Cleveland prior to the establishment of the study.
The four 100 m2 plots were located within each 1 ha block through the use of random X
and Y coordinates, with the stipulation that all plots were at least 10 m from the block
edge and that plots were separated by at least 2 m. The first restriction ensured fires
developed some speed, and therefore intensity, before passing into a plot.
A stratified random sampling technique was used to sample species abundance in each
plot, involving the use of 20 throws of a 1 m2 quadrat into the plot from 20 points of
equal spacing around the plot perimeter. The presence of all species within (or growing
across for twining forbs) each quadrat was recorded. This provided an abundance out of
20 for all species per plot, in each of the five annual surveys. Additional species within
the plot that were not recorded within the 20 quadrats were also documented to record
species richness at the 100 m2 scale. This was considered the most appropriate
32
Chapter 3. The effect of fire regime on floristic patterns.
estimation of species abundance, although frequency does not distinguish abundance
within each quadrat. A pilot trial of percentage cover estimates indicated large variation
between re-assessments of quadrats, making this sampling unrepeatable. The difficulty
in this method arose from the difficulty in estimating the comparative cover of
different growth forms, particularly tufted grasses, woody species and the twining
forbs. Point cover estimates did not detect the many sub-dominant species. Density
counts were not possible for many herbaceous and multi-stemmed subshrub species, as
individual plants could not be distinguished. Density measures are effective for many
woody species, and counts of the dominant trees were undertaken during the annual
surveys to document survival and growth, which are presented in Chapter 8. However a
single measure of species abundance was required to assess floristic patterns at a
community level, and therefore density was not appropriate.
All of the 36 plots were surveyed annually for five years (1997 to 2001), in the late wet
to early dry seasons (March to May), to ensure detection of annual species. Thus the
five annual surveys provided a total of 180 survey records.
3.2.3 Statistical analyses
3.2.3a Fuel load analyses
Analyses of variance (ANOVA) were performed separately on the 2000 and 2001 fuel
loads, to assess the significance of variations between the three fire treatments (unburnt
control, and burnt early and late dry season 1999). A third ANOVA assessed the
significance of differences in fuel load between times since last fire categories, with
samples grouped to the nearest year. All univariate analyses in this thesis were
computed using the Statistica program (StatSoft 1999). The ANOVA assumption of
homogeneity of variances was assessed using Cochran’s test (Underwood 1997). Log
(x) transformations were required to resolve variance heterogeneity in the analysis of
the 2000 fuel loads.
3.2.3b Fire intensity analyses
A t-test was used to examine differences between the May and October 1999 fires. No
statistical comparisons were made using the July 1997 fire data, due to a lack of
33
Chapter 3. The effect of fire regime on floristic patterns.
replication. A Cochran’s test indicated homogeneity of variances of raw data, hence no
transformations were required.
3.2.3c Multivariate analyses of floristic dynamics
The aim of the multivariate analyses was to determine community level dynamics in
floristic composition and abundance. This was done by comparing the species
composition and abundance data for the 180 surveys of the 36 plots, as well as
comparisons of the fire treatments in a subset of years. The term “survey(s)” is used
here to refer to the floristic composition and abundance data collected during one or
more annual inspections of the 36 permanent plots at Cape Cleveland.
First, to detect the influence of fire regime on floristic composition, a cluster analysis
was performed on the 180 surveys, based on species composition data (i.e. species
presence or absence), using the PATN program (Belbin 1995). An agglomerative
hierarchical method of clustering was performed using the Kulczynski distance
measure and group average linkage agglomerate technique (unweighted pair group
arithmetic averaging, UPGMA; Belbin 1995). The Kulczynski distance measure
calculates similarity scores for plots, based on comparisons of species presence or
absence in each survey. This distance measure is effective in determining survey
similarities for ecological data (Faith et al. 1987). The UPGMA technique groups
surveys based on the similarities scores for the centre of each developing cluster, and is
especially useful for grouping surveys with compositions intermediate between two
clusters (McArdle 2001). The resulting clusters were presented in a dendrogram.
An additional cluster analysis was performed using species abundance scores
documented in the 180 surveys. This analysis incorporates fluctuations in species
abundance with the compositional data to assess the influence of fire on both species
composition and abundance. The cluster analysis was undertaken using the same
technique described above, with the Kulczynski distance measure and the group
average linkage agglomerate technique, based on species abundance rather than
presence or absence data, and was computed using the PATN program (Belbin 1995).
34
Chapter 3. The effect of fire regime on floristic patterns.
Secondly, a Principle Components Analysis (PCA) was performed on the species
composition and abundance data using the CANOCO program (ter Braak and Smilauer
1998). PCA, which is an ordination technique, displays the inter-relationships between
all surveys, without forcing them into groups (ter Braak and Wiertz 1994). PCA is a
linear response model, which is appropriate when the variation between surveys is
narrow, such as this study of repeated annual surveys of permanent plots (ter Braak and
Prentice 1988). Other ordination methods, such as semistrong hybrid multidimensional
scaling, were assessed and produced similar scatterplots.
A PCA was undertaken to look at community composition and abundance relationships
for all 180 surveys (1997-2001), and the results are presented in a scatter plot. To assist
in the interpretation of the PCA of the entire 180 surveys, an additional scatter plot was
produced using the mean PCA coordinates for each fire regime, for each of the five
years.
Thirdly, a partial Redundancy Analysis (RDA) was used to assess the correlation
between species composition and fire variables, using the CANOCO program (ter
Braak and Smilauer 1998). A RDA is based on PCA and performs a multiple regression
of environmental variables and species abundance data (McArdle 2001). A “partial”
RDA uses additional environmental variables as covariates, to help decipher the unique
effect of the environmental variables of interest. For example, Morrison et al. (1995)
used time since last fire as a covariate to focus an analysis onto the effect of inter-fire
interval of species abundance. A partial RDA is especially useful for examining
permanent plot data, because it allows the removal of background effects, such as
intrinsic plot differences and fluctuations over time that are consistent to all treatments
(ter Braak and Smilauer 1998).
A partial RDA was performed for the entire data set (1997 to 2001 surveys) to correlate
species composition with elements of the fire regime. Knowledge of the fire history of
the area prior to 1997 (i.e. fires in December 1990 and 1994) allowed allocation of fire
variables for the initial 1997 plot surveys. The fire variables correlated with species
composition were: (i) time since last fire (years); (ii) fire interval prior to last fire
(years); and (iii) season of last fire. Fire season alternatives used were early dry (May),
35
Chapter 3. The effect of fire regime on floristic patterns.
mid dry (July), late dry (October) and early wet season (December). The fire seasons
were represented as nominal variables. That is, each of the four fire season options
were represented by a separate row in the spread sheet being analysed and surveys were
allocated a zero or one to indicate the relevant fire season (ter Braak and Smilauer
1998).
Three covariates were used to remove background differences between the 180 surveys
that were not attributable to fire variables. The 36 plots were identified as covariables.
This allowed the removal of background differences between plots that were
irrespective of the fire treatments. As a randomised block design was used in the survey
design (Chapter 2; Figure 2.4), blocking was used as a covariate to remove differences
between the three groups of blocks across the trial plot (i.e. C, E and L block 1; C, E
and L block 2; C, E and L block 3; Figure 2.4). The third covariate used was the year of
survey (1997 to 2001), which allowed the removal of annual fluctuations not
attributable to fire treatments.
A partial RDA of the 1999 and 2000 surveys assessed the effect of fire season on
species composition and abundance in the year following fire. An additional fire
variable, fire intensity (using logged data due to large variances), was available for this
analysis because the intensity of the most recent fire was known for both 1999 and
2000 recordings. Fire intensity data was not available for analysis of the full 1997 to
2001 data set, because the intensity of the fire prior to the initial 1997 recordings (i.e.
the 1994 fire) was unknown.
The analyses of both the 1997 to 2001 surveys and the 1999 and 2000 subset, followed
ter Braak and Smilauer’s (1998) recommendations for before and after, control and
impact (BACI) studies. Monte Carlo permutations (199 permutations for each analysis)
were used to assess the significance of the correlation between species variation and
environmental variables. This is a test of significance obtained by repeated shuffling of
samples (ter Braak and Smilauer 1998). The annual surveys were permutated as a time-
series of the 36 plots.
36
Chapter 3. The effect of fire regime on floristic patterns.
Initially all fire variables were analysed as a group, with the plot, block and year of
survey as covariates. This determined the variance in species abundance explained by
the fire variables. A forward selection analysis was then undertaken on the individual
fire variables, which is analogous to a post-hoc test (ter Braak and Smilauer 1998). The
importance of each individual fire variable was ranked and the species variation
explained separately by each fire variable was denoted as “Lambda-1”. Lambda-1 is the
eigenvalue of the ordination when only that individual variable is used with the
covariables. Secondly, a model is produced to determine the best combination of fire
variables for explaining species variation. The variable with the largest Lambda-1 is
used as the basis, with separate variables subsequently tested to see which combination
of two variables provides the best explanation of species variance. The significance to
the model of the additional variable is tested using a Monte Carlo permutation test.
“Lambda-A” describes the additional species variance explained by the fire variable,
given those already in the model. This continues until no further correlation with the
species dataset can be provided by extra fire variables.
To quantify the relative effect of the three covariates and their interactions, separate
analyses were run using plot and then years, with the remaining two covariates plus the
fire variables designated as “covariables”, as described by ter Braak and Smilauer
(1998, pp. 263 - 266). The floristic variation accounted for by specific variables and
interactions is denoted as “% variation explained”. This is the sum of canonical
eigenvalues for each respective analysis, and is analogous to the sums of squares in
ANOVA (ter Braak and Smilauer 1998). The significance of specific variables was
assessed using a Monte Carlo test with 199 permutations. As blocking was a
fundamental element in the analyses, it could not be analysed separately as an
independent variable. The assessment of species variance between blocks was
calculated by deducting the sum of all unconstrained eigenvalues from the total
variance of 1.0. The unexplained variance represents the variance that remains after
fitting all variables, including blocks, and was calculated as the sum of all
unconstrained eigenvalues minus the sum of all canonical eigenvalues (ter Braak and
Smilauer 1998).
37
Chapter 3. The effect of fire regime on floristic patterns.
3.2.3d Univariate analyses of species richness and abundance
The aim of the univariate analyses was to examine the response to fire regime of
individual species and growth form groups. Univariate analyses assessed the effects of
fire regime, rather than survey clusters or axes determined from mulitvariate analyses.
This is a more direct assessment of fire regime and Lonsdale and Braithwaite (1991)
argued that univariate analyses of groups determined from DCA analyses were not
sensitive to the variable and subtle species dynamics in tropical savannas.
Species were grouped according to growth form to aid the interpretation of fire
response, and their abundance scores were summed to provide the abundance of each
growth form. The determination of growth form groups is presented in Figure 3.2. All
species were first separated into woody and herbaceous species, due to the importance
of these functionally distinct groups (Walker 1985). The woody species were divided
into trees and shrubs, and subshrubs, based on height at maturity (the latter group being
less than 2 m; Harden 1990). The trees and shrubs were then separated into woodland
and rainforest species, because these two groups may respond differently to fire
regimes. The distinction between these groups is subjective, with species more
commonly found in savanna than rainforest allocated to the “woodland trees and
shrubs” group. The selection of species within the “rainforest” group was conservative
and restricted to those primarily found within rainforest patches, rather than ecotonal
species.
Herbaceous species were first split into monocotyledons and dicotyledons (i.e. forbs as
defined by Harden 1990). The grasses were assessed separately from all other
monocotyledons due to the significance of grasses in savanna function (Higgins et al.
2000). All monocotyledons other than grasses were broadly labelled as “non-grass
monocots”.
Herbaceous dicotyledons were separated into perennial and ephemeral forbs. The latter
typically complete their life cycle within a year, although a few individuals of these
species may survive into a second year. The perennial forbs were divided on the basis
of growth form into twining and upright forbs.
38
Chapter 3. The effect of fire regime on floristic patterns.
Woody species
> 2 m at maturity < 2 m at maturity
Woodland trees and shrubs
Rainforesttrees and shrubs
Subshrubs
Herbaceous species
monocotyledons dicotyledons (forbs)
Grasses Non-grass monocots
perennial annual or biennial
Twiningperennialforbs
Uprightperennialforbs
Ephemeral forbs
Figure 3.2. Diagrammatic key to the distinction of growth form groups used
throughout this thesis.
Species were also classified as “natives” and “exotics” as identified by Henderson
(1997) and univariate analyses assessed whether exotic species were advantaged over
natives by particular fire regimes. The effect of fire on species richness was examined
at 1 m2 and 100 m2 scales.
The most common individual species were examined for evidence of fire response. For
efficiency, analyses of individual species were only performed on those with at least
1% of the total abundance out of the 180 surveys (i.e. species present within 1% of all
quadrats). This limited the analyses to 24 out of the total 118 species detected in the
surveys.
To provide an assessment of the overall effect of fire regimes (control, early and late
burnt) from 1997 to 2001, on species richness and the abundance of species groups and
common species, an analysis of covariance (ANCOVA) was performed on the 2000
39
Chapter 3. The effect of fire regime on floristic patterns.
survey data using the 1997 data as a covariate (Zar 1999). This allowed the assessment
of changes over the course of the five year fire experiment, by analysing the differences
at the end of the trial (2001) once adjusted for differences present prior to the trial
(1997). Separate analyses were not undertaken on the unique effects of the 1997 fire,
due to a lack of unburnt comparisons.
The effect of the 1999 fire season experiment on species richness and the abundance of
species groups and common species, was analysed using two complimentary univariate
analyses. First, an ANCOVA was performed on the 2000 survey data using the 1999
data as a covariate, to assess the change before and immediately after the fire
treatments (control, early and late burnt). In addition, a repeated measures ANOVA of
the three fire treatments in the 1999, 2000 and 2001 data sets was performed, thus
assessing the change in species with fire treatment before fire through to the second
year after fire. The critical factor in repeated measures ANOVA of before and after
impact assessments (BACIs) is the interaction between year and treatment (Green
1993).
In each of these analyses, the four plots in each of the three replicate 1 ha blocks were
considered nested within the fire treatments (control, early or late burnt). The nested
plots were treated as random factors, while fire treatments (and year in the repeated
measures ANOVA) as fixed factors. Where the variation between treatment replicates
of separate blocks was low (P > 0.25), the block replicates were pooled to increase the
power of the tests (Underwood 1997).
ANOVA assumptions of homogeneity of variances between treatments were checked
using Cochran’s test (Underwood 1997) and where significant differences were
detected, analyses were performed on log (x + 1) transformed data. Where data
transformation did not fix significant heterogeneity of variances, a non-parametric test
was used. However, no non-parametric test is available that simultaneously assesses
both the change over time and the differences between the fire treatments. Therefore
separate Kruskal-Wallis ANOVA by ranks tests were performed to check for
significant fire treatment differences in each of 1999, 2000 and 2001 surveys. This
enabled an assessment of pre-existing differences as well as differences in the first and
40
Chapter 3. The effect of fire regime on floristic patterns.
second years post-fire. No nesting option is available in this analysis, and therefore all
plots were treated as independent replicates. Where a significant difference was found,
a Mann-Whitney U-test was used as a post-hoc test, with a Bonferoni adjustment of the
significance level for multiple comparisons (Sokal and Rohlf 1995).
The large number of separate analyses from the same species abundance data sets
increased the probability (alpha) of incorrectly rejecting the null hypothesis (Type I
error; ter Braak and Wiertz 1994). To account for this, a conservative probability level
(P < 0.01) was set for the species abundance analyses. While this increases the
probability of incorrectly rejecting a significant result, it is less likely to result in an
inappropriate claim of significant fire effects, enabling greater confidence when
ascribing a fire response.
3.3 Results
3.3.1 Fuel load dynamics
Fuel accumulated rapidly after fire, with just over half of the maximum fuel load
recorded one year post-fire and stabilising at the maximum weight of approximately 10
tonnes ha-1 after two years (Figure 3.3). There was no significant difference between
fuel loads two, three and four years after fire, which were all significantly greater than
the fuel load one year post-fire (F3,76 = 14.323; P < 0.001). There were significantly
more fuel in the unburnt control blocks than both the early and late burnt blocks in
2000, the first year after the 1999 fire season treatments (F2,24 = 13.269; P < 0.001;
Figure 3.4). No significant differences were detected across the treatments by 2000, the
second year post-fire (F2,24 = 0.222;
P > 0.05; Figure 3.4).
41
Chapter 3. The effect of fire regime on floristic patterns.
-1
) h
a
ad (
l lo
Fue
0
5
10
15
1 2 3 4
Years since fire
t
a
b b b
n = 35 n = 27 n = 9 n = 9
Figure 3.3. Mean (± 1 standard error) fuel accumulation with years since fire in
eucalypt savanna at Cape Cleveland. Means with the same superscript are not
significantly different at P < 0.05; n = the number of 0.05 m2 samples.
0
4
8
12
Control Early burnt Late burnt
a
b b
(a)
0
4
8
Control Early burnt Late burnt
Fire Treatment
a a a(b)
Figure 3.4. Mean (± 1 standard error) fuel load in unburnt, early dry season burnt and
late dry season burnt eucalypt savanna at Cape Cleveland in (a) 2000 and (b) 2001.
Means with the same superscript are not significantly different at P < 0.05. Time since
fire in 2000: Control 3 years, Early burnt and Late burnt 1 year; Time since fire in
2001: Control 4 years, Early burnt and Late burnt 2 years.
12
Fuel
load
(t h
a –1
)
42
Chapter 3. The effect of fire regime on floristic patterns.
3.3.2 Fire intensity
Fire intensity was significantly higher during the late dry season 1999 fires than those
during the early dry season (t5 = 3.980; P < 0.02; Figure 3.5). The intensity recorded
during the 1997 fire was lower than the means for both early and late dry season fires,
although it fell within the range of intensities documented during the three early dry
season fires.
0
2000
4000
6000
8000
Mid dry season 1997
Early dry season 1999
Late dry season1999
Fire treatment
Fire
inte
nsity
(Kw
m-1
)
Figure 3.5. Intensity of the mid dry season (1997), early dry season (1999) and late dry
season (1999) fires in eucalypt savanna at Cape Cleveland. A single value is provided
for the mid dry season fire. Values for early and late dry season 1999 fires are means (±
1 standard error).
3.3.3 Multivariate analyses of species composition and abundance
3.3.3a Cluster Analysis
The cluster analysis of species composition data first isolated all surveys of each plot
within control block 3 (C3A-D) and late burnt block 3 (L3A-D), all five surveys of plot
L2B, four of the five annual surveys of plots E3B and C2B and the 1997 survey of plot
E3A (Figure 3.6; see Figure 2.4 for block layout). This clustering reflects a floristic
variation across the study site and justifies the use a randomised block design rather
than full randomisation of fire treatments (Chapter 2).
The second pattern that can be seen in the cluster analysis is the widespread clumping
of annual surveys of the same plot, which occurred in all three fire regimes. All five
annual surveys were grouped together for 16 (44%) of the 36 plots, 26 (72%) had at
43
Chapter 3. The effect of fire regime on floristic patterns.
least four of the five surveys grouped together and 33 (92%) of the plots had at least
three of the surveys clustered together. The fact that all annual surveys of each plot
were not grouped together indicates some dynamics in species composition over the
study, however there was no consistency in which of the surveys were separated,
suggesting fire regime effects were variable, and interacted with dynamics over time
and plot variation.
Incorporating species abundance with composition data in the cluster analysis affected
the grouping of surveys (Figure 3.7). Three of the four plots from late burnt block 3
(L3A, L3B and L3D) were separated from all other surveys (Figure 2.4). Fire appeared
to have had little effect on this primary distinction between plots, as all five annual
surveys were clustered together for each of L3A, L3B and L3D. The most distinctive
feature of these three plots is that they all contain a lot of Heteropogon contortus but
little of H. triticeus, which is the dominant grass of other plots. Other plots with high H.
contortus abundance also contained a moderate to high abundance of H. triticeus.
Clustering of annual surveys of plots remained widespread with the inclusion of
abundance data in the analysis. A total of 14 (39%) of the 36 plots, with representatives
from each of the three fire regimes, had all five annual surveys clustered together
(Figure 3.7). Twenty three plots (64%) had at least four, and 33 plots (92%) had at least
three of the five annual surveys clumped together. This suggests species differences
were usually greater between plots than annual surveys of a specific plot. However, the
fact that the annual surveys of several plots were separated indicates some fluctuations
in species composition and abundance occurred during the study, which may be
attributable to fire regime.
3.3.3b Principle Components Analysis
The PCA scatter plot of the entire 180 surveys displays symbols representing surveys
of the control plots clustered within the centre of the scatter plot, while those of the late
and early burnt plots radiate out to the periphery (Figure 3.8). All surveys for a
particular treatment were not grouped together.
44
Chapter 3. The effect of fire regime on floristic patterns.
Figure 3.6. Cluster analysis dendrogram from the 180 surveys in eucalypt savanna at Cape Cleveland, based on species composition data only. Survey codes: first digit identifies the fire treatment C, Control; E, Early burnt; L, Late burnt. The second digit identifies the 1 ha block number, 1 – 3 (see Figure 2.4 for block layout). The third digit identifies the four plots within each 1 ha block, A – D. The year of survey is also indicated.
Chapter 3. The effect of fire regime on floristic patterns.
Figure 3.7. Cluster analysis dendrogram from the 180 surveys in eucalypt savanna at Cape Cleveland, based on species composition and abundance data. Survey codes: first digit identifies the fire treatment C, Control; E, Early burnt; L, Late burnt. Second digit identifies the 1 ha block number, 1 – 3 (see Figure 2.4 for block layout). Third digit identifies the four plots within each block, A – D. The year of survey is also indicated.
A significant correlation was detected between fire variables and floristic variation over
the five year study (Table 3.2). The combined fire variables explained only 2.1% of the
species variation across the 180 surveys after the removal of background effects of
covariables, however the correlation with species variance and fire was statistically
significant due to the consistency of the relationship. Species differences between plots,
fluctuations over years irrespective of fire treatment, and blocking accounted for
42.0%, 3.5% and 10.5% of the variance respectively. The high correlation between
plots and species variance indicates that many of the species differences between plots
at the start of the study remained unaffected by fire. Interactions between fire, year and
plots accounted for 15.1% of species variation. A total of 26.8% of the species variance
could not be accounted for by these variables.
51
Chapter 3. The effect of fire regime on floristic patterns.
Table 3.2. Partial RDA of floristic variation across the 180 surveys at Cape Cleveland,
between 1997 and 2001, attributable to fire variables, fluctuations between years, plots,
interactions and blocking. Fire variables are time since last fire, interval before last fire
and fire seasons. 1The floristic variation accounted for by specific variables and
interactions is denoted as “% variation explained”. This is the sum of canonical
eigenvalues for each respective analysis, and is analogous to the sums of squares in
ANOVA. 2The significance of correlations between species variation and tested
variables was assessed using a Monte Carlo test with 199 permutations.
Variable d.f. % variation explained1 F statistic P value2
Fire variables 5 2.1 5.387 0.005
Year 4 3.5 9.115 0.005
Plot 35 42.0 6.540 0.005
Fire x Year x Plot 15.1
Blocks 10.5
Unexplained variation 26.8
The results of the forward selection of fire variables, which is analogous to a post-hoc
test in ANOVA, is displayed in Table 3.3. The interval before last fire was the fire
variable with the best correlation with floristic variance, although time since last fire
and several fire seasons also accounted for 1% of the variation. The combination of fire
variables that best accounted for species variation was interval before last fire and early
dry season fire. Although the latter was not ranked as the second most important
individual variable (Lambda-1), it provides explanatory power additional to that of
interval before last fire, so that together they produced the best correlation with floristic
variation. This indicates that both fire interval and season are important for explaining
floristic variation. Note that fire intensity values were not available for the fire prior to
1997, and therefore fire intensity was not used this analysis.
52
Chapter 3. The effect of fire regime on floristic patterns.
Table 3.3. Forward selection results of the partial RDA of floristic variance across the
180 surveys at Cape Cleveland, between 1997 and 2001, with individual fire variables. 1 The species variation explained separately by each fire variable, after allowance for
covariables, is denoted as “Lambda-1.” The individual fire variables are ranked by their
importance in explaining floristic variation. 2 A “Lambda-A” score is produced for each
variable, describing the additional species variance a variable explains, given the
variables already correlated with species variance. 3 The significance of the correlation
with species variance, once the new variable is added, was assessed using Monte Carlo
tests with 199 permutations.
Variable Lambda11 Lambda A2 F statistic P value3
Interval before last fire 0.01 0.01 7.08 0.005
Time since last fire 0.01
Mid dry season fire 0.01
Early dry season fire 0.01 0.01 3.57 0.005
Late dry season fire 0.01
Early wet season fire 0.00
The partial RDA of the full 180 surveys is portrayed in a biplot, which presents the
correlation between fire variables and species variance (Figure 3.10). To help
interpretation, the symbols representing surveys are grouped into fire regime (control,
early burnt and late burnt), before and after the implementation of the 1999 fire season
treatments. The angle between variables depends on their correlation, with a small
angle indicating a strong correlation. The early, mid and late dry season fire variables
were evenly spaced around the biplot, while the wet season fire was of such limited
correlation it was ignored by the RDA. The mid dry season fire was strongly correlated
with increasing time since last fire and fire intervals, because the longest unburnt plots,
those of the control treatment surveyed in 2000 and 2001, were last burnt in the mid dry
season fire of 1997.
53
Chapter 3. The effect of fire regime on floristic patterns.
RD
A a
xis
2
RDA axis 1-0.4 +0.4
-0.4
+0.4
Late fire
Time since fire
Mid fireFire interval
Early fire
Figure 3.10. Biplot from the partial RDA of the entire 180 surveys in eucalypt savanna
at Cape Cleveland from 1997 to 2001, showing the correlation between species
composition and abundance and fire variables. Arrow length indicates the strength of
the correlation between fire variable and species composition and abundance. Small
angles between arrows indicate a strong correlation between fire variables. Symbols
represent the coordinates of annual surveys of the three fire regimes: Control 1997
(●); Control 1998 (▲); Control 1999 (■); Control 2000 (▼); Control 2001 (►); Early
burnt 1997 (●); Early burnt 1998 (▲); Early burnt 1999 (■); Early burnt 2000 (▼);
Early burnt 2001 (►); Late burnt 1997 (●); Late burnt 1998 (▲); Late burnt 1999 (■);
Late burnt 2000 (▼); Late burnt 2001 (►).
54
Chapter 3. The effect of fire regime on floristic patterns.
The partial RDA of the 1999 and 2000 surveys indicated that fire variables together
accounted for 4.6% of the species variation before and after the 1999 fires (Table 3.4).
The species variance in 1999 and 2000 explained by the fire variables was higher than
that for the entire five year study. This was not simply because fire intensity data was
unavailable for the full 1997 to 2001 analysis, as a re-analysis of the 1999 and 2000
data set without fire intensity indicated the remaining fire variables still accounted for a
higher percentage of the species variation (3.8%).
Plots and blocking accounted for 56.7% and 15.6% of the species variation respectively
and interactions between fire, plot and year 11.7% (Table 3.4). As only two years were
analysed, year fluctuations provided negligible explanation after adjustment for
covariables of fire and plots, due to collinearity, especially with time since last fire. The
higher correlation between floristic variation and fire variables, plots and blocking
resulted in a lower proportion of unexplained floristic variation (11.4%) in the 1999
and 2000 analysis, than that of the full five years.
Table 3.4. Partial RDA of floristic variation across surveys undertaken in both 1999
and 2000, attributable to fire variables, fluctuations between years, plots, interactions
and blocking. Fire variables were time since last fire, interval before last fire, fire
intensity and various fire seasons. 1The floristic variation accounted for by specific
variables and interactions is denoted as “% variation explained”. This is the sum of
canonical eigenvalues for each respective analysis, and is analogous to the sums of
squares in ANOVA. 2The significance of specific variables was assessed using Monte
Carlo test with 199 permutations.
Variable d.f. % variation explained1 F statistic P value2
Fire variables 5 4.6 4.271 0.005
Year 2 0.0
Plot 35 56.7 4.832 0.005
Fire x Year x Plot 11.7
Blocks 15.6
Unexplained variation 11.4
Forward selection of fire variables indicated that fire intensity had the single greatest
explanatory power, accounting for 3% of the species variation (Table 3.5). Fire
55
Chapter 3. The effect of fire regime on floristic patterns.
intensity, plus mid and early dry season fire produced the best combination of fire
variables to explain floristic variation. This, as well as the high individual explanatory
values of time since last fire and interval before last fire, indicate that fire intensity,
interval and season each had an important influence on floristic variation in 1999 to
2000.
Table 3.5. Forward selection results of the partial RDA of floristic variance across the
1999 and 2000 surveys, with individual fire variables. 1 The species variation explained
separately by each fire variable, after allowance for covariables, is denoted as
“Lambda-1.” The individual fire variables are ranked by their importance in explaining
floristic variation. 2 A “Lambda-A” score is produced for each variable, describing the
additional species variance a variable explains, given the variables already correlated
with species variance. 3 The significance of the correlation with species variance, once
the new variable is added, was assessed using Monte Carlo tests with 199 permutations.
Variable Lambda11 Lambda A2 F-ratio P value3
Fire intensity 0.03 0.03 7.03 0.005
Mid dry season fire 0.03 0.01 3.80 0.005
Time since last fire 0.03
Interval before last fire 0.03
Late dry season fire 0.03
Early dry season fire 0.01 0.01 1.31 0.160
The biplot of the 1999 and 2000 partial RDA displays floristic change immediately
after the 1999 fire season trial (Figure 3.11). The change in coordinates between 1999
and 2000 for surveys in both the early and late burnt plots is in the opposite direction to
that in the unburnt controls. The biplot grouped together surveys of all four plots in
each of the early and late burnt blocks, for both 1999 and 2000, while the surveys of all
12 unburnt control plots were positioned in the same point in 1999 and 2000. The
reason for this is that separate fire intensity figures for 1999 were available for each
early and late burnt block, whereas all fire variables, including the intensity of the
previous fire (July 1997), were identical for all unburnt control plots. Hence the
unburnt control surveys were each correlated with the same set of fire variables,
56
Chapter 3. The effect of fire regime on floristic patterns.
resulting in an average correlation with floristic variation for the annual surveys of the
12 control plots.
The biplot of the 1999 and 2000 data set positioned the variable “late dry season fire”
close to fire intensity, indicating the strong relationship between increasing fire
intensity and late dry season fires (Figure 3.11). The mid dry season fire, fire interval
and time since last fire were also closely associated. The length of the arrows represent
the strength of the correlation between the fire variables and floristic variance. The
early dry season fire variable is shorter than the other arrows, indicating less individual
power for explaining species variance than the late dry season fires.
3.3.3d Univariate analyses of species richness and abundance
Twining perennial forbs were the most species rich growth form group, containing 22
species, or 18% of the community (Table 3.6). Upright perennial forbs were the least
diverse group, with 8 species. Twining perennial forbs and grasses were the most
abundant groups, providing 29 and 28% of the total abundance respectively, while
rainforest trees and shrubs produced the least abundance, they were represented by 18
species.
There were no significant differences in species richness at the 100 m2 scale in either
the 2000 or 2001 surveys (Table 3.7). There was however, significantly higher species
richness at the 1 m2 scale in 2000, after late dry season fires compared to early dry
season or unburnt control plots, and in early burnt compared with control plots in 2000.
There were no species richness differences at the 1 m2 scale by 2001.
An increase in the abundance of several common species and growth form groups,
especially grasses, twining perennial forbs and ephemeral forbs, occurred immediately
after fire but were reduced by 2001 (Table 3.7). A summary of the results presented in
Table 3.7 are provided below.
The abundance of both native and exotic species fluctuated over the five years, and was
higher in 2001 than 1997. The mean percentage increase of combined exotic species
(668%, s.e. 98) was significantly greater than that of natives (130%, s.e. = 4; U70 =
57
Chapter 3. The effect of fire regime on floristic patterns.
RDA axis 1
RD
A a
xis
2
-0.4 +0.4
-0.4
+0.4
Time since last fire
Fire intensityLate dry season fire
Interval before last fireMid dry season fire
Early dry season fire
Figure 3.11. Biplot from the partial RDA of surveys in eucalypt savanna at Cape
Cleveland in 1999 and 2000, showing the correlation between species composition and
abundance and fire variables. Arrow length indicates the strength of the correlation
between fire variable and species composition and abundance. Small angles between
arrows indicate a strong correlation between fire variables. Symbols represent the
coordinates of annual surveys of fire treatments: Control 1999 (■); Control 2000 (▼);
Early burnt 1999 (■); Early burnt 2000 (▼); Late burnt 1999 (■); Late burnt 2000 (▼).
58
Chapter 3. The effect of fire regime on floristic patterns.
Table 3.6. Species number and abundance of growth form groups in the five annual
surveys in eucalypt savanna at Cape Cleveland. 1Total abundance was calculated as the
sum abundance of all species of a growth form group.
Growth form Number of
species
% of total
species
Total
abundance1
% of total
abundance
Woodland trees and shrubs 15 13 1671 7
Rainforest trees and shrubs 18 15 610 3
Subshrubs 13 11 1537 6
Upright perennial forbs 8 7 1173 5
Twining perennial forbs 22 18 7146 29
Ephemeral forbs 13 11 1648 7
Grasses 16 14 6872 28
Non-grass monocots 13 11 3564 15
Combined species 118 100 24226 100
142.000; P < 0.001). There was no significant fire effect on the abundance of the native
species as a whole. Late dry season fires increased the abundance of combined exotic
species to a significantly greater extent than early dry season burnt or unburnt plots, in
2000. This difference had disappeared by 2001.
Woodland trees and shrubs as a group did not differ in abundance between fire
treatments. Neither were any significant differences detected in the common trees,
Corymbia clarksoniana and Planchonia careya. Likewise, no significant effect could
be detected for rainforest trees and shrubs, as a group, and the common rainforest tree,
Canarium australianum.
Subshrubs, as a group, did not differ in abundance between fire treatments. However,
the late dry season fires of 1999 significantly enhanced the abundance of the common
subshrub, Breynia oblongifolia, over unburnt controls. This difference was not apparent
in 2001. There was more of the exotic subshrub, Triumfetta rhomboidea, in both
unburnt control and late dry season burnt plots, than in early dry season burnt plots in
2000.
59
Chapter 3. The effect of fire regime on floristic patterns.
Upright perennial forbs, as well as the common species Hybanthus stellarioides and
Rostellularia adscendens, showed no significant fire effects. There was, however, a
significant fluctuation between the years 1999 and 2001 in the upright perennial forb
group that was not related to fire treatment.
Twining perennial forbs responded to fire treatment, with significantly greater
abundance in the late dry season burnt plots compared to unburnt control plots in 2000.
Treatment effects disappeared by 2001. The abundance of the dominant twiner,
Galactia tenuifolia, was significantly enhanced by burning. This was the only species
to show a significantly greater enhancement after early rather than late dry season
burning. The exotic twining perennial forb Passiflora foetida was significantly more
abundant after late dry season fires than early dry season fires or unburnt controls, in
both 2000 and 2001. This fire effect was confirmed by a significant fire by year
interaction, between 1999 and 2001.
The common twining perennial forbs, Flemingia parvifolia, Jasminum didymum and
the exotic Macroptilium atropurpureum showed no significant response to fire regime.
Glycine tomentella and Pycnospora lutescens showed significant fluctuations between
1999 and 2001 that were not related to fire regime.
Ephemeral forbs, as a group, showed a strong response to fire. Their highest abundance
occurred in 2000, following fire, with greater abundance after both early and late dry
season fires compared to unburnt controls. Few ephemeral forbs were present in the
2001 survey and consequently there were no treatment differences in that year. There
was significantly greater abundance of the ephemeral forb Indigofera hirsuta in early
and late burnt plots than unburnt controls in 2000. There was no significant fire effect
detected for Tephrosia juncea.
The grasses, as a group, were significantly more abundant in late dry season burnt plots
than unburnt controls in 2000, however this difference was not evident by 2001. No
significant fire effects could be detected for the common perennial grasses Digitaria
breviglumis, Heteropogon contortus and Themeda triandra. In 2001, the dominant
60
Chapter 3. The effect of fire regime on floristic patterns.
grass H. triticeus, was significantly more abundant in early and late dry season burnt
plots than control plots, which had remained unburnt for four years by that time.
There were no significant fire effects detected for the non-grass monocots, or the
common monocots Commelina spp., Curculigo ensifolia, Eustrephus latifolius and
Scleria mackaviensis.
61
Chapter 3. The effect of fire regime on floristic patterns.
Table 3.7. Mean (standard error) of species richness, abundance of species groups and the 21 most common species, and statistical results,
for fire regime in eucalypt savanna at Cape Cleveland. Note that for repeated measures ANOVAs, the “Fire x Year” interaction is the term
of primary interest, indicating the significance of interactions between treatment and years; a significant “Fire” term indicates treatment
plots differed before treatment applied; a significant “Year” term indicates significant fluctuations over the years in all treatments.
Depend-ent factors Common species listed under relevant growth form groups
Annual abundance means for each treatment (n = 12) C = control, burnt July 1997 only; E = burnt July 1997 and early dry season 1999; L = burnt July 1997 and late dry season 1999. Significantly different treatments for the separate 2000 and 2001 ANCOVA at P < 0.01 are indicated by different superscripts.
Statistical results See section 3.2.3d for methodology. F 2,6 indicates F value, denominator d.f., numerator d.f.; F or H values without an asterisk (*) are not significantly different at P > 0.01; *P < 0.01; **P < 0.001. The term “log” indicates log (x + 1) transformation was used to rectify heterogeneity of variances; “pooled” indicates block P value > 0.25 and replicates pooled; “block,” significant bock effect at P <0.01; and “K-W” indicates the non-parametric Kruskal-Wallis ANOVA by ranks test used instead of parametric ANOVA, where variance heterogeneity unresolved.
The mean percentage germination of viable seed varied between species, ranging from
98% in Crotalaria montana to 20% for Galactia tenuiflora (Figure 4.5). Exposure to
90
Chapter 4. The effect of fire regime on seed dormancy release.
(a) Chamaecrista ab sus
0
20
40
60
80
100
Con
trol
Sm
oke
40ºC
60ºC
80ºC
100º
C
ab
ab ab
a
ab b
(c) Crotalaria calycina
0
20
4060
80
100
Con
trol
Sm
oke
Nitr
ate
40ºC
60ºC
80ºC
85ºC
45
min
100º
C
120º
C
80ºC
+ S
80ºC
+ N
a
b
a
ac
a
b
ac ac
c
(e) Crotalaria montana
020406080
100
Con
trol
Sm
oke
Nitr
ate
40ºC
60ºC
80ºC
80ºC
W
85ºC
45
min
100º
C
120º
C
80ºC
+ S
80ºC
+ N
aa a a
ab
bc bc bc
a
c (f) Crotalaria pallida
0
20
4060
80
100
Con
trol
Sm
oke
Nitr
ate
40ºC
60ºC
80ºC
80ºC
W
85ºC
45
min
100º
C
120º
C
80ºC
+ S
80ºC
+ N
a
ab
ab ababab
ab
ab
b b
(h) Glycine tomentella
0
20
40
60
80
100
Con
trol
Sm
oke
40ºC
60ºC
80ºC
ab
a
b
ab ab
(i) Indigofera hirsuta
020406080
100
Con
trol
Sm
oke
Nitr
ate
40ºC
60ºC
80ºC
80ºC
W
85ºC
45
min
100º
C
120º
C
80ºC
+ S
80ºC
+ N
a aab ab a ab
c bc
aba
(b) Chamaecrista mimosoides
0
20
40
60
80
100
Con
trol
Sm
oke
Nitr
ate
40ºC
60ºC
80ºC
80ºC
W
85ºC
45
min
100º
C
120º
C
80ºC
+ S
80ºC
+ N
b
a a aa
a
a
a aa
(d) Crotalaria lanceolata
0
20
40
60
80
100
Con
trol
Sm
oke
Nitr
ate
40ºC
60ºC
80ºC
80ºC
W
85ºC
45
min
100º
C
120º
C
80ºC
+ S
80ºC
+ N
a
a a a a
a
a
a
b
a
(g) Galactia tenuiflora
0
20
40
60
80
100
Con
trol
Sm
oke
40ºC
60ºC
80ºC
100º
C
120º
C
80ºC
+ S
a a
aa a
a a
(j) Tephrosia juncea
0
20
40
60
80
100
Con
trol
Sm
oke
40ºC
60ºC
80ºC
85ºC
45
min
100º
C
120º
C
aab ab ab
bc
c
ab
a
% G
erm
inat
ion
Treatment
Figure 4.5. Mean (± 1 standard error) percentage germination of viable seed after
exposure to various levels of heat shock, as well as smoke and nitrate. Columns in each
graph with the same superscript are not significantly different at P > 0.05. Germination
results from the two-factor ANOVA 80ºC + smoke (or nitrate) are provided without
superscripts. All temperature exposures are for 5 minutes, except the 45 minute
duration of 85°C 45 min; 80°C W, exposure to 80°C water for 5 minutes.
91
Chapter 4. The effect of fire regime on seed dormancy release.
Table 4.3. Statistical results of one- and two-factor ANOVAs for the laboratory experiment of seed germination. Due to variation in seed
supply, two-factor ANOVA were not performed for all species. Non-parametric Kruskal-Wallis ANOVA by ranks was used in place of the
two-factor ANOVA for assessing the effect of heat and nitrate for Crotalaria montana. F 5,12 indicates F value, denominator d.f.,
numerator d.f.; F or H values without an asterisk (*) are not significantly different at P > 0.05; * P < 0.05; ** P < 0.01; *** P < 0.001. Species One-factor
ANOVA
Two-factor ANOVA
Heat x Smoke
Two-factor ANOVA
Heat x Nitrate
Treatment Heat Smoke Heat x Smoke Heat Nitrate Heat x Nitrate
Chamaecrista absus F 5,12 = 4.512*
Chamaecrista mimosoides F 9,20 = 19.151*** F 1,8 = 0.182 F 1,8 = 11.636** F 1,8 = 8.909* F 1,8 = 956 F 1,8 = 4.481 F 1,8 = 16.333**
Crotalaria calycina F 8,18 = 62.370*** F 1,8 = 5.188 F 1,8 = 0.1059 F 1,8 = 2.647 F 1,8 = 2.223 F 1,8 = 31.711*** F 1,8 = 3.943
Crotalaria lanceolata F 9,20 = 13.806*** F 1,8 = 4.433 F 1,8 = 0.177 F 1,8 = 3.330 F 1,8 = 12.082** F 1,8 = 2.219 F 1,8 = 9.890*
Crotalaria montana F 9,20 = 19.883*** F 1,8 = 12.149** F 1,8 = 73.644*** F = 12.149** H 1,8 = 6.203* H 1,8 = 6.203*
Crotalaria pallida F 9,20 = 6.824*** F 1,8 = 4.796 F 1,8 = 19.901** F 1,8 = 2.375 F 1,8 = 4.840 F 1,8 = 1.284 F 1,8 = 0.751
Galactia tenuiflora F 6,14 = 2.757 F 1,8 = 1.734 F 1,8 = 1.735 F 1,8 = 0.048
Glycine tomentella F 4,10 = 4.432*
Indigofera hirsuta F 9,20 = 13.087*** F 1,8 = 6.368* F 1,8 = 6.368* F 1,8 = 2.579 F 1,8 = 19.862** F 1,8 = 8.828* F 1,8 = 1.241
Tephrosia juncea F 7,16 = 16.744***
92
Chapter 4. The effect of fire on seed dormancy release
elevated temperatures between 80ºC and 100ºC significantly increased the germination
of six of the ten species (Figure 4.5; Table 4.3). The treatments which produced the
most germination were exposure to 80ºC water for five minutes and 85ºC dry heat for
45 minutes. The four species with no enhancement of germination by heat shock were
the four largest seeded species (Tables 4.2 and 4.3).
The percentage germination of viable seeds in the control treatments, (i.e. non-dormant
seeds), averaged 23% across the ten species and ranged from 72% in Crotalaria pallida
to 5% in Indigofera hirsuta. The three exotic species, as a group, had a significantly
higher percentage of non-dormant seeds (mean = 41, s.e. = 10; U = 43.00; P < 0.02)
compared to the seven native species (mean = 15, s.e. = 2).
Seeds of seven out of the eight species exposed to 120ºC did not germinate (Figure
4.5). The only species to germinate after exposure to 120ºC was Tephrosia juncea,
with just 1% germination. A tetrazolium test of the Crotalaria pallida seeds exposed to
120ºC found none were viable, indicating exposure to 120ºC for 5 minutes was lethal.
Exposure to smoke or nitrate in isolation did not significantly enhance germination. In
fact several species showed no germination after these treatments and significant
inhibition by smoke was demonstrated for Chamaechrista mimosoides, Crotalaria
montana, C. pallida and Indigofera hirsuta (Figure 4.5). Exposure to nitrate
significantly inhibited the germination of Crotalaria calycina. However, significant
enhancement of germination resulted from the combination of nitrate and exposure to
80ºC for Crotalaria lanceolata and Indigofera hirsuta (Figure 4.5).
The results for individual species are summarised as follows: Chamaecrista absus
displayed significantly greater germination in the control and after exposure for five
minutes at 60ºC than exposure to 100ºC (Figure 4.5a; Table 4.3).
Chamaecrista mimosoides showed significantly higher germination after exposure to
water at 80ºC for five minutes than in all other treatments (Figure 4.5b; Table 4.3). The
two-factor ANOVA indicated significant inhibition of germination with smoke
93
Chapter 4. The effect of fire regime on seed dormancy release.
exposure, but significant interactions between smoke and heat shock and between
nitrate and heat shock.
Exposure of Crotalaria calycina seed to 85ºC for 45 minutes significantly enhanced
germination over all other treatments except smoke, 40ºC and 80ºC (Figure 4.5c; Table
4.3). Exposure to the nitrate solution and 120ºC produced significantly lower
germination than all other treatments. There were no significant interactions between
heat shock and smoke.
Crotalaria lanceolata showed enhanced germination after exposure to 85ºC for 45
minutes, which was significantly greater than under all other treatments (Figure 4.5d;
Table 4.3). There was a significant interaction between nitrate and heat shock, with
exposure to both treatments resulting in greater germination than the additive effect of
each in isolation. The combination of smoke and heat shock also produced germination
greater than each in isolation, however large variation between replicates inhibited the
detection of a significant interaction.
Percentage germination of Crotalaria montana was significantly enhanced by exposure
to 80ºC and 100ºC for five minutes, 80ºC water for five minutes, and 85ºC for 45
minutes compared to the control treatment and exposure to smoke, nitrate solution,
40ºC and 120ºC for five minutes (Figure 4.5e; Table 4.3). Exposure to 80ºC water also
enhanced germination over 60ºC for five minutes. In the two-factor ANOVA indicated
that exposure to smoke and nitrate significantly inhibited germination.
Crotalaria pallida showed significantly enhanced germination in the control treatments
compared with exposure to 100ºC and 120ºC for five minutes (Figure 4.5f; Table 4.3).
There were no significant interactions between exposure to smoke and heat shock, or
nitrate solution and heat shock. However, the two-factor ANOVA of the combined
smoke with heat shock treatment, indicated an overall significant inhibition of
germination after exposure to smoke.
Galactia tenuiflora showed no significant differences between treatments (Figure 4.5g),
while exposure to 40ºC for five minutes significantly increased the percentage seed
94
Chapter 4. The effect of fire regime on seed dormancy release.
germination of Glycine tomentella compared with the smoke treatment (Figure 4.5h;
Table 4.3).
A significantly higher percentage of Indigofera hirsuta seed germinated after exposure
to 80ºC water for five minutes compared to all other treatments, with the exception of
85ºC for 45 minutes (Figure 4.5i; Table 4.3). The latter produced significantly greater
germination than the control and exposure to smoke, 60ºC and 120ºC for five minutes.
In the two-factor ANOVA, 80ºC produced greater germination than the control, while
the smoke treatment significantly inhibited germination. However, exposure to nitrate
plus 80ºC significantly increased percentage germination.
Tephrosia juncea germinated in significant numbers after exposure to 85ºC for 45
minutes compared to all other treatments, except 80ºC for five minutes (Figure 4.5j;
Table 4.3). The latter produced significantly greater germination than exposure to
smoke and 120ºC for five minutes.
4.3.2 Temperature elevation in the topsoil during the passage of fire
There were no statistical differences between temperatures recorded at the base of grass
clumps and in gaps of at least 30 cm, for any soil depth during either early or late dry
season fires (Table 4.4). A significant negative correlation was detected between soil
temperature and soil depth for both early and late dry season fires, indicating the
decline in temperature with soil depth (Figure 4.6). Temperatures were significantly
higher at all depths during late compared to early dry season fires (Table 4.5) and are
displayed using the mode and upper and lower temperatures (Figure 4.6). Modal values
are presented rather than means due to the use of incremental temperature records, and
as the upper temperature records were capped at 182ºC, precluding the calculation of a
true mean. While temperatures at the surface during the early fires ranged from at least
182ºC to 49º C, all surface measurements during the late fires were at least 182º C as
were most recordings at 3 mm (Figure 4.6). The modes for both early and late dry
season fires indicate that there was usually no elevation of temperature at 30 mm,
although temperatures did reach 65ºC in during the late fire.
95
Chapter 4. The effect of fire regime on seed dormancy release.
255075
100125150175200
0 5 10 15 20 25 30
Spearman's R = -0.898P < 0.001
(a)
255075
100125150175200
0 5 10 15 20 25 30
Soil depth (mm)
Spearman's R = -0.914P < 0.001
(b)
Tem
pera
ture
(ºC
)
Figure 4.6. Modal temperatures recorded at four depths in the topsoil during (a) early
and (b) late dry season fires in eucalypt savanna at Cape Cleveland during 1999 (n = 30
measurements). Error bars represent upper and lower temperatures recorded, maximum
≥ 182°C, minimum 37°C. Results of the Spearman rank correlation of temperature with
soil depth are provided.
96
Chapter 4. The effect of fire regime on seed dormancy release.
Table 4.4. Modal temperature and statistical results of non-parametric Mann-Whitney
U-tests of soil temperatures at the base of grass tussocks compared with tussock gaps,
during early and late dry season fires in eucalypt savanna at Cape Cleveland.
Significance level after Bonferroni adjustment for multiple comparisons is P < 0.013.
Depth Modal Temperature (ºC) U statistic P value Gap Tussock
base
Early dry season fires
Surface 182 182 106.000 > 0.787
3 mm 54 77 83.000 > 0.221
10 mm 27.5 27.5 112.500 1.000
30 mm 27.5 27.5 105.000 > 0.756
Late dry season fires
Surface 182 182 112.500 1.000
3 mm 182 182 103.000 > 0.694
10 mm 71 71 112.000 > 0.983
30 mm 30 30 83.000 > 0.221
Table 4.5. Statistical results of non-parametric Mann-Whitney U-tests comparing soil
temperatures during early and late dry season fires in eucalypt savanna at Cape
Cleveland. Significance level after Bonferroni adjustment for multiple comparisons is
P < 0.013.
Depth U Statistic P value
Surface 0.000 < 0.001
3 mm 15.000 < 0.001
10 mm 65.000 < 0.001
30 mm 17.000 < 0.001
4.3.3 Depth of germination
The depth of seed germination of both Galactia tenuiflora and Indigofera hirsuta was
significantly correlated with temperatures recorded in the topsoil (Table 4.6). Both G.
tenuiflora and I. hirsuta germinated to greater depth after late dry season fires
compared to early fires and along the slashed fire break (Figure 4.7). The mean and
97
Chapter 4. The effect of fire regime on seed dormancy release.
deepest germination depths were lower after late dry season fires, suggesting both
greater depth of dormancy release, and greater depth of seed mortality. Indigofera
hirsuta germinated to a depth of 32 mm after late dry season fires, which recorded
elevated temperatures to 65ºC at 30 mm; and to a depth of 17 mm after early fires,
where temperatures of 40ºC at 10 mm and 37ºC at 30 mm were recorded.
0
0
1.2
2.4
3.6
n = 30 n = 10 n = 58
(b)0
0
0
1.2
2.4
3.6
n = 20 n = 4 n = 22
Slashed Early burnt Late burnt
(a)
40
30
20
10
40
30
20
10
Soil
dept
h (m
m)
Figure 4.7. Depth of seed germination in eucalypt savanna that has been slashed, or
burnt early or late in the dry season for (a) Galactia tenuiflora and (b) Indigofera
hirsuta. Dots represent mean depth of germination. Error bars display the upper and
lower germination depths recorded.
98
m)
Chapter 4. The effect of fire regime on seed dormancy release.
Table 4.6. Results of the Spearman rank correlation analysis of seed germination depth
with temperatures recorded at four separate soil depths.
Soil depth R statistic P value
Galactia tenuiflora (n = 46 seedlings)
Surface 0.590 < 0.001
3 mm 0.719 < 0.001
10 mm 0.647 < 0.001
30 mm 0.505 < 0.001
Indigofera hirsuta (n = 98 seedlings)
Surface 0.675 < 0.001
3 mm 0.747 < 0.001
10 mm 0.675 < 0.001
30 mm 0.332 < 0.001
The broader range in germination depth after late rather than early dry season fires
resulted in greater seedling densities of both species (Figure 4.8). Density differences
were statistically significant for I. hirsuta (t 6 = 5.041; P < 0.002) but not for G.
tenuiflora (t 6 = 2.141; P > 0.05).
0
1
2
3
4
5
6
Galactia tenuiflora Indigofera hirsuta
Seed
ling
dens
ity (m
-2)
Figure 4.8. Mean seedling density (± 1 standard error) of Galactia tenuiflora and
Indigofera hirsuta at four temperature measurement points in Early (■) and Late (■)
dry season burnt eucalypt savanna at Cape Cleveland.
99
Chapter 4. The effect of fire regime on seed dormancy release.
4.4 Discussion
4.4.1 Laboratory experiment
The influence of fire-related factors in breaking seed dormancy was evident for six of
the ten species examined (Figure 4.5; Table 4.3). Significantly greater germination
occurred after exposure to temperatures between 80ºC to 100ºC which is consistent
with the germination requirements of many legumes of southern Australia (Floyd 1976;
Shea et al. 1979; Auld and O’Connell 1991; Bell et al. 1993; Jhurree et al. 1998).
The 80ºC water treatment produced significantly more germination than the five minute
exposure to 80ºC air temperature for seeds of Chamaecrista mimosoides and Indigofera
hirsuta (Figure 4.5; Table 4.3). Moisture is available in the topsoil, although the
quantity varies with season, soil structure and organic content, and Martin and Cushwa
(1966) and Martin et al. (1975) considered heating seeds in hot water may more
accurately depict conditions in the soil seed bank during fire than oven heating. The
85ºC air temperature for 45 minutes produced significantly greater germination than
80ºC air temperature for five minutes in Crotalaria lanceolata. This may have been due
to the extra 5ºC and/or the longer duration of heating.
Exposures to temperatures as low as 40ºC can significantly enhance germination of
some legumes in south-eastern Australia (Auld and O’Connell 1991). It is possible that
temperatures of 40ºC or 60ºC may have increased the percentage seed germination of
some species in this study, had the seeds been heated in the oven for longer than five
minutes or placed in water or soil at those temperatures.
The four largest seeded species displayed no significant increase in germination with
exposure to elevated temperatures, but were tolerant of exposure to at least 80º C
(Figure 4.5; Table 4.3). This suggests an ability to tolerate the passage of fire, but
provides no evidence of fire-promoted germination. Exposure to 120º C for five
minutes was lethal to most seeds in this experiment, which is consistent with reports
from other studies (e.g. Auld and O’Connell 1991). The second and third largest seeded
species, Galactia tenuiflora and Crotalaria pallida, showed the lowest tolerance to heat
shock, with apparent mortality at 100ºC. This contrasts with African acacias, where
larger seeded species possess a greater tolerance of heat shock than those with smaller
100
Chapter 4. The effect of fire regime on seed dormancy release.
seeds (Midgley and Bond 2001), although no correlation between seed size and thermal
tolerance is apparent for legumes of south-western Australia (Bell and Williams 1998).
The two native species that did not respond significantly to heat shock, Galactia
tenuiflora and Glycine tomentella, were the only perennial species examined, and each
is capable of sprouting after fire (Chapter 8). Sprouting species may be able to maintain
population density with less seedling recruitment than needed by annual or ephemeral
species, and therefore the requirements to break seed dormancy may differ with life
history and fire response (Bell 2001). However the germination of Galactia tenuiflora
and Glycine tomentella was low (< 25%) in all treatments, including the control, and
may have been due to sub-optimal incubation conditions, an after-ripening requirement
not satisfied by the few months of storage, and/or the absence of a heat shock or
chemical treatment that would have produced greater germination. Therefore further
examination of the dormancy requirements of these species is required.
While germination in the laboratory without pre-treatment does not necessarily indicate
the absence of seed dormancy (Whelan 1995), the germination in control treatments
does suggest fire-related stimuli are not obligatory. The mean percentage of “non-
dormant” seeds (i.e. those lacking an innate dormancy related to fire cues) for the seven
native species in this study (15%) is similar to averages reported for legumes of south-
eastern (11 to 15%) and south-western (11 to 18%) Australia (Shea et al. 1979; Auld
and O’Connell 1991; Morrison et al. 1992; Bell et al. 1993; Clarke et al. 2000).
However, the exotic species of this study had a significantly higher mean percentage of
non-dormant seeds (41%) compared with the natives. This suggests some exotic
legumes possess a greater capacity for recruitment in the absence of fire than native
legumes in savannas of north-eastern Australia. Indeed several exotic pasture legumes
used in the region, including Macroptilium atropurpureum and Stylosanthes humilis, do
not require fire for seed germination (McIvor et al. 1993).
Neither smoke nor nitrate in isolation significantly promoted seed germination (Figure
4.5; Table 4.3). In fact smoke significantly inhibited the germination of Chamaecrista
mimosoides, Crotalaria montana, Crotalaria pallida and Indigofera hirsuta. This may
have resulted from the use of the 90 minute exposure to smoke, which increases seed
101
Chapter 4. The effect of fire regime on seed dormancy release.
germination in some species (e.g. Dixon et al. 1995; Keith 1997), however Roche et al.
(1997) demonstrated that a duration of more than 60 minutes can inhibit seed
germination of other species. Exposure to nitrate inhibited Crotalaria calycina and C.
montana germination, which suggests the concentration of nitrate used was toxic to
these species, even though it has been shown to increase germination of Western
Australian plants (Bell et al. 1999).
Significant enhancement of germination was produced by the combination of heat
shock followed by nitrate application for Crotalaria lanceolata and Indigofera hirsuta
(Figure 4.5; Table 4.3). This suggests multiple components of fire operate to promote
germination. The synergistic effect of smoke and heat shock has been recently reported
for several shrubs of fire prone regions in south-eastern Australia (Keith 1997; Gilmour
et al. 2000; Kenny 2000; Morris 2000). Nitrate has been demonstrated to interact with
light regime to increase the germination of several Western Australian species (Bell et
al. 1999), but I am not aware of previous reports of the additive effect of nitrate and
heat shock. The greatest change in soil nitrate levels can occur with the first rains after
fire (Bell 1999). The enhanced response to nitrate and heat shock may therefore be
particularly useful in timing recruitment with the first rain following fire, thus allowing
seedlings of these ephemeral species to take advantage of the full wet season to grow
and produce seeds. Multiple fire cues are also beneficial for ensuring increased
germination after fire when elevation of temperature in the topsoil is inadequate to
break seed dormancy (Kenny 2000).
4.4.2 Temperature elevation in the topsoil during the passage of fire
Early and late dry season fires elevated topsoil temperature, which declined rapidly
with increasing soil depth (Figure 4.6). No differences in temperature were detected
between tussock gaps and the base of grass tussocks, suggesting uniformity in heating
at the scale of tens of centimetres (Table 4.4). Temperature elevation reached at least 30
mm depth during late dry season fires, but did not penetrate as deep during earlier fires.
Temperatures that were demonstrated to significantly increase seed germination (i.e.
80ºC to 100ºC) were documented at the surface and 3 mm depth during early dry
season fires. During late dry season fires, all surface temperatures were lethal to seeds,
while temperatures between 80ºC to 100ºC were only recorded at a depth of 3 mm. The
102
Chapter 4. The effect of fire regime on seed dormancy release.
increased temperature penetration into the topsoil recorded during these fires is
consistent with temperatures recorded during fires in other eucalypt communities (Shea
et al. 1979; Bradstock and Auld 1995; Bebawi and Campbell 2000; Smith et al. 2000).
These data highlight the insulating capacity of soil that protects seeds from lethal
temperatures during fires, while exposing a narrow band of seed bank to temperatures
capable of breaking dormancy. Bradstock and Auld (1995) demonstrated the
importance of fine fuel consumption for influencing soil temperatures during fires. In
this study the greatest temperature elevation was recorded during the late dry season
fires which completely consumed fine fuels, whereas some fuel remained after early
fires (Chapter 3). The seasonal variation is also consistent with the findings of Grant et
al. (1997), who documented higher temperature penetration into the topsoil during
autumn (i.e. late dry season) fires than spring (i.e. early dry season) fires in southern
Western Australia.
4.4.3 Depth of seed germination
The depth of seed germination in both Galactia tenuiflora and Indigofera hirsuta was
positively related to the temperature elevation in the topsoil during fires and was
documented at greater depths after late dry season fires (Figure 4.7; Table 4.6). Mean
germination depths of G. tenuiflora and I. hirsuta are consistent with those recorded for
the New South Wales legume, Acacia suaveolens, although the latter is able to
germinate from greater depths (Bradstock and Auld 1995). Germination of G.
tenuiflora and I. hirsuta was closer to the soil surface along the unburnt slashed track
and after early rather than late dry season fires. This suggests greater seed mortality
occurred in the upper topsoil during late dry season fires, and is consistent with results
from the laboratory experiment that indicated temperatures of at least 100ºC are lethal
to G. tenuiflora and of at least 120ºC are lethal to I. hirsuta seeds.
Larger seeded species may benefit more than smaller seeded species from increased
temperature penetration into the topsoil, because their greater starch reserves may allow
survival of germinants from further depths in the topsoil (Midgley and Bond 2001).
However in this instance, the smaller seeded I. hirsuta germinated from greater depths,
even though the larger seeded G. tenuiflora displayed a greater percentage of non-
dormant seeds in the laboratory experiment.
103
Chapter 4. The effect of fire regime on seed dormancy release.
The depth of seed germination of G. tenuiflora was correlated with temperature
penetration even though no significant heat shock cue was demonstrated in the
laboratory experiment. Indigofera hirsuta germinated from a depth of 32 mm, where
the highest temperature recorded was 65ºC during the late fires; and from 17 mm after
early fires, where maximum temperatures at 10 mm were 40ºC. The field germination
therefore suggests seed dormancy of G. tenuiflora is broken by heat shock and that
germination of I. hirsuta may be promoted by lower temperatures than indicated in the
laboratory experiment. This re-affirms the suggestion that exposure of seeds to 40ºC
and 60ºC using hot water, heated soil, or an extended duration in heated air, may have
produced significantly enhanced germination below 80ºC in the laboratory experiment.
There was a greater density of I. hirsuta seedlings recorded within the 1 m radius of
temperature measurement points after late rather than early dry season fires (Figure
4.8). This reflects the greater range in depth of germination after late fires and therefore
greater proportion of the soil seed bank from which germination was triggered.
4.5 Conclusion
In summary, the ten legume species responded variously to the exposure to heat shock
and chemicals related to the passage of fire. While several species displayed no
significant increase in germination with exposure to fire-related cues, heat shock, by
itself and in combination with nitrate, was found to break the seed dormancy of several
species. The presence of seeds of all species with no apparent innate dormancy
suggests germination can occur in the absence of fire, and for a higher percentage of
seeds of exotic species than natives. Variation in seed dormancy requirements may be
important for maintaining species coexistence (Grubb 1977).
Temperatures that break seed dormancy did occur in the topsoil during the passage of
both early and late dry season fires. Greater penetration of elevated temperatures
occurred during late dry season fires, however this included temperatures lethal to
seeds. The depth of germination of two native legumes confirmed that temperatures
experienced during fires are capable of triggering germination in the topsoil. The data
also suggest temperatures as low as 40ºC may increase germination of these species. A
greater range in germination depth, resulting in higher seedling densities, was recorded
104
Chapter 4. The effect of fire regime on seed dormancy release.
105
after late dry season fires, suggesting more abundant seedling emergence may occur
after late rather than early dry season fires.
The results in this chapter suggest that the post-fire pulse in species abundance
documented in Chapter 3 may in part be due to the release of some seeds from a state
of dormancy by the temperature elevation and enhanced nitrate concentrations in the
topsoil as a result of fire. The pulse of species abundance documented in Chapter 3 was
especially evident after late dry season fires, and this chapter presents evidence that late
fires release seed from dormancy to a greater depth in the topsoil, and hence a greater
volume of the soil seed bank.
This chapter has examined only a small selection of savanna species and further
information is needed on the effect of fire on seed dormancy for a wider range of
species. Chapter 5 broadens the investigation of the effect of fire-related cues on seed
dormancy, to include more species. It also identifies species that store seed in the soil,
and provides details on the distribution of the seed bank in the topsoil, seasonal
fluctuations in the seed bank, and the influence of fire on the soil seed bank dynamics.
Chapter 5. The effect of fire regime on soil seed bank dynamics.
Chapter 5. The effect of fire regime on soil seed bank dynamics in a
tropical savanna of north-eastern Australia.
FIREREGIME
Seed dormancy release
Floristic patterns
Seed bankdynamics
Seedlingemergence
Survival andgrowth ofjuveniles
Survival andgrowth ofmature plants
Seedling survival
106
Chapter 5. The effect of fire regime on soil seed bank dynamics.
5.1 Introduction
Seed banks bridge the gap between seed production and seed germination. They
provide a mechanism for population persistence through harsh seasons and supply
propagules for re-establishment after disturbance (Lunt 1997; Auld et al. 2000).
Canopy seed storage (bradyspory) is uncommon in northern Australia, with seed of
savanna species primarily stored within the soil (McIvor 1987; Andrew and Mott 1983;
Williams et al. 1999a). Several annual grasses in Australian tropical savannas produce
soil seed banks of high density. For example, initial input into the soil seed bank by
Sorghum intrans can average 2150 seeds m-2 (Andrew 1986). Seed bank densities of
perennial grasses can be considerably lower, for instance up to 150 seeds m-2 for
Themeda triandra and less than 100 seeds m-2 for Heteropogon contortus (Shaw 1957;
Mott et al. 1985; McIvor 1987).
Many Australian tropical savanna species do not produce seed banks that persist longer
than a few weeks, with seeds either germinating or succumbing to predation or disease
soon after seed fall. Examples of this syndrome include several tropical eucalypts and
the perennial grasses Alloteropsis semialata and Dichanthium fecundum (Mott and
Andrew 1985; Setterfield 1997a; Crowley and Garnett 2001).
Many dominant grasses of tropical savannas, including annual Sorghum spp. and
Themeda triandra, produce a transient seed bank, with seed stored through the dry
season and exhausted during the wet season, requiring replenishment for the following
year (Andrew and Mott 1983; McIvor 1987). For many of these grasses, storage
through the dry season is made possible by an after-ripening seed dormancy
mechanism (McIvor and Howden 2000). Persistent seed banks contain seeds that
remain viable for more than one year and can be important mechanisms for population
survival, especially for short-lived or non-sprouter species (Thompson and Grime 1979;
Bond and van Wilgen 1996). Innate and secondary, enforced, seed dormancy
mechanisms are fundamental for allowing seed bank persistence (Bell 1999; Auld et al.
2000). Examples of species with persistent seed banks in tropical Australian savannas
include the native forb Epaltes australis and the exotic pasture legume, Stylosanthes
hamata (McIvor 1987).
107
Chapter 5. The effect of fire regime on soil seed bank dynamics.
In many fire-prone communities, seedlings primarily recruit from the local seed bank
rather than seed dispersed from outside the immediate area, and therefore seed bank
density, distribution and response to fire-related cues are important factors influencing
post-fire seedling emergence (Whelan 1986; Auld et al. 2000). Soil seed banks are
dynamic, fluctuating in composition and abundance in response to seed input, seed
mortality, release of seeds from dormancy and seed germination (Thompson and Grime
1979). All of these processes can be influenced by fire, which can enhance or restrict
seed production, affect seed dispersal agents, cause seed mortality, and break seed
dormancy to allow germination (Keith 1996; Whelan et al. 2002).
As fire can influence seed bank processes, variations in fire regime may be expected to
have a considerable effect on seed bank dynamics. Fire interval may be particularly
important for species with seed input restricted to the early phase of fire intervals, such
as ephemerals with fire-triggered germination, and plants with fire-promoted flowering
and fruiting (Keith 1996). Seed banks of these species receive a pulse of post-fire seed
input, but may gradually decline between fires (Bond and van Wilgen 1996). Seed
banks of some perennial species, or ephemerals with continuous recruitment, may build
up during the years following fire, so that long fire intervals promote dense seed banks
(Keith 1996). However, fire frequency may have less influence on seed banks of
perennial species that rely heavily on annual input, due to high annual seed losses
irrespective of fire (Bond and van Wilgen 1996).
Fire intensity can affect seed bank dynamics through its influence on plant mortality
and subsequent seed input, as well as direct affects on seed mortality and release from
seed dormancy (Whelan 1995). Fire season can influence seed bank dynamics by
interacting with reproductive phenology, and fires that are synchronised with seasonal
peaks in seed bank density will influence the survival and germination of a greater
number of seeds. Post-fire climatic conditions also influence seed germination, and
therefore seed bank dynamics (Whelan 1995).
The scale and patchiness of fire can influence seed bank dynamics, with a patchy fire
producing a fine-scale spatial mosaic in seed mortality and germination. Williams and
Lane (1999) considered the re-establishment of Sorghum brachypodum after initial
108
Chapter 5. The effect of fire regime on soil seed bank dynamics.
declines in density following wet season burning, may have been due to small-scale
seed dispersal from adjacent unburnt areas.
Research into the effect of fire regime on seed production and seed bank dynamics in
Australian tropical savannas has focused on a few dominant species. Setterfield (1997)
demonstrated that the seed production of Eucalyptus miniata and E. tetrodonta can be
reduced by both early and late dry season fires. Most research on seed banks has
concentrated on grasses, many of which produce seed banks lasting from several weeks
to one year (Andrew and Mott 1983; Andrew 1986; McIvor 1987; Crowley and Garnett
2001).
Harper (1977) produced a valuable model for interpreting seed bank dynamics, in
which he described soil seed banks as containing both dormant and “active”
components, the latter requiring only soil moisture and favourable temperatures to
promote germination (Figure 5.1). The dormant component of the seed bank may
contain seeds with an innate dormancy, which in some seeds can be broken by fire-
related factors (Bell 1999; Chapter 4). The dormant seed bank may also contain seeds
lacking innate dormancy, but inhibited from germination by a secondary, enforced
dormancy. Auld et al. (2000) found evidence that seeds of some shrubs in temperate
woodlands may have remained viable within the soil seed bank for two years as the
result of a secondary dormancy mechanism, possibly enforced by the absence of light.
Experimental treatment of soil seed banks (e.g. exposing to heat shock and smoke) can
indirectly assess the effect of fire on seed dormancy, and therefore the balance between
dormant and active seed banks (e.g. Enright et al. 1997; Read et al. 2000). While the
untreated germinable soil seed bank may include seeds that have been released from
dormancy through the process of soil collection and incubation in shadehouse
conditions (Whelan 1995), it provides a useful approximation of seeds that do not
require a fire stimulus prior to germination. Comparisons of untreated germinable soil
seed banks before and after fire, and in burnt and adjacent unburnt savanna, can
provide a direct assessment of the influence of fire on the active fraction of soil seed
banks.
109
Chapter 5. The effect of fire regime on soil seed bank dynamics.
Seed input
Fire Germination
Seed mortality
Dormant Active (innate and enforced) seed bank
Figure 5.1. Model of the influen
(1977) and Whelan (1995), depic
and as a stimulus for releasing se
dormancy. Note that the germina
detected using a seedling emerge
approximation to the “Active” co
collection and incubation in the s
enforced dormancy.
Chapter 3 documented dynamics
vegetation in response to fire in a
chapter examines seasonal and an
regime on soil seed bank dynami
seed from the dormant to the acti
experimental exposure to heat sh
untreated soil before and after fir
chapter also contrasts the soil see
examines the influence of fire reg
Corymbia clarksoniana. Specific
1. How is the seed bank distribu
stimuli
seed bank
ce of fire on soil seed bank dynamics, based on Harper
ting the impact of fire on seed input, seed mortality
ed reserves from a state of innate and enforced
ble soil seed bank (i.e. the portion of seed bank
nce technique) of untreated soil may be a close
mponent of the seed bank, however the process of soil
hadehouse may release seed from a state of innate or
in the composition and abundance of the standing
tropical savanna of north-eastern Australia. This
nual seed bank fluctuations, and the influence of fire
cs. It investigates the effect of fire on the transfer of
ve fraction of the seed bank, both indirectly, by
ock and smoke; and directly, through comparisons of
e, and in adjacent burnt and unburnt savanna. This
d bank composition with the standing vegetation, and
ime on seed production of the dominant tree,
questions addressed are:
ted within the topsoil?
110
Chapter 5. The effect of fire regime on soil seed bank dynamics.
2. Does the soil seed bank contain seeds which can be released from dormancy
through exposure to fire-related factors (i.e. heat shock and smoke)?
3. Does fire increase the density of the active seed bank?
4. What annual and seasonal fluctuations occur in the soil seed bank and does fire
affect these patterns?
5. How does the species composition of the germinable soil seed bank compare with
the standing vegetation?
6. What is the phenology of seed production of plants at Cape Cleveland and how
does this relate to seasonal dynamics in the soil seed bank?
7. What is the effect of fire season on seed production in C. clarksoniana, a species
that produces a very short-lived seed bank?
5.2 Methods
5.2.1 Sampling methods
5.2.1a Soil seed bank sampling
Pre- and post- mid dry season fire 1997
Soil seed bank of eucalypt savanna at the Cape Cleveland study site (Figures 2.1 and
2.4) was sampled regularly between July 1997 and October 2000. The initial sampling
in July 1997 was undertaken to investigate the effects of the mid dry season fire of that
year on soil seed bank dynamics, and to examine the distribution of seeds in the topsoil.
It was also useful as a pilot study to refine sampling methodology for the remainder of
the seed bank study.
Soil samples were collected from eight points across each of the 1 ha blocks, several
days prior to the July 1997 fire. The sampling method involved walking through each 1
ha block and stopping approximately every 20 paces. A random direction was then
used to locate a point for soil sampling. At each point, duplicate 125 cm3 sub-samples
were collected from three separate depths: the upper 3 mm; 3 to 20 mm; and 20 to 40
mm. The collection depths were made as accurate as possible by marking depths on the
spade used for soil collection. The upper 3 mm was collected by scraping together the
loose surface soil to the required depth. The lower two depths were collected by
digging, to the appropriate depth, a spadeful of soil with a surface area of 459 cm2. This
provided a bulk sample at each point of approximately 780 cm3 for the 3 to 20 mm
111
Chapter 5. The effect of fire regime on soil seed bank dynamics.
depth, and 918 cm3 for 20 to 40 mm depth. Each spadeful of soil was mixed and the
duplicate sub-samples of 125 cm3 were collected. At the end of the pre-fire collection,
three sets of duplicate samples had been collected from each of the three soil depths (18
pre-fire soil samples; Figure 5.2). Each of these samples contained 3000 cm3 of soil,
collected from 24 points (the result of pooling eight sub-samples from each of three 1
ha blocks).
To assess the effect of fire on the seed bank, soil was collected in an identical fashion a
few days after the July 1997 fire (one week after the pre-fire soil collection). The
sampling methodology differed only in the collection of a single set of samples, rather
than duplicates, thereby providing three replicates of each of the three soil depths (nine
post-fire samples, each containing 3000 cm3 of soil; Figure 5.2).
Seed bank composition and abundance were assessed using a seedling emergence
technique, which therefore examined the germinable soil seed bank. The post-fire
samples, plus three replicates of each soil depth from the pre-fire collection, were
placed without treatment into a shadehouse covered with 50% shadecloth. The samples
were watered daily from overhead sprinklers, which provided approximately 21 mm of
water per day. The remaining three replicates of soil samples collected prior to the fire
were put into aluminium trays and placed in an oven at 85ºC for 45 minutes prior to
placing in the shadehouse. This pre-treatment was used to assess the effect of heat
shock on seed dormancy of species present in the soil seed bank. It also allowed
detection of a wider range of species from the germinable soil seed bank. The 85ºC
temperature occurs in the topsoil during the passage of fire and has been shown to
release seed from a dormancy (Auld and O’Connell 1991; Chapter 4). The 45 minute
duration is longer than that experienced in the topsoil during the passage of fire (e.g.
Bradstock and Auld 1995), but thermometer readings of the soil whilst in the oven
indicated this duration was required to allow temperatures of approximately 80ºC to
penetrate into the soil mass. Soil was mixed after 20 minutes in the oven to aid heat
penetration through the soil and spread the heating effect through the seed bank.
Exposure to 85ºC for 45 minutes has been demonstrated to break the dormancy of
several local species (Chapter 4). Similar soil heating treatments have been shown to
112
Chapter 5. The effect of fire regime on soil seed bank dynamics.
promote seed germination from soil seed banks in tropical Australia (Hopkins and
Graham 1984; Skull 1992; Williams 2000).
18 pre-fire soil samples 9 post-fire soil samples
0 - 3 U 2
0 - 3 U 2
0 - 3 H 1
0 - 3 H 2
0 - 3 H 3
0 - 3 B 1
0 - 3 B 2
0 - 3 B 3
0 - 3 U 1
3 - 20 U 1
3 - 20U 2
3 - 20 U 3
3 - 20H 1
3 - 20H 2
3 - 20H 3
3 - 20 B 1
3 – 20 B 2
3 – 20B 3
20 - 40 U 1
20 – 40 U 2
20 – 40 U 3
20 – 40H 1
20 – 40 H 2
20 - 40H 3
20 – 40 B 1
20 – 40 B 2
20 – 40B 3
Figure 5.2. Schematic diagram of the sampling design used in the July 1997
germinable soil seed bank study in eucalypt savanna at Cape Cleveland. Each box
represents a soil seed bank sample of 3000 cm3 collected from 24 points. 0 – 3, surface
samples from a depth of 0 to 3 mm; 3 – 20 samples from 3 to 20 mm depth; 20 – 40,
samples from 20 to 40 mm depth; U, soil collected prior to fire and remained untreated;
H, soil collected prior to fire and heated in an oven at 85º C for 45 minutes; B, soil
collected after fire, but otherwise untreated. Numbers 1, 2 and 3 represent the replicate
number, each replicate contains 24 sub-samples collected from three 1 ha blocks.
Soil samples were assessed regularly for seedlings, which were removed once large
enough to be identified. Additional trays of sand were placed adjacent to the soil trays
to detect the presence of weed seeds in the shadehouse. Assessment of soil samples
continued for six months.
Soil seed bank sampling from October 1997 to October 2000
Soil seed bank at the Cape Cleveland experimental site was sampled over three years,
from October 1997 to October 2000, to investigate seasonal and annual fluctuations,
and the influence of fire regime on seed bank dynamics. Soil was collected in four
113
Chapter 5. The effect of fire regime on soil seed bank dynamics.
seasons in each of 1998, 1999 and 2000: mid wet season, i.e. February; early dry
season, i.e. May; mid dry season, i.e. July; and late dry season, i.e. October.
Soil collection was similar to that described for the pre- and post- 1997 fire (section
5.2.1a), but involved more sub-samples, which were not separated into soil depth
categories (Figure 5.3). Soil samples were collected to a depth of 5 cm, as seed density
usually declines below this depth (Roberts 1981). Samples were collected from 20
points across each of the nine, 1 ha blocks in the initial October 1997 and February
1998 collections, but from 32 points per block thereafter to ensure adequate sampling
of site variation. The points were spaced approximately five paces apart, while walking
in a zig-zag pattern across each 1 ha block. At each point a random direction was
selected and a spadeful of soil dug to 5 cm, providing a volume of 2295 cm3. The soil
was mixed and then two duplicate 125 cm3 sub-samples were collected. The duplicate
samples were kept in separate bags, each containing the pooled 32 sub-samples
collected across each 1 ha block. This provided soil collections of 4000 cm3 (2500 cm3
in October 1997 and February 1998) sub-sampled from a total of 73440 cm3 (45900cm3
in October 1997 and February 1998) of soil from each 1 ha block. Samples from each
block were regarded as replicates.
The soil samples were treated identically to those collected in July 1997 (section
5.2.1a). One of the duplicate samples from each 1 ha block remained untreated and was
placed in the shadehouse and watered daily. The other duplicate sample was placed in
an oven at 85ºC for 45 minutes prior to placement in the shadehouse. Seedlings were
recorded regularly and removed once large enough to be identified. Each collection was
kept in the shadehouse for six months.
114
Chapter 5. The effect of fire regime on soil seed bank dynamics.
Control Block 1 1 ha
Control Block 21 ha
Control Block 3 1 ha
Early Block 11 ha
Early Block 21 ha
Early Block 31 ha
Late Block 1 1 ha
Late Block 2 1 ha
Late Block 31 ha
C 1 U
C 1 H
C 2 U
C2H
C 3 U
C 3H
E1U
E1H
E2U
E2H
E3U
E3H
L1U
L 1 H
L2 U
L2H
L3U
L3H
Figure 5. 3. Schematic diagram of the sampling design used in the soil seed bank study
of eucalypt savanna at Cape Cleveland between October 1997 and October 2000. A
complete set of soil seed bank samples was collected in the mid wet season, i.e.
February; early dry season, i.e. May; mid dry season. i.e. July; and late dry season, i.e.
October; in each year. The top row of boxes represents the 1 ha blocks at Cape
Cleveland. The lower row of boxes represents individual soil samples taken at each
collection date. Each soil sample contained 4000 cm3 of soil, combined from 32, 125
cm3 sub-samples (October 1997 and February 1998 collections contained only 2500
cm3 of soil from 20 sub-samples). Each sub-sample of 125 cm3 was collected from a
soil mass of 73440 cm3, dug to a depth of 5 cm. C, control, burnt in July 1997 only; E,
early burnt, burnt in July 1997 and May 1999; L, late burnt, burnt July 1997 and
October 1999; numbers 1 to 3 represent replicates; U, untreated soil; H, soil heated in
oven at 85ºC for 45 minutes. Soil collections in May, July and October 2000 included
an additional 4000 cm3 sample of soil per block (each from 32, 125 cm3 sub-samples),
which was exposed to smoke at ambient temperature for 30 minutes.
In May, July and October 2000, three samples (rather than duplicates) were collected
from each of the 32 points across each block, to allow a third soil treatment. In addition
to the untreated control and oven heated treatment, the third sample from each of the
nine, 1 ha blocks was exposed to smoke at ambient temperature (Figure 5.4). The
method of smoke treatment was similar to that described in Chapter 4, except replicate
collections from each of the control, early and late fire treatments were exposed to
smoke separately, as recommended by Morrison and Morris (2000). Soil samples were
exposed to the smoking treatment for 60 minutes rather than 90 minutes, as the longer
duration may inhibit germination of some species (Roche et al. 1997; Chapter 4).
115
Chapter 5. The effect of fire regime on soil seed bank dynamics.
Figure 5.4. Image of smoke application to soil seed bank samples collected from
eucalypt savanna at Cape Cleveland in May, July and October 2000. Replicate samples
for fire regimes were treated separately. Each sample was spread into two trays to allow
adequate exposure to smoke at ambient temperature for 30 minutes.
5.2.1b Phenology of seed production
The timing of seed production for eucalypt savanna species at Cape Cleveland was
documented through monthly records of mature seed pods, capsules or fruit, between
1997 and 2001. The purpose of these data was to link the phenology of seed production
with seasonal fluctuations detected in the germinable soil seed bank. No attempt was
made to quantify seed production, nor assess the effects of fire regime, other than for
the dominant tree Corymbia clarksoniana, described below.
5.2.1c Fire effects on Corymbia clarksoniana seed production
Seeds of the dominant tree, Corymbia clarksoniana, were only detected in October
1998 and October 2000 soil seed bank samples, and at very low densities. This
suggested C. clarksoniana produces a very short-lived soil seed bank. Therefore the
116
Chapter 5. The effect of fire regime on soil seed bank dynamics.
effect of fire season on seed supply of this dominant species could not be adequately
assessed using the seed bank data, and direct surveys of capsule density were made.
Capsules of C. clarksoniana were observed to fall when mature, in October and
November each year, which is consistent with other tropical eucalypts (Burrows and
Burrows 1992; Setterfield 1997). Seed is shed both prior to and immediately following
capsule fall. The density of fallen C. clarksoniana capsules was counted in December
2000, after the majority of capsules had fallen, to estimate seed production in the year
following fire season treatments. Capsules were counted within 50, 1m2 quadrats in
each of the nine, 1 ha blocks during the annual seedling survey (Chapter 6). The
quadrat was thrown in a random direction at points spaced five paces apart whilst
walking up and back across each 1 ha block. The number of seeds in each of 30
capsules of C. clarksoniana, collected prior to opening, were counted to allow an
estimate of seed density from the capsule density data.
5.2.2 Statistical analyses
5.2.2a Overview of analyses
To evaluate seed bank distribution in the topsoil; seasonal and annual fluctuations; the
effect of fire and fire-related cues (i.e. heat shock and smoke) on the germinable soil
seed bank; and the effect of fire regime on seed production of the dominant eucalypt;
data were analysed in six sections:
1. Pre- and post-mid dry season fire (July 1997 soil seed bank collections).
2. Seasonal and annual fluctuations with time since fire (soil seed bank samples
collected from Control blocks only, between February 1998 to October 2000).
3. Pre- and post-early and late dry season fires (soil seed bank samples collected
between May 1999 and February 2000).
4. Soil seed banks during the dry season following fire season treatments (soil seed
bank samples collected between May and October 2000).
5. A comparison of species composition between soil seed bank and the standing
vegetation described in Chapter 3.
6. The effect of fire season on the seed production of C. clarksoniana.
117
Chapter 5. The effect of fire regime on soil seed bank dynamics.
The phenological records of seed production were qualitative in nature, and therefore
no statistical analyses were undertaken on these data, but they were used for
interpretation of the seasonal variation in the soil seed banks.
5.2.2b Seed bank dynamics pre- and post-mid dry season 1997 fire
The soil seed bank before and after the mid dry season 1997 fire was analysed in a two-
factor ANOVA to examine the effect of soil treatment with three levels (untreated,
heated and burnt) and soil depth with three levels (surface 3 mm; 3 to 20 mm and 21 to
40 mm), with a Scheffe’s post-hoc test to examine where differences between
treatments lay (Underwood 1997). To allow consistency across soil depths, seedling
numbers per sample were converted to density (m-2). The surface 3 mm data required
no conversion, as the 24, 125 cm3 samples per replicate equates to 1 m2 of soil surface
(24 samples * 125 cm3 / 0.3 cm depth = 10000 cm2 = 1 m2). Counts from the 3 to 20
mm samples were multiplied by 5.667, and those from the 20 to 40 mm samples were
multiplied by 6.667 to give seedling density (m-2). In all soil seed bank analyses,
seedling density was interpreted as the germinable soil seed bank density.
Homogeneity of variances was tested using Cochran’s test (Underwood 1997). Where
variance heterogeneity problems violating ANOVA assumptions could not be resolved
with data transformation, a Kruskal-Wallis ANOVA by rank was performed separately
for the two factors, soil treatment and soil depth (Zar 1999). Where the Kruskal-Wallis
ANOVA detected significant differences, Mann-Whitney U-tests were used to detect
differences within treatments, with a Bonferroni adjustment of significance values for
multiple comparisons (Sokal and Rohlf 1995).
Analyses were performed on species richness (per sample), total soil seed bank, native
and exotic species, the growth form groups described in Chapter 3, and the most
abundant individual species detected in the soil seed banks. Analyses of individual
species were only performed on those comprising at least 5% of the total seed density.
This was done because species with lower abundance had large variations within
treatments. Due to the large overall number of analyses undertaken on the soil seed
bank data, the significance value was set at P < 0.01, to reduce the possibility of
118
Chapter 5. The effect of fire regime on soil seed bank dynamics.
inappropriately assigning a significant conclusion (type 1 error; Zar 1999) and therefore
providing confidence in all differences that are identified as significant.
5.2.2c Seasonal and annual fluctuations with time since fire
Seasonal and annual fluctuations in the soil seed bank were assessed over the first three
years after fire using the replicate samples collected from the three control blocks
(Figure 2.4). The effect of soil heating, plus annual and seasonal fluctuations were
analysed for species richness per sample, the total seed bank, native and exotic groups,
growth form groups and the most abundant species. Species comprising at least 5% of
the total seed density recorded for this set of analyses were assessed.
Soil seed bank data from the control blocks were converted to seed density (m-2) to
provide consistency between the February 1998 soil collection of 2500 cm3 and the
subsequent data from soil samples of 4000 cm3. The data were analysed in a repeated
measures ANOVA, with soil treatment as the main factor, with two levels (untreated
and heated). Two repeated measures factors were assessed: year with three levels
(1998, 1999 and 2000), and season with four levels (wet season, early, mid and late dry
seasons). Repeated measures ANOVA was used because the same 1 ha blocks (which
were the unit of comparison) were repeatedly sampled in all four seasons of each year.
ANOVA assumptions of homogeneity were assessed using Cochran’s test (Underwood
1997). Where significant variance heterogeneity could not be resolved with data
transformations for one or two seasons, the repeated measures ANOVA was performed
with the remaining levels of the factor “season”. Where heterogeneity of variances was
significant in more than two seasons, non-parametric analyses were performed
separately on the soil treatment, year and seasonal effects. A Mann-Whitney U-test was
used for analysis of the soil treatment, and Friedman ANOVA by ranks, which is
appropriate for repeated measures analyses, was performed on the seasonal effects (Zar
1999). Where the Friedman ANOVA detected a significant difference, a Wilcoxon’s
matched pair analysis was undertaken as a post-hoc test, with a Bonferroni adjustment
of significance level for multiple comparisons, to determine where differences lay
(Sokal and Rohlf 1995). For the exotic species and grasses groups, significant
heterogeneity of variance in the 1998 data could not be resolved by transformations,
119
Chapter 5. The effect of fire regime on soil seed bank dynamics.
therefore the year fluctuations were analysed from 1998 to 2000 using a Friedman’s
ANOVA by ranks, while the soil treatment and seasonal fluctuations were analysed in a
two-factor ANOVA for 1999 and 2000 data only.
5.2.2d Seed bank dynamics immediately before and after the 1999 fire season
treatments
An examination was made of the soil seed bank before and after the implementation of
fire season treatments in 1999 (described in Chapter 2). Data from untreated and heated
soils for control, early burnt and late burnt blocks between May 1999 and February
2000 were assessed.
A three-factor ANOVA was used to examine differences between fire treatments, with
three levels (unburnt, early and late dry season burnt); soil treatment, with two levels
(untreated and heated); and season of soil collection, which was a repeated measures
factor, with four levels (early, mid and late dry season 1999 and wet season 2000).
Cochran’s test was used to assess homogeneity of variances and all problems were
resolved by either log (x +1) data transformation and/or excluding one of the four
levels of the factor “season” from the analysis.
An assessment was also made of the effect of the 1999 fires on the “active” component
of the seed bank (see Figure 5.1), through comparisons of the untreated soil samples
from control and burnt blocks. An independent t-test was performed on the control and
early burnt untreated soil seed bank collected in July 1999 (the first collection after the
early dry season fire). An independent t-test was also performed on the control and late
burnt untreated soil seed bank collected in October 1999 (the first collection after the
late dry season fire).
Separate analyses were performed for species richness per sample, total seed bank
density, native and exotic species, growth form groups and common species with at
least 5% of total seed bank abundance. Variance heterogeneity was checked using a
Cochran’s test (Underwood 1997). Significant variance heterogeneity could not be
resolved by data transformation for Glycine tomentella and Indigofera hirsuta in the
120
Chapter 5. The effect of fire regime on soil seed bank dynamics.
July 1999 collections, and therefore non-parametric Mann-Whitney U-tests were
performed.
5.2.2e Seed bank dynamics following fire season treatments
The soil seed bank was assessed for fire effects during the dry season following the
1999 fires (i.e. soil samples collected between May and October 2000) and the effects
of exposure to heat shock and smoke. The data were analysed using a three-factor
ANOVA with the factor soil treatment possessing three levels (untreated, heated and
smoked soil); fire season with three levels (unburnt, and burnt in the early or late dry
season of 1999); and season of soil collection as a repeated measures factor, with three
levels (early, mid and late dry season). Where significant differences for one of the
seasons could not be resolved by data transformation, the three-factor ANOVA was
undertaken using the remaining two seasons.
5.2.2f Comparison of seed bank composition with the standing vegetation
To examine the relationship between soil seed bank and the standing vegetation, a
Principle Components Analysis (PCA) was performed using the CANOCO program
(ter Braak and Smilauer 1998) on a data set containing the species composition in the
180 floristic surveys, recorded between 1997 and 2001 (Chapter 3) and the 288 soil
seed bank samples collected from July 1997 to October 2000. The PCA was based on
species presence or absence data, as methods of estimating abundance differed between
the floristic surveys and the soil seed bank samples.
5.2.2g Fire effects on Corymbia clarksoniana seed production
The effect of fire season on seed production of the dominant tree, Corymbia
clarksoniana, in the year following fire, was based on the density of capsules on the
ground, converted to seed density (m-2) using the mean number of seeds per capsule
estimated from 30 capsules. An initial assessment of statistical differences employed a
one-factor ANOVA with three levels (unburnt, early and late dry season burnt), with
blocks nested within fire treatments. However, Cochran’s tests indicated heterogeneity
of variances could not be resolved with data transformations. Therefore a non-
parametric Kruskal-Wallis ANOVA by ranks was used to assess the statistical
significance of differences between fire treatments. This test does not allow for nesting
121
Chapter 5. The effect of fire regime on soil seed bank dynamics.
of block replicates, so the 50 replicates from each 1 ha block were pooled to provide
150 replicates for each fire treatment. A Mann-Whitney U-test was used as a post-hoc
comparison, with a Bonferroni adjustment of significance level for multiple
comparisons (Sokal and Rohlf 1995).
5.3 Results
5.3.1 Seed bank dynamics pre- and post-mid dry season 1997 fire
A total of 26 species were detected in the germinable soil seed bank (henceforth
referred to as “seed bank”) collected in July 1997, and no significant differences in
species richness were detected between soil depths or with soil treatment (Figure 5.5a;
Table 5.1). Total seed bank density was greatest below 3 mm depth and more seeds
germinated from soil collected after the fire than in untreated soil collected prior to the
fire (Figure 5.5b; Table 5.1).
The results of soil treatment and differences between soil depths for species groups and
individual species are displayed in Tables 5.1 and 5.2. More seedlings of upright forbs
germinated from burnt soil than heated soil collected prior to the fire. The density of
seedling emergence of the dominant grass, Heteropogon triticeus, was significantly
higher in burnt soil compared with untreated and heated soil collected prior to the fire.
Soil heating increased the germination of ephemeral forbs as a group and the common
ephemeral Indigofera hirsuta, compared to untreated and burnt soil, but inhibited the
germination of grasses as a group and the common grass, Digitaria breviglumis.
The seed banks of native species and ephemeral forbs were significantly denser below
3 mm, while that of upright perennial forbs and grasses were significantly more
abundant at a depth of 3 to 20 mm than the surface 3 mm and 20 to 40 mm. The seed
bank of the common ephemeral forb, Indigofera hirsuta was more abundant at 20 to 40
mm than in the surface 3 mm. A significant interaction between soil treatment and soil
depth was detected for native species as a group.
122
Chapter 5. The effect of fire regime on soil seed bank dynamics.
0
2
4
6
8
10
0 - 3 mm 3 - 20 mm 20 - 40 mmSp
ecie
s ri
chn
ess
(per
sam
ple
) (a)
0
50
100
150
200
250
300
0 to 3 mm 3 - 20 mm 20 - 40 mmSoil depth
See
d d
ensi
ty (m
-2)
(b)
Figure 5.5. Mean (! 1 standard error) (a) species richness per sample and (b) total seed
density of germinable soil seed bank, collected in eucalypt savanna at Cape Cleveland,
before and after the 1997 mid dry season fire. Soil samples were collected prior to fire
and remained untreated (■); collected prior to fire and heated in an oven at 85ºC for 45
minutes (■); or collected after fire, but otherwise untreated (■). Sample area varies
between soil depths. 0 – 3, surface samples from a depth of 0 to 3 mm, with a surface
area of 1 m-2; 3 – 20 samples from 3 to 20 mm depth, with a surface area of 0.18 m-2;
20 – 40, samples from 20 to 40 mm depth, with a surface area of 0.15 m-2.
123
Chapter 5. The effect of fire regime on soil seed bank dynamics.
Table 5.1. ANOVA results of soil treatment and depth of germinable soil seed bank
collected before and after fire in July 1997 at Cape Cleveland. Log, log (x + 1)
transformation was used to rectify heterogeneity of variances; Kruskal-Wallis, the non-
parametric Kruskal-Wallis ANOVA by ranks used due to unresolvable variance
heterogeneity. F 2,18 , F value, denominator d.f., numerator d.f.; F or H values without
an asterisk (*) are not significantly different at P > 0.01; *P < 0.01; **P < 0.001.
Scheffe’s post-hoc test results of the significant differences within soil treatments and
soil depths are provided. U, soil collected prior to fire and untreated; H, soil collected
prior to fire and heated in oven at 85º C for 45 minutes; B, soil collected after fire but
other wise untreated. 3 mm, 0 to 3 mm soil depth; 20mm, 3 to 20 mm soil depth;
40mm, 20 to 40 mm soil depth. Dependent factors Soil treatment Soil depth Soil treatment x
Soil depth
Species richness F 2,18 = 0.247 F 2,18 = 0.831 F 4,18 = 1.143
Combined species (n = 26) logged
F 2,18 = 9.436* B > U
F 2,18 = 52.872** 20mm and 40mm > 3mm
F 4,18 = 3.450
Native species (n = 20) logged F 2,18 = 11.304** B > U
F 2,18 = 65.072** 20mm and 40mm > 3mm
F 4,18 = 4.578*
Exotic species (n = 6) logged F 2,18 = 0.511 F 2,18 = 1.452 F 4,18 = 0.530
Subshrubs (n = 2) logged F = 2.491 F 2,18 = 0.831 F 4,18 = 0.740
Upright perennial forbs (n = 5) F 2,18 = 6.119* B > H
F = 12.124** 20mm > 3mm and 40mm
F 4,18 = 2.882
Twining perennial forbs ( n = 7) logged
F 2,18 = 5.867 F 2,18 = 3.999 F 4,18 = 0.662
Ephemeral forbs (n= 5) logged
F 2,18 = 27.898** H > U and B
F 2,18 = 12.811** 20mm and 40mm > 3mm
F 4,18 = 2.810
Indigofera hirsuta logged
F 2,18 = 29.871** H > U and B
F 2,18 = 12.628** 40mm > 3mm
F 4,18 = 2.614
Grasses (n = 4) logged F 2,18 = 37.396** U and B > H
F 2,18 = 7.539* 20mm >3mm and 40mm
F 4,18 = 2.355
Digitaria breviglumis Kruskal-Wallis
H 2,18 = 9.928* U > H
H 2,18 = 3.099
Heteropogon triticeus logged
F 2,18 = 29.495** B > U and H
F 2,18 = 3.981 F 4,18 = 1.681
Non-grass monocots (n = 3)
F 2,18 = 2.991 F 2,18 = 1.504 F 4,18 = 0.908
124
Chapter 5. The effect of fire regime on soil seed bank dynamics.
Table 5.2. Mean (standard error) germinable soil seed bank density of native and exotic species, growth form groups and common species,
collected at three soil depths before and after the July 1997 fire at Cape Cleveland. Untreated, soil collected prior to fire and untreated;
Heated, soil collected prior to fire and heated in oven at 85º C for 45 minutes; Burnt, soil collected after fire but other wise untreated. 0 -
3mm, 0 to 3 mm soil depth; 3 - 20 mm, 3 to 20 mm soil depth; 20 - 40 mm, 20 to 40 mm soil depth. Untreated
0 - 3mm Untreated
3 - 20 mm Untreated
20 - 40 mm Heated
0 - 3mm Heated 3 - 20 mm
Heated 20 - 40 mm
Burnt 0 - 3mm
Burnt 3 - 20 mm
Burnt 20 - 40mm
Native species (n = 20)
9.67 (4.26)
30.22 (6.81)
35.56 (4.44)
7.33 (0.88)
64.23 (10.52)
64.23 (10.52)
13.33 (2.19)
200.23 (33.10)
48.89 (12.37)
Exotic species (n = 6)
0.67 (0.33)
5.67 (5.67)
4.44 (4.44)
1.67 (0.88)
3.78 (3.78)
8.89 (2.22)
0.67 (0.33)
7.56 (5.00)
4.44 (2.22)
Subshrubs (n = 2)
0.33 (0.33)
0.00 (0.00)
2.22 (2.22)
0.67 (0.33)
3.78 (3.78)
6.67 (3.85)
0.67 (0.33)
0.00 (0.00)
0.00 (0.00)
Upright perennial forbs (n = 5)
1.67 (0.88)
9.44 (3.78)
0.00 (0.00)
1.67 (1.67)
3.78 (1.89)
0.00 (0.00)
0.67 (0.67)
20.78 (6.81)
6.67 (0.00)
Twining perennial forbs (n= 7)
0.33 (0.33)
3.78 (1.89)
6.67 (3.85)
1.33 (0.33)
9.45 (5.00)
13.33 (0.00)
0.33 (0.33)
0.00 (0.00)
2.22 (2.22)
Ephemeral forbs (n = 5)
0.33 (0.33)
1.89 (1.89)
13.33 (6.67)
4.33 (0.33)
43.45 (9.45)
48.89 (13.52)
0.00 (0.00)
3.78 (1.89)
2.22 (2.22)
Indigofera hirsuta 0.33 (0.33)
1.89 (1.89)
13.33 (6.67)
3.67 (0.33)
41.56 (7.56)
46.67 (13.88)
0.00 (0.00)
1.89 (1.89)
2.22 (2.22)
Grasses (n = 4) 5.67 (2.19)
17.00 (5.67)
15.56 (4.44)
1.00 (0.58)
7.56 (7.56)
0.00 (0.00)
11.00 (2.65)
171.90 (32.94)
37.78 (17.78)
Digitaria breviglumis
2.67 (1.33)
5.67 (0.00)
13.33 (3.85)
1.00 (0.58)
0.00 (0.00)
0.00 (0.00)
1.33 (1.33)
37.78 (13.22)
6.67 (3.85)
Heteropogon triticeus
1.67 (1.20)
1.89 (1.89)
2.22 (2.22)
0.00 (0.00)
7.56 (7.56)
0.00 (0.00)
9.67 (1.86)
132.23 (19.99)
26.67 (13.88)
Non-grass monocots (n = 3)
2.00 (1.53)
3.78 (1.89)
2.22 (2.22)
0.00 (0.00)
0.00 (0.00)
0.00 (0.00)
1.33 (0.33)
11.33 (6.54)
4.44 (4.44)
125
Chapter 5. The effect of fire regime on soil seed bank dynamics.
5.3.2 Seasonal and annual fluctuations in soil seed bank with time since fire
Seasonal and annual fluctuations were detected in the seed bank in the first three years
following the mid dry season fire of 1997, and soil heating increased the germination of
several species and species groups. Species richness of the germinants from the seed
bank was significantly increased by soil heating and was significantly higher in 1999
and 2000 than 1998 (Figure 5.6a; Table 5.3). Species richness was also higher in the
mid and late dry season compared to the wet season, and in the late dry season than in
the early dry season. Soil heating increased overall seedling numbers, and total seed
bank was higher in 1999 and 2000 than 1998 (Figure 5.6b; Table 5.3). Total seed bank
density was also higher in the mid and late dry season compared to the wet season, and
in the late dry season than in the early dry season.
The annual and seasonal fluctuations in seed bank, and the effect of soil heating on
seed germination, for individual species and species groups are presented in Tables 5.3
and 5.4a-c. The germination of subshrubs as a group, the common subshrubs,
Triumfetta rhomboidea, the common twiner, Pycnospora lutescens, ephemeral forbs as
a group and the common ephemeral forb, Indigofera hirsuta was increased by soil
heating. Soil heating did not significantly inhibit the germination of any species or
species groups.
Seed banks of native and exotic species, grasses and non-grass monocots were denser
in 1999 and 2000 than 1998, and the seed bank of ephemeral forbs was more abundant
in 2000 than 1998.
The seed bank of native species was greater in the mid and late dry seasons compared
to the wet season, and in the late dry season than in the early dry season. Seed banks of
exotic species and grasses were more abundant in the late dry season than the wet
season. Seed bank density of T. rhomboidea was greater in the mid and late dry seasons
than the wet season, and in the late dry season than in the early and mid dry seasons.
Seed banks of twining perennial forbs and the dominant grass, Heteropogon triticeus,
were greater in the mid dry season than the wet season. The non-grass monocot seed
bank was greater in the late dry season than the wet and early dry seasons.
126
Chapter 5. The effect of fire regime on soil seed bank dynamics.
0
5
10
15
20
Wet
Early MidLate
Wet
Early MidLate
Wet
Early MidLateS
pec
ies
rich
nes
s (p
er s
amp
le) (a)
0
200
400
600
800
1000
W et Early Mid Late W et Early Mid Late W et Early Mid Late
Season
See
d d
ensi
ty (m
-2)
1998 1999 2000
(b)
Figure 5.6. Mean (! 1 standard error) (a) species richness per sample and (b) total seed
density of germinable soil seed bank, collected in eucalypt savanna at Cape Cleveland,
between February 1998 and October 2000, in sites last burnt in July 1997. Soil samples remained untreated (■); or were heated in an oven at 85ºC for 45 minutes (■). Sample
area equals 0.05 m-2 in February 1998 and 0.08 m-2 for all other samples. Soil samples
collected in four seasons of each year: Wet, mid wet season, i.e. February; Early, early
dry season, i.e. May; Mid, mid dry season, i.e. July; Late, late dry season, i.e. October.
127
Chapter 5. The effect of fire regime on soil seed bank dynamics.
128
Table 5.3. Statistical significance of differences between soil treatment, annual and seasonal fluctuations in germinable soil seed bank
collected between February 1998 and October 2000 in eucalypt savanna last burnt in July 1997, at Cape Cleveland. Log, log (x + 1)
transformation was used to rectify heterogeneity of variances; non-parametric, the non-parametric Mann-Whitney U-test was used for soil
treatment and Friedman’s ANOVA by ranks were used for annual and seasonal fluctuations where variance heterogeneity could not be
resolved by data transformation. F 2,8 indicates F value, denominator d.f., numerator d.f.; F, U or 2 values without an asterisk (*) are not
significantly different at P > 0.01; *P < 0.01; **P < 0.001. Results from a Scheffe’s post hoc test, Wilcoxon matched pair test for Friedman
ANOVA, of significant differences between soil treatments and soil depths are provided. U, untreated soil; H, soil heated in oven at 85°C for
45 minutes; 98, 1998; 99, 1999; 00, 2000; W, wet season; E, early dry season; M, mid dry season; L, late dry season. Soil Treatment Year
Season
Soil Treatment x Year
Soil Treatment x Season
Year x Season
Soil Treatment x Year x Season
Species richness F 1,4 = 34.152* H > U
F 2,8 = 22.640** 99 & 00 > 98
F 3,12 = 10.649* L & M > W, L > E
F 2,8 = 1.246 F 3,12 = 1.166 F 6,24 = 0.733 F 6,24 = 0.365
All species (n = 64) F 1,4 = 34.994* H > U
F 2,8 = 47.237** 99 & 00 > 98
F 3,12 = 27.192** M & L > W, L > E
F 2,8 = 6.291 F 3,12 = 4.291 F 6,24 = 2.681 F 6,24 = 1.754
Native species (n = 49) F 1,4 = 19.168
F 2,8 = 56.554** 99 & 00 > 98
F 3,12 = 22.445** M & L > W, L > E
F 2,8 = 7.806 F 3,12 = 1.956 F 6,24 = 1.383 F 6,24 = 1.307
Exotic species (n = 15) Treatment X Season 99 & 00, log; Friedman for year
F 1,4 = 4.586 2 2,24 = 16.909** 99 & 00 > 98
F 3,12 = 6.094* L > W
F 3,12 = 1.151
Subshrubs (n = 9) Non-parametric
U1 = 4.753** H > U
2 2,24 = 4.388 2 3,18 = 5.832
Triumfetta rhomboidea non-parametric
U1 = 215.000** H > U
2 2,24 = 5.143 2 3,18 = 10.703
Chapter 5. The effect of fire regime on soil seed bank dynamics.
129
Table 5.3. (cont.) Soil Treatment
Year
Season Soil Treatment x Year
Soil Treatment x Season
Year x Season
Soil Treatment x Year x Season
Upright perennial forbs (n = 9) Non-parametric
U1 = 540.000 2 2,24 = 7.243
2 3,18 = 9.226
Twining perennial forbs (n = 16) log
F 1,4 = 5.008 F 2,8 = 8.313 P < 0.011
F 3,12 = 6.131* M > W
F 2,8 = 0.030 F 3,12 = 0.886 F 6,24 = 1.019 F 6,24 = 3.391
Pycnospora lutescens non-parametric
U1 = 213.000** H > U
2 2,24 = 3.031 2 3,18 = 4.991
Ephemeral forbs (n= 12) non-parametric
U1 = 62.500** H > U
2 2,24 = 16.929** 00 > 98
2 3,18 = 4.587
Indigofera hirsuta non-parametric
U1 = 1.500** H > U
2 2,24 = 4.392 2 3,18 = 6.971
Grasses (n = 10) Treatment x Season 99 & 00; Friedman for Year
F 1,4 = 6.188 2 2,24 = 14.439** 99 & 00 > 98
F 3,12 = 9.864** L > W
F 3,12 = 1.675
Digitaria breviglumis Non-parametric
U1 = 522.500 2 2,24 = 13.703** 00 > 98
2 3,18 = 8.396
Heteropogon triticeus non-parametric
U1 = 421.500* U > H
2 2,24 = 12.286* 99 > 98
2 3,18 = 14.978* E, M & L > W
Non-grass monocots (n = 6) non-parametric
U1 = 643.500 2 2,24 = 16.353** 99 & 00 > 98
2 3,18 = 30.986** L > W & E
Chapter 5. The effect of fire regime on soil seed bank dynamics.
Table 5.4a. Mean (standard error) untreated and heated germinable soil seed bank
density (m-2) of natives and exotic species, growth form groups and common species,
collected in the wet season, early, mid and late dry seasons of 1998 at Cape Cleveland,
in savanna last burnt in July 1997. Columns are identified by the season of soil
collection: Mid wet, mid wet season, i.e. February; Early, early dry season i.e. May;
Mid, mid dry season, i.e. July; Late, late dry season, i.e. October. Untreated soil Heated soil
Mid wet Early Mid Late Mid wet Early Mid Late
Native species (n= 49)
66.67 (17.64)
41.67 (11.02)
45.83 (23.20)
129.17 (11.02)
46.67 (13.33)
104.17 (33.33)
175.00 (33.07)
245.83 (41.04)
Exotic species (n = 15)
0.00 (0.00)
8.33 (4.17)
12.50 (7.22)
8.33 (4.17)
20.00 (11.55)
16.67 (11.02)
33.33 (4.17)
16.67 (4.17)
Woodland trees and shrubs (n =1)
0.00 (0.00)
0.00 (0.00)
0.00 (0.00)
4.17 (4.17)
0.00 (0.00)
0.00 (0.00)
0.00 (0.00)
0.00 (0.00)
Subshrubs (n = 9)
0.00 (0.00)
0.00 (0.00)
0.00 (0.00)
8.33 (8.33)
20.00 (11.55)
8.33 (8.33)
33.33 (4.17)
4.17 (4.17)
Triumfetta rhomboidea
0.00 (0.00)
0.00 (0.00)
0.00 (0.00)
0.00 (0.00)
20.00 (11.55)
4.17 (4.17)
33.33 (41.17)
4.17 (4.17)
Upright perennial forbs (n = 9)
33.33 (6.67)
0.00 (0.00)
4.17 (4.17)
12.50 (7.22)
13.33 (13.33)
0.00 (0.00)
0.00 (0.00)
0.00 (0.00)
Twining perennial forbs (n = 16)
13.33 (6.67)
8.33 (4.17)
12.50 (7.22)
4.17 (4.17)
6.67 (6.67)
66.67 (33.33)
87.5 (57.28)
116.67 (57.89)
Pycnospora lutescens
13.33 (6.67)
0.00 (0.00)
0.00 (0.00)
0.00 (0.00)
6.67 (6.67)
16.67 (11.02)
75.00 (57.28)
87.50 (47.32)
Ephemeral forbs (n = 12)
0.00 (0.00)
4.17 (4.17)
4.17 (4.17)
4.17 (4.17)
26.67 (6.67)
41.67 (4.17)
62.50 (14.43)
125.00 (52.04)
Indigofera hirsuta
0.00 (0.00)
4.17 (4.17)
4.17 (4.17)
0.00 (0.00)
20.00 (0.00)
33.33 (4.17)
62.50 (14.43)
87.50 (33.07)
Grasses (n = 10)
13.33 (6.67)
37.50 (7.22)
25.00 (19.09)
87.50 (26.02)
0.00 (0.00)
4.17 (4.17)
12.50 (7.22)
12.50 (7.22)
Digitaria breviglumis
13.33 (6.67)
12.50 (7.22)
4.17 (4.17)
4.17 (4.17)
0.00 (0.00)
0.00 (0.00)
4.17 (4.17)
8.33 (4.17)
Heteropogon triticeus
0.00 (0.00)
25.00 (12.50)
16.67 (16.67)
33.33 (15.02)
0.00 (0.00)
4.17 (4.17)
0.00 (0.00)
0.00 (0.00)
Non-grass monocots (n = 6)
6.67 (6.67)
0.00 (0.00)
12.50 (12.50)
16.67 (16.67)
0.00 (0.00)
0.00 (0.00)
12.50 (7.22)
4.17 (4.17)
130
Chapter 5. The effect of fire regime on soil seed bank dynamics.
Table 5.4b. Mean (standard error) of untreated and heated germinable soil seed bank
density (m-2) of natives and exotic species, growth form groups and common species,
collected in the wet season, early, mid and late dry seasons of 1999 at Cape Cleveland,
in savanna last burnt in July 1997. Columns are identified by the season of soil
collection: Mid wet, mid wet season, i.e. February; Early, early dry season i.e. May;
Mid, mid dry season, i.e. July; Late, late dry season, i.e. October. Untreated soil Heated soil
Mid wet Early Mid Late Mid Early Mid Late
Native species (n = 49)
66.67 (29.17)
75.00 (40.18)
279.17 (48.05)
295.83 (41.04)
187.50 (33.07)
470.83 (86.10)
391.67 (141.85)
537.50 (19.09)
Exotic species (n = 15)
75.00 (62.92)
54.17 (11.02)
37.50 (19.09)
41.67 (29.17)
20.83 (15.02)
104.17 (34.11)
70.83 (29.17)
133.33 (25.34)
Woodland trees and shrubs (n =1)
0.00 (0.00)
0.00 (0.00)
0.00 (0.00)
0.00 (0.00)
0.00 (0.00)
0.00 (0.00)
0.00 (0.00)
0.00 (0.00)
Subshrubs (n = 9)
8.33 (8.33)
12.50 (12.50)
4.17 (4.17)
4.17 (4.17)
16.67 (4.17)
108.33 (18.16)
54.17 (35.60)
91.67 (39.75)
Triumfetta rhomboidea
0.00 (0.00)
0.00 (0.00)
4.17 (4.17)
4.17 (4.17)
4.17 (4.17)
79.17 (33.33)
54.17 (35.60)
91.67 (39.75)
Upright perennial forbs (n = 9)
12.50 (0.00)
0.00 (0.00)
25.00 (14.43)
8.33 (4.17)
0.00 (0.00)
4.17 (4.17)
12.50 (7.22)
16.67 (4.17)
Twining perennial forbs (n = 16)
12.50 (12.50)
37.50 (14.43)
62.50 (28.87)
79.17 (33.33)
95.83 (53.20)
250.00 (111.10)
137.52 (101.04)
170.83 (43.50)
Pycnospora lutescens
0.00 (0.00)
4.17 (4.17)
12.50 (7.22)
8.33 (8.33)
50.00 (33.07)
187.50 (94.65)
95.83 (83.65)
58.33 (23.20)
Ephemeral forbs (n = 12)
66.67 (54.17)
33.33 (18.16)
16.67 (16.67)
4.17 (4.17)
87.50 (21.65)
187.50 (38.19)
183.33 (72.29)
95.83 (25.34)
Indigofera hirsuta
0.00 (0.00)
4.17 (4.17)
0.00 (0.00)
0.00 (0.00)
62.50 (19.09)
141.67 (39.75)
120.083 (46.93)
62.50 (14.43)
Grasses (n = 10)
33.33 (18.16)
41.67 (30.05)
191.67 (67.06)
175.00 (26.02)
8.33 (8.33)
20.83 (20.83)
41.67 (15.02)
195.83 (41.67)
Digitaria breviglumis
29.17 (15.02)
25.00 (25.00)
45.83 (39.75)
25.00 (19.09)
8.33 (8.33)
4.17 (4.17)
20.83 (11.02)
25.00 (7.22)
Heteropogon triticeus
4.17 (4.17)
16.67 (16.67)
120.83 (43.50)
150.00 (25.00)
0.00 (0.00)
12.50 (15.50)
16.67 (4.17)
170.83 (48.05)
Non-grass monocots (n = 6)
8.33 (4.17)
4.17 (4.17)
16.67 (16.67)
66.67 (4.17)
0.00 (0.00)
4.17 (4.17)
33.33 (4.17)
100.000 (12.50)
131
Chapter 5. The effect of fire regime on soil seed bank dynamics.
Table 5.4c. Mean (standard error) of untreated and heated germinable soil seed bank
density (m-2) of natives and exotic species, growth form groups and common species,
collected in the wet season, early, mid and late dry seasons of 2000 at Cape Cleveland,
in savanna last burnt in July 1997. Columns are identified by the season of soil
collection: Mid wet, mid wet season, i.e. February; Early, early dry season i.e. May;
Mid, mid dry season, i.e. July; Late, late dry season, i.e. October. Untreated soil Heated soil
Mid wet Early Mid Late Mid Early Mid Late
Native species (n = 49)
75.00 (50.00)
141.67 (18.16)
229.17 (48.05)
295.83 (77.17)
179.17 (58.33)
258.33 (84.27)
416.67 (54.17)
525.00 (73.24)
Exotic species (n = 15)
20.83 (11.02)
16.67 (11.02)
41.67 (16.67)
54.17 (30.05)
33.33 (11.02)
58.33 (20.83)
183.33 (11.02)
266.67 (65.48)
Woodland trees and shrubs (n =1)
0.00 (0.00)
0.00 (0.00)
0.00 (0.00)
0.00 (0.00)
0.00 (0.00)
0.00 (0.00)
0.00 (0.00)
0.00 (0.00)
Subshrubs (n = 9)
4.17 (4.17)
4.17 (4.17)
0.00 (0.00)
20.83 (15.02)
8.33 (4.17)
33.33 (22.05)
137.50 (19.09)
241.67 (46.96)
Triumfetta rhomboidea
4.17 (4.17)
0.00 (0.00)
0.00 (0.00)
20.83 (15.02)
8.33 (4.17)
29.17 (18.16)
137.50 (19.09)
220.83 (44.10)
Upright perennial forbs (n = 9)
4.17 (4.17)
29.17 (18.16)
33.33 (20.83)
45.83 (29.17)
8.33 (4.17)
12.50 (7.22)
16.67 (11.02)
50.00 (21.65)
Twining perennial forbs (n = 16)
20.83 (4.17)
29.17 (8.33)
41.67 (15.02)
20.83 (4.17)
87.50 (50.52)
83.33 (34.11)
225.00 (59.07)
129.17 (58.33)
Pycnospora lutescens
0.00 (0.00)
8.33 (4.17)
4.17 (4.17)
0.00 (0.00)
33.33 (15.02)
37.50 (26.02)
158.33 (63.05)
41.67 (23.30)
Ephemeral forbs (n = 12)
8.33 (8.33)
8.33 (4.17)
12.50 (0.00)
20.83 (8.33)
91.67 (15.02)
75.00 (25.00)
133.33 (32.54)
154.17 (49.12)
Indigofera hirsuta
0.00 (0.00)
0.00 (0.00)
0.00 (0.00)
0.00 (0.00)
79.17 (11.02)
37.50 (14.43)
108.33 (29.17)
95.83 (32.54)
Grasses (n = 10)
45.83 (33.33)
83.33 (25.34)
125.00 (21.65)
141.67 (23.20)
12.50 (12.50)
87.50 (45.07)
62.50 (43.90)
70.83 (8.33)
Digitaria breviglumis
20.83 (8.33)
20.83 (8.33)
50.00 (25.00)
104.17 (22.05)
12.50 (12.50)
25.00 (19.09)
54.17 (48.05)
62.50 (0.00)
Heteropogon triticeus
16.67 (16.67)
45.83 (23.20)
54.17 (25.34)
25.00 (14.43)
0.00 (0.00)
37.50 (19.09)
4.17 (4.17)
4.17 (4.17)
Non- grass monocots (n = 6)
12.50 (12.50)
4.17 (4.17)
58.33 (11.02)
100.00 (12.50)
4.17 (4.17)
25.00 (19.09)
25.00 (0.00)
145.83 (43.50)
132
Chapter 5. The effect of fire regime on soil seed bank dynamics.
5.3.3 Seed bank dynamics immediately before and after the 1999 fire season
treatments
The seed bank of 39 species was detected between May 1999 and February 2000. Soil
heating significantly increased the species richness of seedlings from the seed bank
(Figure 5.7a; Table 5.5). Species richness was highest in seed banks collected in the
mid and late dry seasons compared to the wet season, and in the late dry season
compared to the early dry season. Total density of seedlings germinating from the seed
bank was significantly increased by soil heating (Figure 5.7b; Table 5.5). There was a
significantly higher total seed bank density detected in the early, mid and late dry
seasons compared to the wet season, and in the late dry season compared to the early
dry season. A significant interaction between soil treatment and season of collection
was also demonstrated.
The annual and seasonal fluctuations, and the effect of soil heating, for individual
species and species groups are presented in Tables 5.5 and 5.6. The germination of
native species, twining perennial forbs, the common twiner P. lutescens, ephemeral
forbs, and the common ephemeral I. hirsuta, was significantly increased by soil
heating. Significant interactions between fire and season of soil collection were
detected for natives as a group and for the common grass Digitaria breviglumis,
indicating seed bank density increased following early and late dry season fires (Table
5.5).
The seed bank density of native species was higher in the mid and late dry seasons than
the wet season, and in the late rather than early dry season. The seed bank of upright
perennial forbs was more abundant in the late dry season rather than the wet season,
and that of twining perennial forbs was greater in the early and late dry seasons than the
wet season. Seed bank density of grasses and non-grass monocots was higher in the
mid and late dry seasons than in the wet season, and in the late rather than mid dry
season. The seed bank of the common grass D. breviglumis was more abundant in the
late dry season than the wet and early dry seasons, while that of H. triticeus was greater
in the late rather than mid dry season, in the mid dry season compared with the early
dry season. A significant interaction was detected between soil treatment and season of
133
Chapter 5. The effect of fire regime on soil seed bank dynamics.
collection for the seed banks of native species, upright perennial forbs, grasses and I.
hirsuta.
0
5
10
15
20
1 2 3 4 5 6 7 8 9 10 11 12
Sp
ecie
s ri
chn
ess
(0.0
8 m
-2) (a)
0
200
400
600
800
1000
Early Mid Late W et Early Mid Late W et Early Mid Late W et
Season
See
d d
ensi
ty (m
-2)
Control Early burnt Late burnt
(b)
Figure 5.7. Mean (! 1 standard error) (a) species richness and (b) total seed density of
germinable soil seed bank, collected in eucalypt savanna at Cape Cleveland, between
May 1999 and February 2000. Soil samples remained untreated (■); or were heated in
an oven at 85ºC for 45 minutes (■). Arrows indicate timing of early and late dry season
fires in relation to soil sample collections. Early, early dry season, i.e. May 1999; Mid,
mid dry season, i.e. July1999; Late, late dry season, i.e. October 1999; Wet, mid wet
season, i.e. February 2000. Control, sites last burnt in July 1997; Early burnt, sites
burnt July 1997 and May 1999; Late burnt, sites burnt July 1997 and October 1999.
134
Chapter 5. The effect of fire regime on soil seed bank dynamics.
Table 5.5. ANOVA of the statistical significance of differences between fire treatment, soil treatment and season of soil seed bank
collection, before and after the 1999 fire season treatments in eucalypt savanna at Cape Cleveland. log indicates log (x + 1) transformation
was used to rectify heterogeneity of variances; F 2,12 indicates F value, denominator d.f., numerator d.f.; F values without an asterisk (*)
are not significantly different at P > 0.01; *P < 0.01; **P < 0.001.; Early & Late, indicate the subset of seasons of collection used in
analysis where data transformation did not resolve variance heterogeneity for other seasons. Results presented from a Scheffe’s post-hoc
test for soil treatment, fire and season of collection differences. U, untreated soil; H, soil heated in oven at 85°C for 45 minutes; W, wet
season; E, early dry season; M, mid dry season; L, late dry season. Species group
Fire Soil Treatment Season Fire x Soil Treatment
Fire x season Soil Treatment x Season
Fire x Soil Treatment x Season
Species richness F 2,12 = 0.107 F 1,12 = 11.814** H > U
F 3,36 = 22.381** M & L > W, L > E
F 2,12 = 2.553 F 6,36 = 1.602 F 3,36 = 0.439 F 6,36 = 0.628
All species (n = 39)
F 2,12 = 0.036 F 1,12 = 24.340** H > U
F 3,36 = 53.822** E, M & L > W; L > E
F 2,12 = 2.028
F 6,36 = 2.332 F 3,36 = 4.928* F 6,36 = 2.436
Native species (n = 31) F 2,12 = 0.569 F 1,12 = 21.539** H > U
F 3,36 = 64.940** E, M & L > W; L > E & M
F 2,12 = 0.897 F 6,36 = 4.083* F 3,36 = 7.236** F 6,36 = 2.048
Exotic species (n = 8) F 2,12 = 5.730
F 1,12 = 1.600 F 3,36 = 2.197 F 2,12 = 4.202 F 6,36 = 1.167 F 3,36 = 0.753 F 6,36 = 1.480
Subshrubs (n = 5) Early, Mid & Late
F 2,12 = 5.122
F 1,12 = 6.814
F 2,24 = 3.485 F 2,12 = 6.817 F 4,24 = 0.357 F 2,24 = 0.126 F 4,24 = 1.345
Upright perennial forbs (n = 6) Mid, Late & Wet
F 2,12 = 3.214 F 1,12 = 0.624 F 2,24 = 12.538* L > W
F 2,12 = 0.225 F 4,24 = 2.809 F 2,24 = 6.585* F 6,36 = 0.710
Twining perennial forbs (n = 10) log
F 2,12 = 1.283 F 1,12 = 11.019* H > U
F 3,36 = 9.823** E & L > W
F 2,12 = 0.322 F 6,36 = 1.100 F 3,36 = 0.879 F 4,24 = 1.539
Glycine tomentella F 2,12 = 0.232 F 1,12 = 3.889 F 3,36 = 0.627 F 2,12 = 0.022 F 6,36 = 1.205
F 3,36 = 0.795 F 6,36 = 0.556
135
Chapter 5. The effect of fire regime on soil seed bank dynamics.
Table 5.5 (cont.) Species group
Fire Soil Treatment
Season Fire x Soil Treatment
Fire x season Soil Treatment x Season
Fire x Soil Treatment x Season
Pycnospora lutescens Log;Early, Late
F 2,12 = 2.858 F 1,12 = 44.555** H > U
F 1,12 = 1.561
F 2,12 = 0.682 F 2,12 = 1.162 F 1,12 = 1.763 F 2,12 = 0.981
Ephemeral forbs (n = 9) Mid, Late & Wet
F 2,12 = 3.263 F 1,12 = 64.001** H > U
F 2,24 = 1.583 F 2,12 = 2.559 F 4,24= 0.726 F 2,24 = 1.819 F 4,24 = 0.913
Indigofera hirsuta Log; Early, Mid & Late
F 2,12 = 1.441 F 1,12 = 93.866** H > U
F 2,24 = 0.112 F 2,12 = 0.408 F 4,24 = 1.840 P < 0.154
F 2,24 = 5.559* F 4,24 = 3.761
Grasses (n = 6)
F 2,12 = 2.054 F 1,12 = 6.091
F 3,36 = 52.607** M & L > W, L > M
F 2,12 = 1.714 F 6,36 = 2.822 F 3,36 = 4.457* F 6,36 = 1.739
Digitaria breviglumis F 2,12 = 1.687 F 1,12 = 4.529 F 3,36 = 13.395** L > W & E
F 2,12 = 1.534 F 6,36 = 5.652** F 3,36 = 2.658 F 6,36 = 1.428
Heteropogon triticeus Early, Mid & Late
F 2,12 = 1.820 F 1,12 = 4.934
F 2,24 = 32.653** M & L > E, L > M
F 2,12 = 0.908 F 4,24 = 0.560 F 2,24 = 2.472 F 4,24 = 1.339
Non-grass monocots (n = 3), Mid,Late & Wet
F 2,12 = 0.418 F 1,12 = 0.268 F 2,24 = 47.042** M & L > W, L > M
F 2,12 = 2.527 F 4,24 = 1.654 F 2,24 = 0.217 F 4,24 = 2.073
136
Chapter 5. The effect of fire regime on soil seed bank dynamics.
Table 5.6a. Mean (standard error) germinable soil seed bank density (m-2) of untreated
and heated soil samples collected between May 1999 and February 2000 at Cape
Cleveland, from the control treatment (i.e. savanna that remained unburnt since July
1997). Columns are identified by the season of soil collection: Early, early dry season
i.e. May; Mid, mid dry season, i.e. July; Late, late dry season, i.e. October. Untreated soil Heated soil
Early Mid Late Wet Early Mid Late Wet
Native species (n = 31)
75.00 (40.18)
279.17 (48.05)
295.83 (41.04)
75.00 (50.00)
470.83 (86.10)
391.67 (141.85)
537.50 (19.09)
179.17 (58.33)
Exotic species (n = 8)
54.17 (11.02)
37.50 (19.09)
41.07 (29.17)
20.83 (11.02)
104.17 (34.11)
70.83 (29.17)
133.33 (25.34)
33.33 (11.02)
Subshrubs (n = 5)
12.50 (12.50)
4.17 (4.17)
4.17 (4.17)
4.17 (4.17)
108.33 (18.16)
54.17 (35.60)
91.67 (39.75)
8.33 (4.17)
Upright perennial forbs (n = 6)
0.00 (0.00)
25.00 (14.43)
8.33 (4.17)
4.17 (4.17)
4.17 (4.17)
12.50 (7.22)
16.67 (4.17)
8.33 (4.17)
Twining perennial forbs (n = 10)
37.50 (14.43)
62.50 (28.87)
79.17 (33.33)
20.83 (4.17)
250.00 (111.10)
137.50 (101.04)
170.83 (43.50)
87.50 (50.52)
Glycine tomentella
0.00 (0.00)
20.83 (20.83)
25.00 (19.09)
8.33 (4.17)
29.17 (18.16)
16.67 (8.33)
29.17 (15.02)
33.33 (22.05)
Pycnospora lutescens
4.17 (4.17)
12.50 (7.22)
8.33 (8.33)
0.00 (0.00)
187.50 (94.65)
95.83 (93.65)
58.33 (23.20)
33.33 (15.02)
Ephemeral forbs (n = 9)
33.33 (18.16)
16.67 (16.67)
4.17 (4.17)
8.33 (8.33)
187.50 (38.19)
183.33 (72.29)
95.83 (25.34)
91.67 (15.02)
Indigofera hirsuta
4.17 (4.17)
0.00 (0.00)
0.00 (0.00)
0.00 (0.00)
141.67 (39.75)
120.83 (46.96)
62.50 (14.43)
79.17 (11.02)
Grasses (n =6)
41.67 (30.05)
191.67 (67.06)
175.00 (26.02)
45.83 (33.33)
20.83 (20.83)
41.67 (15.02)
195.83 (41.67)
12.50 (12.50)
Digitaria breviglumis
25.00 (25.00)
45.83 (39.75)
25.00 (19.09)
20.83 (8.33)
4.17 (4.17)
20.83 (11.02)
25.00 (7.22)
12.50 (12.50)
Heteropogon triticeus
16.67 (8.33)
120.83 (43.50)
150.00 (25.00)
16.67 (16.67)
12.50 (12.50)
16.67 (4.17)
170.83 (48.05)
0.00 (0.00)
Non-grass monocots (n = 3)
4.17 (4.17)
16.67 (16.67)
66.67 (4.17)
12.50 (12.50)
4.17 (4.17)
33.33 (4.17)
100.50 (12.50)
4.17 (4.17)
137
Chapter 5. The effect of fire regime on soil seed bank dynamics.
Table 5.6b. Mean (standard error) germinable soil seed bank density (m-2) of untreated
and heated soil samples collected between May 1999 and February 2000 at Cape
Cleveland, from early burnt savanna (May 1999), after the early dry season soil seed
bank collection. Columns are identified by the season of soil collection: Early, early dry
season i.e. May; Mid, mid dry season, i.e. July; Late, late dry season, i.e. October. Untreated soil Heated soil
Early Mid Late Wet Early Mid Late Wet
Native species (n = 31)
191.67 (36.32)
445.83 (67.06)
400.00 (61.66)
75.00 (28.87)
308.33 (27.33)
358.33 (49.12)
612.50 (57.28)
250.00 (52.04)
Exotic species (n = 8)
58.33 (11.02)
20.83 (15.02)
29.17 (23.20)
16.67 (11.02)
4.17 (4.17)
33.33 (16.67)
54.17 (35.60)
20.83 (11.02)
Subshrubs (n = 5)
25.00 (25.00)
0.00 (0.00)
0.00 (0.00)
0.00 (0.00)
0.00 (0.00)
8.33 (8.33)
16.67 (11.02)
8.33 (4.17)
Upright perennial forbs (n = 6)
41.67 (15.02)
45.83 (18.16)
50.00 (19.09)
20.83 (20.83)
0.00 (0.00)
0.00 (0.00)
75.00 (31.46)
4.17 (4.17)
Twining perennial forbs (n = 10)
62.50 (7.22)
8.33 (4.17)
45.83 (18.16)
12.50 (7.22)
83.33 (29.17)
70.83 (22.05)
100.00 (33.07)
50.00 (19.09)
Glycine tomentella 29.17 (8.33)
0.00 (0.00)
4.17 (4.17)
4.17 (4.17)
29.17 (8.33)
8.33 (8.33)
25.00 (12.50)
25.00 (12.50)
Pycnospora lutescens
0.00 (0.00)
0.00 (0.00)
4.17 (4.17)
0.00 (0.00)
16.67 (11.02)
20.83 (20.83)
33.33 (15.02)
4.17 (4.17)
Ephemeral forbs (n = 9)
37.50 (19.09)
33.33 (20.83)
25.00 (14.43)
16.67 (11.02)
191.67 (18.16)
195.85 (34.16)
175.00 (38.19)
191.67 (18.16)
Indigofera hirsuta 4.17 (4.17)
4.17 (4.17)
8.33 (4.17)
0.00 (0.00)
150.00 (26.02)
179.17 (23.20)
141.67 (35.60)
170.83 (32.54)
Grasses (n = 6)
79.17 (34.11)
341.67 (29.17)
262.50 (83.23)
29.17 (4.17)
33.33 (20.83)
83.33 (32.54)
237.50 (90.14)
16.67 (11.02)
Digitaria breviglumis
58.33 (23.20)
112.50 (12.50)
41.67 (16.67)
20.83 (4.17)
4.17 (4.17)
12.50 (7.22)
66.67 (42.29)
4.17 (4.17)
Heteropogon triticeus
12.50 (12.50)
200.00 (40.18)
212.50 (64.15)
8.33 (8.33)
29.17 (16.67)
54.17 (29.17)
170.83 (48.05)
0.00 (0.00)
Non-grass monocots (n = 3)
4.17 (4.17)
37.50 (19.09)
45.83 (8.33)
12.50 (7.22)
4.17 (4.17)
33.33 (8.33)
62.50 (26.02)
0.00 (0.00)
138
Chapter 5. The effect of fire regime on soil seed bank dynamics.
Table 5.6c. Mean (standard error) germinable soil seed bank density (m-2) of untreated
and heated soil samples collected between May 1999 and February 2000 at Cape
Cleveland, from late burnt savanna (October 1999), prior to the late dry season soil
seed bank collection. Columns are identified by the season of soil collection: Early,
early dry season i.e. May; Mid, mid dry season, i.e. July; Late, late dry season, i.e.
October. Untreated soil Heated soil
Early Mid Late Wet Early Mid Late Wet
Native species (n = 31)
141.67 (23.20)
245.83 (60.52)
575.00 (12.50)
16.67 (11.02)
475.00 (109.21)
291.67 (67.06)
650.00 (26.02)
158.33 (46.96)
Exotic species (n = 8)
25.00 (19.09)
33.33 (15.02)
45.83 (11.02)
41.67 (29.17)
33.33 (27.32)
37.50 (7.22)
12.50 (7.27)
20.83 (11.02)
Subshrubs (n = 5)
29.17 (4.17)
0.00 (0.00)
25.00 (12.00)
0.00 (0.00)
33.33 (27.32)
8.33 (8.33)
12.50 (7.22)
4.17 (4.17)
Upright perennial forbs (n = 6)
12.50 (7.22)
50.00 (19.09)
50.00 (7.22)
8.33 (4.17)
0.00 (0.00)
4.17 (4.17)
83.33 (29.17)
4.17 (4.17)
Twining perennial forbs (n = 10)
66.67 (23.20)
66.67 (15.02)
108.33 (37.03)
33.33 (33.33)
125.00 (19.09)
70.83 (25.34)
120.83 (15.02)
45.83 (27.32)
Glycine tomentella 16.67 (8.33)
20.83 (11.02)
20.83 (15.02)
4.17 (4.17)
29.17 (15.02)
29.17 (11.02)
20.83 (8.33)
20.83 (11.02)
Pycnospora lutescens
0.00 (0.00)
12.50 (12.50)
37.50 (26.02)
0.00 (0.00)
50.00 (7.22)
20.83 (20.83)
50.00 (26.02)
12.50 (7.22)
Ephemeral forbs (n = 9)
4.17 (4.17)
16.67 (11.02)
50.00 (19.09)
8.33 (4.17)
341.67 (101.38)
116.67 (18.16)
79.17 (16.67)
120.83 (41.67)
Indigofera hirsuta 4.17 (4.17)
8.33 (4.17)
33.33 (16.67)
0.00 (0.00)
295.83 (102.40)
104.17 (25.34)
75.00 (19.09)
112.50 (37.50)
Grasses (n = 6)
54.17 (16.67)
95.83 (29.17)
287.50 (59.07)
4.17 (4.17)
8.33 (8.33)
108.33 (18.16)
312.50 (28.87)
0.00 (0.00)
Digitaria breviglumis
8.33 (8.33)
25.00 (12.50)
112.50 (28.87)
0.00 (0.00)
0.00 (0.00)
25.00 (12.50)
112.50 (14.43)
0.00 (0.00)
Heteropogon triticeus
41.67 (4.17)
62.50 (19.09)
175.00 (45.07)
4.17 (4.17)
4.17 (4.17)
66.67 (18.16)
179.17 (45.83)
0.00 (0.00)
Non-grass monocots (n = 3)
0.00 (0.00)
50.00 (26.02)
100.00 (12.50)
4.17 (4.17)
0.00 (0.00)
20.83 (15.02)
54.17 (8.33)
4.17 (4.17)
139
Chapter 5. The effect of fire regime on soil seed bank dynamics.
Table 5.7. Results of an independent t-test of untreated germinable soil seed bank after
early dry season fire (control vs early burnt, July 1999 soil collection) and late dry
season fire (control vs late burnt, October 1999 soil collection) at Cape Cleveland. U,
Mann-Whitney U-test used for Indigofera hirsuta and Glycine tomentella July 1999
collected soil seed bank, due to variance heterogeneity. n.s., not significant at P > 0.01. Species and
groups (n = number of species in mid/late)
Mid dry season (d.f. = 4) Late dry season (d.f. = 4)
t value P value t value P value
Species richness 0.392 n.s. 2.101 n.s.
All species n = 23/20
1.449 n.s. 8.308 < 0.001
Native species n = 18/17
2.020 n.s. 6.508 < 0.003
n = 5/3 0.686 n.s. 0.134 n.s.
Subshrubs n = 1/3
1.000 n.s. 1.581 n.s.
Upright perennial forbs n = 4/3
0.898 n.s. 5.00 < 0.007
Twining perennial forbs d.f. = 6/6
1.857 n.s. 0.585 n.s.
Glycine tomentella
U = 3.000 n.s. 0.171 n.s.
Pycnospora lutescens
1.732 n.s. 1.067 n.s.
Ephemeral forbs n = 5/4
0.625 n.s. 1.868 n.s.
Indigofera hirsuta
U = 3.000 n.s. 0.179 n.s.
Grasses n = 5/2
2.051 n.s. 1.743 n.s.
Digitaria breviglumis
1.600 n.s. 2.528 n.s.
Heteropogon triticeus
1.337 n.s. 0.171 n.s.
Non-grass monocots n = 2/2
0.822 n.s. 2.530 n.s.
Exotic species
140
Chapter 5. The effect of fire regime on soil seed bank dynamics.
Analyses of the untreated seed bank immediately following the early dry season fire
indicated that neither total seed density nor species richness significantly differed
between the unburnt control and early dry season burnt blocks (Table 5.7). However,
the late dry season fire significantly increased the total untreated seed bank and that of
native species and upright perennial forbs (Table 5.7), indicating that the late dry
season fire released seed from dormancy. A considerable increase in germination from
the untreated seed bank samples collected following the late dry season fire was
detected for ephemeral forbs and Indigofera hirsuta (Tables 5.6a - c), however low
germinable seed banks in the second of three late burnt blocks reduced the chance of
detecting a significant effect.
5.3.4 Seed bank dynamics following fire season treatments
A total of 53 species was detected in the seed bank during the dry season in the year
following the 1999 fires. Species richness was not influenced by fire history (Figure
5.8a; Table 5.8). However species richness was significantly increased after soil
heating compared to untreated soil, and was significantly higher in the late dry season
compared to the early dry season.
No significant variation with fire treatment was detected for total seed bank density
(Figure 5.8b; Table 5.8). However, soil heating increased the total number of seedlings
that geminated from the seed bank, which was significantly higher in the late rather
than early dry season. There was a significant interaction between soil treatment and
the season of seed bank collection.
Seed bank densities in the dry season of 2000, and the statistical significance of
differences between treatments, of individual species and species groups are displayed
in Tables 5.8 and 5.9. The seed bank of I. hirsuta was denser in blocks burnt in the
early dry season fires of 1999 than blocks that remained unburnt. Conversely, the seed
bank density of subshrubs was significantly reduced by both early and late dry season
fires of 1999, while that of non-grasss monocots was lower in blocks burnt in late dry
season fires compared with the control blocks that remained unburnt in 1999.
141
Chapter 5. The effect of fire regime on soil seed bank dynamics.
0
5
10
15
20
Early Mid Late Early Mid Late Early Mid Late
Sp
ecie
s ri
chn
ess
(0.0
8m-2
) (a)
0
200
400
600
800
1000
Early Mid Late Early Mid Late Early Mid Late
Season
See
d d
ensi
ty (m
-2)
Control Early burnt Late burnt
(b)
Figure 5.8. Mean (± 1 standard error) (a) species richness and (b) total seed density of
germinable soil seed bank, collected in eucalypt savanna at Cape Cleveland, between
May and October 2000. Soil samples remained untreated (■); or were heated in an
oven at 85ºC for 45 minutes (■); or exposed to smoke at ambient temperature for 60
minutes (■). Early, soil collected in the early dry season, i.e. May; Mid, soil collected
in the mid dry season, i.e. July; Late, soil collected in the late dry season, i.e. October.
Control, sites last burnt in July 1997; Early burnt, sites burnt July 1997 and May 1999;
Late burnt, sites burnt July 1997 and October 1999.
142
Chapter 5. The effect of fire regime on soil seed bank dynamics.
Table 5.8. ANOVA results of fire treatment, soil treatment, and seasonal of collection in germinable soil seed bank collected in the year
following fire, between May and October 2000, at Cape Cleveland. Log, log (x + 1) transformation was used to rectify heterogeneity of
variances; F 2,12 indicates F value, denominator d.f., numerator d.f.; F values without an asterisk (*) are not significantly different at P >
0.01; *P < 0.01; **P < 0.001.; Early & Late, indicate seasons of collection used in analysis where data transformation did not resolve
variance heterogeneity for other seasons. non-parametric, the non-parametric Kruskal-Wallis ANOVA by ranks used for fire history and
soil treatment, and Friedman ANOVA by ranks for seasonal fluctuations, where variance heterogeneity could not be resolved by data.
Results from a Scheffe’s post hoc test (Mann-Whitney U-test for Kruskal-Wallis ANOVA and Wilcoxon matched pair test for Friedman
ANOVA) of significant differences between soil treatments and soil depths are provided. U, untreated soil; H, soil heated in oven at 85°C
for 45 minutes; S, exposure to smoke at ambient temperature for 30 minutes; W, wet season; E, early dry season; M, mid dry season; L,
late dry season. Species Group
Fire Soil Treatment
Season Fire x Soil Treatment
Fire x season Soil Treatment x Season
Fire x Soil Treatment x Season
Species richness F 2,18 = 1.452 F 2,18 = 8.267* H > U
F 2,36 =20.171** L > E
F 4,18 = 0.514 F 4,36 = 0.786 F 4,36 = 3.250 F 8,36 = 0.765
All species (n = 53) Early & Late
F 2,18 = 1.458 F 2,18 = 213.734** H > U
F 1,18 = 95.182** L > E
F 4,18 = 0.082 F 2,18 = 0.643 F 2,18 = 6.021** F 4,18 = 0.098
Native species (n = 40) Early & Late
F 2,18 = 0.546 F 2,18 = 10.255** H & S > U
F 1,18 = 86.145** L > E
F 4,18 = 0.091 F 2,18 = 0.018 F 2,18 = 4.873 F 4,18 = 0.374
Exotic species (n = 13) log
F 2,18 = 3.224 F 2,18 = 7.922* H > U
F 2,36 = 13.215** M & L > E
F 4,18 = 1.234 F 4,36 = 9.083** F 4,36 = 4.082* F 8,36 = 1.986
Subshrubs (n = 5) Early & Late
F 2,18 = 28.357** U > E & L
F 2,18 = 61.928** H > U & S
F 1,18 = 3.539 F 4,18 = 27.179** F 2,18 = 8.539* F 2,18 = 3.657 F 4,18 = 7.377**
Triumfetta rhomboidea Non-parametric
H 2,18 = 2.498 H 2,18 = 41.822** H > U & S
2 2,36 = 21.500** L > E
145
Chapter 5. The effect of fire regime on soil seed bank dynamics.
Table 5.8 (cont.) Species group
Fire Soil Treatment
Season Fire x Soil Treatment
Fire x season Soil Treatment x Season
Fire x Soil Treatment x Season
Uprightperennial forbs (n = 6)
F 2,18 = 0.866 F 2,18 = 9.085* S > U & H
F 2,36 = 6.302* L > E
F 4,18 = 0.338 F 4,36 = 0.721 F 4,36 = 1.266 F 8,36 = 0.337
Spermacoce brachystema
F 2,18 = 2.496 F 2,18 = 3.751
F 2,36 = 2.800 F 4,18 = 0.751 F 4,36 = 1.798 F 4,36 = 0.494 F 8,36 = 1.531
Twining perennial forbs (n = 12), log
F 2,18 = 2.305 F 2,18 = 15.887** H > U & S
F 2,36 = 2.760 F 4,18 = 2.374 F 4,36 = 0.451 F 4,36 = 0.453 F 8,36 = 0.318
Pycnospora lutescens Early & Late
F 2,18 = 0.390 F 2,18 = 9.197* H > U & S
F 1,18 = 0.000 F 4,18 = 0.396 F 2,18 = 0.733 F 2,18 = 0.419 F 8,36 = 0.262
Ephemeral forbs (n = 12) log
F 2,18 = 3.512 F 2,18 = 31.243** H > U & S
F 2,36 = 5.912* L > E
F 4,18 = 0.489 F 4,36 = 0.950
F 4,36 = 0.060 F 8,36 = 0.480
Indigofera hirsuta Log; Mid & Late
F 2,18 = 7.161* E > U
F 2,18 = 55.135** H > U & S
F 2,36 = 0.619 F 4,18 = 0.632 F 2,18 = 5.484 F 4,36 = 0.136 F 8,36 = 1.879
Grasses (n = 10) Early & Late
F 2,18 = 0.143 F 2,18 = 16.749** S > U & H
F 2,36 = 36.856** L > E
F 4,18 = 0.460 F 2,18 = 3.304 F 4,36 = 5.312 F 8,36 = 0.771
Digitaria breviglumis Non-parametirc
H 2,18 = 1.057 H 2,18 = 36.878** S > U & H
2 2,36 = 6.433
Heteropogon contortus Non-parametric
H 2,18 = 4.175 H 2,18 = 8.622
2 2,36 = 6.433
Heteropogon triticeus F 2,18 = 1.939 F 2,18 = 15.506** S > U & H
F 2,36 = 6.321* M > L
F 4,18 = 1.277 F 4,36 = 0.724 F 4,36 = 4.605* F 8,36 = 0.948
Non-grass monocots (n = 6)
F 2,18 = 13.167** U > L
F 2,18 = 0.205 F 2,36 = 31.443** L > E & M
F 4,18 = 0.518 F 4,36 = 5.573** F 4,36 = 0.617 F 8,36 = 0.890
Commelina spp Mid & Late
F = 4.657 P < 0.023
F = 3.909 P < 0.039
F 2,36 = 6.293 F 4,18 = 0.548
F 2,18 = 0.832 F 2,18 = 1.353 F 4,18 = 0.353
146
Chapter 5. The effect of fire regime on soil seed bank dynamics.
The germination of native species was significantly increased by both heating and
smoking treatments. The germination of subshrubs, the common subshrub, Triumfetta
rhomboidea, twining perennial forbs, the common twiner, Pycnospora lutescens,
ephemeral forbs and the common ephemeral I. hirsuta, was significantly increased by
heating compared to untreated soil and exposure to smoke. Exposure to smoke
significantly increased the germination of upright perennial forbs, grasses and the
common grasses, Digitaria breviglumis and H. triticeus, compared with heated and
untreated soil. A significant interaction between fire and soil treatment was
demonstrated for subshrubs, with the highest seed bank density detected in heated
samples collected from control blocks, which remained unburnt since 1997.
The seed bank density of natives, T. rhomboidea, upright perennial forbs, ephemeral
forbs, grasses was significantly greater during the late rather than early dry season. The
seed bank of exotic species was significantly greater in the mid and late, rather than
early dry season. The seed bank of H. triticeus was larger in the mid rather than late dry
season and that of the non-grass monocots was greater during the late dry season rather
than both early and mid dry seasons.
A significant interaction between fire and season of soil collection was demonstrated
for exotic species, subshrubs and non-grass monocots. Exotic species and H. triticeus
displayed a significant interaction between soil treatment and season of collection, with
exotic seed bank density was highest in late dry season samples that were heated, while
H. triticeus seed bank density was highest in mid dry season samples that were smoked.
Significant interactions were also detected between the combinations of all three factors
in the subshrub seed bank.
145
Chapter 5. The effect of fire regime on soil seed bank dynamics.
Table 5.9a. Mean (standard error) germinable soil seed bank density (m-2) collected
from control treatment (i.e. savanna last burnt in July 1997), at Cape Cleveland
between May and October 2000. The first letter of column headings denotes soil
treatment: U, untreated; H, heated; S, smoked. The second letter indicates season of
collection E, early dry season i.e. May; M, mid dry, i.e. July; L, late dry season, i.e.
October. Species group U & E U & M U & L H & E H & M H & L S & E S & M S & L All species (n = 53)
158.33 (27.33)
270.83 (54.17)
350.00 (73.24)
316.67 (65.09)
600.00 (61.66)
791.67 (133.92)
258.33 (48.05)
595.83 (11.02)
666.67 (79.17)
Native species (n = 40)
141.67 (18.16)
225.00 (47.32)
295.83 (77.17)
258.33 (84.27)
416.67 (54.17)
529.17 (72.65)
220.83 (42.29)
558.83 (4.17)
616.67 (85.49)
Exotic species (n = 13)
16.67 (11.02)
41.67 (16.67)
54.17 (30.05)
58.33 (20.83)
183.33 (11.02)
262.50 (64.15)
37.50 (7.22)
37.50 (14.43)
50.00 (7.22)
Woodland trees & shrubs (n = 2)
0.00 (0.00)
0.00 (0.00)
0.00 (0.00)
0.00 (0.00)
0.00 (0.00)
0.00 (0.00)
0.00 (0.00)
0.00 (0.00)
0.00 (0.00)
Subshrubs (n = 5)
4.17 (4.17)
0.00 (0.00)
20.83 (15.02)
33.33 (22.05)
137.50 (19.09)
241.67 (46.96)
0.00 (0.00)
8.33 (8.33)
12.50 (12.50)
Triumfetta rhomboidea
0.00 (0.00)
0.00 (0.00)
20.83 (15.02)
29.17 (18.16)
137.50 (19.09)
220.83 (44.10)
0.00 (0.00)
4.17 (4.17)
8.33 (8.33)
Upright perennial forbs (n = 6)
29.17 (18.16)
33.33 (20.83)
45.83 (29.17)
12.50 (7.22)
16.67 (11.02)
50.00 (21.65)
37.50 (19.09)
41.67 (8.33)
100.00 (14.43)
Spermacoce brachystema
29.17 (18.16)
1250 (12.50)
33.33 (22.05)
4.17 (4.17)
8.33 (4.17)
37.50 (21.65)
33.33 (18.16)
20.83 (4.17)
75.00 (7.22)
Twining perennial forbs (n = 12)
29.17 (8.33)
37.50 (12.50)
141.67 (23.20)
83.33 (34.11)
225.00 (59.07)
129.17 (58.33)
16.67 (11.02)
37.50 (12.50)
33.33 (27.32)
Pycnospora lutescens
8.33 (4.17)
4.17 (4.17)
0.00 (0.00)
37.50 (26.02)
158.33 (63.05)
41.67 (23.20)
0.00 (0.00)
8.33 (8.33)
8.33 (8.33)
Ephemeral forbs (n = 12)
8.33 (4.17)
12.50 (0.00)
20.83 (8.33)
75.00 (25.00)
133.33 (32.54)
154.17 (49.12)
16.67 (4.17)
20.83 (15.02)
29.17 (15.02)
Indigofera hirsuta 0.00 (0.00)
0.00 (0.00)
0.00 (0.00)
37.50 (14.43)
108.33 (29.17)
95.83 (32.54)
0.00 (0.00)
8.33 (8.33)
0.00 (0.00)
Grasses (n = 10)
83.33 (25.34)
125.00 (21.65)
141.67 (23.20)
87.50 (45.07)
62.50 (43.90)
70.83 (8.33)
187.50 (28.87)
441.67 (18.16)
358.33 (41.04)
Digitaria breviglumis
20.83 (8.33)
50.00 (25.00)
104.17 (22.05)
25.00 (19.09)
54.17 (48.05)
62.50 (0.00)
104.17 (11.02)
237.50 (50.52)
270.83 (20.83)
Heteropogon contortus
12.50 (7.22)
12.50 (12.50)
4.17 (4.17)
0.00 (0.00)
0.00 (0.00)
0.00 (0.00)
0.00 (0.00)
54.17 (48.05)
25.00 (25.00)
Heteropogon triticeus
45.83 (23.20)
54.17 (25.34)
25.00 (14.43)
37.50 (19.09)
4.17 (4.17)
4.17 (4.17)
62.50 (14.43)
141.67 (8.33)
54.17 (18.16)
Non-grass monocots (n = 6)
4.17 (4.17)
58.33 (11.02)
100.00 (12.50)
25.00 (19.09)
25.00 (0.00)
145.83 (43.50)
0.00 (0.00)
45.83 (4.17)
133.33 (22.05)
Commelina spp. 4.17 (4.17)
41.67 (4.17)
66.67 (25.34)
0.00 (0.00)
12.50 (7.22)
37.50 (19.09)
0.00 (0.00)
33.33 (11.02)
95.83 (36.32)
146
Chapter 5. The effect of fire regime on soil seed bank dynamics.
Table 5.9b. Mean (standard error) germinable soil seed bank density (m-2) collected
from early burnt savanna (last burnt in May 1999), at Cape Cleveland between May
and October 2000. The first letter of column headings denotes soil treatment: U,
untreated; H, heated; S, smoked. The second letter indicates season of collection E,
early dry season i.e. May; M, mid dry, i.e. July; L, late dry season, i.e. October. Species (group) U & E U & M U & L H & E H & M H & L S & E S & M S & L All species (n = 53)
170.83 (11.02)
208.33 (18.16)
320.83 (25.34)
308.33 (69.35)
437.50 (38.19)
675.00 (157.29)
254.17 (32.54)
558.33 (116.89)
545.83 (119.10)
Native species (n = 40)
137.50 (19.09)
175.00 (21.65)
300.00 (26.02)
195.83 (36.32)
420.83 (32.54)
587.50 (131.70)
212.50 (43.90)
520.83 (129.37)
520.83 (115.55)
Exotic species (n = 13)
33.33 (15.02)
33.33 (4.17)
20.83 (4.17)
112.50 (50.52)
16.67 (11.02)
87.50 (26.02)
41.67 (23.20)
37.50 (12.50)
25.00 (7.22)
Woodland trees & shrubs (n = 2)
0.00 (0.00)
0.00 (0.00)
0.00 (0.00)
0.00 (0.00)
0.00 (0.00)
8.33 (4.17)
0.00 (0.00)
0.00 (0.00)
8.33 (4.17)
Subshrubs (n = 5)
4.17 (4.17)
0.00 (0.00)
8.33 (8.33)
20.83 (11.02)
8.33 (4.17)
45.83 (22.05)
0.00 (0.00)
4.17 (4.17)
4.17 (4.17)
Triumfetta rhomboidea
0.00 (0.00)
0.00 (0.00)
4.17 (4.17)
20.83 (4.17)
33.33 (11.02)
33.33 (11.02)
0.00 (0.00)
4.17 (4.17)
4.17 (4.17)
Upright perennial forbs (n = 6)
25.00 (7.22)
29.17 (15.02)
58.33 (36.32)
8.33 (8.33)
8.33 (4.17)
20.83 (15.02)
20.83 (4.17)
75.00 (43.30)
79.17 (4.17)
Spermacoce brachystema
8.33 (4.17)
12.50 (7.22)
54.17 (32.54)
0.00 (0.00)
4.17 (4.17)
0.00 (0.00)
12.50 (7.22)
33.33 (18.16)
4.17 (4.17)
Twining perennial forbs (n = 12)
54.17 (15.02)
66.67 (30.05)
16.67 (4.17)
83.33 (15.02)
125.00 (54.49)
162.50 (64.15)
37.50 (31.46)
41.67 (30.05)
29.17 (8.33)
Pycnospora lutescens
12.50 (12.50)
16.57 (11.02)
8.33 (4.17)
45.83 (15.02)
37.50 (25.00)
58.33 (18.16)
4.17 (4.17)
8.33 (4.17)
12.50 (0.00)
Ephemeral forbs (n = 12)
33.33 (22.05)
20.83 (8.33)
33.33 (15.02)
108.33 (29.17)
212.50 (38.19)
254.17 (43.50)
20.83 (8.33)
29.17 (4.17)
75.00 (19.09)
Indigofera hirsuta 4.17 (4.17)
8.33 (8.33)
20.83 (4.17)
20.83 (11.02)
187.50 (38.19)
183.33 (41.04)
0.00 (0.00)
4.17 (4.17)
54.17 (29.17)
Grasses (n = 10)
50.00 (19.09)
54.17 (15.02)
112.50 (33.07)
83.33 (29.17)
58.33 (41.04)
154.17 (79.49)
170.83 (48.05)
387.50 (156.12)
279.17 (71.20)
Digitaria breviglumis
20.83 (4.17)
25.00 (7.22)
50.00 (12.50)
54.17 (25.34)
16.67 (11.02)
58.33 (23.20)
83.33 (35.60)
141.67 (46.40)
187.50 (43.30)
Heteropogon contortus
8.33 (8.33)
8.33 (4.17)
25.00 (19.09)
0.00 (0.00)
4.17 (4.17)
45.83 (39.75)
20.83 (15.02)
154.17 (72.29)
25.00 (14.43)
Heteropogon triticeus
16.67 (11.02)
16.67 (11.02)
29.17 (8.33)
4.17 (4.17)
33.33 (22.05)
33.33 (18.16)
54.17 (25.34)
91.67 (39.75)
33.33 (11.02)
Non-grass monocots (n = 6)
4.17 (4.17)
37.50 (19.09)
83.33 (40.05)
4.17 (4.17)
25.00 (7.22)
37.50 (26.02)
4.17 (4.17)
20.83 (8.33)
70.83 (39.75)
Commelina spp. 4.17 (4.17)
33.33 (20.83)
66.67 (32.54)
0.00 (0.00)
20.83 (8.33)
8.33 (4.17)
4.17 (4.17)
20.83 (8.33)
45.83 (34.11)
147
Chapter 5. The effect of fire regime on soil seed bank dynamics.
Table 5.9c. Mean (standard error) germinable soil seed bank density (m-2) collected
from late burnt savanna (last burnt in October 1999), at Cape Cleveland between May
and October 2000. The first letter of column headings denotes soil treatment: U,
untreated; H, heated; S, smoked. The second letter indicates season of collection E,
early dry season i.e. May; M, mid dry, i.e. July; L, late dry season, i.e. October. Species (group) U & E U & M U & L H & E H & M H & L S & E S & M S & L All species (n = 53)
129.17 (15.02)
208.17 (11.02)
275.00 (28.87)
229.17 (37.03)
483.33 (207.46)
670.83 (155.51)
154.17 (4.17)
704.17 (65.09)
558.33 (72.65)
Native species (n = 40)
125.00 (19.09)
158.33 (30.05)
254.17 (22.05)
200.00 (37.50)
412.50(188.75)
525.00 (131.30)
150.00 (7.22)
616.67 (51.20)
537.50 (76.03)
Exotic species (n = 13)
4.17 (4.17)
45.83 (20.83)
20.83 (8.33)
29.17 (11.02)
70.83 (29.17)
145.83 (35.60)
4.17 (4.17)
87.50 (19.09)
20.83 (4.17)
Woodland trees & shrubs (n = 2)
0.00 (0.00)
0.00 (0.00)
0.00 (0.00)
0.00 (0.00)
0.00 (0.00)
4.17 (4.17)
0.00 (0.00)
0.00 (0.00)
0.00 (0.00)
Subshrubs (n = 5)
4.17 (4.17)
4.17 (4.17)
0.00 (0.00)
20.83 (8.33)
8.33 (4.17)
50.00 (7.22)
4.17 (4.17)
0.00 (0.00)
8.33 (4.17)
Triumfetta rhomboidea
0.00 (0.00)
0.00 (0.00)
0.00 (0.00)
20.83 (8.33)
8.33 (4.17)
50.00 (7.22)
0.00 (0.00)
0.00 (0.00)
4.17 (4.17)
Upright perennial forbs (n = 6)
20.83 (15.02)
25.00 (12.50)
20.83 (4.17)
12.50 (7.22)
25.00 (12.50)
20.83 (15.02)
12.50 (7.22)
62.50 (19.09)
66.67 (36.32)
Spermacoce brachystema
20.83 (15.02)
4.17 (4.17)
4.17 (4.17)
4.17 (4.17)
12.50 (12.50)
4.17 (4.17)
12.50 (7.22)
29.17 (16.67)
33.33 (33.33)
Twining perennial forbs (n = 12)
4.17 (4.17)
20.83 (15.02)
8.33 (8.33)
70.83 (25.34)
145.83 (77.17)
112.50 (47.32)
20.83 (11.02)
45.83 (15.02)
16.67 (4.17)
Pycnospora lutescens
4.17 (4.17)
4.17 (4.17)
0.00 (0.00)
37.50 (21.65)
70.83 (39.75)
29.17 (18.16)
20.83 (11.02)
0.00 (0.00)
12.50 (7.22)
Ephemeral forbs (n = 12)
29.17 (15.02)
58.33 (18.16)
37.50 (7.22)
83.33 (39.75)
233.33 (109.29)
320.83 (121.26)
12.50 (7.22)
66.67 (15.02)
33.33 (20.83)
Indigofera hirsuta 8.3 (4.17)
12.50 (7.22)
4.17 (4.17)
33.33 (18.16)
170.83 (90.24)
191.67 (66.67)
0.00 (0.00)
8.33 (4.17)
8.33 (8.33)
Grasses (n = 10)
62.50 (12.50)
79.17 (15.02)
175.00 (28.87)
41.67 (23.20)
50.00 (26.02)
158.33 (39.75)
104.17(4.17)
520.83 (27.32)
391.67 (105.16)
Digitaria breviglumis
12.50 (0.00)
25.00 (7.22)
87.50 (19.09)
12.50 (0.00)
20.83 (11.02)
87.50 (19.09)
70.83 (11.02)
350.00 (68.84)
245.83 (37.03)
Heteropogon contortus
0.00 (0.00)
0.00 (0.00)
45.83 (34.11)
0.00 (0.00)
8.33 (8.33)
20.83 (11.02)
0.00 (0.00)
83.33 (22.05)
91.67 (68.21)
Heteropogon triticeus
37.50 (7.22)
41.67 (15.02)
25.00 (7.22)
12.50 (12.50)
8.33 (8.33)
8.33 (8.33)
25.00 (7.22)
83.33 (30.05)
37.50 (14.43)
Non-grass monocots (n = 6)
8.33 (4.17)
16.67 (11.02)
29.12 (15.02)
0.00 (0.00)
20.83 (11.02)
8.33 (4.17)
0.00 (0.00)
8.33 (8.33)
41.67 (18.67)
Commelina spp. 8.33 (4.17)
16.67 (11.02)
16.67 (11.02)
0.00 (0.00)
4.17 (4.17)
8.33 (4.17)
0.00 (0.00)
8.33 (8.33)
41.67 (18.16)
148
Chapter 5. The effect of fire regime on soil seed bank dynamics.
5.3.5 Phenology of seed production
The phenology of seed production was documented for 86 species at Cape Cleveland
(Table 5.10). Mature seed was produced, with seed subsequently dispersed, by
woodland trees and shrubs generally between the mid dry season to the wet season;
rainforest trees and shrubs, subshrubs and ephemeral forbs throughout the dry season;
and upright and twining perennial forbs, grasses and non-grass monocots throughout
the year. The month with the lowest number of species with mature seed was January,
with only 20 species, and was highest in May, when 52 species were recorded with
mature seeds. Seed production continued through the dry season, with 59% of the
species having begun seed production by the start of May, and 92% by the start of
October. This indicates seed accumulated through the dry season, so that the greatest
quantity of seed had been produced by the late dry season, as documented in the soil
seed bank study.
5.3.6 Comparison of seed bank composition with the standing vegetation
A total of 64 species were detected in the 288 soil seed bank samples, collected during
the wet season, early, mid and late dry seasons between July 1997 and October 2000
(Appendix 1). Fifty nine species (50% of total) detected in the 180 floristic surveys
between 1997 an 2001 (Chapter 3) were detected in the seed bank. An additional five
species were present in the seed bank, but not recorded during the floristic surveys,
although all five were observed in the standing vegetation at the Cape Cleveland site,
adjacent to survey plots. Therefore no additional species were detected in the soil seed
bank that were not present in the standing vegetation, while only half of the species in
the standing vegetation were detected in the seed bank.
The seed bank was dominated by herbaceous species, which represented 83% of the
species number, and 94% of the total seed bank abundance recorded in the 288
samples. No rainforest species, only two woodland trees and shrubs, and nine
subshrubs were detected in the germinable seed bank (Appendix 1). By comparison, in
the floristic surveys, herbaceous species represented 61% of total species number and
84% of the abundance in the floristic surveys (Chapter 3), indicating a greater
proportional representation of herbaceous species in the seed bank than standing
vegetation.
149
Chapter 5. The effect of fire regime on soil seed bank dynamics.
Table 5.10. Phenology of seed production of eucalypt savanna plants at Cape
Cleveland. Shading indicates months in which mature seed was present on plants.
Records collected between 1997 to 2001. J, January; F, February etc.; * exotic species.
Species J F M A M J J A S O N D Woodland trees and shrubs
Ephemeral forbs Chamaecrista absus* C. mimosioides Crotalaria brevis C. calycina C. goreensis* C. laburnifolia* C. lanceolata C. montana C. pallida* Emilia sonchifolia* Hyptis suaveolens* Indigofera hirsuta Polygala linariifolia Stylosanthes humilis* Tephrosia juncea
Chapter 5. The effect of fire regime on soil seed bank dynamics.
The PCA scatter plot indicated that the species composition in seed bank samples was
distinct to the composition in the floristic surveys (Figure 5.9). This distinction reflects
the higher species number per survey, and the greater consistency of species presence,
in the floristic surveys compared with seed bank samples. While 22 species occurred in
more than half of the 180 floristic surveys, only three species were recorded in more
than half of the 288 seed bank samples (Appendix 1). Most (84%) of the 64 species
detected in the seed bank occurred in a lower proportion of the seed bank samples than
floristic surveys. Digitaria breviglumis, which occurred in the greatest number of seed
bank samples (61%) was present in a higher percentage of the floristic surveys (94%).
Heteropogon triticeus, the species present in the most floristic surveys (97%), was
observed in only 58% of the seed banks samples. Ten species occurred in a higher
percentage of seed bank samples than floristic surveys, including the ephemeral forb I.
hirsuta, which was present in 57% of the seed bank samples and 48% of the floristic
surveys.
5.3.7 Fire effects on Corymbia clarksoniana seed production
The mean number of seeds per capsule of Corymbia clarksoniana was 5.0 (n = 30; s.e.
= 0.33). The late dry season fire of 1999 significantly reduced seed production (as
estimated by capsule density on the ground) in the following year, compared to unburnt
controls (H = 11.175; P < 0.004; Figure 5.10). Seed production in savanna burnt
during the early dry season fire was not significantly different from either unburnt or
late burnt sites.
2,447
152
Chapter 5. The effect of fire regime on soil seed bank dynamics.
PCA axis 1
PCA
axi
s 2
-1.0 +1.0
-1.0
+1.0
Figure 5.9. PCA scatter plot of species composition in the 288 soil seed bank samples
(■); and 180 floristic surveys (●).
153
Chapter 5. The effect of fire regime on soil seed bank dynamics.
m)
ty (
ns
d de
See
0
5
10
15
20
Control Early burnt Late burnt
Fire history
i-2 a
ab
b
Figure 5.10. Mean (± 1 standard error) seed production of Corymbia clarksoniana at
Cape Cleveland in December 2000, in savanna with different fire histories. Control, last
burnt in July 1997; Early burnt, last burnt in May 1999; Late burnt, last burnt October
1999. Columns with different superscripts are significantly different at P < 0.05.
5.4 Discussion
5.4.1 The effect of fire on the balance between dormant and active soil seed banks
The germination of several individual species and species groups was significantly
increased by exposure to heat shock or smoke, providing indirect evidence that fire
releases seed from dormancy, and increases the active fraction of the soil seed bank
(Tables 5.1, 5.3, 5.5 and 5.8). Heat shock significantly increased species richness of
germinants, total density of seedlings from the seed bank, and the density of native
species, exotic species, subshrubs, ephemeral and twining perennial forbs, and
Indigofera hirsuta, Pycnospora lutescens and Triumfetta rhomboidea seed banks.
Germination of grasses as a group, and the common grass Digitaria breviglumis, was
inhibited by heat shock. These data, documenting a heat shock response by I. hirsuta,
but not by Glycine tomentella, are consistent with the results of the laboratory
experiments on these two forbs (Chapter 4). Heat shock has proved effective in
promoting the germinable soil seed bank of a range of fire-prone communities across
Australia, demonstrating its value as a treatment for assessing soil seed bank
composition and importance in understanding seed dormancy mechanisms (e.g.
Warcup 1980; Hopkins and Graham 1984; Skull 1992; Enright et al. 1997; Williams
2000).
154
Chapter 5. The effect of fire regime on soil seed bank dynamics.
Exposure to smoke at ambient temperature significantly increased the germination of
native species, upright perennial forbs, grasses as a group and the common grasses D.
breviglumis and Heteropogon triticeus from the seed bank (Table 5.8). Smoke has been
reported to increase germination from the soil seed bank in a range of eucalypt
woodland flora, including grasses and forbs (Enright et al. 1997; Roche et al. 1998;
Lloyd et al. 2000; Read et al. 2000). In accordance with the laboratory experiment, no
evidence was found that smoke plays a role in seed dormancy release for the ten
legumes examined in Chapter 4.
The mid dry season fire of 1997 significantly increased the total density of the
untreated seed bank, as well as the density of natives, upright perennial forbs and the
common grass H. triticeus (Table 5.1). The late dry season fire of 1999 significantly
increased the density of seedlings emerging from the untreated seed bank overall, and
that of combined natives and upright perennial forbs (Table 5.7). Assessment of
seedlings emerging from the untreated seed bank samples documented the active seed
bank (Figure 5.1), plus seed with innate or enforced dormancy that was broken through
the process of soil collection and incubation in the shadehouse. As the soil collection
and incubation process was identical for samples from control, early burnt and late
burnt savanna, the significant increase in seedling density from untreated seed bank
collected after the mid dry season 1997, and late dry season 1999 fires provide direct
evidence that these fires broke seed dormancy of a range of species, thereby increasing
the active fraction of the soil seed bank. Odgers (1996) reported a similar stimulation of
the seed banks of forbs by a fire in a eucalypt woodland of south-eastern Queensland.
The early dry season fires of 1999 at Cape Cleveland did not significantly promote the
active fraction of the total seed bank or the seed bank of any species or groups (Table
5.7).
The germination of the upright perennial forbs and H. triticeus was promoted by smoke
rather than heat shock (Table 5.8) and therefore in addition to producing greater heat
penetration into the topsoil, late dry season fires may also expose a greater proportion
of the soil seed bank to smoke. Overall, these results indicate that several aspects of the
passage of fire including heat shock, smoke and elevated nitrate levels (Chapter 4)
155
Chapter 5. The effect of fire regime on soil seed bank dynamics.
combine to break seed dormancy of a range of savanna species, and that mid to late dry
season fires provide a greater dormancy release stimulus than early dry season fires.
5.4.2 Distribution of seed in the topsoil
The seed bank was more abundant at soil depths of between 3 and 40 mm than in the
surface 3 mm, indicating seed burial and incorporation within the topsoil occurs (Table
5.1). This may occur via a seed-based mechanism, such as the twisting action of
hygroscopic awns, or through the activities of fauna, especially ants (Tothill 1969;
Andrew and Mott 1983). The lower density of surface seed may also indicate greater
levels of mortality of seed exposed to the elements.
5.4.3 Seed bank composition and abundance
The seed bank density of eucalypt savanna at Cape Cleveland ranged from 50 to 792
seeds m-2 (for samples to 5 cm depth; Tables 5.4, 5.6 and 5.9), which is a low to
moderate density in comparison to other eucalypt communities across Australia (Table
5.11) and in comparison with several annual grasses that dominate the ground layer of
some Australian tropical savannas. For instance, seed bank density of the annual
grasses Sorghum intrans and Schizachyrium fragile have been observed at over 2000
seeds m-2 (Andrew 1986; Crowley and Garnett 1999). The seed bank density at Cape
Cleveland is also low in comparison with a tropical savanna located approximately 50
km to the south-west, which was cleared and over-sown with exotic annual grasses and
legumes, (McIvor 1987; Table 5.11). However, the bulk of seed in the tropical pasture
studied by McIvor (1987) was from a few, mainly exotic, species. The Cape Cleveland
seed bank contained 19 species common to McIvor’s (1987) study. He found that all of
these species produced average seed banks of [ 60 seeds m-2 and 14 species averaged
[10 seeds m-2. This suggests that the low to moderate seed bank density documented at
Cape Cleveland is typical of the tropical savannas in the region that have not been over-
sown with exotic pasture species.
156
Chapter 5. The effect of fire regime on soil seed bank dynamics.
157
Table 5.11. Response to soil treatments, total number of species, seed density and the most abundant growth form detected in germinable soil
seed bank studies undertaken in eucalypt communities across Australia. 1 McIvor (1987); 2 Hodgkinson et al. (1980), seed extraction used
rather than germination method; 3 Lunt (1997); 4 Read et al. (2000); 5 Clifford et al. (1996), data from 56 locations; 6 Melzer (1997); 7 Odgers
(1996); 8 Vlahos and Bell (1986); 9 Enright et al. (1997); 10 this study; 11 Wang (1997); 12 Drake (1979); 13 Williams (2000). Community Region Soil treatment
Late burnt 0.01 (0.01) x 0.19 (0.07) x 2.24 (0.32) y 0.56 (0.10) y
72.863**
125.831**
108.946**
33.011** E & L > C
Control 0.00 (0.00) a 0.05 (0.02) a 0.47 (0.12) b 0.90 (0.15) b Early burnt 0.00 (0.00) p
0.03 (0.02) p 1.79 (0.25) q 0.52 (0.09) r
Commelina spp.
Late burnt 0.01 (0.01) x 0.16 ( 0.06) x 2.01 (0.31) y 0.56 (0.10) z
73.539** 131.355** 94.578**
28.346** E & L > C
182
Chapter 6. The effect of fire regime on seedling emergence.
-2
0
5
10
15
Burnt Slashed Unburnt
Treatment
Seed
ling
dens
ity (m
)
b
a
a
(n = 50 n = 50 n = 450
Figure 6.1. Mean (± 1 standard error) seedling density of Corymbia clarksoniana in
eucalypt savanna in December 1999, at Cape Cleveland. Burnt, burnt two months prior
to survey; Slashed, grass was cut four months prior to survey; Unburnt, savanna that
was unburnt for 16 months at time of survey.
Seedling density of rainforest trees and shrubs was significantly higher in the late burnt
blocks following the 1999 fires. There were no significant differences in rainforest
seedlings between years in control and early burnt blocks, nor between the fire
treatments of 1999.
Subshrub seedlings were significantly more abundant in late burnt than unburnt control
blocks after the 1999 fire treatments. In the control blocks, subshrub seedlings were
more abundant in 2000 than in 1998, and there were no significant differences between
years in the early burnt blocks. Seedlings of the common subshrub Triumfetta
rhomboidea were significantly denser after late dry season fires than in unburnt blocks
in 1999. Triumfetta rhomboidea seedlings were more abundant in 1997 and 2000 in
control blocks, and in 1999 in late burnt blocks. There were no significant differences
between years in the early burnt blocks.
Both early and late dry season fires promoted seedling emergence of upright perennial
forbs over unburnt controls in 1999. No significant differences were detected between
years in control blocks, but seedling density of upright perennial forbs in 1999 was
significantly greater in both early and late burnt blocks than other years. Seedling
183
Chapter 6. The effect of fire regime on seedling emergence.
density of Hybanthus spp. (combined H. enneaspermus and H. stellarioides, which
were indistinguishable at the seedling stage) were not significantly different between
years in the control blocks, but seedling density in the early and late burnt blocks was
significantly higher after the 1999 fires than all other years. In 1999 the late dry season
fires promoted greater seedling density than occurred in the unburnt control blocks.
In 1999, the seedling density of twining perennial forbs was significantly greater in late
rather than early dry season burnt savanna, which in turn was significantly greater than
in unburnt savanna. No significant differences were detectable in seedling density
between years in control burnt blocks. However, a significantly higher seedling density
occurred in both early and late burnt blocks in 1999 than all other years, indicating the
1999 fires produced denser seedling emergence than the July 1997 fire. The seedling
density of the common twiner, Galactia tenuiflora, was significantly higher in 1999
than in other years in both the early and late dry season burnt blocks, but not
significantly different between years in control blocks, and a greater seedling density
was recorded after both early and late dry season fires than in unburnt savanna in 1999.
Seedlings of the common twiners Glycine tomentella, Passiflora foetida and
Pycnospora lutescens emerged at significantly higher density in 1999 in late burnt
savanna than in early burnt and unburnt savanna. Seedling density of G. tomentella was
not significantly different between years in control blocks, but in both early and late
burnt blocks, was highest following the 1999 fires. Seedlings of the exotic twiner
Passiflora foetida were significantly more abundant in 1999 than other years in both
early and late burnt blocks. Seedling density of Pycnospora lutescens was significantly
higher in 1998 than in 1997 in control blocks and in 1999 than 1997 in early burnt
blocks. In late burnt blocks, P. lutescens seedlings were significantly denser in 1999
than other years and in 1998 and 2000 compared to 1997, indicating poor recruitment
after the July 1997 fire.
Seedling density in 1999 of ephemeral forbs, and the common forb Indigofera hirsuta,
was significantly higher after late rather than early dry season fires, which produced
significantly greater recruitment than in unburnt savanna. For ephemeral forbs, and I.
hirsuta, significantly higher seedling density in control blocks was documented
following the 1997 fire than in other years. In early burnt blocks, a significantly higher
184
Chapter 6. The effect of fire regime on seedling emergence.
seedling density was recorded in after the 1997 fire than the 1999 fire, and more
seedlings were documented in both 1997 and 1999 than 1998 and 2000. In the late
burnt blocks, significantly more seedlings were detected in 1999 than 1997, and both
years contained significantly higher seedling densities than 1998 and 2000.
The common ephemeral forb Chamaecrista absus produced significantly more
seedlings in 1999 than 1998 in early burnt blocks, and in 1999 than other years in late
burnt blocks. Crotalaria pallida produced significantly more seedlings in late burnt
than unburnt blocks in 1999, and the 1999 fire produced significantly more seedlings
than the 1997 fire in late burnt blocks. Crotalaria pallida seedlings were more
abundant in 1999 than 1997 and 2000 in early burnt blocks. Seedling density of
Tephrosia juncea was significantly higher after early and late dry season fires than in
unburnt savanna in 1999. More seedling recruitment of T. juncea were recorded after
the 1997 fire than during other years in control blocks, and seedling emergence was
higher in 1997 and 1999 than 1998 and 2000 in both early and late burnt blocks.
Seedling density of grasses in 1999 was significantly greater in late than early dry
season burnt savanna, which in turn was greater than unburnt savanna. In control
blocks, significantly higher seedling density was recorded following the 1997 fire than
in other years. In early burnt blocks, significantly more grass seedlings emerged in
1997 than 1999, and greater numbers in 1999 than in 1998 and 2000. In late burnt
blocks, significantly more grass seedlings emerged following the 1999 fires than the
1997 fire, and greater densities were recorded in 1997 than in 1998 and 2000.
Seedlings of the common grass Heteropogon contortus were more abundant after late
dry season fires than those in the early dry season and in unburnt savanna in 1999. In
control and early burnt blocks, a significantly higher seedling density was recorded
following the 1997 fire than in other years. Significantly more seedlings of H. contortus
were detected in 1997 than in 1999, which in turn yielded more seedlings than 1998
and 2000, in both early and late burnt blocks.
Heteropogon triticeus produced significantly more seedlings in 1999 after late rather
than early dry season fires, and in early burnt than in unburnt savanna. In control
185
Chapter 6. The effect of fire regime on seedling emergence.
blocks, significantly more H. triticeus seedlings were documented following the 1997
fire than in other years. In early burnt blocks, significantly more seedlings were
recorded following the 1997 fire than the 1999 fires, with less again in 1998 and 2000.
In late burnt blocks, significantly more seedlings were recorded following the 1999
fires than the 1997 fire, and more in 1997 than in 1998 and 2000.
Seedling density of non-grass monocots in 1999 was significantly increased by both
early and late dry season fires over unburnt savanna. In control blocks, 1999 and 2000
contained significantly greater seedling density than 1997 and 1998. In both early and
late burnt blocks, significantly more seedlings were recorded in 1999 than in other
years. The seedling density of the common monocot Commelina spp. (combined C.
diffusa and C. ensifolia which were indistinguishable at the seedling stage) in 1999 was
more abundant after early and late dry season fires than in unburnt savanna.
Significantly more seedlings of Commelina spp. emerged in 1999 and 2000 than 1997
and 1998 in control blocks. In both early and late burnt blocks, significantly greater
numbers of seedlings were recorded in 1999 than 2000, and more in 2000 than in 1997
and 1998.
6.3.3 Species composition of seedling emergence surveys, soil seed bank samples and
floristic surveys
The four annual seedling surveys of the nine 1 ha blocks at Cape Cleveland, between
1997 and 2000 documented a total of 67 species, 12 of which were present in at least
half of the surveys (Appendix 1). Seventy six percent of the species documented in the
seedling surveys were common to the soil seed bank samples (Appendix 1). These
included all eight grasses, while none of the four rainforest seedling species were
detected in the soil seed bank. Eleven species that were documented within the soil
seed bank were absent from the seedling surveys, although all were uncommon,
producing < 0.5 % of the total seed bank density. Five seedling species were not
recorded within the floristic surveys but mature plants of each were observed at the
Cape Cleveland site, adjacent to floristic survey plots. This suggests germination
originated from seed produced on site and, for approximately one quarter of the
seedling species, germination originated from fresh, rather than stored seed.
186
Chapter 6. The effect of fire regime on seedling emergence.
Seedlings were detected for 20% of the woodland trees and shrubs recorded in the
floristic surveys, 22% of the rainforest trees and shrubs, 69% of the subshrubs, 88% of
the upright perennial forbs, 82% of the twining perennial forbs, 100% of the ephemeral
forbs, 50% of the grasses and 31% of the non-grass monocots (Appendix 1).
The relative abundance of native and exotic species remained fairly constant across the
floristic surveys, soil seed bank samples and seedling surveys. Only ephemeral forbs
and grasses were more common in the seedling surveys than in the floristic surveys and
soil seed bank samples. Woodland and rainforest trees and shrubs were most abundant
in the floristic surveys, and more abundant in the seedling surveys than the soil seed
bank samples.
The PCA scatter plot indicated that the species composition of seedling surveys was
related to both the floristic surveys and the soil seed bank (Figure 6.2). It positioned
points representing seedling surveys between those representing floristic surveys and
soil seed bank samples. Surveys of the same blocks did not tend to be grouped together
(i.e. the PCA symbols representing the seedling surveys of a certain block were usually
not adjacent to those representing floristic surveys or seed bank samples of that same
block). Twenty five (69%) seedling surveys were positioned nearest to a seed bank
sample and 11 (31%) were positioned closest to a floristic survey. This suggests species
composition of two thirds of the seedling surveys displayed a greater affinity with the
soil seed bank than the floristic surveys.
The 11 seedling surveys that were positioned closest to a floristic survey were the 11
most species diverse seedling surveys, and each contained species that were not
detected in the soil seed bank. Eight of these 11 seedling surveys (73%) were
undertaken in recently
187
Chapter 6. The effect of fire regime on seedling emergence.
PCA axis 1
PCA
axi
s 2
-1.0 +1.0
-1.0
+1.0
Figure 6.2. PCA scatter plot of species composition within floristic surveys ( ); soil
seed bank samples ( ); and seedling emergence surveys ( ) in eucalypt savanna at
Cape Cleveland.
burnt savanna, including all surveys after the early and late dry season fires of 1999.
The three surveys in unburnt savanna were undertaken in 1998 or 2000 and contained
common seedling species as well as several woody species that were absent (Cajanus
confertiflorus and Terminalia sericocarpa) from or rare (Breynia oblongifolia) in the
seed bank.
The three seedling surveys furthest within the cluster of seed bank samples were the
surveys undertaken in 2000 of the second control, early burnt and late burnt blocks.
They each contained well below average species richness, and species commonly
188
Chapter 6. The effect of fire regime on seedling emergence.
recorded in the seed bank samples, including Commelina spp., Digitaria breviglumis,
Galactia tenuiflora and Passiflora foetida.
6.3.4 Safe sites of Corymbia clarksoniana
Mean seed germination of Corymbia clarksoniana in the laboratory was 38% (standard
error = 7). The tetrazolium test found that a mean of 75% (standard error = 5) of the
seeds were viable, indicating that 51% of viable seeds germinated in the laboratory
within a fortnight of sowing.
Very limited seedling emergence was observed in the first experimental sowing of C.
clarksoniana seeds, where all seeds were placed on the soil surface (Figure 6.3).
Differences between treatments were not statistically significant (F 2,12; P > 0.05).
More seedlings emerged in the second experiment, particularly where seed was buried
in cut or burnt plots (Figure 6.4). While no seedlings emerged from the undisturbed
plots, differences between treatments were not statistically significant, because of inter-
plot variation within treatments (Table 6.3).
6.3.5 Total seedling emergence surveys at Cape Cleveland
The majority of seedlings emerged from the permanent 1m2 plots during November and
early December 1999 (Figure 6.5), which was the start of the 1999 wet season (Table
2.1). The highest rate of seedling emergence occurred in late burnt plots in the first
fortnight of November 1999, when an average of 55 new seedlings m-2 were recorded.
A minor germination event also occurred in the early burnt and early cut sites after
some rain during the first fortnight of September 1999.
The mean total seedling emergence and statistical significance of differences between
treatments are presented in Table 6.4. Species richness was significantly higher in early
and late burnt and cut treatments than in undisturbed savanna. Total seedling
emergence was significantly higher in late burnt plots, averaging 90 seedlings m-2, than
all other
189
Chapter 6. The effect of fire regime on seedling emergence.
0
2
4
6
8
10
Undisturbed Cut Burnt
Treatment
% E
mer
genc
e of
via
ble
seed
s
Figure 6.3. Mean (± 1 standard error) percentage seedling emergence of viable seeds of
Corymbia clarksoniana in eucalypt savanna at Cape Cleveland. Undisturbed, savanna
unburnt for three years; Cut, herbaceous layer cut and removed prior to sowing seeds in
savanna unburnt for three years; Burnt, savanna burnt prior to seed sowing. Treatments
were not significantly different at P > 0.05.
05
1015
202530
Undisturbed Cut Burnt
Treatment
%Em
erge
nce
of v
iabl
e se
eds
Figure 6.4. Mean (± 1 standard error) percentage seedling emergence of surface sown
( ) and buried ( ) viable seeds of Corymbia clarksoniana in eucalypt savanna at
Cape Cleveland. Seeds sown on the soil surface and buried to 5 mm in Undisturbed,
savanna unburnt for three years; Cut, unburnt savanna with the herbaceous layer cut
and removed prior to sowing seeds; Burnt, savanna burnt prior to seed sowing.
190
Chapter 6. The effect of fire regime on seedling emergence.
Table 6.3. Results of two-factor ANOVA of the effect of micro-site disturbance and
seed burial on seedling emergence of Corymbia clarksoniana in eucalypt savanna at
Cape Cleveland. F statistic, denominator d.f., numerator d.f..
Treatment F statistic P value
Micro-site disturbance F 2,12 = 2.822 > 0.05
Seed burial F 1,12 = 2.689 > 0.05
Disturbance x burial F 2,12 = 0.822 > 0.05
-2
0
10
20
30
40
50
60
Jun-
99
Jul-9
9
Aug
-99
Sep
-99
Oct
-99
Nov
-99
Dec
-99
Jan-
00
Feb-
00
Mar
-00
Apr
-00
May
-00
Month of survey
Seed
ling
dens
ity (m
)
Figure 6.5. Rate of seedling emergence in eucalypt savanna at Cape Cleveland in
savanna undisturbed since burning July 1997 ( ); savanna burnt early dry season
(May) 1999 ( ); savanna burnt late dry season (October) 1999 ( ); savanna unburnt
since July 1997, with herbaceous layer cut and removed in May 1999 (X); savanna
unburnt since July 1997 with herbaceous layer cut and removed in October 1999 (●).
Note that the 1999/2000 wet season rainfall began at the start of November, with 186
mm in that month (see Table 2.1).
191
Chapter 6. The effect of fire regime on seedling emergence.
Table 6.4. Mean (standard error) species richness and total seedling density (m-2), and Kruskal-Wallis ANOVA results, in undisturbed,
early burnt, late burnt, early cut and late cut plots at Cape Cleveland. Total seedling density includes the sum of seedling emergence
documented between May 1999 to May 2000 in undisturbed, early burnt and early cut plots; and between October 1999 and May 2000 in
late burnt and late cut plots. H statistic, denominator d.f., numerator d.f.; H statistics without an asterisk (*) are not significantly different
at P > 0.01; *P < 0.01; **P < 0.001. Species and goups Undisturbed
(n = 30) Early burnt (n = 30)
Late burnt (n = 30)
Early cut (n = 30)
Late cut (n = 30)
Kruskal-Wallis ANOVA H 4,145 =
Species richness 1.77 (0.24) a 7.83 (0.54) bc 8.63 (0.36) c 6.30 (0.45) b 6.87 (0.32) bc 76.859**All species (n = 49) 1.60 (0.61) a
37.00 (3.53) b 90.23 (11.41) c 31.57 (3.31) b 35.10 (4.09) b 96.063**Native species (n = 39) 2.40 (0.43) a 31.87 (3.36) b 79.80 (11.19) c 24.83 (3.20) b 25.00 (3.90) b 95.754**Exotic species (n = 10) 1.70 (0.49) a 5.13 (1.24) b 10.43 (1.37) c 6.73 (1.01) bc 10.10 (1.50) c 49.448**Rainforest trees and shrubs (n = 5) 0.03 (0.03) a 0.03 (0.03) a 0.03 (0.03) a 0.13 (0.10) a 0.03 (0.03) a 0.736Subshrubs (n = 4) 0.63 (0.40) a 0.87 (0.63) a 1.43 (0.50) ab 2.60 (0.72) b 1.87 (0.54) ab 18.912**Triumfetta rhomboidea 0.63 (0.41) a 0.73 (0.63) a 1.37 (0.49) ab 2.17 (0.58) b 1.80 (0.52) ab 22.756**Upright perennial forbs (n = 6) 0.13 (0.08) a 4.93 (1.84) b 4.63 (2.18) b 1.60 (0.50) b 2.50 (0.90) b 23.821**Hybanthus spp. 0.10 (0.07) a 3.30 (1.51) a 1.63 (0.73) a 0.90 (0.40) a 1.40 (0.48) a 11.529Spermacoce brachystema 0.03 (0.03) a 0.17 (0.84) a 2.50 (1.55) a 0.60 (0.33) a 1.07 (0.69) a 5.818Twining perennial forbs (n = 13) 1.37 (0.31) a 9.83 (1.62) bd 17.47 (3.05) c 7.27 (1.32) d 13.40 (1.77) bc 62.869**Galactia tenuiflora 0.27 (0.12) a 4.53 (1.34) b 2.37 (0.63) b 0.93 (0.30) ab 1.10 (0.34) ab 20.248**Glycine tomentella 0.00 (0.00) a 1.70 (0.50) b 5.17 (2.78) b 0.50 (0.21) ab 1.13 (0.36) b 24.020**Macroptilium atropurpureum 0.27 (0.10) a 0.27 (0.11) a 0.27 (0.13) a 0.40 (0.22) a 0.67 (0.26) a 1.546Passiflora foetida 0.73 (0.27) a 2.20 (0.56) ac 6.73 (1.08) b 3.30 (0.69) c 6.83 (1.29) bc 51.146**Pycnospora lutescens 0.10 (0.07) a 0.77 (0.39) a 1.77 (0.77) a 2.13 (0.96) a 3.17 (1.18) a 10.622Ephemeral forbs (n = 11) 0.13 (0.06) a 5.33 (0.80) bc 12.70 (2.45) c 3.00 (0.63) bd 2.33 (0.59) d 56.717**Crotalaria pallida 0.00 (0.00) a 1.00 (0.49) a 1.40 (0.60) a 0.10 (0.07) a 0.40 (0.21) a 11.737Indigofera hirsuta 0.03 (0.03) a 1.70 (0.44) b 8.37 c (1.93) 1.00 b (0.28) 1.23 b (0.54) 45.205** Tephrosia juncea 0.03 (0.03) a 1.23 (0.43) ab 1.83 (0.84) b 0.13 (0.08) ab 0.03 (0.03) a 18.868**Grasses (n = 6) 0.23 (0.20) a 11.77 (1.72) b 45.20 (10.65)c 8.83 (2.00) d 5.20 (0.93) d 91.262**Heteropogon contortus 0.00 (0.00) a 0.03 (0.03) ab 17.00 (10.18)b 1.27 (1.27) ab 0.07 (0.05) ab 19.411**H. triticeus 0.23 (0.20) a 11.07 (1.72) b 27.43 (3.13) c 7.40 (1.77) bd 4.97 (0.94) d 86.943 **Non-grass monocots (n = 4) 0.77 (0.20) a 4.23 (1.08) ab 8.87 (2.21) b 8.13 (2.23) b 9.77 (2.35) b 31.453**Commelina spp. 0.77 (0.20) a 4.07 (1.09) ab 8.70 (2.21) b 7.90 (2.24) b 9.53 (2.37) b 29.751**
192
Chapter 6. The effect of fire regime on seedling emergence.
treatments. The early burnt, early cut and late cut treatments produced significantly
more seedlings than undisturbed plots.
Total seedling emergence of native species was significantly less in undisturbed plots
than all other treatments. Late burnt plots contained significantly higher native seedling
densities than early burnt, early cut and late plots. Seedlings of exotic species were
more abundant in burnt and cut plots than undisturbed plots. Late burnt and early cut
plots contained significantly higher seedling densities of exotic species than early burnt
plots.
No seedlings of woodland trees and shrubs were observed within the plots. There were
no significant differences between seedling emergence of rainforest trees and shrubs
across the treatments. Total seedling emergence of subshrubs and the common
subshrub Triumfetta rhomboidea, was significantly higher in early cut than early burnt
plots.
All burnt and cut treatments produced significantly higher total seedling emergence of
upright perennial forbs than undisturbed savanna. No significant differences were
detected for the common upright perennial forbs Hybanthus spp. and Spermacoce
brachystema.
Seedling emergence of twining perennial forbs was significantly increased by burning
and cutting in both the early and late dry seasons. Late burning and cutting promoted
seedlings of twining perennial forbs over early cutting, while late burnt plots contained
significantly more seedlings than early burnt plots. No significant effects could be
detected for the common twiners Macroptilium atropurpureum and Pycnospora
lutescens. Early and late burnt plots contained significantly more seedlings of Galactia
tenuiflora than undisturbed plots. Early and late burning and late cutting enhanced
emergence of Glycine tomentella seedlings over undisturbed savanna. Passiflora
foetida seedlings were more abundant in late burnt and late cut plots than undisturbed
plots, and late burning promoted seedlings over early burning and cutting.
193
Chapter 6. The effect of fire regime on seedling emergence.
Total seedling emergence of ephemeral forbs was significantly lower in undisturbed
savanna than all other treatments. Burning during both the early and late dry seasons
promoted the emergence of ephemeral forb seedlings relative to late cutting, and late
burnt plots contained more seedlings than early cut plots. No significant differences
could be detected for the common ephemeral forb Crotalaria pallida. Indigofera
hirsuta seedlings were significantly more abundant after burning and cutting than in
undisturbed savanna, and late burnt plots contained more seedlings than early burnt,
and early and late cut plots. Tephrosia juncea seedlings were significantly more
abundant in late burnt than early burnt and early cut plots.
Total grass seedling emergence was significantly lower in undisturbed plots than all
other treatments. Early and late burning increased seedling emergence more than early
and late cutting. The common grass Heteropogon contortus produced significantly
more seedlings after late dry season fires than in undisturbed savanna. Significantly
more H. triticeus seedlings emerged from savanna burnt and cut in the early and late
dry seasons than in undisturbed savanna. Early and late burnt plots contained
significantly more seedlings than late cut, and late burnt more than early burnt and
early cut plots.
Seedling emergence of non-grass monocots, including Commelina spp., was
significantly greater in late burnt, and early and late cut plots than in undisturbed
savanna.
6.3.6 Total seedling emergence as a proportion of the soil seed bank
Up to 3% of the untreated soil seed bank collected in the mid dry season (July) of 1999,
emerged as seedlings between July and October 1999. A significantly higher proportion
of the seed bank emerged in the early burnt plots than in early cut plots, and in early cut
plots than in undisturbed plots (Figure 6.6a; H 4,10 = 7.261; P < 0.027).
Up to 14% of the untreated soil seed bank collected in the late dry season (October) of
1999, emerged as seedlings over the wet season (23rd October 1999 to 29th February
2000; Figure 6.6b). The percentage seedling emergence was significantly higher in late
burnt, early cut and late cut plots than undisturbed plots (Figure 6.6b; F 4,10 = 13.238;
194
Chapter 6. The effect of fire regime on seedling emergence.
01234
Undisturbed Early burnt Early cut
a
c
(a) b
05
101520
Undisturbed Early burnt Late burnt Early cut Late cut
a
ab
c bcbc
(b)
010203040
Undisturbed Early burnt Late burnt Early cut Late cut
Treatment
a
ab
ab b
ab
(c)
% S
eedl
ing
emer
genc
e
Figure 6.6. Mean (± 1 standard error) percentage seedling emergence of soil seed bank
at Cape Cleveland. (a) seedling emergence between 31 July and 23 October 1999 as a
percentage of untreated soil seed bank collected 31 July 1999; (b) seedling emergence
between 23 October 1999 and 29 February 2000 as a percentage of the untreated soil
seed bank collected 23 October 1999; (c) seedling emergence between 23 October 1999
and 29 February 2000 as a percentage of the decline in soil seed bank over the same
period. Undisturbed, savanna that was last burnt July 1997; Early burnt, savanna burnt
in July 1997 and May 1999; Late burnt, savanna burnt in July 1997 and October 1999;
Early cut, the herbaceous layer cut and removed in the early dry season (May) 1999,
from savanna that was last burnt July 1997; Late cut, the herbaceous layer cut and
removed in the late dry season (October) 1999, from savanna that was last burnt July
1997.
195
Chapter 6. The effect of fire regime on seedling emergence.
P < 0.001). Late burnt plots also had a higher percentage emergence than early burnt
plots.
Seedling emergence, as a percentage of the decline in the untreated soil seed bank over
the wet season (23rd October 1999 to 29th February 2000), was up to 20% (Figure
6.6c). It was significantly higher in the late cut than the undisturbed plots (F 4,10 =
4.112; P < 0.032).
6.4 Discussion
6.4.1 Seedling emergence surveys
Surveys of eucalypt savanna at four sites across the Townsville region indicated that
seedling emergence occurs primarily in the first year after fire (Tables 6.1 and 6.2). At
Mt Elliot, Castle Hill and Many Peaks Range, species richness of seedlings, total
seedling density and seedling density of native and exotic species, most growth form
groups and common species, were significantly higher in recently burnt than unburnt
savanna (Table 6.1). Woodland and rainforest trees and shrubs were the only growth
form groups that did not show not significantly enhanced seedling emergence following
fire, being observed at low densities in both burnt and unburnt sites. Four exotic
species, Crotalaria goreensis, Hyptis suaveolens, Stachytarpheta jamaicensis and
Triumfetta rhomboidea, the native twiner Rhynchosia minima and an unidentified
species of Fimbristylis, were the only common species that did not show a significant
response to fire. Seedling emergence of these species in unburnt savanna was high in
areas disturbed by feral pigs at one of the sites (Many Peaks Range). In this study, no
species or species groups produced seedlings in significantly higher densities in
unburnt compared to burnt savanna. This contrasts with patterns of seedling emergence
of some other tropical savanna species, including Eucalyptus miniata which recruits
seedlings at highest density in unburnt savanna (Setterfield 1997b). Annual grasses that
dominate many tropical eucalypt savannas, such as Schizachyrium spp. and Sorghum
spp., germinate in high densities in both burnt and unburnt savanna (Andrew and Mott
1983; Crowley and Garnett 1999).
Fire, especially late dry season fire, significantly increased the richness of seedling
species and the density of seedlings of most groups and common species at Cape
196
Chapter 6. The effect of fire regime on seedling emergence.
Cleveland (Table 6.2). A significant increase in seedling density by late dry season fires
over unburnt savanna was documented for native and exotic species, subshrubs, the
common subshrub Triumfetta rhomboidea, all herbaceous growth form groups, and the
common herbaceous species Crotalaria pallida, Galactia tenuiflora, Glycine
tomentella, Indigofera hirsuta, Heteropogon contortus, H. triticeus, Passiflora foetida,
Pycnospora lutescens and Tephrosia juncea. The late dry season fires also increased
seedling emergence compared with early dry season fires for native and exotic species,
twining perennial forbs, the common twiners Galactia tenuiflora, Glycine tomentella,
Passiflora foetida and Pycnospora lutescens, ephemeral forbs and the common
ephemeral Indigofera hirsuta, grasses, and the dominant grass Heteropogon triticeus.
The late dry season fires of 1999 produced significantly higher species richness and
higher seedling emergence than the 1997 mid dry season fire for native and exotic
species, subshrubs, Triumfetta rhomboidea, all herbaceous species groups, and the
common herbs Chamaecrista absus, Crotalaria pallida, Galactia tenuiflora, Glycine
of seedlings of the annual grass, Sorghum intrans, has provided evidence of significant
density-dependent effects on seedling growth and seed production, but not seedling
survival (Andrew 1986).
Established plants may compete with, or facilitate, seedling establishment. Survival of
Eucalyptus marginata seedlings is limited by competition with canopy trees (Stoneman
et al. 1994). Seedling survival of herbs in Victorian grassland is higher in gaps than
underneath Themeda triandra tussocks (Morgan 1998). Establishment of rainforest
seedlings in tropical savannas may be facilitated by established trees and shrubs
(Kellman 1985; Bowman and Fensham 1991). Noble (1980) documented both
competitive and facilitative interactions between tussock grasses and Eucalyptus
pauciflora seedlings. Competition from grass tussocks (Poa spp.) prevented the
survival of E. pauciflora seedlings within 4 cm of a tussock. However, grasses
provided some benefits to nearby seedlings, as the tallest E. pauciflora seedlings were
those closest to tussocks, but outside the 4 cm zone.
Seedling survival is often higher on burnt rather than unburnt ground (Pate et al. 1985;
Bradstock 1991). This may result from various factors, including enhanced nutrient and
light availability (Ashton and Chinner 1999) and reduced competition (Bond and van
Wilgen 1996). Herbivory from invertebrates can be reduced in recently burnt
communities (Whelan and Main 1979; Tozer and Bradstock 1997), while herbivory by
vertebrates can increase after burning, especially after small scale fires (Whelan 1995).
Seedling survival is affected by various aspects of fire. Fire interval is important
because seedlings of fire-killed species need to produce seed, and seedlings of
resprouting species need to develop the ability to survive the next fire. Variation in fire
210
Chapter 7. The effect of fire regime on seedling survival.
intensity may affect the ability of a seedling to survive the passage of fire and patchy
low intensity fires can enable the survival of seedlings in unburnt areas. Fire intensity
can influence the survival of seedlings that emerge following the fire, through its effect
on ground layer combustion and therefore micro-site environment (Keith 1996).
Fire season affects seedling survival through its relationship with fire intensity, and the
timing of fires with seasonal phases in plant resource allocation, seed abundance and
the post-fire climate (Whelan 1995). Early to mid wet season fires in tropical savannas
kill seedlings of annual Sorghum spp. before they set seed, causing population declines
(Stocker and Sturtz 1966; Lonsdale et al. 1998; Williams and Lane 1999). Baird (1977)
concluded that the greater seedling survival in eucalypt woodland after mid dry season
(i.e. summer) fires than early dry season fires (i.e. spring) in south-western Australia
was due to the limited rain following early dry season fires. In contrast, higher
mortality of Banksia seedlings was documented after late dry season fires (i.e. autumn)
than early dry season fires (i.e. spring) in Banksia woodland of south-western Australia
(Enright and Lamont 1989). They considered this was due to more safe sites provided
by early dry season fires, with the unconsumed leaf litter protecting seedlings from
desiccation.
Seedlings of obligate seeders often show higher percentage survival than seedlings of
associated sprouters (Pate et al. 1990; Benwell 1998). For sprouting species, the period
required to develop the capacity to tolerate fire is of equivalent functional importance
to the time required for seedlings of obligate seeders species to set seed (i.e. primary
juvenile period, Gill 1975; Keith 1996).
Fires, particularly those in the late dry season, promote seedling emergence in tropical
savannas of Townsville (Chapter 6). This chapter examines the effect of fire on
seedling survival. It assesses the survival of seedlings that emerged after early and late
dry season fires, as well as the survival of seedlings that recruited prior to burning.
Specific questions addressed are:
1. Is percentage survival higher for seedlings that emerged from recently burnt than
longer unburnt savanna?
211
Chapter 7. The effect of fire regime on seedling survival.
2. Is seedling survival enhanced by the removal of herbaceous cover?
3. Does the season of burning, or removal of herbaceous cover, influence the survival
of post-disturbance seedlings?
4. Can seedlings develop the capacity to survive fire within a year?
5. What is the effect of fire season on pre-fire seedlings?
6. Is there evidence of density-dependent seedling survival in this savanna?
7.2 Methods
7.2.1 Sampling methods
7.2.1a Survival of seedlings emerging from burnt, cut and undisturbed savanna
The 1m2 permanently marked plots that were established at Cape Cleveland in 1999 to
examine seedling emergence (Chapter 6), were used to assess the effects of burning,
and the removal of the herbaceous layer from unburnt savanna, in both the early and
late dry seasons, on the survival of seedlings. The treatments were:
1. Undisturbed; savanna that was last burnt in July 1997, and remained undisturbed.
2. Early burnt; savanna burnt in early dry season fires (May 1999).
3. Late burnt; savanna burnt in late dry season fires (October 1999).
4. Early cut; herbaceous layer cut and removed from unburnt plots in the early dry
season (May 1999), in savanna that was last burnt in July 1997.
5. Late cut; herbaceous layer cut and removed from unburnt plots in the late dry
season (October 1999), in savanna that was last burnt in July 1997.
Each treatment was represented by ten 1m2 plots in each of three 1 ha blocks at Cape
Cleveland, providing a total of 30, 1m2 plots for each of the five treatments (Chapter 6).
Seedlings that emerged between May 1999 (October 1999 for late burnt and late cut)
and May 2000, were tagged by placing fencing wire, that was twisted into various
shapes to distinguish common species, into the soil two or three centimetres from the
base of the seedlings (Chapter 6). The survival of tagged seedlings was examined for
survival in October 2001, two years after the late dry season fires. This provided data
on seedling survival for at least 18 months following germination of all seedlings and,
as most emerged in November and early December 1999 (Figure 6.5), it represents 23
months since the germination of most seedlings.
212
Chapter 7. The effect of fire regime on seedling survival.
7.2.1b Ability of seedlings to survive fire within one year of germination
Prior to burning along the fire break block (Figure 2.4) in September 1998, ten 1m2
plots were established to examine seedling emergence and survival in annually burnt
savanna. These plots document the ability of post-fire seedlings to tolerate a follow up
fire within one year of germination.
Random numbers were used to determine the distance of the 1m2 plots along the 700 m
length of the fire break block. Seedling emergence was assessed every month after the
September 1998 fire, and seedlings were tagged by placing fencing wire in the soil, two
or three centimetres from the base of the seedlings. The number of tagged seedlings
that sprouted after the May 1999 fire was assessed in August 1999, three months
following fire. No seedlings were simultaneously tagged in unburnt savanna, and
therefore no direct comparison can be drawn between survival in burnt and unburnt
savanna between September 1998 and August 1999. Conclusions from these data are
also limited by the assessment of only one burnt area, and it is possible that seedlings
which were alive three months after fire subsequently died before the onset of the wet
season in November. Nevertheless, the data are useful for documenting sprouting
capabilities of seedlings.
7.2.1c The effect of fire season on the survival of Corymbia clarksoniana seedlings that
emerged prior to fire
In November 1998, within one month of the mass seedling emergence of Corymbia
clarksoniana at Cape Cleveland, 50 seedlings were tagged in each of the nine, 1 ha
blocks (Figure 2.4). Seedlings were easily distinguished from established plants by the
presence of broad cotyledons. The seedlings examined were those that emerged along
the edges of the 100m2 plots used in the floristic surveys (Chapter 3) to allow ease of
relocation. In each of the nine, 1ha blocks, one of the four edges was randomly selected
from each of the four 100m2 plots for the examination of seedlings. Additional plot
edges were selected where needed. Seedlings were tagged by placing fencing wire in
the soil, two or three centimetres from the base of the seedlings and twisting the top of
the wire into a Z shape to identify as the location of a C. clarksoniana seedling in the
event of seedling mortality. The seedlings were assessed for survival, and heights
213
Chapter 7. The effect of fire regime on seedling survival.
measured, seven months (prior to the May 1999 fire), 19 months (May 2000) and 36
months (October 2001) after germination.
7.2.2 Statistical analyses
7.2.2a Survival of seedlings emerging from burnt, cut and undisturbed savanna
The influence of disturbance treatments on seedling survival was assessed using
percentage survival figures, as final seedling numbers varied with the density of
seedling emergence. The percentage survival of seedlings of each species was
calculated for each replicate 1m2 plot, by dividing the total number of seedlings that
emerged between May 1999 and May 2000 (Chapter 6), by the number surviving in
October 2001 and multiplying by 100. As the life span of the ephemeral species is less
than the period for which survival was assessed, the seedling emergence of ephemeral
species was not included in the calculation of overall percentage seedling survival. The
statistical significance of differences in percentage seedling survival between
undisturbed, early and late burnt and early and late cut savanna was assessed using a
one-factor ANOVA. Analyses were performed for total seedling survival, and that of
native and exotic species, the growth form groups defined in Chapter 3, and common
species with at least 5% of the surviving seedlings. As the overall seedling survival was
low, species with less than 5% of surviving seedlings were highly variable within
treatments and were not analysed.
The ten, 1m2 plots from each of the three replicate 1 ha blocks used in each treatment
were considered nested within the disturbance treatments (undisturbed, early or late
burnt, early or late cut). The nested plots were treated as random factors, with treatment
as a fixed factor. Where the variation between treatment replicates of separate blocks
was low
(P > 0.25) the plot replicates were pooled to increase the power of the ANOVA
(Underwood 1997).
Homogeneity of variance was assessed using Cochran’s test (Underwood 1997).
Variance heterogeneity was resolved for most species and species groups using arcsine
data transformation (Underwood 1997). Due to the large number of analyses, a
significance level of P < 0.01 was used to reduce the probability of incorrectly
214
Chapter 7. The effect of fire regime on seedling survival.
attributing a significant difference (i.e. alpha; Zar 1999). Where significant differences
were detected, a Scheffe’s post-hoc test was used to determine where differences lay
(Underwood 1997). Where data transformation did not resolve significant variance
heterogeneity, the non-parametric Kruskal-Wallis ANOVA by ranks was used, and a
Mann-Whitney U-test used as a post-hoc test with a Bonferroni adjustment of the
significance level for multiple comparisons (Sokal and Rohlf 1995).
The presence of density-dependent mortality was assessed using the total seedling
survival data. As variances were strongly heterogeneous, the non-parametric
Spearman’s rank correlation was used to assess a relationship between the density of
seedling emergence and the percentage seedling survival in each of undisturbed, early
burnt, late burnt, early cut and late cut plots (Sokal and Rohlf 1995). Seedling
emergence data for ephemeral species were not included in the calculation of
percentage seedling survival, as their life span is less than the period for which survival
was assessed. However, the seedling emergence density used in the correlation with
seedling survival did include ephemeral species, due to the role of all seedlings in
influencing density-dependent processes.
7.2.2b Ability of seedlings to survive fire within one year of germination
Seedling survival following the early dry season fire along the fire break block was
calculated for the four most common sprouter species that emerged between September
1998 and May 1999. In each of the 1m2 plots, percentage seedling survival was
calculated for the total numbers of seedlings that emerged between the September 1998
fire and the May 1999 fire. Percentage survival was also calculated for the number of
seedlings that were alive one week prior to the May 1999 fire. No comparative data
were collected for survival of these seedlings in unburnt savanna and therefore no
analyses of survival in burnt and unburnt were performed. Inter-species differences
were not analysed as the seedlings were tagged within the same plots and were not
independent of each other (Underwood 1997).
215
Chapter 7. The effect of fire regime on seedling survival.
7.2.2c The effect of fire season on the survival of pre-fire Corymbia clarksoniana
seedlings
The statistical significance of differences between seedling survival of Corymbia
clarksoniana in control, early and late dry season burnt blocks was compared using a
one-factor ANOVA. The intention was to perform a repeated measures ANOVA on the
percentage seedling survival at seven months (prior to the May 1999 fires), 19 and 36
months folowing germination. A Cochran’s test (Underwood 1997) indicated variance
heterogeneity for the 36 month survival data could not be resolved with data
transformations. Therefore a repeated measures ANOVA was performed on the
survival data at seven and 19 months, with a separate non-parametric Kruskal-Wallis
ANOVA by ranks used to assess significance of differences between fire treatments at
36 months after germination (Sokal and Rohlf 1995; Zar 1999).
To examine the statistical significance of differences in seedling heights between fire
treatments, an independent t-test was performed on the heights of seedlings surviving at
36 months in the control and early burnt blocks, as no seedlings remained in the late
burnt blocks (Zar 1999).
7.3 Results
7.3.1 Survival of seedlings emerging from burnt, cut and undisturbed savanna
The rainfall during the period of assessment was above average during the first year
(i.e. 2000) but below average during the second year following seedling emergence (i.e.
2001; Figure 2.2 and Table 2.1). Seedling emergence between May 1999 and May
2000 ranged from 1.6 seedlings m-2 in the undisturbed savanna to 90.2 seedlings m-2 in
the late burnt savanna (Table 6.4). An average of approximately four seedlings m-2
survived in late burnt and two seedlings m-2 in early dry season burnt savanna by
October 2001. Negligible seedlings survived in undisturbed (0.1m-2), early cut (0.8m-2)
and late dry season cut savanna (0.4m-2).
The percentage of species that survived until October 2001 in the 1m2 plots was
significantly higher in early and late dry season burnt savanna than in undisturbed and
late dry season cut savanna (F 4,145 = 218.13; P < 0.001; Figure 7.1a). Percentage
survival of species was also significantly higher in late dry season burnt than early dry
216
Chapter 7. The effect of fire regime on seedling survival.
season cut savanna. The percentage survival of all seedlings combined was
significantly higher in early and late dry season burnt savanna than in undisturbed and
early and late dry season cut savanna (F 4,10 = 8.26; P < 0.003; Figure 7.1b).
The mean percentage survival and statistical significance of species groups and
common species is presented in Table 7.1. The percentage survival of native seedlings
was significantly higher in early and late dry season burnt savanna than in undisturbed
and early and late dry season cut savanna. There were no significant differences
between treatments for exotic seedlings.
No seedlings of trees and shrubs, ephemerals or non-grass monocots were alive by
October 2001, at least 18 months after seedling emergence. A higher percentage of
subshrub seedlings survived in late dry season burnt savanna than undisturbed savanna.
There were no significant differences between treatments for the common subshrub
Triumfetta rhomboidea, which possessed the highest percentage seedling survival of
any individual species, at 19%.
There were no significant differences in percentage seedling survival between
treatments for the upright perennial forbs, grasses or the common grasses Heteropogon
contortus and H. triticeus; although there was significant variation in the survival of H.
triticeus seedlings between blocks, which suggests edaphic factors were influencing
survival.
217
Chapter 7. The effect of fire regime on seedling survival.
0
10
20
30
40
Undisturbed Early burnt Late burnt Early cut Late cut
a
c
bc
ab a
(a)
0
2
4
6
8
10
Undisturbed Early burnt Late burnt Early cut Late cut
Treatment
bb
a
a
a
(b)
% s
eedl
ing
surv
ival
Figure 7.1. Mean (± 1 standard error) percentage (a) species survival and (b) seedling
survival in October 2001, 18 to 24 months after seedling emergence in eucalypt
savanna at Cape Cleveland. Undisturbed, savanna unburnt since July 1997 and
remained undisturbed; Early burnt, savanna burnt early dry season (May) 1999; Late
burnt, savanna burnt late dry season (October) 1999; Early cut, savanna unburnt since
July 1997 with the herbaceous layer cut and removed in May 1999; Late cut, savanna
unburnt since July 1997 with the herbaceous layer cut and removed in October 1999.
Columns with the same superscript are not significantly different at P < 0.01.
218
Chapter 7. The effect of fire regime on seedling survival.
Table 7.1. Mean (standard error) percentage survival after at least 18 months, and ANOVA results, of seedlings of native and exotic species,
growth form groups and common species emerging from eucalypt savanna at Cape Cleveland. Undisturbed, savanna unburnt since July 1997
and remained undisturbed; Early burnt, savanna burnt early dry season (May) 1999; Late burnt, savanna burnt late dry season (October) 1999;
Early cut, savanna unburnt since July 1997 with the herbaceous layer cut and removed in May 1999; Late cut, savanna unburnt since July 1997
with the herbaceous layer cut and removed in October 1999. H 4,145, H value, denominator d.f., numerator d.f.; H values without an asterisk (*)
are not significantly different at P > 0.01; *P < 0.01; **P < 0.001. Arcsine, arcsine transformation before analysis to resolve heterogeneity of
variances; Pooled, blocks replicates pooled where P > 0.25. Block, a significant difference between blocks at P < 0.01. Means with the same
superscript are not significantly different at P < 0.01.
Control Early burnt Late burnt Early cut Late cut ANOVA results Native species (n = 11) 8.10 (5.72) a 15.83 (3.56) b 8.73 (1.35) b 4.77 (2.28) a 2.90 (0.96) a H 4,145 = 69.837** Exotic species (n = 2) 3.33 (3.33) a
8.28 (3.86) a 18.44 (3.56) a 5.85 (2.92) a 3.97 (0.28) a Arcsine F 4,145 = 4.005
Subshrubs (n = 2) 0.00 (0.00) a 6.67 (6.67) ab 18.52 (6.89) b 4.65 (2.39) ab 0.48 (0.48) ab Arcsine, Pooled F 4,145 = 4.687**
Triumfetta rhomboidea 0.00 (0.00) a 3.51 (3.33) a 18.61 (6.89) a 5.04 (2.47) a 0.48 (0.48) a H 4,145 = 12.713 Upright perennial forbs (n = 3)
0.00 (0.00) a 3.54 (3.33) a 3.39 (3.33) a 3.33 (3.33) a 1.67 (1.67) a H 4,145 = 2.391
Twining perennial forbs (n = 5)
2.50 (1.84) a 9.35 (2.00) ab 11.63 (2.06) b 1.31 (1.12) a 1.07 (0.52) a Pooled F 4,145 = 9.335**
Galactia tenuiflora 2.36 (2.36) ab 19.23 (5.99) b 14.57 (5.72) ab 3.85 (2.67) ab 0.00 (0.00) a H 4,145 = 20.572** Passiflora foetida 3.33 (3.33) a 7.44 (3.83) a 15.51 (3.56) b 0.26 (0.26) a 0.42 (0.42) a H 4,145 = 48.293** Grasses (n = 3) 0.56 (0.56) a 7.28 (1.86) a 5.45 (1.18) a 1.44 (0.78) a 3.64 (2.36) a Arcsine
F 4,145 = 4.590 Heteropogon contortus 0.00 (0.00) a 3.33 (3.33) a 7.44 (3.92) a 0.09 (0.09) a 6.67 (4.63) a F 4,145 = 1.710 H. triticeus 0.56 (0.56) a 7.50 (2.03) a 3.40 (0.96) a 1.35 (0.78) a 1.43 (0.93) a Block
F 4,145 = 1.520
219
Chapter 7. The effect of fire regime on seedling survival.
A significantly greater percentage of twining perennial forb seedlings survived in late
dry season burnt savanna than undisturbed savanna, and early and late dry season cut
plots. Seedling survival of the common twiner Galactia tenuiflora was significantly
higher in early dry season burnt than late dry season cut savanna. A significantly higher
percentage of Passiflora foetida seedlings survived in late dry season burnt savanna
than in all other treatments.
Evidence of density-dependent seedling mortality was detected in late burnt plots, with
a significant negative correlation between percentage seedling survival and density
(Figure 7.2). No significant correlation was found between seedling survival and
density for other treatments.
7.3.2 Ability of seedlings to survive fire within one year of germination
Half (56%) of the Galactia tenuiflora seedlings that were alive prior to the May 1999
fire had developed the ability to sprout after the early dry season fire, despite being less
than eight months old (Figure 7.3). The lowest seedling survival was of Corymbia
clarksoniana with survival of only 5% of the seedlings that were alive one week prior
to the fire. This represents only 1% of the total C. clarksoniana seedlings that emerged
between September 1998 and May 1999.
Survival of Heteropogon triticeus and Pycnospora lutescens seedlings that were alive
one week prior to the May 1999 fire was 38% for both species (Figure 7.3). The higher
pre-fire mortality of H. triticeus seedlings that emerged between September 1998 and
May 1999 meant that total seedling survival was lower than that of P. lutescens.
7.3.3 The effect of fire season on the survival of pre-fire Corymbia clarksoniana
seedlings
Only 5% of Corymbia clarksoniana seedlings survived in undisturbed savanna in
control blocks and no seedlings remained alive in late burnt blocks 36 months after
germination (Figure 7.4). No statistically significant differences were detected in
percentage seedling survival between fire treatments (Table 7.2). The inability to detect
a significant difference, even though no seedlings survived in late burnt savanna after
220
Chapter 7. The effect of fire regime on seedling survival.
0
10
20
30
40
0 5 10 15 20
R = 0.000 P > 0.010
(a)
0
10
20
30
40
0 50 100 150
R = 0.152 P > 0.010
(b)
0
10
20
30
40
0 100 200 300 400
R = -0.531 P < 0.003
(c)
0
10
20
30
40
0 50 100 150
R = 0.357P > 0.010
(d)
0
10
20
30
40
0 50 100 150
R = 0.310 P > 0.010
(e)
% s
eedl
ing
surv
ival
Seedling density (m-2)
Figure 7.2. Correlation between percentage seedling survival and seedling density for
(a) undisturbed savanna, unburnt since July 1997; (b), savanna burnt early dry season
(May) 1999; (c), savanna burnt late dry season (October) 1999; (d), savanna unburnt
since July 1997 with the herbaceous layer cut and removed in May 1999; (e), savanna
unburnt since July 1997 with the herbaceous layer cut and removed in October 1999.
Spearman’s rank coefficient R and P value indicated.
221
Chapter 7. The effect of fire regime on seedling survival.
0
20
40
60
80
Corymbiaclarksoniana
Galactiatenuiflora
Heteropogontriticeus
Pycnosporalutescens
Species
% s
eedl
ing
surv
ival
Figure 7.3. Mean (± 1 standard error) percentage survival of seedlings, less than eight
months old, following an early dry season fire (May 1999) in eucalypt savanna at Cape
Cleveland. Percentage survival calculated from the number of seedlings alive one week
prior to fire (■); percentage survival calculated from the total number of seedlings that
emerged between the September 1998 and May 1999 fires (■).
36 months, was probably a result of the variation in survival in unburnt savanna, where
one of the three replicate blocks possessed no seedling survival after 36 months.
However, a significant age effect was detected in the repeated measures ANOVA for
seven and 19 months since germination, indicating a significant decline in seedling
survival with time since establishment of cohort (Table 7.2). Eight percent of C.
clarksoniana seedlings that were alive in early burnt blocks prior to the May 1999 fires
sprouted following those burns, which is a similar percentage to that recorded for
seedlings tagged along the fire break block (Figure 7.3).
Growth of C. clarksoniana seedlings levelled off after 19 months, with no additional
height recorded by 36 months. The mean height of C. clarksoniana seedlings after 36
months was not significantly different between control and early burnt blocks (t 9 =
0.995; P > 0.05).
222
Chapter 7. The effect of fire regime on seedling survival.
0
20
40
60
7 19 36
% s
eed
ling
su
rviv
al
(a)
0
10
20
30
7 19 36
Age of seedlings (months)
See
dlin
g h
eig
ht (
cm) (b)
Figure 7.4. Mean (± 1 standard error) percentage (a) seedling survival and (b) seedling
height with age of Corymbia clarksoniana in eucalypt savanna at Cape Cleveland.
Savanna last burnt July 1997 (■); savanna burnt in the early dry season (May) 1999
(seven months after germination) and July 1997 (■); savanna burnt in the late dry
season (October) 1999 (11 months after germination) and July 1997 (■).
223
Chapter 7. The effect of fire regime on seedling survival.
Table 7.2. ANOVA results of fire season treatments on the survival of Corymbia
clarksoniana seedlings that emerged seven months prior to the early dry season fire. F
4,145, F or H value, denominator d.f., numerator d.f.
Analysis F or H Statistic P value
Repeated measures ANOVA
at seven and 19 months:
Fire F 2,6 = 2.184 > 0.05
Age of seedling F 1,6 = 55.051 < 0.001
Fire x Age F 2,6 = 0.459
> 0.05
Kruskal-Wallis ANOVA
at 36 months
H 2,6 = 4.300
> 0.05
7.4 Discussion
7.4.1 Survival of seedlings emerging from burnt, cut and undisturbed savanna
Seedlings that emerged after fire displayed a higher percentage survival than seedlings
in unburnt savanna (Figure 7.1). The number of species that survived was also highest
when seedlings emerged after fires, especially those of the late dry season. Seven
percent of seedlings survived in burnt savanna, which meant that by October 2001,
approximately two years after germination, four seedlings m-2 survived in late and two
in early dry season burnt savanna. Seedling establishment in unburnt savanna was
negligible.
Seven percent seedling survival after approximately two years in eucalypt savanna at
Cape Cleveland, with highest survival of an individual species at 19% for Triumfetta
rhomboidea, is low compared to that recorded in some other communities. For
instance, Abbott (1985) found seedling survival of Banksia grandis in Western
Australia ranged from 74 to 86% after two years and Vaughton (1998) found 91% of
Grevillea barklyana seedlings in coastal New South Wales were alive after two years.
In tropical savannas, survival to maturity of seedlings of the annual grasses Sorghum
intrans and S. stipoideum is 30 to 60% (Andrew and Mott 1983). Seedling survival in
Eucalyptus and Banksia dominated woodland of south-west Western Australia was
224
Chapter 7. The effect of fire regime on seedling survival.
15% in woodland, 2.5 years following fire (Whelan and Main 1979). Purdie and Slatyer
(1976) documented between three and 88%, and Clarke (in press) recorded between 0
and 25%, seedling survival after one year in temperate eucalypt woodlands in south-
eastern Australia.
Enhanced seedling survival after fire has been reported in shrubby and open eucalypt
woodlands and forests of south-eastern Australia (Purdie 1977; Bradstock 1991;
Ashton and Chinner 1999) and south-west Western Australia (Whelan and Main 1979;
Pate et al. 1985). The greater survival after fire may be a result of higher nutrient and
light availability, lower competition for resources and reduced herbivory (Whelan and
Main 1979; Noble 1980; Stoneman et al. 1994; Ashton and Chinner 1999). The similar
levels of seedling survival documented in undisturbed and cut savanna (Figure 7.1),
indicates competition for light soon after seedling emergence is probably not the
primary factor limiting seedling survival in the tropical savanna at Cape Cleveland, and
seedling herbivory, disease and competition for nutrients and moisture require
assessment. The mechanisms causing seedling mortality may differ between burnt and
unburnt areas. For instance, Tozer and Bradstock (1997) found herbivory was the
primary cause of seedling mortality in the absence of fire, and desiccation in burnt
sites.
Late dry season fires enhanced seedling survival over all other treatments for twining
perennial forbs and the common twiner, Passiflora foetida, while subshrubs displayed
significantly greater percentage survival in late burnt over undisturbed savanna, and
Galactia tenuiflora in early burnt over late cut savanna (Table 7.1). Seasonal
differences in seedling survival may result from variation in the post-fire climate (Baird
1977; Whelan 1995). All seedling emergence following late dry season fires occurred
during the wet season (Chapter 6), and therefore those seedlings received substantially
greater rain following emergence than the seedlings that emerged during the dry season
following early fires. Variation in seedling survival following different fire season may
also result from different micro-site environments. While late dry season fires produced
complete combustion of the herbaceous layer, some unconsumed grass stalks remained
after early dry season fires (Chapter 3), and this variation in herbaceous cover may
have influenced seedling survival, including the greater survival of G. tenuiflora in
225
Chapter 7. The effect of fire regime on seedling survival.
early burnt savanna. Leaf litter remaining unconsumed after fire can enhance seedling
survival of Banksia spp. of Western Australia (Enright and Lamont 1989) and
Eucalyptus obliqua in forests of south-eastern Australia (Facelli et al. 1999).
Evidence of density-dependent seedling mortality was found in late dry season burnt
savanna, which contained the highest density of seedling emergence (Figure 7.2). This
data suggests competition, herbivory and/or disease, may have a proportionately greater
influence on seedling mortality at the higher seedling densities that are only recorded
after late dry season fires. However, experimental manipulation of seedling density is
required to gain a better understanding of density-dependent processes operating in this
savanna.
Many seedlings, across all treatments, were observed to be in an advanced state of
wilting prior to death. This suggests competition for soil moisture was the primary
mechanism of seedling mortality, as identified in other communities (e.g. Baird 1977;
Lamont et al. 1993). However, disease and invertebrate damage to roots and stems may
also have caused wilting and therefore the cause of seedling mortality remains
unconfirmed.
7.4.2 Ability of seedlings to survive fire within one year of germination
Some seedlings of all four species examined along the fire break block survived the
early dry season fire in May 1999, although survival varied between 5% for Corymbia
clarksoniana and 56% for Galactia tenuiflora (Figure 7.3). While the extrapolation of
these data is limited because it documents only a single burnt area, the results indicate
seedlings of these common sprouting species are capable of surviving fire within a year
of germination. The ability of seedlings to rapidly develop a tolerance of fire is critical
for population persistence in frequently burnt communities (Keith 1996). The higher
survival in herbaceous species may reflect the differences between the dominating tree
C. clarksoniana and the herbs in plant longevity, with greater seedling survival, and
hence recruitment success, of shorter-lived herbaceous species that require more
regular replacement of individuals to maintain populations.
226
Chapter 7. The effect of fire regime on seedling survival.
The period required before seedlings develop the ability to survive fire varies between
species. For instance, in heathy woodlands of south-eastern Australia, seedlings of
Banksia serrata require approximately six years before they can sprout after fire and
those of Isopogon anemonifolius require around 13 years (Bradstock and Myerscough
1988). Seedlings of Allosyncarpia ternata, a rainforest tree of the Northern Territory,
develop the ability to sprout after approximately three years (Fordyce et al. 1997).
Seedlings of several common tropical savanna and rainforest trees can survive fire
within one year of germination, at least when initially raised in a shadehouse and
transplanted into the field (Williams 1998).
The ability of seedlings of fire-killed species to set seed before a subsequent fire is
functionally similar to the ability of seedlings of sprouting species to survive fire (Keith
1996). Seedlings of ephemeral species at Cape Cleveland were all observed to set seed
within a year (pers. obs.), whereas the tagged seedlings of perennial species did not set
seed during their first year, and only a few species, for example Pycnospora lutescens,
produced seed in their second year (pers. obs.). This suggests that seedlings of
sprouting species allocate more resources towards developing the ability to sprout after
fire than producing seed, while seedlings of ephemerals allocate more resources
towards seed production. Both strategies enable some population resilience to fires that
occur in the first year following germination. However, the low percentage of seedlings
that survive fire for some perennial species, such as C. clarksoniana, suggests
populations of sprouting, perennial species may be more sensitive to annual fires than
fire-killed, ephemeral species.
7.4.3 The effect of fire season on the survival of pre-fire Corymbia clarksoniana
seedlings
A minor number of Corymbia clarksoniana seedlings sprouted after late dry season
fires that occurred one year after germination, however no seedlings remained alive in
late burnt savanna three years after germination (Figure 7.4a). Five percent of seedlings
survived in unburnt savanna after three years, while one percent survived in savanna
burnt in the early dry season, six months after germination. While this suggests greater
survival for seedlings that remained unburnt for three years, differences between fire
treatments were not statistically significant due to variation within treatments (Table
227
Chapter 7. The effect of fire regime on seedling survival.
7.2). The variation in seedling survival within unburnt savanna suggests differences
with micro-site and further experimentation is required to examine the effect of fire on
seedling survival of C. clarksoniana. While the results of this study are not conclusive,
they provide some evidence that fire may enhance the number of safe sites, thus
increasing seedling density (Chapter 6), and that fire in the year following germination
reduces seedling survival.
The fire-sensitivity of C. clarksoniana corresponds with results of a study of
Eucalyptus miniata seedlings in tropical savanna of the Northern Territory by
Setterfield (1997b). She found seedling survival of E. miniata was significantly greater
in unburnt savanna, with 11% of seedlings alive after 1.5 years. No E. miniata
seedlings survived a late dry season fire within a year of germination. Three percent of
E. miniata seedlings initially sprouted after early dry season fires, but all subsequently
died the following month (Setterfield 1997b).
Low levels of seedling survival may be common among eucalypts. Fensham (1992)
found very low (< 5%) seedling survival of E. miniata and E. tetradonata seedlings in
unburnt tropical savanna. Seedling survival of eucalypts in southern Australia is also
typically low (i.e. < 10%) after two or three years (e.g. Withers 1978; Bowman and
Kirkpatrick 1986).
7.5 Conclusion
Seedling survival was higher for those seedlings that emerged in recently burnt rather
than unburnt savanna. The removal of the herbaceous cover in unburnt savanna did not
significantly increase seedling survival, suggesting aspects of fire other than the
removal of shade, such as enhanced nutrients or reduced invertebrate herbivory or
disease, are the primary factors promoting seedling survival. Some species displayed
variation in seedling survival between early and late dry season fires, which may have
resulted from differences in post-fire climate and micro-site environments. Only late
dry season fires promoted sufficient seedlings for density-dependent mortality to be
detected.
228
Chapter 7. The effect of fire regime on seedling survival.
229
Only four seedlings m-2 (of all species pooled) survived in late burnt, two seedlings m-2
survived in early burnt, and negligible numbers of seedlings survived in unburnt
savanna, approximately two years following germination. Further work is required to
determine the survival until maturity of ephemeral species. Data is also needed on the
density of established seedlings, and the frequency of recruitment, required to maintain
stable populations of savanna species. Details of the longevity of species, the primary
juvenile periods and how long it takes for seedlings of each species to develop the
capacity to sprout after fire are also required.
The density of soil seed banks in the eucalypt savanna at Cape Cleveland is low to
moderate and seedling emergence is correspondingly low to moderate compared with
other communities (Chapter 5 and 6). This chapter has demonstrated that seedling
survival is low compared with other species and communities. While 14% of the soil
seed bank emerged as seedlings after late dry season fires (Chapter 5) only 7% of
perennial seedlings were alive two years later. Together these data indicate that seed
supply, seedling emergence and seedling survival are all critical life events that limit
the recruitment of new plants.
Chapter 8 examines the effect of fire on the survival and growth of juveniles and
mature plants in eucalypt savanna at Cape Cleveland. It documents the fire response of
each species and assesses the influence of fire season on plant survival.
Chapter 8. The effect of fire regime on the survival and growth of juvenile and mature plants.
Chapter 8. The effect of fire regime on the survival and growth of
juveniles and mature plants.
FIREREGIME
Seed dormancy release
Floristic patterns
Seed bankdynamics
Seedlingemergence
Survival andgrowth ofjuveniles
Survival andgrowth of
mature plants
Seedling survival
230
Chapter 8. The effect of fire regime on the survival and growth of juvenile and mature plants.
8.1 Introduction Plant growth in Australian tropical savannas is linked with the seasonal patterns in
rainfall (Mott et al. 1985). Trees typically produce a flush of new leaves during the
transition between the end of the dry season and start of the wet season (Williams et al.
1997). The growth of tree girths occurs primarily during the wet season (Mucha 1979),
as does the growth of grasses and forbs (Andrew and Mott 1983; Mott et al. 1985).
Plant growth is limited by climate, competition for resources, disease, herbivory and
disturbance (Harper 1977). Soils of many Australian tropical savannas are low in
nutrients (Morgan et al. 2000; Jackson and Ash 2001). Competition for soil nutrients
limits the growth of the annual grasses Sorghum intrans and S. stipoideum that
dominate some savannas of northern Australia (Cook and Andrew 1991). Competition
for soil moisture during the annual dry season may also limit plant growth in tropical
savannas (Bowman 1988).
Herbaceous and woody species differ in life span. Through an assessment of seasonal
growth rings, Mucha (1979) suggested eucalypts of the Darwin region in the Northern
Territory occasionally reach 100 years in age. Fensham and Bowman (1992) pointed
out that this calculation did not include the years spent as stunted saplings, less than 2
m in height, which are described hereafter as “juveniles,” that may remain stunted for
decades. Perennial grasses of tropical savannas may live for approximately eight years,
or more, under low stock grazing pressure (Mott 1978; Mott et al. 1985). Species that
complete their life cycle in one or two years (ephemeral herbs) are also common in
Australian tropical savannas (Crowley and Garnett 1999; Russell-Smith et al. in press;
Chapter 3).
Fire is a frequent disturbance in tropical savannas (Walker 1985; Higgins et al. 2000).
The majority of woody species of tropical savannas are capable of sprouting after full
canopy scorch (Walker 1985; Williams et al. 1999b; Midgley and Bond 2001; Russell-
Smith et al. in press). Many perennial herbs of tropical savannas are also capable of
sprouting after fire (Shaw 1957; Mott and Andrew 1985). Sprouting can originate from
buds located below the soil at the base of the stem and along roots and rhizomes, and
for woody species, also epicormically from buds on branches and trunks (Gill 1981).
231
Chapter 8. The effect of fire regime on the survival and growth of juvenile and mature plants.
Re-growth from roots and rhizomes can provide stem multiplication and is common to
a range of herbs and woody species (e.g. Lacey 1974; Russell-Smith et al. in press).
The ability to sprout after fire can vary with life stage, or plant size, and the type of fire.
In tropical savannas, medium sized trees (20 to 30 cm diameter at breast height) show
greater survival through fires than larger and smaller trees (Williams et al. 1999b). For
many woody species, the ability to epicormically sprout from stems and branches is
only apparent in plants taller than approximately 1.5 to 2 m, with plants below this
height being reduced to sprouting from basal buds below the soil surface (Trollope
1996; Williams et al. 1999b). Frequent fires may therefore keep juvenile trees below 2
m in height, holding them within a “fire-trap” and maintaining an open savanna
structure (Midgley and Bond 2001). Suppression below 2 m in height of juveniles of
non-eucalypt trees has been documented in tropical savannas of northern Australia. Fire
intervals of at least two years are required to allow the growth of stunted juveniles of
some Acacia and broadleaf species, such as Gardenia megasperma (Bowman et al.
1988), and at least three years for the release of Melaleuca viridiflora juveniles from
the fire-trap (Crowley and Garnett 1998). Eucalypt juveniles do not always grow
rapidly beyond 2 m in height in the absence of fire, and a proportion may die-back to
ground level during the dry season (Prior et al. 1997). While stunted juveniles of
Eucalyptus tetrodonta have been documented to grow above the fire-trap in the absence
of fire, E. miniata juveniles can remain stunted with fire exclusion for two decades
(Fensham 1990; Bowman and Panton 1995; Russell-Smith et al. in press). Insect attack
on eucalypt juveniles can be severe, however, Fensham (1994) demonstrated herbivory
by insects is not the primary process that suppresses juveniles. Evidence has been
found that competition for resources with canopy trees is an important process
suppressing the growth of E. miniata juveniles (Fensham and Bowman 1992).
Frequent fires may exhaust a plant’s capacity to sprout, and the intensity and season of
fire may also affect survival (Keith 1996). High intensity, late dry season fires
significantly reduce the survival of trees in tropical savannas of the Northern Territory
(Williams et al. 1999b). Noble (1989) also reported higher survival of mallee eucalypts
after repeated early dry season (i.e. spring) rather than late dry season (i.e. autumn)
fires in New South Wales.
232
Chapter 8. The effect of fire regime on the survival and growth of juvenile and mature plants.
Variation in survival after fires of different intensities and seasons may be due to
differences in the survival of regenerative buds and/or the quantity of stored carbon
reserves (Bond and van Wilgen 1996). Bud survival depends on the location and
protection of buds, heat from the fire and residence time of flames (Whelan 1995).
Carbon reserves fluctuate seasonally and percentage survival is likely to be greatest
when stored reserves are high and while plants are dormant, or when there is sufficient
growing season following fire to allow replacement of reserves (Bond and van Wilgen
1996). The effect of fire season on plant recovery has been demonstrated on perennial
grasses, with poorest recovery after burning grasses during the growing season, while
culms are elongating (Tainton 1981, cited in Bond and van Wilgen 1996).
Vegetative survival through fire provides plant persistence and therefore stability of
populations in frequently burnt communities (Bond and Midgley 2001). The ability to
sprout after fire requires a trade-off in resource allocation, with sprouters allocating
fewer resources to seed production than non-sprouters (Bellingham and Sparrow 2000;
Bell 2001).
Fire may affect plant growth through its impact on soil nutrient dynamics, damage to
buds and depletion of plant reserves (Whelan 1995). The basal area of trees at the
Kapalga research station in the Northern Territory remained stable over five years with
fire exclusion and annual early dry season burning, but declined with annual late dry
season fires, primarily as a result of stem mortality (Williams et al. in press). Overall
basal area of trees at nearby Munmarlary increased over 21 years in annually and
biennially burnt savanna, and particularly in unburnt savanna (Russell-Smith et al. in
press). The greatest increase in basal area of Eucalyptus miniata trees at Munmarlary
occurred in savanna burnt annually in the early dry season, while no change in basal
area was recorded for E. tetrodonta (Russell-Smith et al. in press).
In dry sclerophyll forest of south-eastern Queensland, annual burning in the mid dry
season for 44 years produced no effect on the growth rates of Eucalyptus acmenoides
and E. drepanophylla, but enhanced the growth of E. tereticornis in comparison to
unburnt forest (Guinto et al. 1999). In an associated wet sclerophyll forest, fire
intervals of two to three years, with low fire intensities (< 500 kWm-1) enhanced the
233
Chapter 8. The effect of fire regime on the survival and growth of juvenile and mature plants.
growth of Lophostemon confertus but inhibited growth of Syncarpia glomulifera,
compared to unburnt forest (Guinto et al. 1999).
Chapter 3 documented community resilience to a series of fires in eucalypt savanna at
Cape Cleveland. Population persistence in a frequently burnt savanna can be provided
by vegetative survival and/or seedling recruitment. Chapters 4 to 7 examined seedling
recruitment, which was most abundant for herbaceous rather than woody species, and
occurred primarily after fire. This chapter examines vegetative survival and growth to
complete the assessment of mechanisms that can provide resilience to species
composition in a frequently burnt savanna. The ability of species to survive fire is
documented, and a quantitative assessment of survival during fire is made for juvenile
and mature individuals of common species.
Specific questions addressed are:
1. Which species are capable of sprouting after fire and is fire response consistent
across eucalypt savanna sites of the Townsville region?
2. What is the effect of fire season and time since fire on the survival and growth of
juveniles and mature individuals of common tree species?
3. Does the density of sprouting stems differ after burning and cutting, and with
season of disturbance?
4. Does the percentage survival of common herbs vary with burning and cutting in the
early and late dry seasons?
8.2 Methods
8.2.1 Sampling
8.2.1a Regenerative capacity of savanna species
The ability of plants to sprout after fire was documented following burns at Cape
Cleveland, Mt Elliot, Many Peaks Range and Castle Hill (Figure 2.1). Sprouting stems
originating from below the soil surface were distinguished from seedlings by the
attachment of shoots to a burnt stem, thickened bases or roots. Documentation of plant
regeneration followed Gill and Bradstock’s (1992) classification, and only species that
were fully scorched in fires were included in the assessment.
234
Chapter 8. The effect of fire regime on the survival and growth of juvenile and mature plants.
8.2.1b Survival and growth of trees
To assess the effect of fire on tree survival, the number of trees > 2m in height was
counted in each of the 36, permanently marked 100m2 plots at Cape Cleveland
(Chapter 3) in March to May, in each of 1997 to 2001. The circumference at breast
height of trees was recorded in each annual survey from 1998 to 2001, to assess the
influence of fire on tree basal area.
8.2.1c Survival and growth of Corymbia clarksoniana juveniles
Survival and growth of Corymbia clarksoniana juveniles (defined as individuals < 2m
in height) were compared between unburnt, early (May 1999) and late dry season
(October 1999) burnt savanna. Heights were recorded for all C. clarksoniana juveniles
within the 36, 100m2 plots at Cape Cleveland in March to May 1999, prior to the
implementation of the early dry season fires. The juveniles were tagged and re-
measured at the same time of year in 2000 and 2001.
8.2.1d Stem regeneration after burning and cutting in the early and late dry seasons
An assessment was made of the effect of different disturbances (burning and cutting)
and the season of disturbance (early and late dry seasons), on the number of sprouting
stems of the common subshrub, Breynia oblongifolia. This shrub was assessed because
of its capacity to regenerate from root-suckers, hence its value for assessing the effect
of fire on vegetative regeneration. The permanent 1m2 plots used to document total
seedling emergence (Chapter 6) were used to assess the effects of disturbance type and
season of disturbance on stem survival and growth. The experiment assessed the
impacts of a single set of fires or cutting treatments. These were:
1. Undisturbed; savanna that was last burnt in July 1997 and remained undisturbed.
2. Early burnt; savanna burnt in early dry season fires (May 1999).
3. Late burnt; savanna burnt in late dry season fires (October 1999).
4. Early cut; herbaceous layer cut and removed from unburnt plots at the time of early
dry season fires, in savanna that was last burnt in July 1997.
5. Late cut; herbaceous layer cut and removed from unburnt plots at the time of late
dry season fires, in savanna that was last burnt in July 1997.
235
Chapter 8. The effect of fire regime on the survival and growth of juvenile and mature plants.
Prior to the implementation of burning and cutting treatments in May 1999 and October
1999, the number of B. oblongifolia stems was recorded within the permanent 1m2
plots. The number of surviving stems were recorded in May 2000.
8.2.1e Survival of mature herbs
An assessment was made of the effect of burning and cutting, in the early and late dry
seasons, on the percentage survival of common grasses and forbs. The permanent 1m2
plots established to document total seedling emergence (Chapter 6) were used to assess
the effects of disturbance type and season of disturbance on stem survival and growth.
The five treatments are outlined above in section 8.2.1d. Assessments were made when
the plots were established in May and October 1999, and survival was re-surveyed one
month after the early and late dry season fires.
Density counts of common grasses and forbs were attempted when the 1m2 plots were
established. However, the density of plants could not be calculated accurately due to
the multiple stems of many common forbs, and the clumping nature of grasses. Post-
disturbance assessments indicated that pre-fire counts were inaccurate (i.e. two or three
distinct clumps sprouted where a pre-treatment count documented a single clump). In
the case of Heteropogon triticeus, not only were pre-fire clumps difficult to count, but
post-fire re-growth emerged from several distinct sections of individual clumps,
making distinction and therefore estimating post-fire density inaccurate.
As a result of the inaccuracies of density measurements, the assessment of plant
survival was based on the presence or absence of a species within a 1m2 plot, pre- and
post-treatment. A percentage survival figure was calculated for each of the three
replicate 1 ha blocks, based on the percentage of 1m2 plots in which a species remained
present. This is less sensitive to changes in plant density than counts of individual
plants and, depending on the number of plants per plot, may lead to an over- or
underestimate of percentage survival.
236
Chapter 8. The effect of fire regime on the survival and growth of juvenile and mature plants.
8.2.2 Statistical analyses
8.2.2a Regenerative capacity of savanna species
Records of post-fire regeneration of all species encountered were tabulated.
Observations from the four savanna sites across Townsville were listed separately to
provide confirmation of regenerative capabilities across the region. No quantitative data
were collected and therefore no statistical analyses were performed.
8.2.2b Survival and growth of trees
The influence of fire treatments on the density and basal area of trees (> 2m in height)
was analysed for combined tree species and the four most abundant species, as other
species were present at very low densities. A repeated measures ANOVA was
performed for fire treatment, with three levels (control, early burnt and late burnt) and
year of survey as the repeated measure. The repeated measure factor “year” contained
five levels (1997 to 2001) for the tree density analyses and four levels (1998 to 2001)
for basal area analyses, as circumference measurements were only available from 1998
to 2001. Due to the small number of trees within each of the 100m2 plots, data from the
four 100m2 plots were pooled for each replicate 1 ha per block to reduce variance.
8.2.2c Survival and growth of Corymbia clarksoniana juveniles
The influence of fire regime on the growth and survival of C. clarksoniana juveniles
was assessed using a one-factor ANOVA to test the statistical significance of
differences in survival and heights of juveniles with time since last fire. The differences
in survival and heights of juveniles between fire treatments (control, early and late
burnt) was assessed using a repeated measures ANOVA, with the repeated measure
factor “year” containing three levels (1999 to 2001). Individuals that were < 2 m in
height during the initial 1999 survey that grew > 2 m by 2001 remained in the analyses
to ensure accuracy in assessment of the changes in survival and height.
8.2.2d Stem regeneration after burning and cutting in the early and late dry seasons
The statistical significance of differences in the number of B. oblongifolia stems
between treatments (undisturbed, early and late burnt, early and late cut) was assessed
using a one-factor analysis of co-variance (ANCOVA) of the final survey data
237
Chapter 8. The effect of fire regime on the survival and growth of juvenile and mature plants.
collected in May 2000, using the initial stem density data collected in 1999 as a
covariate.
8.2.2e Survival of mature herbs
A one-factor ANOVA was initially used for determining the statistical significance of
differences in percentage survival following treatments (undisturbed, early and late
burnt, early and late cut) for each of the five most common herbs. However a
Cochran’s test (Underwood 1997) indicated significant variance heterogeneity could
not be resolved with data transformations. Therefore a non-parametric Kruskal-Wallis
ANOVA by ranks was used to test the statistical significance of differences between
treatments for each species.
8.3 Results
8.3.1 Regenerative capacity of savanna species
Post-fire regeneration observations were documented for a total of 160 species
(Appendix 2). Eighty one percent (130 species) were observed to sprout after fires in
Townsville eucalypt savannas and fire response for individual species was consistent
between sites.
While nearly all trees and shrubs were consistently able to sprout after fire (Table 8.1;
Appendix 2), the ability to sprout from epicormic rather than basal buds was restricted
to the eucalypts, Canarium australianum and Planchonia careya. The ability to
epicormically sprout was size-dependent, with epicormic sprouting of eucalypts and
Planchonia careya only observed for plants greater than 1.5 m to 2 m in height. The
tallest Canarium australianum tree, of 8 m in height, was also able to epicormically
sprout after full canopy scorch during both the July 1997 and October 1999 fires, while
all other C. australianum plants sprouted from the stem base.
Obligate seeders were primarily ephemeral forbs that were observed to produce seed
within one year of germination (Table 8.1; Appendix 2). Obligate seeder perennials
were the shrubs Acacia holosericea and A. umbellata, the twining forb Cassytha
filiformis and the subshrubs Triumfetta rhomboidea and Urena lobata. A single Vitex
trifolia shrub present at Cape Cleveland was killed by the 1997 fire and until further
observations are made, it must be assumed to be an obligate seeder. Acacia umbellata,
238
Chapter 8. The effect of fire regime on the survival and growth of juvenile and mature plants.
Cassthya filiformis, Triumfetta rhomboidea and Urena lobata produce seed in the
second year after germination, but the juvenile period of A. holosericea and V. trifolia
are unknown.
Table 8.1. Summary of post-fire regeneration of growth form groups in eucalypt
savanna in the vicinity of Townsville.
Growth form group Number of
species
% sprouters % obligate
seeders
% sprouting
ability unknown
Woodland trees and shrubs 32 91 9 0
Rainforest trees and shrubs 20 95 0 5
Subshrubs 15 93 0 7
Upright perennial forbs 14 93 0 7
Twining perennial forbs 26 100 0 0
Ephemeral forbs 20 0 100 0
Grasses 18 89 11 0
Non-grass monocots 15 100 0 0
8.3.2 Survival and growth of trees
The density of all trees (> 2m in height) increased between 1997 and 2001 with a
significant interaction between fire and year (Table 8.2; Figure 8.1). Tree density
increased in control sites, unburnt since 1997, but declined in late burnt sites after the
October 1999 fire. Although Canarium australianum and Corymbia tessellaris
displayed slight increases in tree density in control sites, and a Corymbia tessellaris
tree was killed in a late dry season fire, no statistically significant differences between
fire treatments, or year of survey, were found for any of the four most abundant trees
over the five years of investigation (Table 8.2; Figure 8.1).
239
Chapter 8. The effect of fire regime on the survival and growth of juvenile and mature plants.
Table 8.2. Repeated measures ANOVA results for the effect of fire on the density of all
trees (> 2m height) and the four most abundant trees, between 1997 to 2001 at Cape
Cleveland. No Canarium australianum trees > 2m in height were present in early burnt
blocks, hence analyses were restricted to comparisons of control and late burnt blocks.
F 2,6, F value, denominator d.f., numerator d.f.; F values without an asterisk (*) are not
significantly different at P > 0.05; *P < 0.05; **P < 0.01. Scheffe’s post-hoc test
results are provided for differences between years. Species Fire Year Fire x Year
Combined trees
(n = 10 species; 199 plants)
F 2, 6 = 3.131 F 4, 24 = 4.929**
(2001 > 1997 & 1998)
F 8, 24 = 2.507*
Canarium australianum (n = 16 plants) F 1, 4 = 2.896 F 4, 16 = 2.804 F 4,16 = 2.804
Corymbia clarksoniana (n = 61 plants) F 2, 6 = 0.138 F 4, 24 = 1.758 F 8, 24 = 1.030
Corymbia tessellaris (n = 25 plants) F 2, 6 = 0.311 F 4, 24 = 1.714 F 8, 24 = 0.643
Planchonia careya (n = 60 plants) F 2, 6 = 1.333 F 4, 24 = 0.000 F 8, 24 = 1.500
There were no significant fire effects on tree basal area (Figure 8.2; Table 8.3), even
though tree density differed between fire treatments (Table 8.2). This is because the
increase in tree density resulted from the growth of saplings above the 2 m height,
which added little to the overall basal area compared to the larger trees. The basal area
of the dominant tree Corymbia clarksoniana significantly increased over the course of
the study (Figure 8.2; Table 8.3). No other statistically significant differences in basal
area were detected for the four most abundant trees, despite the decline in basal area in
C. tessellaris in late burnt sites in 2000 and 2001 due to the death of a large tree in a
late dry season fire.
240
Chapter 8. The effect of fire regime on the survival and growth of juvenile and mature plants.
0
100
200
300
1997 1998 1999 2000 2001
(b)
0
100
200
300
1997 1998 1999 2000 2001
(c)
0
100
200
300
1997 1998 1999 2000 2001
(d)
0
100
200
300
1997 1998 1999 2000 2001
(e)
0
200
400
600
800
1000
1997 1998 1999 2000 2001
(a)
Tree
den
sity
(ha
–1)
Figure 8.1. Mean (± 1 standard error) tree density in control ( ), early ( ) and late
dry season burnt ( ) eucalypt savanna at Cape Cleveland, between 1997 and 2001 for