127
THE EFFECT OF GENDER AND REASONING ABILITY ON THE STUDENTS’ UNDERSTANDING OF ECOLOGICAL CONCEPTS AND ATTITUDE TOWARDS SCIENCE HACER SOYLU SEPTEMBER 2006
| Date post: | 19-May-2018 |
| Category: |
Documents |
| Upload: | truongdung |
| View: | 215 times |
| Download: | 0 times |

THE EFFECT OF GENDER AND REASONING ABILITY ON THE STUDENTS’ UNDERSTANDING OF ECOLOGICAL CONCEPTS AND ATTITUDE
TOWARDS SCIENCE
HACER SOYLU
SEPTEMBER 2006

THE EFFECT OF GENDER AND REASONING ABILITY ON THE STUDENTS’ UNDERSTANDING OF ECOLOGICAL CONCEPTS AND ATTITUDE
TOWARDS SCIENCE
A THESIS SUBMITTED TO
THE GRADUATE SCHOOL OF NATURAL AND APLLIED SCIENCES OF
MIDDLE EAST TECHNICAL UNIVERSITY
BY
HACER SOYLU
IN PARTIAL FULFILLMENT OF THE REQUIREMENTS FOR
THE DEGREE OF MASTER OF SCIENCE IN
SECONDARY SCHOOL SCIENCE AND MATHEMATICS EDUCATION
SEPTEMBER 2006

Approval of the Graduate School of Natural and Applied Sciences
________________________________ Prof. Dr. Canan ÖZGEN
Director I certify that this thesis satisfies all the requirements as a thesis for the degree of Mater of Science
________________________________ Prof. Dr. Ömer GEBAN
Head of Department This is to certify that we read this thesis and that in our opinion it is fully adequate, in scope and quality, as a thesis for the degree of Master of Science _____________________________ ________________________________ Assoc. Prof. Dr. Ceren TEKKAYA Assist Prof. Dr. Jale ÇAKIROĞLU
Co-Supervisor Supervisor Examining Committee Members Prof. Dr. Ömer GEBAN (METU, SSME) _______________ Assist. Prof. Dr. Jale ÇAKIROĞLU (METU, ELE) _______________ Assoc. Prof. Dr. Ceren TEKKAYA (METU, ELE) _______________ Assist. Prof. Dr. Semra SUNGUR (METU, ELE) _______________ Dr. F. Ömer ÖZDEMİR (METU, SSME) _______________

I hereby declare that all information in this document has been obtained and presented in accordance with academic rules and ethical conduct. I also declare that, as required by these rules and conduct, I have fully cited and referenced all material and results that are not original to this work. Name, Last name : Hacer SOYLU Signature : iii
ABSTRACT
THE EFFECT OF GENDER AND REASONING ABILITY ON THE STUDENTS’
UNDERSTANDING OF ECOLOGICAL CONCEPTS AND ATTITUDE
TOWARDS SCIENCE
Soylu, Hacer
M.S., Department of Secondary Science and Mathematics Education
Supervisor: Assist Prof. Dr. Jale ÇAKIROĞLU
Co-supervisor: Assoc Prof. Dr. Ceren TEKKAYA
September 2006, 111 pages
The purpose of this study was to investigate the effect of gender and
reasoning ability on the 8th grade students’ understanding of ecological concepts and
attitude toward science. All 8th grade students from public elementary school in
Tosya participated in the study. Students’ understanding, attitude toward science and
reasoning ability were also measured by means of the Test of Ecology Concept
(TEC), the Attitude Scale toward Science (ASTS) and the Test of Logical Thinking
(TOLT) respectively. In order to investigate students’ understanding deeply,
interview was conducted.
Results of the TEC and interview show that students have many
misconceptions concerning ecosystem, population, community, decomposers, food
chain, food web, energy pyramid and energy flow. Students’ understanding for the
first tier (M= 55.8), combination of first two tiers (M= 27) and combination of all
three tiers (M= 21.2) were calculated according to TEC results.
iv

Multivariate Analysis of Covariance (MANCOVA) conducted to determine
the effect of gender on students’ understanding of ecological concepts and attitude
towards science when reasoning ability was controlled. The results indicated that
there was significant gender difference in favor of girls with respect to students’
understanding of ecological concepts and attitude towards science when reasoning
ability was controlled (Wilks’ Lambda=0.97; p=.00).
Key words: Misconception, ecological conception, reasoning ability, gender
difference, attitude toward science, three-tier diagnostic test.
v

ÖZ
CİNSİYETİN VE MANTIKSAL DÜŞÜNME YETENEĞİNİN ÖĞRENCİLERİN
EKOLOJİK KAVRAMLARI ANLAMAVE FEN BİLGİSİ DERSİNE YÖNELİK
TUTUMLARINA ETKİSİ
SOYLU, Hacer
Yüksek Lisans, Orta Öğretim Fen ve Matematik Alanları Eğitimi Bölümü
Tez Yöneticisi: Yrd. Doç. Dr. Jale Çakıroğlu
Ortak Tez Yöneticisi: Doç. Dr. Ceren Tekkaya
Eylül 2006, 111 sayfa
Bu çalışmanın amacı cinsiyetin ve mantıksal düşünme yeteneğinin
öğrencilerin ekoloji kavramlarını anlama ve fen bilgisine yönelik tutumlarına etkisini
araştırmaktır. Bu çalışmaya Tosya ilçesinden ilköğretim okullarında eğitim gören
bütün sekizinci sınıf öğrencileri katılmıştır. Öğrencilerin kavram yanılgılarını, fen
bilgisi dersine yönelik tutumlarını ve mantıksal düşünme yeteneklerini sırasıyla
Ekoloji Kavram Testi, Fen Bilgisi Tutum Ölçeği ve Mantıksal Düşünme Yetenek
Testi ile ölçülmüştür. Öğrencilerin kavram yanılgılarını derinlemesine araştırmak
için mülakat yapılmıştır.
Ekoloji Kavram testi ve mülakat sonuçları öğrencilerin ekosistem,
populasyon, kominite, ayrıştırıcılar, besin zinciri, besin ağı, enerji piramidi ve enerji
akışıyla ilgili bir çok kavram yanılgısına sahip olduğunu göstermektedir. Ekoloji
Kavram Testi sonuçlarına göre öğrencilerin anlama seviyeleri testin birinci
basamağına(M= 55.8), ilk iki basamağın kombinasyonunu (M= 27) ve üç basamağın
kombinasyonu (M= 21.2) için hesaplanmıştır.
vi

Cinsiyetin öğrencilerin ekolojik kavramları anlama ve fen bilgisi dersine
yönelik tutumlarına etkisini ölçmek için çoklu kovaryans analizi kullanılmıştır.
Sonuçlar, öğrencilerin ekolojik kavramları anlama ve fen bilgisi dersine yönelik
tutumlarına cinsiyetin kızlar yönünde etkisi olduğu, aynı zamanda cinsiyetle
mantıksal yetenek arasında bir etkileşim olduğunu göstermiştir.
Anahtar Kelimeler: Kavram yanılgısı, ekolojik kavramlar, mantıksal yetenek,
cinsiyet farklılığı, fen bilgisine yönelik tutum, üç aşamalı tanı testi.
vii

To My Parents
viii

ACKNOWLEDGEMENTS
Firstly, I would like to thank and express my deep gratitude to my supervisor Assist
Prof. Dr. Jale Çakıroğlu and co-supervisor Assoc Prof. Dr. Ceren Tekkaya for their
helpful guidance and their encouragement.
I also thank to my husband, Selçuk Çeşmeci and my daughter Hatice Çeşmeci for
their patient and support.
I want to thank my parents, my husband’s parents and all my friends, especially
Nagihan Fesli, Elif Şenelmiş and Ertan Şenelmiş for their help.
ix

TABLE OF CONTENTS
PLAGIARISM…………………………………………………………………….....iii
ABSTRACT…………………………………………………………………………iv
ÖZ………………………………………………………………………………...….vi
DEDICATION……………………………………………………………………...viii
ACKNOWLEDGMENTS………………………………………………………...…ix
TABLE OF CONTENTS…………………………………………………………….x
LIST OF TABLES ………………………………………………………………...xiii
LIST OF FIGURES………………………………………………………………...xiv
LIST OF ABBREVIATIONS……………………………………………………….xv
CHAPTERS…………………………………………………………………………..1
1. INTRODUCTION………………………………………………………………..1
1.1. Definition of Important Terms……………………………………………….5
1.2. The Main Problem and Sub-problems……………………………………….6
1.2.1. Main Problem…………………………………………………………6
1.2.2. Sub- Problems………………………………………………………...6
1.3. Hypothesis of the study……………………………………………………...6
1.4. Significance of the study…………………………………………………….6
2. REVIEW THE LITERATURE ………………………………………………......8
2.1. Introduction…………………………………………………………………..8
2.2. Misconception……………………………………………………………......8
2.2.1. Misconceptions in ecology………………………………………….10
2.3 Identifying Misconception………………………………………………….18
2.4 Factors affecting Students’ Understandings and Attitude toward science….21
2.4.1 Gender Difference………………………………………………….21
2.4.2 Reasoning Ability…………………………………………………..24
3. METHOD……………………………………………………………………….32
3.1. Population and Sample……………………………..………………………32
3.2. Instruments…………………………………………………………………34
x

3.2.1. The Test of Ecological Concepts ……………………………...……34
3.2.2. Attitude Scale towards Science …………………………………….35
3.2.3. Logical Thinking Test……………………………………………….35
3.3. Variables ……………………………………………………………….......35
3.3.1. Dependent Variable…………………………………………………36
3.3.2. Independent Variable………………………………………………..36
3.4. Interview with Students ……………………………………………………36
3.5. Procedure……………………………………………...................................37
3.6. Descriptive Statistics……………………………………………………….37
3.7. Inferential Statistics………………………………………………………...38
3.8. Assumptions and Limitations………………………………………………38
3.8.1. Assumptions…………………………………………………………38
3.8.2. Limitations…………………………………………………………..38
4. RESULTS……………………………………………………………………….39
4.1. Descriptive Statistics……………………………………………………….39
4.1.1. Descriptive statistics of TEC………………………………………..41
4.1.2. Descriptive Statistics of TOLT………………………………...……49
4.2. Inferential Statistics………………………………………………………...55
4.3. Result of Interviews………………………………………………………...59
4.4. Summary of the Results…………………………………………………….71
5. CONCLUSIONS,DISCUSSION AND IMPLICATIONS……………………...74
5.1. Overview of the study ……………………………………………………...74
5.2. Conclusions and Discussion of the Results…………………………...........74
5.3. Internal and External Validity………………………………………...........79
5.4. Implication of the Study……………………………………………………80
5.5. Recommendations for Further Research…………………………………...81
REFERENCES……………………………………………………………………...83
APPENDICES………………………………………………………………………92
A INTERVIEW SCHEDULE……………………………………………….92
B CANLILAR VE ETKİLEŞİM KAVRAM TESTİ………………………..95
xi

C FEN BİLGİSİ DERSİ TUTUM ÖLÇEĞİ……………………………….103
D MANTIKSAL YETENEK TESTİ………………………………………104
xii

LIST OF TABLES
TABLES
Table 3.1 Sample Characteristics……………………………………………………33
Table 3.2 Characteristics of the variables…………………………………………...36
Table 4.1 Basic Descriptive Statistics Related to the scores of
TEC, TOLT, ASS and last year’s grades…………………………………...……….39
Table 4.2 Distribution of students and their points according to
types of understanding ……………………………………………………………...41
Table 4.3 Percentages of 8th grade students’ content knowledge,
its reason and their confidences for the first two tiers………………………………44
Table 4.4 A list of students’ misconceptions identified through
test of ecology concepts…………………………………………………………….46
Table 4.5 Frequencies and percentages of students with respect to five
reasoning modes………………………………………………….............................50
Table 4.6 Distribution of students with respect to level of formal thought………....52
Table 4.7 Descriptive statistics for the Gender and Reasoning Ability
with respect to Understanding of ecological concepts and Attitude………………...53
Table 4.8 Significance test of correlation between independent
variables and dependent variables…………………………………………………...55
Table 4.9 Significance test of correlation between independent variables………….55
Table 4.10 Results of the MCR analysis of homogeneity of regression…………….56
Table 4.11 Box's M test of equality of covariance matrices………………………...57
Table 4.12 Levene's test of equality of error variances……………………………..57
Table 4.13 MANCOVA results……………………………………………………..58
Table 4.14 Test of between subject effects………………………………………….59
xiii

LIST OF FIGURES
FIGURES
Figure 4.1 Frequencies of Attitude and Achievement………………………………40
Figure 4.2 Distribution of the students’ desired answers of
the three tiers for all items………………………………………………………..…45
Figure 4.3 Distribution of students’ TOLT scores……………………………….....51
Figure 4.4 Understanding of ecological concepts profiles of
low, medium, high level students across gender……………………………………54
Figure 4.5 Attitude profiles of low, medium, high level students across gender…...54
Figure 4.6 Food chain is a kind of germination of seed by student 4……………….63
Figure 4.7 Food chain as a cyclic chain by student 1……………………………….64
Figure 4.8 Drawing about Energy Pyramid Indicating the Producer, First Consumer
and Decomposer by Student 1……………………………………………………....66
Figure 4.9 Drawing of Energy Pyramid Indicating the Number of Organism
by Student 5…………………………………………………………………………66
Figure 4.10 Drawing of Energy Pyramid by Student 9…………………………..…67
Figure 4.11 Drawing of Food Web by Student 2……………………………………68
Figure 4.12 Drawing of Food Web in Land Ecosystem by Student 1………………69
Figure 4.13 Drawing of Food Web in the Water Ecosystem by Student 1………….69
Figure 4.14 A sample of food web…………………………………………………..70
xiv

LIST OF ABBREVIATIONS
TEC : Test of Ecology Concept
TOLT : Test of Logical Thinking
ASTS : Attitude Scale towards Science
MANCOVA : Multivariate Analysis of Covariance
P : Significance Level
xv

1
CHAPTER 1
INTRODUCTION
Most of the research studies from the literature show that students’ minds are
not empty; they have plenty of ideas or prior knowledge (Arnaudin & Mintzes, 1985;
Bell, 1985) when they enter the class. These alternative ideas can be named as
‘‘preconception’’ (Novak, 1977), ‘‘misconception’’ (Fisher, 1985) or ‘‘children
science’’ (Osborne & Freyberg, 1985), which is different from scientific views and
resistant to change with scientific ones (Driver, 1981; Fisher, 1985; Westbrook &
Marek, 1991). Misconceptions are obstacles for students’ understanding of concepts
and meaningful learning (Carey, 1985; Driver, Guesne, & Tiberghien, 1985; Osborne
& Freyberg, 1985; Posner, Strike, Hewson, & Gertzog, 1982). Therefore, researchers
have had a great deal of identifying students’ misconceptions about many science
concepts such as photosynthesis (Halsam & Treagust, 1987; Smith &
Anderson,1984;Yenilmez, 2005); human body (Mintzes, 1984); homeostasis
(Westbrook & Marek, 1992); natural selection (Bishop & Anderson, 1990; Greene,
1990); amino acids and translation (Fisher, 1985); the human circulatory system
(Arnaudin & Mintzes, 1985; Sungur, Tekkaya & Geban, 2001; Yip, 1998); diffusion
(Westbrook & Marek, 1991); diffusion and osmosis (Odom & Borrow, 1985);
nutrient cycling (Hogan & Fisherkeller, 1996; Okeke, Wood & Robinson, 1980) and
ecological concepts (Adeniyi, 1985; Bell 1985, Brehm, Anderson & DuBay, 1986;
Bishop & Anderson 1990; Çetin, 2003; Eisen & Stavy, 1992; D'Avanzo, 2003;
Gallegos, Jerezano, Flores, 1994; Griffiths, Thomey & Normore, 1988; Griffiths &
Grant, 1995; Hogan & Weathers, 2003; Lavoie, 1997; Leach, Driver, Scott & Wood-
Robinson, 1996; Munson, 1994; Özkan, Tekkaya & Geban, 2004; Smith & Anderson
1984; Storey 1989). Concepts related to ecology are among such concepts and also
students have many misconceptions about concepts related to ecology that must be

2
identified since students have great difficulty to learn meaningfully. Moreover,
misconceptions involving ecological phenomena are particularly important to
overcome, because ecology informs students how they are influenced by, and have
influence on, the ecosystems and the biosphere (D’Avanzo, 2003; Johnson &
Peeples, 1987) so overcoming misconceptions is crucial to students learning and
their world-view. When misconceptions are challenged directly and students
provided with opportunities to re-construct their world-view, the proportion of
students able to use science conceptions to explain phenomena increases
significantly. Therefore, in order to increase students’ understanding teachers must
know how to identify students’ misconceptions.
There are several techniques used to identify students’ misconception
concerning science were clinical interviews (Adeniyi, 1985), concept maps (Novak
& Gowin, 1984; Okebukola, 1990), multiple-choice test (Peterson, Treagust &
Garnett, 1989; Taber, 1999; Tan & Treagust, 1999); two-tier diagnostic test (Haslam
& Treagust, 1987; Rollnick & Mahooana, 1999; Odom & Borrow, 1995) and three-
tier diagnostic test (Eryılmaz & Sürmeli, 2002; Kutluay, 2005; Peşman, 2005;
Türker, 2005). Beside some of advantages, most of the identification techniques have
limitations. Multiple-choice test can be easily administered and interpreted. On the
other hand, it has the limitation that it does not give deep enough inside into the
students’ ideas on the topic and students give correct answers for wrong reasons. Due
to these reasons, Haslam and Treagust (1987), Rollnick and Mahooana (1999) and
Odom and Borrow (1995) have recommended that students should justify their
answers so researchers added multiple-choice test with several tiers, for instance; in a
two-tier test, the first tier presents a multiple choice content question and the second
tier presents a set of reasons for the given answers in the first tier (Odom & Borrow,
1995). However, two-tier tests have some deficiencies. Griffard and Wandersee
(2001) criticized two-tier test and asserted the test results overestimate the percentage
of misconceptions because lack of knowledge can not be discriminated from
misconceptions. Because of deficiency in two-tier test, Eryılmaz and Sürmeli (2002)
developed a three tier-test to assess students’ misconceptions concerning heat and

3
temperature. By means of the three tier-test, students’ lack of knowledge
discriminated from their misconceptions since the third tier items assess how
confident the students are about their responses for the first and second tiers
(Kutluay, 2005; Peşman, 2005; Türker, 2005).
Beside identification misconceptions, factors affecting students’
understanding of science concepts and attitude towards science such as reasoning
ability and gender have been given special interest by many researches (BouJaodue,
1992; Cavallo, 1996; Cavallo & Schafer, 1994; Lawson, 1983; Lawson & Renner,
1975; Niaz & Lawson, 1985; Noh & Schorman, 1997). Concerning reasoning ability,
researches have suggested that significant relationship between reasoning abilities
and biology achievement (Cavallo, 1996; Ehindore, 1979; Johnson & Lowson, 1998;
Lawson & Thompson, 1988). Cavallo (1996) found that reasoning ability best
predicted students’ achievement in solving genetic problems. The study carried out
by Lawson and Thompson (1988) indicated that misconceptions are consistent and
significantly related to the reasoning ability. Moreover, the students with the highest
level of formal reasoning might change their alternative conception more easily
(Lawson & Thompson, 1998; Oliva, 2003). Moreover, Sungur and Tekkaya (2003)
investigated the effect of gender and reasoning ability on students’ achievement
related with the human circulatory system. The results showed that while there was
no statistically significant mean difference between boys and girls with respect to
achievement and attitude toward biology, there was statistically significant mean
difference between concrete and formal students with respect to achievement and
attitude toward biology. Concerning gender effect, Dimitrov (1999) revealed that
there was no significant difference between girls and boys with respect to
achievement in life sciences. Moreover, Ugwu and Soyibo (2004) reported that no
significant gender difference in Jamaican eighth-grade students’ performance.
Furthermore, Campbell, Voekl and Donohue (1998) reported that boys and girls
achieve equally on this standardized measure until the middle school years, when
boys begin to have an advantage that lasts through high school. On the other hand,
other studies reported that there was a significant gender difference regarding science

4
achievement (Okeke & Ochuba, 986; Soyibo, 1999; Young & Fraser, 1994). For
example, Young and Fraser (1994) revealed significant gender differences in biology
achievement in favor of the boys. Stark and Gray (1999) reported that girls
performed at significantly higher levels on tasks where the content was drawn from
the biological sciences and those written tasks assessing science skills. Boys,
however, were found to have greater success in the physical sciences. Girls had
significantly higher achievement than boys, regarding students’ achievement
(Valanides, 1996).
Regarding gender effect on reasoning ability, there is a difference between
girls and boys’ reasoning ability. Yenilmez, Sungur and Tekkaya (2006) investigated
the effect of gender and grade level on students’ reasoning abilities. Results showed
that boys have higher scores than girls on proportional, probabilistic and
combinational reasoning, whereas girls have higher scores on controlling variables
and correlation reasoning. It was also found that there was a statistically significant
gender difference in favor of boys for proportional reasoning. Furthermore, Boujaude
and Giuliano (1994) showed that scores of male students on Test of Logical Thinking
(TOLT) were significantly higher than those of female students. On the other hand,
Valanides (1996) investigated 12th grade Cypriot students’ reasoning abilities with
respect to gender. The results show that students’ performance was higher on
proportional reasoning and controlling variables items. Also, results revealed that
boys had significantly better performance than girls on probabilistic reasoning item
and girls had significantly higher achievement than boys, regarding students’
achievement.
To summarize, students have many misconceptions about ecology which are
obstacle for meaningful learning so many scientist gave special importance to
identify misconceptions, elimination of sources of misconceptions and factors
affecting students’ misconceptions about ecology and attitude toward science such as
gender and reasoning ability.

5
1.1 Definition of Important Terms
This part includes some important definitions related to the study.
Misconception: is the "mistakes" or errors, "misconceptions" or misleading ideas,
and "misunderstandings" or misinterpretations of facts, saying that teachers and
brighter students can correct errors (Barrass 1984). In this study, misconception
was an incorrect answer in the first or second tier and confidence for the first two
tiers in the third tier of the Test of Ecology Concept.
Three-tier misconception test: An item has one additional tier which asks
students confidence about the answer of the former two-tiers (Çataloğlu, 2002).
Ecology: is a complex self-sustaining, natural system with interactions between
biotic (living) and a-biotic (non-living).
Reasoning Ability: is ability to do many operations like relating two variables,
isolating individual factors, interpreting observations and realizing.
Formal Reasoning Ability: If students have formal reasoning ability, they are able
to solve abstract problem in logical fashion and becomes more scientific in
thinking. There are five formal operational reasoning modes, namely proportional
reasoning, controlling variables, probability reasoning, correlational reasoning
and combinational reasoning. Proportional reasoning is important in many
quantative aspects of science while correlational reasoning is important for
interpretation of data where the potential relationships between variables are
considered.
6
Concrete Reasoning Ability: Students are able to solve concrete problems in
logical fashion and understand reversibility.
1.2 The Main Problem and Sub-problems
The research questions investigated in this study can be classified as the main
problem and the sub-problems.
1.2.1 Main Problem
The purpose of the study is to investigate the effect of gender on 8th grade
students’ understanding of ecological concepts and attitude toward science.
1.2.2 Sub- Problems
1. What are the misconceptions that eighth grade students hold about some
ecological concepts?
2. What is the effect of gender on students’ understanding of ecological
concepts and attitude towards science when the effect of TOLT scores are
controlled?
1.3 Hypothesis of the study
There is no significant main effect of gender on the population means of
understanding of ecological concepts and attitude towards science when the effect of
TOLT scores is controlled.
1.4 Significance of the study
Ecology is one of the most important subjects in biology. Ecology informs
students how they are influenced by, and have influence on, the ecosystems and the

7
biosphere. In addition, understanding ecology facilitates understanding
photosynthesis and respiration easily (Anderson, Sheldon, & Dubay, 1990; Çapa,
2000, Özkan, 2001); for example, students have to learn distinction between
producer and consumer before photosynthesis (Çapa, 2000; Özkan, 2001). On the
other hand, students have many misconceptions about ecology (Adeniyi, 1985;
Bishop & Anderson 1990; Çetin, 2003; D'Avanzo 2003; Eisen & Stavy, 1992;
Gallegos et al., 1994; Griffiths & Grant, 1988; Hogan & Weathers, 2003; Leach et
al., 1996; Lavoie, 1997; Munson, 1994; Özkan et al., 2004). Moreover,
misconceptions on ecology are obstacle to be learned and taught new concepts.
Therefore, it is very important to identify students’ misconceptions about ecology for
an instructor to help his/her student’s understanding the scientific conceptions
properly. There are several identification techniques but they have some limitations;
for instance, concept map technique is very time consuming and evaluation is not
easy. Multiple-choice test can be applied easily to many students but it can not assess
students’ answers deeply. Although two–tier test eliminates the deficiency of
multiple-choice test, it can not differentiate lack of knowledge from misconception.
In the three-tier test; however, lack of knowledge can be distinguished from
misconception by means of third tier which asking student whether they are
confident or not for the first two tiers. So, in the present study, three-tier test was
used to identify students’ misconception in ecology.
Previous studies provide us with a rich knowledge about students’
misconceptions on ecological concepts and remediation methods of these
misconceptions. However, there is no study investigating the effect of gender on
students’ understanding of ecological concepts and attitude towards science.
Therefore, this study investigates the effect of gender on students’ understanding of
ecological concepts and attitude towards science when the effect of reasoning ability
is controlled.

8
CHAPTER 2
REVIEW OF THE LITERATURE
2.1 Introduction
In this chapter, literature review is presented in the three sections. The first
section is about the misconception and misconceptions in ecology. In the second
part, identification of misconception is presented and finally factors affecting
students’ understanding and attitude toward science are given.
2.2. Misconception
Misconception is defined as scientifically incorrect interpretations and
responses to problems may be provided by students (Driver, 1985; Osborne &
Freyberg, 1985). Also, Strike and Posner (1985) described misconception as
explanations of phenomena constructed by a student in response to the students’
prior knowledge and experience. Many scientists named misconceptions differently
like preconception (Novak, 1977), misconception (Fisher, 1985) or children science
(Osborne & Freyberg, 1985). Moreover, the extensive research on misconceptions
has also focused on characteristics of misconceptions, source of misconception and
identification of misconceptions. Some of the key characteristics of science
misconceptions may be summarized as follows: (a) stated misconceptions could
represent elements of a coherent conceptual framework constructed by the individual
(Hewson & Hewson, 1988), (b) misconceptions are constructed by individuals in
response to their verbal and empirical experiences (Carey, 1985; Pines & West,
1986), (c) misconceptions are stable elements of an individual's conceptual
framework and highly resistant to change, (d) traditional teaching is unlikely to

9
change a student's conceptual understanding (Champagne & Klopfer, 1983; Hewson
& Hewson, 1988; Osborne & Freyberg, 1985; Posner, Strike, Hewson, & Gertzog,
1982). Furthermore, misconceptions prevent learning new concepts. In order to
increase learning new concepts, identification misconception and elimination source
of misconception are very important. Interview, concept map, multiple-choice test,
two-tier diagnostic test and three-tier diagnostic test are the most common
identification techniques. Previous studies showed several sources of misconceptions
(Adeniyi, 1985; Ivowi, 1983; Helm, 1980; Klammer, 1988, Lee & Diong, 1999). Lee
and Diong (1999) stated many word in science confused with everyday language,
which caused misconception. For example, students perceived respiration as
breathing or food was perceived as only human food. In addition, Bell (1985) found
that students used energy and food as everyday language meaning. Also, Sanders
(1993) stated that unscientific use of everyday language, everyday experiences,
incorrect concept formation or incorrect information are taught during instruction
and wrong explanations in the textbook were the sources of misconception. For
example, Eyidoğan and Guneysu (2001) investigated misconceptions in eight-grade
science textbook in the unit of cell and cell division. They found 21 misconceptions:
11 are about cell division (52%), 5 are on reproduction (24%) and 5 are about
inheritance and environment (24%) and lack of knowledge in this science textbook.
Moreover, Çapa (2000) investigated misconceptions concerning photosynthesis and
respiration in plants. She concluded that the source of students’ misconceptions were
textbooks and suggested science textbook should be examined to check
misconception and renewed. Aşcı, Özkan and Tekkaya (2001) investigated students’
misconception about respiration and they found that high school and university
textbooks have many misconceptions. Furthermore, Adeniyi (1985) found that some
misconceptions were expressed by the teacher. For example, in his study, Adeniyi
reported that students put the decomposers in the top of the energy pyramid because
their teacher included decomposers in the top rung of a pyramid during instruction.
In addition, Adeniyi reported another source of misconceptions that held by students
was the inadequacy of the curriculum.
10
To sum up, misconceptions are scientifically incorrect interpretations. They
are pervasive, stable and resistant to change. There are many sources like everyday
language, textbooks, instruction, and teachers’ misconception. Therefore, students
hold many misconceptions that should be identified by using appropriate techniques
before instruction and be remediated during instruction.
2.2.1 Misconceptions in Ecology
There are many science education research that emphasized the importance of
understanding students’ misconceptions on ecological terms, such as food chain,
food web, energy pyramid and decomposers (Adeniyi, 1985; Çetin, 2003; D'Avanzo,
2003; Eisen & Stavy, 1992; Eilam, 2002; Gallegos et al., 1994; Griffiths & Grant,
1985; Lavoie, 1997; Leach, Driver, Scott & Wood-Robinson, 1996; Lin & Hu, 2002;
Munson, 1991; Reiner & Eilam, 2001; Özkan et al., 2004; Webb & Boltt, 1990).
Cherrett, (1989) listed 50 most important ecological concepts by surveying the
members of the British Ecological Society. Twenty important concepts from the
Cherrett’s list would be recognized and endorsed as essential to environmental
literacy by some of the environmental educators (Munson, 1994). Munson listed
these 20 most important concepts: the ecosystem, succession, energy flow,
conservation of resources, competition, niche, materials cycling, the community, life
history strategies, ecosystem fragility, food web, ecological adaptation,
environmental heterogeneity, species diversity, density dependent regulation,
limiting factors, carrying capacity, maximum sustainable yield, population cycles,
and predator-prey interaction. As seen in the list, ecosystem, energy flow, food chain,
food web and prey-predator interaction are among the most important 20 concepts.
Ecological concepts are prominent aspect of science syllabuses. While
science teachers identified ecological concepts as important and believed them easy
for students to understand (Finley, 1982), there are many studies that revealed certain
misconceptions particularly about environment, population, community, habitat and
decomposers (Adeniyi, 1985; Brehm et al., 1986; D'Avanzo, 2003; Eisen & Stavy,

11
1992; Leach et al., 1996; Munson, 1991). For example, working with junior high
students, Eisen and Stavy (1992) developed a unit that they hoped would change pre-
existing misconceptions and prevent the formation of new ones by ignoring details
and avoiding information overload. They focused on the role of plants in moving
materials (like carbon, hydrogen, and oxygen) cyclically through the ecosystem.
They found that students have misconception that plants are dependent on people,
not vice versa. Other misconception about producer is that green plants are only
producers of carbohydrates in ecosystems (Storey, 1989). In addition, some students
believed that plants take food from the outside environment, or plants get their food
from the soil via roots (Bell 1985; Smith & Anderson 1984). Leach et al. (1996)
found several misconceptions about consumers; for example, the number of
producers is high to satisfy consumers and there are more herbivores because people
keep and breed them and humans provide food for other organism.
Adeniyi (1985) studied Nigerian students’ misconceptions about ecology.
After instruction, 26 students aged from 13 to 15 at elementary school were assessed
by the essay test and clinical interview. Results of the essay test and interview
revealed that students failed to define ecosystem, habitat, community, population,
and many students confused ecosystem with habitat and population. They also stated
community is the same as population. Adeniyi found that students remembered the
everyday language meaning when population was asked. Thus, students thought
population as human population. Also, Adeniyi reported that there are more
herbivores than carnivores because plants eaters produce more young ones at one
time and people breed more plant eaters than meat eaters. Adeniyi stated students
described carnivores as big or ferocious and herbivores as passive or smaller.
Students also thought that bacteria are the source of energy in ecosystem because
heat and gases are produced by decomposing dead plants and animals. Student
ordered food chain in aquatic environment as small fish was eaten by large fish that
was eaten by crocodile and lastly it was decomposed by bacteria. Students thought
that plants do not live in water so they could not understand food relationship in
aquatic environment. Adeniyi (1985) found that students believed that the base

12
(producer level) of the energy pyramid is wider than apex (consumer level) since the
number of producers is higher than the herbivores to provide enough food for
herbivores. Also, he indicated that students thought that energy decreases from
producer level to consumer level since herbivores use some energy for digesting or
herbivores may be hungry at time of eating or energy evaporates into the atmosphere
during respiration so carnivores get little energy from herbivores. On the other hand,
some students in his study considered that available energy increases from the base
to the apex of the energy pyramid so carnivores are the most powerful because
energy accumulates up; thus, carnivores get their energy from both producers and
herbivores. Moreover, students assumed that decomposers locate at the top of the
energy pyramid and they said that bacteria are the source of energy. Moreover,
Lavoie (1997) reported that decomposers release some energy that is cycled back to
plants.
The study conducted by Munson (1994) related to ecology indicated that
some students do not perceive organism exist within a system of interacting biotic
and abiotic factors. Students also believed that varying the population of an organism
might not affect an ecosystem because some organisms in the ecosystem are not
important. Furthermore, he found that students do not have clear explanation about
species, population and community in their minds and students do not understand
that each species has unique needs, and therefore each species has a unique effect on
an ecosystem. On the other hand, some students believed that the needs of a species
are general and typical of similar species that carry out the same role within the
ecosystem. Munson reported that students interpreted food webs as simple food
chains. He stated that populations higher on a food web increase in number because
they deplete those lower in the web. Similarly, Brehm et al. (1986) revealed that
students described ecosystem that are not an organized whole, but a collection of
organisms. In another study, Leach, Driver, Scott, and Wood-Robinson (1996)
investigated students’ ideas about ecology and found that most pupils aged 5 and 16
are inconsistent in the form of explanation used in different contexts; for example,
they may explain relative population size in different communities in different ways.

13
Özkan, Tekkaya and Geban (2004) studied seventh grade Turkish students’
misconceptions related to ecological concepts. They conducted an interview and by
using results of the interview and literature, they developed two-tier diagnostic test.
Eighteen misconceptions were identified by means of this test related to the concepts
of environment, ecosystem, decomposer, population, energy resources in ecosystem
and food chain and food web. They reported that students defined food chain as a
kind of feeding relation including different food materials such as proteins and
vitamins. Also, students had difficulty in identification of first consumer, second
consumer or producer; for example, they maintained carnivores are the first
consumer as they are wild and strong. On the other hand, several students claimed
that humans are the first consumer because they consume everything. Moreover, they
found that ecosystem is the interaction among living things and population is the
number of people in a certain area; such as, population of city. Furthermore, they
reported three misconceptions about decomposers such as decomposers eat dead
plants and animals to keep environment, decomposers are not important because they
are found on dead animals and they have no effect on ecosystems because they are
too small to be seen by naked eye. They found several misconceptions about energy
flow and energy pyramid. They reported that the strongest one has more energy; for
example, when asked to which one has the greatest energy among grass, sheep and
man, students believed that man has the greatest amount of energy since he is
stronger so he has more energy. However, other students responded the reason of this
question as man gets his energy from both grass and ship. On the other hand,
students believed that energy flows from the stronger one to weaker one; for
example, student stated in a food chain including plant, chicken and man, energy
flows through man to plant because man has the greatest energy while some students
thought that energy does not pass from one organism to other organism. Also, other
students in her study believed that there is no relationship between plants and
animals since plants and animals have own energy. Moreover, students claimed that
plants get their energy from soil because they grow in soil and their food of mineral
and water are present in soil.

14
Griffiths and Grant (1985) investigated tenth grade students’ misconceptions
related to food web that a hierarchy leading to the ability to determine how a change
in the size of one population can affect another population in the same web but not
on the same chain, and identification of specific misconceptions held by subjects
concerning food web. Data were collected from 200 students. In their study, they
found five misconceptions about food web. These are:
1. Interpretation of food web dynamics in terms of a food chain.
2. In a food web, a change in one population will only affect another population
if two populations are directly related as predator and prey.
3. A population located higher on a given food chain within a food web is a
predator of all populations located below it in the chain.
4. A change in the size of a prey population has no affect on its predator
population
5. If the size of one population in a food web is altered, all other populations in
the web will be altered in the same way.
Gallegos et al. (1994) found that students thought there is no producer in the
food web. They thought that food web involves only prey and predator. Also, they
thought that carnivores are big or ferocious and herbivores are passive or smaller so
they considered that producers are small and passive like herbivores. Therefore,
students started food chain with a producer correctly although they held
misconception of ferocity and size. Student also thought that in a food web, a change
in one population would only affect another population if the two populations were
directly related as predator and prey. Moreover, they reported that student considered
the relative sizes of prey and predator populations have no bearing on the size of
other.
Reiner and Eilam (2001) studied changes in students’ ideas of a food chain
and they looked for underlying ontological belief that may explain students’ ideas.
Data were collected by observing 28 ninth grade students during 24 instructional
sessions on ecology in Israel. Results of the study showed that there are several

15
factors that effect students’ consideration in identifying a food chain such as eating
event, size hierarchy and total elimination; for instance, students thought that a big
fish fed on smaller fish fed on a smaller one. Furthermore, they reported that students
considered if the organism is eliminated when consumed, it is assumed as an element
in a food chain otherwise, it could not constitute food chain.
The study conducted by Eilam (2002) indicated that students considered
bacteria as the microscopic-sized bacteria to diseases when asked whether bacteria in
the human body constitute a food chain. Some of the student defined food chain as
cyclic that white blood cell swallows the bacteria that feed on the human body. On
the other hand, most of students thought bacteria as decomposers but they stated that
decomposers feed only on the last element of the chain. Furthermore, Eliam reported
that most of the students did not consider nectar as the first link of the feeding
relations because it is not contained the green parts of plants. They thought that only
a green component of plants is the part of a food chain since it contains
photosynthesis products to pass on the subsequent consumers. In addition, students in
this study believed that humans in feeding relations are always at the top of the
pyramid and that larger organisms always feed on smaller ones. Results of the study
about prey and predator relationship supported fourth and fifth misconceptions of
Griffith and Grand’s findings.
In another study, Webb and Boltt (1990) examined the ability of high school
pupils and university students to answer questions on relationship within food webs
using sound ecological principles. Data were collected from 108 pupils aged 15-17
years old. They developed food web diagram using letters that represent populations
in the food web and arrows that shows the relationship. Nine open-ended questions
were asked to students. Results of the study showed that misconceptions appeared
regularly at all levels were based on the proximity of populations in the food web; for
example, if the populations are too far apart, there is no effect or there is not too
much effect if the chains are spread out. Thus, the distance or links among the

16
populations are important. However, they reported that misconceptions described by
Griffiths and Grant (1985) occurred occasionally.
Çetin (2003) investigated the ninth grade Turkish students’ understanding of
ecology unit. Data were collected from 79 high school students from four different
classes through ecology concept test. Her study covered non-living, living factors of
the environment, producer, consumer, decomposer, relationship in matter and energy
flow, food web, food chain, cycle of matter, population, community, ecosystem, and
environmental pollution. Results of the study showed that students have some
misconceptions about ecology unit and these misconceptions prevent meaningful
learning. She reported that students had several misconceptions concerning food
chain that the tertiary consumer takes its food from producers and secondary
consumers feed on the tertiary consumers.
D'Avanzo (2003) investigated common misconceptions about photosynthesis,
respiration, food webs, evolution and ecosystems to help improve college ecology
instruction, ecology faculty and researchers who study learning should collaborate to
design research about ecology teaching and ecological thinking. D'Avanzo reported
that students believed that energy is not lost in trophic transfer since diagrams of
energy pyramids that indicate decreases in energy, without indicating that energy is
given off as heat, can reinforce students’ misconception that energy is not conserved.
Lin and Hu (2002) investigated energy flow and matter cycling. Data were
collected from 106 pupils in the seventh grade aged 13 years old from five secondary
schools in the Taipei. The 12 items related with produces, consumers, decomposers,
matter, and energy were provided for concept mapping. The results indicate that
most of the pupils failed to recognize the interrelationships among the various
concepts concerned with units of energy flow and matter cycling. It was the
relationship between the living world and the non-living world that presented the
greatest difficulty to understanding.

17
To sum up, these studies show that students have many misconceptions about
ecological terms, such as food chain, food web, energy pyramid and decomposers.
Main misconceptions on ecological terms are as below:
• Varying the population of an organism will only affect the others that are
directly connected through a food chain (Griffiths & Grant, 1985; Munson
1991).
• Food webs are interpreted as simple food chains (Munson, 1991; Griffiths &
Grant, 1985).
• If the organism is eliminated when consumed, it is assumed as an element in
a food chain otherwise, it could not constitute food chain (Reiner & Eilam,
2001).
• Decomposers feed only on the last element of the chain (Eilam, 2002).
• Only a green component of plants is the part of a food chain since it contains
photosynthesis products to pass on the subsequent consumers (Eilam, 2002).
• If the populations are too far apart, there is no effect or there is not too much
effect if the chains are spread out (Webb & Boltt, 1990)
• Varying the population of an organism may not affect an ecosystem, because
some organisms are not important (Munson, 1991).
• Varying the population of an organism will affect all other organisms to the
same degree (Griffiths & Grant, 1985).
• Organisms higher in a food web eat everything that is lower in the food web
(Griffiths & Grant, 1985).
• The top of the food chain has the most energy because it accumulates up the
chain (Adeniyi, 1985).
• Populations higher on a food web increase in number because they deplete
those lower in the web (Munson, 1994).
• Ecosystems are not an organized whole, but a collection of organisms (Brehm
et al., 1986).

18
• There are more herbivores because people keep and breed them (Leach et al.,
1996).
• Decomposers release some energy that is cycled back to plants (Lavoi, 1997).
• The number of producers is high to satisfy consumers (Leach et al., 1996).
• Carnivores have more energy or power than herbivores do (Adeniyi, 1985)
• Carnivores are big or ferocious. Herbivores are passive or smaller (Gallegos
et al., 1994)
• Plants do not live in water (Adeniyi, 1985).
• Plants take in food from the outside environment, and/or plants get their food
from the soil via roots (Bell, 1985; Smith & Anderson, 1984).
• Plants are dependent on people, not vice versa (Eisen & Stavy, 1992).
• Energy is not lost in trophic transfer (D'Avanzo, 2003).
• Humans provide food for other organisms (Leach et al., 1996)
2.3 Identifying Misconception
The identification of misconception has been the aim of many of the studies
carried out over the last two decades (Pfundt & Duit, 1991). However, there is often
little time invested by instructors in finding out in depth what students already know
or what they do not know, what they are confused about, what their preconceptions
are and whether they perceive new concepts or not despite their preconception
(Carey, 1985; Driver, Guesne, & Tiberghien, 1985; Osborne & Freyberg, 1985;
Posner, Strike, Hewson & Gertzog, 1982). So instruction may not be influenced to
students that we might expect. Students bring to class their ideas, experience and
preconceptions, which are resistant to change. Therefore, identification of prior
knowledge is important part of the instruction for meaningful learning. Students’
conceptions have been identified by means of interview, concept map, open-ended
questions, multiple-choice test, and two or three tier diagnostic test.
Interview technique was used to identify students’ misconceptions in many
biology topics; such as ecology (Adeniyi, 1985; Çetin, 2003; Fisher, 1985; Özkan,

19
Tekkaya & Geban, 2004), the human circulatory system (Arnaudin & Mintzes, 1985;
Sungur, Tekkaya & Geban, 2001), cellular respiration (Songer & Mintzes, 1994),
diffusion and osmosis (Odom & Borrow, 1995), respiration in plants and
photosynthesis (Çapa, 2000). Interview permits follow-up questions and interactions
that can also provide insight into how a student is thinking and how thinking may
change over time. It has some advantages; for example, it can be applied over a wide
range of age, and provide deep investigation by getting students view rather than the
correct scientific view. However, it has some limitations; for instance, interviews,
transcribing and analysis of transcripts are time consuming and it can be applied for
limited sample size.
Concept map is the other effective tool used for identifying students’
misconception. It is used for a large number of researchers in different subject area in
biology (Odom & Kelly, 2001). It provides more or less direct measures of the
pupils’ knowledge structure, in which it is conceived of as a combination of a task, a
response format, and a scoring system (Ruiz-Primo & Shavelson 1996). It also gives
a permanent record of student understanding at a particular time, which is useful to
show changes in student understanding. However, concept map has some limitation;
for example, it must be learned how to apply, how to score, and students must be
taught how to construct them. This takes too much time (Zelik, n.d)
The other way of identifying students’ misconception is multiple-choice tests.
They can permit coverage of wide range of topics in a relatively short time (Tamir,
1990). Also, they can be scored easily, quickly and objectively, but they do not
provide deep insight into students’ ideas (Rollnick & Mahooana, 1990). Although
they can measure students’ contents knowledge, they can not give any idea about
students’ reasoning behind their choices; thus, students choose correct answer with
wrong reasons (Odom & Borrow, 1995).
To determine students’ reasoning, misconception and conceptual
understanding, many researchers suggested using a two-tier diagnostic instrument

20
(Haslam & Treagust, 1987; Odom & Borrow, 1995; Rollnick & Mahoona, 1999;
Tyson, Treagust & Bucat, 1999). A two tier diagnostic instrument has two parts. The
first part having content questions with two or three choices is a kind of multiple-
choice test. The second part of the two tier diagnostic instrument includes a set of
possible reasons for the answer given to the first part. Distracters are designed to
elicit misconceptions known from the literature. They can be applied a large number
of students and scored easily but they can not differentiate lack of knowledge or error
from misconception. Generally, in objective test all wrong answers are treated as
misconception. On the other hand, reason of the wrong answers may be lack of
knowledge or error. Eryılmaz and Sürmeli (2002) claimed that misconception has a
connotation of error, but not all errors are misconceptions. Therefore, in order to
identify misconception from lack of knowledge and error, they developed a three-tier
diagnostic test. In three-tier test, first and second tier are the same as two-tier
diagnostic instrument; thus, the first tier is the content questions with two or three
choices and the second tier is the reasons of the choices in the first tier. The third tier
presents whether confident or not for the first two tiers. For example, if students’
answers for the first tier are incorrect, then the reasons of the answers for the first tier
are chosen in the second tier, and student is confident about the answers for the first
two tiers, we can think that students have misconceptions. Assessing misconception
with multiple-choice test or two-tier diagnostic test overestimates the percentage of
students having misconception and all wrong answers treated as misconception.
Therefore, Eryılmaz and Sürmeli calculated percentage of students having
misconception for each tier. They reported that 46% of the students had in average at
least one misconception according to the first tier, 27% of the students had in average
at least one misconception according to the first two tiers, and 18% of the students
had in average at least one misconception according to all three tiers. They
concluded that assessing misconception with one-tier or two-tier test overestimates
the percentages of students having misconceptions due to all wrong answers treated
as misconception. Some of the incorrect answers may be due to misconceptions but
some of them may be due to randomly given answers or lack of knowledge so three
21
tier diagnostic test decreases assuming error, mistakes or lack of knowledge as
misconception.
2.4 Factors affecting Students’ Understandings and Attitude
There are many factors affecting students’ understanding and attitude toward
science. Of a special interest, in this part only two of them, will be discussed: Gender
and reasoning ability
2.4.1 Gender Difference
Many researches have showed that mean scores on measures of both science
achievement and attitudes toward science begin to differentiate by gender, favoring
boys, during the middle school years (Catsambis, 1995; Baker & Leary, 1995;
Jovanic & King, 1998; Jones, 2000; Lightbody & Durndell, 1996; Simpson & Oliver,
1990; Sullins, Hernandez, Fuller & Tashiro, 1995). Although there is no difference in
achievement of boys and girls until the middle school years, boys begin to have
greater success that lasts through high school (Campbell, Voekl & Donohue, 1998).
Moreover, Simpson and Oliver (1990) showed that both attitudes toward science and
science motivation for boys and girls from grades 6 to 10 declined but boys have
more positive science attitudes and achievements than the girls across the level.
Furthermore, results of the studies showed that there is a significant gender
difference in science experiences, attitudes, and perceptions of science courses and
careers. While males have more extracurricular experiences with a variety of tools
such as batteries, electric toys, fuses, microscopes, and pulleys, females have more
experiences with bread-making, knitting, sewing, and planting seeds. More male
students showed they were interested in atomic bombs, atoms, cars, computers, x-
rays, and technology while more females reported interest in animal communication,
rainbows, healthy eating, weather, and AIDS. In addition, Jones (2000) reported that
girls and boys have different attitude towards science for the last three decades. He
stated that girls have different experiences outside the school and this affects their
22
attitude. Although students often have different experiences with science in and out
of school based on gender, more females than males graduate from post secondary
institutions and get higher grades in science and engineering courses. On the other
hand, more males than females major in the natural sciences or engineering (Keeves,
1991; Kotte, 1992; National Academy Press, 1991; National Science Board, 1998;
Rosser, 1995). Studies also reported that gender differences begin as early as
elementary school and boys have possessed more positive attitude in studying
science than girls (Clarke, 1972; Clark & Nelson, 1972; 1971; Kotte, 1992). Kahle
and Lakes (1983) examined data from the National Assessment of Educational
Progress (NAEP) in the US and found that girls described their science classes as
facts to memorize and boring. In addition, girls’ attitudes toward science tend to
decline until middle school and this continue to high school (Sullins, Hernandez,
Fuller, & Tashiro, 1995). Catsambis (1995) examined data from 19,000 eighth grade
students who participated in the National Educational Longitudinal Study and found
that males liked more science lesson and thought science would be useful to their
future, and were less afraid to ask questions in science classes than their female peers
were. According to Catsambis, girls have less positive attitudes although they
performed better than boys and got higher grades in science classes. In addition,
Catsambis reported that middle school boys more interested in a future career in
science than girls. He stated the reasons of the gender gap in science achievement
beginning in the middle school, a decline in girls’ science self-concept and in other
components of their attitudes towards science.
Keeves and Kotte (1992) examined students from ten different countries and
found that males held more positive attitudes toward science than females, even
though females were more interested in school and school learning in general. Also,
they reported males thought science was easy to learn whereas female students
thought science was difficult to learn. They also found that more males enrolled in
physics and chemistry courses in secondary school but more females enrolled
biology in secondary school. They also reported that male students aged 10, 14, and
18 had higher achievement in chemistry, earth science, and physics than female

23
students did. On the other hand, there were no significant differences between males
and females for biology.
Baker and Leary (1995) also found differences in attitudes and understanding
of science as students progressed from middle through high school. They reported
that eighth grade girls in the study liked science in spite of their peers’
discouragement for their career choice in science. However, in eleventh grade peers
thought differently from eighth grade peers though they believed that girls do not like
science. Furthermore, they found that the girls do not like physical sciences because
of not allowing them to help or care people. They prefer biology in order to help
people, animals, or the earth instead of physical sciences.
Jones (1990) reported that while boys generally preferred research in physical
sciences, girls wanted to make research in the area of biology in the sample of the
pre-college students’ research. He also found that girls thought as biology as a more
caring branch of science whereas they described as physics are related with war and
destruction.
The study conducted by Jovanic and King (1998) showed that girls rather
than boys make comparative judgments across academic domains so years
progressed girls perceived themselves to be better at the other school subject and
therefore not as good at science. The study of Osborne and Collins (2000) revealed
reason of the girls’ rejection of science that was the perception of science as a
difficult subject and also showed that most of the curriculum lack of the demanding
activities and observing problem so this affects girls’ attitude towards science
negatively. Furthermore, Lightbody and Durndell (1996) have found that boys were
far more liking science than girls. However, Archer (1992) has found that girls aged
between 10 and 15 reported liking most strongly the three subjects: mathematics,
science and games. Moreover, Elver and Comber (1995) have shown that girls are
successful as well as boys.

24
More recently, Osborne (2003) investigated a major literature about attitudes
to science and its implications over the past 20 years. Moreover, analysis by gender
shows that the male to female ratio remains 3.4: 1 in physics, while it is at least
approximately equal in chemistry; biology by contrast is still dominated by girls.
Results revealed that there are many factors that affect attitude such as gender,
teachers, curricula, cultural and other variables, but the most effective factor is
gender and quality of teaching. Furthermore, classroom activities and classroom
environment may affect positively students’ interest to science. Oliver and Simpson
(1988) have reported that social support from peers and attitude towards enrolling for
a course are strong determinants of girls’ choice to pursue science courses
voluntarily.
Results of the Colley, Comber and Hargreaves’s (1994) studies showed that
there was significant gender difference among 11 years old and 13 years old pupils
with girls favoring English and Humanities, boys favoring science. On the other
hand, The Research Business (1994) in England showed that there was no significant
gender difference with the sample aged 14-16 who found science as useful (68%)
and interesting (58%).
2.4.2 Reasoning Ability
On the basis of Piagetian Theory, schemes which are organized patterns of
behaviors or thoughts that allow mentally representing or thinking objects or events
in our world evolve through four stages. Although these stages reflect a generally
continues pattern of cognitive development, children do not suddenly jump from one
stage to the next. These stages of cognitive development are sensory motor (0-2
years), preoperational (2-7 years), concrete operational (7-11 years), formal
operational (11-adult). Understanding occurs in concrete and formal operational level
(Johnson, 1993). While students at the concrete operational stage are able to concrete
(hands on) problems in logical fashion, understands laws of conservation and
reversibility, and are able to classify and seriate, they can not make non-observable

25
or imaginatory operations. Moreover, Bigs and Collins (1982) reported that students
who are identified at the concrete operational students might have an inefficient
working memory and have difficulty multiple concepts simultaneously and they fail
to recognize which concepts is best answer to the problem. Concrete operational
students will often consider a problem to have a single correct solution and will have
difficulty to identifying responses for open-ended questions that have multiple
answers. In formal operational students have deep working memory so they are able
solve abstract problems in logical fashion, becomes more scientific in thinking such
as testing the hypothesis and analyzing data and they can keep concepts and their
interrelationships in their mind while considering answers. According to
developmental theory, descriptive and theoretical concepts constructions are linked
to intellectual development because the process depends on reasoning patterns and
also reasoning ability relies on not only maturation but also individual self-regulatory
mechanisms. Furthermore, students normally progress from concrete to abstract stage
with increasing age, grade level, and practice. Students who have reached the formal
stage can use logical operations (Bybee & Sund, 1990), which are important for
science learning and achievement (Lawson, 1995; Piaget, 1964).
Learning of science requires intellectual skills and high levels of reasoning
ability of students (Bigs & Collins, 1982; Bitner, 1991; Johnson, 1993; Lawson,
1982). For successful learning in science, five formal reasoning modes consisting of
controlling variables, proportional, probabilistic, correlational, and combinational
reasoning abilities are essential (Bitner, 1991; Lawson, 1982). On the other hand,
Lawson, Karplus and Adi (1978) found little or no difference between sixth graders’
and eighth graders’ use of proportional and probabilistic reasoning. They found huge
advances in the use of proportional and probabilistic reasoning from 8th to 10th
graders. In a sample of 6130 Korean students, Hwang, Park and Kim (1989) found
generally similar performances on measures of proportional, combinational,
probabilistic and correlational reasoning among 12-, 13-, and 14- years old. They
found substantial performance improvements by the 15-year-olds. Students science
achievement at secondary level depends on solving algorithm and conceptual

26
problems whose solution requires sound understanding of underlying concepts and
application and manipulation of certain mathematics and science formulae but
students sometimes solve problems by applying scientific formulae without
understanding underlying scientific concepts (Heywoth, 1999; Mason et al., 1997)
Therefore, a large number of researchers gave special importance to
reasoning ability and reported that positive relationship between students’ logical
thinking ability and their science achievement (Abraham et al., 1992; Atkinson,
2004; BouJaodue et al., 2004; Chandran et al., 1987; Cavallo, 1996; Cavallo et al.,
2003; Johson & Lawson, 1998; Jones et al., 2000; Hupper et al., 2002; Lawson &
Thompson 1988; Lawson et al., 2000; Oliva, 2003; Robinson & Niaz, 1991, Sungur
& Tekkaya, 2003; Valanides, 1997; Yenilmez et al., 2006). For example, Lawson
(1978) investigated students’ formal reasoning levels with 523 students from eighth
grade to tenth grade. He found that 35% of the students were at the concrete level,
15% of the students at the formal level and 35% of the students at the transitional
level which was named by Lawson. Transitional level is the beginning of the formal
thought. He reported that students at the concrete level fail to understand in abstract
concepts. Furthermore, Tobin and Capie (1982) found that formal reasoning ability is
the strongest predictor of process skill achievement and retention with 36% of
variance. Also, Lawson and Thomson (1988) reported higher reasoning ability and
larger mental capacity eliminate some misconceptions. They tested hypothesis of
formal operational students hold significantly fewer misconceptions than their
concrete operational classmates did. Data were collected from 131 seventh grade
students by application of essay test about genetics and natural selection after
instruction. On the other hand, Oliva (2003) found that the students with higher
levels of formal reasoning tend to have more structured misconceptions than the ones
having lower level of formal reasoning but they change their misconceptions more
easily. Kwan and Lawson (2000) maintained there is a relationship between
maturation of brain growth during adolescence and scientific reasoning ability
including capacity to reject misconceptions and accept scientific conceptions.

27
In other study, Johson and Lawson (1998) investigated the effect of the
reasoning ability and prior knowledge on biology achievement in expository and
inquiry classes and examined that 366 students enrolled in a one-semester nonmajors
biology course at a large suburban southwestern community. They found that the
effect of reasoning ability on achievement is more than prior knowledge effect and
the improvement of reasoning ability in inquiry classes is higher than expository
classes since reasoning patterns are used to inquire into biological phenomena,
generate and test alternative hypotheses, and otherwise construct meanings from
potentially confusing and disequilibrating inquiry experiences. These processes
correspond to the concrete, transitional, and formal stages within Piagetian theory
(Inhelder & Piaget, 1958; Karplus & Lavatelli, 1969; Piaget & Inhelder, 1962). They
also reported that reasoning ability explained more of the variance in final
examination scores for students enrolled in expository classes (18.8%) than in
inquiry classes (7.2%). On the other hand, some researchers have found student’s
prior knowledge of biology is the primary determinant of the achievement, while
others have found reasoning ability is the primary determinant of the achievement,
for example, Blurton (1985) found that prior genetics knowledge, but not reasoning
ability, significantly predicted performance on a genetics posttest. However, Lawson
and Worsnop (1992) found high school biology students’ reasoning ability to be
significantly related to gains in conceptual knowledge because concept acquisition
requires equilibrium between assimilation and accommodation in which several
interrelated reasoning pattern. Therefore, concept acquisition should also be
dependent on students’ reasoning ability (Lawson, 1985, 1991; Wollman & Lawson,
1977). In addition, Lawson et al. (1991) found reasoning ability to be highly
correlated with performance on concept acquisition tasks for high school biology and
chemistry students. On the other hand, Westbrook and Marek (1991, 1992) showed
no relationship between reasoning ability and understanding diffusion but they found
that a relationship between reasoning ability and understanding homeostasis. Bitner
(1991) showed there was a high correlation between success and reasoning ability
and reported that reasoning ability explained 62% of the variance in high school
science grades. Moreover, Robinson and Niaz (1991) found reasoning ability to be

28
related to chemistry students’ success at solving stoichiometry problems. Although it
seems reasonable to expect that both prior conceptual knowledge and reasoning
ability contribute to learning, perhaps the extent to which prior knowledge and
reasoning ability predict achievement depends to some extent on the instructional
method employed. Shayer and Adey (1993) reported design of the instruction to
develop reasoning patterns also resulted in larger differences in science achievement
between control and experimental groups.Some research has shown a gender
difference in reasoning ability favoring males (Liben & Golbeck, 1980) although
other studies have shown little difference between males and females on reasoning
ability (Kahle & Meece, 1994).
Germann (1994) tested a model of science process skills acquisition and
interaction with parents' education, preferred language, gender, science attitude,
cognitive development, academic ability, and biology knowledge. Path analysis
techniques were used to test a hypothesized structural model of direct and indirect
causal effects of student variables on science process and data collected at the
beginning and end of the school year from sixty-seven 9th- and 10th-grade biology
students who lived in a rural Franco-American community in New England. Results
of the study showed that academic ability, biology knowledge and language
preference had significant direct effects and there were significant mediated effects
by cognitive development, parents' education, and attitude toward science in school.
The variables of cognitive development and academic ability had the greatest total
effects on science process skills. Concept construction often engages hypothetico
deductive reasoning skills.
Cavallo (1996) explored relationships among school students' meaningful
learning orientation, reasoning ability and acquisition of meaningful understandings
of genetics topics, and ability to solve genetics problems. After measured students'
meaningful learning orientation (meaningful and rote) and reasoning ability
(preformal and formal), students were tested before and after laboratory-based
learning cycle genetics instruction using a multiple choice assessment format and an

29
open-ended assessment format (mental model) and regression analyses were
conducted to examine the predictive influence of meaningful learning orientation,
reasoning ability, and the interaction of these variables on students' performance on
the different tests. Results revealed that meaningful learning orientation best
predicted students' understanding of genetics interrelationships, whereas reasoning
ability best predicted their achievement in solving genetics problems. The interaction
of meaningful learning orientation and reasoning ability did not significantly predict
students' genetics understanding or problem solving. Cavallo, Potter and Rozman
(2004) measured students' learning approaches, motivational goals, self-efficacy,
epistemological beliefs, scientific reasoning abilities, and understanding of central
physics concepts at the beginning and end of the course. The findings showed that
male students had significantly higher self-efficacy, performance goals, and physics
understanding compared to females, which persisted throughout the course.
Differential shifts were found in students 'meaningful learning approaches, with
females tending to use less meaningful learning from beginning to end of the course;
and males using more meaningful learning over this time period. For both males and
females, self-efficacy significantly predicted physics understanding and course
achievement. For females, higher reasoning ability was also a significant predictor of
understanding and achievement; whereas for males, learning goals and rote learning
were significant predictors, but in a negative direction.
Lawson, Abraham, and Renner (1989) reported that many inquiry-based
curricula were developed to help promote students critical thinking, concept
understanding, and scientific reasoning abilities. Research on these curricula found
that students in inquiry-based classrooms formulate more sound understandings of
science processes and content, as compared to those in classrooms with more passive
learning, such as listening to a lecture (Gabel, 1994).
Main points of the literature review was listed as below
1. Students have several misconceptions about ecological conceptions which are
persistent to change and they influence further understanding and learning
30
(Adeniyi, 1985; Brehm et al., 1986; Çetin, 2003; D'Avanzo, 2003; Eisen &
Stavy, 1992; Eilam, 2002; Gallegos et al., 1994; Griffiths & Grant, 1985;
Leach, Driver, Scott, Wood-Robinson, 1996; Munson, 1991; Reiner & Eilam,
2001; Özkan, 2001; Webb & Boltt, 1990).
2. Sources of misconceptions according to previous studies are science textbook
(Ivowi, 1983), teachers’ instructions (Adeniyi, 1985), popular sayings of
students (Helm, 1980) and a curriculum (Klammer, 1988).
3. Identification of misconception has been the aim of many of the studies
carried out over the last two decades (Pfundt & Duit, 1991). There are many
techniques to identify misconceptions such as interview technique (Adeniyi,
1985; Arnaudin & Mintzes, 1985; Çapa, 2000; Çetin, 2003; Fisher, 1985;
Lawson, 1988; Sungur, Tekkaya & Geban, 2001; Songer & Mintzes, 1994;
Odom & Borrow, 1995;Özkan, Tekkaya & Geban, 2004), concept map
(Odom & Kelly 2001), multiple-choice tests (Rollnick & Mahooana, 1990;
Tamir, 1990), two-tier diagnostic instrument (Haslam & Treagust, 1987;
Odom & Borrow, 1995; Rollnick & Mahoona, 1999; Tyson, Treagust &
Bucat, 1999), three-tier diagnostic test (Eryılmaz & Sürmeli, 2002, Kutluay,
2005; Peşman, 2005; Türker, 2005).
4. Some of the incorrect answers may be due to misconceptions but some of
them may be due to randomly given answers or lack of knowledge so three
tier diagnostic test decreases assuming error, mistakes or lack of knowledge
as misconception (Eryılmaz & Sürmeli, 2002).
5. Gender and reasoning ability are the most important factors that affect
students’ understanding of science and attitude towards science (Sungur &
Tekkaya, 2003).

31
6. Studies also reported that gender differences begin as early as elementary
school and boys have possessed more positive attitude in studying science
than girls (Clarke, 1972; Clark & Nelson, 1972; 1971; Kotte, 1992). Kahle
and Lakes (1983).
7. There are large number of studies have focused on identifying cognitive
variables that affect students’ achievement and their understanding of science
concepts (BouJaodue 1992, Cavallo 1996, Cavallo & Schafer, 1994;
Giuliano, 1992; Lawson, 1983; Niaz, 1987; Niaz & Lawson, 1985, Niaz &
Robinson, 1992; Noh & Scharmann, 1997).
8. There is a positive relationship between students’ logical thinking ability and
their science understanding (Abraham et al., 1992; Atkinson, 2004; Boujaude
et al., 2004; Cavallo, 1996; Cavallo et al., 2003; Chandran et al, 1987;
Hupper et al., 2002; Jones et al., 2000; Johson & Lawson, 1998; Lawson et
al., 2000; Lawson & Thompson 1988; Valanides, 1997; Oliva, 2003;
Robinson & Niaz, 1991; Sungur & Tekkaya, 2003; Yenilmez et al, 2006).
9. Several studies have established a clear link between scientific reasoning
ability and concept understanding (Baker, 1994; Choi & Hur, 1987; Johson &
Lawson, 1998; Kim & Kwon, 1994; Lawson & Renner, 1975; Lawson, 1985;
Robinson & Niaz, 1991; Ward & Herron, 1980).

32
CHAPTER 3
METHOD
In the previous chapters, purpose, problems, and hypotheses of the study were
presented, related literature was reviewed and the essence of the study was justified.
In this chapter, population and sampling procedure, description of variables,
instruments of the study, procedure, and methods used to analyze data and
assumptions and limitations will be explained briefly.
3.1 Population and Sample
The target population of the study is all eight grade elementary school
students in Turkey. The accessible population contains all eight grade students in
Tosya, the biggest district of Kastamonu, in Turkey. The study was conducted in all
8th grade classes in elementary school in Tosya and a sample of 600 students
participated in this study. There were 313 female students and 287 male students.
Students’ ages ranged from 13 to 16 with the mean of 14.1. The mean of the science
grade of the students was 3 over 5.

33
Table 3.1 shows the demographic information regarding the mother
educational level (MEL), father educational level (FEL) as indicators of
socioeconomic status of the students in the study, students’ age and their grades. As
it can be deduced from the table, majority of the parents graduated from primary
school. Moreover, most of the students are 14 years old and most of the students’
grades are 2 or 3.
Table 3.1 Sample Characteristics Educational Level MEL FEL
Illiterate 48 11
Primary School 466 322
Secondary School 63 112
High School 14 95
University 9 56
MS 0 4
PhD 0 0
Age girls boys
13 14 11
14 238 258
15 38 33
16 3 5
Grade girls boys
2 106 116
3 70 72
4 88 57
5 49 42
Total 313 287
34
3.2 Instruments
Data were collected by four means. These were the Test of Ecology Concepts
(TEC), the Attitude Scale towards Science (ASTS), the Test of Logical Thinking
(TOLT) and interviews.
3.2.1 The Test of Ecology Concepts (TEC)
A three-tier diagnostic test, the test of ecology concepts, was used to assess
students’ understanding on Ecological concepts (Appendix B). This scale was
developed by researcher based on previous studies (Reiner & Eilam, 2001; Özkan,
2001; Eilam, 2002). Some of items in the TEC, developed by Özkan (2001), were
revised by reviewing related literature about ecology. Final version of TEC consists
of 19 items concerning basic ecological terms, food web, food chain, energy pyramid
and energy flow. The first tier of the TEC is the multiple-choice content question and
the second tier presents a set of reasons for the given answer in the first tier. The last
tier asks the students whether he/she is sure or not for the given answers for the first
two tiers. Then, the test was given to two science teachers and two science educators
in order to establish content validity. The test was pilot tested and its reliability was
found to be .83. Students were categorized different levels of understanding
according to the test scores they got. Scoring procedure is as given below
1. Complete Understanding: When student gave the correct response for the first
and second tier, then chose the ‘I am sure’ alternative in the third tier, two
points are given, which is called complete understanding.
2. Partial Understanding: Students were not sure in the third tier although
choosing right answers in the first and second tier. One point is given.
3. Lack of Understanding: If students’ responses for one of the tiers or both are
false and they are not sure for the first two tiers, half point is given.
4. Misconception: If students’ responses for one of the tiers or both are false and
they are sure for the first two tiers, zero point is given to students’ responses.

35
3.2.2 Attitude Scale towards Science (ASTS)
In this study, the Attitude Scale towards Science was used to determine
students’ attitude towards science (Appendix C). This scale was developed by
Geban, Ertepınar, Yılmaz, Altın and Şahbaz (1994). The reliability of the scale found
as 0.83. The ASTS has 15 items with a 5-point likert type scale: strongly agree, agree
undecided, disagree, and strongly disagree. It consists of both positive and negative
statements. Negative statements were translated to the scores of positive statements.
Then total score was calculated. Its range was from 0 to 58. While higher scores
showed positive attitudes towards science, lower scores showed negative attitudes
towards science. Reliability of ASTS for this study was found to be .77.
3.2.3 The Test of Logical Thinking (TOLT)
The Test of Logical Thinking (TOLT) was used to determine students’
reasoning ability. It was originally developed by Tobin and Capie (1981) and
translated and adapted into Turkish by Geban, Aşkar and Özkan (1992; Appendix
D). The TOLT contains ten items measuring five reasoning modes. These are
proportional reasoning (Items 1&2), controlling variables (Items 3&4), probabilistic
reasoning (Items 5&6), correlational reasoning (Items 7&8), and combinatorial
reasoning (Items 9&10). Items 1-8 have two parts that students have to give right
answers both parts to get 1 point. In the items 9 and 10, a subject needs to be list all
the possible combinatorial reasoning for 1 point. Total score of the test is 10. Its
reliability was found as .81. In this study, reliability of the TOLT was found to be
.63.
3.3 Variables
There are two types of the variables in this study: the dependent variable and
the independent variable.

36
3.3.1 Dependent Variable
In this study, two variables were dependent variables: students’ ecological
concepts test scores and students’ attitude towards science scores. These scores were
obtained by the instruments The Test of the Ecology Concepts (TEC) and The
Attitude Scale towards Science (ASTS) respectively.
3.3.2 Independent Variable
In this study, there were two independent variables: students’ test of logical
thinking (TOLT) scores and gender. TOLT was considered as continuous variable
and measured on interval scale. TOLT scores are used as covariate. Gender was
considered as discrete variable and it was measured on nominal scale.
Characteristics of the variables were summarized in the Table 3.2
Table 3.2 Characteristics of the variables
Type of Variable Name Type of value Type of Interval Scale
DV TEC Continuous Interval
DV ASTS Continuous Interval
IV TOLT Continuous Interval
IV Gender Discrete Nominal
3.4 Interview with Students
Ten students from an elementary school in Tosya in the fall semester of 2005-
2006 were selected for the interview. These ten students were chosen according to

37
previous science grade obtained from their teachers; 3 from high achievers (grade=
5), 4 from medium achievers (grade= 3-4) and 3 from low achievers (grade= 2).
The interviews were conducted at the end of the study in order to investigate
students’ misconceptions concerning ecological concepts deeply. A semi-structured
interview schedule was used. Interview questions covered 5 main concepts; basic
ecological concepts, food chain, food web, energy pyramid and energy flow. Each
interview lasted about 25 minutes duration. During the interview sessions, notes were
taken and a tape recorder was used.
3.5 Procedure
Design of the study was survey since students’ misconceptions about ecology
were identified and students’ reasoning ability and attitude towards science were
investigated. The study started with a detailed review of the literature. After
determining a keyword list, the researcher searched Dissertation Abstracts
International (DAI), Social Science Citation Index (SSCI), Educational Resources
Information Center (ERIC), Ebscohost and search engine Google were searched
systematically. After searching of works done abroad, the studies made in Turkey
were searched from YÖK, Hacettepe Eğitim Dergisi and Eğitim ve Bilim Dergisi.
The photocopies of the available documents were taken from METU library, library
of Bilkent University and TUBİTAK Ulakbim. All of the documents obtained were
read. After the reviewing the literature, some items of the ecology concept test were
determined to change. Before conducting TEC, it was examined by two science
teachers and science educators for establishing the content validity. Results of the
study were analyzed and evaluated and necessary changes were done.
3.6 Descriptive Statistics
The mean, median, mode, standard deviation, skewness, kurtosis and range of
the total score of TOLT, ASTS, TEC are found. A description and frequencies of
misconceptions are also presented in descriptive statistics.

38
3.7 Inferential Statistics
The inferential statistics of this study performed by using statistical package
program for social sciences (SPSS).The significance level was set to the .05 because
it is mostly used value in educational studies.
In order to test the hypotheses, Multivariate Analysis of Covariance
(MANCOVA), statistical technique, was used to see the effect of gender on students’
understanding of ecological concepts and attitude toward science when the effect of
reasoning ability is controlled.
3.8 Assumptions and Limitations
3.8.1 Assumptions
1. Test was administered under standard conditions.
2. Students answered test questions seriously.
3. Duration was assumed to be enough for answering all questions in each
instrument.
3.8.2 Limitations
1. The study was restricted to some ecological terms.
2. The sample of this study was limited to public schools. This sample was not
the good representation for students in the private school.
3. The subjects in the interview were restricted to 10 8th grade students.

39
CHAPTER 4
RESULTS
In this chapter, the results of descriptive statistics related to the students’
understanding of ecology measured by the Test of Ecology Concepts (TEC), the
reasoning ability measured by the Test of Logical Thinking (TOLT) and attitude
towards science measured by Attitude Scale towards Science (ASTS), results of the
inferential statistics of testing 2 null hypotheses, the results of the interviews and a
brief summary of the findings are given by means of the four different sections.
4.1 Descriptive Statistics
Descriptive statistics of the Test of Ecological Concepts scores (TEC), Test of
Logical Thinking (TOLT) scores, and Attitude Scale towards Science (ASTS) scores
were given in Table 4.1.
Table 4.1 Descriptive statistics related to the scores of TEC, TOLT, and ASTS.
N Mean Std. Dev Mode Skewness Kurtosis
TEC 600 4.03 2.5 2 0.65 -.04
TOLT 600 2.05 1.8 1 1.5 3.0
ASTS 600 55.5 8.5 54 0.9 -.03
As seen from the Table 4.1 that the mean of TEC is very low (M=4.03). Most
of the students answered 2 items correctly out of 19. Students’ scores in TEC range
from 0 to 13.
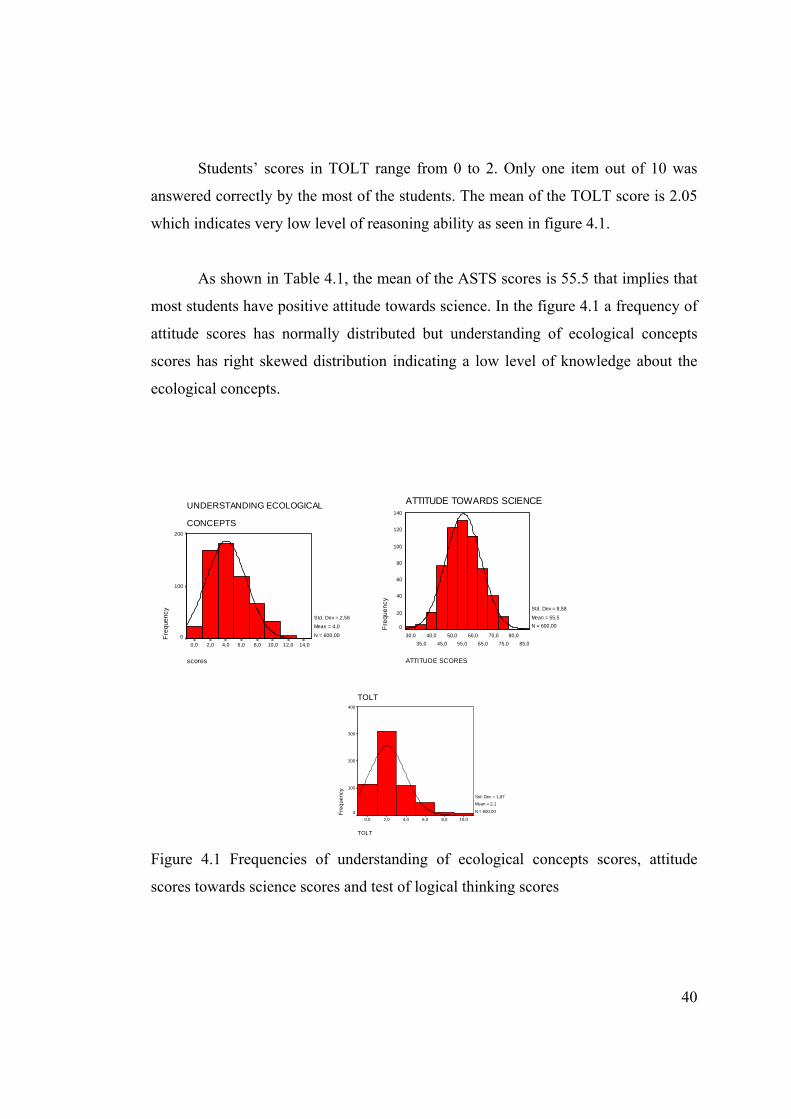
40
Students’ scores in TOLT range from 0 to 2. Only one item out of 10 was
answered correctly by the most of the students. The mean of the TOLT score is 2.05
which indicates very low level of reasoning ability as seen in figure 4.1.
As shown in Table 4.1, the mean of the ASTS scores is 55.5 that implies that
most students have positive attitude towards science. In the figure 4.1 a frequency of
attitude scores has normally distributed but understanding of ecological concepts
scores has right skewed distribution indicating a low level of knowledge about the
ecological concepts.
scores
14,012,010,08,06,04,02,00,0
UNDERSTANDING ECOLOGICAL
CONCEPTS
Freq
uenc
y
200
100
0
Std. Dev = 2,56
Mean = 4,0
N = 600,00
ATTITUDE SCORES
85,080,0
75,070,0
65,060,0
55,050,0
45,040,0
35,030,0
ATTITUDE TOWARDS SCIENCE
Freq
uenc
y
140
120
100
80
60
40
20
0
Std. Dev = 8,58
Mean = 55,5N = 600,00
TOLT
10,08,06,04,02,00,0
TOLT
Freq
uenc
y
400
300
200
100
0
Std. Dev = 1,87 Mean = 2,1
N = 600,00
Figure 4.1 Frequencies of understanding of ecological concepts scores, attitude
scores towards science scores and test of logical thinking scores

41
4.1.1 Descriptive statistics of the TEC
In the Test of Ecology Concept, each item has three tiers. First tier is the
content question and the second tier presents a set of reasons for the given answer in
the first tier. The last tier asks the student whether he/ she is sure or not for the given
answers for the first two tiers.
Students’ responses to TEC were analyzed and scored according to four types
of understanding that are complete understanding, partial understanding, lack of
understanding and misconception. Table 4.2 shows distribution of students and their
points according to types of understanding.
Table 4.2 Distribution of students and their points according to
types of understanding
Types of Understanding Points Number of Students
Complete Understanding 26 1 24 2 22 3 20 15 18 17 16 26 14 42 12 55 10 64 8 88 6 93 4 96 2 72 0 26 Partial Understanding 9 1 6 3 5 7 4 15 3 60 2 101 1 163 0 250

42
Table 4.2 Continued
Types of Understanding Points Number of Students
Lack of Understanding 9.5 22 9 61 8.5 93 8 91 7.5 80 7 62 6.5 55 6 42 5.5 25 5 17 4.5 15 4 3 3.5 2 3 9 2 5 1 7 0 11 Misconception 19 250 18 164 17 100 16 59 15 15 14 8 13 3 10 1
Types of understanding were calculated for item 7 related to decomposers that
is one of the most common misconception. Moreover, interpretation of the Table 4.2
is given below.
1. Complete Understanding: In item 7 related to decomposers, 14.7% students
gave the correct response for both first and second tier, then chose the ‘I am
sure’ alternative in the third tier, they took 2 points. Table 4.2 shows that only
one student who has complete understanding gave desired answers to all 13
items in TEC.
2. Partial Understanding: In item 7, 6 % of the students were not sure in the third
tier although choosing right answers in the first and second tier. They took

43
one point. The highest point is 9 that only one student took according to TEC
results and 250 students were sure what they chose as seen in Table 4.2.
3. Lack of Understanding: 36.2 % of the students’ responses for one of the tiers
or both are false in item 7 and they are not sure for the first two tiers, they
took half point. Table 4.2 shows that 22 students have the highest points in
lack of understanding.
4. Misconception: 43.1 % of the students’ responses for one of the tiers or both
are false in item 7 and they are sure for the first two tiers, they took zero
point. As seen in the Table 4.2, 250 students were sure for the first two tiers
of 19 items though they failed to give right responses for one of the tiers or
both.

44
The percentages of the students’ correct answers for each item and each tier
are given in Table 4.3 and Figure 4.2. For the first tier percent of the answers for
most of the items are high. The percentage of correct response ranged from 19% to
92.2% (M=55.8%). For the first and second tier were combined, the percentage of
correct response was reduced the range of 6.6% to 78.5% (M=27%). When all three
tiers combined in terms of correct and sure responses, the range was 3.6% to 75.5%
(M=21.2%).
Table 4.3 Percentages of 8th grade students’ content knowledge, its reason and their
confidences for the first two tiers.
Items 1st Tier (%) Combination of first Combination of
two tiers (%) all three tiers (%)
1 92.2 78.5 75.5
2 44.5 24.5 20
3 19 6.6 3.6
4 59.2 52 48
5 79.5 37.2 29.8
6 66.3 24 15.6
7 87 20.8 15
8 42.3 24.6 17
9 56.3 25.5 22
10 40.5 15.2 9.1
11 22.6 13.2 11.8
12 22.3 17.8 15.6
13 55.6 43.2 33.1
14 78.3 41.5 28.1
15 59.3 8.5 4.2
16 60.2 26.3 18.3
17 50.8 12.6 7.6
18 67.8 32.3 22.6
19 56.8 10.3 5.6
Average 55.8 27 21.2

45
In Figure 4.2, students’ desired responses for the first tier, combination of
first two tiers and combination of all three tiers for all items can be seen clearly.
0,0010,0020,0030,0040,0050,0060,0070,0080,0090,00
100,00
1 2 3 4 5 6 7 8 9 10 11 12 13 14 15 16 17 18 19
itemsperc
enta
ges o
f des
ired
resp
onse
first tier combination of first two tiers combination of all three tiers
Figure 4.2 Distribution of the students’ desired responses of the three tiers for all
items

46
Table 4.4 shows the students’ misconception identified through Test of
Ecology Concepts and the percent of misconception. Only the misconceptions higher
than 5% were listed in Table 4.4
Table 4.4 A list of students’ misconceptions identified through test of ecology
concepts
Misconception Item Number Percent
A. Basic Ecological terms
1. The number of people in Turkey is an example of 2 5
population because population is group of people in a certain area.
2. The number of people in Turkey is an example of 2 5.3
population because population is the group of the
member of species in a certain area.
3. Decomposers are important for ecosystem because 7 5.7
they are found on dead animals.
4. Decomposers are important for ecosystem because 7 34.8
they eat dead plants and animals to keep environment clean.
B. Energy Sources in Ecosystem
1. The energy source for plants is soil because plants grow 4 13.2
in soil.
2. The energy source for plants is air because they use 4 7.3
the gases in air to get energy.
3. There is a relationship between plants and animals 5 19.5
with respect to energy because animals eat plants.
4. There is relationship between plants and animals 5 7.3
with respect to energy because both plants and animals
have their own energy.
5. There is relationship between plants and animals 5 5.2
with respect to energy because animals are stronger
than plants and they have their own energy.
6. There is no relationship between plants and animals 5 5
with respect to energy because both animals and plants
have their own energy.

47
Table 4.4 Continued
Misconception Item Number Percent
C. Food Chain
1. A bacterium inside the human body is a part of 6 12.3
food chain because bacterium decomposes lifeless
body, break into mineral.
2. A bacterium inside the human body is not a part of 6 5.3
food chain because bacterium feed on our body.
3. Food chain is a kind of feeding including different 8 15.2
food materials because it is consisted of proteins and
vitamins found in foods.
4. Food chain is the transfer of energy from one 8 5.5
living to another because food chain exists
when an animal eats a plant.
5. Nectar, butterfly and bird are constituents of 10 7.8
a food chain because a bird eats others due to
being stronger than others.
6. Nectar, butterfly and bird are not constituents of 10 9.2
a food chain because nectar is food of butterfly.
7. Nectar, butterfly and bird are not constituents 10 14.8
of a food chain because nectar is not a plant.
8. Nectar, butterfly and bird are not constituents 10 6.7
of a food chain because nonliving things are not
in the food chain.
D. Notion of Energy
1. In a food chain including plants, insect, chicken and man, 9 13.7
energy does not pass from one living thing to another
because every living thing has its own energy.
2. In a food chain including plants, insect, 9 7.8
chicken and man, energy flows through man to plant
because man has the greatest energy.
3. In a food chain including plants, insect, chicken 9 8.2
and man, energy flows through plant to man because
man does not give energy to anything.
4. In a food chain including grass , sheep and man, 11 16
man has the greatest energy because man is stronger
and has more energy

48
Table 4.4 Continued
Misconception Item Number Percent
5. In a food chain including grass, sheep, and man, 11 32.2
man has the greatest energy because he gets his energy
both from grass and sheep.
6. In a food chain including grass, sheep and man, 11 5.7
man has the greatest energy because meat is
a powerful energy source and nutritious food for man.
7. Among lion, rabbit and man, lion is the primary 12 8.7
consumer because lion is the wild and strong animal.
8. Among lion, rabbit and man, lion is the primary 12 8.7
consumer because lion is a carnivore.
9. Among lion, rabbit and man, man is the primary 12 39.7
consumer because he consumes everything.
10. In an energy pyramid, man occupies the base 13 6.3
because the number of man highest in nature.
11. In an energy pyramid, consumers occupy 13 7.8
the base because they have the greatest energy.
E. Food Web
1. In a food web, a change in one population 14 12.8
will only effect another population if two population 16 7.1
are directly related as predator and prey. 17 7.8
18 5.8
19 11.9
2. A population located higher on a given 15 6.25
food chain within a food web is a predator of 18 10.8
all populations located below it in the chain.
3. A change in the size of a prey population 14 5.5
has no affect on its predator population. 16 6.7
15 6.3
4. If the size of one population in a food web 15 19.3
is altered, all other populations in the web will be 19 9
altered in the same way.

49
As a summary, students have many misconceptions about basic ecological
concepts such as energy sources in ecosystem, notion of energy, food chain and food
web. The highest misconception is related to primary consumer, students thought that
among lion, rabbit and man, man is the primary consumer because man consumes
everything (39.7%), which shows students can not differentiate consumers.
Moreover, 34.8% of the students have problem about the role of decomposers in
ecosystem because they consider that they eat dead plants and animals to keep
environment clean. In item 11 related to energy, 32.2% of students chose that in a
food chain including grass, sheep, and man, man has the greatest energy because he
gets his energy both from grass and sheep. Students thought that energy is adding up
so man has the greatest energy. Moreover, 19.5% of the students stated that there is a
relationship between plants and animals with respect to energy but they assume that
this relationship depends on food not energy. Most of the students fail to answer the
question 14, 15, 16, 17, 18 and 19 concerning food web. They thought that in a food
web, a change in one population would only effect another population if two
populations were directly related as predator and prey. This shows that students do
not understand prey, predator and the relationship between them clearly. Also, they
assumed if the size of one population in a food web is altered, all other populations in
the web will be altered in the same way and they thought that a population located
higher on a given food chain within a food web is a predator of all populations
located below it in the chain.
4.1.2 Descriptive Statistics of TOLT
The Test of Logical thinking (TOLT) was used to determine formal reasoning
of students. The TOLT contains ten items measuring five reasoning modes. These
are proportional reasoning (Items 1&2), controlling variables (items 3&4),
probabilistic reasoning (Items 5&6), correlational reasoning (Items 7&8), and
combinatorial reasoning (Items 9&10).

50
The frequencies and percentages of students with respect to five reasoning
modes can be seen in the Table 4.5. Most of the students have high combinational
reasoning ability (49.1%) but they have low correlational (8.3%) reasoning ability.
Table 4.5 Frequencies and percentages of students with respect to
five reasoning modes
Reasoning mode Item f %
Proportional 1 145 24.3
Proportional 2 80 13.3
Total 225 18.75
Controlling variables 3 103 17.7
Controlling variables 4 88 14.7
Total 191 15.9
Probabilistic 5 79 13.3
Probabilistic 6 41 6.8
Total 120 10
Correlational 7 50 8.3
Correlational 8 50 8.3
Total 100 8.3
Combinational 9 338 56.3
Combinational 10 252 42
Total 590 49.1

51
A clear picture can be seen in Figure 4.3 which shows the distribution of each
item and their frequencies.
050
100150200250300350400
1 2 3 4 5 6 7 8 9 10
Items
Num
ber o
f Stu
dent
s
Figure 4.3 Distribution of students’ TOLT scores
TOLT scores are also classified into three formal reasoning levels; low
(scores from 0 to 3), medium (scores from 4 to 7) and high (scores from 7 to 10).
Table 4.6 shows the distribution of students with respect to levels of formal thought.
This table indicates that 533 students (88.8%) have low formal reasoning ability, 57
students (9.5%) have medium formal reasoning ability and 10 students (1.6%) have
high formal reasoning ability. The majority of students have low formal reasoning
ability.

52
Concerning gender difference, the number of the girls is slightly higher than
boys at low formal reasoning ability, but the number of boys at medium formal
reasoning ability is higher than girls at the medium formal reasoning ability and a
few boys (4) and girls (6) have high level of formal reasoning level.
Table 4.6 Distribution of students with respect to level of formal thought
Formal Reasoning Level (N)
Low Medium High Total
Boys 249 34 4 287
Girls 284 23 6 313
Total 533 57 10 600

53
Descriptive statistics for the gender and reasoning ability with respect to
understanding of the ecological concepts and attitude towards science are
summarized in Table 4.7. As seen in the table, students at high level reasoning ability
have higher mean understanding of the ecological concepts. Girls at the high,
medium and low formal level have slightly higher mean of understanding of the
ecological concepts than boys at the high, medium and low level reasoning ability as
seen in the Figure 4.4. Mean of attitude scores of girls is higher than boys at low and
medium level reasoning ability; thus, girls at low and medium level reasoning ability
have more positive attitude towards science than boys at low and medium level
reasoning ability but boys at high level reasoning ability have more positive attitude
than girls at high level reasoning ability. Mean of attitude scores of girls is lower
than boys at higher level reasoning ability. This pattern can be seen clearly in the
Figure 4.5
Table 4.7 Descriptive statistics for the gender and reasoning ability with respect
to understanding of ecological concepts and attitude Low Medium High Total
Mean SD Mean SD Mean SD Mean SD
Attitude
Boys 53.9 8.24 58.4 8.88 65.7 4.3 54.6 8.48
Girls 56.1 8.6 59.5 6.5 61.2 8.4 56.4 8.5
Total 55.1 8.5 58.8 7.9 63.0 7.1 55.5 8.5
Understanding
Boys 3.4 2.3 4.7 2.5 5.7 0.95 3.6 2.3
Girls 4.3 2.7 5.3 2.2 6.0 2.4 4.4 2.6
Total 3.8 2.5 4.9 2.4 5.9 1.9 4.0 2.5
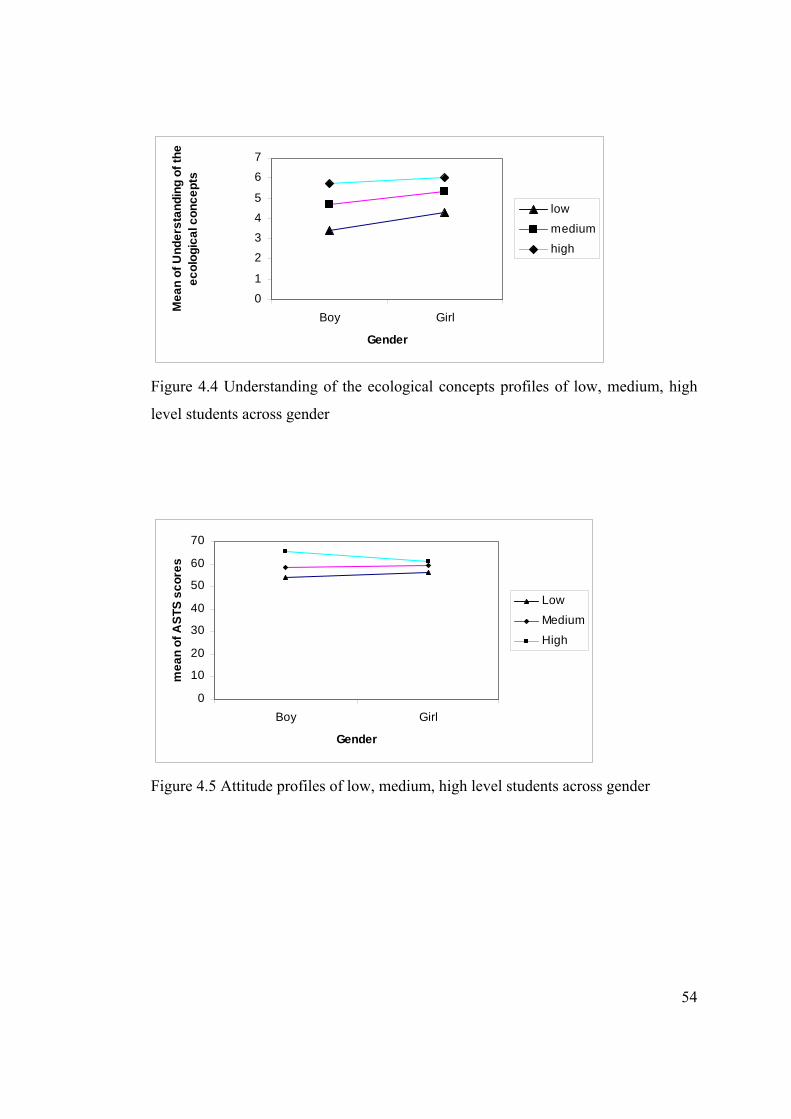
54
0
1
2
34
5
6
7
Boy Girl
Gender
Mea
n of
Und
erst
andi
ng o
f the
ec
olog
ical
con
cept
slow
medium
high
Figure 4.4 Understanding of the ecological concepts profiles of low, medium, high
level students across gender
0
10
20
30
40
50
60
70
Boy Girl
Gender
mea
n of
AST
S sc
ores
Low
Medium
High
Figure 4.5 Attitude profiles of low, medium, high level students across gender

55
4.2 Inferential Statistics
Multivariate Analysis of Covariance (MANCOVA) performed to investigate
the effect of gender on students’ understanding ecological concepts and attitude
toward science when the effect of reasoning ability is controlled. Statistical analysis
was performed at .05 significance level using Statistical Package for Social Sciences
(SPSS). Two dependent variables were used: scores of ecology concept test and
attitude scale towards science. The independent variable was gender. Reasoning
ability was used as covariate. As seen in Table 4.8 and Table 4.9, there were
correlations among dependent variables and independent variables, and between
independent variables.
Table 4.8 Significance test of correlation between independent variables and
dependent variables Variables Correlation Coefficients
ATTITUDE UNDERSTANDING ATTITUDE .215 UNDERSTANDING .215 GENDER .106 .157 TOLT .172 .278 *Correlation is significant at the 0.05 level (2-tailed).
Table 4.9 Significance test of correlation between independent variables Variables Correlation coefficients GENDER TOLT
GENDER .39 TOLT .39 Correlation is significant at .05 level (2-tailed)
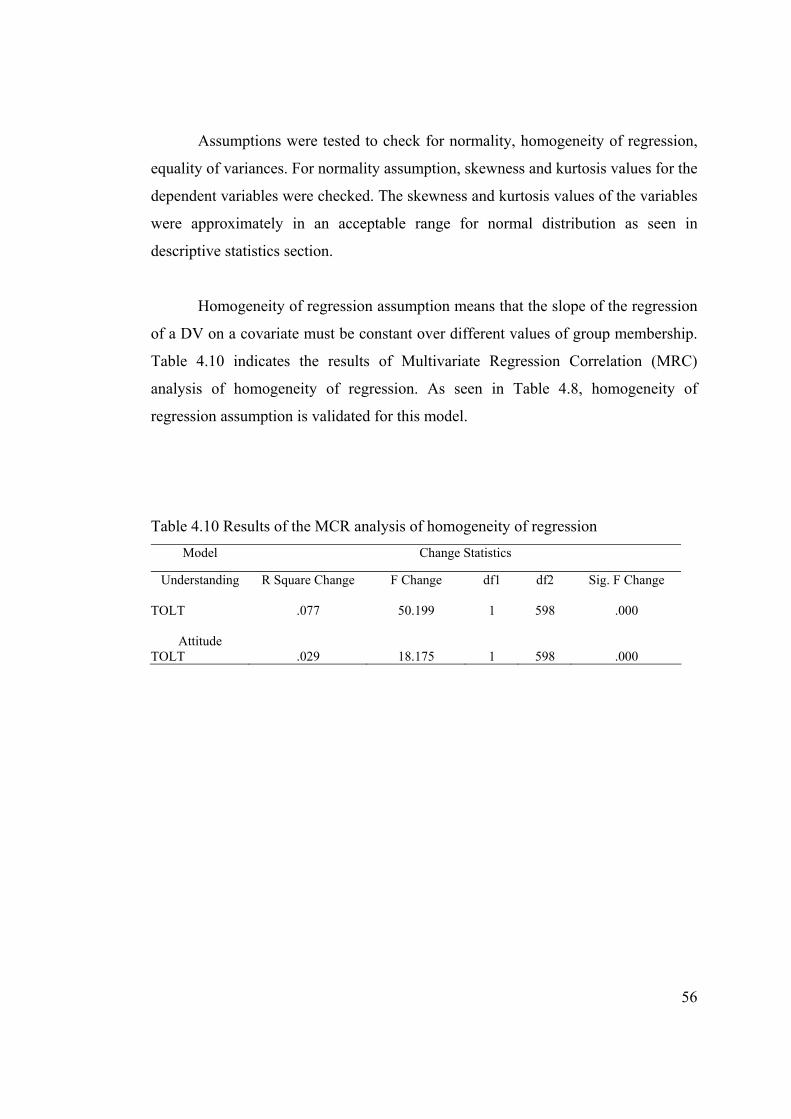
56
Assumptions were tested to check for normality, homogeneity of regression,
equality of variances. For normality assumption, skewness and kurtosis values for the
dependent variables were checked. The skewness and kurtosis values of the variables
were approximately in an acceptable range for normal distribution as seen in
descriptive statistics section.
Homogeneity of regression assumption means that the slope of the regression
of a DV on a covariate must be constant over different values of group membership.
Table 4.10 indicates the results of Multivariate Regression Correlation (MRC)
analysis of homogeneity of regression. As seen in Table 4.8, homogeneity of
regression assumption is validated for this model.
Table 4.10 Results of the MCR analysis of homogeneity of regression Model Change Statistics
Understanding
R Square Change F Change df1 df2 Sig. F Change
TOLT .077 50.199 1 598 .000
Attitude
TOLT .029 18.175 1 598 .000

57
Table 4.11 indicates the Box's M Test of Equality of Covariance Matrices. As
seen from the table, the observed covariance matrices of the DVs were equal across
groups.
Table 4.11 Box's M test of equality of covariance matrices
Box’s M 4.733 F 1.572 df1 3 df2 84437201 Sig .194
Levene's Test of Equality was used to determine the equality variance
assumption. Table 4.12 shows that the error variances of the selected DVs across
groups were equal.
Table 4.12 Levene's test of equality of error variances
F Df1 Df2 Sig
Attitude .048 1 598 .828
Understanding 6.03 1 598 .014
Hypothesis of the study:
There is no significant main effect of gender on the population means of
understanding of ecological concepts and attitude towards science when the effect of
TOLT scores is controlled.

58
This hypothesis was tested by MANCOVA. Table 4.13 shows that there was
statistically significant gender difference in favor of girls with respect to collective
dependent variables when the effect of TOLT scores controlled (Wilks’
Lambda=0.97; p=.00). Eta squared represents the proportion of variance of the
dependent variable. Values for eta squared can range from 0 to 1. Effect size (eta
square) of gender is small, effect size of TOLT is high. Sample size of this study
(N=600) is higher than 100 so power is not an issue.
Table 4.13 MANCOVA results
Source Wilks’ Hypothesis F Sig (p) Eta- Observed
Lamda df Squared Power
Intercept .51 2 5566.99 .000 .949 1
GENDER .971 2 8.893 .000 .029 .97
TOLT .911 2 29.253 .000 .089 1

59
In order to test the effects of covariate on each dependent variable, a
univariate analysis of covariance (ANCOVA) was conducted as follow-up tests to
the MANCOVA. Table 4.14 shows gender difference is effective on both attitude
towards science and understanding ecological concepts. Table 4.14 also indicates
that TOLT has significant effect on understanding and attitude.
Table 4.14 Test of between subject effects Source Dependent
Variable df F Sig. Eta Squared Observed
Power Corrected Model
Attitude 2 12,239 .000 .039 .996
Understanding 2 32.784 .000 .099 1.000 Intercept Attitude 1 11130.297 .000 .949 1.000 Understanding 1 481.124 .000 .446 1.000 TOLT Attitude 1 17.485 .000 .028 .987 Understanding 1 49.145 .000 .076 1.000 GENDER Attitude 1 6.147 .013 .010 .697 Understanding 1 14.256 .000 .023 .965 Error Attitude 597 Understanding 597 Total Attitude 600 Understanding 600 a Computed using alpha = .05
4.3 Result of interviews
Interview sessions were conducted individually with ten 8th grade students to
reveal reasons behind the students’ misconception. Interview questions covered
environment, specious, populations, ecosystem, biosphere, producers, consumers,
decomposers, energy pyramid, energy flow, food chain and food web topics.
1. Definition of environment and interpretation of the living and non living
things

60
Most of the students define environment as a place where living and non-
living things live. Some of the students said that environment is a place that people,
animals and plants live, they do not consider non-living things in the environment.
Most of the students differentiate living things from non-living things. While most of
them explain the relationship between living and non-living things, some of them
have misconception about how they are related, for example, two of the students
said:
‘‘Living things take energy from non-living things like plant that takes water
from soil.’’
They thought that soil is the energy source of plant. On the other hand, one
student considered nonliving and living things relationship as a nutrient cycling, for
instance, she said:
‘‘Living things die, decompose into minerals and plants take minerals,
animals eat plants.’’
She did not consider energy relationship. Some of the students who have low
grades have no idea about the relationship between the living things and non-living
things.
It can be said that most of the students define the environment correctly. This
result was consistent with the TEC scores. On the other hand, some of the students
have misconceptions about the relationship between living and non-living things.
While some of them know partially, some of them have no idea.
2. Definition of some ecological conceptions
When asked what the species is, two of the students said that they had no idea
about species and seven of them said that it is a type. They remembered everyday
language meaning of species not the scientific meaning. While only one of the
students defined species as variety in living things, she said that she did not
remember much more so she could not give an example for species. Moreover, when
asked what the population is, students’ response showed that they have

61
misconception or lack of knowledge. Students confused population with the human
population that is the popular saying; for example, three of the students stated:
‘‘Population is the number of people.’’
Also, most of the students said that they did not know what the population is.
When asked whether the population and species are similar things, four students
stated that they were not same and they explained this with different reasons whereas
six of them said that they did not know; for instance,
‘‘Species is a kind whereas population is human population.’’
‘‘I do not know whether the population and species are similar things’’
Next question is about ecosystem. Except one student who said he did not
know the definition of the ecosystem, all of the students gave response for this
question. Five students out of ten defined ecosystem as ecologic balance and
arrangement in nature. Only one student gave the desired response and he explained
ecosystem is the interrelationship between living and non-living things. While one of
the students remembered ecosystem as a food chain of the world like snake eats frog,
others remembered pollution that affects balance of ecosystem or style of living as
ecosystem. Some of the students’ responses;
‘‘Ecosystem is balance and arrangement in nature.’’
‘‘Ecosystem is the interrelationship between living and non-living things.’’
‘‘Ecosystem is the food chain of the world; snake eats frogs.’’
When students were asked what biosphere is and whether different
ecosystems constitute biosphere, only two of the students gave answer that biosphere
is earth and different ecosystem constitute biosphere. However, others could not give
any response; thus, most of the students have no idea about biosphere.
3. Energy and Energy Source
When interviewer asked how you could describe energy, students gave
different responses, for example, one student said that men get energy from food they
62
eat and another described energy as it is the thing that provides our movement. Also,
some of the students defined energy as
‘‘Amount of materials in living and non-living things.’’
Moreover, some of the students explained that sun or soil are the source of
energy in the nature while others stated that they did not know for the source of
energy in the nature. For the question of how living things use sun as energy, three
students failed to response this question and others explained that plants use energy
by taking water from soil or photosynthesis and men use sun as heat. Moreover, two
of the students explained that plants get energy from soil and animals eat plants so
animals get energy. For the question about the relationship between animals and
plants in terms of energy, one student replied:
‘‘There is no relationship between animals and plants since plants get energy
from rain; animals get energy from what they eat.’’
As a summary, students’ responses to the questions revealed the presence of
misconceptions among students concerning source of energy. Most of the students
thought that foods eaten or soil were described as source of energy. Some of the
students said that sun is the source of energy but men get this energy as heat. In
addition, some explained that plants get energy from soil and rain and animals get
energy from plants. As a result, students’ answers indicated that students had
misconception about energy and energy source.
4. Food chain
When asked definition of food chain, students gave different responses.
Students thought food chain as eating order or food. They confused food with the
popular saying. Their response showed that they have misconception about food
chain; for example, some of the students stated:
‘‘Different foods coming together constitute food chain.’’
‘‘Strong animals eat weak animals’’
‘‘Animals eating each other are called food chain.’’

63
In the second question, students were asked to draw a food chain and show
the consumers on it. One of the students drew as figure 4.6 and stated first consumer
is a cow that eats producers. Second consumer that eats first consumer is lion. When
asked the reasons of the starting a plant to food chain and which one has the most
energy, she explained that flowers are producers which produce their food by
photosynthesis and flowers has the most energy. From her drawings, it is concluded
that she thought food web as a simple of food chain and she drew a cyclic food
chain. Other students drew a linear food chain as men→food→energy. They thought
that man is the consumer and because of stating man first in their food chain
drawings, they believed that food has the most energy so man eats food to get
energy. Some of the students defined food chain as producer→ first consumer→
second consumer→ third consumer and stated that first consumer is herbivore,
second consumer is carnivore and omnivore. They also said that plants give oxygen
to air so it is producer.
Figure 4.6 Food chain is a kind of germination of seed by student 4
As a result, students’ responses to those questions indicated the presence of
misconceptions among students concerning food chain. Students do not consider the
food chain as a flow of energy through its members. Some students thought that food
chain is a kind of feeding including different food material and also they thought that
food has the most energy so they started with food. Some of them stated that energy

64
is transferred from weak animals to strong animals and man has the most energy.
While most of the students started with a plant or producer to food chain, others
started with animal or man. Whereas one of the students drew the food chain as a
cycle (figure 4.7), others drew a linear chain. One of the students confused
germination of seed with food chain as seen in the figure 4.6. To sum up, students
have many misconceptions about food chain.
Figure 4.7 Food chain as a cyclic chain by student 1
In the next question about food chain, interviewer asked if nectar, butterfly
and bird are constituents of a food chain and the reasons behind this. Most of the
students said that they are not constituents of a food chain because of many reasons.
For instance, one of the reason is that butterfly can not eat nectar. Another reason is
that nectar is not a producer; it is the part of the flower. Other reason is that there is
no food for butterfly. Answers to this question revealed the some of students’
misconception concerning food chain. Some thought that nectar could not act as a

65
producer because nectar is only the part of plant. Some of them do not know what the
nectar is so they thought there is no food for butterfly.
In the last question students were asked whether a bacterium inside the
human body is a part of food chain or not and what could be the reasons of this. One
of the students responded ‘‘a bacterium inside the human body is a part of food chain
because a bacterium eats other organisms’’ but other students said that a bacterium
inside the human body is not a part of food chain since it decomposes organic
materials into inorganic materials in the ecosystem. Other students explained the
reason is that there is no producer. These answers indicated that students held many
misconceptions concerning functions of bacteria in food chain. Most of the students
thought bacteria as decomposer and they thought that food chain should be started
with producers. Two students stated that food chain starts with a plant and there was
no producer in our body so a bacterium inside the human body is not a part of food
chain.
5. Energy pyramid
When asked about the Energy Pyramid, students gave different responses
like:
‘‘A group of energy.’’
‘‘Order of energy.’’
‘‘A group of living things that constitutes energy pyramid.’’
Students do not have accurate meaning of energy pyramid. Although some of
the students could not draw energy pyramids, most of the students drew energy
pyramids correctly but labeled wrongly as seen in the figure 4.8, figure 4.9, and
figure 4.10.

66
Figure 4.8 Drawing about energy pyramid indicating the producer, first
consumer and decomposer by student 1
Figure 4.9 Drawing of energy pyramid indicating the number of organism
by student 5

67
Figure 4.10 Drawing of energy pyramid by student 9
After energy pyramid was drawn, they were asked why they gave place for
decomposers in the top of the energy pyramid. Only one student explained that they
decompose all of them. Other students said ‘‘decomposers are very small and have
very little energy so they located top of the energy pyramid’’. Others have no idea
about this. Next question is that why the base of energy pyramid is larger than the top
of energy pyramid or why the top of the energy pyramid is smaller than the base.
Most of the students stated that the number of plants is very high so the base of the
energy pyramid is larger than the top of the energy pyramid. They did not mention
the amount of energy in their explanations.
To sum up, students’ responses to those questions indicated the presence of
misconceptions among students regarding energy pyramid. Most of the students
defined energy pyramid as group of energy or order of energy. While some of them
could not draw an energy pyramid correctly, other drew it but identify its parts
wrongly. They put decomposer at the top of the energy pyramid. They stated that the
number of organism decreases from the base of the energy pyramid to the top so the
base of the energy pyramid is larger than the top of the energy pyramid. As a result,
all of these revealed that students had misconceptions about energy pyramid.

68
6. Food web
When asked about food web, one of the students expressed the circulation of
materials. He thought that water evaporates from sea and ocean, condense in the
atmosphere and rain to earth (Figure 4.11). On the other hand, only one student could
draw food web in the land and water ecosystem but her drawings indicated food web
as a simple cyclic food chain (Figure 4.12 and Figure 4.13). Other students, however,
defined food web as the group of many foods. Students confused food web with food
chain or materials cycling. However, most of the students failed to draw food web.
Figure 4.11 Drawing of food web by student 2

69
Figure 4.12 Drawing of food web in land ecosystem by student 1
Figure 4.13 Drawing of food web in the water ecosystem by student 1

70
As seen in the drawings and students’ responses, most of the students had no
idea about food web or they had misconceptions about food web. Some students
stated circulation of materials as food web; others had difficulty in differentiating the
food chain from food web in construction of the food web.
J I
H
K C
F D
B
G E
A
Figure 4.14 A sample of food web (Webb & Boltt, 1990)
When interviewer showed a sample of food web diagram (figure 4.14) and
asked about the meaning and importance of direction of arrows, most of the students
said that arrows indicate that big animals eats small animals and the direction of the
arrows is not important. In addition, one of the students responded that direction of
the arrows is not important and arrows show the food. On the other hand, some of the
students said that they revealed the relationship; they thought that direction is
important; for example, they said ‘‘arrows show prey and predator’’. Although most
of the students described A as a producer, some of the students said that A is a plant
or A is a soil when asked what A is.
Next question is about the effects of changing the environmental conditions in
this food web (Figure 4.14). They were asked what happens to population H in figure
4.14 if there is a sudden decrease in population F. Some of the students explained

71
their answers as while F decreases, H increases whereas others responded that when
H decreases, F decreases because F is the food of H. In the other question, students
were asked whether sudden decrease in population E affects the population H or not
(Figure 4.14) and how this happens. Some of the students stated that when E
decreases, H does not change since population E affects F but it does not affect H
though others answered that it does not affect H since there is no direct relationship.
Similarly, they were asked if a sudden increase in population G affects the
population F or not (Figure 4.14). One of the students said that G does not increase.
Others stated that it does not affect since there is no relationship between them. In
the last question, students were asked whether a sudden size change in population A
affect the population J in Figure 4.14 and how, some of the students mentioned that a
size change in population A does not affect B, K and J. Some other students stated
that it does not affect because there is no direct relations. Other students said that
when population A increases, population B decreases so population K increases and
population C decreases because population A eats population B.
As a result, students’ answers show that they had many misconceptions about
food web. They could not differentiate prey population and predator population.
They considered food chain inverted. Furthermore, they do not have ability to
determine the effect of sudden size change in one population on prey and predator
and non-adjacent population.
To sum up, results of interview are consistent with the results of TEC.
Moreover, interview results show that students have many misconceptions and
reasons of these misconceptions.
4.4 Summary of the Results
1. Based on the TEC results, students’ responses were categorized as complete
understanding, partial understanding, lack of understanding and
misconceptions were examined. For example, in item 7 related to

72
decomposers, 14.7% of the students have complete understanding, 6% of the
students have partial understanding, 36.2% of the students have lack of
understanding and 43.1% of the students have misconceptions.
2. About 55.8% of the students have complete understanding in the first tier.
27% of the students have complete understanding in the combination of first
two tiers and 21.2% of the students have complete understanding in the
combination of the all three tiers.
3. The results of this study indicated that students have many misconceptions
about basic ecological terms, food chain, food web, energy flow and source
of energy according to results of TEC and interviews. For instance, according
to TEC results, in item 7 related to decomposers, about 34.8% of the students
have misconceptions the role of decomposers in ecosystem because they
consider that they eat dead plants and animals to keep environment clean. In
the interview, students located decomposers at the top of the energy pyramid
and they explained reason of this that decomposers decompose all of the
organisms below in the energy pyramid.
4. In item 11 related to energy flow, about 32.2% of students chose that in a
food chain including grass, sheep, and man, and man has the greatest energy
because he gets his energy both from grass and from sheep. In the interview,
students stated reason that energy is adding up so man has the greatest
energy.
5. In item 12 related to primary consumer, 39.7% of the students chose that
among lion, rabbit, and man, man is the primary consumer because he
consumes everything.

73
6. In item 5 related to energy, about 19.5% of the students stated that there is a
relationship between plants and animals with respect to energy but they
assume that this relationship depends on food but not energy.
7. During interview, new misconceptions were found; for example, students
confused germination of seed or circulation of material with food web.
Moreover, students drew food chain as cyclic chain not linear. Furthermore,
students thought that energy pyramids show the number of organisms.
8. The mean of the TOLT score is 1.1 which indicates very low reasoning
ability, the mean of the ASTS scores is 55.5 which implies that most students
have positive attitude towards science and the mean score of TEC is 4.03
which shows very low understanding of the ecological concepts.
9. Most of the students have high combinational reasoning ability (49.1%) but
they have low correlational (8.3%) reasoning ability.
10. There was statistically significant gender difference in favor of girls with
respect to collective dependent variables when the effect of TOLT scores
controlled (Wilks’ Lambda=0.97; p=.00).
11. Female students had higher understanding of ecological concepts and more
positive attitude towards science than male students when the effect of TOLT
scores controlled.

74
CHAPTER 5
CONCLUSION, DISCUSSION AND IMPLICATIONS
This chapter of the study includes overview of the study, conclusions and
discussion of the results, internal and external validity, implications of the study, and
recommendations for further research.
5.1 Overview of the study
The main purpose of the study was to investigate students’ understandings of
ecological concepts and the effect of gender and reasoning ability on 8th grade
students’ understanding ecological terms and attitude towards science. In this study,
Test of Ecology Concepts (TEC), Test of Logical Thinking (TOLT) and Attitude
Scale towards Science (ASTS) were used to measure misconceptions related to
ecological concepts, reasoning ability and attitude towards science respectively.
TEC, TOLT, ASTS were administered to all 8th grade students in Tosya , the biggest
district of Kastamonu.
TEC, three-tier tests, was developed based on the previous studies and
administered in order to asses students’ misconceptions related to ecological
concepts. Statistical analyses were presented in chapter 4.
5.2 Conclusions and Discussion of the Results
The results of this study indicated that students have many misconceptions
about basic ecological terms, food chain, food web, energy flow and source of
energy according to results of TEC and interviews. Most of the students have

75
misconception about food web since students thought food web as a simple food
chain. This can be seen easily in the students’ drawings during the interview. Webb
and Bolt (1990) reported that students aged 15-17 have difficulty in progressing from
food chain to food web and had many misconception about food web than first year
university students since food chain is thought as a simple set of isolated organisms
so students have difficulty to understand food web. Another most common
misconception about food web in this study is that a change in one population will
only affect another population if the two populations are directly related as predator
and prey. During interview, when asked the effect a change in one population on a
second population in other part of the food web, students said ‘‘if two population are
too far apart, there is no effect’’ or ‘‘it does not affect since there is no direct
relationship between population’’. Gallegos (1994), Adeniyi (1985), Griffiths and
Grant (1985) revealed the similar result and claimed that students overcome this
difficulty in food web concept if food chains are thought as interactive population
embedded in an ecological context. Moreover, students could not differentiate first
consumer from second or third consumer; for example, when asked students to order
lion, rabbit and man, most of them chose that man is the primary consumer because
he consumes everything and man has the greatest energy. They thought that
organisms higher in a food web eat everything that is lower in the food web and have
more energy than lower in the food web. Griffiths and Grant (1985) supported our
findings. Moreover, Adeniyi (1985) found the similar results and reported that
Nigerian students aged 13-15 years believed that energy is adding up so man gets his
energy from both cows and plants and has more energy. Adeniyi revealed that some
of this misconception may have existed before instruction but a few of them
appeared result from instruction. Our findings from interview was consistent with
Adeniyi’s results.
Results of TEC and interview also showed that students have many
misconceptions about food chain; for instance, during interview students stated
‘‘strong animals eat weak animals’’, ‘‘food chain is a kind of germination of seed’’
and they drew food chain as a cyclic or linear. They considered part of plant like

76
flower, leaves is not producer and producer must be green; for example, nectar,
butterfly and bird do not constitute food chain since student thought that there is no
producer. They assumed that nectar is part of flower and green plants are only
producers of carbohydrates in ecosystems. Moreover, a bacterium inside the human
body is a part of food chain because a bacterium eats other organisms but other
students said that a bacterium inside the human body is not a part of food chain since
it decomposes organic materials into inorganic materials in the ecosystem. Students
considered bacteria as the microscopic-sized bacteria to diseases when asked whether
bacteria in the human body constitute a food chain as indicated by Eilam (2002).
Eliam concluded that students’ prior knowledge affects further learning as seen in the
function of bacteria.
Findings of this study showed that students have difficulty to understand
energy pyramid and energy source; for instance, most of the students believed that
the source of energy for plants is soil since plant grow in soil. Bell (1985); Adeniyi,
(1985); Smith and Anderson (1984) were reported the similar findings. Interview
results supported TEC findings that students stated source of energy as ‘‘soil since
plants take water and mineral from soil ’’. Moreover, students thought that the
number of plants is very high so the base of the energy pyramid is larger than the top
of the energy pyramid. Students’ drawings indicated that decreasing numbers of
organisms from the base to the apex of the energy pyramid since energy is abstract
concepts so students could not see energy but they see organisms. Therefore,
students labeled number of organism in the energy pyramid. Moreover, they believed
that number of producers is higher than the consumers. On the other hand, Leach et
al. (1996) found that the number of producers is high to satisfy consumers and there
are more herbivores because people keep and breed them and humans provide food
for other organisms.
Furthermore, most of the students have misconception about decomposers.
They thought as decomposers that eat dead animals and plants to keep environment
clean. Çığırgan (2000) reported reason of this that science textbook introduce

77
decomposers as garbage collector (as cited in Özkan et al., 2004). Also, most of the
students gave place decomposers at the top of the energy pyramid during the
interview since they believed that decomposers decompose everything and
decomposers are very small and have very little energy so they located top of the
energy pyramid. Moreover, Adeniyi (1985) found that students located decomposers
at the top of the energy pyramid due to teacher’s placement of decomposers in the
top rung of the energy pyramid and maintained that one of the sources of students’
misconceptions is teachers’ misconceptions.
These results suggest that students brought their misconceptions to the class
and most of the students only memorize scientific facts. They do not try to
understand facts with reasons. Therefore, teachers ought to realize and identify
students’ misconceptions. Also, they should design their lesson to remediate these
misconceptions.
The result of this study revealed that as a three-tier test, TEC provides us to
categorize students’ responses as complete understanding, partial understanding, lack
of understanding and misconception; for example, in item 7 related to decomposers,
14.7% of the students have complete understanding, 6% of the students have partial
understanding, 36.2% of the students have lack of understanding and 43.1% of the
students have misconception. Furthermore, mean percentages of the first and
combination of first two tiers are higher than the combination of all three tiers since
third tier measures confidence of students for their response. About 55.8% of the
students have complete understanding in the first tier. 27% of the students have
complete understanding in the combination of first two tiers and 21.2% of the
students have complete understanding in the combination of the all three tiers.
Percentages of desired responses decrease when tier increases. Therefore, TEC,
three-tier diagnostic test, is useful to identify students’ misconceptions since
misconceptions can be differentiated from lack of understanding, partial
understanding and complete understanding. Also, TEC, three-tier diagnostic test,
does not overestimate misconception.

78
Result of this study showed that there was statistically significant gender
difference in favor of girls with respect to understanding ecological concepts and
attitude toward science (Wilks’ Lambda=0.97; p=0.00). This result is consistent with
the previous studies (Alparsan, Tekkaya & Geban, 2003; Sungur & Tekkaya, 2003).
For example, Sungur and Tekkaya (2003) found that girls have higher achievement
and more positive attitude than boys. Moreover, Alparsan, Tekkaya & Geban (2003)
indicated that a significant difference between performance of girls and that of boys
in the favour of girls. On the other hand, this result is inconsistent with some of the
previous studies (Clarke, 1972; Clark & Nelson, 1972; Kotte, 1992). They reported
that boys have possessed more positive attitude in studying science than girls .
According to Catsambis (1995), girls have less positive attitudes although they
performed better than boys and got higher grades in science classes. Jones (2000)
reported that girls have different experiences outside the school and this affects their
attitude. However, Keeves and Kotte (1992) reported that there were no significant
differences between males and females for biology. Osborne (2003) found reasons of
gender difference as teacher, curricula, cultural and other variables; for example, in
society there is a general silent belief that girls do not do science which affects
students to determine the choice of science course. Therefore, teacher should pay
attention not to introduce gender bias during instruction and there should not be
gender bias in the design of the classroom environment. Curriculum and textbook
should be examined whether gender difference present or not (Sungur & Tekkaya,
2003).
Beside gender difference, reasoning ability effects students’ understanding
ecological concepts and attitude towards science.This result is consistent with the
previous studies (Lawson & Renner, 1975; Lawson & Thompson, 1988; Panizzon,
2003; Sungur & Tekkaya, 2003). For example, Panizzon (2003) found the similar
result that there is a significant relationship between conceptual knowledge and
reasoning ability in science students. Moreover, Lawson and Renner (1975) found
that while high level formal reasoners were able to understand both concrete and
formal concepts, low level reasoners were able to understand only concrete concepts.

79
Sungur and Tekkaya (2003) revealed a significant mean difference between concrete
and formal students with respect to achievement and attitude toward biology.
Moreover, Lawson and Thompson (1988) found that better reasoning ability means
larger mental capacity and higher achievement. Therefore, teachers should be aware
of students’ reasoning ability levels in order to promote meaningful learning and also
teachers ought to design their lesson and classroom environment according to
students reasoning levels; for example, teachers can use concrete problems or
materials in order to foster understanding. In addition, teachers should ask questions
which require analyzing, critical thinking to increase reasoning level (Mwamwenda,
1993). Different instructional methods like learning cycle (Bitner, 1991) or inquiry
(Johnson & Lawson, 1998) should be used to foster scientific reasoning.
In summary, students have many misconceptions. These misconceptions
should be identified before instruction. TEC-three tier diagnostic test- is very useful
tool to identify misconceptions since it does not overestimate misconceptions and
misconceptions can be differentiated from lack of knowledge, partial understanding
and complete understanding by means of TEC. Moreover, result of this study shows
that there was statistically significant gender difference in favor of girls with respect
to understanding ecological concepts and attitude toward science. Furthermore,
results of this study show that there was statistically significant gender difference
with respect to understanding ecological concepts and attitude toward science when
the effect of reasoning ability was controlled.
5.3 Internal and External Validity
There are several important threats to internal validity of survey research;
mortality, location, instrumentation (Fraenkel & Wallen, 1996, p: 383). To control
location threat, same room was used for interview and comfortable conditions were
supported for all interviewees. All schools’ classrooms generally were similar
condition as heating, lightening, wideness, etc for administration of the three-tier test.
Data collector bias and data collector characteristics could not be threat to internal

80
validity since the interviews were conducted by only the researcher. Confidentially
was not a threat because all the interviewees were informed about their answers used
only the purposes of this study.
External validity is the degree to which results are generalizable, or
applicable to groups and environments outside the research setting. There are two
types of external validity: population validity and ecological validity. Population
validity is to degree to which a sample represents the population of interest.
Ecological validity refers to the degree to which results of a study can be extended to
other settings or conditions (Fraenkel & Wallen, 1996 p: 106-109). Our sample is all
eighth grade students in Tosya. So, the outcomes of this study were the accessible
population. TEC, TOLT and ATSS were administered in ordinary classrooms. There
were not many differences among them. However, there were difference among
subject characteristics such as socioeconomic status, education facilities etc which
can affect the results of the study.
5.4 Implications of the Study
There are several important implications according to results of this study and
findings of the previous studies:
1. Results of the previous studies and this study showed that students have
misconceptions and these misconceptions are obstacles for students to learn
new concepts. Teacher should pay attention to students’ misconceptions that
was found in this study or previous studies while planning their learning
activities and learning materials.
2. By means of three-tier diagnostic test, complete understanding, partial
understanding, lack of knowledge can be differentiated from misconception
so three-tier diagnostic test ought to be used to identify misconception.

81
3. Students’ reasoning ability is important for understanding of ecological
concepts that are abstract. It is very difficult for students to understand
abstract ecological concepts like energy flow or notion of energy. In order
to increase understanding, teachers should use more concrete materials like
models, diagrams, simulations to make abstract concepts understandable to
students (Postner, Strike, Hewson, & Gertzog, 1982)
4. Teachers should determine whether they introduce gender bias during
instruction or interaction with their students. In addition, textbooks and
curriculum materials ought to be examined to identify whether they reflect
gender difference or not.
5.5 Recommendations for Further Research
There are several recommendations for the further studies. They can be listed
as the followings:
1. The other biology topics can be investigated by using a three-tier test to
identify students’ misconceptions.
2. The sample can be chosen from different city and sample size can be
increased to get more accurate results for further studies.
3. Eight grade students’ misconception concerning some ecological concept
was investigated in this study. Similar research studies can be conducted for
different grade levels.

82
4. The effect of reasoning ability and gender on students’ understanding and
attitude regarding other biology topics or other subject areas such as
physics, chemistry can be investigated.

83
REFERENCES
Adeniyi, E.O. (1985). Misconceptions of selected ecological concepts held by
some Nigerian students. Journal of Biological Education 19 (4), 311-316.
Anderson, C., Sheldon, T., & Dubay, J. (1986). The effects of instruction on
college nonmajors’ conceptions of respiration and photosynthesis, Research Series
No. 164. East Lansing, MI: Institute for Research on Teaching. ERIC Document
Reproduction Service No. ED 2703
Arnaudin, M. N.,& Mintzes, J. J., (1985). Students alternative conceptions of
the human circulatory system: a cross-age study. Science Education, 69 (5), 721-733.
Aşcı, Z., Özkan, Ö. & Tekkaya, C., (2001). Students’ misconceptions about
respiration. Retrieved March 10, 2005 from
www.fedu.metu.edu.tr/ufbmek-5/b_kitabi/PDF/Fen/Bildiri/t72d.pdf Ausubel, D.P., (1968). Educational Psychology, A cognitive view, New York,
Holt, Ripehart, Winston.
Bar, V., Zinn, B., Goldmuntz, R., & Sneider, C., (1994). Children’s concepts
about weight and free fall. Science Education, 78, 149–169.
Barrass, R., (1984). Some Misconception and misunderstanding perpetuated
by teachers and textbooks of biology. Journal of Biology Education, 18, 201-235.
Bell, B., (1985). Students’ ideas about plant nutrition: what are they? Journal
of Biological Education, 19, 213-218.
Bishop. B. A., & Anderson, C. W., (1990). Student conceptions of natural
selection and its role in evolution. Journal of Research in Science Teaching, 27(5),
415-417.
Bitner, B., (1991). Formal operational reasoning modes: Predictors for critical
thinking abilities and grades assigned by teachers in science and mathematics for
students in Grades nine through twelve. Journal of Research in Science Teaching,
28, 265–274.
BouJaodue, S.B., (1992). The relationship between students’ strategies and
the change in their misunderstandings during a high school chemistry course.
Journal of Research in Science Teaching, 29(7), 687-699.

84
Brehm, S., Anderson, C. W., & DuBay, J., (1986). Ecology: A teaching
module. Occasional Paper No. 94. East Lansing, MI: Institute for Research on
Teaching, Michigan State University.
Browning, M. E., & Lehman, J.D., (1988). Identification of student
misconceptions in genetics problem solving via computer programs. Journal of
Research in Science Teaching, 25(9), 747-761.
Brumby, M. N., (1984). Misconceptions about the concept of natural
selection by medical biology students. Science Education, 68, 493–503.
Campbell, J.R., Voelkl, K.E, & Donohue, P.L., (1998). Report in brief:
NAEP 1996 trends in academic progress.
Canal, P., (1999). Photosynthesis and inverse respiration in plants: an
inevitable misconception. International Journal of. Science Education, 21, 363-371.
Çapa, Y., (2000). An analysis of ninth grade students’ misconceptions
concerning photosynthesis and respiration in plants. Unpublished Master Thesis,
The Middle East Technical University, Ankara
Carey, S., (1985). Conceptual change in childhood. Cambridge, MA: MIT
Press.
Çataloğlu, E., (2002). Development and validation of an achievement test in
introductory quantum mechanics: The quantum mechanics visualization instrument
(QMVI) Online. Retrieved July 30, 2005 from
http://etda.libraries.psu.edu/thesis/approved/WorldWideIndex/ETD-145/ Catsambis, S., (1995). Gender,race,ethnicity, and science education in middle
grades. Journal of Research in Science Teaching, 32, 243-257.
Cavallo, A.M.L., (1996). Meaningful learning, reasoning ability and students’
understanding and problems solving topics in genetics. Journal of Research in
Science Education, 33, 625- 656.
Çetin, G. (2003). Developing and implementing an instructional Technology
aided conceptual change in Teaching Ecology Concepts at nine grade, Unpublished
Master Thesis, The Middle East Technical University, Ankara.
Champagne, A. B., & Klopfer, L. E. (1983,January). Naive knowledge and
science learning. American Association of Physics Teachers, New York.

85
Cherrett, J. M., (1989). Key concepts: The results of a survey of our members'
opinions. Oxford: Blackwell Scientific Publications.
Chi, M.T.H., & Slotta, J. D., (1993). The ontological coherence of intuitive
physics. Cognition and Instruction, 19, 249–260.
Clement, J., (1982). Students’ preconceptions in introductory mechanics.
American Journal of Physics, 50, 1, 66-71.
Engel Clough, E., & Wood-Robinson, C., (1985). Children’s understanding
of inheritance. Journal of Biological Education, 19, 304–310.
D’Avanzo, C. (2003). Application of research on learning to college teaching:
ecological examples. Bioscience, 53, 1121-1128.
Driver,R. & Easley, J.A., (1978). Pupils and paradigms: A review of literature
related to concept development in adolescent science students. Studies in Science
Education 5, 61-84.
Driver, R., Guesne, E., & Tiberghien, A. (1985). Children's ideas in science.
Philadelphia: Open University Press.
Ehindore, O. J. (1979). Formal operational precocity and achievement in
biology among some Nijerian high school students. Science Education, 63, 231-236.
Eilam, R., (2002). Strata comprehending ecology: Looking through the prism
of feeding relations. Science Education, 86(5), 645-671.
Eisen, Y., Stavy, R. (1992). Material cycles in nature: a new approach to
teaching photosynthesis in junior high school. The American Biology Teacher, 54,
339-342.
Eryılmaz, A. & Sürmeli, E. (2002). Üç-aşamalı sorularla öğrencilerin ısı ve
sıcaklık konularındaki kavram yanılgılarının ölçülmesi. Retrieved May 29, 2004,
from
http://www.fedu.metu.edu.tr/ufbmek-5
Eyidoğan, F. & Guneysu, S. (2001).İlköğretim 8. sınıf fen bilgisi kitaplarındaki
kavram yanılgıları, Retrieved May 30, 2004, from
http://www.fedu.metu.edu.tr/ufbmek-5

86
Finley, F.N., Steward, J., & Yarroch, W.L., (1982). Teachers’ perceptions of
important and difficult science content. Science Education, 66(4), 531-538.
Fisher, K.M., (1985). A misconception in biology: Amino acid and
translation. Journal of Research in Science Teaching, 22(1), 53-62.
Fraenkel, J. R., & Wallen, N. E., (1996). How to design and evaluate
research in science education. New York: McGraw-Hill.
Gallegos, L, Jerezano, M.E. & Flores, F. (1994). Preconceptions and relations
used by children in the construction of food chains. Journal of Research in Science
Teaching, 31(3), 259- 272.
Geban, Ö., Aşkar, P. & Özkan, İ. (1992). Effect of computer simulated
experiment and problem solving approaches on students learning outcomes at the
high school level. Journal of Educational Research, 86(1), 5-10.
Geban, Ö., Ertepınar, H, Yılmaz, G., Altın, A., & Şahbaz, F. (1994).
Bilgisayar destekli eğitimin öğrencilerin fen bilgisi başarılarına ve fen bilgisi
ilgilerine etkisi [The effect of computer aided instruction to students’ achievements
and attitude towards science]. I. Ulusal Fen Bilimleri Eğitimi sempozyumu, Bildiri
Özetleri Kitabı(pp.1-2) 9 Eylül Üniversitesi, İzmir.
Germann, P. J. (1994). Testing a model of science process skills acquisition:
An interaction with parents' education, preferred language, gender, science attitudes,
cognitive development, academic ability, and biology knowledge. Journal of
Research in Science Teaching, 31, 749-783.
Griffard, P. B. & Wandersee, J. H (2001). The two-tier instrument on
photosysnthesis: What does it diagnose? International Journal of Science Education,
23(10), 1039-1052.
Griffiths, A.K., & Grant B. A. C., (1985). High school students’
understanding of food webs: Identification of a learning hierarchy and related
misconceptions. Journal of Research in Science Teaching, 22(5), 421-436.
Gtiffiths, A. K., Thomey, K., Cooke, B., & Normore, G., (1988). Remedation
of students-specific misconceptions relating three science concepts. Journal of
Research in Science Teaching, 25(9), 709-719.

87
Gunstone, Champagne, & Klopfer, 1981; Gunstone, R.F., Champgane, A.B.,
Klopfer, L.E. (1981). Instruction for understanding: A case study. The Australian
Science Teachers Journal, 27(3), 27-32.
Haidar, A. H., (1997). Prospective chemistry teachers’ conceptions of the
conservation of matter and related concepts. Journal of Research in Science
Teaching, 34, 181–197.
Halloun, I. A., & Hestenes, D., (1985). Common sense concepts about
motion. American Journal of Physics, 53, 1056–1065.
Haslam, F., & Treagust, D.F., (1987). Diagnosing secondary students’
misconceptions of photosynthesis and respiration in plants using a two-tier multiple
choice instrument. Journal of Biological Education, 21(3), 203-211.
Hawkins, J., & Pea, R. D., (1987). Tools for bridging the cultures of everyday
and scientific thinking. Journal of Research in Science Teaching, 24, 291–307.
Helm, H. (1980). Misconceptions in physics amongst South African students.
Physics Education, 15, 92-97.
Hestenes, D., Wells, M. & Swackhamer, G. (1992). Force concept Inventory.
The Physics Teacher, 30, 141-158.
Hewson, P.& Hewson, M. (1988). An appropriate conception of teaching
science: a view from studies of science learning. Science Education, 72(5), 597-614.
Ivowi, U.M.O. (1983). Misconceptions in physics amongst Nigerian
secondary school students. In: Helm, H., Novak, J.D.: Proceedings of the
International Seminar "Misconceptions in Science and Mathematics". Ithaca, N.Y.:
Cornell University, 356-361.
Johnson, M. A. & Lawson, A.E. (1998). What are the relative effects of
reasoning ability and prior knowledge on biology achievement in expository and
inquiry classes. Journal of Research in Science Education, 35, 89-103.
Kargbo, D.B., Hobbs, E.D., Erickson, G.L (1980). Children's beliefs about
inherited characteristics. Journal of Biological Education, 14(2), 137-146.
Korkmaz, O. (2004) The relationship among reasoning ability, gender and
students’ understanding of diffusion and osmosis. Unpublished Master Thesis, The
Middle East Technical University, Ankara.

88
Kutluay, Y. (2005). Diagnosis of eleventh grade students’ misconception
about geometric optic by a three-tier test. Unpublished Master Thesis, The Middle
East Technical University, Ankara.
Lavoie, D.R. (1997). Using a modified concept mapping strategy to identify
students' alternative scientific understandings of biology. Paper presentation at
National Association for Research in Science Teaching, Annual meeting at Chicago,
IL, March 21-24.
Lawson, A.E., Thompson, L.D., (1988). Formal reasoning ability and
misconceptions concerning genetics and natural selection. Journal of Research in
Science Teaching, 25, 733-746.
Lawson, A., & Renner, J. (1975). Piagetian theory and biology teaching. The
American Biology Teacher, 37, 336–343.
Leach, J., Driver, R., Scott, P., Wood-Robinson, C., (1996). Children's ideas
about ecology 3: ideas found in children aged 5-16 about the interdependency of
organisms. International Journal of Science Education, 18, 129-141.
Mintzes, J. J., (1984). Naïve theories in biology: Children’s concepts of the
human body. School Science and Mathematics, 84(7), 548-555.
Munson, B. H., (1994). Ecological misconceptions. Journal of Environmental
Education, 25(4), 30-34.
Nakhleh & Krajcik (1994) Influence levels of information as presented by
different tehnologies on students’ understanding of acid, base, and ph concepts.
Journal of Research in Science Teaching, 34(10), 1077-1096
Niaz, M., & Lawson, A. (1985). Balancing chemical equations: The role of
developmental level and mental capacity. Journal of Research in Science Teaching,
22, 41–51.
Novak, J., & Gowin, D., (1984). Learning how to learn. New York:
Cambridge University Press.
Novak, J.D. (1990). Concept mapping: a useful tool for science education.
Journal of Research in Science Teaching, 27(10), 937-949.
Novak, J.D. (1993). How do we learn our lesson?. The Science Teacher,
50(3), 50-55.

89
Odom, A. L., & Kelly, P. V., (2001). Integrating concept mapping and the
learning cycle to teach diffusion and osmosis concepts to high school biology
students. Science Education, 85 (6), 615-635.
Odom, L.A., & Borrow, H.L., (1985). Development and application of a two
tier diagnostic test measuring collage biology students’ understanding of diffusion
and osmosis after a course of instruction. Journal of Research in Science Teaching,
27(5), 493-504.
Okebukola, P.A., (1990). Attaining meaningful learning of concepts in
genetics and biology: An examination of the potency of concepts of concept mapping
techniques. Journal of Research in Science Teaching, 27(5), 493-504.
Osborne, R. J., & Freyberg, P.S., (1985). Learning in Science: The
implications of children's science. London: Heinemann.
Osborne, R., Wittrock, M.C. (1983). Learning science: A generative process.
Science Education, 67, 4, 489-508.
Osborne, R. (1983). Towards modifying children's ideas about electric
current. Research in Science and Technological Education,1(1), 73-82
Özkan, Ö., (2001). Remediation of seventh grade students’ misconception
related to the ecological concepts through conceptual change approach.
Unpublished Master Thesis, The Middle East Technical University, Ankara.
Panizzon, D., (2003). Using a cognitive structural model to provide new
insights into students’ understandings of diffusion. International Journal of Science,
25(12), 1427-1450.
Peşman, H., (2005). Development of a three-tier test to asses ninth grade
students’ misconception about simple electric circuits. Unpublished Master Thesis,
The Middle East Technical University, Ankara.
Pfundt, H., & Duit, R. (1991). Bibliography of students’ alternative
frameworks in science education, 3rd ed. Kiel, Germany: IPN.
Pines, L., West, L., (1986). Conceptual understanding and science learning:
An interpretation of research within a sources of knowledge framework. Science
Education,70(5) 583-604.

90
Posner, G.J., Strike, K.A., Hewson, P.W., Gertzog, W.A. (1982).
Accommodation of a scientific conception: toward a theory of conceptual change.
Science Education 66, 211-227.
Reiner, M., & Eilam, B., (2001). Conceptual classroom environment—a
system view of learning. International Journal of Science Education, 23(6),551- 568.
Rollnick, M., & Mahooana, P.P., (1999). A quick and effective way of
diagnosing student difficulties: Two tier from simple multiple-choice questions.
South African Journal of Chemistry, 52(4), 161-165.
Sanders, M., (1993). Erroneous ideas about respiration: The teacher factor.
Journal of Research in Science Teaching, 30(8) 919-934.
Simpson, M,. Arnold, B. (1982). Educational psychology and the teaching of
specialist subjects. Scottish Educational Review, 14 (2), 109-117.
Smith, E.L., Anderson, C.W. (1984). Plants as producers: A case study of
elementary science teaching. Journal of Research in Science Teaching, 21(7), 685-
698.
Soyibo, K., (1999). Gender differences in Caribbean students’ performance
on a test of errors in biological labelling, Research in Science and Technological
Education, 17, 75–82.
Stavy, R., Wax, N., (1989). Children's conceptions of plants as living things.
Human Development, 32, 635.
Steinkamp,M.W., & Maehr, M.L. (1983). Affect, ability and science
achievement: Aquantitative synthesis of correlational research. Review of
Educational Research, 53, 369-396.
Strike, K. A. and Posner, G. J. (1982). Conceptual change and science
teaching. European Journal of Science Education, 4(3), 231-240.
Sungur, S., & Tekkaya, C., (2003). Students’ achievement in human
circulatory system unit: the effect of reasoning ability and gender, Journal of Science
Education and Technology, 12, 59–64.
Sungur, S., (2004). An implementation of problem based learning in high
school biology courses. Unpublished Master Thesis, The Middle East Technical
University, Ankara.
91
Thijs, G. D. (1992). Evaluation of an introductory course on “force”
considering students’ preconceptions. Science Education, 76, 155–174.
Tobin, K. G. & Capie, W. (1981). The development ad validation of a group
test of logical thinking. Educational and Psychological Measurement, 41, 413–423.
Tamir, P., (1990). Justifying the selection of answers in multiple-choice
items. International Journal of Science Education, 12(5), 563-573.
Valanides, N. C. (1997) Cognitive abilities among twelfth-grade students:
implications for science teaching, Educational Research and Evaluation, 3, 160–186.
Wandersee, J.H. (1994). Making high-tech micrographs meaningful to the
biology student. The content of science. London: The Falmer Press, 161-176.
Webb, P., & Boltt, G., (1990). Food chain and food web: A natural
progression? Journal of Biological Education, 24(3), 187-191.
Weinburgh, M.(1995). Gender differences in student attitudes toward science:
A metaanalysis of the literature from 1970 to 1991. Journal of Research in Science
Teaching, 20, 839-850.
Westbrook, S.L. & Marek, E.A. (1991). A cross-age study of student
understanding of the concept of diffusion. Journal of Research in Science Teaching,
28(8), 649-660.
Westbrook, S.L., & Marek, E.A. (1992). A cross-age study of student
understanding of the concept of homeostasis. Journal of Research in Science
Teaching, 29, 51–61.
Willson, V.L., (1983). A meta-analysis of the relationship between science
achievement and science attitude: Kindergarten through college. Journal of Research
in Science Teaching, 20, 839-850.
Yenilmez, A. (2006). Exploring relationship among students’ prior
knowledge, meaningful learning orientation, reasoning ability, mode of instruction
and understanding of photosynthesis and respiration in plants. Unpublished Master
Thesis, The Middle East Technical University, Ankara.
Young, D. J. & Fraser, B. J. (1994) Gender differences in science
achievement: do school effects make a difference? Journal of Research in Science
Teaching, 31, 857–871.

92
APPENDIX A
INTERVIEW SCHEDULE
ÇEVRE
Sürekli okuduğumuz bir tabela vardır: “Çevrenizi temiz tutunuz.’’
Bana çevre nedir söyler misin?
Bir çevre içinde ne gibi şeyler bulabiliriz?
Verdiğin örnekleri canlı ve cansız varlıklar olarak ayırır mısın?
Çevrende canlı ve cansız varlıklar arasında bir ilişki var mı?
“Evet” derse, çevrede canlı ve cansız varlıklar arasında nasıl bir ilişki var?
TEMEL EKOLOJİK KAVRAMLAR
Tür nedir?
“Popülasyon” sözünden ne anlıyorsun?
Popülasyona bir örnek verebilir misin?
“Tür” ile “Populasyon” aynı şeyler mi?Açıklar mısın?
Sana “Ekosistem” nedir diye sorsam,bana neler söyleyebilirsin?
“Biyosfer” nedir? Farklı Ekosistemler biyosferi oluşturur mu?
ENERJİ
Enerjiyi nasıl tanımlarsın?
Doğadaki temel enerji kaynağı nedir? Bu konuda neler söyleyebilirsin ?
“Güneş” derse, peki canlılar güneşi bir enerji kaynağı olarak nasıl kullanır?
Bitkilerle hayvanlar arasında enerji bakımından bir ilişki var mıdır?
Var derse, nasıl? Biraz açıklayabilir misin.

93
Yok derse, o zaman bitkiler ve hayvanlar enerjilerini nereden edinirler?
BESİN ZİNCİRİ
“Besin zinciri”ni nasıl tanımlayabilirsin?
Bana bir besin zinciri çizebilir misin?
Çizmiş olduğun besin zincirinde bana tüketiciyi gösterebilir misin?Tüketicileri
birbirinden nasıl ayırt edebilirsin?
“Bitki ile başlarsa”, besin zincirine neden bitki ile başladın?
“Hayvan ile başlarsa”, besin zincirine neden hayvan ile başladın?
Peki enerji miktarı hakkında ne söyleyebilirsin?Verdiğin örnekte, hangi canlı en fazla
enerjiye sahiptir?
Kelebek, kuş ve nektar bir besin zinciri oluşturur mu? Neden?
İnsan vücudundaki bakteri besin zincirinin bir parçası mı? Neden?
ENERJİ PİRAMİDİ
“Enerji piramidi”nden ne anlıyorsun?
Bana bir enerji piramidi çizip içini doldurur musun?
“Ayrıştırıcıları koymazsa”, peki ayrıştırıcılar hakkında ne düşünüyorsun? Neden
enerji piramidinde ayrıştırıcılara yer vermedin?
Eğer, doğru çizerse: neden piramidin alt kısmı üst kısmından daha geniş? Neden
piramidin üst kısmı alt kısmından daha küçük?
BESİN AĞI
“Besin ağı” nı nasıl tanımlayabilirsin?
Bize şematik bir besin ağı çizebilir misin?
Bu besin ağını anlatır mısın?
Eğer su ekosisteminde çizerse, kara ekosisteminde besin ağı çizebilir misin?
“Bu bir besin ağını gösteren şekildir.Bu harflerin her biri belli bir popülasyonun bir
üyesini simgelemektedir.Buna göre şu sorulara cevap verir misin?”

94
J H I K C F B D G E A
Oklar neyi ifade ediyor olabilir? Okların yönü önemli midir ?
“A” ne olabilir?
Şimdi bazı çevresel faktörler yüzünden yukarıdaki besin ağında bulunan
popülasyonda ani değişikliklerin olduğunu düşünelim. Buna göre, bu değişikliklerin
diğer popülasyonlar üzerindeki etkisini bulmaya çalışalım.
F popülasyonundaki ani azalma H popülasyonunu etkiler mi?
Etkiler derse, nasıl etkiler, neden?
Etkilemez derse, neden?
E popülasyonundaki ani azalma H popülasyonunu etkiler mi?
Etkiler derse, nasıl etkiler, neden?
Etkilemez derse, neden?
G popülasyonundaki ani artış F popülasyonunu etkiler mi?
Etkiler derse, nasıl etkiler, neden?
Etkilemez derse, neden?
A popülasyonunda olan ani bir değişiklikten J popülasyonu etkilenir mi?
Etkilenir derse, nasıl ve hangi yoldan, harfleri işaretler misin?
Etkilemez derse, neden?

95
APPENDIX B
CANLILAR VE ETKİLEŞİM’ KAVRAM TESTİ
Sevgili Öğrenciler;
Bu testteki sorular, ‘Canlılar ve Etkileşim’ konusunda öğrencilerin sahip
olduğu kavram yanlışlarını ölçmek için hazırlanmıştır.Test, 19 tane çoktan seçmeli
soru içermektedir Her soru üç bölümden oluşmaktadır. Birinci bölüm, konu bilgisini
içeren çoktan seçmeli soruyu; ikinci bölüm olası nedenleri, üçüncü bölüm ise bu
cevaplarınızdan ne kadar emin olduğunuzu içeren soruyu içermektedir. Her soru için
bir cevap ve her cevap için bir neden ve ne kadar emin olduğunuzu işaretlemeniz
gerekmektedir. Sebep sorularında cevabınız ‘Hiçbiri’ ise yandaki boşluğa kendi
cevabınızı yazınız. Lütfen hiçbir bölümü ve soruyu boş bırakmayınız.
Vereceğiniz bilgiler kesinlikle gizli tutulacaktır.Yardımlarınız için sizlere
teşekkür ederim.
Hacer Soylu
ODTÜ - Eğitim Fakültesi
1. Okulunuzun adı :
2. Cinsiyet : Kız Erkek 3. Doğum tarihiniz : 4.Fen Bilgisi dersinizin geçen dönemki karne notu nedir? 5. Annenizin Eğitim Durumu 6. Babanızın Eğitim Durumu
Hiç okula gitmemiş Hiç okula gitmemiş
İlkokul İlkokul
Ortaokul Ortaokul
Lise Lise
Üniversite Üniversite
Yüksek lisans (Mastır/Doktora) Yüksek lisans (Mastır/Doktora)
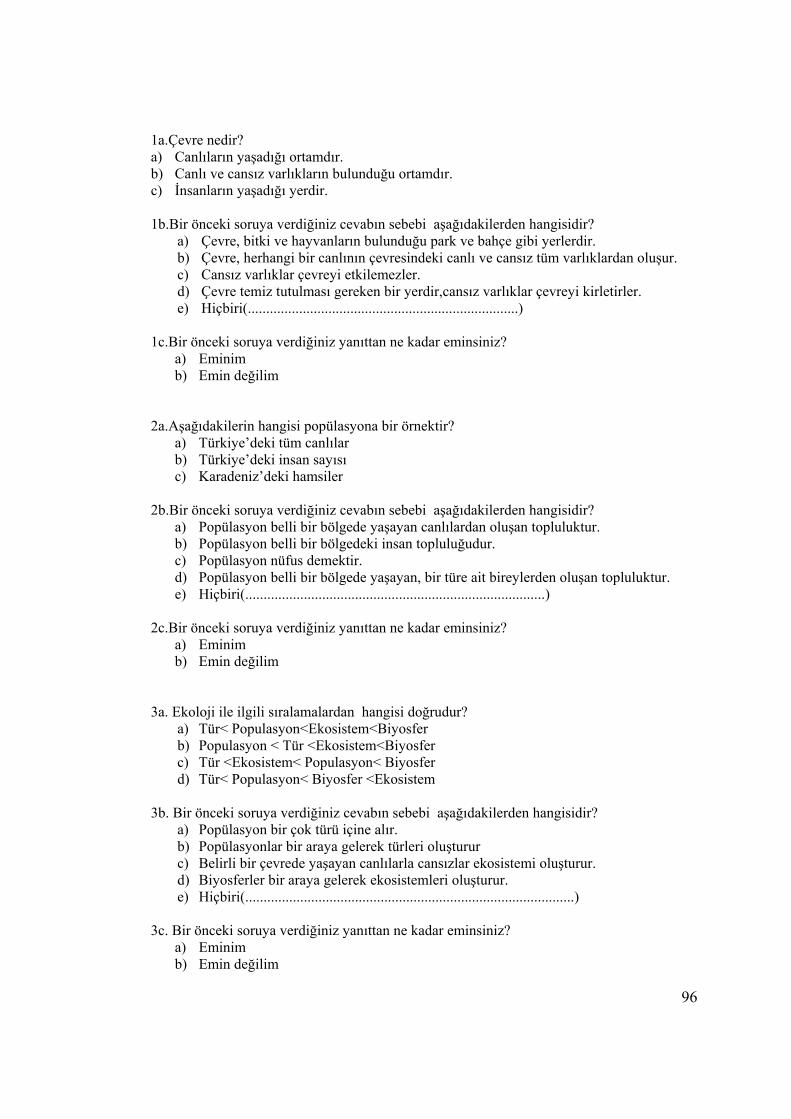
96
1a.Çevre nedir? a) Canlıların yaşadığı ortamdır. b) Canlı ve cansız varlıkların bulunduğu ortamdır. c) İnsanların yaşadığı yerdir. 1b.Bir önceki soruya verdiğiniz cevabın sebebi aşağıdakilerden hangisidir?
a) Çevre, bitki ve hayvanların bulunduğu park ve bahçe gibi yerlerdir. b) Çevre, herhangi bir canlının çevresindeki canlı ve cansız tüm varlıklardan oluşur. c) Cansız varlıklar çevreyi etkilemezler. d) Çevre temiz tutulması gereken bir yerdir,cansız varlıklar çevreyi kirletirler. e) Hiçbiri(..........................................................................)
1c.Bir önceki soruya verdiğiniz yanıttan ne kadar eminsiniz?
a) Eminim b) Emin değilim
2a.Aşağıdakilerin hangisi popülasyona bir örnektir?
a) Türkiye’deki tüm canlılar b) Türkiye’deki insan sayısı c) Karadeniz’deki hamsiler
2b.Bir önceki soruya verdiğiniz cevabın sebebi aşağıdakilerden hangisidir?
a) Popülasyon belli bir bölgede yaşayan canlılardan oluşan topluluktur. b) Popülasyon belli bir bölgedeki insan topluluğudur. c) Popülasyon nüfus demektir. d) Popülasyon belli bir bölgede yaşayan, bir türe ait bireylerden oluşan topluluktur. e) Hiçbiri(..................................................................................)
2c.Bir önceki soruya verdiğiniz yanıttan ne kadar eminsiniz?
a) Eminim b) Emin değilim
3a. Ekoloji ile ilgili sıralamalardan hangisi doğrudur? a) Tür< Populasyon<Ekosistem<Biyosfer b) Populasyon < Tür <Ekosistem<Biyosfer c) Tür <Ekosistem< Populasyon< Biyosfer d) Tür< Populasyon< Biyosfer <Ekosistem
3b. Bir önceki soruya verdiğiniz cevabın sebebi aşağıdakilerden hangisidir?
a) Popülasyon bir çok türü içine alır. b) Popülasyonlar bir araya gelerek türleri oluşturur c) Belirli bir çevrede yaşayan canlılarla cansızlar ekosistemi oluşturur. d) Biyosferler bir araya gelerek ekosistemleri oluşturur. e) Hiçbiri(..........................................................................................)
3c. Bir önceki soruya verdiğiniz yanıttan ne kadar eminsiniz?
a) Eminim b) Emin değilim

97
4a. Bitkilerin enerji kaynağı nedir? a) Toprak b) Hava c) Güneş
4b. Bir önceki soruya verdiğiniz cevabın sebebi aşağıdakilerden hangisidir?
a) Bitkiler toprakta yetişirler. b) Bitkiler havadaki gazları kullanarak enerji elde ederler. c) Bitkiler topraktaki su ve mineraller ile beslenirler. d) Bitkiler güneş enerjisini kullanarak besin yaparlar. e) Hiçbiri(..........................................................................................)
4c. Bir önceki soruya verdiğiniz yanıttan ne kadar eminsiniz?
a) Eminim b) Emin değilim
5a. Bitkilerle hayvanlar arasında enerji bakımından bir ilişki var mıdır?
a) Vardır b) Yoktur
5b. Bir önceki soruya verdiğiniz cevabın sebebi aşağıdakilerden hangisidir?
a) Hayvanlar bitkileri yer. b) Hayvanların ve bitkilerin kendi ayrı besinleri vardır. c) Hayvanlar bitkilerden daha güçlüdür ve kendi enerjileri vardır. d) Bitkilerden alınan enerjinin bir kısmı hayvanlar tarafından kullanılır.
Hiçbiri(..........................................................................................) 5c.Bir önceki soruya verdiğiniz yanıttan ne kadar eminsiniz?
a) Eminim b) Emin değilim
6a. İnsan vücudundaki bakteri besin zincirinin bir parçası mıdır?
a) Evet b) Hayır
6b. Bir önceki soruya verdiğiniz cevabın sebebi aşağıdakilerden hangisidir?
a) Büyük canlılar küçük canlılarla beslenir. b) Bakteriler vücudumuzdaki besinlerle beslenirler. c) Bakteriler bazı organizmalar tarafından parçalanır. d) Bakteri ölü canlıları parçalar, minerallere ayırır. e) Hiçbiri(..........................................................................................)
6c. Bir önceki soruya verdiğiniz yanıttan ne kadar eminsiniz?
a) Eminim b) Emin değilim
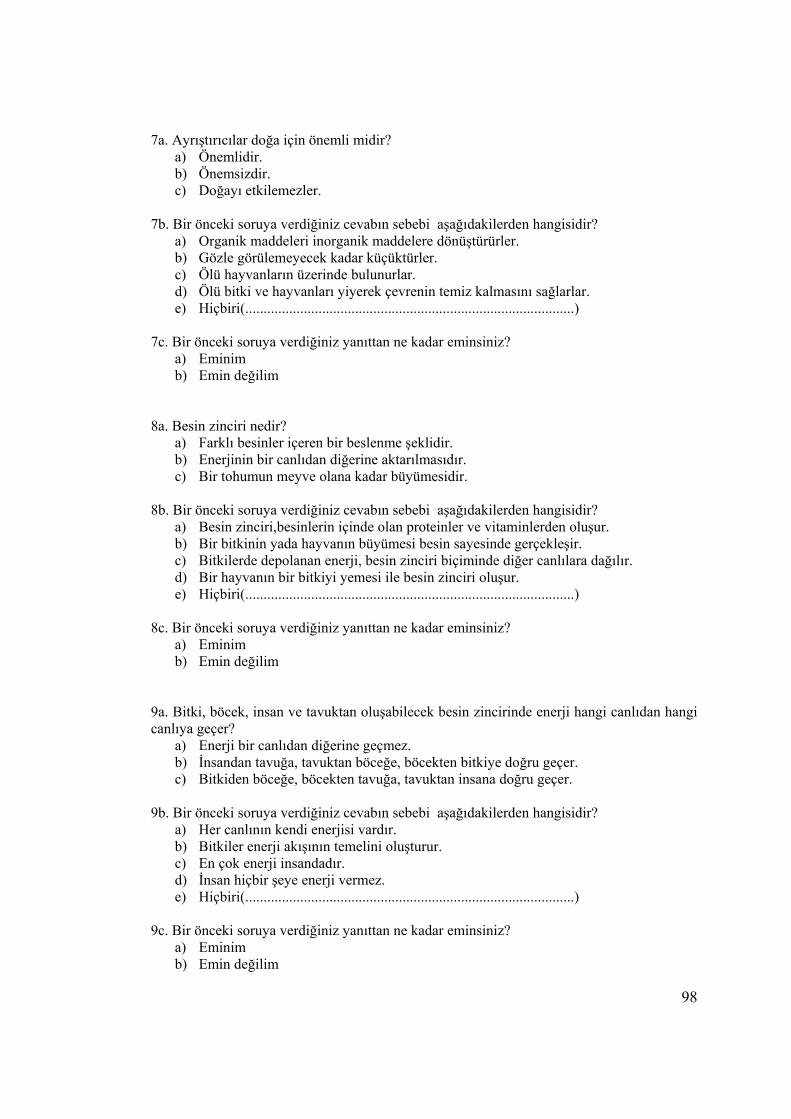
98
7a. Ayrıştırıcılar doğa için önemli midir? a) Önemlidir. b) Önemsizdir. c) Doğayı etkilemezler.
7b. Bir önceki soruya verdiğiniz cevabın sebebi aşağıdakilerden hangisidir?
a) Organik maddeleri inorganik maddelere dönüştürürler. b) Gözle görülemeyecek kadar küçüktürler. c) Ölü hayvanların üzerinde bulunurlar. d) Ölü bitki ve hayvanları yiyerek çevrenin temiz kalmasını sağlarlar. e) Hiçbiri(..........................................................................................)
7c. Bir önceki soruya verdiğiniz yanıttan ne kadar eminsiniz?
a) Eminim b) Emin değilim
8a. Besin zinciri nedir?
a) Farklı besinler içeren bir beslenme şeklidir. b) Enerjinin bir canlıdan diğerine aktarılmasıdır. c) Bir tohumun meyve olana kadar büyümesidir.
8b. Bir önceki soruya verdiğiniz cevabın sebebi aşağıdakilerden hangisidir?
a) Besin zinciri,besinlerin içinde olan proteinler ve vitaminlerden oluşur. b) Bir bitkinin yada hayvanın büyümesi besin sayesinde gerçekleşir. c) Bitkilerde depolanan enerji, besin zinciri biçiminde diğer canlılara dağılır. d) Bir hayvanın bir bitkiyi yemesi ile besin zinciri oluşur. e) Hiçbiri(..........................................................................................)
8c. Bir önceki soruya verdiğiniz yanıttan ne kadar eminsiniz?
a) Eminim b) Emin değilim
9a. Bitki, böcek, insan ve tavuktan oluşabilecek besin zincirinde enerji hangi canlıdan hangi canlıya geçer?
a) Enerji bir canlıdan diğerine geçmez. b) İnsandan tavuğa, tavuktan böceğe, böcekten bitkiye doğru geçer. c) Bitkiden böceğe, böcekten tavuğa, tavuktan insana doğru geçer.
9b. Bir önceki soruya verdiğiniz cevabın sebebi aşağıdakilerden hangisidir?
a) Her canlının kendi enerjisi vardır. b) Bitkiler enerji akışının temelini oluşturur. c) En çok enerji insandadır. d) İnsan hiçbir şeye enerji vermez. e) Hiçbiri(..........................................................................................)
9c. Bir önceki soruya verdiğiniz yanıttan ne kadar eminsiniz?
a) Eminim b) Emin değilim
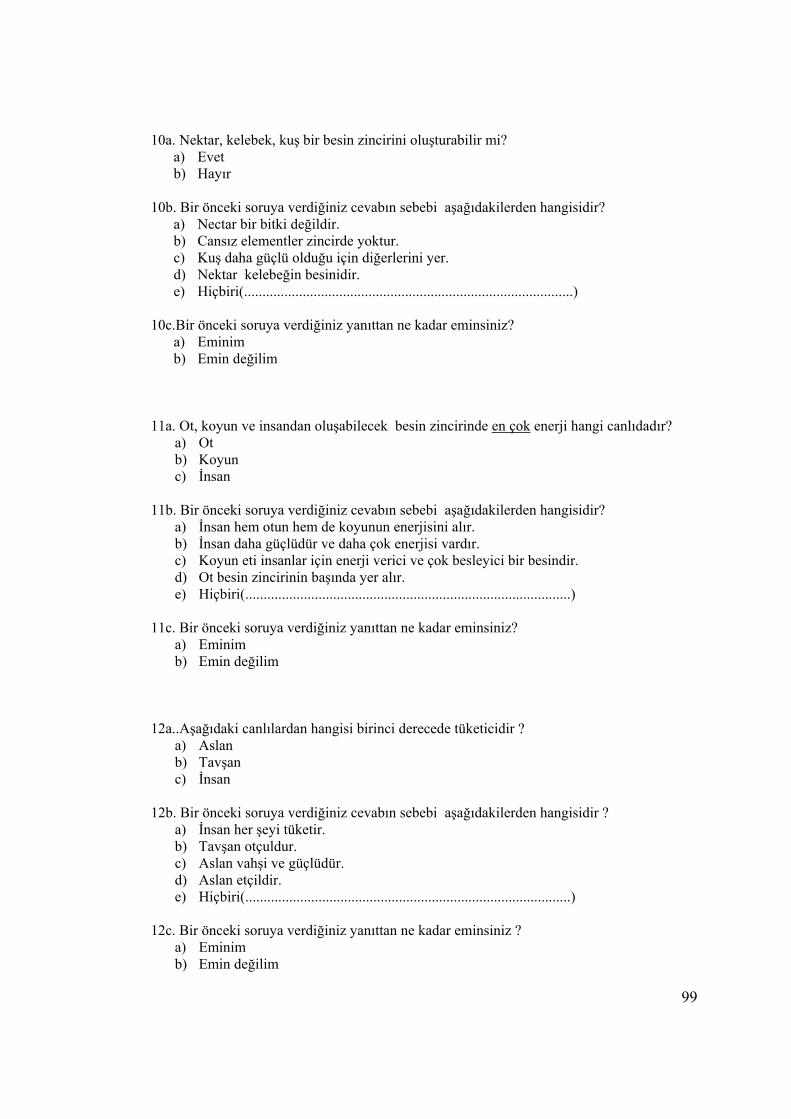
99
10a. Nektar, kelebek, kuş bir besin zincirini oluşturabilir mi? a) Evet b) Hayır
10b. Bir önceki soruya verdiğiniz cevabın sebebi aşağıdakilerden hangisidir?
a) Nectar bir bitki değildir. b) Cansız elementler zincirde yoktur. c) Kuş daha güçlü olduğu için diğerlerini yer. d) Nektar kelebeğin besinidir. e) Hiçbiri(..........................................................................................)
10c.Bir önceki soruya verdiğiniz yanıttan ne kadar eminsiniz?
a) Eminim b) Emin değilim
11a. Ot, koyun ve insandan oluşabilecek besin zincirinde en çok enerji hangi canlıdadır?
a) Ot b) Koyun c) İnsan
11b. Bir önceki soruya verdiğiniz cevabın sebebi aşağıdakilerden hangisidir?
a) İnsan hem otun hem de koyunun enerjisini alır. b) İnsan daha güçlüdür ve daha çok enerjisi vardır. c) Koyun eti insanlar için enerji verici ve çok besleyici bir besindir. d) Ot besin zincirinin başında yer alır. e) Hiçbiri(.........................................................................................)
11c. Bir önceki soruya verdiğiniz yanıttan ne kadar eminsiniz?
a) Eminim b) Emin değilim
12a..Aşağıdaki canlılardan hangisi birinci derecede tüketicidir ?
a) Aslan b) Tavşan c) İnsan
12b. Bir önceki soruya verdiğiniz cevabın sebebi aşağıdakilerden hangisidir ?
a) İnsan her şeyi tüketir. b) Tavşan otçuldur. c) Aslan vahşi ve güçlüdür. d) Aslan etçildir. e) Hiçbiri(.........................................................................................)
12c. Bir önceki soruya verdiğiniz yanıttan ne kadar eminsiniz ?
a) Eminim b) Emin değilim

100
13a. Enerji piramidinin tabanını hangi canlılar oluşturur ? a) İnsanlar b) Tüketiciler c) Üreticiler
13b .Bir önceki soruya verdiğiniz cevabın sebebi aşağıdakilerden hangisidir ?
a) En fazla enerji üreticilerdedir. b) Tüketiciler enerji bakımından daha zengindir. c) Doğada en çok insan bulunur. d) İnsanlar hem bitkileri hem de hayvanları yer. e) Hiçbiri(....................................................................................................)
13c. Bir önceki soruya verdiğiniz yanıttan ne kadar eminsiniz ?
a) Eminim b) Emin değilim
14a. F popülasyonundaki ani bir azalma H popülasyonunu etkiler mi ?
a) Etkiler. b) Etkilemez.
14b. Bir önceki soruya verdiğiniz cevabın sebebi aşağıdakilerden hangisidir ?
a) H popülasyonunu yiyen sayısı azalır ve H popülasyonu artar. b) F popülasyonu H popülasyonunun besin kaynağıdır. c) H popülasyonu F popülasyonunun avcısıdır av sayısının azalmasından etkilenmez. d) H popülasyonu,F popülasyonundan daha güçlüdür. e) Hiçbiri(..........................................................................................)
14c. Bir önceki soruya verdiğiniz yanıttan ne kadar eminsiniz?
a) Eminim b) Emin değilim
15a. E popülasyonundaki ani bir azalma H popülasyonunu etkiler mi ?
a) Etkiler. b) Etkilemez.
15b. Bir önceki soruya verdiğiniz cevabın sebebi aşağıdakilerden hangisidir?
a) E popülasyonu hem F popülasyonu ile hem de H popülasyonu ile beslenir. b) Yanyana değiller. c) H popülasyonu en yukarıdadır,sadece kendinden sonra geleni etkileyebilir. d) Aynı besin ağı içindeler. e) Hiçbiri(..........................................................................................)
15c. Bir önceki soruya verdiğiniz yanıttan ne kadar eminsiniz?
a) Eminim b) Emin değilim

101
14-19 arasındaki soruları aşağıdaki şekle göre cevaplayınız. “Bu bir besin ağını gösteren şekildir.Bu harflerin her biri belli bir popülasyonun bir üyesini simgelemektedir.Buna göre aşağıdaki sorulara cevap verir misin ? J H I K C F B D G E A 16a. G popülasyonundaki ani bir artış F popülasyonunu etkiler mi?
a) Etkiler. b) Etkilemez.
16b. Bir önceki soruya verdiğiniz cevabın sebebi aşağıdakilerden hangisidir?
a) F popülasyonunu azalır. b) Aralarında av-avcı ilişkisi yok. c) Sadece E popülasyonu etkilenir d) Yanyana değiller e) Hiçbiri(..........................................................................................)
16c. Bir önceki soruya verdiğiniz yanıttan ne kadar eminsiniz?
a) Eminim b) Emin değilim
17a. H popülasyonundaki ani bir azalma E popülasyonunu etkiler mi?
a) Etkiler. b) Etkilemez.
17b. Bir önceki soruya verdiğiniz cevabın sebebi aşağıdakilerden hangisidir?
a) Yanyana değiller. b) Aralarında av-avcı ilişkisi yok. c) H popülasyonu hem F popülasyonunun hem de E popülasyonunun avcısıdır. d) F popülasyonu artacağından E popülasyonu azalır. e) Hiçbiri(..........................................................................................)
17c. Bir önceki soruya verdiğiniz yanıttan ne kadar eminsiniz?
a) Eminim b) Emin değilim

102
18a.A popülasyonunda olan ani bir değişiklikten J popülasyonu etkilenir mi? a) Etkilenir. b) Etkilenmez.
18b. Bir önceki soruya verdiğiniz cevabın sebebi aşağıdakilerden hangisidir?
a) Av popülasyonundaki değişiklikten avcı popülasyonu etkilenmez. b) Aynı besin ağı içinde yer alıyorlar c) Birbirlerinden çok uzaktalar d) J popülasyonu, alttaki diğer bütün popülasyonları yer. e) Hiçbiri(..........................................................................................)
18c. Bir önceki soruya verdiğiniz yanıttan ne kadar eminsiniz?
a) Eminim b) Emin değilim
19a. I popülasyonundaki ani bir artış K popülasyonunu etkiler mi?
a) Etkiler. b) Etkilemez.
19b. Bir önceki soruya verdiğiniz cevabın sebebi aşağıdakilerden hangisidir?
a) Aralarında hiçbir bağ yok. b) Birbirlerinden çok uzaklar. c) Besin ağındaki bir değişiklik bütün besin ağını aynı şekilde etkiler d) Aynı besin ağı içinde olduklarından etkiler. e) Hiçbiri(..........................................................................................)
19c. Bir önceki soruya verdiğiniz yanıttan ne kadar eminsiniz?
a) Eminim b) Emin değilim

103
APPENDIX C
FEN BİLGİSİ DERSİ TUTUM ÖLÇEĞİ
Bu ölçek, Fen Bilgisi dersine ilişkin tutum cümleleri ve her cümlenin karşısında sizin düşüncenizi ölçen beş seçenek içermektedir. Lütfen her cümleyi dikkatle okuduktan sonra kendinize uygun seçeneği işaretleyiniz.
Tam
amen
ka
tılıy
orum
Katılı
yoru
m
Kar
arsı
zım
Katılmıy
orum
Hiç
ka
tılmıy
orum
1) Fen Bilgisi çok sevdiğim bir alandır.
2) Fen Bilgisi ile ilgili kitapları okumaktan hoşlanırım.
3) Fen Bilgisinin günlük yaşantıda çok önemli yeri yoktur.
4) Fen Bilgisi ile ilgili ders problemlerini çözmekten hoşlanırım.
5) Fen Bilgisi konuları ile ilgili daha çok şey öğrenmek isterim.
6) Fen Bilgisi dersine girerken sıkıntı duyarım.
7) Fen Bilgisi derslerine zevkle girerim.
8) Fen Bilgisi dersine ayrılan ders saatinin daha fazla olmasını isterim.
9) Fen Bilgisi dersine çalışırken canım sıkılır.
10) Fen Bilgisi konularını ilgilendiren günlük olaylar hakkında daha fazla bilgi edinmek isterim.
11)
Düşünce sistemimizi geliştirmede Fen Bilgisi öğrenimi önemlidir.
12)
Fen Bilgisi çevremizdeki doğal olayların daha iyi anlaşılmasında önemlidir.
13) Dersler içinde Fen Bilgisi dersi sevimsiz gelir.
14) Fen Bilgisi konuları ile ilgili tartışmalara katılmak bana cazip gelmez.
15) Çalışma zamanımın önemli bir kısmını Fen Bilgisi dersine ayırmak isterim.

104
APPENDIX D
MANTIKSAL DÜŞÜNME YETENEK TESTİ
AÇIKLAMA: Bu test, çeşitli alanlarda, özellikle Fen ve Matematik dallarında
karşılaşabileceğiniz problemlerde neden-sonuç ilişkisini görüp, problem çözme
stratejilerini ne derece kullanabileceğinizi göstermesi açısından çok faydalıdır. Bu
test içindeki sorular mantıksal ve bilimsel olarak düşünmeyi gösterecek cevapları
içermektedir.
NOT: Soru Kitapçığı üzerinde herhangi bir işlem yapmayınız ve cevaplarınızı
yalnızca cevap kağıdına yazınız. CEVAP KAĞIDINI doldururken dikkat edilecek
hususlardan birisi, 1 den 8 e kadar olan sorularda her soru için cevap kağıdında iki
kutu bulunmaktadır. Soldaki ilk kutuya sizce sorunun uygun cevap şıkkını yazınız,
ikinci kutucuğa yani AÇIKLAMASI yazılı kutucuğa ise o soruyla ilgili soru
kitapçığındaki Açıklaması kısmındaki şıkları okuyarak sizce en uygun olanını
seçiniz. Örneğin 12’nci sorunun cevabı sizce b ise ve Açıklaması kısmındaki en
uygun açıklama ikinci şık ise cevap kağıdını aşağıdaki gibi doldurun:
12. AÇIKLAMASI
9. ve 10. soruları ise soru kitapçığında bu sorularla ilgili kısımları okurken nasıl
cevaplayacağınızı daha iyi anlayacaksınız.
2b

105
SORU 1: Bir boyacı, aynı büyüklükteki altı odayı boyamak için dört kutu boya
kullandığına göre sekiz kutu boya ile yine aynı büyüklükte kaç oda boyayabilir?
a. 7 oda
b. 8 oda
c. 9 oda
d. 10 oda
e. Hiçbiri
Açıklaması:
1. Oda sayısının boya kutusuna oranı daima 23 olacaktır.
2. Daha fazla boya kutusu ile fark azalabilir.
3. Oda sayısı ile boya kutusu arasındaki fark her zaman iki olacaktır.
4. Dört kutu boya ile fark iki olduğuna göre, altı kutu boya ile fark yine
iki olacaktır.
5. Ne kadar çok boyaya ihtiyaç olduğunu tahmin etmek mümkün
değildir.
SORU 2: On bir odayı boyamak için kaç kutu boya gerekir? (Birinci soruya bakınız)
a. 5 kutu
b. 7 kutu
c. 8 kutu
d. 9 kutu
e. Hiçbiri
Açıklaması:
1. Boya kutusu sayısının oda sayısına oranı daima32 dür.
2. Eğer beş oda daha olsaydı, üç kutu boya daha gerekecekti.
3. Oda sayısı ile boya kutusu arasındaki fark her zaman ikidir.
4. Boya kutusu sayısı oda sayısının yarısı olacaktır.
5. Boya miktarını tahmin etmek mümkün değildir.

106
SORU 3: Topun eğik bir düzlemden (rampa) aşağı yuvarlandıktan sonra kat ettiği
mesafe ile eğik düzlemin yüksekliği arasındaki ilişkiyi bulmak için deney yapmak
isterseniz, aşağıda gösterilen hangi eğik düzlem setlerini kullanırdınız?
a. I ve IV
b. II ve IV
c. I ve III
d. II ve V
e. Hepsi
Açıklaması:
1. En yüksek eğik düzlemle (rampa) karşı en alçak olan
karşılaştırılmalıdır.
2. Tüm eğik düzlem setleri birbiriyle karşılaştırılmalıdır.
3. Yükseklik arttıkça topun ağırlığı azalmalıdır.
4. Yükseklikler aynı fakat top ağırlıkları farklı olmalıdır.
5. Yükseklikler farklı fakat top ağırlıkları aynı olmalıdır.
SORU 4: Tepeden yuvarlanan bir topun eğik düzlemden (rampa) aşağı
yuvarlandıktan sonra kat ettiği mesafenin topun ağırlığıyla olan ilişkisini bulmak için
bir deney yapmak isterseniz, aşağıda verilen hangi eğik düzlem setlerini
kullanırdınız?
a. I ve IV
b. II ve IV
c. I ve III
d. II ve V
e. Hepsi

107
Açıklaması:
a. En ağır olan top en hafif olanla kıyaslanmalıdır.
b. Tüm eğik düzlem setleri birbiriyle karşılaştırılmalıdır.
c. Topun ağırlığı arttıkça, yükseklik azaltılmalıdır.
d. Ağırlıklar farklı fakat yükseklikler aynı olmalıdır.
e. Ağırlıklar aynı fakat yükseklikler farklı olmalıdır.
SORU 5: Bir Amerikalı turist Şark Expresi’nde altı kişinin bulunduğu bir
kompartımana girer. Bu kişilerden üçü yalnızca İngilizce ve diğer üçü ise yalnızca
Fransızca bilmektedir. Amerikalının kompartımana ilk girdiğinde İngilizce bilen
biriyle konuşma olasılığı nedir?
a. 2 de 1
b. 3 de 1
c. 4 de 1
d. 6 da 1
e. 6 da 4
Açıklaması:
1. Ardarda üç Fransızca bilen kişi çıkabildiği için dört seçim yapmak
gerekir.
2. Mevcut altı kişi arasından İngilizce bilen bir kişi seçilmelidir.
3. Toplam üç İngilizce bilen kişiden sadece birinin seçilmesi yeterlidir.
4. Kompartımandakilerin yarısı İngilizce konuşur.
5. Altı kişi arasından, bir İngilizce bilen kişinin yanısıra, üç tanede
Fransızca bilen kişi seçilebilir.

108
SORU 6: Üç altın, dört gümüş ve beş bakır para bir torbaya konulduktan sonra, dört
altın, iki gümüş ve üç bakır yüzük de aynı torbaya konur. İlk denemede torbadan
altın bir nesne çekme olasılığı nedir?
a. 2 de 1
b. 3 de 1
c. 7 de 1
d. 21 de 1
e. Yukarıdakilerden hiçbiri
Açıklaması:
1. Altın, gümüş ve bakırdan yapılan nesneler arasından bir altın nesne
seçilmelidir.
2. Paraların 41 ü ve yüzüklerin
94 u altından yapılmıştır.
3. Torbadan çekilen nesnenin para ve yüzük olması önemli olmadığı
için toplam 7 altın nesneden bir tanesinin seçilmesi yeterlidir.
4. Toplam yirmi bir nesneden bir altın nesne seçilmelidir.
5. Torbadaki 21 nesnenin 7 si altından yapılmıştır.
SORU 7: Altı yaşındaki Ahmet’in şeker almak için 50 lirası vardır. Bakkaldaki
kapalı iki şeker kutusundan birinde 30 adet kırmızı ve 50 adet sarı renkte şeker
bulunmaktadır. İkinci bir kutuda ise 20 adet kırmızı ve 30 adet sarı şeker vardır.
Ahmet kırmızı şekerleri sevmektedir. Ahmet’in ikinci kutudan kırmızı şeker çekme
olasılığı birinci kutuya göre daha fazla mıdır?
a. Evet
b. Hayır
Açıklaması:
1. Birinci kutuda 30, ikincisinde ise yalnızca 20 kırmızı şeker vardır.
2. Birinci kutuda 20 tane daha fazla sarı şeker, ikincisinde ise yalnızca
10 tane daha fazla sarı şeker vardır.
3. Birinci kutuda 50, ikincisinde ise yalnızca 30 sarı şeker vardır.
4. İkinci kutudaki kırmızı şekerlerin oranı daha fazladır.
5. Birinci kutuda daha fazla sayıda şeker vardır.

109
SORU 8: 7 büyük ve 21 tane küçük köpek şekli aşağıda verilmiştir. Bazı köpekler
benekli bazıları ise beneksizdir. Büyük köpeklerin benekli olma olasılıkları küçük
köpeklerden daha fazla mıdır?
a. Evet
b. Hayır
Açıklaması:
1. Bazı küçük köpeklerin ve bazı büyük köpeklerin benekleri vardır.
2. Dokuz tane küçük köpeğin ve yalnızca üç tane büyük köpeğin
benekleri vardır.
3. 28 köpekten 12 tanesi benekli ve geriye kalan 16 tanesi beneksizdir.
4. Büyük köpeklerin 73 si ve küçük köpeklerin
219 i beneklidir.
5. Küçük köpeklerden 12 sinin, fakat büyük köpeklerden ise sadece
4ünün beneği yoktur.

110
SORU 9: Bir pastanede üç çeşit ekmek, üç çeşit et ve üç çeşit sos kullanılarak
sandviçler yapılmaktadır.
Ekmek Çeşitleri Et Çeşitleri Sos Çeşitleri
Buğday (B) Salam (S) Ketçap (K)
Çavdar (Ç) Piliç (P) Mayonez (M)
Yulaf (Y) Hindi (H) Tereyağı (T)
Her bir sandviç ekmek, et ve sos içermektedir. Yalnızca bir ekmek çeşidi,
bir et çeşidi kullanılarak kaç çeşit sandviç hazırlanabilir?
Cevap kağıdı üzerinde bu soruyla ilgili bırakılan boşluklara bütün olası
sandviç çeşitlerinin listesini çıkarın.
Cevap kağıdında gereksiniminizden fazla yer bırakılmıştır.
Listeyi hazırlarken ekmek, et ve sos çeşitlerinin yukarıda gösterilen
kısaltılmış sembollerini kullanınız.
Örnek: BSK= Buğday, Salam ve Ketçap dan yapılan sandviç

111
SORU 10: Bir otomobil yarışında Dodge (D), Chevrolet (C), Ford (F) ve Mercedes
(M) marka dört araba yarışmaktadır. Seyircilerden biri arabaların yarışı bitiriş
sırasının DCFM olacağını tahmin etmektedir. Arabaların diğer mümkün olan bütün
yarışı bitirme sıralamalarını cevap kağıdında bu soruyla ilgili bırakılan boşlukalara
yazınız.
Cevap kağıdında gereksiniminizden fazla yer bırakılmıştır.
Bitirme sıralamalarını gösterirken, arabaların yukarıda gösterilen kısaltılmış
sembollerini kulanınız.
Örnek: DCFM yarışı sırasıyla önce Dodge’nin, sonra Chevrolet’in, sonra
Ford’un ve en sonra Mercedes’in bitirdiğini gösterir.


