Page 1
THE EFFECT OF INFLATION ON STOCK MARKET RETURNS AT
THE NAIROBI SECURITIES EXCHANGE
BY
GLADYS MOGIRE
D63/74490/2014
A RESEARCH PROJECT SUBMITTED IN PARTIAL
FULFILLMENT OF THE REQUIREMENTS FOR THE AWARD OF
THE DEGREE OF MASTER OF SCIENCE IN FINANCE, SCHOOL
OF BUSINESS, UNIVERSITY OF NAIROBI
2016
Page 2
ii
DECLARATION
This research project is my original work and has not been presented for a degree at any
other university for examination.
Signature ____________________________ Date ___________________________
Gladys Mogire
D63/74490/2014
This research project has been submitted for examination with my approval as the
University supervisor.
Signature _______________________________ Date __________________________
Mr. Herick Ondigo
Lecturer
Department of Finance and Accounting
School of Business
University of Nairobi
Page 3
iii
ACKNOWLEDGEMENTS
I would like to express my gratitude to God Almighty above for making it possible for me to
finish the project without any problem.
I would also like to thank my supervisor Mr. Ondigo and moderator Dr. Nyamute for offering me
guidance and correcting my mistakes hence ensuring my project was written successfully.
The lecturers of the University of Nairobi finance and accounting department who helped me to
acquire knowledge along the way on various units that I was undertaking I appreciate you for
making me gain more academic knowledge.
Lastly but not least, to my family for the Moral support during this time that I was writing my
project.
Page 4
iv
DEDICATION
I dedicate this project to my Family, my father Mr. Zablon Obungu who is my mentor
and pillar in all that I have been doing. My mother Madam Alice Magoma for providing
every necessity that I required all through this time. My siblings Edna, Lillianna, Grayce,
Rachel, James, Wycliffe, Moses and Alex for the endless calls ensuring that I was on toes
to finish my project. My Nephews and nieces Nathan, Al, Kayla and Ella for cheering me
up even when the going was tough.
My best friends Liz Kimita and Marcy Kemunto you pushed me really hard and ensured
that all this was a success.
God, bless you all. My love for you cannot be quantified.
Page 5
v
TABLE OF CONTENTS
DECLARATION............................................................................................................... ii
ACKNOWLEDGEMENT ............................................................................................... iii
DEDICATION.................................................................................................................. iv
LIST OF TABLES ......................................................................................................... viii
LIST OF FIGURES ......................................................................................................... ix
LIST OF ABBREVIATIONS .......................................................................................... x
ABSTRACT ...................................................................................................................... xi
CHAPTER ONE: INTRODUCTION ............................................................................. 1
1.1 Background of the Study ........................................................................................... 1
1.1.1 Inflation .............................................................................................................. 2
1.1.2 Stock Market Returns ......................................................................................... 4
1.1.3 Effect of Inflation on Stock Market Returns ...................................................... 5
1.1.4 Nairobi Securities Exchange .............................................................................. 7
1.2 Research Problem ...................................................................................................... 8
1.3 Research Objective .................................................................................................. 10
1.4 Value of the Study ................................................................................................... 10
CHAPTER TWO: LITERATURE REVIEW .............................................................. 11
2.1 Introduction ............................................................................................................. 11
2.2 Theoretical Literature Review ................................................................................. 11
2.2.1 Fisher Effect Theory ......................................................................................... 11
2.2.2 Inflation Illusion Hypothesis ............................................................................ 12
2.2.3 Efficient Market Hypothesis ............................................................................. 13
Page 6
vi
2.3 Determinants of Stock Market Returns ................................................................... 14
2.3.1 Interest Rates .................................................................................................... 15
2.3.2 Money Supply................................................................................................... 15
2.3.3 Exchange Rates................................................................................................. 16
2.4 Empirical Literature Review ................................................................................... 17
2.4.1 Global Studies................................................................................................... 17
2.4.2 Local Studies .................................................................................................... 19
2.5 Conceptual Framework ........................................................................................... 21
2.6 Summary of the Literature Review ......................................................................... 23
CHAPTER THREE: RESEARCH METHODOLOGY ............................................. 24
3.1 Introduction ............................................................................................................. 24
3.2 Research Design ...................................................................................................... 24
3.3 Population of the Study ........................................................................................... 25
3.4 Data Collection ........................................................................................................ 25
3.5 Data Analysis .......................................................................................................... 25
3.6.1 Analytical Models............................................................................................. 25
3.6.2 Test of Significance .......................................................................................... 27
CHAPTER FOUR: DATA ANALYSIS, RESULTS AND INTERPRETATION .... 28
4.1 Introduction ............................................................................................................. 28
4.2 Descriptive Statistics ............................................................................................... 28
4.3 Inferential Statistics ................................................................................................. 33
4.3.1 Correlations ...................................................................................................... 34
4.3.2 Augmented Dickey-Fuller (ADF) Unit Root Test ............................................ 35
Page 7
vii
4.3.3 Granger Causality Test ..................................................................................... 35
4.3.4 Regression Analysis ......................................................................................... 36
4.4 Interpretation of the Findings .................................................................................. 37
CHAPTER FIVE: SUMMARY, CONCLUSION AND RECOMMENDATIONS .. 40
5.1 Introduction ............................................................................................................. 40
5.2 Summary ................................................................................................................. 40
5.3 Conclusion ............................................................................................................... 41
5.4 Recommendations for Policy and practice .............................................................. 42
5.5 Limitations of the Study .......................................................................................... 43
5.6 Suggestions for Further Research ........................................................................... 43
REFERENCES ................................................................................................................ 45
APPENDICES ................................................................................................................. 54
Appendix I: Firms Listed at the Nairobi Securities Exchange ...................................... 54
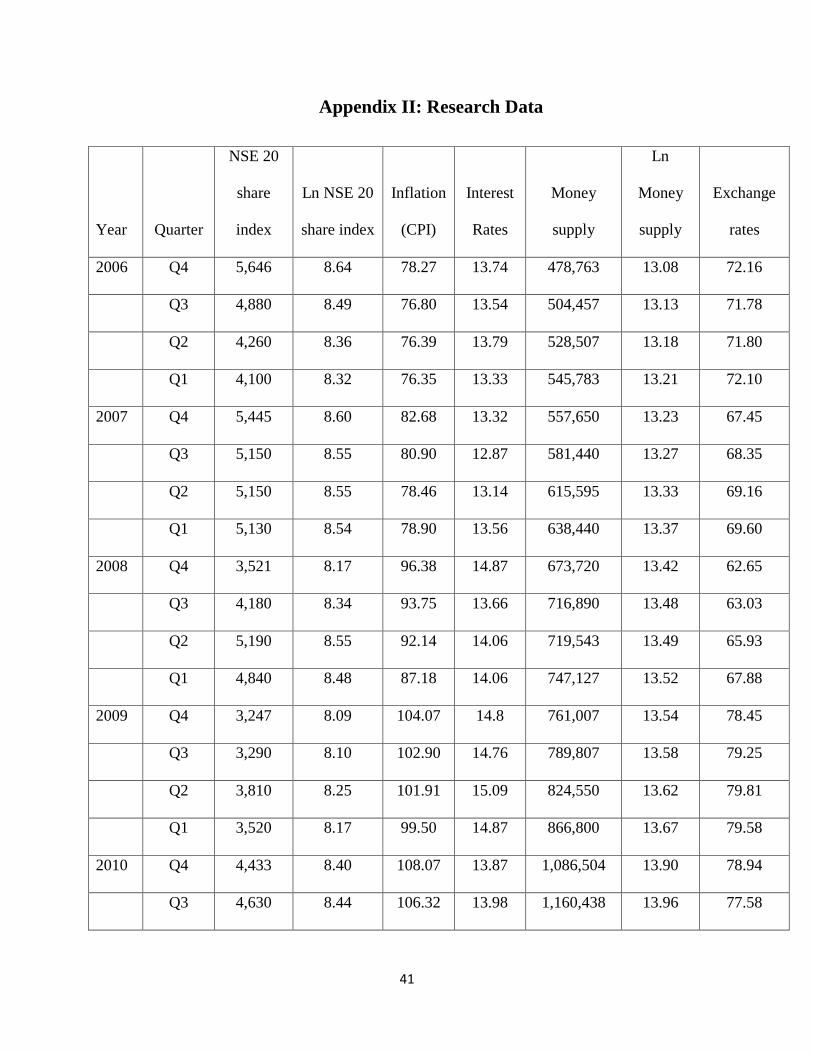
Appendix II: Research Data .......................................................................................... 41
Page 8
viii
LIST OF TABLES
Table 4.1 Summary Descriptive Statistics ........................................................................ 28
Table 4.2 Correlations ....................................................................................................... 34
Table 4.3: Augmented Dickey-Fuller Test ....................................................................... 35
Table 4.4 Granger Causality Test ..................................................................................... 36
Table 4.5 Regression Results ............................................................................................ 36
Page 9
ix
LIST OF FIGURES
Figure 2.1 Conceptual Framework ................................................................................... 22
Figure 4.1 NSE 20 Share Index Trend ............................... Error! Bookmark not defined.
Figure 4.2: Consumer Price Index Trend ........................... Error! Bookmark not defined.
Figure 4.3 Interest rates trend ............................................ Error! Bookmark not defined.
Figure 4.4 Money supply trend .......................................... Error! Bookmark not defined.
Figure 4.5 Exchange rates trend......................................... Error! Bookmark not defined.
Page 10
x
LIST OF ABBREVIATIONS
ADF - Augmented Dickey Fuller Test
CPI - Consumer Price Index
EMH - Efficient Market Hypothesis
GDP - Gross Domestic Product
IFC - International Finance Corporation
NSE - Nairobi Securities Exchange
OLS - Ordinary Least Squares
Page 11
xi
ABSTRACT
Inflation has probably been a characteristic of human history since money was adopted as a
means of payment. The relationship between stock market performance and inflation is
imperative for investors because stocks are expected to provide protection from the effects of
inflation. However, various theoretical foundations provide mixed findings on the connection
between inflation and stock market returns. This study therefore sought to determine the effect of
inflation on stock market returns at the Nairobi securities exchange. The independent variable for
this study was inflation measured using the consumer price index while the dependent variable
was stock market returns measured using share index. Interest rates, money supply and exchange
rates formed the control variables. The study employed a descriptive research design and carried
out a census of the 65 firms listed at the Nairobi Securities Exchange, as at December 2015. The
study used secondary data, which was analyzed using the augmented dickey fuller model, the
granger causality test and finally the regression analysis. The results of the Augmented Dickey
Fuller test (ADF) found that the time series had a unit root. The granger causality test found that
there was a causal relationship between inflation and stock market returns but there was no
causal relationship between stock market returns and inflation. The regression results found a
significant positive relationship between inflation and stock market returns and a significant
negative relationship between interest rates and stock market returns at the Nairobi Securities
Exchange. The findings also found an insignificant negative relationship between money supply
and exchange rates at the Nairobi Securities Exchange. The study concluded that inflation
positively affects stock market returns while interest rates, money supply and exchanges rates
negatively stock market returns at the Nairobi Securities Exchange. The study recommended the
government of Kenya should formulate policies on inflation, interest rates, money supply and
exchange rates to ensure that they do not have adverse effects on stock market returns.
Page 12
1
CHAPTER ONE: INTRODUCTION
1.1 Background of the Study
Inflation has probably been a characteristic of human history since money was adopted as
a means of payment. Inflation presupposes the existence of money, which evolved as an
unplanned social institution by a number of inventions and innovations (Bemholz, 2003).
On the other hand, a stock market is an important financial institution in a country and is
major concern to investors, business owners and the government (Osagie & Emeni,
2015). Inflation is a factor that affects the investor’s risk averse and consequently,
reflects on expected high-required return on capital and the real discount rate (Kullaporn
& Lalita, 2010). As such, stock prices are the reflector of various variables such as
inflation, exchange rate, interest rate and industrial production (Aliyu, 2011). Thus, a
predictable increase in the rate of inflation slows down financial market development
(Owolabi & Adegbite, 2013). According to Azar (2014), stock returns are negatively
related to actual inflation, and to expected and unexpected inflation.
The foundation of discourse on the relationship between stock market returns and
inflation is the Fisher (1930) hypothesis (Osagie & Emeni, 2015). The Fishers hypothesis
presuppose that shares can act as a hedge against inflation during the period of high
inflation, investors acquire more of real than financial assets (Mbulawa, 2015). However,
the Fama’s (1981) hypothesis states that correlation between inflation and stock market
returns is not a causal one; rather, it is a spurious relationship of dual effect (Owolabi &
Adegbite, 2013). In addition, the proxy hypothesis, stock returns are influenced by
inflation through real activities, which are essential determinants of the equity values.
Page 13
2
The real activities are, for instance capital expenditures, as well as the average real rate of
return on capital and output (Kullaporn & Lalita, 2010). Further, the Efficient Market
Hypothesis, states that stock markets fully reflect all available information, hence stock
prices are affected by changes in inflation.
Stock markets are said to reflect the health of the country’s economy (Sireesha, 2013).
The emergence and expansion of stock markets in African countries in recent decades has
been an important step for them towards attracting investment that is more private and
becoming more integrated into the global financial markets (Balparda, Caporale & Gil-
Alana, 2015). The Kenyan stock market is one of the emerging economies in Africa; its
stock market performance is highly dependent on the nature of the macroeconomic
variables. The Nairobi security market is significant for economic growth as it enables
unutilized funds to be invested in productive economic activities (Olweny and Omondi,
2011). The NSE acts as the barometer for the Kenyan economy. As such, the exchange
has continuously lobbied the government to create a conducive policy framework to
facilitate growth of the economy and the private sector to enhance growth of the stock
market (Ngugi, 2005).
1.1.1 Inflation
Inflation is a rise in the general level of prices of goods and services in an economy over
a period of time (Ariss, 2012). According to Shiblee (2009), inflation is defined as a
sustained increase in the general level of prices for goods, and services. Thus, inflation is
a persistent rise in the overall (or average) level of prices of all goods and services.
Inflation occurs when prices of goods increase or when it needs more money to purchase
Page 14
3
the same items (Saleem, Zafar & Rafique, 2013). Inflation pressure can be largely
attributed to structural factors such as; real income reduction caused by fluctuation in oil
revenue, high nominal wages and debt obligation in the form of expansionary fiscal
deficit (Taofik & Omosola, 2013). Other causes of inflation are attributed to fluctuations
in the demand of goods and service, as well as changes in available supplies of a product
(Ariss, 2012).
Inflation gradually reduces the purchasing power of money, hence a loss of the real value
of money. As inflation increases over the period, then the value of money decreases and
return is also decreased (Ahmad & Naseem, 2011). Higher inflation uncertainty increases
the required risk premium, leads to a higher discount rate, and lowers the discounted
present value of expected future cash flows, thus resulting in a fall in stock prices. In
addition, economic activity is adversely affected by inflation uncertainty and since stock
returns lead economic activity, there is a negative relation between stock returns and
inflation uncertainty (Azar, 2014). High rates of inflation erode the purchasing power of
an economy’s currency (Mugambi & Okech, 2016). However, low and stable inflation
rates allow the private sector to plan for the future, lead to a lower need for costly price
adjustments, prevent tax distortion and thus create a stable business environment (Alimi,
2014).
Inflation considered one of the economic phenomena that still polarized attention of both
developed and developing countries. In addition, it is considered a complex economic
subject because it represents a tangible phenomenon and not only a macroeconomic
variable such as gross domestic product and investment (Shukairi, 2012). Inflation is
widely measured by calculating the movement in the Consumer Price Index (CPI)
Page 15
4
(Mohan & Chitradevi, 2014). According to Ahmad and Naseem (2011), price inflation is
measured by the inflation rate, which is calculated from the annual percentage change in
the general price index (Consumer price Index) over the period of time. Saleem, Zafar
and Rafique (2013) explains that the inflation rate is represented by the consumer price
index (CPI) which is actually signified an overall increase in prices of goods and
services.
1.1.2 Stock Market Returns
Stock market return is the yield an investor obtains over a specified period. It is
sometimes considered synonymous to stock prices. A strong market can be seen as one
that incorporates new information on stock prices and hence making the stock prices for
the firms stable and accurately valued (Mwangi & Mwiti, 2015). Stock market returns
have predictive power for investment and output because stock market returns are a
forward-looking variable that incorporates expectations about future cash flows and
discount rates. Stock market returns serve as an index to investors or governments in
making their investment decisions. Investors of different financial capacity are able to
invest in the stock market as long as they are able to get a return that is higher than their
cost of capital (Wang, 2012).
Stock returns determine how effective and efficient the stock market allocates shares and
equities based on preference and availability of market information. Increase or decrease
in price of stock create uncertainty for the investors and in turn affect the demand and
supply of stocks (Taofik and Omosola, 2013). Shares and stock markets are extremely
sensitive to any prize-shaping information, relevant for future trends and market
Page 16
5
development (Širucek, 2013). Higher stock returns imply higher profitability by firms
and other corporate bodies and thus overall growth/prosperity of an economy and vice
versa (Aliyu, 2011). Therefore, uncertainty of return in stock markets is seen as an
important aspect of the aggregate economy as an unstable growth trend in an economy
makes it difficult to invest and consume (Erdugan, 2012).
Stock return is the gain or loss of the value of a share in a particular period usually quoted
as a percentage. It consists of capital gains as well as any income received by the investor
from the stock (Mugambi & Okech, 2016). Stock market indexing is one of the most
widely used measures of stock performance. The measures of stock market performance
include market capitalization; which measures stock market size, stock market liquidity
that refers to the ability of investors to buy and sell securities easily. Others are All Share
Index; which reflects the performance and the condition of the stock market, and the
turnover ratio; which is an index of comparison for the market liquidity rating and level
of transaction costs (Daferighe & Sunday, 2012). In Kenya, stock returns are normally
calculated by from NSE 20 share index as, long since the index is usually the benchmark
in measuring stock market performance.
1.1.3 Effect of Inflation on Stock Market Returns
The relationship between inflation and stock returns has received substantial
consideration in the available literature. As such, the connection between stock prices and
inflation is based upon the Fisher (1930) which states that equity stocks, which represent
claims against the real assets of a business, may serve as a hedge against inflation. Thus,
investors would sell financial assets in exchange for real assets when expected inflation is
Page 17
6
pronounced (Ioannides, Katrakilidis & Andreas, 2005). Additionally, the efficient market
hypothesis (EMH) states that stock markets gradually integrate into the world market,
and prices react to world information like inflation and other macroeconomic variables.
According to Mahedi (2012), based on market efficiency inflation influences stock
indices, where; when the inflation rate is higher than expected, which is economically
bad news, implies meaningful impact of stock returns.
A study by Alimi (2014) also examined the long run and short run relationships between
inflation and the financial sector development in Nigeria over the period between 1970
and 2012. The findings of the study found that that inflation presented deleterious effects
on financial development over the study period. Taofik and Omosola (2013) explored the
relationships and dynamic interactions between stock returns and inflation in Nigeria and
revealed the existence of a long run relationship between stock returns and inflation.
Ahmad and Naseem (2011) examined the impact of high inflation on stock market
returns in Pakistan using monthly data of inflation and stock returns and found that there
is negative and significant impact of inflation on stock returns.
In their study, Kullaporn and Lalita (2010) investigated the relationship between inflation
and stock prices in Thailand and also explored the impact of specific events and revealed
that that movement of stock prices is irrelevant to inflation. Magnus, Krylova &
Vahamaa (2004) also examined the impact of inflation and economic growth
expectations and perceived stock market uncertainty and established that stock and bond
prices move in the same direction during periods of high inflation expectations, while
epochs of negative stock-bond return correlation seem to coincide with the lowest levels
of inflation expectations.
Page 18
7
1.1.4 Nairobi Securities Exchange
The NSE, an emerging market is the self regulating organization in Kenya dealing with
listed instruments and draws its membership from stock brokers, dealers and investment
banks (Muituri, 2014). Securities traded at NSE are bonds and shares that constitute the
markets two broad segments, i.e. the Main Investments Market Segment and the
Alternative Investments Market Segment characterized by its liquidity, market
capitalization and turnover, the NSE may be classified as both emerging market and
frontier market (Wabwire et al., 2013). The exchange comprises of over 60 active listed
companies with a daily trading volume of over US $5 million and a total market
capitalization of approximately US $15 billion. Apart from equities, government and
corporate bonds are also traded on the exchange with an average of daily bond trading of
US $60 million (Rono, 2013).
The NSE is the oldest and largest securities exchange in East Africa and most of the
shares that are traded in the Tanzanian and Ugandan exchanges are cross-listed on the
Kenyan exchange (Njuguna, 2015). The Nairobi securities exchange (NSE) has over the
years gone through many reforms to become the most advanced stock exchange in the
Eastern region of Africa and one of the most profitable markets in the world (Adjei,
2015). The NSE is currently one of the most attractive and promising markets in Africa
and many investors want to benefit from the high growth and promising economic
outlook and therefore invest in the NSE (Muituri, 2014). In Sub Saharan Africa, the NSE
is currently ranked fifth in terms of equity market capitalization (Aduda, Masila &
Onsongo, 2012).
Page 19
8
According to Vena (2014) stock market returns for the firms quoted at the NSE and the
rate of inflation were positively correlated hence an indication that high level of inflation
influences investments. A study by Muriuki (2014) investigates the effect of inflation and
interest rates on market returns at the Nairobi Securities Exchange and found a negative
and significant relationship between inflation rates and market returns but a positive and
significant relationship between interest rates and market returns. According to Olweny
and Omondi (2010), the NSE 20 Share Index fell by 7.8% to stand at 3,247 points in
December 2009 compared to 3,531 points December 2008. The Nairobi Stock Exchange
(NSE) 20 share index rose steadily over the first three quarters of 2010 to reach a peak of
4,630 points during the third quarter.
1.2 Research Problem
The relationship between stock market performance and inflation is imperative for
investors because stocks are expected to provide protection from the effects of inflation
(Mbulawa, 2015). However, various theoretical foundations provide mixed findings on
the connection between inflation and stock market returns. For instance, the proxy
hypothesis illustrate that there is a negative relationship between inflation rate and stock
market returns and also stock prices (Kullaporn and Lalita, 2010). The Fama (1981)
hypothesis on the other hand, supports that the relationship between inflation and stock
market performance is inverse (Mbulawa, 2015). However, the fisher theory presupposes
that equity stocks presents claims against real assets of a business and as such, may serve
as a hedge against inflation (Osagie & Emeni, 2015).
Page 20
9
The Kenyan economy has witnessed some significant changes in inflation over time. In
November to December 2012, the consumer price index (CPI) increased by 0.69 per cent
from 133.33 points and the overall rate of inflation declined to 3.20 per cent from 3.25
per cent (Osoro & Ogeto, 2014). Further, the consumer price index increased by 0.95
percent from 137.96 to 139.28 in April 2013 and during the same time there was a
subsequent effect on stock returns because of the changes in inflation rates (Kirui,
Wawire & Perez, 2014). In addition, the Nairobi Stock Exchange (NSE) 20 share index
rising and falling steadily over the years due to inflationary tendencies. Thus, the need to
analyze the effect of inflation on stock market returns of firms listed at the Nairobi
securities exchange.
A number of researches have been conducted to examine the effect of inflation on stock
returns in both developed and developing economies around the world. A study by,
Mahmood et al (2014) examined the connection between inflation and stock prices in
Pakistan and found that inflation is influenced negatively by pressure on stock prices.
Mahonye and Mandishara (2014) examined the long-run relationship of stock returns and
its determinants in Zimbabwe and established that inflation, real income, money supply
and exchange rate are the main determinants of stock market returns. Daferighe and
Sunday (2012) also investigated the impact of inflation on stock market performance in
Nigeria and revealed that low level of influence is regarded as a good hedge against
inflation in Nigeria. However, the above international studies obtained varied results.
In Kenya, Kimani and Mutuku (2013) investigated the impact of inflation, Central
Depository System and other macroeconomic variables on the Nairobi stock market
performance and revealed a negative relationship between inflation and stock market
Page 21
10
performance in Kenya. In addition, Mwai (2013) analyzed the relationship between
macroeconomic variables and share prices of companies listed at the Nairobi Securities
Exchange and established that share prices were affected by various macroeconomic
variables including the gross domestic product, interest rates, inflation and exchange
rates. However, most of the studies carried out in Kenya combine inflation with other
macroeconomic variables to determine their effect on stock market returns. Therefore, the
need for this study, which aims to establish, what is the effect of inflation on stock market
returns at the Nairobi securities exchange?
1.3 Research Objective
To determine the effect of inflation on stock market returns at the Nairobi securities
exchange
1.4 Value of the Study
This study will help investors enhance the understanding of inflation and its effects on
stock market returns and also help them make optimal asset allocation decisions during
inflationary times. The study will also be of significance to various policy making
institutions like the Capital Market Authority and the Nairobi Securities Exchange in
Kenya as may use its findings and recommendation to generate effective policies to
mitigate the effects of inflation on stock market returns. Finally, the findings of this study
will be of benefit to researchers and academic scholars since the study will contribute to
the available literature and knowledge on inflation and stock market returns.
Page 22
11
CHAPTER TWO: LITERATURE REVIEW
2.1 Introduction
This chapter explores the available literature on inflation and stock market returns as
studied by various scholars across the globe. The section outlines the theoretical
framework, the determinants of stock market returns, the empirical literature review and a
summary of the literature reviewed.
2.2 Theoretical Literature Review
To investigate the relationship between inflation and stock market returns at the Nairobi
Securities Exchange the study will explore the Fisher’s theory, the inflation illusion
hypothesis and the Efficient Market Hypothesis.
2.2.1 Fisher Effect Theory
The Fisher effect theory was formulated by Fisher (1930), and the theory presupposes
that nominal interest rates fully reflect available information concerning the expectations
of inflation. The theory is the basis for the idea that monetary policy should mainly focus
on managing expectations of inflation in an attempt to keep real interest rate stable. This
aims at promoting savings and investment (Laichena &Obwogi, 2015). The Fisher effect
theory also states that the expected rate of return on common stocks comprises a real
return and the expected rate of inflation. The real return on common stocks is assumed to
be constant over time. It is assumed the negative returns will exactly outweigh the
positive real return, the rate of the common stock are therefore expected to move one-on-
one with the rate of inflation (Mahonye & Mandishara, 2014).
Page 23
12
The Fisher effect presupposes that nominal rates of interest on financial assets should
move one-to-one with expected inflation. Moreover, changes in both short-term and long-
term rates are expected to affect the discount rate in the same direction through their
effect on the nominal risk-free rate (Kuwornu, 2012). The Fisher hypothesis assumes that
there is no relationship between real rates and monetary sector (Floros, 2004). However,
the Fisher hypothesis, when studied using more real rather than nominal stock returns,
suggests that real stock returns should be independent of inflation (Shanmugam &Misra,
2008). Generally, the Fisher theory presumes the nominal returns on financial assets
should increase with the rate of inflation, whereas real rates of return are independent of
the inflation rate. Thus, the Fisher effect theory as applied to stock returns presupposes an
inverse relationship between stock returns to expected and unexpected inflation.
2.2.2 Inflation Illusion Hypothesis
The inflation illusion hypothesis of Modigliani and Cohn (1970) point’s out, that the real
effect of inflation is caused by money illusion (Omotor, 2011). The inflation illusion
suggests that when expected inflation rises, bond yields duly increase, but because equity
investors incorrectly discount real cash flows using nominal rates, the increase in nominal
yields leads to equity under-pricing and vice versa (Owolabi & Adegbite, 2013).
Accordingly, the Modigliani-Cohn (1970) hypothesis suggests that disinflation may itself
generate mispricing by confusing stock market investors who are subject to inflation
illusion. It also implies that a successful stabilization of inflation will reduce the volatility
of mispricing and thereby contribute to the efficiency of the stock market (Campbell &
Vuolteenaho, 2004).
Page 24
13
The inflation illusion hypothesis also claims that stock market investors suffer from
money illusion is a particularly intriguing and controversial proposition, as the stakes in
the stock market are obviously very high. Thus, when inflation is high (low), the rational
equity-premium expectation is higher (lower) than the market’s subjective expectation,
and the stock market is undervalued (overvalued) (Cohen, Polk & Vuolteenaho, 2005).
Under the inflation hypothesis, an overly strong (weak) nominal discounting of future
real cash flows in times of higher (lower) inflation expectations depresses (raises) current
stock prices and thus leads to an undervaluation (overvaluation) of equity markets
(Schmeling & Schrimpf, 2008). The Inflation illusion theory generally makes identical
predictions about the forecasting power of inflation for asset returns in the stock market.
2.2.3 Efficient Market Hypothesis
The Efficient Market Hypothesis (EMH) was formulated by Fama (1970). The Efficient
Market Hypothesis (EMH) is a financial theory that explains that information is quickly
reflected in share prices such that investors are not able to earn excess risk adjusted
returns (Njuguna, 2015). The core idea behind the EMH is that stock prices should fully
reflect all new and available information in an unbiased manner to the market
participants. Such markets deliver accurate signals for resource apportionment as market
prices represent each security’s basic worth, although deviations can occur (Rono, 2013).
The efficient market hypothesis and rational expectations hypothesis are based on the
idea of a perfect capital market.
The Efficient Market Hypothesis outlines three main dimensions of capital market
efficiency: weak form, semi-strong and strong market efficiency, with each depending on
Page 25
14
the information set available. The weak-form efficiency is based on the random walk
hypothesis, where future price changes are independent of price changes in the past.
Similarly, semi-strong form efficiency occurs when the information set is publicly
available information while strong form efficiency occurs when the information set is all
information, including insider information (Osei, 2015). According to Fama (1970), the
theory of the EMH of financial markets holds that the security prices tend to fluctuate
randomly around their intrinsic values, return quickly towards equilibrium, and fully
reflect the latest information available.
The Efficient Market Hypothesis (EMH) is the most widely accepted model underlying
the efficiency of capital markets (Mensaha, Adom & Berko, 2014). Market efficiency
also ensures the efficient allocation of resources, in the sense that a firm’s performance is
reflected in its stock prices, which inform potential investors when to take optimal
investment decisions (Mensaha, Adom & Berko, 2014). As such, events with a positive
(negative) change in firm’s future cash flows will have a positive (negative) impact on
the stock price because investors will buy (sell) stocks (Scholer, Skiera & Tellis, 2013).
According to the EMH stock market, return is the percentage change in stock price due to
the arrival of new information. Thus, when new information on inflation becomes public,
the market rapidly assimilates the new information’s on inflation, which affects stock
prices hence market returns.
2.3 Determinants of Stock Market Returns
The section examines interest rates, money supply, exchange rates and economic growth
as the main determinants of stock market returns.
Page 26
15
2.3.1 Interest Rates
The interest rate is defined as the price of savings determined by demand and supply of
loanable funds (Obura & Anyango, 2016). The interest rate is a function of income. Its
primary role is to help mobilize financial resources and ensure the efficient utilization of
resources in the promotion of economic growth and development (Osoro & Ogeto, 2014).
The interest rate can also be defined as the annual price charged by a lender to a borrower
in order for the borrower to obtain a loan and is usually expressed as a percentage of the
total amount loaned. The neoclassical theory of interest rate states that, the cost of loans
for investment by entrepreneurs becomes costly when there is an upshot in interest rates,
therefore, investment activities in an economy shrinks as a result (Barnor, 2014).
The interest rate is considered the cost of capital and an increase or a decrease in interest
rate may affect the investment decision of the investors (Olweny & Omondi, 2010).
Accordingly, Rehman, Sidek and Fauziah (2009) argue that higher interest rates or
discount rates would reduce the present value of cash flows, hence a rise in the rate of
interest increases the opportunity cost of holding cash, which later on leads to a
substitution effect between stocks and other interest bearing securities like bonds.
According to Barnor (2014), a rise in interest rate influences investing decisions, thus
investors make changes in their investment structure, generally from capital market to
fixed income securities
2.3.2 Money Supply
Money supply or money stock is the total amount of monetary assets available in an
economy at a specific time. Money supply changes are a superior indicator and an
Page 27
16
important source of information about the future of stock market returns or variability
(Barnor, 2014). An increase in money supply leads to economic growth, stock prices
would benefit from expansionary monetary policy. In another way, with the increase in
money supply, the availability of liquidity at a lower interest rate increases, which can
flow into the stock market (Rehman, Sidek & Fauziah, 2009). Humpe and Macmillan
(2007) states that stock prices are influenced positively by industrial production and
negatively by the money supply.
Sirucek (2013) explains that the most important factor influencing the development of
stock prices in the long term is the amount of money in the economy since money supply
can affect stock prices directly, when there is more money in the economy than can be
utilized so they are allocated to investments. Additionally, Shiblee (2009) posits that
changes in stock prices are predominantly set by changes in money supply thus an
increase in the rate of growth of money supply strengthens the rate of increase in stock
prices. Conversely, a fall in the rate of growth of money supply should slow down the
growth momentum of stock prices.
2.3.3 Exchange Rates
Exchange rate is the rate at which one currency is being converted into another currency
(Mohan & Chitradevi, 2014). Exchange rate changes can affect the relative prices,
thereby the competitiveness of domestic and foreign producers. A significant
appreciation of the domestic currency makes domestic goods expensive relative to
foreign goods resulting in a shift of demand away from domestic to foreign goods. When
currency appreciates, in a situation where the country is export-oriented, it is expected
Page 28
17
that there will be a reduction in the competitiveness of her exports, and would therefore
have a negative impact on the domestic stock market (Kirui, Wawire & Perez, 2014).
The appreciation of a country’s currency lowers the cost of imported goods, which in
most cases constitute a large part of the production inputs for emerging market countries
(Kuwornu, 2012). Accordingly, when the domestic currency depreciates against foreign
currencies, export product prices will decrease and, consequently, the volume of the
country’s export will increase, assuming that the demand for this product is elastic
(Kuwornu, 2012). From a macro perspective, foreign exchange rate has an effect on the
country’s economy whereas from a micro perspective it affects the firms. As such,
exchange rate volatility has implications on a country’s financial sector, the stock market
to be precise (Obura & Anyango, 2016).
2.4 Empirical Literature Review
This section present published and unpublished studies on inflation and stock market
returns by various authors and scholars around the globe and also in Kenya.
2.4.1 Global Studies
Pinjaman and Aralas (2015) analyzed the impact of selected macroeconomic factors,
namely Gross Domestic Product, exchange rate, interest rate, inflation rate, money
supply, economic crisis and economic liberalization towards stock return volatility in
Malaysia. The dynamic stock returns, volatility estimation established that stock return
volatility is persistent in nature where previous shock will influence the current stock
performance. The findings of the cross-sectional time series model revealed significant
relationships of between Gross Domestic Product, exchange rate, interest rate, inflation
Page 29
18
rate, money supply, economic crisis and economic liberalization and stock return
volatility.
Saleem, Zafar and Rafique (2013) investigated the long run relationship between KSE
100 index return and inflation rate in Pakistani economy. The study used quarterly data
from January 1996 to December 2011 and the Augmented Dickey Fuller (ADF) unit root
test to find out the stationarity of the data at level or at first differences, the Johansen
Cointegration Technique was used to determine the long term equilibrium relationship
between inflation rate and stock prices. The study also used Granger Causality Test to
find out the causal relationship between said variables. The evidence from cointegration
test found a negative relationship between KSE 100 index return and inflation rate while
the Granger causality tests established that there was no causality between KSE 100
index return and inflation rate in any direction.
Reddy (2012) explored the impact of real gross domestic product, interest rate and
inflation rate on stock prices of quoted companies from 1997 – 2009. Using regression
analysis the study established that real gross domestic product, interest rate and inflation
rate accounted for 95.6% of the variation in stock prices. The study also revealed that a
reduction in interest and inflation rate resulted in increased stock prices, increased real
gross domestic product had a positive impact. The study recommended that the
government should therefore implement policies that will reduce inflation rate and
improve the standard of living of its citizens and interest rate should be made moderate to
encourage investment and transactions in stock.
Kuwornu (2012) explored the effect of macroeconomic variables on the Ghanaian stock
market returns using monthly data over the period January 1992 to December 2008. The
Page 30
19
study employed the Johansen Multivariate Co-integration Procedure. The empirical
results reveal that there is co-integration between the inflation, crude oil price, exchange
rate and 91-day Treasury bill rate and stock returns in Ghana indicating long run
equilibrium relationship. Further, the results revealed that; in the short run, Treasury Bill
Rate and inflation rate significantly influences the stock returns. In addition, the study
found out that in the end the stock returns are significantly influenced by inflation rate,
crude oil prices, exchange rate, and the Treasury bill rate.
Floros (2004) examined the relationship between stock returns and inflation in Greece,
The study focused on various econometric techniques to test the relationship, using
monthly values of the Athens Stock Exchange Price index and the Greek Consumer Price
index over the period 1988-2002. The results from a simple OLS model revealed a
positive, but not significant relationship, however, using a system of equations including
lagged values of inflation the study found a negative but not significant effect of lagged
inflation to stock returns. In addition, using the Johansen cointegration test, the study
found that there is no long-run relationship between stock returns and inflation in Greece
and that the inflation rate is not correlated with stock returns.
2.4.2 Local Studies
Mugambi and Okech (2016) explored the impact of macroeconomic variables on stock
returns of listed banks in the Nairobi Securities Exchange. The study employed
secondary from the Central Bank of Kenya for a period from 2000 to 2015. The study
used correlation analysis, Unit Root test and the linear regression model to establish the
relationship. The study findings revealed that interest rate, exchange rate and inflation
Page 31
20
have significant impact on bank stock return, while GDP had an insignificant impact on
bank stock returns. The study recommended that the government should ensure a stable
macroeconomic environment and moderate its monetary policy interventions.
Laichena and Obwogi (2015) analyzed the effects of macroeconomic variables on stock
returns in East Africa. The study examined the effects of interest rates, inflation rate,
currency exchange rate, GDP and their impacts on stock returns in East Africa. The study
used a panel data of 3 East African countries, Kenya, Uganda and Tanzania from 2005 to
2014. The findings of the study revealed that there was a significant relationship between
the macroeconomic variables in the study and stock returns in East Africa. The study
recommended that policymakers in East Africa should make efforts towards improving
the macroeconomic conditions of the region to improve stock returns.
Barasa (2014) studied the the determinants of stock market performance at the Nairobi
Securities Exchange. The study employed a descriptive research design and used
secondary data for a period 2000 and 2013. The study findings revealed that the NSE 20-
Share Index as well as CPI, money supply and GDP per Capita deteriorated just before,
during and immediately after the general elections. The study also established that the
relationship between inflation as measured using CPI and stock market performance was
inverse. The study concluded that the relationship between inflation and stock market
performance is inverse and insignificant.
Kirui, Wawire and Onono (2014) evaluated the relationship between gross domestic
product, Treasury bill rate, exchange rate, inflation and stock market return in the Nairobi
Securities Exchange. The study used the Engle-Granger two-step method was used to
establish the Co integrating relationship between stock returns and the macroeconomic
Page 32
21
variables and Threshold Generalized Autoregressive Conditional Heteroscedasticity
model to capture the leverage effects and volatility persistence at the NSE. The study
findings revealed that gross domestic product, inflation and the Treasury bill rate had
insignificant relationships while exchange rate showed a significant relationship with
stock returns.
Olweny and Omondi (2012) investigated the effect of macroeconomic factors on the
stock return volatility on the Nairobi Securities Exchange. The study focused on the
effect of foreign exchange rate, interest rate and inflation rate fluctuation on stock return
volatility and used monthly time series data for 10 years from 2001 - 2010. The study
employed Exponential Generalized Autoregressive Conditional Heteroscedasticity and
Threshold Generalized Conditional Heteroscedasticity. The findings of the research
revealed that foreign exchange rate, interest rate and inflation rate, affect stock return
volatility.
2.5 Conceptual Framework
A conceptual framework is a graphical or diagrammatic representation of the relationship
between variables in a study. The connection between inflation and stock market
performance has been explained theoretical and empirically studies by several authors.
Theoretically, the Fisher theory explains that equity stocks, which represent claims
against the real assets of a business, may serve as a hedge against inflation thus investors
would sell financial assets in exchange for real assets when expected inflation is
pronounced. On the hand, the efficient market hypothesis explains that a market is
efficient when it adjusts instantaneously to take account of all available information thus
Page 33
22
information on changes in inflation may be reflected in stock prices, which may affect the
stock market performance.
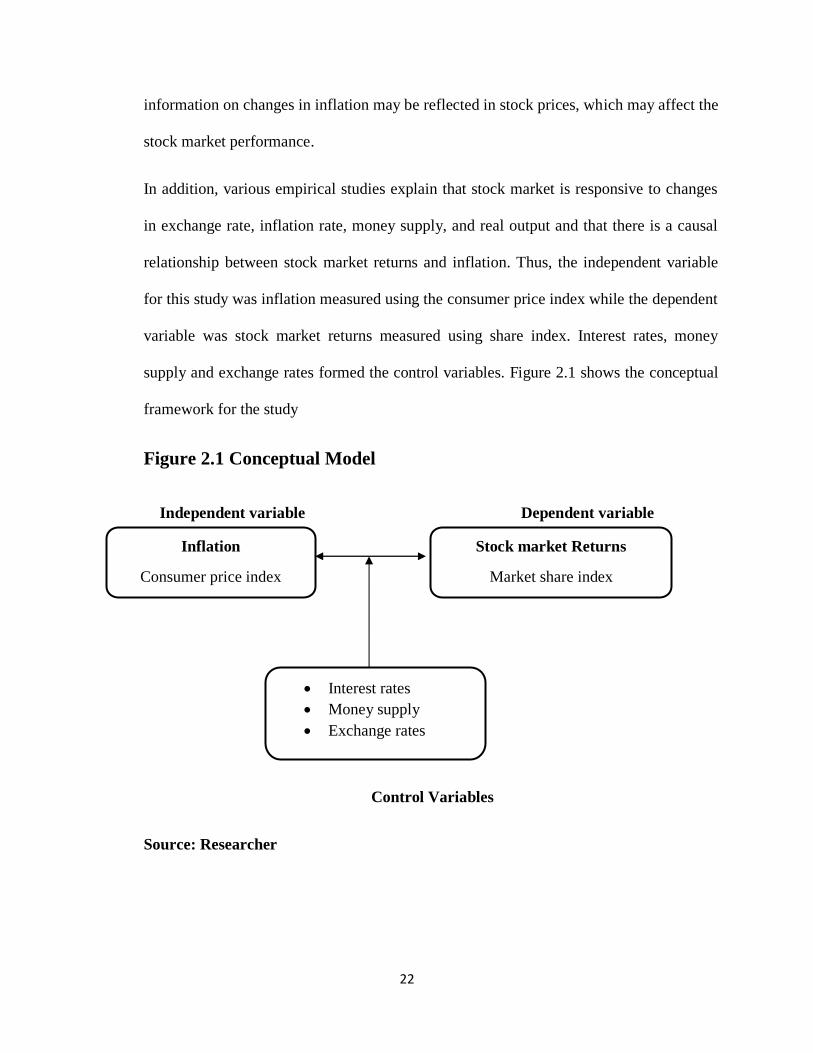
In addition, various empirical studies explain that stock market is responsive to changes
in exchange rate, inflation rate, money supply, and real output and that there is a causal
relationship between stock market returns and inflation. Thus, the independent variable
for this study was inflation measured using the consumer price index while the dependent
variable was stock market returns measured using share index. Interest rates, money
supply and exchange rates formed the control variables. Figure 2.1 shows the conceptual
framework for the study
Figure 2.1 Conceptual Model
Independent variable Dependent variable
Control Variables
Source: Researcher
Inflation
Consumer price index
Stock market Returns
Market share index
Interest rates
Money supply
Exchange rates
Page 34
23
2.6 Summary of the Literature Review
The chapter has reviewed the Fisher theory, the inflation illusion hypothesis and the
efficient market hypothesis. The Fisher effect theory presupposes that the general price
level through corresponding increases in the nominal stock market returns and thus the
real returns remain unaffected. However, the inflation illusion theory presupposes that if
the market suffers from inflation illusion, then holders of rationally priced securities will
liquidate their positions and tilt toward underpriced assets while the efficient market
hypothesis postulates that stock markets gradually integrate into the world market, and
prices react to world information and events like inflation. Thus, the reviewed theoretical
explanations provide conflicting views on the effect of inflation on stock market returns
Additionally, most of the reviewed studies show that there is a connection between
inflation and stock returns. International studies by Pinjaman and Aralas (2015), Barnor
(2014), Reddy (2012) and Kuwornu (2012) investigated the relationship between
inflation on stock market retuns. However, majority of the reviewed global studies
examine the effect of inflation in combination with other macro-economic factors. In
Kenya, studies by Mugambi and Okech (2016), Olweny and Omondi (2012), Laichena
and Obwogi (2015) and Barasa (2014) also explored the relationship between various
macroeconomic factors, inflation included on stock market performance. The reviewed
local studies acknowledge that inflation is a major determinant of stock market
performance, however the studies examine the effect of inflation in combination with
other macro variables thus, the need to explore the effect of inflation on stock market
returns independently in Kenya.
Page 35
24
CHAPTER THREE: RESEARCH METHODOLOGY
3.1 Introduction
This chapter reviews the procedures that will be used to carry out the study. The chapter
previews the research design, study population, data collection and data analysis.
3.2 Research Design
A research design is defined as the blueprint through which a study is conducted while
ensuring maximum control over the factors that may have an influence on the validity of
the findings (Burns & Grove, 2003). According to Yin (2003), research design guides the
researcher in the process of collecting, analyzing and interpreting observations, allowing
them to draw inferences concerning causal relations among the variables under
investigation. A research design is used to structure the research, display the functions of
the major parts of the research project and explain the contribution of each part in
addressing the central research questions (Troachim, 2008).
This study sought to analyze the effect of inflation on stock market returns at the Nairobi
securities exchange. Thus, the study employed a descriptive research design. A
descriptive research is concerned with the present and attempts to determine the status of
the phenomenon under investigation. Sekaran and Bougie (2011) explains that
descriptive study is undertaken in order to ascertain and be able to describe the
characteristics of the variable of interest in a situation. Therefore, a descriptive research
design helped in determining the causal relationship between inflation and stock market
returns of firms listed at the NSE
Page 36
25
3.3 Population of the Study
A population is a well defined or set of people, services, elements, events, a group of
things or households that are being investigated (Kothari, 2004). The population of the
study comprised the 65 firms listed at the Nairobi Securities Exchange, as at December
2015 thus a census of the 65 firms was undertaken (See appendix I).
3.4 Data Collection
This study used secondary data. Data on stock market returns and performance measured
using the NSE 20 share index was obtained from the Nairobi securities exchange while
data on inflation rates measured using the consumer price index, interest rates, money
supply and exchange rates was obtained from the Central Bank of Kenya and the Kenya
National Bureau of Statistics. The data covered a period of 10 years from January 2006 to
December 2015.
3.5 Data Analysis
The data collected was analyzed using quantitatively using descriptive and inferential
statistics using E-views version 8.0. Descriptive statistics of the study variables was
computed and presented in the form of the mean, maximum, minimum and standard
deviation whereas several inferential statistical models were used to draw conclusions.
3.6.1 Analytical Models
To analyze the relationship between study variables the study employed the augmented
dickey fuller model, the granger causality test and finally the regression analysis
Page 37
26
3.6.1.1 Augmented Dickey Fuller Model
The Augmented Dickey Fuller (ADF) test was applied to estimate the unit root. ADF
tests normally check the stationarity series where; if the ADF statistics exceeded the
critical value, the null hypothesis of unit root in the series was rejected.
3.6.1.2 Granger Causality Test
The Granger causality test was used to determine the relationship between two (or more)
variables in order to observe the direction of causality. The Granger causality test was
applied to test the causal relationship between inflation and stock market returns of the
firms listed at the NSE.
3.6.1.3 Regression Analysis
Regression analysis was used to establish the relationship between the independent and
dependent variable. The regression equation took the following form
𝑌 = 𝛽𝑜 + 𝛽1 𝑋1 + 𝛽2𝑋2 + 𝛽3𝑋3 + 𝛽4𝑋4 + 𝐵5𝑋5 + 𝜀
Where,
𝑌 = Stock market returns measured using the monthly NSE 20 share index
𝑋1 = Inflation measured using the monthly consumer price index
𝑋2 = Interest rates measured using monthly weighted average lending rate by
commercial banks
𝑋3 = Money supply measured using monthly broad money supply (M3)
Page 38
27
𝑋4 = Exchange rate measured using monthly average Kenya shilling per unit of
US dollar
𝛽𝑜 = Constant
𝐵𝑖 = Coefficient
𝛽1 - 𝛽5 = Regression Coefficients
𝜀 = Error term
3.6.2 Test of Significance
The study used the t and F-test to determine the statistical significance. The F-test was
used to test the overall significance of the model, i.e. the goodness of fit while the t –test
was used to test the significance of the regression coefficients at 5% level of significance.
Page 39
28
CHAPTER FOUR: DATA ANALYSIS, RESULTS AND
INTERPRETATION
4.1 Introduction
This chapter outlines the analysis and presentation of the study findings. The chapter
contains the descriptive statistics, the graphical analysis of the considered variables and
the correlations. The chapter also presents the findings of the Augmented Dickey Fuller
Test, ganger causality test, regression analysis and the interpretation of the findings.
4.2 Descriptive Statistics
Descriptive statistics comprises of the minimum and maximum values, the mean, the
standard deviation and the graphical analysis of the findings.
4.2.1 Summary Descriptive Statistics
Table 4.1 Summary Descriptive Statistics
Minimum Maximum Mean Std. Deviation
Stock Market Returns 8.100 8.600 8.39250 .165464
Inflation (CPI) 76.300 163.300 116.11000 28.005987
Interest Rates 12.900 20.300 15.50250 2.081233
Money supply 13.100 14.800 13.95000 .518875
Exchange rates 62.600 103.900 80.85500 10.270444
Source: Research Findings
Page 40
29
Table 4.2 indicates that the mean value of the stock market returns was 8.39 whereas
them average consumer price index was 116.11 while the average interest rates was 15.50
respectively. The findings also show that the average value of money supply was 13.95
and the average value of exchange rates was 80.8558 respectively.
4.2.2 Graphical Analysis
This part presents the graphical analysis of the study variables and comprises the graphs
for NSE 20 share index, inflation, interest rates, money supply and exchange rates.
4.2.2.1 NSE 20 Share Index
The figure below shows the results :
Figure 4.1 NSE 20 Share Index Trend
Source: Research Findings
-
1,000.00
2,000.00
3,000.00
4,000.00
5,000.00
6,000.00
Q4 Q2 Q4 Q2 Q4 Q2 Q4 Q2 Q4 Q2 Q4 Q2 Q4 Q2 Q4 Q2 Q4 Q2 Q4 Q2
2006 2007 2008 2009 2010 2011 2012 2013 2014 2015
NSE 20 share index
NSE 20 share index
Page 41
30
Figure 4.1 shows the quarterly NSE 20 share index trend. The figure indicates that there
have been fluctuations on the NSE 20 share index over the study period as from 2006 to
2015.
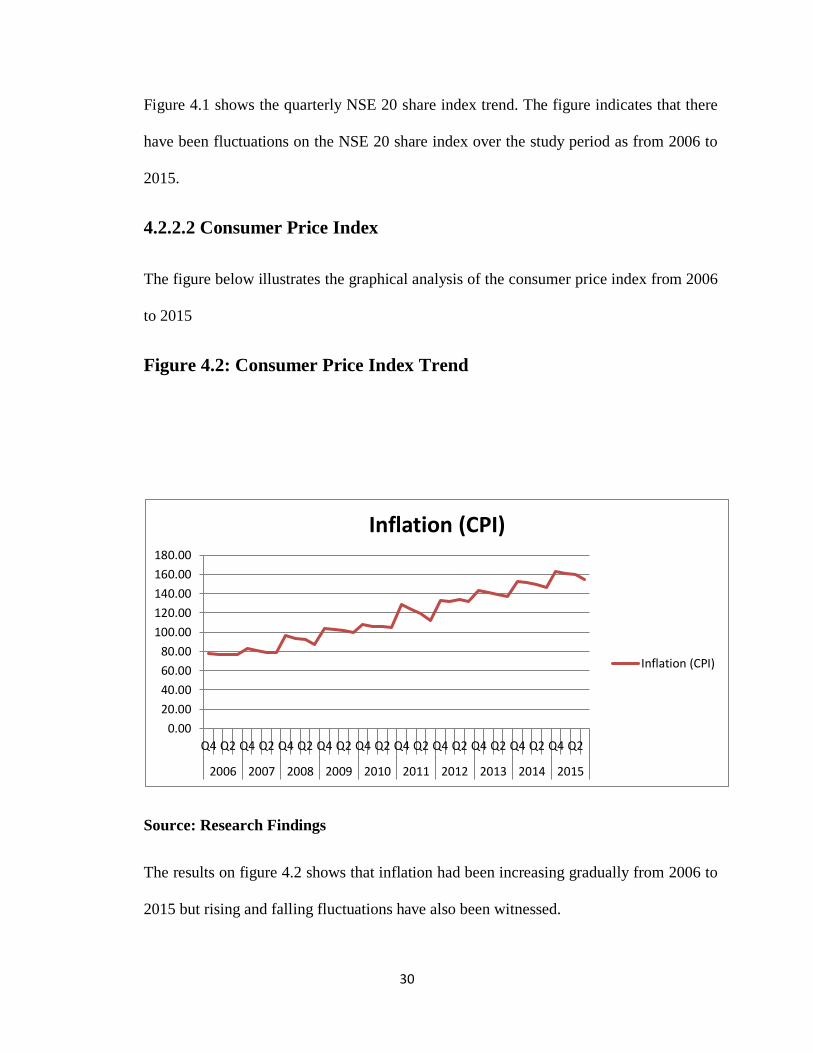
4.2.2.2 Consumer Price Index
The figure below illustrates the graphical analysis of the consumer price index from 2006
to 2015
Figure 4.2: Consumer Price Index Trend
Source: Research Findings
The results on figure 4.2 shows that inflation had been increasing gradually from 2006 to
2015 but rising and falling fluctuations have also been witnessed.
0.00
20.00
40.00
60.00
80.00
100.00
120.00
140.00
160.00
180.00
Q4 Q2 Q4 Q2 Q4 Q2 Q4 Q2 Q4 Q2 Q4 Q2 Q4 Q2 Q4 Q2 Q4 Q2 Q4 Q2
2006 2007 2008 2009 2010 2011 2012 2013 2014 2015
Inflation (CPI)
Inflation (CPI)
Page 42
31
4.2.2.3 Interest Rates
The figure below shows the trend of interest rates from 2006 to 2015
Figure 4.3 Interest rates trend
Source: Research Findings
Figure 4.3 indicates that the level of interest rates over the period 2006 to 2015 had been
rising and falling with the highest increase being witnessed in 2010, 2012 and 2013
respectively.
4.2.2.4 Money Supply
Figure 4.4 shows the results obtained
0.00
5.00
10.00
15.00
20.00
25.00
Q4 Q2 Q4 Q2 Q4 Q2 Q4 Q2 Q4 Q2 Q4 Q2 Q4 Q2 Q4 Q2 Q4 Q2 Q4 Q2
2006 2007 2008 2009 2010 2011 2012 2013 2014 2015
Interest Rates
Interest Rates
Page 43
32
Figure 4.4 Money supply trends
Source: Research Findings
The results on figure 4.4 illustrates that trend of money supply has been steadily
increasing from 2006 to 2015 but a decline had been witnessed in the fourth quarter of
2014 and sharp increase in the 2 quarter of 2015.
4.2.2.5 Exchange Rates
Figure 4.5 shows the graphical trend of exchanges rates from 2006 to 2015
-
500,000.00
1,000,000.00
1,500,000.00
2,000,000.00
2,500,000.00
3,000,000.00
Q4 Q2 Q4 Q2 Q4 Q2 Q4 Q2 Q4 Q2 Q4 Q2 Q4 Q2 Q4 Q2 Q4 Q2 Q4 Q2
2006 2007 2008 2009 2010 2011 2012 2013 2014 2015
Money supply
Money supply
Page 44
33
Figure 4.5 Exchange rates trend
Source: Research findings
The results on figure 4.5 indicate that there had been fluctuations in exchange rates over
the period. The figure also shows exchange rates had been rising steadily with the highest
rise being in 2015.
4.3 Inferential Statistics
This section contains the correlations, the the Augmented Dickey Fuller Test, ganger
causality test and regression analysis
0.00
20.00
40.00
60.00
80.00
100.00
120.00
Q4 Q2 Q4 Q2 Q4 Q2 Q4 Q2 Q4 Q2 Q4 Q2 Q4 Q2 Q4 Q2 Q4 Q2 Q4 Q2
2006 2007 2008 2009 2010 2011 2012 2013 2014 2015
Exchange rates
Exchange rates
Page 45
34
4.3.1 Correlations
Correlation analysis was carried to establish the the nature and the strength of the
relationship between the variable of the research. Table 4.2 shows the obtained
correlation analysis results
Table 4.2 Correlations
Stock Market
Returns
Inflation
(CPI)
Interest
Rates
Money
supply
Exchange
rates
Stock Market
Returns
1
Inflation (CPI) .132 1
Interest Rates -.267 .688** 1
Money supply .106 .966** .671** 1
Exchange rates .028 .893** .593** .879** 1
**. Correlation is significant at the 0.01 level (2-tailed).
Source: Research Findings
The results on table 4.2 indicate a positive correlation between stock market returns and
inflation (CPI), money supply and exchange rates. The results also show that there is a
negative correlation between stock market returns interest rates. This finding indicate that
there is a positive correlation between inflation, money supply, exchange rates and stock
market returns but a negative correlation between interest rates and stock market returns.
Page 46
35
4.3.2 Augmented Dickey-Fuller (ADF) Unit Root Test
The Augmented Dickey-Fuller tests was employed to check the stationarity time series.
Table 4.3 shows the results obtained.
Table 4.3: Augmented Dickey-Fuller Test
Null hypothesis: the time series has a unit root
Augmented Dickey-Fuller test statistic Stock market Returns Inflation
t-statistic -3.37122 -6.67233
Prob.* 0.007013 2.091e-008
*MacKinnon (1996) one-sided p-values
Source: Research findings
The findings on table 4.3 shows that the P values of stock market returns and inflation
were 0.0070 and 2.091e-008, which are less than the significance value 0.05. This leads
to the acceptance of the null hypothesis that the time series has a unit root.
4.3.3 Granger Causality Test
The Granger causality test was applied to test the causal relationship between inflation
and stock market returns of the firms listed at the NSE. Table 4.5 illustrates the results
obtained
Page 47
36
Table 4.4 Granger Causality Test
Null hypothesis F-statistic Prob. Casual inference
Inflation does not granger cause stock market returns 19.373 0.0001 Causality
Stock market returns does not granger cause inflation 0.0038528 0.9508 No causality
Source: Research Findings
The results on table 4.4 indicates that there is a causal relationship between inflation and
stock market returns since the P-value (0.0001<0.05). On the other hand, the results
indicate that there is no causal relationship between stock market returns and inflation
since the p-value (0.9508>0.05).
4.3.4 Regression Analysis
Regression analysis was used to establish the relationship between the independent
variable, the control variables and the dependent variable. Table 4.6 shows the regression
results
Table 4.5 Regression Results
Model 1: OLS, using observations 1-40
Dependent variable: Stock Market Returns
Heteroskedasticity-robust standard errors, variant HC1
Coefficient Std. Error t-ratio p-value
const 10.162 2.47431 4.1070 0.00023 ***
Inflation (CPI) 0.0075396 0.00386775 1.9494 0.05930 *
Interest Rates -0.053589 0.00873391 -6.1357 <0.00001 ***
Page 48
37
Money supply -0.081251 0.203267 -0.3997 0.69179
Exchange rates -0.00842539 0.00749283 -1.1245 0.26847
Mean dependent var 8.392253 S.D. dependent var 0.169210
Sum squared resid 0.794612 S.E. of regression 0.150676
R-squared 0.288398 Adjusted R-squared 0.207073
F(4, 35) 12.18119 P-value(F) 2.63e-06
Log-likelihood 21.61807 Akaike criterion -33.23615
Schwarz criterion -24.79175 Hannan-Quinn -30.18292
Source: Research Findings
The results on table 4.5 indicate that there is a significant positive relationship
(B=0.0075) between inflation and stock market returns at the Nairobi Securities
Exchange. The results also show that there is a significant negative relationship (B= -
0.0536) between interest rates and stock market returns at the Nairobi Securities
Exchange. Further, the results indicate that that there is an insignificant negative
relationship (B = -0.0813 & -0.0084) between money supply and exchange rates at the
Nairobi Securities Exchange.
4.4 Interpretation of the Findings
The study found that inflation significantly and positively influences stock market returns
at the Nairobi Securities Exchange. This means that a unit increase in inflation positively
affects stock market returns at the NSE by 0.0075 units, hence there is a direct
relationship between inflation and stock market returns at the NSE. Similarly, Floros
(2004) revealed a positive effect of lagged inflation on stock returns. Mugambi and
Okech (2016) revealed that interest rate and inflation had a significant impact on stock
returns. Olweny and Omondi (2012) revealed that inflation rate affects stock return
volatility of firms listed at the NSE.
Page 49
38
The study also found that interest rates significantly and negatively influences stock
market returns at the Nairobi Securities Exchange. This means that a unit increase in
interest rates negatively affects stock market returns at the NSE by 0.0536 units, hence
there is an inverse relationship between interest rates and stock market returns at the
NSE. Similarly, Rehman, Sidek and Fauziah (2009) argue that higher interest rates or
discount rates would reduce the present value of cash flows, hence a rise in the rate of
interest increases the opportunity cost of holding cash, which later on leads to a
substitution effect between stocks and other interest bearing securities like bonds.
Further, the study established a negative and insignificant relationship between money
supply and stock market returns at the Nairobi Securities Exchange. This means that a
unit increase in money supply negatively affects stock market returns at the NSE by
0.0813 units, hence there is an inverse relationship between money supply and stock
market returns at the NSE. Similarly, Humpe and Macmillan (2007) established that
stock prices are influenced positively by industrial production and negatively by the
money supply. Rehman, Sidek and Fauziah (2009) posit that the increase in money
supply increases the availability of liquidity at lower interest rate increases, which can
flow into the stock market.
The study also established a negative and insignificant relationship between exchange
rates and stock market returns at the Nairobi Securities Exchange. This means that a unit
increase in exchange rates negatively affects stock market returns at the NSE by 0.0084
units, hence there is an inverse relationship between exchange rates and stock market
returns at the NSE. Similarly, Kirui, Wawire & Perez (2014) argue that when the
currency appreciates, in a situation where the country is export-oriented, it is expected
Page 50
39
that there will be a reduction in the competitiveness of her exports, and would therefore
have a negative impact on the domestic stock market.
Page 51
40
CHAPTER FIVE: SUMMARY, CONCLUSION AND
RECOMMENDATIONS
5.1 Introduction
This chapter summarizes the research findings, provides the study conclusions and
recommendations, presents the study limitations and suggests areas, which require further
research.
5.2 Summary
The objective of this research was to determine the effect of inflation on stock market
returns at the Nairobi Securities Exchange. The independent variable for this study was
inflation measured using the consumer price index while the dependent variable was
stock market returns measured using share index. Interest rates, money supply and
exchange rates will formed the control variables. To investigate the relationship between
inflation and stock market returns at the Nairobi Securities Exchange the study explored
the Fisher’s theory, the inflation illusion hypothesis and the Efficient Market Hypothesis.
The results of descriptive statistics established that mean value of the stock market
returns was 8.39 whereas the average consumer price index was 116.11 while the average
interest rates was 15.50 respectively. The findings also established that the average value
of money supply was 13.95 and the average value of exchange rates was 80.8558
respectively. The trend analysis of the study variables established that there have been
fluctuations on the NSE 20 share index over and that inflation had been increasing
gradually while the level of interest rates had been rising and falling over the study
Page 52
41
period. The study further revealed that the trend of money supply has been steadily
increasing and there have been fluctuations in exchange rates over the period.
The correlation findings revealed a positive correlation between inflation, money supply,
exchange rates and stock market returns but a negative correlation between interest rates
and stock market returns. The results of the Augmented Dickey Fuller test (ADF) found
that the time series had a unit root. The granger causality test found that there was a
causal relationship between inflation and stock market returns but there was no causal
relationship between stock market returns and inflation. The regression results found a
significant positive relationship between inflation and stock market returns and a
significant negative relationship between interest rates and stock market returns at the
Nairobi Securities Exchange. The findings also found an insignificant negative
relationship between money supply and exchange rates at the Nairobi Securities
Exchange.
5.3 Conclusions
The findings of the study established that inflation significantly and positively influences
stock market returns at the Nairobi Securities Exchange. This leads to the conclusion that
inflation positively affects stock market returns hence, there is a direct relationship
between inflation and stock market returns at the NSE. The findings also revealed that
interest rates significantly and negatively influences stock market returns at the Nairobi
Securities Exchange. This leads to the conclusion that interest rates negatively affects
stock market returns hence there is an inverse relationship between interest rates and
stock market returns at the NSE.
Page 53
42
The findings of the study revealed a negative and insignificant relationship between
money supply and stock market returns at the Nairobi Securities Exchange. This leads to
the conclusion that an increase in money supply negatively affects stock market returns
hence there is an inverse relationship between money supply and stock market returns at
the NSE. The study further found a negative and insignificant relationship between
exchange rates and stock market returns at the Nairobi Securities Exchange. This leads to
the conclusion that an increase in exchange rates negatively affects stock market returns
hence there is an inverse relationship between exchange rates and stock market returns at
the NSE.
5.4 Recommendations for Policy and practice
The study concluded that inflation positively affects stock market returns. Based on this
conclusion the study recommends that the government of Kenya should formulate
policies on inflation to ensure that the rise of inflation does not affect stock market
returns.
The study concluded that interest rates negatively affect stock market returns. As per this
conclusion, the study recommends that the Central Bank of Kenya should formulate
prudential guidelines to ensure the rise and fall of interest rates does not have adverse
effect of stock market returns.
The study concluded that an increase in money supply and exchange rates negatively
affects stock market returns. As per this conclusion, the study recommends that the
Central Bank of Kenya should ensure that formulate policy mechanisms to ensure
Page 54
43
increase in money supply and fluctuation in exchange rates have a minimal negative
impact on stock market returns.
5.5 Limitations of the Study
The focus of this study was the relationship between inflation and stock market returns at
the Nairobi Securities Exchange. Thus, the findings of this study are limited to stock
returns of firms listed at the NSE and they may not be replicated in other stock
exchanges. Additionally, the findings are limited to Kenya since the effects of inflation
are different in various countries.
The study also used secondary data for a period of 10 years from 2006 to 2015 and
consumer price index to measure inflation. However, data for such a long time is historic
in nature and may not be representative of the current situation. In addition, inflation can
also be measured using the inflation rate but this study used the consumer price index.
5.6 Suggestions for Further Research
This study used the regression model and the granger causality test to establish the effect
of inflation on stock market returns at the Nairobi securities exchange. Thus, this study
suggest an examination of the relationship between inflation and stock returns using other
econometric models like the Johansen Cointegration Technique, Threshold Generalized
Autoregressive Conditional Heteroscedasticity model (TGARCH) and Generalized
Autoregressive Conditional Heteroscedasticity model (GARCH) to capture the effects of
inflation persistence.
Page 55
44
The study also was limited to stock market returns thus the study recommends an
additional study on the effect of inflation on share price volatility to establish whether
inflation causes share price volatility. An addition, study is also suggested on the effect of
inflation on stock market returns of firms listed at the East Africa Securities Exchanges.
Page 56
45
REFERENCES
Adjei, B. (2015). Return and Volatility Spillovers among Stock and Foreign Exchange
Markets: Empirical Evidence from selected African Markets. Unpublished Thesis.
Lappeenranta University of Technology.
Aduda, J., Masila, J. M. & Onsongo, E. Y. (2012). The Determinants of Stock Market
Development: The Case for the Nairobi Stock Exchange. International Journal of
Humanities and Social Science, 2 (9), 214-230
Ahmad, M. I. & Naseem, M. A. (2011). Does Inflation Hurt the Stock Market Returns?
Accessed online from https://www.researchgate.net/publication/228311038 on
27/6/2016
Alimi, R. S. (2014). Inflation and Financial Sector Performance: the Case of Nigeria.
Timisoara Journal of Economics and Business, 7 (1), 55-69
Aliyu, S. U. R. (2011). Does inflation has an impact on Stock Returns and Volatility.
Evidence from Nigeria and Ghana. Bayero University, Kano-Nigeria
Ariss, R. T. (2012). Understanding Inflation and Revising National Price Data. Lebanese
Economic Association, Beirut- Lebanon.
Azar, S. A. (2014). The Determinants of US Stock Market Returns. Open Economics and
Management Journal, 1, 1-13
Balparda, B., Caporale, G. M. & Gil-Alana, L. A. (2015). The Kenyan Stock Market:
Inefficiency, Long Memory, Persistence and Anomalies in the NSE-20. Working
Paper No. 15-11. Economics and Finance Working Paper Series
Page 57
46
Barasa, J. W. (2014). Macroeconomic Determinants of Stock Market Performance in
Kenya: Case of Nairobi Securities Exchange. Unpublished MSc Project.
University of Nairobi
Barnor, C. (2014). The Effect of Macroeconomic Variables on Stock Market Returns in
Ghana (2000-2013). Unpublished Dissertation. Walden University. Available at
http://scholarworks.waldenu.edu/dissertations
Bemholz, P. (2003). Monetary Regimes and Inflation: History, Economic and Political
Relationships. Cheltenham. Edward Elgar
Burns, R. B. & Grove, A. (2003). Business Research Methods and Statistics using SPSS.
London. Sage Publications Limited.
Campbell, J. Y. & Vuolteenaho, T. (2004). Inflation illusion and stock prices. American
Economic Review, 94 (2), 19-23.
Cohen, R. B., Polk, C. & Vuolteenaho, T. (2005). Money Illusion in the Stock Market:
The Modigliani-Cohn Hypothesis. The Quarterly Journal of Economics, 639-668
Daferighe, E. & Sunday, C. S. (2012). The Impact of Inflation on Stock Market
Performance in Nigeria. American Journal of Social and Management Sciences, 3
(2), 76-82
Erdugan, R. (2012). The Effect of Economic Factors on the Performance of the
Australian Stock Market. Unpublished Dissertation. Victoria University,
Melbourne
Floros, C. (2004). Stock Returns and Inflation in Greece. University of Portsmouth, UK
Page 58
47
Humpe, A. & Macmillan, P. (2007). Can Macroeconomic Variables Explain Long-Term
Stock Market Movements? A Comparison of the US and Japan. University of St
Andrews
Ioannides, D., Katrakilidis, C. & Andreas, L. (2005). The relationship between Stock
Market Returns and Inflation: An econometric investigation using Greek data.
University of Macedonia
Kimani, D. K. & Mutuku, C. M. (2013). Inflation Dynamics on the Overall Stock Market
Performance: The Case of Nairobi Securities Exchange in Kenya. Economics and
Finance Review, 2 (11), 01 – 11
Kirui, E., Wawire, H. W. & Onono, P. (2014). Macroeconomic Variables, Volatility and
Stock Market Returns: A Case of Nairobi Securities Exchange, Kenya.
International Journal of Economics and Finance, 6 (8), 214-228
Kothari, C. R. (2004). Research Methodology: Methods and Techniques. New Age
International (P) Limited, Publishers New Delhi
Kullaporn, L. & Lalita, R. (2010). Relationship between Inflation and Stock Prices in
Thailand. Unpublished Thesis. Umea School of Business, Thailand
Kuwornu, J. K. M. (2012). Effect of Macroeconomic Variables on the Ghanaian Stock
Market Returns: A Co-integration Analysis. Agris on-line Papers in Economics
and Informatics, 4 (2), 1-12
Page 59
48
Laichena, K. E. & Obwogi, T. N. (2015). Effects of Macroeconomic Variables on Stock
Returns in the East African Community Stock Exchange Market. International
Journal of Education and Research, 3 (10), 305-320
MacDonald, S. & Headlam, N. (2008). Research Methods Handbook: Introductory Guide
to Research Methods for Social Research. Express Networks, Manchester.
Magnus, A., Krylova, E. & Vähämaa, S. (2004). Why does the Correlation between
Stock and Bond Returns Vary over Time? European Central Bank
Mahedi, M. (2013). Impact of the Macroeconomic Variables on the Stock Market
Returns: The Case of Germany and the United Kingdom. Global Journal of
Management and Business Research, 12 (16), 1-13
Mahmood, I., Nazir, F., Junid, M. & Javed, Z. H. (2014). Stock Prices and Inflation: A
Case Study of Pakistan. Journal of Asian Business Strategy, 4 (12), 217-223
Mahonye, N. & Mandishara, L. (2012). Stock Market Returns and Hyperinflation in
Zimbabwe. Investment Management and Financial Innovations, 11 (4), 223 – 232
Mbulawa, S. (2015). The Impact of Inflation on Stock Market Performance in Zimbabwe
between 1980 and 2008: An Empirical Investigation. European Journal of
Business, Economics and Accountancy, 3 (4), 62-70
Mensaha, T., Adom, P. K. & Berko, M. P. (2014). Does Automation Improve Stock
Market Efficiency in Ghana? African Review of Economics and Finance, 6 (1),
69–101
Page 60
49
Mohan, C. & Chitradevi, N. (2014). Impact of Inflation and Exchange Rate on Stock
Market Performance in India. Indian Journal of Applied Research, 4 (3), 230- 232
Mugambi, M. & Okech, T. C. (2016). Effect of Macroeconomic Variables on Stock
Returns of Listed Commercial Banks in Kenya. International Journal of
Economics, Commerce and Management, 4 (6), 390-418
Muiruri, P. N. (2014). Effects of Estimating Systematic Risk in Equity Stocks in the
Nairobi Securities Exchange (NSE) (An Empirical Review of Systematic Risks
Estimation). International Journal of Academic Research in Accounting, Finance
and Management Sciences, 4 (4), 228–248
Muriuki, P. K. (2014). The Effect of Inflation and Interest Rates on Stock Market Returns
of Firms Listed at the Nairobi Securities Exchange. Unpublished MBA Project.
University of Nairobi.
Mwai, A. M. (2013). The Relationship between Macroeconomic Variables and Share
Prices of Companies Listed at the Nairobi Securities Exchange. Unpublished
MBA Project. University of Nairobi
Mwangi, M. & Mwiti, J. K. (2015). The Effect of Voluntary Disclosure on Stock Market
Returns of Companies Listed at the Nairobi Securities Exchange. International
Journal of Business and Social Science, 6 (1), 99-105
Njuguna, J. M. (2015). An Investigation of the Market Efficiency of the Nairobi
Securities Exchange. Unpublished Project. University of South Africa
Page 61
50
Obura, J. M. & Anyango, C. (2016). Moderating Effect of Interest Rates on Relationship
between Foreign Exchange Rate Fluctuation and Performance of Nairobi
Securities Exchange Market. Universal Journal of Accounting and Finance, 4 (2),
27-34
Olowoniyi A. O and Ojenike J.O. (2012). Determinants of Stock Return of Nigerian-
Listed Firms. Journal of Emerging Trends in Economics and Management
Sciences, 3 (4), 389-392
Olweny, T. & Omondi, K. (2011). The Effect of Macroeconomic Factors on Stock Return
Volatility in the Nairobi Stock Exchange, Kenya. Economics and Finance
Review, 1 (10), 34 – 48
Omotor, D. G. (2011). Relationship between Inflation and Stock Market Returns:
Evidence from Nigeria. Journal of Applied Statistics, 1 (1), 1 – 15
Osagie, E.I. & Emeni, F. K. (2015). Inflation Rates, Financial Openness, Exchange Rates
and Stock Markets Volatility in Nigeria. ICAN Journal of Accounting and
Finance, 4 (1), 125-140
Osei, K. A. (2002). Asset pricing and information efficiency of the Ghana Stock Market.
AERC Research Paper 115. African Economic Research Consortium, Nairobi,
Kenya
Osoro, C. & Ogeto, W. (2014). Macro Economic Fluctuations Effects on the Financial
Performance of Listed Manufacturing Firms in Kenya. The International Journal
of Social Sciences, 20 (1), 26-40
Page 62
51
Owidi, O. H. & Waweru, F. M. (2016). Analysis of Asymmetric and Persistence in Stock
Return Volatility in the Nairobi Securities Exchange Market Phases. Journal of
Finance and Economics, 4 (3), 63-73.
Owolabi, A. U. & Adegbite, T. A. (2013). Inflation and Capital Market Performance: The
Nigerian Outlook. Journal of Emerging Trends in Economics and Management
Sciences, 5 (1), 93-99
Phiri, A. (2016). Long run equilibrium adjustment between inflation and stock market
returns in South Africa: A nonlinear perspective. Munich Personal RePEc
Archive Available online at https://mpra.ub.uni-muenchen.de/70260/
Pinjaman, S. B. & Aralas, S. B. (2015). The Dynamic Stock Returns Volatility and
Macroeconomic Factors in Malaysia: A Sectoral Study. South East Asia Journal
of Contemporary Business, Economics and Law, 8 (3), 33 – 40
Rahman, A. A., Sidek, N. Z. M. & Fauziah, H. T. (2009). Macroeconomic Determinants
of Malaysian Stock Market. African Journal of Business Management, 3 (3), 95-
106.
Ritter, J. R. (2005). Economic Growth and Equity Returns. Pacific-Basin Finance
Journal, 13, 489 – 503
Reddy, D. V. L. (2012). Impact of Inflation and GDP on Stock Market Returns in India.
International Journal of Advanced Research in Management and Social Sciences,
1 (6), 120 - 136
Page 63
52
Rono, C. H. (2013). Stock Price Reaction to Earnings Announcements: A Comparative
Test of Market Efficiency between NSE Securities Exchange and JSE Securities
Exchange. Unpublished Thesis. University of the Witwatersrand
Saleem, F. Zafar, L. & Rafique, B. (2013). Long Run Relationship between Inflation and
Stock Return: Evidence from Pakistan. Social Sciences and Humanities, 4 (2),
407 – 415
Schmeling, M. & Schrimpf, A. (2008). Expected Inflation, Expected Stock Returns, And
Money Illusion: What Can We Learn From Survey Expectations? Discussion
Paper 2008-036. Center for European Economic Research, Mannheim, Germany
Schöler, L., Skiera, B. & Tellis, G. J. (2013). Stock Market Returns to Financial
Innovations before and during the Financial Crisis in US and Europe. Goethe
University
Shanmugam, K. R. & Misra, B. S. (2008). Stock Returns- Inflation Relation in India.
Working Paper 38/2008. Madras School of Economics, India
Shiblee, L. (2009). The Impact of Inflation, GDP, Unemployment, and Money Supply on
Stock Prices. Arab Bank – Syria
Shukairi, N.M., Waleed, A., AbdulBaset, H. & Marwan M. A. (2012). The Relationship
between Inflation and Stock Prices (A Case of Jordan). IJRRAS, 10 (1), 46-52
Sireesha, P. B. (2013). Effect of Select Macro Economic Variables on Stock Returns in
India. International Journal of Marketing, Financial Services & Management
Research, 2 (6), 197-207
Page 64
53
Širucek, M. (2013). The Impact of the Money Supply on Stock Prices and Stock Bubbles.
Mendel University
Taofik, M. I. & Omosola, M. A. (2013). The Relationship between Stock Return and
Inflation in Nigeria. European Scientific Journal, 9 (4), 146 – 157
Troachim, W. M. K. (2008). Research Methods: Knowledge Base. Mason OH.
Vena, H. (2014). The Effect of Inflation on the Stock Market Performance of the Nairobi
Securities Exchange. Unpublished MBA Project. University of Nairobi
Wabwire, J. M., Owuor, G., Onyuma, S. & Njuguna, A. (2013). The Effect of Initial
Public Offer Announcements on Market Returns of Listed Stocks at the Nairobi
Stock Exchange. International Journal of Research in Management, 3 (2), 84-119
Wang F. (2012). Determinants of Chinese Stock Market Returns. Unpublished MSc
Thesis. Universiti Utara Malaysia
Yin, R. K. (2003). Case Study Research Design and Methods. (3rd Ed.) Applied Social
Methods Research Series
Page 65
54
APPENDICES
Appendix I: Firms Listed at the Nairobi Securities Exchange
1. A.Baumann CO Ltd
2. Athi River Mining
3. Atlas Development and Support Services
4. B.O.C Kenya Ltd
5. Bamburi Cement Ltd
6. Barclays Bank Ltd
7. British American Tobacco Kenya Ltd
8. British-American Investments Company
(Kenya) Ltd
9. Car and General (K) Ltd
10. Carbacid Investments Ltd
11. Centum Investment Co Ltd
12. CFC Stanbic Holdings Ltd
13. CIC Insurance Group Ltd
14. Crown Berger Ltd
15. Diamond Trust Bank Kenya Ltd
16. E.A.Cables Ltd
17. E.A.Portland Cement Ltd
18. Eaagads Ltd
19. East African Breweries Ltd
20. Equity Bank Ltd
21. Eveready East Africa Ltd
22. Express Ltd
23. Flame Tree Group Holdings Ltd
24. Home Afrika Ltd
25. Housing Finance Co Ltd
26. Hutchings Biemer Ltd
27. I&M Holdings Ltd
28. Jubilee Holdings Ltd
29. Kakuzi
30. Kapchorua Tea Co. Ltd
31. KenGen Ltd
32. KenolKobil Ltd
33. Kenya Airways Ltd
34. Kenya Commercial Bank Ltd
35. Kenya Orchards Ltd
36. Kenya Power & Lighting Co Ltd
37. Kenya Re-Insurance Corporation Ltd
38. Kurwitu Ventures
39. Liberty Kenya Holdings Ltd
Page 66
2
40. Limuru Tea Co. Ltd
41. Longhorn Kenya Ltd
42. Marshalls (E.A.) Ltd
43. Mumias Sugar Co. Ltd
44. Nairobi Securities Exchange Ltd
45. Nation Media Group
46. National Bank of Kenya Ltd
47. NIC Bank Ltd
48. Olympia Capital Holdings ltd
49. Pan Africa Insurance Holdings Ltd
50. Rea Vipingo Plantations Ltd
51. Safaricom Ltd
52. Sameer Africa Ltd
53. Sasini Ltd
54. Scangroup Ltd
55. Standard Chartered Bank Ltd
56. Standard Group Ltd
57. Stanlib Fahari I-REIT
58. The Co-operative Bank of Kenya Ltd
59. Total Kenya Ltd
60. TPS Eastern Africa (Serena) Ltd
61. Trans-Century Ltd
62. Uchumi Supermarket Ltd
63. Umeme Ltd
64. Unga Group Ltd
65. Williamson Tea Kenya Ltd
Source: Nairobi Securities Exchange
Page 67
41
Appendix II: Research Data
Year Quarter
NSE 20
share
index
Ln NSE 20
share index
Inflation
(CPI)
Interest
Rates
Money
supply
Ln
Money
supply
Exchange
rates
2006 Q4 5,646 8.64 78.27 13.74 478,763 13.08 72.16
Q3 4,880 8.49 76.80 13.54 504,457 13.13 71.78
Q2 4,260 8.36 76.39 13.79 528,507 13.18 71.80
Q1 4,100 8.32 76.35 13.33 545,783 13.21 72.10
2007 Q4 5,445 8.60 82.68 13.32 557,650 13.23 67.45
Q3 5,150 8.55 80.90 12.87 581,440 13.27 68.35
Q2 5,150 8.55 78.46 13.14 615,595 13.33 69.16
Q1 5,130 8.54 78.90 13.56 638,440 13.37 69.60
2008 Q4 3,521 8.17 96.38 14.87 673,720 13.42 62.65
Q3 4,180 8.34 93.75 13.66 716,890 13.48 63.03
Q2 5,190 8.55 92.14 14.06 719,543 13.49 65.93
Q1 4,840 8.48 87.18 14.06 747,127 13.52 67.88
2009 Q4 3,247 8.09 104.07 14.8 761,007 13.54 78.45
Q3 3,290 8.10 102.90 14.76 789,807 13.58 79.25
Q2 3,810 8.25 101.91 15.09 824,550 13.62 79.81
Q1 3,520 8.17 99.50 14.87 866,800 13.67 79.58
2010 Q4 4,433 8.40 108.07 13.87 1,086,504 13.90 78.94
Q3 4,630 8.44 106.32 13.98 1,160,438 13.96 77.58
Page 68
42
Q2 4,480 8.41 105.65 14.19 1,224,547 14.02 76.98
Q1 4,340 8.38 105.01 14.39 1,261,646 14.05 76.49
2011 Q4 3,205 8.07 128.81 20.04 1,305,511 14.08 91.52
Q3 3,180 8.06 123.88 14.79 1,355,670 14.12 94.85
Q2 3,970 8.29 119.56 13.91 1,444,592 14.18 86.33
Q1 3,890 8.27 112.41 13.92 1,505,853 14.22 82.21
2012 Q4 4,133 8.33 133.35 18.15 1,509,222 14.23 85.71
Q3 3,970 8.29 131.78 19.73 1,564,173 14.26 84.61
Q2 3,700 8.22 133.63 20.3 1,640,561 14.31 84.76
Q1 3,370 8.12 131.36 20.34 1,723,349 14.36 83.54
2013 Q4 4,927 8.50 143.25 16.99 1,744,233 14.37 86.15
Q3 4,793 8.47 140.99 16.86 1,815,433 14.41 87.17
Q2 4,598 8.43 139.46 16.97 1,849,167 14.43 84.98
Q1 4,861 8.49 136.72 17.73 1,924,700 14.47 86.50
2014 Q4 4,936 8.50 152.09 15.99 1,957,492 14.49 90.04
Q3 5,199 8.56 151.62 16.04 1,850,994 14.43 88.49
Q2 4,906 8.50 149.27 16.36 1,814,700 14.41 87.43
Q1 4,885 8.49 145.99 16.91 1,779,118 14.39 86.33
2015 Q4 5,100 8.54 163.27 17.45 2,658,200 14.79 102.08
Q3 5,200 8.56 160.93 16.57 2,556,000 14.75 103.89
Q2 5,500 8.61 159.71 15.48 2,133,400 14.57 97.01
Q1 5,346 8.58 154.48 15.46 2,234,800 14.62 91.81
Source: Research Findings