Journal of Economics, Business, and Accountancy Ventura Vol. 22, No. 1, April - July 2019, pages 123 - 136 The effect of marketing mix and after sales service toward brand equity Roya Bakhshinezhad Shamami 1 *, Bahram Kheiry 2 1,2 Iran, Islamic Republic of A R T I C L E I N F O Article history Received : 5 May 2019 Revised : 19 June 2019 Accepted : 19 June 2019 JEL Classification: M31 Key words: Marketing mix, 4P (price, product, place, pro- motion), After-sales services; Brand awareness, Perceived quality, brand equity. DOI: 10.14414/jebav.v22i1.1671 * Corresponding author, email address: 1 [email protected]ABSTRACT The present research aimed to study the effect of the marketing mix (price, product, place, promotion) and after-sales services on three dimensions of brand equity (perceived quality, brand loyalty, and brand awareness) using the Aaker Model. After-sales service in the automotive industry is emphasized as a key and effective element in the promotion of perceived quality, brand loyalty, brand equity, and even products pricing. It is a descriptive survey in which the required data were collected using a questionnaire. The statistical population included the buyers of products of Iran Khodro Diesel Company who have used the sales and after-sales services of this company, 384 of whom were selected as the sample. The obtained data were analyzed using Smart PLS-2 and SPSS-21. The results indicated that product; place (distribution), promotion (advertisement), and after-sales services have a significant impact on dimensions of brand equity. ABSTRAK Penelitian ini bertujuan untuk mengetahui pengaruh bauran pemasaran (harga, produk, tempat, promosi) dan layanan purna jual pada tiga dimensi ekuitas merek (kualitas yang diterima, loyalitas merek, dan kesadaran merek) menggunakan Model Aaker. Layanan purna jual di industri otomotif pergunakan sebagai elemen kunci dan efektif dalam promosi terhadap persepsi kualitas, loyalitas merek, ekuitas merek, dan bahkan untuk penetapan harga produk. Penelitian ini adalah jenis survei deskriptif di mana data yang diperlukan diambil menggunakan kuesioner. Populasi statistik meliputi pembeli produk Iran Khodro Diesel Company yang telah menggunakan layanan penjualan dan purna jual perusahaan ini, 384 di antaranya dipilih sebagai sampel. Data yang diperoleh dianalisis menggunakan Smart PLS-2 dan SPSS-21. Hasil menunjukkan bahwa produk; tempat (distribusi), promosi (iklan), dan layanan purna jual memiliki pengaruh signifikan pada dimensi ekuitas merek. 1. INTRODUCTION A product becomes branded when the target buyers are aware of that product, and when they also have got the knowledge structures of that product in their mind (Keller, 1993; Krishnan, 1996). These knowledge structures increase value and this increased value create brand equity (value further results in the creation of brand equity) (Aaker, 1991-1996, Keller, 1993). Studies have shown that brand equity has been always considered one of the most famous marketing concepts over the past decades (Yoo & Donthu, 2001). First, brand equity is an important non-price competitive principle to make a distinction and one of the essential factors for any company to achieve a suitable position in the industry. It also plays a strategic and important role in achieving competitive advantage. In other words, brand equity is an increasing tool or the adding the value (value added of a product through its brand (Kamakura and Russell, 1993). This value can be calculated through subtraction from the profits of the physical properties of the product or the total brand profit. As a considerable asset for companies, brand equity can increase the cash flow of their businesses (Simon and Sullivan, 1993). Some researchers have concluded that brand equity can affect the future profit and increase liquidity in a long run. In addition, it can also increase the chance of choosing a brand (trademark) (Buil et al, 2013). According to Aaker (1991, 1996), brand equity is a multi-dimensional concept. These
Transcript
Journal of Economics, Business, and Accountancy Ventura Vol. 22, No. 1, April - July 2019, pages 123 - 136
The effect of marketing mix and after sales service toward brand equity
Roya Bakhshinezhad Shamami1*, Bahram Kheiry2
1,2Iran, Islamic Republic of
A R T I C L E I N F OArticle historyReceived : 5 May 2019Revised : 19 June 2019Accepted : 19 June 2019
ABSTRACTThe present research aimed to study the effect of the marketing mix (price, product, place, promotion) and after-sales services on three dimensions of brand equity (perceived quality, brand loyalty, and brand awareness) using the Aaker Model. After-sales service in the automotive industry is emphasized as a key and effective element in the promotion of perceived quality, brand loyalty, brand equity, and even products pricing. It is a descriptive survey in which the required data were collected using a questionnaire. The statistical population included the buyers of products of Iran Khodro Diesel Company who have used the sales and after-sales services of this company, 384 of whom were selected as the sample. The obtained data were analyzed using Smart PLS-2 and SPSS-21. The results indicated that product; place (distribution), promotion (advertisement), and after-sales services have a significant impact on dimensions of brand equity.
ABSTRAKPenelitian ini bertujuan untuk mengetahui pengaruh bauran pemasaran (harga, produk, tempat, promosi) dan layanan purna jual pada tiga dimensi ekuitas merek (kualitas yang diterima, loyalitas merek, dan kesadaran merek) menggunakan Model Aaker. Layanan purna jual di industri otomotif pergunakan sebagai elemen kunci dan efektif dalam promosi terhadap persepsi kualitas, loyalitas merek, ekuitas merek, dan bahkan untuk penetapan harga produk. Penelitian ini adalah jenis survei deskriptif di mana data yang diperlukan diambil menggunakan kuesioner. Populasi statistik meliputi pembeli produk Iran Khodro Diesel Company yang telah menggunakan layanan penjualan dan purna jual perusahaan ini, 384 di antaranya dipilih sebagai sampel. Data yang diperoleh dianalisis menggunakan Smart PLS-2 dan SPSS-21. Hasil menunjukkan bahwa produk; tempat (distribusi), promosi (iklan), dan layanan purna jual memiliki pengaruh signifikan pada dimensi ekuitas merek.
1. INTRODUCTIONA product becomes branded when the target buyers are aware of that product, and when they also have got the knowledge structures of that product in their mind (Keller, 1993; Krishnan, 1996). These knowledge structures increase value and this increased value create brand equity (value further results in the creation of brand equity) (Aaker, 1991-1996, Keller, 1993).
Studies have shown that brand equity has been always considered one of the most famous marketing concepts over the past decades (Yoo & Donthu, 2001). First, brand equity is an important non-price competitive principle to make a distinction and one of the essential factors for any company to achieve a suitable position in the industry. It also plays
a strategic and important role in achieving competitive advantage. In other words, brand equity is an increasing tool or the adding the value (value added of a product through its brand (Kamakura and Russell, 1993). This value can be calculated through subtraction from the profits of the physical properties of the product or the total brand profit. As a considerable asset for companies, brand equity can increase the cash flow of their businesses (Simon and Sullivan, 1993). Some researchers have concluded that brand equity can affect the future profit and increase liquidity in a long run. In addition, it can also increase the chance of choosing a brand (trademark) (Buil et al, 2013).
According to Aaker (1991, 1996), brand equity is a multi-dimensional concept. These
124
Roya B Shamami & Bahram Kheiry, The effect of marketing mix and after sales service
dimensions increase the brand equity because each of them is positively associated with the brand equity. In the present research, three of these dimensions will be studied. Any marketing activity has the potential to affect brand equity because it reflects the effect of marketing ventures on brand equity. In this study, the 4P marketing mix was considered an indicator of marketing plans.
After-sales service is also an element in marketing activity and one of the most influential factors on the development and communication between the seller and the buyer, especially in the automotive industry. Saccani et al (2007) believes that activities related to the after-sales service are an important source of profitability and competitive advantage in most manufacturing industries, because spare parts and after-sales services may become three times more important and profitable than the original purchases during the life cycle of a product. Continuous provision of after-sales services is also vital to securing the market power.
It is very necessary to pay a special attention to after-sales service. It is due to the consideration of the features of commercial vehicles and their importance in the transportation industry. It is because it can impose heavy costs on customers in the case of any problem because of the high price of such products and their capital nature. In most studies, after-sales service has been always regarded as a relevant product, advertisement, and channel. However, its role in compensation for quality, which leads to increased brand equity, and its effect on the price has been less emphasized. When some companies have a product of low quality at a period of time and competitors offer the same product with higher quality or when the finished price of the product is high, competition on after-sales services is more effective for maintaining the position, maintaining or increasing the price, and increasing the brand equity. These companies can prolong the warranty period or improve the quality of their after-sales services and simultaneously take advantage of improved quality of their product through investment.
Less attention has been given to the role of after-sales services as part of a company’s competitive strategy while many studies on the manufacturing industries, especially the automotive industry, mainly focus on product differentiation and variety, increased quality
of cars, pricing outcomes, and the impact of product specifications on demand. The present study aims to take a step towards addressing this issue by analyzing the effect of the 4P marketing mix and after-sales service on the creation of brand equity. The ultimate objective of this study is to help the active companies in this field to develop appropriate strategies for the key factors affecting their brand equity and allocate more financial resources to these factors in order to build the dimensions of brand equity at the lowest cost and improve their financial performance.
2. THEORETICAL FRAMEWORK AND HYPOTHESESBrandFrom the perspective of the consumer, the brand is an important part of a product which can add to its value. For a potential customer, a brand is a major guide which facilitates transactions like money. Therefore, brands are more than names or symbols. Even, they are a key element in communication between the company and consumers and represent consumers’ perceptions and feelings of a product and its performance (Kotler and Armstrong, 2012).
Brand EquityResearchers have different perceptions of brand equity. Generally, brand equity is a capital or property derived from the name or symbol of a brand which is added to a product (Aaker, 1991). Brand equity is also defined as the difference in customer choice between a branded product and a non-branded one that has the same specifications (Yu et al, 2000). Keller and Lehmann (2003) states that brand equity is the distinct impact that brand knowledge has on customer responses to brand marketing. The Aaker Model (1991) is one of the generally accepted theories in this regard which has been widely used in many articles. Three dimensions of the Aaker Model, including brand awareness, perceived quality, and brand loyalty, were used to measure brand equity in this study.
Brand awareness:According to Aaker (1991), brand awareness is the ability of a potential buyer to recognize and remember that a brand is a member of a particular commodity class. In fact, based on this definition, Aaker believes that brand awareness is a tool for measuring the effectiveness of marketing and advertising
Journal of Economics, Business, and Accountancy Ventura Vol. 22, No. 1, April - July 2019, pages 123 - 136
125
activities. Aaker (1991) asserts that the process of brand equity creation begins with increasing brand awareness. Hence, it is a prerequisite for perceived quality. In addition, consumer’s brand awareness causes some attitudes, such as perceived quality, which influences brand loyalty (Keller and Lehmann, 2003). Wang et al. (2008) showed that there is a positive relationship between brand awareness and perceived quality.
Perceived qualityIn general, perceived quality is usually defined as a consumer’s judgment of the overall value of a product or service based on their intended purposes. In addition, it can be taken as the general assessment of the desirability or superiority of a brand (Aaker, 1991). In fact, perceived quality is not the real quality of a product or service but it is the customer’s mental assessment of that product or service which provides value for customers and helps them to have a reason to buy by differentiating a brand from its competitors. Perceived quality of customer is associated with information evaluation and brand loyalty and highly influences the consumer when buying a product or service. Perceived quality is a prerequisite for brand loyalty and higher levels of perceived quality can improve brand loyalty (Papu et al, 2005). Thus, perceived quality is not only the overall value of product but also the customers’ mental assessment associated with information evaluation and brand loyalty.
Brand loyaltyAchieving the highest degree of loyalty is an important objective in the process of branding. One of the major features of a brand is the ability to build loyalty in customers (Heding et al, 2015). Brand loyalty plays a significant role in creating long-term interests for companies, because loyal customers to a brand need less promotional activities than other customers; they are willing to pay more for the benefits and quality of their favorite brand and stand against situational factors and competitors’ marketing efforts, although there may be logically other alternatives. On the other hand, brand loyalty helps organizations to gain a greater share of the market (Bohrer, 2007).
Marketing MixThe concept of marketing mix was first introduced by Borden in 1964. As the quintessence of decision-making and market assessment, marketing mix refers to a set of
tactical and controllable tools that companies combine them with each other in order to achieve their desired response in the target market (Kotler and Armstrong, 2012: 121). These tools can be divided into four variables of product, price, place (or distribution), and promotion, that are known as the 4P.
ProductAccording to Cutler et al (2000), a product is anything that is marketed to draw attention, ownership, use or consumption and meets a requirement or demand. Lovelock and Wright believe that managers set the specifications of their main product (whether a commodity or service) and its extra services based on the expected benefits of customers and performance of competing products (Lovelock and Wright, 2003).
PricePrice is the various costs that customers incur for the benefits of a product (service) and includes financial costs and other non-financial costs (Kotler and Armstrong, 2012). Lower price combinations may bring benefits and benefits to the company in the short term, but it is not a proper policy for long-term business development (Chen et al, 2012). Consumers believe that price is an incredibly important index and also an indicator of quality or profit. Brands with higher prices are understood as better quality, while those with lower prices damage their quality (Kamakura and Russell, 1993; Milgrom and Roberts, 1986; Woodside et al, 1977). The results of another study indicate that price (is and) indirect standard of product quality for customers. This means that the price of a product is positively associated with its quality (Selvakumar and Vikkraman, 2011).
Place (or distribution)In a simple sense, place or distribution refers to the activities that make the product available to consumers. The distribution channel, in the form of a general assessment, affects customers’ attitude towards brands (Pheng Low and Tan, 1995). In this study, distribution indicates all agencies and authorized dealers of Iran Khodro Diesel Company. Distribution through good and powerful imaged store (well-equipped stores) transmits signals about the good quality of a brand (Cretu and Brodie, 2007).
PromotionThe total promotion mix of a company consists of a special combination of promotional
126
Roya B Shamami & Bahram Kheiry, The effect of marketing mix and after sales service
activities, public relations, individual sales, promotion of sales, and marketing that the company applies them in order to communicate the product value to customers and establish effective relationships with them (Kotler and Armstrong, 2012). However, all these tools and activities contain three advantages of communication, stimulation, and call. Sales promotion can be defined as a short-term incentive which aims to encourage customers to try or use a specific product or service (Keller, 2003). Although monetary or price promotions may increase the profit or sales in a short term, they will decline the brand equity in the long term, create a low-quality image of the brand, jeopardize the brand, confuse the consumers (West and Prendergast, 2009). Kim and Hyun (2011) also showed that monetary promotions have a negative effect on perceived quality (Figure 1).
After-Sales ServiceAfter-sales service refers to all activities that a company does after selling a product or service to customers in order to satisfy customers and help them to receive the highest value of the product or service they have bought (Roosta, 2001). The review of after-sales service literature reveals that 5 aspects are critical to customer expectations of acceptable service levels (Asugman et al, 1997). These five aspects include the availability of parts, warranty and (insurance) full coverage, technical support, pricing policies, and technical assistance. In the automotive industry, after-sales service is one of the vital sources of building a brand. In addition, it has been mentioned as the fifth dimension in the creation of brand equity in
some studies. As Guajardo et al, (2015) showed, the warranty period and after-sales service quality are two factors that can compensate for the low quality of some products.
3. RESEARCH METHODThe present research was an applied, descriptive-correlational survey. To collect information about the research literature and background, the desk research method was used which included the review of relevant dissertations, articles, English or Farsi books, and internet search. To test the research hypotheses, the field study method was used. To this end, a 44-item questionnaire was developed to measure the research variables. This questionnaire was distributed among 384 customers of Iran Khodro Diesel Company who were selected based on simple random sampling. Simple random sampling is a sampling technique where every item in the population has an even chance and likelihood of being selected in the sample. Here the selection of items completely depends on chance or by probability and therefore this sampling technique is also sometimes known as a method of chances. This process and technique is known as simple random sampling, and should not be confused with systematic random sampling. A simple random sample is a fair sampling technique.Simple random sampling is a very basic type of sampling method and can easily be a compo-nent of a more complex sampling method. The main attribute of this sampling method is that every sample has the same probability of being chosen (Olken and Rotem,1986).
The sample size in this sampling method should ideally be more than a few hundred so
Figure 1The conceptual framework of the research (source: the Aaker Model, Kim and Hyun, 2011)
Journal of Economics, Business, and Accountancy Ventura Vol. 22, No. 1, April - July 2019, pages 123 - 136
127
that simple random sampling can be applied in an appropriate manner. It is sometimes argued that this method is theoretically simple to understand but difficult to practically implement. Working with large sample size isn’t an easy task and it can sometimes be a challenge finding a realistic sampling frame(Olken and Rotem, 1986).
This questionnaire consists of 2 parts. The first part includes the demographic features related to the statistical sample to achieve side-findings and the second section includes the evaluation of dependent and independent variables. For either of product variables several questions are asked: price, distribution and advertising, 3 questions which are the after sale quality service, awareness of the brand 5 questions and comprehended quality and loyalty to it has 3 questions. All the questions are studied with Likert-scale, five options form number 5 (totally agree) to 1 (totally disagree).
This questionnaire is self-administered and the designed content authenticity of the questionnaire is distributed among the related experts and experienced people several questions about the optimization or non-optimization of questions based on the variables and the purpose of each variable. The completed questionnaires are collected and the validity of the related content for each question is calculated with CVR formula and the non-beneficial questions are omitted. Besides, the face validity is obtained from asking some non-experts about the validity and invalidity of the questions.
The validity of the questionnaire was assessed through the face, content, and construct validity methods. To confirm the face validity, a number of non-specialists were asked to comment on the validity or invalidity of items. To measure the content validity, a questionnaire was distributed among experts and scholars to specify the usefulness or non-usefulness of items regarding the variables and their purpose. After the questionnaires were filled out, the content validity ratio of each item was calculated and non-useful items were eliminated. To assess the construct validity of this questionnaire, the confirmatory factor analysis was used. Accordingly, if the t-value of the factor load of each indicator with its construct is greater than 1.96, the indicators are accurate enough to measure the desired construct or latent attribute. The results showed that all indicators had an appropriate factorial structure (Table 1). Therefore, measures were
accurate enough to measure constructs or latent attributes of the research. Given the reasons mentioned above, the questionnaire used in this study for data collection had the acceptable level of validity.
The reliability of this questionnaire was assessed using Cronbach’s alpha. To this end, the questionnaire was distributed among a group of 30 from the study population to be filled out. Then, Cronbach’s alpha was calculated based on the obtained data in SPSS. Based on the pre-test sample, Cronbach’s alpha for this questionnaire was determined to be 0.971, which is greater than 0.7. Therefore, it can be stated that the questionnaire was in a quite acceptable level in terms of reliability.
It is noteworthy that all statistical analyses were performed using SPSS and PLS software packages.
4. DATA ANALYSIS AND DISCUSSIONThe inferential and descriptive statistics were used in this study to analyze data and test hypotheses.
Descriptive StatisticsRegarding the purpose of this research, it is a practical one and considering the method it is a descriptive-survey-correlative research. In order to collect data, this research has been applied the study and test of research hypotheses with a questionnaire which are developed by the researcher and are related to the research subject and also afield research has been utilized. According to the Krejcie and Morgan’s (1970) table, the sample volume is about 384 and the statistical population is selected with a simple random sampling among the costumers of Iran Khodro Diesel products that have applied its services at the time and after sales services.Gender: According to the information collected from the questionnaires, 97.89% of participants were male, and only 2.11% of the statistical sample was female.
Marital Status: According to the collected information, 87% of the participants were married, and 13% of them were single.
Age: Most of the respondents were in their thirties. The lowest frequency of age was among the participants who were below 20.
Educational Attainments: The highest frequency of educational attainments came from people with high school diplomas (42%), and the lowest frequency came from people with master degrees (1.4%) in the sample.
128
Roya B Shamami & Bahram Kheiry, The effect of marketing mix and after sales service
Income Level: The highest frequency of monthly income level came from people earning 30-50 million rials (tomans) a month (39%), and the lowest frequency was among people earning more than 70 million rials (tomans) a month (8%).
Regarding the inferential statistics, the partial least squares analysis was employed to test the hypotheses because the distribution of variables was not normal. Two models are tested in PLS models. The first one is an external model or a measurement model investigating the validity and reliability of questionnaires. For this purpose, three important indices are used: Average Variance Extracted (AVE), Composite Reliability (CR), and factor load. The second model is an internal or structural model indicating the relationship between the latent research variables. This model can be used to investigate the research hypotheses.
External Model (Measurement Model)In PLS methodology, the validity of a structure should first be investigated to determine whether the selected indicators are accurate enough to measure the intended structures. For this purpose, the confirmatory factor analysis is used. In other words, the factor load of each indicator has a significance value (t) at an error level of 5% with its structure. This value ranges from -1.96 to 1.96; moreover, the factor load of each indicator should be greater than 0.50 with its structure. The validity of structure is a method of internal validity, something which means the intended tool lacks sources of error. This evaluation is done with the help of divergent and convergent validities.
Convergent Correlation: This type of correlation indicates the relationship between criteria. If the values of AVE are greater than 0.5 for all structures, the items can explain more than 50% of the variance in the relevant structures, a fact which shows the existence of convergent correlation in the tests.
Divergent Correlation: This type of correlation exists when it is predicted that two variables are not completely correlated with each other according to the theory. This can also be empirically proven by the scores obtained by measuring them. This index evaluates the relationship between a structure and its indicators in comparison with its relationship with the other structures of a model.
The calculated values of AVE are greater than 0.5 for all structures. Therefore, the items explain more than 50% of the relevant structures. The desirability of values of this index shows the convergent correlation of the tests.
The correlation of structures was smaller than the squared AVE of each structure;
Promotion 0.383 0.387 0.306 0.443 0.430 0.376 0.418 0.477 0.888Source: Data Process
Journal of Economics, Business, and Accountancy Ventura Vol. 22, No. 1, April - July 2019, pages 123 - 136
129
therefore, no pairs of variables were completely correlated with each other. The combination of items indicated that all of the structures were separated from each other very well. Thus, the measurement tool shows a divergent correlation.
According to table 2 given the fact that convergent and divergent correlations were confirmed, the measurement tool is structurally valid. On the other hand, the composite reliabilities of all structures are greater than 0.7; therefore, there is an internal consistency between the indicators of each variable.
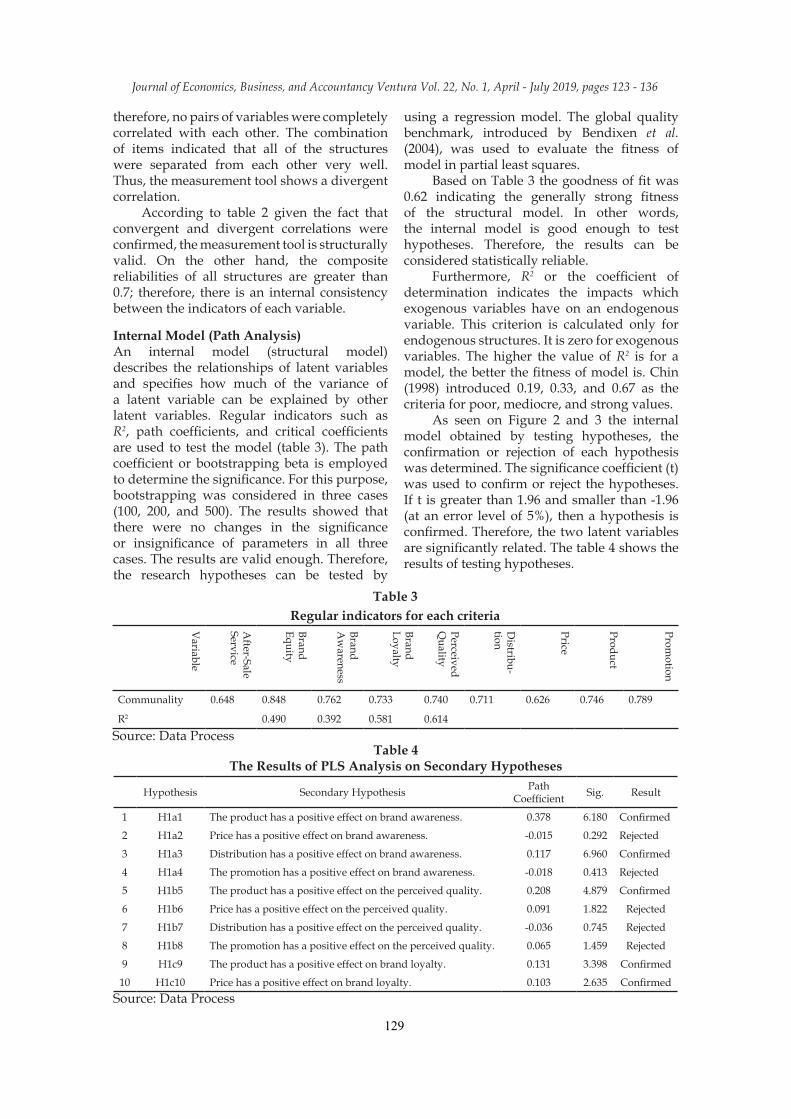
Internal Model (Path Analysis)An internal model (structural model) describes the relationships of latent variables and specifies how much of the variance of a latent variable can be explained by other latent variables. Regular indicators such as R2, path coefficients, and critical coefficients are used to test the model (table 3). The path coefficient or bootstrapping beta is employed to determine the significance. For this purpose, bootstrapping was considered in three cases (100, 200, and 500). The results showed that there were no changes in the significance or insignificance of parameters in all three cases. The results are valid enough. Therefore, the research hypotheses can be tested by
using a regression model. The global quality benchmark, introduced by Bendixen et al. (2004), was used to evaluate the fitness of model in partial least squares.
Based on Table 3 the goodness of fit was 0.62 indicating the generally strong fitness of the structural model. In other words, the internal model is good enough to test hypotheses. Therefore, the results can be considered statistically reliable.
Furthermore, R2 or the coefficient of determination indicates the impacts which exogenous variables have on an endogenous variable. This criterion is calculated only for endogenous structures. It is zero for exogenous variables. The higher the value of R2 is for a model, the better the fitness of model is. Chin (1998) introduced 0.19, 0.33, and 0.67 as the criteria for poor, mediocre, and strong values.
As seen on Figure 2 and 3 the internal model obtained by testing hypotheses, the confirmation or rejection of each hypothesis was determined. The significance coefficient (t) was used to confirm or reject the hypotheses. If t is greater than 1.96 and smaller than -1.96 (at an error level of 5%), then a hypothesis is confirmed. Therefore, the two latent variables are significantly related. The table 4 shows the results of testing hypotheses.
Table 4The Results of PLS Analysis on Secondary Hypotheses
Hypothesis Secondary Hypothesis Path Coefficient Sig. Result
1 H1a1 The product has a positive effect on brand awareness. 0.378 6.180 Confirmed
2 H1a2 Price has a positive effect on brand awareness. -0.015 0.292 Rejected
3 H1a3 Distribution has a positive effect on brand awareness. 0.117 6.960 Confirmed
4 H1a4 The promotion has a positive effect on brand awareness. -0.018 0.413 Rejected
5 H1b5 The product has a positive effect on the perceived quality. 0.208 4.879 Confirmed
6 H1b6 Price has a positive effect on the perceived quality. 0.091 1.822 Rejected
7 H1b7 Distribution has a positive effect on the perceived quality. -0.036 0.745 Rejected
8 H1b8 The promotion has a positive effect on the perceived quality. 0.065 1.459 Rejected
9 H1c9 The product has a positive effect on brand loyalty. 0.131 3.398 Confirmed
10 H1c10 Price has a positive effect on brand loyalty. 0.103 2.635 ConfirmedSource: Data Process
130
Roya B Shamami & Bahram Kheiry, The effect of marketing mix and after sales service
The Second-Order Factor AnalysisAccording to the research model, the second-order factor analysis was used to evaluate the primary. The results are as shown on Figure 4 and 5 and also Table 5.
Figure 4The Internal Model for Testing the Primary
Hypothesis in the Standard Mode
Figure 2The Internal Model for Secondary Hypotheses in the Standard Mode
Figure 3The Internal Model for Secondary Hypotheses in the Significance Model
Journal of Economics, Business, and Accountancy Ventura Vol. 22, No. 1, April - July 2019, pages 123 - 136
131
Figure 5The Internal Model for Testing the Primary
Hypothesis in the Significance Mode
Table 5The Results of PLS Analysis for
the Primary HypothesisPrimary
HypothesisPath
CoefficientSig. Results
The combina-tion of market-ing services (P4) and after-sale service has an effect on brand equity.
0.572 14.527 Con-firmed
Source: Data Process
DiscussionThe main aim of this study is developing an empirical study of Aaker (191) model in automotive industry, since mere previous researches has been done on the relations among marketing efforts, after-sale services and brand sizes and market performance. The present research is a model to describe these relations in automotive industry and test commercial vehicles. This model considers 3 features of industrial marketing. First, after-sale services are regarded as the marketing mixed efforts. Second, the role and relation of price and after-sale services as an influential factor in the market performance are regarded and the last factor is loyalty to the brand as the main factor of brand special value. Although the foreign validity of the tested model is limited since its content is limited to the commercial vehicles section, its findings will help us about the manner of relation of brand special feature with mixed efforts of marketing and its performance. The marketing mixed efforts which are considered in this model will influence on the 3 aspects of brand special value and generally the main value of the brand.
1. Confirming that the product H1b56, H1a1 and H1c9 assumptions have positive influence on brand awareness, comprehended quality and loyalty to the brand. It can be stated that about some products like commercial vehicles the selection of commercial name by the costumer is really serious since its multiple
complexities and the decision importance according to Kim and Hyun(2011) and on the other side, since the vehicle features are regarded as job tool and production and presentation of required vehicles based on the customers’ need is the vital factor of company, serious decision making and judge about product sale, loyalty will be made to shape the internal quality. For instance, from product quality to loyalty to foreign sign such as shape, and appearance as mentioned and confirmed will have positive influence on the 3 sides. For this reason, regarding the products and its aspects have vital influence on increasing the brand special value. Besides, mechanical advantages of product, such as series of aspects like product form, motor power, loading and traveller capacities, driver bedroom, the ability of installing variable utilities based on the customer’s need and product marketing condition, product performance quality, duration, validity, it’s easy fix ability and in general the product will is made correctly must be regarded.
2. The approval of H1a3 hypothesis which is the distribution of brand awareness has positive influence: the researchers show that in customer’s marketing, the distribution channel performance will help to make the brand special value (Dodds and et al,. 1991; Krishnan. 1996; Yoo and et al, 2000). Good picture of the shop not only attract users but also provides benefit. We can achieve good information from potential users, and increase the customers’ satisfaction and positive oral satisfaction. Therefore, the awareness of brand and loyalty to the commercial name will be increased. Moreover, this distribution from the shops with good picture will show one commercial name with good quality. Besides, the power of distribution channel is considered as a positive factor in brand special feature; since, it increases the high power of sale probable distribution of a commercial name at each time and place that a customer wants (Farris et al 1989; Yoo and et al,. 2000). Specifically, when a power of distribution channel increases, the customers’ effort to find and achieve a commercial name decreases, the customers will comprehend with high probability as a more valuable brand and it can increase the customer’s satisfaction and loyalty to the commercial name (Yoo and et al,. 2000). The good picture of industrial channel members can increase the buyers’ trust from the performance. Bendixen and et al, (2004) also understand that mechanical adviser and
132
Roya B Shamami & Bahram Kheiry, The effect of marketing mix and after sales service
sale agent are the main ways to achieve brand awareness in electronic device market. In this way, as Schuiling and Moss (2004) conclude that based on the researches and findings of this study, the distribution channel performance (which is related to the distribution power and channel member pictures) has positive influence on the brand awareness and brand special value. It is suggested that by increasing training, the customers’ awareness about the similar products will be influential. Increasing and development of distribution channel (development of sale agents) that all of them not only present sale service, but also after-sale service and it can cause increase in product selling, less decrease in finding and achieving product and after-sale service by the customer. As a result, the customer feel that the product has high value and the probability of buying by the buyer or potential customers will increase. Special concentration and investment in some agents that have strategic condition and in fact are the main zone of country transportation with the selection of authentic agents that have positive and powerful, the awareness degree of brand can be increased and besides making value for costumer, it can provide special feature for the company.
3. The H1c10 assumption suggests that price has positive influence on the brand loyalty: in consumer markets, the price that is extra sign of product quality and also the brands with high price mostly regard that they have high quality (Dodds and et al,. 1991; Yoo and et al,. 2000). On the other hand, the quality of presented is homogenous and can be easily confirmed, the higher price can have negative influence on the loyalty of commercial name since it is not the product quality sign and in response to these bold points, higher money must be paid. This negative point of high price is reported on the brand loyalty in industrial brand putting (Cretu and Brodie, 2007; Jensen and Klastrup, 2008; Michell and et al. 2001). Mudambi and et al (1997) also study the relation of higher price with higher services and higher loyalty to the commercial name. In this research, considering the confirmation of direct relation of price and loyalty to the brand and since costumers of commercial vehicles focus on the evaluation of product price such as monthly wage of vehicle, the prices for fixing and keeping the vehicle, quality, mechanical features, and pieced of utilized vehicles and ..., and it can be concluded that by considering the mentioned aspects in pricing and also the
pricing policies will clearly influence on loyalty to brand and increasing the brand special value.
4. The H1c12 assumption says that advertisement will influence on brand loyalty: upgrading will be defined as preparing information for encouragement (Van Rail and et al, 2005). This factor includes advertisement, advertising events, price decreasing, personal sale, a website which is based on activities in the user marketing. The positive influences of advertisement on the brand special value aspects are confirmed completely (Aaker and Jacobson, 1994; Cobb-Walgren et al,. 1995; Simon and Sullivan, 1993; Yoo and et al,. 2000). The advertising adventures with long-term aims can make brand special value and, in this way, by presenting real product experience that makes strong, satisfactory, and exclusive imagination, it can be helpful (Keller et al, 2011).
Today, the discounts is one of the main tools for upgrading, the short-term decrease of price, such as trades with price discount may not be satisfactory for making brand special value even if they have higher amount of sale at the time of sale (Aaker, 1991; Yoo and et al,. 2000). Exhibition, commercial show, conferences, direct electronic email of advertising, press distribution, oral advertisement and mechanical adviser especially in markets with high technology can also be considered as information sources (Abratt, 1986). Gordon et al (1993) conclude that primary awareness and imagination that the commercial that mostly achieve from direct call with sellers in the business market , the advertising activities repetition, increase in public relations, exhibition sale, price decrease as one of the temporary upgrade tool, special and non-cash discount in sale, public show of products and making mechanical catalogues to compare company products with similar products of competitors can make an influential and long-term relations with consumers and by regarding the importance of oral advertisement that today changes its form to social media, because of its easy access of most of the costumers to these tools, their importance must not be ignored and they must be focused as a tool for continuous relation with costumers.
4. The H2b14 assumption states that after-sale services have a positive effect on the comprehended quality: the quantitative researches focus on the after-sale services influences on the comprehended quality.
Journal of Economics, Business, and Accountancy Ventura Vol. 22, No. 1, April - July 2019, pages 123 - 136
133
Considering this condition, it is expected that perfect services and supports are a memorable feature of a commercial brand and it can make to have a satisfactory commercial name. The after-sale services are services to develop the buyer and seller relation in business market (Kuhn et al, 2008). It helps to buyer higher satisfaction and it also helps to develop buyer and seller relation (Mudambi et al, 1997; Van Riel and et al,. 2005).
In user marketing, after-sale services as a product is regarded as an advertisement or related channel aspect. For this reason, the role of after-sale services as a marketing tool in making brand special value and its upgrade has not been focused considerably. Based on what Hutton (1997) explains, for instance, it can probably be thought that buyers will prefer the well-known commercial vehicles than those that are not famous and its due to 3 primary reasons. First, they are not informed from their complexities. Second, commercial vehicles requires great amount of supporting services. Third, impairment in commercial vehicles performance will make serious problems for the company and buyers. Therefore, it can be said that the commercial vehicles performance are knotted with after-sale services.
After-sale services are part of product that has great influences on the achieved quality. By increasing and developing the after-sale services agents, personnel training and providing equipping the after-sale services agents; increasing the guarantee duration and services can be regarded as a competitive advantage. In some steps that automotive industries must present products with low quality which are due to political or economic conditions and consequently a gap will occur between the expected product and presented product, they can use this gap as an opportunity to compensate this gap and it can happen by increasing the guarantee and warranty time, upgrading the spare parts quality , fixing speed, the parts price and wage, frequency and availability of parts, frequency and extension of fixing centres, considering the presented services by agents can focus on the compensatory role of them in continuing the relation and customer’s satisfaction and remove this gap.
The assumptions H5c18, H6a19, H6b20 and H6c21 confirm the relation between the brand special value and general value of brand special value. By applying influences hierarchical theory (Lavidge, and Steiner, 1961)
our model in the field of commercial vehicles by considering the brand special value include 3 aspects and pass through 3 main causative ways: from commercial name awareness to the comprehended quality, from awareness to brand loyalty, and from the comprehended quality to loyalty to the brand commercial name and general value. Based on the three mentioned aspects this conclusion is the brand special value (Yoo and Donthu, 2001; Yoo and et al,. 2000). The positive influences of these three aspects of brand special value in general brand special value has been confirmed in several studies (Yoo and Donthu, 2001; Yoo and et al,. 2000). Yoo and Donthu (2001) show the internal relations between the three aspects of brand special value. The procedures that involve in brand special value are making awareness of brand and also making imagination of quality and comprehension value, emerging loyalty to brand and developing the commercial name (Gordon and et al,. 1993). These four steps are adjusted to brand special value aspects.
By confirming the assumptions H6a19, H6b20 it can be said that unlike some researches that brand awareness directly influence on brand special value, in commercial automotive discussion, due to product complexity and its high importance, knowledge and awareness of product will cause to customer knowledge and judge and selection of a commercial name; and it is similar to the fact that brand awareness relates to comprehended quality and brand loyalty. In this condition, it is interesting to note that the comprehended quality relates to brand loyalty and it means that awareness from the commercial name and comprehended has great influence on brand loyalty. Regarding the product complexity and importance (in commercial automotive) it is acceptable that brand awareness and selection and decision making will cause a brand loyalty and the user reaction based on the quality comprehension, brand superiority and his behaviour in the brand marketing activities cause brand loyalty.
5. CONCLUSION, IMPLICATION, SUGGE-STION, AND LIMITATIONSThis research focuses on survey and determining the marketing influence of the P4 and after-sale services on brand special value. The research findings state that product and distribution have a positive effect on brand awareness. Furthermore, the product has a positive influence on comprehended quality. Product, price and development are the three
134
Roya B Shamami & Bahram Kheiry, The effect of marketing mix and after sales service
aspects that have a positive influence on brand loyalty. After-sale services have a positive influence on comprehended quality. Findings show that brand awareness has a positive influence on comprehended quality and brand loyalty. The comprehended quality of brand has a positive influence on brand awareness. Brand awareness has a positive influence on brand special value.
In this research, brand loyalty is the only factor that directly affects brand special value (H5c18 assumption confirmation). It is a factor that influences from brand awareness and comprehended quality and it is the main item of brand special value. This loyalty will decrease the brand marketing expenses since keeping existed customers is easier than attracting new customer’s satisfaction and decreasing their motivations is for replacing the other brands. Therefore, by strengthening the influential aspects on awareness, comprehended quality and loyalty and with marketing programmes, the companies can make special value and also they can use loyalty to commercial name and sign. This is the highest aim and it leads to brand special value. The results of this conclusion show that the customer relation with brand is influenced from marketing and after-sale services; as a result, some activities will be done in this way and follow some ways that lead to less expenses.
REFERENCESAaker, D.A. and Equity, M.B., (1991).
Capitalizing on the Value of a Brand Name. New York, 28, pp.35-37.
Aaker, D.A. and Equity, M.B., (1991). The Free Press. New York, 206.
Aaker, D.A. and Jacobson, R., (1994). The financial information content of perceived quality. Journal of marketing research, 31(2), pp.191-201.
Aaker, D.A., (1996). Measuring brand equity across products and markets. California management review, 38(3).
Abratt, R., (1986). Industrial buying in high-tech markets. Industrial marketing management, 15(4), pp.293-298.
Asugman, G., Johnson, J.L. and McCullough, J., (1997). The role of after-sales service in international marketing. Journal of International Marketing, 5(4), pp.11-28.
Bendixen, M., Bukasa, K.A. and Abratt, R., (2004). Brand equity in the business-to-business market. Industrial marketing management, 33(5), pp.371-380.
Blut, M., Evanschitzky, H., Vogel, V. and Ahlert, D., (2007). Switching barriers in the four-stage loyalty model. ACR North American Advances.
Bohrer, M.F., (2007). Discriminant Analysis of Aaker’s Brand Equity Model on Top-of-mind Awareness/brand Preference Congruence in Prospective Hospital Patients. ProQuest.
Buil, I., De Chernatony, L. and Martínez, E., (2013). Examining the role of advertising and sales promotions in brand equity creation. Journal of Business Research, 66(1), pp.115-122.
Chen, C.C., Chen, P.K. and Huang, C.E., (2012). Brands and consumer behavior. Social Behavior and Personality: an international journal, 40(1), pp.105-114.
Cobb-Walgren, C.J., Ruble, C.A. and Donthu, N., (1995). Brand equity, brand preference, and purchase intent. Journal of advertising, 24(3), pp.25-40.
Cretu, A.E. and Brodie, R.J., (2007). The influence of brand image and company reputation where manufacturers market to small firms: A customer value perspective. Industrial marketing management, 36(2), pp.230-240.
Cutler, T. J., & Nye, D. A. (2000). Anything but’empowerment’? Smokers, tar and nicotine data and cigarette design. Health, Risk & Society, 2(1), 69-81.
Dodds, W.B., Monroe, K.B. and Grewal, D., (1991). Effects of price, brand, and store information on buyers’ product evaluations. Journal of marketing research, 28(3), pp.307-319.
Farris, P., Olver, J. and De Kluyver, C., (1989). The relationship between distribution and market share. Marketing Science, 8(2), pp.107-128.
Gordon, G.L., Calantone, R.J., Di Benedetto, C.A., (1993). Brand equity in the business-to-business sector: An exploratory study. Journal of Product & Brand Management, 2(3), pp.4-16.
Journal of Economics, Business, and Accountancy Ventura Vol. 22, No. 1, April - July 2019, pages 123 - 136
135
Guajardo, J.A., Cohen, M.A. and Netessine, S., (2015). Service competition and product quality in the US automobile industry. Management Science, 62(7), pp.1860-1877.
Heding, T., Knudtzen, C.F. and Bjerre, M., 2015. Brand management: Research, theory and practice. Routledge.
Hutton, J.G., (1997). A study of brand equity in an organizational-buying context. Journal of Product & Brand Management, 6(6), pp.428-439.
Jensen, M.B. and Klastrup, K., (2008). Towards a B2B customer-based brand equity model. Journal of Targeting, Measurement and analysis for Marketing, 16(2), pp.122-128.
Kamakura, W.A. and Russell, G.J., 1993. Measuring brand value with scanner data. International journal of Research in Marketing, 10(1), pp.9-22.
Keller, K.L. and Lehmann, D.R., (2003). How do brands create value?. Marketing management, 12(3), pp.26-26.
Keller, K.L., Parameswaran, M.G. and Jacob, I., (2011). Strategic brand management: Building, measuring, and managing brand equity. Pearson Education India.
Kim, J.H. and Hyun, Y.J., (2011). A model to investigate the influence of marketing-mix efforts and corporate image on brand equity in the IT software sector. Industrial marketing management, 40(3), pp.424-438.
Kotler, P. and Armstrong, G., 2012. Principles of marketing 14th edition. New Jearsey: Pearson Education Inc.
Krejcie, R.V. and Morgan, D.W., (1970). Determining sample size for research activities. Educational and psychological measurement, 30(3), pp.607-610.
Krishnan, H.S., (1996). Characteristics of memory associations: A consumer-based brand equity perspective. International Journal of research in Marketing, 13(4), pp.389-405.
Kuhn, K.A.L., Alpert, F. and Pope, N.K.L., (2008). An application of Keller’s brand equity model in a B2B context. Qualitative Market Research: An International Journal, 11(1), pp.40-58.
Lavidge, R.J. and Steiner, G.A., (1961). A model for predictive measurements of advertising effectiveness. Journal of marketing, 25(6), pp.59-62.
Lovelock, C. and Wright, L., (2010). Principles of marketing and services, translated by Abolfazl Taj Zade Namin. Samt publication.
Michell, P., King, J. and Reast, J., (2001). Brand values related to industrial products. Industrial marketing management, 30(5), pp.415-425.
Milgrom, P. and Roberts, J., (1986). Price and advertising signals of product quality. Journal of political economy, 94(4), pp.796-821.
Mudambi, S.M., Doyle, P. and Wong, V., 1997. An exploration of branding in industrial markets. Industrial Marketing Management, 26(5), pp.433-446.
Olken, F. and Rotem, D., (1986). Simple random sampling from relational databases.
Pappu, R., Quester, P.G. and Cooksey, R.W., (2005). Consumer-based brand equity: improving the measurement–empirical evidence. Journal of Product & Brand Management, 14(3), pp.143-154.
Pheng Low, S. and Tan, M.C., (1995). A convergence of Western marketing mix concepts and oriental strategic thinking. Marketing Intelligence & Planning, 13(2), pp.36-46.
Roosta, A., Venus, D. and Ebrahimi, A., (1996). Marketing management. SAMT Publicaion.
Saccani, N., Johansson, P. and Perona, M., (2007). Configuring the after-sales service supply chain: A multiple case study. International Journal of production economics, 110(1-2), pp.52-69.
Schuiling, I. and Moss, G., (2004). How different are branding strategies in the pharmaceutical industry and the fast-moving consumer goods sector?. Journal of Brand Management, 11(5), pp.366-380.
Selvakumar, J.J. and Vikkraman, P., (2011). Impact of advertising and price promotions on brand equity in service sector. Journal of contemporary research in management, 6(3), p.51.
136
Roya B Shamami & Bahram Kheiry, The effect of marketing mix and after sales service
Simon, C.J. and Sullivan, M.W., (1993). The measurement and determinants of brand equity: a financial approach. Marketing science, 12(1), pp.28-52.
Van Riel, A.C., De Mortanges, C.P. and Streukens, S., (2005). Marketing antecedents of industrial brand equity: An empirical investigation in specialty chemicals. Industrial Marketing Management, 34(8), pp.841-847.
Wang, H., Wei, Y. and Yu, C., (2008). Global brand equity model: combining customer-based with product-market outcome approaches. Journal of Product & Brand Management, 17(5), pp.305-316.
West, D. and Prendergast, G.P., (2009). Advertising and promotions budgeting and the role of risk. European Journal of Marketing, 43(11/12), pp.1457-1476.
Woodside, A.G., Sheth, J.N. and Bennett, P.D., (1977). Consumer and industrial buying behavior.
Yoo, B. and Donthu, N., (2001). Developing and validating a multidimensional consumer-based brand equity scale. Journal of business research, 52(1), pp.1-14.
Yoo, B., Donthu, N. and Lee, S., 2000. An examination of selected marketing mix elements and brand equity. Journal of the academy of marketing science, 28(2), pp.195-211.