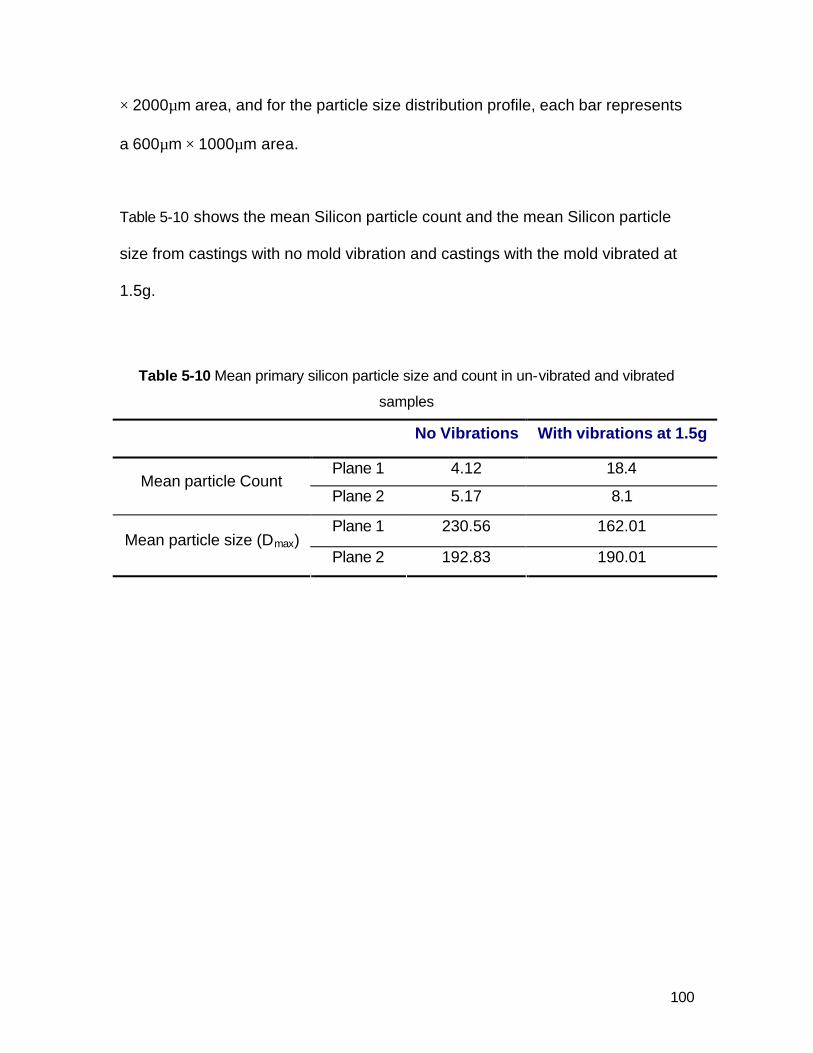
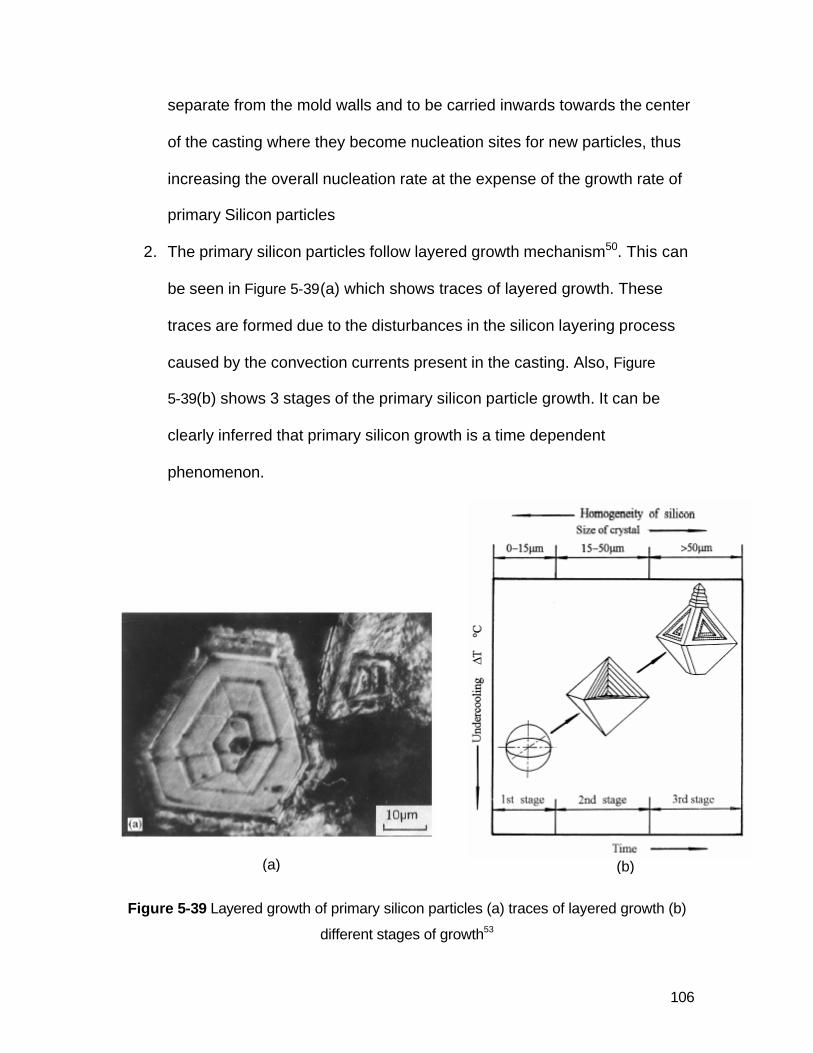
The Effect of Mechanical Mold Vibration On the Characteristics of Aluminum Alloys by Jayesh Deshpande A Thesis Submitted to the Faculty Of Worcester Polytechnic Institute In partial fulfillment of the requirements for the Degree of Master of Science In Manufacturing Engineering September 2006 APPROVED: Makhlouf M. Makhlouf, Professor of Mechanical Engineering, Advisor Richard D. Sisson, Jr., Professor of Mechanical Engineering Director of Manufacturing and Materials Engineering
Transcript
The Effect of Mechanical Mold Vibration On the Characteristics of Aluminum Alloys
by
Jayesh Deshpande
A Thesis Submitted to the Faculty
Of
Worcester Polytechnic Institute
In partial fulfillment of the requirements for the
Degree of Master of Science
In
Manufacturing Engineering
September 2006
APPROVED:
Makhlouf M. Makhlouf, Professor of Mechanical Engineering, Advisor Richard D. Sisson, Jr., Professor of Mechanical Engineering Director of Manufacturing and Materials Engineering
LIST OF FIGURES .................................................................................................................4
LIST OF TABLES ...................................................................................................................7
Definitions and Parameters ..........................................................................................................................23
The Use of Mechanical Vibrations in Casting............................................................................................25
3.2. CASTING CHARACTERISTICS OF AL-S I AND AL-CU ALLOYS ............................................29
Aluminum-Silicon and Aluminum-Copper alloys are important non-ferrous casting
alloys. Different methods have been applied to improve their casting
characteristics, their microstructure and consequently, their mechanical
properties. Application of mechanical vibrations to the mold during solidification
of the alloy is one of these methods. In this study, the effect of controlled
mechanical vibrations on the dendrite coherency point, the hot tearing tendency,
and the microstructure of B206, B390, and binary Al-7%Si alloys was evaluated.
The dendrite coherency point was determined using the two-thermocouple
method. The hot tearing tendency was evaluated using the crack susceptibility
criterion (CSCb) and by means of measurements using a specially designed ring
mold. Microstructure characterization was performed using optical and scanning
electron microscopy coupled with image analysis. It was found that mechanical
vibrations refine the microstructure of the alloys; and, in the case of B390 alloy, it
resulted in significant improvement in the distribution of the primary silicon
particles. In the case of B206 and Al-7%Si alloys, where aluminum is the primary
phase, mechanical vibrations caused the dendrite coherency point to shift
towards lower temperature, i.e., towards higher fraction solid. This shift, together
with the refinement of the grain structure, manifested itself in significant reduction
in the incidence of hot tearing in B206 castings.
10
Acknowledgements
I would like to acknowledge assistant, support and guidance I received from
these great people.
I would like to acknowledge my advisor Dr. M. M. Makhlouf for his guidance,
support and patience during this research. His help has been important not only
to my completion of the degree but also to my development as an engineer. I
have and will always feel deeply indebted for his mentorship.
I express my profound gratitude to Dr. D. Apelian, director, MPI for his
encouragement and guidance. I could not have asked for a better treasure than
to have the privilege to be influenced by these two fine men throughout my
experience at WPI.
I would also like to thank Dr. R. D. Sisson Jr., director of Materials and
Manufacturing engineering program for his mentorship.
I am also indebted to research staff at MPI who generously gave their time and
expertise to assist me during this work. To mention that Dr. Sujoy Chaudhury has
been extremely helpful to me would be an egregious understatement. I don’t
remember a single day without a knock on his office door with a query. I truly
appreciate his patience in explaining me myriad of queries (sometimes really
stupid!), on solidification, aluminum alloys and almost everything related to
metallurgy. Thanks are also extended to Dr. Libo Wang for his help in the casting
part of this work, Mr. Matthew Diehm of Consolidated Metco and Michael
O’Donnell of Washburn Machine Shops for their help in fabrication of the ring
mold.
11
I would like to thank members of ACRC consortium for their guidance and
financial support for this work. I acknowledge Karl Raatikainen for all the help
and co-operation he extended during my thesis work.
I would like to thank Virendra and other fellow students for all the good time we
spent in and out of the Washburn and for the help getting home from some of
those good times.
I would like to thank my father Umesh for introducing me to the beauty of metal
casting, my mother Madhavi for her constant encouragement and support
throughout my life. I wish my mother could have seen this, but such was not to
be. Instead, her memories alone must suffice and I take comfort in the fact that
she is constantly watching me and her blessings will be with me forever.
12
1. Introduction
In 1857, the noted British author Charles Dickens, known for his social
sensibilities wrote, “Within the course of the last two years ... a treasure has
been divined, unearthed and brought to light ... what do you think of a metal as
white as silver, as unalterable as gold, as easily melted as copper, as tough as
iron, which is malleable, ductile, and with the singular quality of being lighter than
glass? Such a metal does exist in considerable quantities on the surface of the
globe.” “The advantages to be derived from a metal endowed with such qualities
are easy to be understood. Its future place as a raw material in all sorts of
industrial applications is undoubted, and we may expect soon to see it, in some
shape or other, in the hands of the civilized world at large.” Dickens’ forecast was
indeed a proven truth as aluminum has found application virtually in every
market.
Being a light metal, aluminum has been instrumental in developing lightweight
fuel-efficient transportation systems. In North America, new automobiles have on
an average more than 300lbs of aluminum. More than 40 automobiles carry more
than 500lbs of aluminum in the form of various structural and transmission
components. Automobiles back in 1973 contained less than a quarter by weight
of the aluminum than what today’s automobiles contain1. As Aluminum’s
cost/benefit ratio continues to improve, no doubt aluminum will continue to play a
pivotal role in the development of safer, cleaner and lighter automobiles.
High performance applications, such as the automobile, call for stronger, more
formable aluminum alloys. In order to achieve better performance from an alloy,
13
manufacturers may alter the alloy composition or the manufacturing process. The
alterations can be done by means of addition of alloying elements, by means of
changes to the component design, or by means of changing the processing
parameters.
In the present work, the effect of mold vibrations on the characteristics of three
aluminum alloys; namely B206, B390, and Al-7wt%Si is evaluated. B206 is an Al-
Cu alloy characterized by its high strength. It is typically used in high strength
structural components. B390 alloy is a hypereutectic Al-Si alloy characterized by
high wear resistance. It is typically used in high wear resistance applications
such as in ring gears, engine blocks, pistons etc. Al-7wt%Si is a hypoeutectic
binary alloy. Composition wise, it is related to A356. A356 has many automotive
applications including cylinder heads and intake manifolds2.
Experimentation with mold vibration in order to alter the as-cast microstructure of
cast components date back to 1868. In one of the earlier investigations, Chernov
found that application of mechanical vibration during solidification of steel caused
refinement of austenite 3. More recent investigations by Abu-Dheir et al 4 shows
an effect of mechanical vibrations on the morphology of silicon in Al-Si alloys,
which manifests itself in significant enhancement of mechanical properties. Also
recent work by Dommaschk 5 showed that a refined grain structure of Al-Si alloys
could be obtained by mold vibration.
In addition to the Introduction (Chapter 1), this thesis contains 5 chapters, which
are:
Chapter 2: Objective, which clearly lists the objectives of the work.
14
Chapter 3: Background, which presents a review of the open literature on the
application of mold vibrations to solidifying melts and the effects of vibrations on
the casting characteristics of aluminum alloys.
Chapter 4: Design of Experiments and Procedures, which details the design
of experiments, and the materials and procedures used in the various
experiments.
Chapter 5: Results and Discussion, which presents and discusses the results
obtained, and correlates them with the understanding available from the
literature.
Chapter 6: Conclusions, which summaries the findings and recommends
further work.
15
2. Objective
The objective of this thesis is to investigate the effect of mechanical mold
vibration on the following:
1. The casting characteristics of casting alloys, including:
1.1. The tendency of the alloy to hot tear during solidification as evaluated
from
1.1.1. The Crack Susceptibility Criterion (CSCb)
1.1.2. Hot tear observations using a ring mold
1.2. The dendrite coherency temperature
2. The as-cast microstructure of the alloy, including:
2.1. The morphology of silicon particles including eutectic Si particles, as well
as primary Si particles (in the case of hypereutectic alloys)
2.2. The as-cast grain size
16
3. Background
In this section, a review of vibration melt treatment and characteristics of
aluminum alloys is presented. Section 3.1 discusses the fundamentals of
vibrations, the parameters associated with vibrations, and the methods available
for application of vibrations to metallic melts. Section 3.2 reviews previous work
on the application of vibrations to melts Section 3.3 is devoted to discussing the
relevant casting characteristics of Al alloys particularly, Al-7wt%Si, B390 and
B206 alloys.
3.1. Vibrations
In general, vibration is the motion of the particles of an elastic body or medium in
alternate ly opposite directions from the position of equilibrium, periodically in
time. Pillai et. al. have published an extensive survey of the different methods of
vibrations used on solidifying metals and their effect on the final structure6. Table
3.1 presents a summary of their survey.
17
Table 3-1 Literature survey on the use of vibrations on solidifying metals6.
Aluminum Alloy Source of Vibration Effect of vibrations Al Ultrasonic Degassing Pure Al Rectilinear vibrations by
transforming rotary motion of a DC motor, 100 cycles/min (2Hz)
Grain refinement Reduction in pipe formation Reduced solidification time
Eutectic Al-Si alloy Low frequency vibration Coarsening of Mg and Na modified alloy Refinement of Sr modified eutectic Si
Al-Si alloys, AK9(hypo) and AK11 (eutectic)
Electromagnetic stirring (EM) during continuous casting
Lower porosity by the factor of 3 Higher UTS and % elongation Modified eutectic only inh EM mold without modifier addition
Al–20Si
Low frequency melt agitation Significant reduction in gas content
Hypoeutectic Al7Si hypereutectic Al20Si
Electromagnetic stirring Reduction in Si segregation in hypereutectic alloy Promotion of dendrite fragmentation in hypoeutectic alloy Reduced axial porosity and hence sound core of the ingot
Al–Ti, Al alloy , Al–Si alloy, Al–Cu alloy
Vigorous agitation of mould Vibration to the dies
Formation of fine grains Grain refinement Improved surface finish Reproduction of thin sections Dispersion of porosity and oxides Coarsening of secondary precipitating phases Segregation due to constitutional under cooling not prevented
Light alloy (500 kg of Al)
Ultrasonic vibration Improves degasification Reduced degassing time of a few minutes with scavenging cum vibration against 30 min with scavenging alone Suppression of pipe Reduction in hot tearing tendency Reduction in porosity and shrinkage concentration in a spot
18
Reduction in gravity segregation of FeAl3
Al–8.5Si–1.75Cu–0.35Mg– 0.4Mn–0.55Fe
Ultrasonic at 990K Increased hardness with decreased fluctuations in different parts of die cast parts Formation of homogeneous fine structures of _ and _+Si phases Enhancement in density 0.001–0.01 g/cm3
Al alloys Magnetic field/passing AC through the melt
Grain refinement
Continuous cast Al–Zn–Mg–Cu ingot
Ultrasonic Grain refinement Decreased hydrogen especially with low Fe content alloys
AK9 Al casting
Ultrasonic 20 KHz Ti alloy emitter immersed inside the melt at 1013K
Maximum enhancement in mechanical properties after 10 min of treatment UTS increases from 164 to 181Mpa % Elongation increases from 2.8 to 3.1 Reduction in H2 content and size of oxide inclusions by a factor ~1.5 and ~3
Al–5Mg
Electromagnetic field Reduced diffusion layer thickness in front of the solidification front Increased concentration of alloying elements in solid solution Decreased volume of non equilibrium eutectics Refinement of dendritic microstructure and fine distribution of non equilibrium eutectic phases
Al–6/11/15 Cu Mechanical vibration Refinement and uniform distribution of primary Al Primary grains contact/connect each other forming a complicated inter twist morphology Improvement in tensile strength with increasing amplitude of Vibration
19
Al alloy
Combined effect of internal variable magnetic field and passing of AC through the molten metal
Refinement of structure Dispersion of inclusions Elimination of modifier addition
Al alloy with Zr addition
Ultrasonic treatment during continuous casting
Formation of sub dendritic grains (≈0.1 mm) against coarser grains (0.8–1.5 mm) without treatment leading to enhanced plasticity
Al–5Mg Al.4.5% Cu
Electromagnetic generator at 30 and 150 Hz, 0.05–5.52mm amplitude, 1–120 g peak acceleration
Extensive grain refinement especially with high accelerations
,Al–4.5Cu
Rectilinear vibration by transforming rotary motion of a DC motor, 100 cycles/min (2 Hz)
Elimination of most of the shrinkage Grain refinement occurs but similar to pure Al, rapid initially and slower later Reduced solidification time Si and Fe phases become less acicular
Al12.3Si
Varying frequencies of 15–41.7 Hz and amplitude of 0.125 –0.5mm With increasing vibration time
Increasing frequency and amplitude resulted in grain refinement and reduced pipe Coarsening of eutectic silicon in unmodified and sodium modified Coarsening of primary silicon
Forced vibrations can be applied to a melt via a variety of methods including
ultrasonic, electromagnetic, and mechanical methods.
Ultrasonic Vibrations
A number of researchers haves used ultrasonic vibrations for melt treatment.
20
Eskin summarized the effect of ultrasonic treatment on light alloys 7,8. Works of
various researchers demonstrate that ultrasonic vibrations can be used for
cavitation, melt degassing, fine filtration of melts (the USFIRALS process), non-
dendritic solidification, improved semi-solid deformation, spatial solidification and
for the production of aluminum alloys with low-solubility components7.
Xu et al9 found that ultrasonic treatment is an effective method for degassing
aluminum melts. Also Jian, et al found that ultrasonic vibrations could be used to
refine eutectic silicon in hypoeutectic Al-Si alloys 10. Figure 3-1 shows the effect of
ultrasonic vibrations on the morphology of eutectic Si. Figure 3 -2 shows the
effect of ultrasonic vibrations on the grain structure of A356 alloy.
(a) (b)
Figure 3-1 Eutectic Si Morphology (a) without ultrasonic vibration and (b) with ultrasonic
vibration10.
21
(a) (b)
Figure 3-2 Effect of ultrasonic vibrations on microstructure of A356 alloy, without (a) and
with (b) ultrasonic vibrations11.
Although ultrasonic vibrations have shown favorable effects on the solidification
characteristics of aluminum alloys, its commercial applications are constrained
mainly because of the difficulties encountered in the use of ultrasonic instruments
on the foundry floor11.
Electro-magnetic vibrations
As the name suggests, electro-magnetic vibrations typically involve two different
force fields, a stationary magnetic field and an alternating electric field. If a
stationary magnetic field with a magnetic flux density B and an alternating
electrical field with a frequency f and current density J is applied to a melt, a
vibrating electromagnetic body force with a density F = J X B is induced inside
the melt. This force sets the particles inside the melt into vibration motion with a
frequency equal to the frequency of the alternating electrical field, vibrating
perpendicular to the plane of J and B12. Another electro-magnetic force is formed
inside the melt due to the applied magnetic force and the induced force, This
22
force is partly rotational and stirs the melt12. Figure 3-3 illustrates the relationship
between these forces.
Figure 3-3 Direction of vibrating force F developed by the interaction of the alternating
electric field J and the stationary magnetic field B12.
Zong13 reported that low frequency electromagnetic vibrations could be used to
grain refine, to eliminate micro segregation, and to avoid cracks and improve the
as-cast surface quality of alloys. Yoon et al 14 found that electromagnetic
vibrations reduce the grain size of primary silicon. They attributed this
phenomenon to the collision of primary Si particles with one another. Mizuki et
al15 imposed electro-magnetic vibrations on an Al-7wt%Si alloy and found that
with increasing the intensity of the vibrations, the primary a-Al dendrites
approached a globular shape of about 25 µm in size. Mizuki et al also found that
in Al-17wt%Si, the primary Si particles were refined to 5 µm at a frequency
nearing 1 kHz. The level of refinement increased with the frequency of
vibration16. They attributed this phenomenon to collapsed dendrite arms due to
micro-explosions and stirring in the melt. Various researchers17,18,19 reported
23
refined and uniform grain structure, refined primary and eutectic Si, and improved
surface quality of castings due to electromagnetic vibrations.
Mechanical Vibrations
In this method, the entire mold is set into vibration by means of a vibration
source. Although the use of mechanical vibrations allows limited degrees of
freedom to the operator, it is the most promising method of applying vibrations to
solidifying melts due to its simplicity and the ruggedness of the equipment
needed for inducing vibrations.
Definitions and Parameters
Vibration - A periodic motion of the particles of an elastic body or medium in
alternately opposite directions from the position of equilibrium when that
equilibrium has been disturbed.
Amplitude - The severity of the vibration. Amplitude can be represented in
several forms:
– Peak-to-peak
– Zero-to-zero
– Average Value
– Root Mean Square Value
For the purposes of this work, all values of amplitude are represented in the form
of Root Mean Square Value (RMS).
Frequency - The number of cycles that a system will perform in a unit time. It is
usually measured in Hertz (Hz).
24
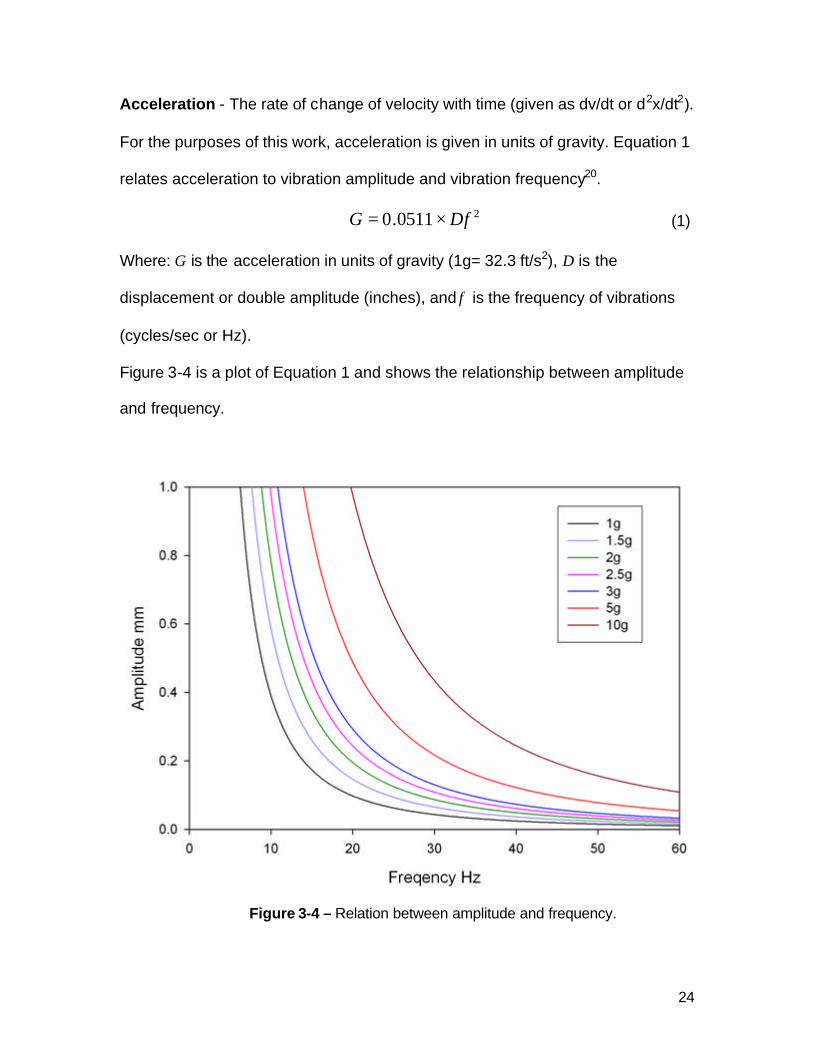
Acceleration - The rate of change of velocity with time (given as dv/dt or d2x/dt2).
For the purposes of this work, acceleration is given in units of gravity. Equation 1
relates acceleration to vibration amplitude and vibration frequency20.
20511.0 DfG ×= (1)
Where: G is the acceleration in units of gravity (1g= 32.3 ft/s2), D is the
displacement or double amplitude (inches), and f is the frequency of vibrations
(cycles/sec or Hz).
Figure 3-4 is a plot of Equation 1 and shows the relationship between amplitude
and frequency.
Figure 3-4 – Relation between amplitude and frequency.
25
The Use of Mechanical Vibrations in Casting
Sokoloff4 was probably the first to report on the use of mechanical vibrations for
grain refinement. Campbell21 reported that mechanical vibration causes
improvement in mechanical and corrosion properties of alloys. Mechanical
vibrations have also been linked to the reduction or complete removal of the
tendency for pipe formation in ingots of pure metals 22. Figure 3.6 shows
fragmentation of the dendrites5 caused by mechanical vibrations during
solidification of NH4Cl-H2O.
Figure 3-5 Dendrite fragmentation while solidification of NH4Cl-H2O under vibrations [5].
Dommaschk et al studied the effect of vibrations on pure Aluminum,
Al7wt%SiMg, and Al12%wtSi alloys along with other non-ferrous alloys. Their
research focused on the effect of mechanical vibrations on grain refinement and
mechanical properties. They observed that the cooling rate and the degree of
grain refinement increase with the intensity of vibrations, and the grain size
becomes more homogenous. The effect of mechanical vibrations on the
solidification behavior of pure Aluminum is shown in Figure 3-6.
No vibrations With vibrations
26
Dommaschk et al also reported that the dependence of the castings’ wall
thickness on casting characteristics could be minimized with the use of
mechanical vibrations 23, 5.
Figure 3-6 Effect of mechanical vibrations on the cooling curve of pure aluminum23.
Pillai et al used very low frequency vibrations (100 and 200 cycles per minute) to
study its effect on A356 and Al12Si alloy. They concluded that mechanical
vibrations improve the density, hardness, UTS, and elongation of the cast
components. They attributed these improvements to the enhanced coagulation of
hydrogen bubbles and their escape from the melt brought about by vibrating the
mold. Thus porosity was reduced and wetting of the mold walls by the melt was
enhanced, this in turn promoted faster heat transfer and fragmentation of the
27
solids formed on the mold wall [6]. However the method that Pillai et al used for
generating the low frequency vibrations (hand tapping and mold tilting) is highly
impractical in a produc tion foundry environment. Kokatepe et al applied
vibrations of 15 to 41.7 Hz frequency and 0.125 to 0.5 mm amplitude to Al12.3Si
alloy ingots poured in a graphite mold3. They found that at 41.7 Hz, the
solidification time of the casting was reduced by 24%, pipe volume was reduced
by 55%, and grain size was reduced by 52% as compared to the un-vibrated
casting. See Figure 3 -7.
(a) (b)
(c)
Figure 3-7 Effect of mechanical vibrations on (a) pipe volume, (b) pipe depth, and (c)
grain size of Al12.3Si ingot casting3.
28
But Kokatepe et al also reported that the vibrations caused coarsening of the
eutectic silicon due to an increase in diffusivity of silicon in the liquid caused by
the vibrations. Kokatepe et al attributed the observed grain refinement to mainly
the fragmentation of dendrites and the growing crystallites during the early
stages of solidification.
Abu Dheir et al used an electromagnetic shaker to induce mechanical vibrations
in a permanent mold 24, 4. They vibrated the mold at frequencies ranging from
100Hz to 2 kHz and amplitudes ranging from 3.73µm to 199µm, and recorded
the thermal history at different points in the mold. Their observation with AA356
alloy reveals that vibration homogenizes the temperature distribution in the mold
and promotes a faster cooling rate. This manifested itself in a more uniform
dendrite structure and less porosity in the castings. Abu Dheir et al observed
fragmentation of the dendritic structure in Al12.5Si. They found that the degree of
fragmentation increased with the amplitude of vibration. They also reported that
the eutectic structure transformed from the typical flaky structure to a more
fibrous structure with increasing amplitude up to 149µm (See Figure 3-8).
Beyond 149µm, the fibrous eutectic silicon agglomerated to form a structure of
coarse flakes. Abu Dheir et al also reported that certain mechanical properties
were affected by the vibrations including a 19 to 68 in percent increase in
elongation and a slight increase (3%) in UTS.
29
(a)
(b)
Figure 3-8 Morphology of Eutectic Silicon (a) without vibrations (b) with vibrations at a
frequency 100Hz and amplitude 149µm 4.
3.2. Casting Characteristics of Al-Si and Al-Cu Alloys
Al-Si and Al-Cu alloys constitute a large portion of the commercial foundry
aluminum alloys. This Chapter is a review of the casting characteristics of these
alloys.
30
Aluminum-Silicon Alloys
Aluminum-Silicon alloys are by far the most important commercial casting alloys
mainly due to their superior casting characteristics as compared with other alloys.
Al-Si alloys have excellent castability, machinability, and corrosion resistance. As
shown in Figure 3 -9 aluminum casting alloys can be classified based on their
Silicon content into three groups: hypoeutectic alloys, in which the Silicon content
is between 5 and 10%; eutectic alloys; in which the Silicon content is between 11
and 13%; and hypereutectic alloys; in which the Silicon content is between 14
and 20%25. Al-Si alloys can be cast using various processes including high
pressure die casting, permanent mold casting, sand casting, lost foam casting,
etc. Aluminum and silicon form a simple eutectic system with limited solid
solutions.
Figure 3-9 The Aluminum rich portion of the Al-Si phase diagram.
31
The eutectic temperature and composition are respectively 577oC and 12.6wt%
Silicon. At the eutectic temperature, the aluminum and silicon solid solutions
contain 1.65%wt Silicon and 0.17wt% Aluminum26.
Hypoeutectic Alloys
Hypoeutectic Al-Si alloys are characterized by good castability, corrosion
resistance and pressure tightness. Binary Al-Si alloys show some response to
heat treatment. The aluminum phase can be moderately supersaturated with
silicon by rapid cooling. Much greater strengthening can be done by the addition
of Copper, Magnesium or Nickel. Addition of Copper imparts high strength and
improved machinabiity but reduced ductility and corrosion resistance27.
Binary Al-7%wt Si Alloy
Binary hypoeutectic Aluminum-Silicon alloys have good castability and corrosion
resistance 2. If the Iron content is kept at a minimum, they also show good
ductility.
Microstructure of Al-7wt%Si Alloy
The microstructure of binary Al-7wt%Si alloy consists of a-Aluminum dendrites
and eutectic Silicon particles. Due to limited solid solubility, silicon prominently
occurs as elemental particles in the eutectic. The microstructure greatly depends
on the solidification rate and the presence of modifying elements such as
Titanium and Stontium. A low solidification rate produces large flakes of silicon,
large dendritic cells and large dendrite arm spacing, while a high solidification
rate produces small dendritic cells, and small dendrite arm spacing, and the
32
eutectic Silicon assumes a fibrous morphology. Figure 3-10 and Figure 3 -11
show representative microstructures of unmodified and modified Al-7%wtSi alloy.
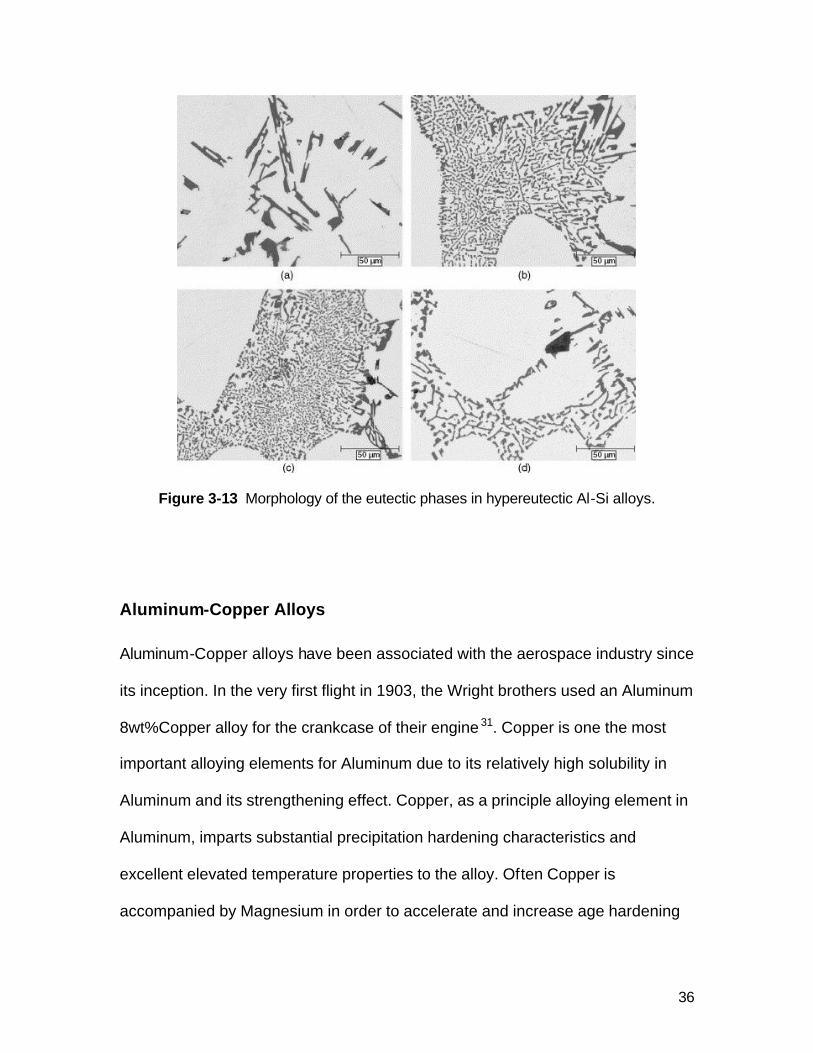
Figure 3-13 Morphology of the eutectic phases in hypereutectic Al-Si alloys.
Aluminum-Copper Alloys
Aluminum-Copper alloys have been associated with the aerospace industry since
its inception. In the very first flight in 1903, the Wright brothers used an Aluminum
8wt%Copper alloy for the crankcase of their engine 31. Copper is one the most
important alloying elements for Aluminum due to its relatively high solubility in
Aluminum and its strengthening effect. Copper, as a principle alloying element in
Aluminum, imparts substantial precipitation hardening characteristics and
excellent elevated temperature properties to the alloy. Often Copper is
accompanied by Magnesium in order to accelerate and increase age hardening
37
at room temperature 26. Often Manganese is added to Al-Cu alloys to mitigate the
detrimental effects of impurities such as Iron and Silicon 25.
The eutectic temperature in the Al-Cu system is 548°C and the eutectic
composition is 33.2wt% Cu26. The eutectic phases that separate from the liquid in
the solidification reaction are ?-CuAl2, which is an intermetallic phase containing
53.5wt% Cu, and the aluminum solid solution, which contains 5.65wt% Cu.
Figure 3-14 shows the Aluminum rich portion of the Al-Cu phase diagram.
33.2%
548oC
5.7%
Figure 3-5 Aluminum rich portion of the Al-Cu phase diagram32.
Alloy B206
Alloy B206 is an important Aluminum-Copper alloy with Copper content between
4.5% and 5.5%. Table 3-4 gives the nominal composition of B206 alloy.
38
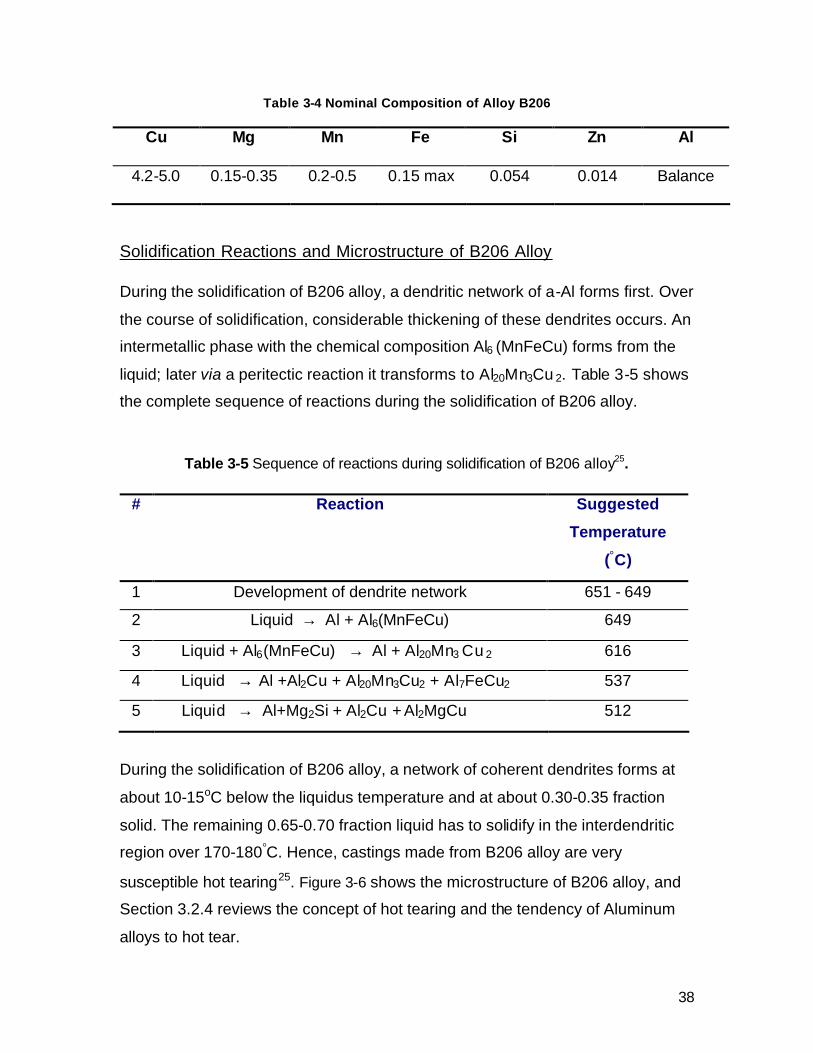
Table 3-4 Nominal Composition of Alloy B206
Cu Mg Mn Fe Si Zn Al
4.2-5.0 0.15-0.35 0.2-0.5 0.15 max 0.054 0.014 Balance
Solidification Reactions and Microstructure of B206 Alloy
During the solidification of B206 alloy, a dendritic network of a-Al forms first. Over
the course of solidification, considerable thickening of these dendrites occurs. An
intermetallic phase with the chemical composition Al6 (MnFeCu) forms from the
liquid; later via a peritectic reaction it transforms to Al20Mn3Cu 2. Table 3-5 shows
the complete sequence of reactions during the solidification of B206 alloy.
Table 3-5 Sequence of reactions during solidification of B206 alloy25.
During the solidification of B206 alloy, a network of coherent dendrites forms at
about 10-15oC below the liquidus temperature and at about 0.30-0.35 fraction
solid. The remaining 0.65-0.70 fraction liquid has to solidify in the interdendritic
region over 170-180°C. Hence, castings made from B206 alloy are very
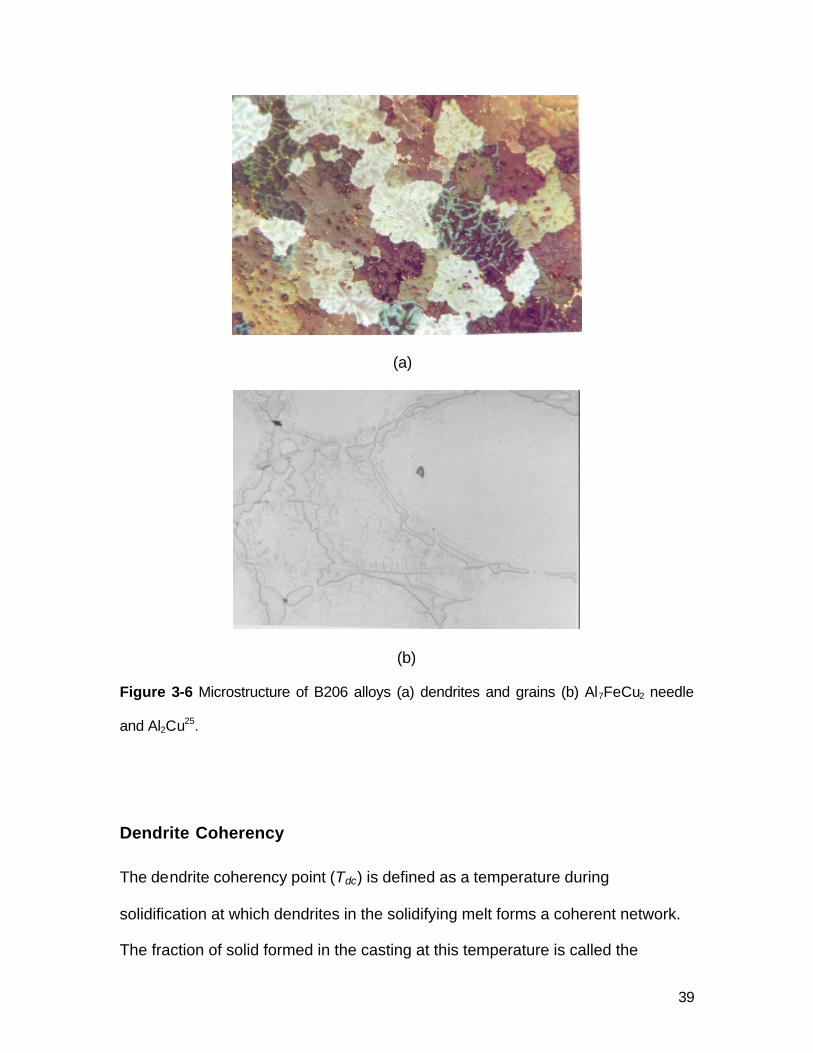
susceptible hot tearing25. Figure 3-6 shows the microstructure of B206 alloy, and
Section 3.2.4 reviews the concept of hot tearing and the tendency of Aluminum
alloys to hot tear.
# Reaction Suggested
Temperature
(°C)
1 Development of dendrite network 651 - 649
2 Liquid → Al + Al6(MnFeCu) 649
3 Liquid + Al6(MnFeCu) → Al + Al20Mn3 Cu 2 616
4 Liquid → Al +Al2Cu + Al20Mn3Cu2 + Al7FeCu2 537
5 Liquid → Al+Mg2Si + Al2Cu + Al2MgCu 512
39
(a)
(b)
Figure 3-6 Microstructure of B206 alloys (a) dendrites and grains (b) Al7FeCu2 needle
and Al2Cu25.
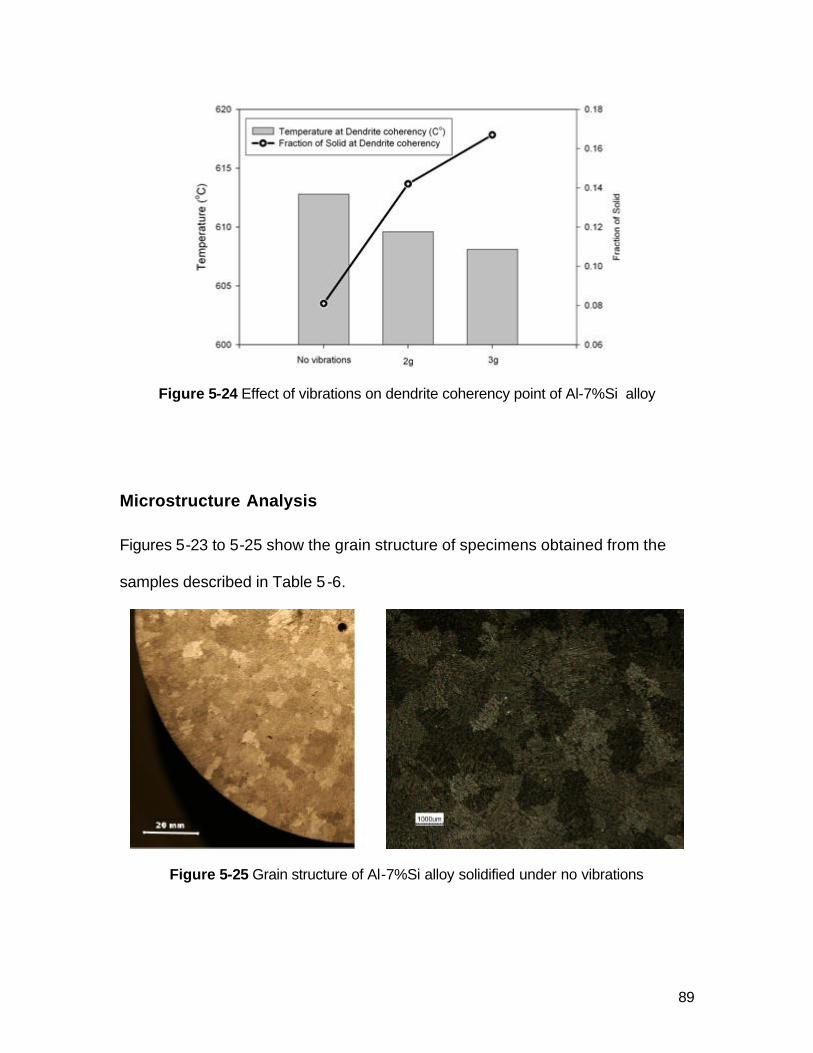
Dendrite Coherency
The dendrite coherency point (Tdc) is defined as a temperature during
solidification at which dendrites in the solidifying melt forms a coherent network.
The fraction of solid formed in the casting at this temperature is called the
40
coherency solid fraction (fsdc). During the initial stages of solidification, the
dendrites are not interconnected and they are free to move as shown in Figure 3-
16(a). Figure 3-16(b) shows interconnected dendrite in white and inter-dendritic
liquid in grey. This feeding mechanism prevails after the dendrite coherency
point. Consequently, in order to compensate for solidification shrinkage, the melt
has to take more treacherous inter-dendritic path and contraction induced
stresses developed in the continuous solid network, can result in casting defects
like hot tearing, shrinkage porosity, gas porosity and macro-segregation33.
Figure 3-7 Feeding Mechanisms (a) Mass Feeding (b) Inter-dendritic feeding34
Spencer35 observed that continuous stirring of melt during solidification results in
coherency at higher solid fractions and resultant microstructure shows smaller
and more round dendrites. Thus, he related shift in coherency point to the
dendrite morphology. Claxton36 concluded that dendrite coherency point is an
important characteristic influencing castability of Aluminum wrought alloys.
41
Determination of the Dendrite Coherency Point
Three methods have been developed for measuring the dendrite coherency point
of alloys. These are (1) the Two Thermocouple method (2) the Direct Shear Cell
method, and (3) the Rheological Determination method. These methods are
reviewed in some detail in the next sections.
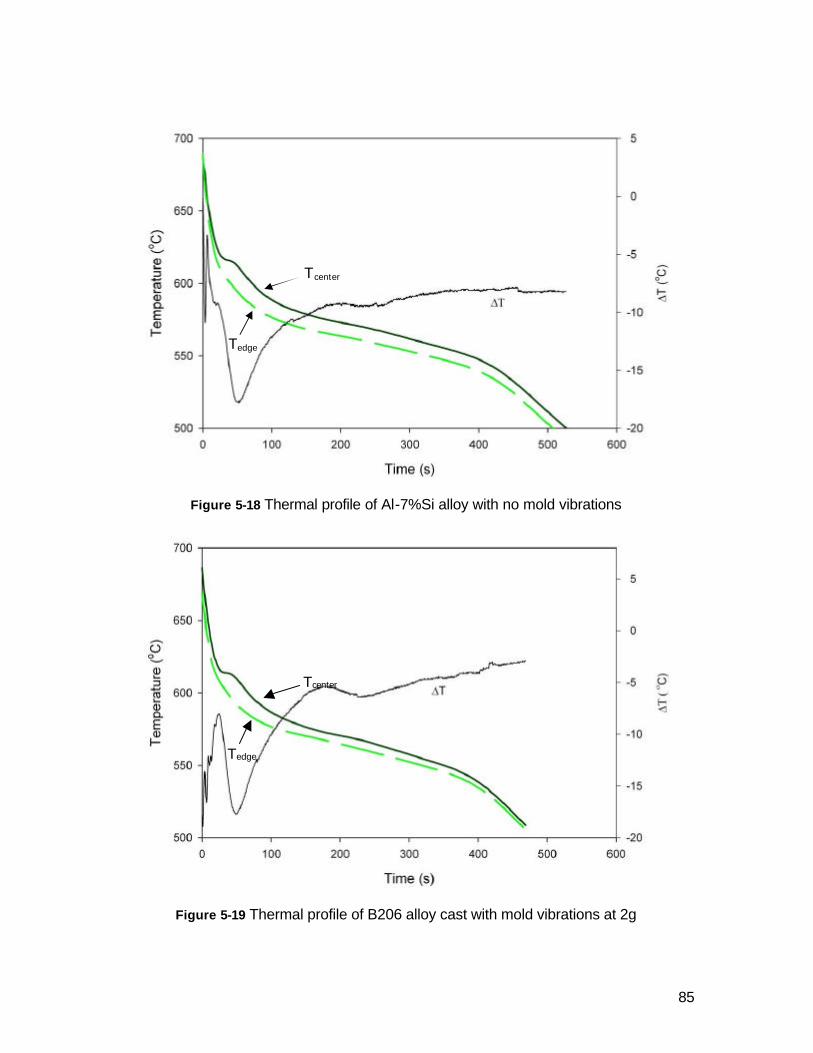
The Two Thermocouple Method
This method was developed by Backerud et al37 and utilizes two thermocouples,
one placed at the center and the other at the wall of a cylindrical mold. As
solidification progresses, new phases first nucleate at the wall of the crucible and
then progress to the center. Consequently, the latent heat of solidification is
released near the crucible’s wall before it is released at the center of the crucible.
The difference in temperature between the two thermocouples is recorded.
Initially, solidification raises the temperature of the thermocouple placed at the
crucible’s wall while the region surrounding the thermocouple at the center of the
crucible is still in the liquid phase. At this point, the temperature difference curve
rises. The heat wave gradually travels towards from the crucible’s wall towards
the crucible’s center, and the temperature difference curve drops until a minimum
value is reached. At this point, nucleation of the primary phase is complete. After
this point the temperature difference curve rises again. The point at which the
curve drops to its minimum value is the dendrite coherency point. After the
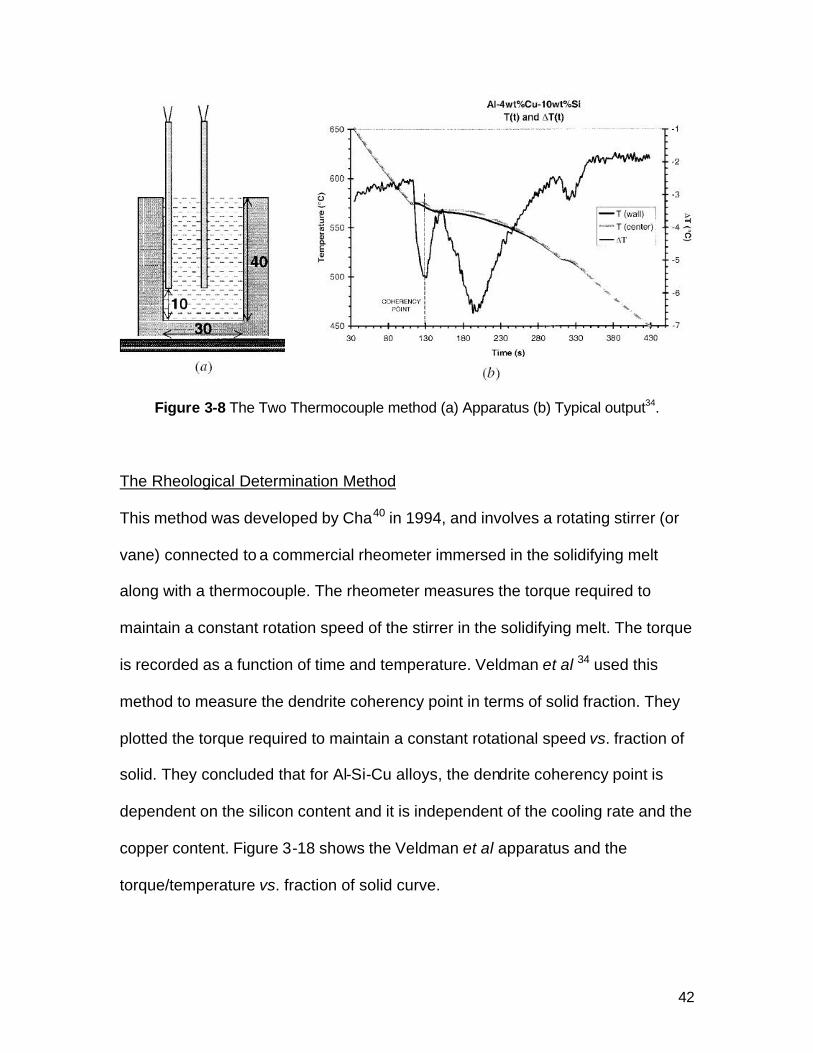
dendrite coherency point, thickening of the dendrite occurs laterally. Figure 3-8
shows a typical setup and the output data of the Two Thermocouple method.
42
Figure 3-8 The Two Thermocouple method (a) Apparatus (b) Typical output34.
The Rheological Determination Method
This method was developed by Cha40 in 1994, and involves a rotating stirrer (or
vane) connected to a commercial rheometer immersed in the solidifying melt
along with a thermocouple. The rheometer measures the torque required to
maintain a constant rotation speed of the stirrer in the solidifying melt. The torque
is recorded as a function of time and temperature. Veldman et al 34 used this
method to measure the dendrite coherency point in terms of solid fraction. They
plotted the torque required to maintain a constant rotational speed vs. fraction of
solid. They concluded that for Al-Si-Cu alloys, the dendrite coherency point is
dependent on the silicon content and it is independent of the cooling rate and the
copper content. Figure 3-18 shows the Veldman et al apparatus and the
torque/temperature vs. fraction of solid curve.
43
Figure 3-9 (a) Experimental setup and (b) typical output data of the rheological
determination method34.
The Direct Shear Cell Method
This method was developed by Nabulsi36 and utilizes a shear cell to measure the
shear response of the semi-solid material as shown in Figure 3-19(a). The pulling
arm is connected to a universal tensile testing machine by means of an
arrangement of pulleys. The melt is maintained in an isothermal condition
throughout the experiment, and several experiments each at a different
temperature are performed in order to obtain the shear cell response vs.
temperature curve shown in Figure 3-19(b).
44
(a)
(b)
Figure 3-10 (a) Schematic of the direct shear cell (b) Typical output data38.
Hot Tearing Tendency of Aluminum Casting Alloys
Hot tearing is a casting defect that is formed when the tensile stress developed in
the solidifying casting exceeds the mechanical strength of the casting. It is also
referred to as hot shortness or hot cracking. It can be observed as an irreversible
tear in the solidified casting.
45
In general, hot tears can form in certain alloy systems during the terminal stages
of solidification when a liquid film is distributed along the grain boundaries and
the interdendritic regions. At this stage, shrinkage strains across the partially
solidified boundaries can become appreciable. If the terminal liquid is distributed
along the boundaries as a continuous film, the strains cannot be accommodated
and the boundaries separate to form a crack. In this sense, hot tearing may be
regarded as a special case of liquid metal embrittlement where significant loss of
ductility occurs when an alloy is heated above its solidus temperature and liquid
forms. Consequently, the temperature range over which the alloy solidifies, and
the characteristics (particularly surface tension) of the liquid that exists at the
terminal stages of solidification are primary factors that control the susceptibility
of the alloy to hot tearing. Surface tension forces play an important role in liquid
metal embrittlement. If γSL is the interfacial free energy between solid and liquid,
and if γSS is the interfacial free energy between two solid grains, then the dihedral
angle (θ) of the liquid film in the grain boundary depends on the ratio LSSS γγ
(See Figure 3-20). When LSSS γγ ≥ 2, then θ = 0, and the liquid completely wets
the solid grains.
2θ
γSL
γSL
γSS = 2 γSLcosθ γSS
boundary
Grain
Liquid metal
Figure 3-11 Equilibrium distribution of liquid at grain boundaries.
46
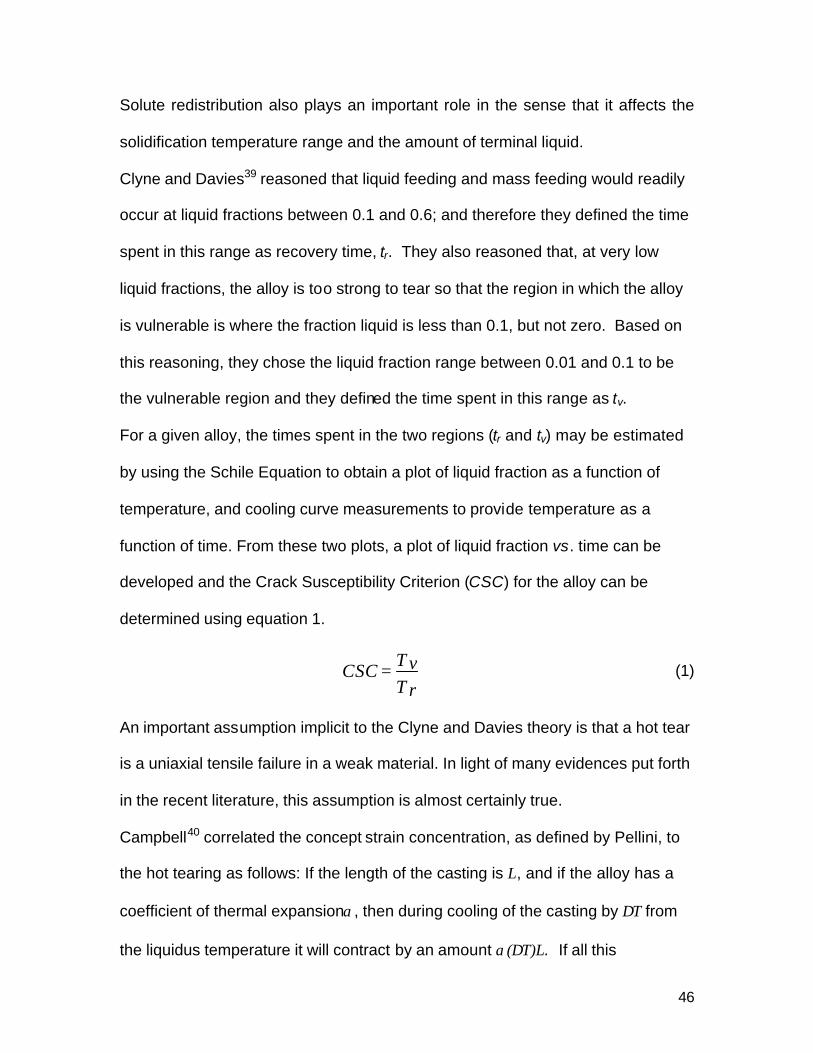
Solute redistribution also plays an important role in the sense that it affects the
solidification temperature range and the amount of terminal liquid.
Clyne and Davies39 reasoned that liquid feeding and mass feeding would readily
occur at liquid fractions between 0.1 and 0.6; and therefore they defined the time
spent in this range as recovery time, tr. They also reasoned that, at very low
liquid fractions, the alloy is too strong to tear so that the region in which the alloy
is vulnerable is where the fraction liquid is less than 0.1, but not zero. Based on
this reasoning, they chose the liquid fraction range between 0.01 and 0.1 to be
the vulnerable region and they defined the time spent in this range as tv.
For a given alloy, the times spent in the two regions (tr and tv) may be estimated
by using the Schile Equation to obtain a plot of liquid fraction as a function of
temperature, and cooling curve measurements to provide temperature as a
function of time. From these two plots, a plot of liquid fraction vs. time can be
developed and the Crack Susceptibility Criterion (CSC) for the alloy can be
determined using equation 1.
T r
T vCSC = (1)
An important assumption implicit to the Clyne and Davies theory is that a hot tear
is a uniaxial tensile failure in a weak material. In light of many evidences put forth
in the recent literature, this assumption is almost certainly true.
Campbell40 correlated the concept strain concentration, as defined by Pellini, to
the hot tearing as follows: If the length of the casting is L, and if the alloy has a
coefficient of thermal expansionα, then during cooling of the casting by ∆T from
the liquidus temperature it will contract by an amount α(∆T)L. If all this
47
contraction occurs in a hot spot of length l, then the strain in the hot spot is given
by
lTL∆= αε (2)
If the grain size is a, then the number of grains in the hot spot is l/a; and if we
divide the strain, ε, by the number of grain boundaries in the hot spot, then we
have the strain per grain boundary that is acting to open the hot tear
2
)(l
LaT∆= αε (3)
If all the castings are made in the same mold, then L and l will not change from
casting to casting, and we can also assume that α does not change significantly
from alloy to alloy, so Equation (3) may be re-written as
aT )(∆∝ε (4)
Combining Equation (4) with Equation (1) gives a modified Crack Susceptibility
Criterion, CSCb that can account for the effect of grain size on the susceptibility to
hot tearing
( )aTtt
CSCr
vb ∆∝
(5)
Many theories have been put forth over the years attempting to predict
susceptibility to hot tearing as a function of alloy composition. The theory
presented here is one of the few serious contenders. However, the ability to deal
with all of the aspects of solidification across an alloy system is a difficult
preposition for any one theory. Consequently, the theory is most useful for binary
48
alloys. Nevertheless, it is useful in a comparative study of the potential that
vibrations may have in minimizing the incidence of hot tearing in complex alloys.
Measurement of Hot Tearing Tendencies
Testing of an alloy for its susceptibility to hot tearing is a very important task and
several methods have been suggested over the years to gauge the tendency of
alloys to hot tear. These methods can be broadly classified into the following
categories:
1. Tests using mechanical techniques – these include tensile test at high
temperature41, direct chill casting tensile test42, stress and strain
measurement of ‘C’ shaped castings43, variable tensile strain tests44, tests
using, electrical resistance methods45, and optical emission methods46.
2. Tests using observation of the hot tears47,48 – these include the Flanged Bar
test, the Cylindrical Bar test, the Ball-Bar test, the I-Beam Casting test, the
Cold Finger test, the C-Bar Casting test, the U Casting test, the N-Tec Hot
Tear Mold test, and the Ring Mold test.
Most of these tests use castings that are constrained at one end so that feeding
is restricted while solidification occurs. When the stress exceeds the tensile
strength of the solidifying casting, hot tears form at the hot spot. It is important to
realize that because of the unique geometry of each mold, it is not possible to
compare results from one test to the other. Among all these tests, the Ring Mold
test, shown schematically in Figure 3-22 is the most widely used because of its
simplicity48.
49
Figure 3-12 Typical design of ring mold used for hot tear testing48.
50
4. Design of Experiments, Materials and Procedures
4.1. Design of Experiments
In order to evaluate effects of vibrations on aluminum based alloys, several
experiments were performed. Table 4-1 summarizes design of experiments.
Table 4-1 Design of Experiments
Independent Variables Dependant Variables
Alloy type:
− Al 7%Si
− B390
− B206
Vibration Parameter g:
− ≈ 0
− g1*
− g2*
− g3*
Casting characteristics:
Tendency to hot tear
Dendrite coherency temperature
Crack Susceptibility Criterion (CSCb)
Microstructure:
Size and morphology of grains
Size and morphology of eutectic Si
Distribution of primary Si
*g1,g2 and g3 are the vibration acceleration values in terms of gravity units. It is a combination of vibration amplitude and frequency. 1g=0.0511Df 2.
51
Constants Value
Melt super heat for given alloy N/A*
Hydrogen content of the melt <0.12 ml H/100g alloy
Grain refiner ≈ 0.00
Chemical modifier ≈ 0.00
Vibration time Pouring to complete solidification
* amount of superheat differs with alloy but constant for given alloy
Alloys used for this work were chosen to address specific issues associated with
their castings. Hence, partial factorial analysis of Table 4-1 was done.
Table 4-2 shows experiments’ matrix.
Table 4-2 Experiments’ matrix
Alloy Objective
B206 B390 Al-7%Si
Thermal Analysis v v Grain size v
Hot Tearing
Ring mold v Grain Size v
Primary Silicon v Microstructure
Eutectic Silicon v
52
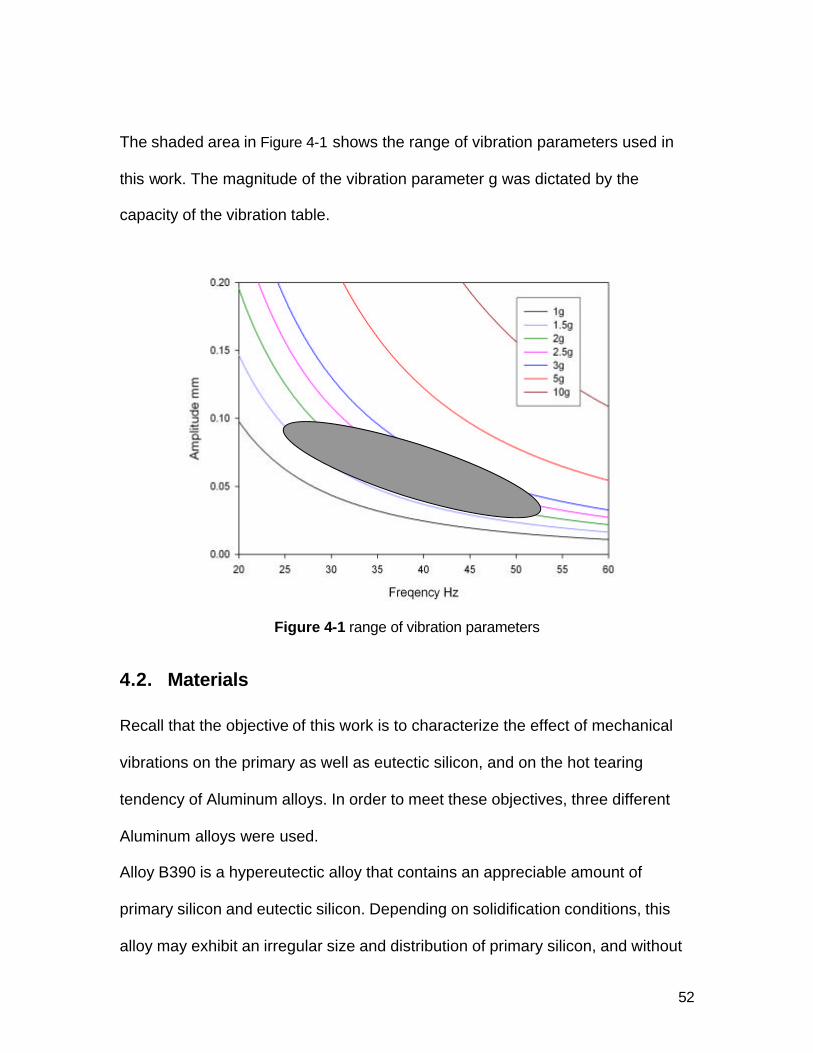
The shaded area in Figure 4-1 shows the range of vibration parameters used in
this work. The magnitude of the vibration parameter g was dictated by the
capacity of the vibration table.
Figure 4-1 range of vibration parameters
4.2. Materials
Recall that the objective of this work is to characterize the effect of mechanical
vibrations on the primary as well as eutectic silicon, and on the hot tearing
tendency of Aluminum alloys. In order to meet these objectives, three different
Aluminum alloys were used.
Alloy B390 is a hypereutectic alloy that contains an appreciable amount of
primary silicon and eutectic silicon. Depending on solidification conditions, this
alloy may exhibit an irregular size and distribution of primary silicon, and without
53
proper chemical modification, coarse primary silicon renders B390 unusable for
many applications. The compositional analysis was done using spark
transmission spectrometerI. Table 4-3 shows composition of the B390 alloy used
for this work.
Table 4-3 Composition of B390 alloy
*elements with wt% less than 0.01 are not shown
Al-7%Si is a binary alloy with appreciable eutectic silicon content. This alloy was
prepared using high purity aluminum (99.99%) and Al-50%Si master alloy. The
high purity aluminum was melted and maintained at 8000 C in an electrical
resistance furnace. Al-50%Si master alloy was added to the melt and stirred
using a graphite rod. After confirming the composition means of spark emission
spectrometry, the alloy was poured in the form of ingots. Table 4-4 shows
composition of the Al-7% alloy used for this work.