THE EFFECT OF MEDICAL MALPRACTICE AWARD AMOUNT ON HEALTH: A CROSS-SECTIONAL REVIEW OF 1998 STATE DATA Except where reference is made to the work of others, the work described in this thesis is my own or was done in collaboration with my advisory committee. This thesis does not include proprietary or classified information. ________________________________________ Jason Margretz Certificate of Approval: _____________________ _____________________ Richard O. Beil John D. Jackson, Chair Associate Professor Professor Economics Economics _____________________ _____________________ T. Randolph Beard George T. Flowers Professor Interim Dean Economics Graduate School
Transcript
THE EFFECT OF MEDICAL MALPRACTICE AWARD AMOUNT ON HEALTH:
A CROSS-SECTIONAL REVIEW OF 1998 STATE DATA
Except where reference is made to the work of others, the work described in this thesis is my own or was done in collaboration with my advisory committee. This thesis does not
include proprietary or classified information.
________________________________________ Jason Margretz
Certificate of Approval: _____________________ _____________________ Richard O. Beil John D. Jackson, Chair Associate Professor Professor Economics Economics _____________________ _____________________ T. Randolph Beard George T. Flowers Professor Interim Dean Economics Graduate School
THE EFFECT OF MEDICAL MALPRACTICE AWARD AMOUNT ON HEALTH:
A CROSS-SECTIONAL REVIEW OF 1998 STATE DATA
Jason Margretz
A Thesis
Submitted to
the Graduate School of
Auburn University
in Partial Fulfillment of the
Requirement for the
Degree of
Master of Science
Auburn, Alabama May 10, 2007
iii
THE EFFECT OF MEDICAL MALPRACTICE AWARD AMOUNT ON HEALTH:
A CROSS-SECTIONAL REVIEW OF 1998 STATE DATA
Jason Charles Margretz
Permission is granted to Auburn University to make copies of this thesis at its discretion, upon the request of individuals or institutions and at their expense. The author reserves
all publication rights.
_____________________ Signature of Author
_____________________ Date of Graduation
iv
VITA
Jason Margretz, son of James and Susan Margretz was born October 15, 1978, in
Cedar Rapids, Iowa. He graduated from Luther College in May 2001 with a double
major of Management Information Systems and Management along with a minor in
Economics. After graduation, he worked as a computer programmer for a Fortune 500
insurance company for 3.5 years. He then entered the Graduate School of Auburn
University in August, 2005.
v
THESIS ABSTRACT
THE EFFECT OF MEDICAL MALPRACTICE AWARD AMOUNT ON HEALTH:
A CROSS-SECTIONAL REVIEW OF 1998 STATE DATA
Jason Margretz
Master of Science, May 10, 2007 (B.A., Luther College – Decorah, 1997)
58 Typed Pages
Directed by John D. Jackson
This thesis examines the relationship between amount awarded in medical
malpractice lawsuits and the health of a population. Data from 1998 is collected for each
state and a crossectional analysis is performed. Two stage least squares is used to
compensate for the simultaneity between health and the amount awarded in medical
malpractice lawsuits. Although lacking statistical significance, analysis of the results
supports the theory that medical malpractice lawsuits at the margin improve the health of
a population.
vi
ACKNOWLEDGEMENTS
The author would like to thank parents, James and Susan Margretz, as well as his
sister and friends. Their support throughout the challenges associated with graduate
school was invaluable and will not be forgotten. The author would also like to thank
committee chairman, Dr. John Jackson, and committee members Dr. Richard Beil, and
Dr. Randolph Beard for their guidance and assistance throughout his time at Auburn
University.
vii
Style manual or journal used: American Economic Review Computer software used: Microsoft Word 2003 Microsoft Excel 2003
LIMDEP 8.0
viii
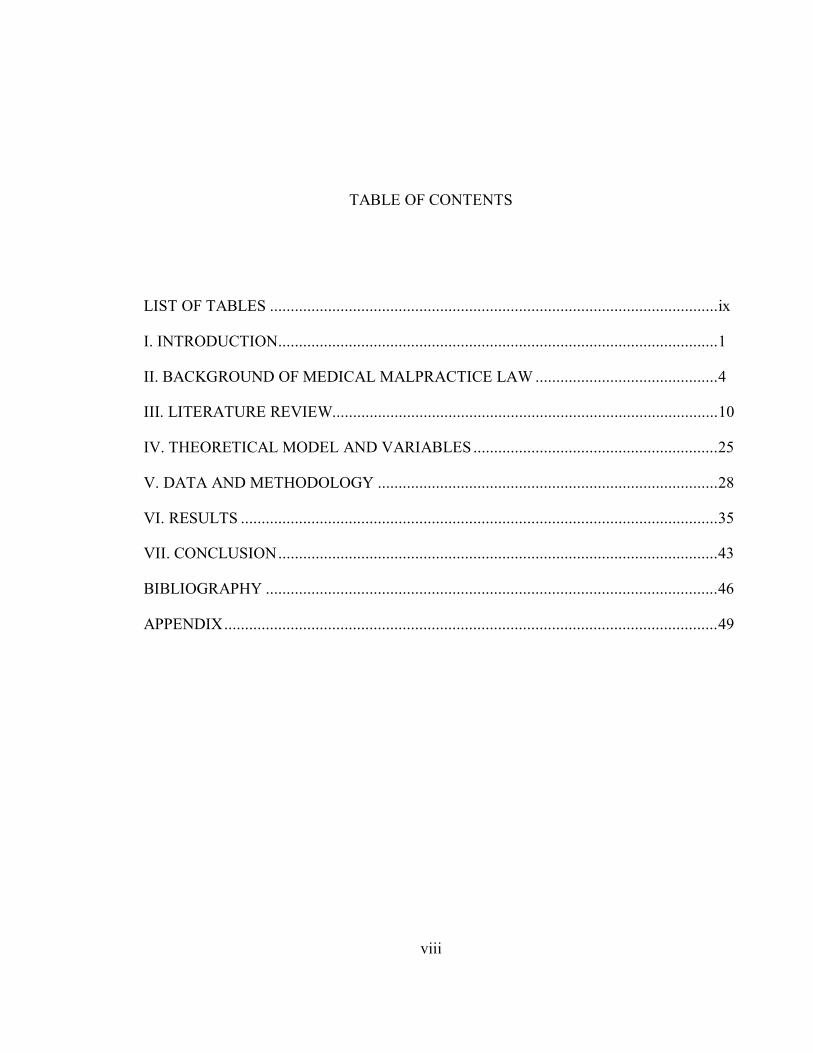
TABLE OF CONTENTS
LIST OF TABLES ............................................................................................................ix
I. INTRODUCTION..........................................................................................................1
II. BACKGROUND OF MEDICAL MALPRACTICE LAW ............................................4
III. LITERATURE REVIEW.............................................................................................10
IV. THEORETICAL MODEL AND VARIABLES...........................................................25
V. DATA AND METHODOLOGY ..................................................................................28
VI. RESULTS ...................................................................................................................35
VII. CONCLUSION..........................................................................................................43
Health has always been a highly valued asset. In earlier times good health was a
requirement for survival. Today, in the developed world, people may live productive
lives with some of the most debilitating medical disabilities. There are efforts to protect
physically debilitated workers from employment discrimination, such as the Americans
with Disabilities Act (ADA). Buildings are designed to be accessible to individuals with
disabilities. There are companies that provide opportunities for sports and recreation for
disadvantaged individuals. With these new opportunities good health is no longer a
requirement for survival; it is now a luxury and facilitator. Good health is not required to
have a productive life, but it does increase the choice of available careers. It is not
needed for a long life, but does increase its likelihood. Good health may not directly
provide enjoyment, but it allows for a pain free existence and it enables more choices of
recreation. Citizens in developed countries are experiencing expected lifespans that are
more than twice as long as people from earlier civilizations. Because of the increased
lifespans there has been a drastic increase in the expectation of how long people with
chronic pain or other ailments will have to endure suffering. When the populace looks to
increase or maintain their health it is medical care providers that they seek out.
2
Medical care providers have been around since the beginning of recorded history.
Unfortunately, not all medical outcomes are positive. These negative outcomes can be
broken up into two generic categories; where there is no fault of the medical worker, and
where the negative outcome is at least partially based on a mistake of the provider.
Newer technology and further understanding of medicine reduces the number of no fault
negative outcomes, but the primary interest of this thesis is how legislative action against
medical care professionals when mistakes do occur effects health.
The following chapter provides a brief overview of the history of medical
malpractice. It shows how over time and across cultures medical malpractice is treated
differently. There are differences in how medical malpractice is determined and what is
viewed as an appropriate deterrent or compensation for the injured party. Furthermore, it
examines the perception towards medical malpractice and the ensuing lawsuits in the
United States.
Chapter III will examine contain the literature review. The chapter will start by
examining the theory behind medical malpractice lawsuits. The theory will be clarified,
expanded, and examples given. Finally, studies providing a foundation for the regression
analysis to follow will be discussed.
Chapter IV will discuss the model being used and a rational for the variables
being utilized. Variables that affect the design of the model will be noted.
In Chapter V, more detail is given to sources and more specific meanings of the
variables being employed. After the variables have been adequately defined, the
regression models will be presented.
3
Chapter VI, will present the results of the regressions. Initially, tests to insure the
second stage regression is correctly specified, whether heteroscedasticity exists, and the
extent of multicollinearity will be performed. The results of the regression will be
examined for economic and statistical significance.
The final chapter will summarize the results found in the econometric analysis. It
will suggest further research topics that were either opened up by this thesis or may
improve the quality of the findings.
4
CHAPTER II
BACKGROUND OF MEDICAL MALPRACTICE LAW
The first handling of medical malpractice occurred in the first recorded set of
laws. During the second century B.C. the Babylonian legal code of Hammurabi had
predefined punishment for mistakes by medical care providers. These laws did not
compensate victims of the malpractice, but they did discourage mistakes by doctors.
As time has progressed, different civilizations have had varying expectations of
medical providers and punishment for mistakes have changed. A variety of factors play a
roll in expectations. Different societies have different concepts of justice and
compensation. Furthermore, the faith in medicine to cure also plays a role. It is this faith
in medicine that is especially high in modern developed countries, although there is
variance in this faith across countries and even within different regions of the same
country. It is beyond doubt that medicine has made great strides and that some faith is
justified. Whether the faith in medicine has exceeded its capabilities is an open debate.
Eighteenth century English law relied less on predefined punishment for medical
mistakes and on more financially punishing liable practitioners by awarding injured
patients compensation. According to Mohr (2000), by the beginning of the 18th century
the notion of malpractice was embedded in English legal theory.
5
The theories developed in England were influential in the colonial United States.
The first recorded malpractice lawsuit in the United States occurred in 1794 involved a
man suing as a result of his wife’s death due to surgery. According to DeVille (1990),
after 1835 medical malpractice lawsuits started becoming popular and by the 1840s there
were complaints from physicians about the common occurrence of malpractice lawsuits.
Since this time, medical malpractice lawsuits have been viewed as a problem by some.
The amount of attention medical malpractice lawsuits receive from the media and
politicians varies, but it seems that the debate on medical malpractice is never far from
the surface.
Mohr cites the initial lack of a governing body to regulate professionals as the
chief reason for the increased popularity in the United States relative to England and the
rest of Europe. Without the governing body the quality of care varied more dramatically
and the advertisement of medical care and products often exaggerated the results that
could be expected. However, as these issues have since been resolved it is necessary to
look for other causes.
Theory states that one of the reasons for a large number of medical malpractice
lawsuits in the United States may be because of the acceptance of contingency based
legal fees in the United States. Contingency based fees assuming an open market place,
potentially allow for greater access to the court system and a higher alignment of
financial motivation between the lawyer and client.
Other reasons such as new technology, higher standards, and the advent of
malpractice insurance also contribute to the number of lawsuits and award amounts.
Although in these areas there have traditionally been fewer differences between the
United States and Europe.
6
ANALYSIS OF MEDICAL MALPRACTICE LAWSUITS
According to Olsen (1996), there are three main measures of medical malpractice
lawsuits that determine financial impact on malpractice insurers. Their frequency
measures how often medical malpractice lawsuits occur. The percentage of lawsuits that
are decided in the favor of the plaintiff can be viewed as the probability of a defendant
losing a malpractice suit. Finally, the severity is the average amount awarded. These
three factors determine the average benefits paid be medical malpractice insurers. And,
assuming a competitive insurance market, the average benefits paid should be a decisive
factor in determining the premiums paid by medical care providers. The frequency and
severity of lawsuits are the two components that supporters of tort reform or specific
medical malpractice reform cite as being problems.
The debate on medical malpractice is a large, multifaceted dispute. Many of the
arguments used by both sides are flawed, biased, and misleading. This is to be expected
because so many lives are directly and indirectly affected. Doctors, lawyers, insurance
companies, patients and their families are all affected. Because there are so many parties
and, as a result, so many faulty arguments, it is futile to attempt to examine the logic of
every argument and counter argument.
Tort law has two objectives. One is to compensate the injured, and the other, just
like other forms of law, is designed to modify actions. It is the modification of actions
that is most often used as arguments for and against medical malpractice lawsuits.
Opponents of medical malpractice lawsuits believe that the actions are changed too
much. They believe that because of medical malpractice lawsuits doctors leave the
profession, access to care is limited, and defensive medicine is practiced. Proponents of
7
medical malpractice believe that the change in actions has a positive net benefit to
society.
Despite the futility of examining arguments from nonacademic parties
(physicians, patients, lawyers, etc.) this study would be remiss not to examine existing
economic theory which will be covered in the literature review. The results of previous
research are reviewed. Then an empirical analysis are preformed that provide better
insight into how the evidence corresponds to theory. Specifically, this thesis examines
the connection between health and medical malpractice lawsuits.
When examining health and medical malpractice it is important to recognize the
simultaneity that exists between the two variables. Medical malpractice lawsuits and the
risk of being sued affect the quantity, cost, and variety of services provided. All of this
theoretically changes the health of the population, although it is not known if the net
affect is positive or negative. The frequency, probability, and severity of benefits paid
may affect health differently depending on what information medical care providers are
exposed to and how it affects their decisions.
The other way of viewing the relationship between health and medical
malpractice lawsuits is attempting to determine how health affects the number and
severity of medical malpractice lawsuits. Medical care providers, jury, and patient health
all play a role in medical malpractice lawsuits.
It is reasonable to suspect that medical care providers are more likely to make a
mistake if they are in poor health when treating a patient. The more likely a mistake is
made increases the liklihood a lawsuit will be initiated, thereby increasing the frequency
of lawsuits and potentially affecting the probability of a decision in favor of the plaintiff.
8
It is also possible that these physicians when making a mistake commit a more serious
one and the severity of the lawsuits increase.
The health of the jury and the health of their friends and family may affect their
ability to empathize with the plaintiff. This would not directly affect the frequency of
lawsuits, but would affect the probability of an outcome favoring the plaintiff and the
severity of the decision. An increase in these two factors would likely increase future
frequency of lawsuits.
Analyzing the affect of the patient’s health is the most complicated. A patient
that had relatively poor health may require more complicated diagnoses and treatments
which increase the likelihood of a mistake, thereby increasing the frequency of lawsuits.
Furthermore, a mistake on an unhealthy individual may produce a more negative
outcome. An initially unhealthy individual may require a longer recovery. Both of these
reasons may increase the severity of the outcome. Depending on the circumstances and
disposition of the jury, an unhealthy individual may have a harder time convincing a jury
that the medical care provider made a mistake and the negative outcome was not a result
of their generally poor health. A patient of relatively good health may be able to recover
more quickly from any medical malpractice that occurs. A contrarian view is that a
person of good health is likely to have a more productive outlook before the medical
treatment; therefore, a mistake that leaves a healthy and unhealthy patient in the same
condition would be more expensive to the healthy patient. The increased expense would
then be reflected in the severity of the outcome. The increased damage done to the
healthy patient may increase the frequency of lawsuits. Because there is rational
supporting health both increasing and decreasing the severity of medical malpractice
lawsuits it is not possible to make a definite prediction of what should happen.
9
The health of patients, medical care providers, and juries each affect the
frequency and severity of the amount awarded in medical malpractice lawsuits. Ideally,
there would be data on each of these groups. It could then be determined how the health
of each group affected medical malpractice awards. Unfortunately, the data required is
not available. The coefficient of the health variable is affected by each of these groups.
This makes interpretation of the data more difficult.
Frequency, probability, and severity all play a role in the importance of medical
malpractice. However, it is the severity, or amount awarded by the jury, that gets the
most attention. Part of this is because it also has an affect on the frequency of lawsuits
according to medical malpractice critics. Large award amounts create a “lottery”
mentality.1 Because of the importance and attention received by the amount awarded, it
is the focal point of this thesis in measuring medical malpractice.
Examining the populations health and medical malpractice award amounts is
expected to provide the clearest understanding of the relationship between the two. Once
this relationship is better understood it can be used to improve understanding of the topic
and contribute towards implementation of sound public policy. The affect of medical
malpractice award amounts on health of the population can help determine policy
implementation towards medical malpractice, assuming that health is a priority of the
government. Meanwhile examining the determinates of medical malpractice awards,
specifically the role health plays, will explain some of the variation found in the data.
1 As given in a speech by Donald J. Palmisano, MD, JD Past-President of American Medical Association on February 17, 2005 to the House of Representatives Small Business Committee
10
CHAPTER III
LITERATURE REVIEW
This literature review contains two parts. The first part examines the theory of
medical malpractice lawsuits. The second part reviews previous papers that are used to
help formulate the regression models to be estimated late on in this study.
MEDICAL MALPRACTICE THEORY:
Because medical malpractice lawsuits fall under the more general category of tort
law, it is important to understand the origins and rationale behind tort law.
According to Landes and Posner (1987), tort law, although around since the
twelfth century, were initially a relatively unimportant field because few of the cases
involved accidents. This changed in the middle of the nineteenth century. Railroads
obtain much of the credit for the increase in the number of tort cases involving accidents;
however, as pointed out by Olsen (1996), this is also when medical malpractice lawsuits
started becoming more popular.
The economic theory of tort law revolves around the concept that some activities
have external costs. An example often used is that railroads may produce sparks that
damage the nearby crops of a farmer. The more trains the railroad has pass by a given
11
farm, the greater the chance of damage to the farm. Tort law allows for a method of
internalizing those costs, thereby reaching a more efficient solution. Although tort law is
a potential solution, it is not the only available solution. Another popular solution is
taxing the railroad and compensating affected farmers.
Coase (1960) points out the problem is actually reciprocal in nature. Continuing
the example above, sparks from the railroad hurt the farmer. But taxing or regulating the
railroad harms the railroad. Both parties may have options available to them that would
eliminate the conflict. When no transaction costs are assumed then the parties will reach
the same outcome reguardless of whether one of the parties is held liabale for damages.
However; when the assumption of no transaction costs is relaxed, the initial state of
liability laws and predefined property rights may affect the outcome and hence, may
affect the efficiency of the outcome.
A numerical example is the easiest way to see the point. Suppose that the farmer
makes $100 from a crop that is susceptible to fire damage from sparks and $90 from a
crop that is fire resistant. There is an expected fire cost of $30 if the crop susceptible to
fire is grown. The railroad company can install a spark free smokestack for $20.
Transaction costs of predamage negotiation between the railroad company and the farmer
is $15. There are three options available to the railroad under the assumption that it is
held responsible for damages. One option is to let the sparks start the crop on fire and
pay $30 to the farmer. The second option is to negotiate with the farmer prior to the fire
damage. This option would result in costing the $15 in transaction costs and an
additional $10 to have the farmer plant a fire resistant crop for a total cost of $25. The
12
final option is for the railroad company to install the spark free smokestack for $20.
Given these three options the most efficient solution is to install the smokestack for $20.
However if the railroad is not held responsible for damages then the farmers most
efficient option is to plant the fire resistant crop and only lose $10. In this example if the
railroad company is held liable for damages then society (limiting society to the railroad
company and the farmer for simplification) will have $10 less than if the railroad was not
held responsible.
As analyzed by Landes and Posner, No Liability, Strict Liability, and Negligence
are different ways for courts to assign liability. Applying “No Liability” to medical
malpractice lawsuits prevents hospitals and physicians from being held responsible. This
is the most economically efficient solution if patients are more efficient at avoiding injury
than hospitals are at preventing injuries. Given the expertise and education involved in
being a medical professional, this is an unrealistic expectation in the vast majority of
cases. “Strict Liability” states that every accident is the responsibility of the injurer. In
the case of medical malpractice the medical care professional is held responsible for
every negative outcome. This differs from “Negligence” in that the injurer is only held
responsible if they use less than “Due Care”. (Where “Due Care” is defined as the point
where social marginal cost and social marginal benefits are equal) The subsequent
analysis, shows that strict liability and negligence both result in the potential injurers,
medical care providers, having an optimal level of care at the “due care” level. Although
the quality of health care should be the same if negligence or strict liability is assumed,
the different forms of liability should affect the cost of health care. If medical care
13
providers are required to pay for all negative outcomes then they need to charge more to
be compensated for the claims they pay. The total expected cost of health care may be
the same for patients, but the upfront cost is higher, this leads to a reduction in the
amount of medical care, and hence a reduction in quality of health.
Medical malpractice follows the negligence requirements of tort law. As
mentioned above, negligence only occurs if due care is not provided, but the medical care
profession has incentive to provide due care. Yet many medical malpractice cases occur.
There are several reasons why this may happen. 1.) Patients and or juries may
mistakenly believe that there was negligence. 2.) A person may not have complete
control over the level of care they provide due to a stochastic element such as
attentiveness. 3.) Negligence is determined by the actions expected of an “average man”.
(Below average individuals may have a harder time meeting these expectations.) 4.) If
there are a lack of negligence cases, there enters doubt about potential outcomes and what
is considered due care. The frequency of medical malpractice lawsuits seems to suggest
that lack of cases is not the cause of existing medical malpractice lawsuits. Medical care
professionals often cite the first reason, while patients and their lawyers are more likely
to cite 2 or 3 as being the cause of medical malpractice lawsuits.
The theory above gave the economic justification for medical malpractice
lawsuits and why they occur. Understanding these factors is necessary but not sufficient
to properly understand the debate on medical malpractice. The amount awarded in a case
gets perhaps more attention and blame, by the medical community, than the number of
cases. According to the past president of the AMA, Donald J. Palmisano, “runaway
14
juries are handing out huge awards in some liability cases” which “has created a lottery
mentality”.2 A lottery mentality in this context is where plaintiffs sue with little chance
of winning in hopes that they will win and receive a large windfall. Therefore, it is also
important to understand why there have been “huge awards”.
According to Landes and Posner (1960), punitive damages are when the amount
awarded exceeds the harm done. Punitive damages are awarded to encourage the party
committing the transgression or mistake and other similar providers to take steps to
prevent it or similar occurrences from happening again. Punitive damages are sometimes
awarded as a substitute for an injunction in cases involving the human body. This is
because enforcing property rights through an injunction is likely to be prohibitively
expensive. A more efficient manor of dealing with the problem is by awarding punitive
damages and providing the injurer the financial incentive to change their behavior.
When physicians and other medical care providers change their behavior it is
referred to as defensive medicine. Although defensive medicine is used in a negative
context, Bhat (2001) points out that defensive medicine can either raise or lower the
quality of medical care. He goes further to state that raising the quality of medical care is
good and lowering the quality or medical care is bad. Economically this is a little to
broad of a definition. It is possible that running extra tests would raise the quality of
care, but at too high of a cost and this would be inefficient. The quality of medical care
may be very high, but if the quality leads to a price higher than people are willing to pay
then it becomes irrelevant. Hence, systematically inefficient use of medical resources
2 Speech to the House of Representatives Small Business Committee on February 17, 2005
15
may result in excessively high prices leading to lower quantity of medical care and lower
overall health of the population.
Kessler and McClellan (1996) examined elderly patients with heart diseases in
states that implemented tort reform and compared the results to states that did not have
tort reform. They determined that there was a five to nine percentage drop in
expenditures with an insignificant drop in mortality rates. Their conclusion is that there
is evidence to support the argument that there is an inefficient use of resources in
medicine that can be in part corrected by tort reform.
Bhat (2001) proposes that there may be excessive defensive medicine being
practiced but this may not disappear with the elimination of malpractice risk because a
significant fraction of physicians’ income comes from the practice of defensive medicine.
Furthermore, if malpractice risks are eliminated, then “negligent adverse outcomes are
likely to go up dramatically.”3
Vidmar (1995) points out that although juries determine the verdict and the
damage award; these are reviewed by the judge who may determine that the jury made a
mistake. Furthermore, “either of the opposing parties may appeal the decision for review
by a higher court.” Vidmar provides a very detailed history of one case, Melis V. Kutin,
on how a jury and judge determine the damage awarded.
Riccardi and Ireland (2000) provide information on how the payment and fee
structure of medical malpractice cases are determined. In the process they discuss how
malpractice amounts are determined in New York. Every state determines the amount
3 p. 198
16
awarded differently but they take the same issues into consideration. When determining
what variables should be included in the regression of medical malpractice amount
awarded this should provide a solid foundation. The damage award is comprised of
economic damages and noneconomic damages categories. Economists often play a large
role in determining the economic damages to the patient. Economic damages include lost
past and future wages, medical bills, and other monetary losses that directly result from
the medical malpractice. Economists do not play a part in determining noneconomic
damages, which include such things as pain and suffering, loss of enjoyment, loss to
society, etc. In New York, and other states, the damages are often broken into life
contingent and period certain payments. The actual amount of life contingent payments
may vary significantly with the amount determined by the court. This discrepancy results
from many patients that experience medical malpractice have shorter life expectancies.
Pain and suffering along with loss of enjoyment will vary depending on the extent
of the injuries. Different medical treatments have different likelihoods of resulting in
serious injury to the patient. Because there is likely to be a positive correlation between
economic damages and damages resulting from pain, suffering, and loss of enjoyment,
procedures can not be categorized as solely affecting economic or noneconomic damages.
Fournier and McInnes (2001) examined different specialties that may increase the risk of
medical malpractice lawsuits. They determined that Anesthesiology, Obstetrics-
Gynecology, Otorhinolaryngology, General Surgery, Emergency Medicine, and
Radiology all may increase the chances of a medical malpractice lawsuit.
17
Another aspect of noneconomic damages is loss to society. Although other
aspects of a patient may affect the loss to society, education, as stated by Thompson
(1998), can have a dramatic effect. In fact, according to Haveman and Wolfe (1984), “a
conservative estimate of the total annual value of the nonmarketed effects of schooling
would be, say, $4500-55000.”4
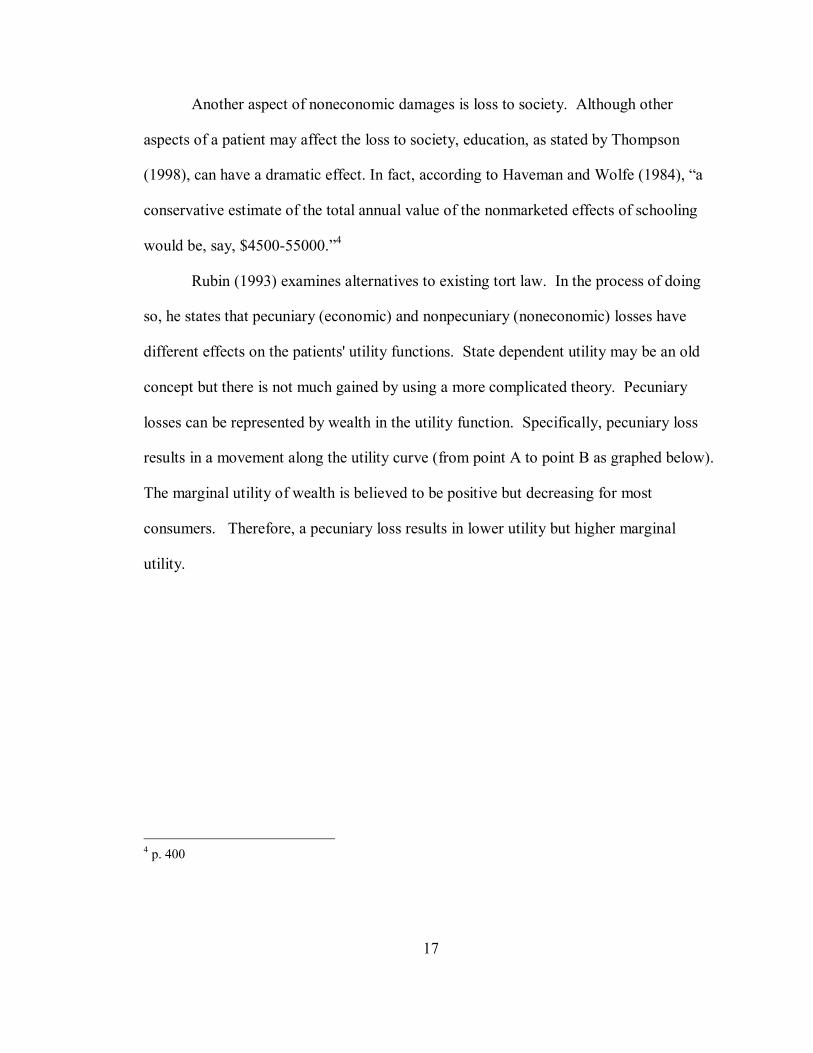
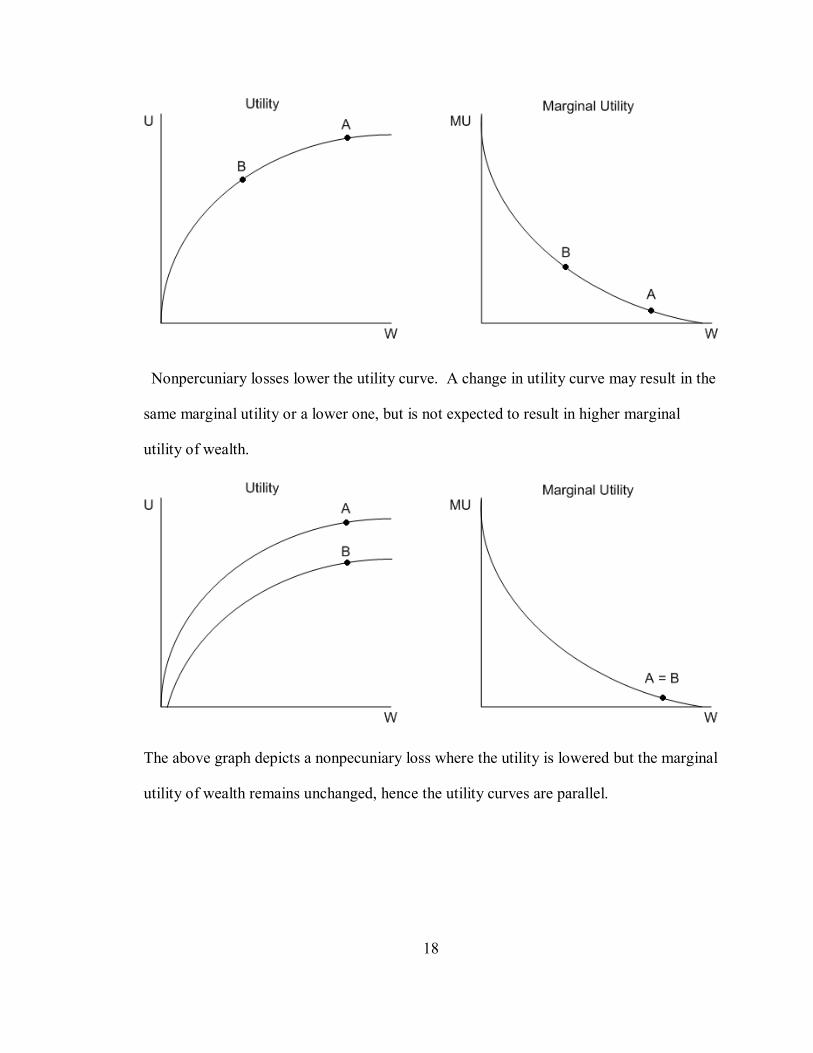
Rubin (1993) examines alternatives to existing tort law. In the process of doing
so, he states that pecuniary (economic) and nonpecuniary (noneconomic) losses have
different effects on the patients' utility functions. State dependent utility may be an old
concept but there is not much gained by using a more complicated theory. Pecuniary
losses can be represented by wealth in the utility function. Specifically, pecuniary loss
results in a movement along the utility curve (from point A to point B as graphed below).
The marginal utility of wealth is believed to be positive but decreasing for most
consumers. Therefore, a pecuniary loss results in lower utility but higher marginal
utility.
4 p. 400
18
Nonpercuniary losses lower the utility curve. A change in utility curve may result in the
same marginal utility or a lower one, but is not expected to result in higher marginal
utility of wealth.
The above graph depicts a nonpecuniary loss where the utility is lowered but the marginal
utility of wealth remains unchanged, hence the utility curves are parallel.
19
Appling the work done by Rubin, the sources of noneconomic damages in
medical malpractice lawsuits can be very informative. According to Sinn (2003),
“Prefrences are, in fact, just a trick of nature to induce us to behave in a way that satisfies
the rules of biological evolution.” Sinn looks at risk prefrences from a biological
perspective and proves that logarithmic risk preferences are statistically superior to all
other preference structures. That is to say that logarithmic preference structures will, “be
chosen by a fraction of the aggregate population that approaches 100% as time goes to
infinity.” This conclusion is reached by recognizing that evolution selects the preference
structure that maximizes the growth rate of a population. Sinn then makes an assumption
that the number of children a parent has is proportional to the amount of resources
commanded. It should be noted that this need not be the current case, simply that for
much of mankind's history it was applicable. The assumption that the number of children
a parent has is proportional to the amount of resources commanded is contentious. He
goes on to prove that a logarithmic preference structure will maximize wealth in the long
run. The basic rational is that a more risk adverse individual will place too many limits
on their growth, while a more risk loving individual experiences too many significant
negative outcomes to maximize their long term wealth. The concept of a logarithmic
utility curve has a long history dating back to 1754 when it was first proposed by
Bernoulli.5
Although it would be a mistake to assume that everyone has this utility function, a
logarithmic utility function should suffice as a rough representation of the public's utility.
5 Specimen Theoriae Novae de Mensura Sortis translated in Econometrica p. 28
20
For simplicity I will assume that the original utility function can be represented by U =
ln(w) where 'w' represents wealth. There are three basic types of losses that will be
examined: economic loss, noneconomic loss that maintains the same marginal utility
slope, and noneconomic loss with a lower marginal utility slope.
Representing an economic loss with 'e' allows for the utility function to be
represented by U = ln(w-e). Letting 'c' represent the economic compensation then allows
the utility after the economic loss and subsequent economic compensation to be
represented by U = ln(w-e+c) where c represents the economic compensation. Therefore,
when ln(w) = ln(w-e+c), the individual has reacquired the original utility through
economic compensation. This occurs when e = c, that is to say when the economic
compensation is equal to the economic loss.
A noneconomic loss that lowers the utility function by the same amount as the
economic loss above without changing the slope can be viewed as the utility function U =
ln(w) – ln{w / (w-e)}. After the compensation the utility function would be U = ln(w +
c) – ln{w / (w - e)}.
ln(w + c) – ln{w / (w – e)} = ln(w) →
ln[(w + c) /{w / (w – e)}] = ln(w) →
(w + c) * (w – e) / w = w →
c = w2 /(w-e) – w
To reacquire the original utility the compensation (c) must equal w2/(w-e) – w.
The third possibility is that the utility is lowered and the slope flatter. The results
here are obviously going to be determined by how much the slope is changed. One way
21
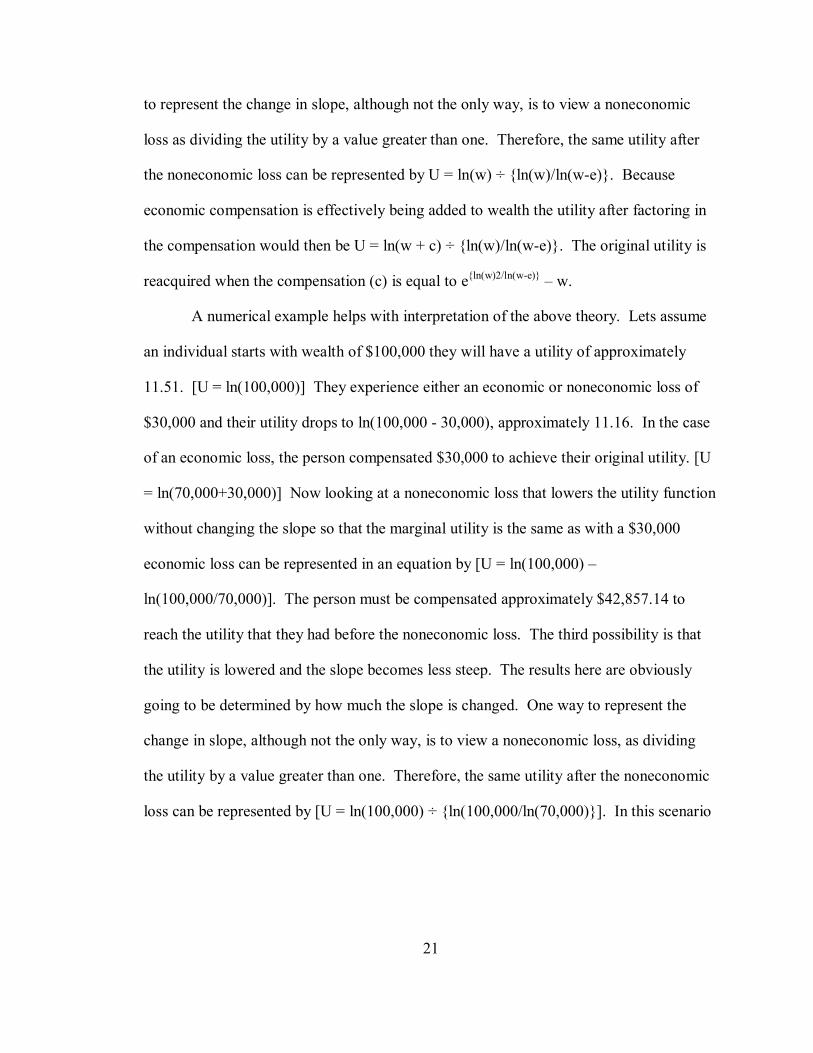
to represent the change in slope, although not the only way, is to view a noneconomic
loss as dividing the utility by a value greater than one. Therefore, the same utility after
the noneconomic loss can be represented by U = ln(w) ÷ {ln(w)/ln(w-e)}. Because
economic compensation is effectively being added to wealth the utility after factoring in
the compensation would then be U = ln(w + c) ÷ {ln(w)/ln(w-e)}. The original utility is
reacquired when the compensation (c) is equal to e{ln(w)2/ln(w-e)} – w.
A numerical example helps with interpretation of the above theory. Lets assume
an individual starts with wealth of $100,000 they will have a utility of approximately
11.51. [U = ln(100,000)] They experience either an economic or noneconomic loss of
$30,000 and their utility drops to ln(100,000 - 30,000), approximately 11.16. In the case
of an economic loss, the person compensated $30,000 to achieve their original utility. [U
= ln(70,000+30,000)] Now looking at a noneconomic loss that lowers the utility function
without changing the slope so that the marginal utility is the same as with a $30,000
economic loss can be represented in an equation by [U = ln(100,000) –
ln(100,000/70,000)]. The person must be compensated approximately $42,857.14 to
reach the utility that they had before the noneconomic loss. The third possibility is that
the utility is lowered and the slope becomes less steep. The results here are obviously
going to be determined by how much the slope is changed. One way to represent the
change in slope, although not the only way, is to view a noneconomic loss, as dividing
the utility by a value greater than one. Therefore, the same utility after the noneconomic
loss can be represented by [U = ln(100,000) ÷ {ln(100,000/ln(70,000)}]. In this scenario
22
it takes approximately $44,495.50 for an individual to achieve their utility level before
the noneconomic loss.
Of course the utility functions above were just examples of how the utility
function might look and might change, but it shows how a risk adverse utility function is
affected differently by different types of losses. Noneconomic losses, ceteris paribas,
require more compensation to reacquire the original utility than an economic loss and that
a noneconomic loss that lowers the slope requires even more compensation.
THE ESTIMATION OF MEDICAL MALPRACTICE AND HEALTH:
The foundation of the estimation of medical malpractice amount awarded will be
based off a previous prior empirical analysis. Health of a population, per capita income,
state attitude towards tort lawsuits, education, physician specialty, age of population,
health expenditures, and a northeast regional dummy were all variables that theory stated
would affect the malpractice amount awarded. The proxy for health used is age-adjusted
death rate from 1996 to 1998. The results found that age-adjusted death rate had a
positive contribution towards the medical malpractice amount award and was statistically
significant at the one percent confidence level. Per capita income was found to have both
a linear term and a squared term that were statistically significant at the one percent level.
The signs resulted in per capita income having a critical value for a maximum effect on
medical malpractice amount awarded. A dummy variable representing state legislation
capping non-economic damages at $250,000 was a proxy for state attitude towards tort
23
lawsuits. This variable had a negative sign and was statistically significant at the five
percent level. Education and physician specialty both were put into log form and found
to have positive signs with five percent confidence. Age and health expenditures were
found not to be statistically significant. The northeast regional dummy was found to have
a positive affect on medical malpractice amount awarded at the one percent confidence
level.
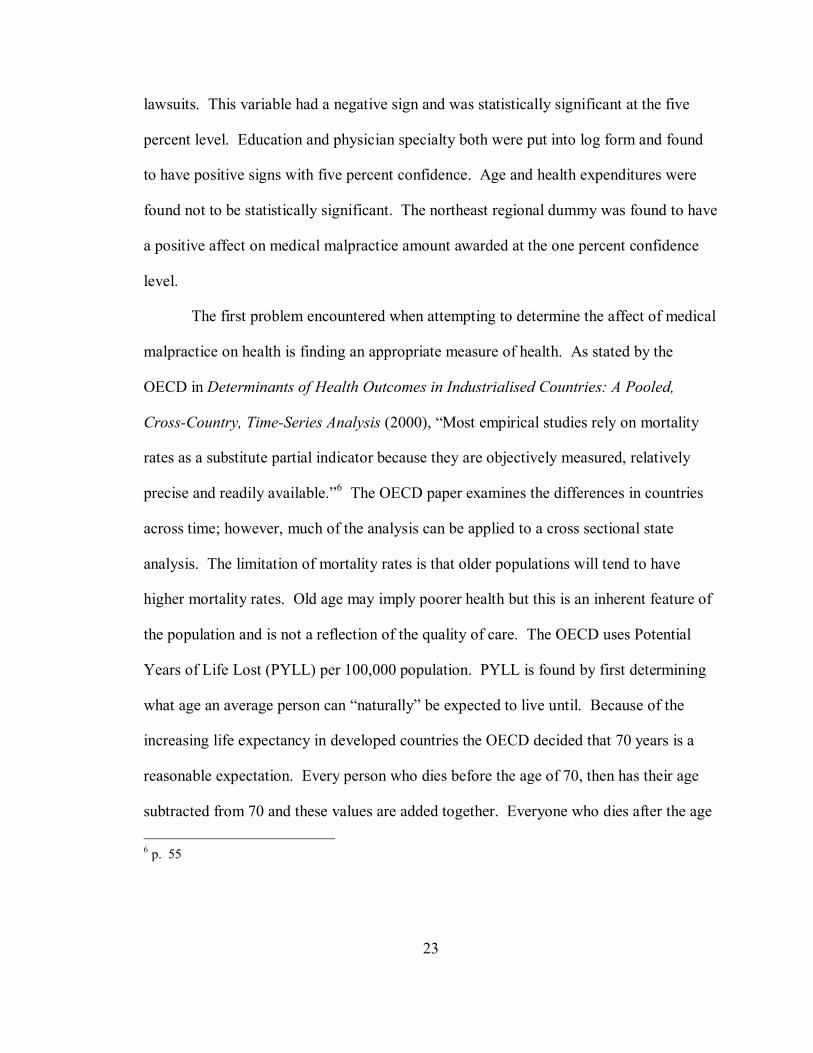
The first problem encountered when attempting to determine the affect of medical
malpractice on health is finding an appropriate measure of health. As stated by the
OECD in Determinants of Health Outcomes in Industrialised Countries: A Pooled,
Cross-Country, Time-Series Analysis (2000), “Most empirical studies rely on mortality
rates as a substitute partial indicator because they are objectively measured, relatively
precise and readily available.”6 The OECD paper examines the differences in countries
across time; however, much of the analysis can be applied to a cross sectional state
analysis. The limitation of mortality rates is that older populations will tend to have
higher mortality rates. Old age may imply poorer health but this is an inherent feature of
the population and is not a reflection of the quality of care. The OECD uses Potential
Years of Life Lost (PYLL) per 100,000 population. PYLL is found by first determining
what age an average person can “naturally” be expected to live until. Because of the
increasing life expectancy in developed countries the OECD decided that 70 years is a
reasonable expectation. Every person who dies before the age of 70, then has their age
subtracted from 70 and these values are added together. Everyone who dies after the age
6 p. 55
24
of 70 is represented by a zero. This number is considered the Potential Years of Life
Lost. The OECD runs separate regressions for males and females to capture the
differences between the two genders. The independent variables tested were; health
expenditures, income, NOx emissions per capita, share of public health expenditure, share
of white-collar workers in total work force, alcohol consumption, tobacco consumption,
butter consumption, and sugar consumption. NOx emissions per capita represent the
amount of air pollution. Share of white-collar workers in total work forces is used
because nature of work is believed to affect mortality rates. It is also believed to capture
the education level because there is a high positive correlation between education and
white-collar jobs. As expected health expenditures, income, share of public expenditure,
and share of white-collar workers all had negative affects on PYLL, while NOx
emissions, alcohol consumption, tobacco consumption, butter consumption, and sugar
consumption all increase PYLL.
25
CHAPTER IV
THEORETICAL MODEL AND VARIABLES
There exists a national debate on tort reform, and nowhere is this debate more
passionate than when referencing medical malpractice. The arguments against medical
malpractice center on the concept that large potential awards encourage lawyers to bring
forward many lawsuits hoping to “hit the lottery”. Supporters of medical malpractice
believe that doctors should be held accountable, and that patients deserve to be
compensated for the mistakes made. To analyze the effects of medical malpractice
lawsuits on health, regression analysis will be utilized.
Although the question is how amount awarded in medical malpractice lawsuits
affects health, theory and preliminary econometric analysis suggests that health has
already been shown to affect the amount awarded. For this reason there is a danger of
simultaneity. The Hausman test will be performed to determine if there is indeed
endogeneity. Assuming that there is a simultaneity problem, health of the population and
median malpractice payment will be treated as endogenous variables.
Correcting for simultaneity will be achieved by performing two stage least
squares analysis of the data. The first stage will be determining a predicted value of
medical malpractice amount awarded. This predicted value will then be used in the
second stage as an explanatory variable. According to Greene (2003), accurate standard
26
deviations require using the actual values of medical malpractice amount awarded instead
of the predicted values.7
The predicted median medical malpractice values will use a regression found in a
previous paper as the base. Theory states that economic and noneconomic damages are
vital components to predicting median medical malpractice values. In addition there are
cultural differences that may play a role in malpractice amounts. It is relatively easy
recognizing factors that play a role in economic damages. Variables such as income, age,
and cost of medical care should affect the amount of economic damages awarded.
Different medical procedures are likely to have different amounts of damage when
malpractice occurs. To account for this, the percentage of treatments for each specialty in
each state would have been ideal, but unfortunately that information was not available, in
its place percentage of physicians specializing in a field is used. Physician specialty will
likely affect both economic and noneconomic damages. Noneconomic damages by their
very nature are harder to measure. One variable that is likely to affect noneconomic
damages are states that impose a $250,000 cap on non-economic damages. This cap on
noneconomic damages may not directly affect the median malpractice amount awarded,
because all values are under $250,000, but may instead be a proxy for other state
legistlation that may affect the amount awarded, it also may capture the attitude of states
towards tort lawsuits. Individuals with more education may be viewed to contributing
more to society. The amount of education could also affect how the population of the
state views medical malpractice. Characteristics of The United States are neither
homogenous nor necessarily randomly distributed. It is because of this dual property that
regions are included. In particular, culture in the United States varies by region. In the
7 p. 400
27
case of endogeneity the variable age adjusted death rate will be replaced with the
variables in the health regression analysis sans medical malpractice amount awarded.
The health regression will use age adjusted death rate instead of the Potential
Years of Life Lost (PYLL) per 100,000 population with a base year 70 as was used in the
OECD research. This is because of the somewhat arbitrary nature of picking 70 as the
base age. It also does not factor in the people who die after the age 70 and hence loses a
large segment of the population. The dependent variables for health will be similar;
health expenditures, income, NOx emissions, and share of public expenditure in total
health expenditure will be used just as in the OECD research. Instead of tobacco
consumption, packs of cigarettes sold per month per adult will be used. It is reasonable
to expect purchases of cigarettes to correspond closely with consumption. Education will
be used instead of share of white-collar workers in total work force. Butter and sugar
consumption will be replaced with percentage of the population at health risk due to
obesity as measured by body mass index. Although the body mass index may not always
be an accurate measure of obesity, it is the only variable available to measure food
consumption. All of the above variables are directly related to existing theory and have
been found in the past to be important. Median malpractice payments will be included in
order to test how it affects the health of a population. This is the main variable of
interest.
28
CHAPTER V
DATA AND METHODOLOGY
The data in this thesis unless stated elsewhere is state level data for the year 1998.
The nonlinear variables are used because preliminary empirical analysis demonstrated a
non linear relationship for some of the regressors.
Centers for Disease Control and Prevention (CDC) provides the age-adjusted
death rate in Health, United States, 2002. The age-adjusted death rate is calculated for
the year grouping, 1996-1998. Age-adjusted death rates are used instead of actual death
rates because diseases occur at different rates in different age groups. By normalizing the
death rate across ages it becomes possible to more accurately compare relative health of
state populations. “Adjustment is accomplished by first multiplying the age-specific rates
of disease by age-specific weights”.8 The age specific weights are found by examining
the proportion of the US population within each age group to die. These age specific
death weights, based on the US population, are then applied to each state to find what the
death rate of the specific state is likely to be if they had an age distribution matching the
United States as a whole, AGEADJUS.
United States Environmental Protection Agency records NOx emissions. Area
emissions, NOXAREAP, instead of point emissions are used. There are both positives
8 New York’s Department of Health website on age adjusted death rate
29
and drawbacks to using this approach. Area emissions are estimated based on fuel used,
miles driven, etc. This is produced on the county level then summed up to produce state
aggregates. Point source is the accumulation of facilities that are easily identified and
measured. Area emissions are more comprehensive in nature, but are merely estimates.
Point source emissions are exact values, but miss many small sources of pollution. This
thesis will use area source emissions to capture more sources recognizing that if pollution
is harmful to health, then it is irrelevant where the pollution comes from and under the
belief that the estimates produced are a more accurate picture of overall pollution than
point source values. The emissions are measured in short tons (2000 pounds).
The percentage of population that is obese is estimated by the Centers for Disease
Control and Prevention (CDC) using data from 1998 National Health Interview Survey.
Body Mass Index (BMI) is used to determine obesity. BMI is found by taking
weight/(height)2, where weight is measured in kilograms and height is measured in
meters. A value greater than or equal to 30 qualifies as obese. As described in the
Report of the Dietary Guidelines Advisory Committee on the Dietary Guidelines for
Americans, 1995 body fat may be a better indicator of obesity but, “because body fat
cannot be readily measured, weight appears to be the most appropriate surrogate”.9
OBESITY and OBESITSQ will represent obesity and the squared term.
Packs of cigarettes sold per adult per month were obtained from The Tobacco
Institute. The data is collected bimonthly; the months are then averaged to provide a two
month average. For the purpose of this paper these bimonthly average was then taken
9 As reported under “Discussion of Proposed Changes”
30
and multiplied by two and accumulated for the year. This value was then logged,
LNPACKSP. One of the bimonthly data groups is 1989 December/January; which
consists of Dec, 1989 and January 1990. It is not believed that this will create much of a
disturbance in the data, because smoking has a cumulative effect on health. It is a history
of smoking that is relevant, not the amount of smoking in the given year. Furthermore,
the data compiled from wholesale warehouse removal records where what actually
should be captured is consumption. However, sales data is more accurate, easier to
capture, and dependent on consumption which out weighs the drawbacks.
Share of public expenditure in total health expenditure was obtained from 1998-
1999 State Health Care Expenditure Report that is co-published by the Milbank
Memorial Fund, the National Association of State Budget Officers, and the Reforming
States Group. Share of public expenditure typically means the share spent by the state in
relation to the total amount spent by individuals and the state combined. However due to
lack of data availability a different definition will have to be used. Instead state
expenditures will be examined. The report separates spending according to broad
categories; “Medicaid, the State Children's Health Insurance Program (SCHIP), state
employees' health benefits, corrections, higher education, insurance and access
expansion, public health-related expenditures, state facility-based services, and
community-based services.” The share was found by taking total public health related
expenditures divided by total state health care expenditures for the fiscal year 1998,
SHAREPUB. Public health related expenditures includes, “direct personal health
expenditures for specific program areas but does not include subsistence, personal care,
31
or general public health expenditures” as defined by the report. Examples of programs
that would be included in public health related expenditures are local health clinics,
licensing boards and regulatory oversight, childhood immunization, health grants, AIDS
testing, hearing aid assistance, breast and cervical cancer screening, tuberculosis
programs, emergency health services, and education programs.
Median payment amount for medical malpractice tort lawsuits was obtained from
National Practitioner Data Bank 1998 Annual Report. The median payment amount, in
several states, is less than the median amount received by claimants because some states
have “State compensation funds, and other similar funds”. The NPDB obtains their
information from insurance companies and self-insured entities (but not self-insured
individuals) that are required to report whenever they make a payment of any amount that
benefits a physician, MEDIANPA.
Per capita income is from Bureau of Economic Analysis. Per capita personal
income is found by first summing “wage and salary disbursements, supplements to wages
and salaries, proprietors' income with inventory valuation and capital consumption
adjustments, rental income of persons with capital consumption adjustment, personal
dividend income, personal interest income, and personal current transfer receipts, less
contributions for government social insurance“, then dividing by the resident population
of the state as determined by the Census Bureau’s annual midyear population estimates,
PERCAPIT and the squared term PERCAPSQ.
Tort reform is a very diverse group of regulations and therefore it is difficult to
precisely categorize states. The category used in this paper, noneconomic damage cap of
32
$250,000, was taken from a Report to Congressional Requesters created by United States
General Accounting Office called MEDICAL MALPRACTICE: Implications of Rising
Premiums on Access to Health Care. States that have enacted the noneconomic damage
cap as of 1995 will be given a dummy value for the variable NONECON2.
The age data was acquired from Population Estimates for the U.S., Regions, and
States by Selected Age Groups and Sex from the U.S. Census Bureau. The estimate is
produced by the Population Estimates Program (PEP). Every year the estimates are
updated. Population changes throughout the year; estimate given is for July 1. In order
to provide the best estimate possible; births, deaths, Federal tax returns, medicare
enrollment, and immigration are used to update decennial census base counts. Percentage
of the population from ages 18 to 64, AGE18TO6, is found by summing smaller
population percentages together.
Education was retrieved from the report, Educational Attainment in the United
States: March 1998 from the Bureau of the Census. The report was created from data
originating in March 1998 Current Population Survey (CPS). The 90 percent confidence
interval for each state varies between 5.6 and 1.8 percentage points. The percentage of
population with a bachelor degree or more of education logged, LNPERPOP.
The information on number of physicians was collected from Physician
Characteristics and Distribution in the U.S. which is created by the American Medical
Association. (Note: the year 1994 was used for this data because of availability. It is
unlikely that the percentages changed much from 1994 and 1998.) Specifically, the
33
percentage of physicians specializing in anesthesiology is found then logged,
LNANPERC.
Health expenditure per capita was obtained from HRSA State Health Workforce
Profiles. The data was taken from the 1998 reports however; the estimate is for 1994,
HEALTHEX.
Finally, the states comprising of the northeastern dummy was chosen to
correspond with the grouping used by the Census Bureau, NEREGION. Preliminary
empirical analysis showed that the northeastern region was the only region that varied
significantly form the rest of the country.
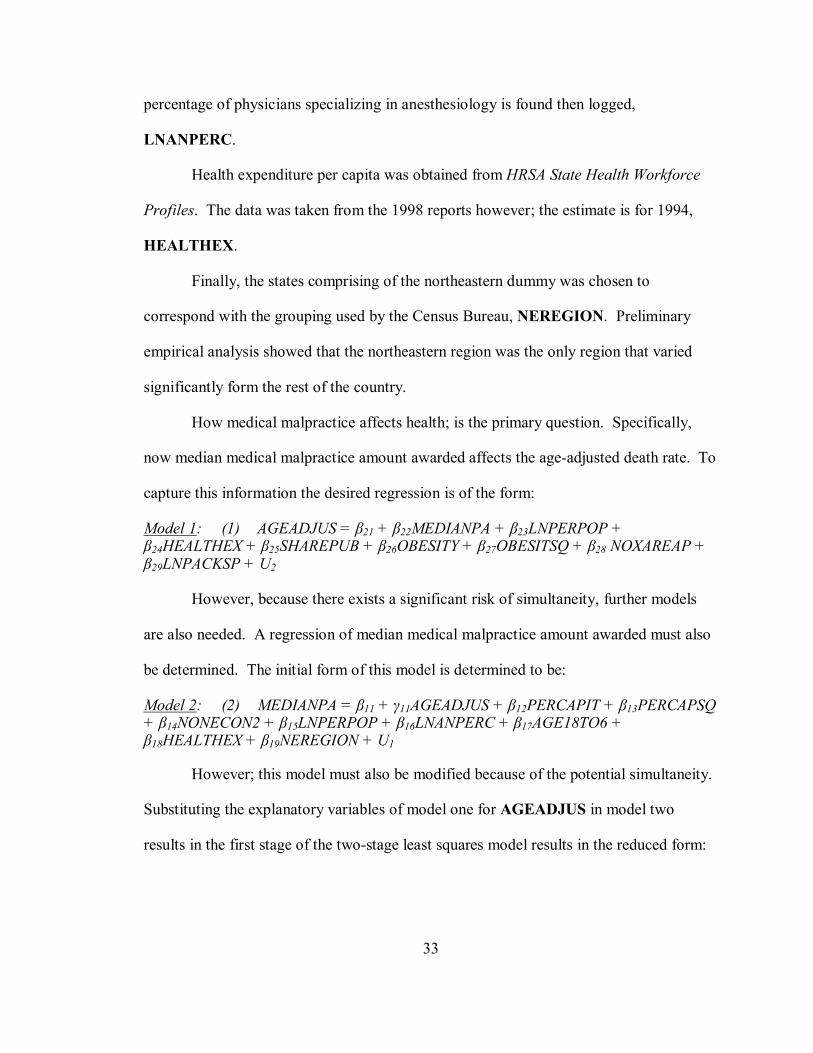
How medical malpractice affects health; is the primary question. Specifically,
now median medical malpractice amount awarded affects the age-adjusted death rate. To
capture this information the desired regression is of the form:
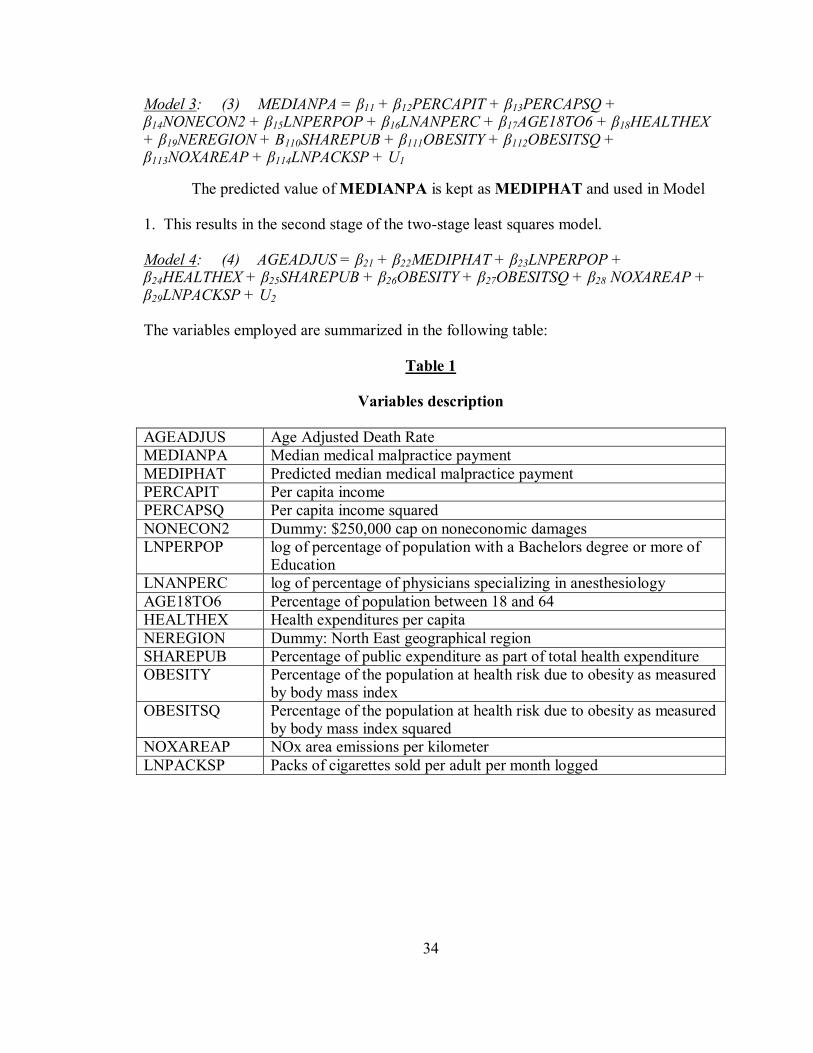
The predicted value of MEDIANPA is kept as MEDIPHAT and used in Model
1. This results in the second stage of the two-stage least squares model.
Model 4: (4) AGEADJUS = β21 + β22MEDIPHAT + β23LNPERPOP + β24HEALTHEX + β25SHAREPUB + β26OBESITY + β27OBESITSQ + β28 NOXAREAP + β29LNPACKSP + U2 The variables employed are summarized in the following table:
Table 1
Variables description
AGEADJUS Age Adjusted Death Rate MEDIANPA Median medical malpractice payment MEDIPHAT Predicted median medical malpractice payment PERCAPIT Per capita income PERCAPSQ Per capita income squared NONECON2 Dummy: $250,000 cap on noneconomic damages LNPERPOP log of percentage of population with a Bachelors degree or more of
Education LNANPERC log of percentage of physicians specializing in anesthesiology AGE18TO6 Percentage of population between 18 and 64 HEALTHEX Health expenditures per capita NEREGION Dummy: North East geographical region SHAREPUB Percentage of public expenditure as part of total health expenditure OBESITY Percentage of the population at health risk due to obesity as measured
by body mass index OBESITSQ Percentage of the population at health risk due to obesity as measured
by body mass index squared NOXAREAP NOx area emissions per kilometer LNPACKSP Packs of cigarettes sold per adult per month logged
35
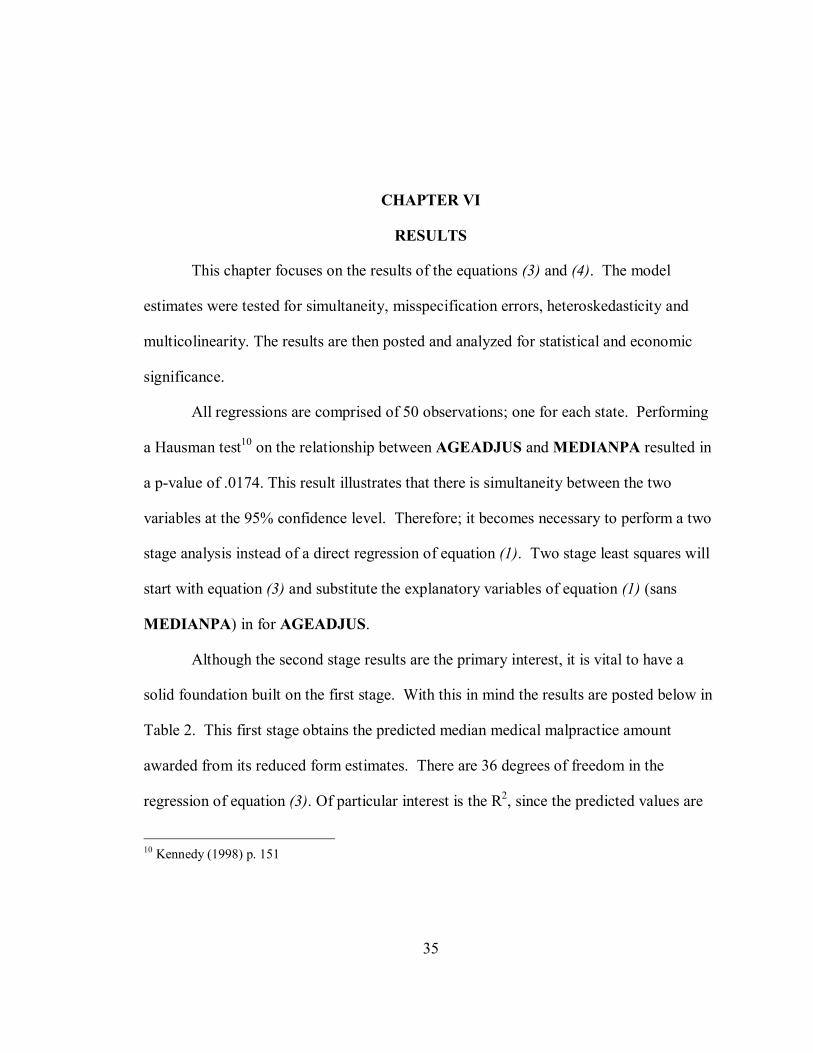
CHAPTER VI
RESULTS
This chapter focuses on the results of the equations (3) and (4). The model
estimates were tested for simultaneity, misspecification errors, heteroskedasticity and
multicolinearity. The results are then posted and analyzed for statistical and economic
significance.
All regressions are comprised of 50 observations; one for each state. Performing
a Hausman test10 on the relationship between AGEADJUS and MEDIANPA resulted in
a p-value of .0174. This result illustrates that there is simultaneity between the two
variables at the 95% confidence level. Therefore; it becomes necessary to perform a two
stage analysis instead of a direct regression of equation (1). Two stage least squares will
start with equation (3) and substitute the explanatory variables of equation (1) (sans
MEDIANPA) in for AGEADJUS.
Although the second stage results are the primary interest, it is vital to have a
solid foundation built on the first stage. With this in mind the results are posted below in
Table 2. This first stage obtains the predicted median medical malpractice amount
awarded from its reduced form estimates. There are 36 degrees of freedom in the
regression of equation (3). Of particular interest is the R2, since the predicted values are
10 Kennedy (1998) p. 151
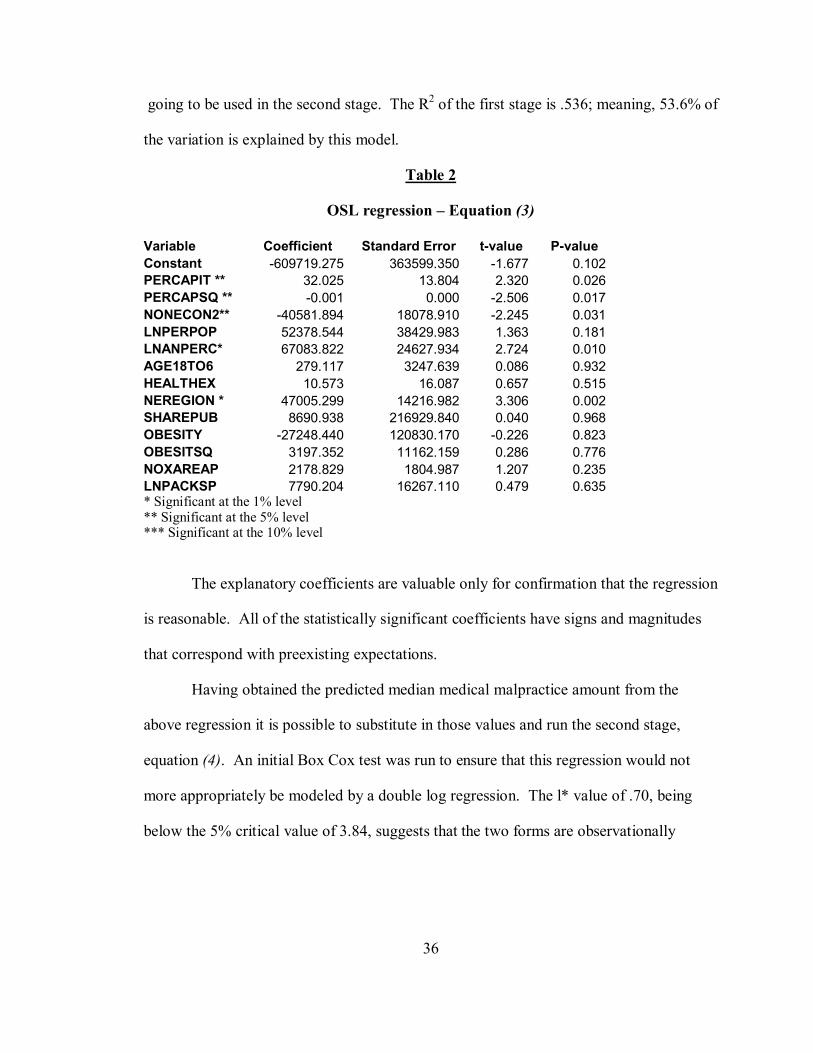
36
going to be used in the second stage. The R2 of the first stage is .536; meaning, 53.6% of
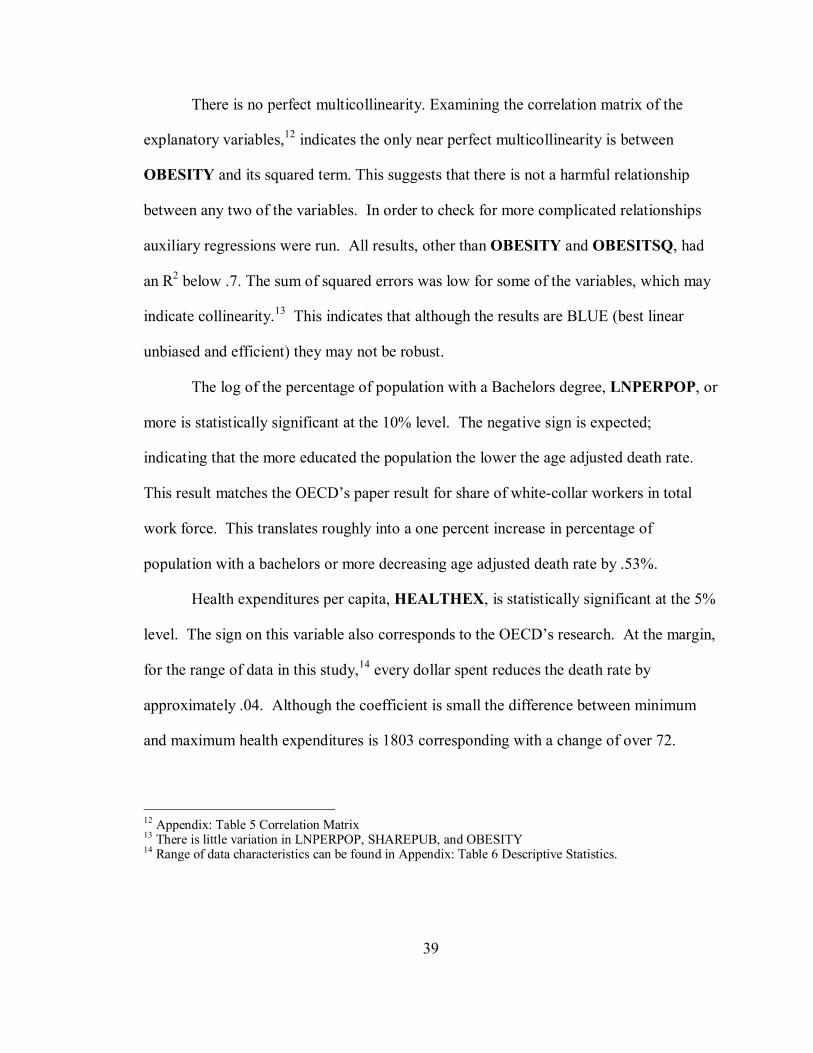
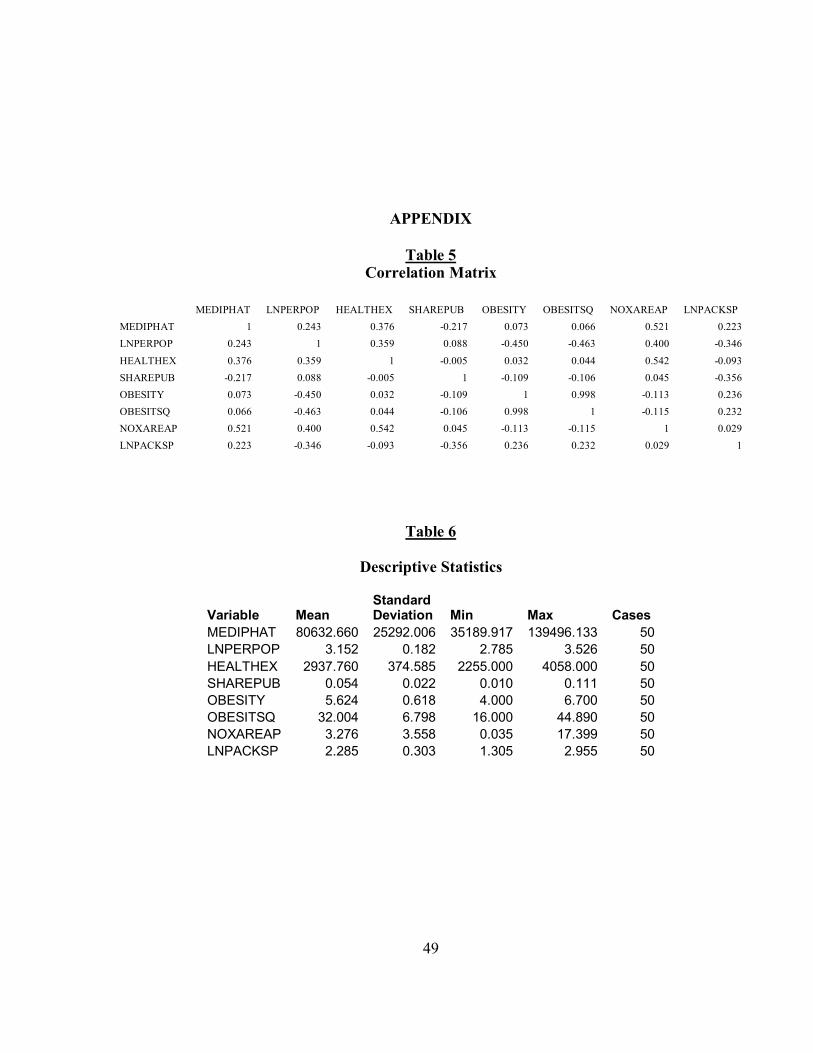
There is no perfect multicollinearity. Examining the correlation matrix of the
explanatory variables,12 indicates the only near perfect multicollinearity is between
OBESITY and its squared term. This suggests that there is not a harmful relationship
between any two of the variables. In order to check for more complicated relationships
auxiliary regressions were run. All results, other than OBESITY and OBESITSQ, had
an R2 below .7. The sum of squared errors was low for some of the variables, which may
indicate collinearity.13 This indicates that although the results are BLUE (best linear
unbiased and efficient) they may not be robust.
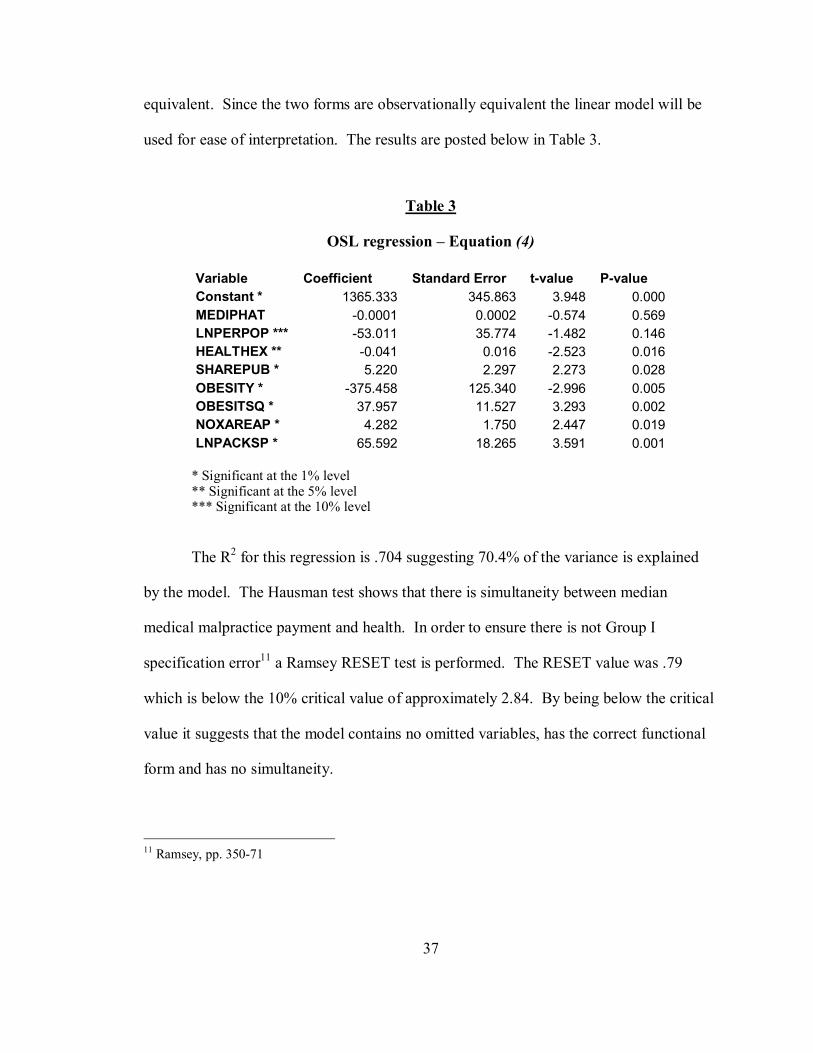
The log of the percentage of population with a Bachelors degree, LNPERPOP, or
more is statistically significant at the 10% level. The negative sign is expected;
indicating that the more educated the population the lower the age adjusted death rate.
This result matches the OECD’s paper result for share of white-collar workers in total
work force. This translates roughly into a one percent increase in percentage of
population with a bachelors or more decreasing age adjusted death rate by .53%.
Health expenditures per capita, HEALTHEX, is statistically significant at the 5%
level. The sign on this variable also corresponds to the OECD’s research. At the margin,
for the range of data in this study,14 every dollar spent reduces the death rate by
approximately .04. Although the coefficient is small the difference between minimum
and maximum health expenditures is 1803 corresponding with a change of over 72.
12 Appendix: Table 5 Correlation Matrix 13 There is little variation in LNPERPOP, SHAREPUB, and OBESITY 14 Range of data characteristics can be found in Appendix: Table 6 Descriptive Statistics.
40
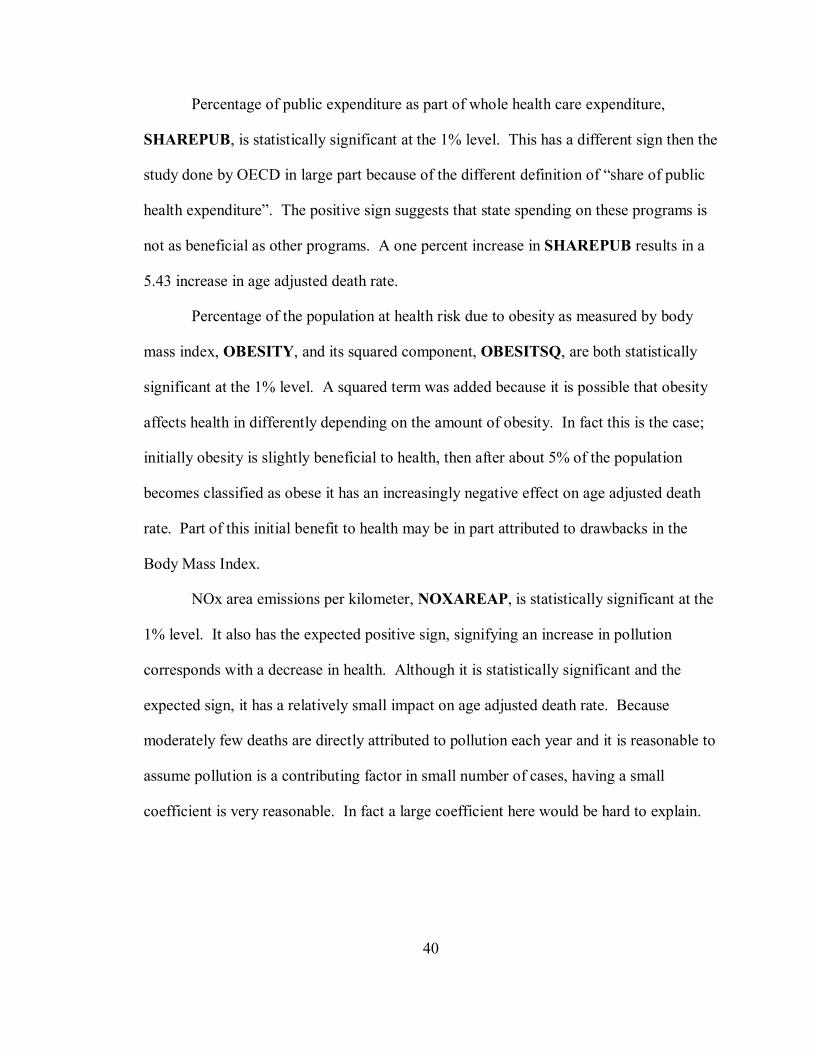
Percentage of public expenditure as part of whole health care expenditure,
SHAREPUB, is statistically significant at the 1% level. This has a different sign then the
study done by OECD in large part because of the different definition of “share of public
health expenditure”. The positive sign suggests that state spending on these programs is
not as beneficial as other programs. A one percent increase in SHAREPUB results in a
5.43 increase in age adjusted death rate.
Percentage of the population at health risk due to obesity as measured by body
mass index, OBESITY, and its squared component, OBESITSQ, are both statistically
significant at the 1% level. A squared term was added because it is possible that obesity
affects health in differently depending on the amount of obesity. In fact this is the case;
initially obesity is slightly beneficial to health, then after about 5% of the population
becomes classified as obese it has an increasingly negative effect on age adjusted death
rate. Part of this initial benefit to health may be in part attributed to drawbacks in the
Body Mass Index.
NOx area emissions per kilometer, NOXAREAP, is statistically significant at the
1% level. It also has the expected positive sign, signifying an increase in pollution
corresponds with a decrease in health. Although it is statistically significant and the
expected sign, it has a relatively small impact on age adjusted death rate. Because
moderately few deaths are directly attributed to pollution each year and it is reasonable to
assume pollution is a contributing factor in small number of cases, having a small
coefficient is very reasonable. In fact a large coefficient here would be hard to explain.
41
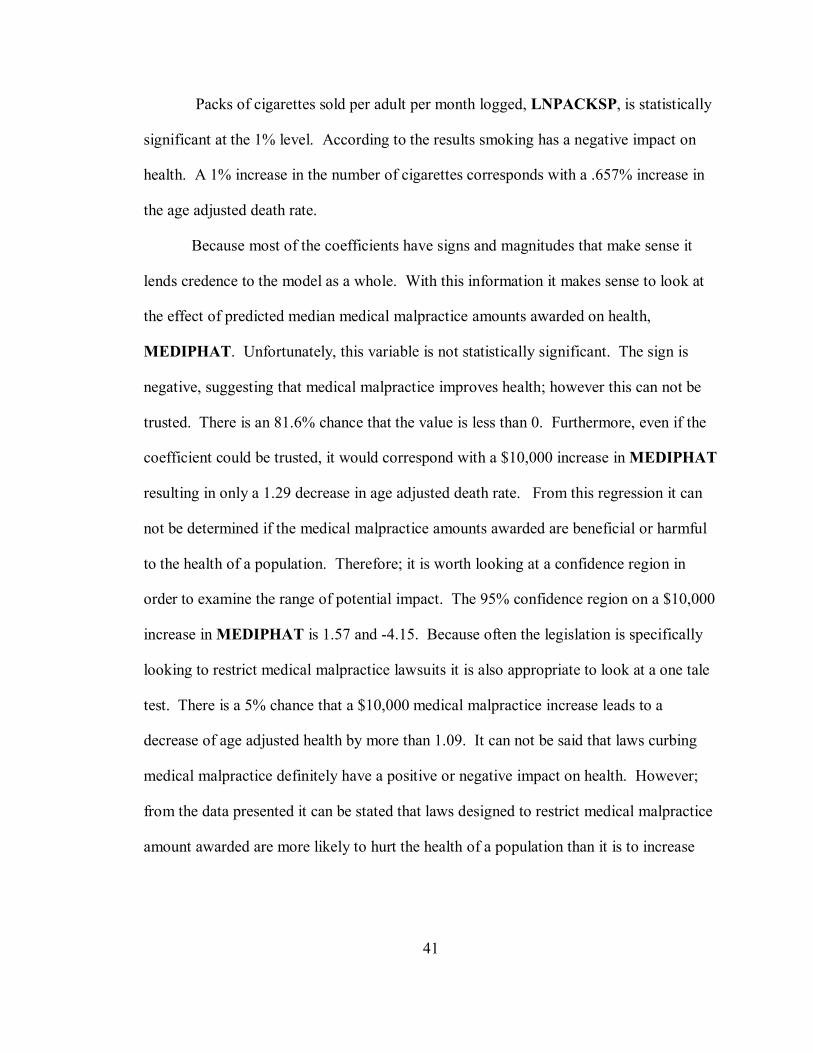
Packs of cigarettes sold per adult per month logged, LNPACKSP, is statistically
significant at the 1% level. According to the results smoking has a negative impact on
health. A 1% increase in the number of cigarettes corresponds with a .657% increase in
the age adjusted death rate.
Because most of the coefficients have signs and magnitudes that make sense it
lends credence to the model as a whole. With this information it makes sense to look at
the effect of predicted median medical malpractice amounts awarded on health,
MEDIPHAT. Unfortunately, this variable is not statistically significant. The sign is
negative, suggesting that medical malpractice improves health; however this can not be
trusted. There is an 81.6% chance that the value is less than 0. Furthermore, even if the
coefficient could be trusted, it would correspond with a $10,000 increase in MEDIPHAT
resulting in only a 1.29 decrease in age adjusted death rate. From this regression it can
not be determined if the medical malpractice amounts awarded are beneficial or harmful
to the health of a population. Therefore; it is worth looking at a confidence region in
order to examine the range of potential impact. The 95% confidence region on a $10,000
increase in MEDIPHAT is 1.57 and -4.15. Because often the legislation is specifically
looking to restrict medical malpractice lawsuits it is also appropriate to look at a one tale
test. There is a 5% chance that a $10,000 medical malpractice increase leads to a
decrease of age adjusted health by more than 1.09. It can not be said that laws curbing
medical malpractice definitely have a positive or negative impact on health. However;
from the data presented it can be stated that laws designed to restrict medical malpractice
amount awarded are more likely to hurt the health of a population than it is to increase
42
health. Because of medical malpractice amount awarded has an uncertain but likely
affect of improving health politicians should be cautious before enacting tort reform laws.
43
CHAPTER VII
CONCLUSION
Good health, or lack of bad health, is a treasured commodity. Every activity can
be negatively affected by poor health. Hence, a small change in health can result in a
large change in utility. Furthermore; because a decline in health is a nonpecuniary loss, it
requires a relatively large monetary award to off set the decline. Medical malpractice
lawsuits are one way to add monetary incentive for doctors to avoid mistakes. If all that
occurred were fewer mistakes then medical malpractice lawsuits would unconditionally
improve health of a population. However, it is possible that physicians have so much
motivation to reduce mistakes that they become too cautions. Defensive medicine is
when physicians perform more tests, much more expensive tests with little benefit, and in
general is more concerned with protecting themselves from potential lawsuits than caring
for patients. While this may be effective in reducing lawsuits it is often not economically
efficient. As a result medical care is more expensive, which leads to a smaller amount of
medical care being provided. Furthermore, medical malpractice lawsuits are blamed for a
lack of availability of certain services. It is for these justifications that politicians
develop laws to curb medical malpractice lawsuits.
The question then is, “Are the benefits or drawbacks more influential on health?”
Once this question can be answered it is possible to apply the findings to suggest the
44
course of action that will most benefit the health of a population. It is necessary to first
determine the proper analysis to run on the data. In this case, because of the simultaneity
nature between medical malpractice and health it is necessary to run two stage least
square regression.
After running the two stage least square regression and correcting for
heteroscedasticity all of the variables other than median medical malpractice amount
awarded are statistically significant at least at the 10% level. Furthermore, all the signs
and magnitude correspond with previous research except for percentage of public
expenditure as part of whole health care expenditure, which may be accounted for by
differences in the United States health care system in comparison to the rest of the
worlds’. In addition, the model passes the Ramsey RESET test and shows little
multicollinearity. All of this supports the validity of the regression. The sign on
MEDIPHAT is negative, suggesting that large medical malpractice lawsuits may benefit
the health of a population. However, the variable of interest is not statistically significant
and therefore the negative coefficient cannot be trusted. It can be said that it is more
likely that medical malpractice improves the health of a population than hurt it.15
The results of the regression do not support laws designed to limit medical
malpractice lawsuits, but it cannot say definitively that the laws are harmful to health.
With this information the best advice for policy makers is to tread carefully.
Future research in this area should concentrate on changes that might result in a
statistically significant coefficient for median medical malpractice amounts awarded.
15 Likelihood of 63.2% using a two tailed test and 81.9% using a one tail test
45
This maybe accomplished in a number of ways including; better modeling the first stage
that finds the predicted values, collecting data from multiple years and running
regressions on the paneled data, or examining a single state across multiple years. A
point of interest for further research may be further investigating share of public health
expenditure; how it relates to health of a population, how it compares to other state
spending, and which programs included in public health expenditure are the most
effective. This line of research has the potential to be a valuable policy tool.
46
BIBLIOGRAPHY
Bernoulli, Daniel (1738): « Specimen Theoriae Novae de Mensura Sortis »; Commentarii Acedemiae Scientiarum Imperialis Peteropolitanae, v 5, p. 175-192. Translated in Econometrica (1954), v. 22, p. 23-36.
Bhat, Vasanthakumar N. (2001): «Medical Malpractice: A Comprehensive Analysis »; Auburn House
Coase, Ronald H. (1960): «The Problem of Social Cost »; Journal of Law and Economics v. 3, p. 1-44
Danzon, Patricia Munch (1985): «Medical Malpractice: Theory, Evidence, and Public Policy »; Harvard University Press
DeVille, Kenneth (1990): «Medical Malpractice in Nineteenth Century America: Origins and Legacy »; New York University Press
Fournier, Gary M.; McInnes, Melayne Morgan (2001): « The Case for Experience Rating in Medical Malpractice Insurance: An Empirical Evaluation »; Journal of Risk and Insurance, v. 68, iss. 2, p. 255-76
Greene, William H. (2003): «Econometric Analysis »; 4th ed., Prentice Hall Gujarati, Damodar N. (2003): «Basic Econometrics »; 4th ed., McGraw-Hill, Inc.
Haveman, Robert H.; Wolfe, Barbara L. (1984): «Schooling and Economic Well-Being: The Role of Nonmarket Effects » Journal of Human Resources, v. 19, iss. 3, pp. 377-407
Kessler, Daniel; McClellan, Mark (1996): « Do Doctors Practice Defensive Medicine? »; Quarterly Journal of Economics, v. 111, iss. 2, p. 353-90
Landes, William M.; Posner, Richard A. (1987): «The Economic Structure of Tort Law »; Harvard University Press
47
Mohr, James C. (2000): «American Medical Malpractice Litigation in Historical Perspective »; The Journal of the American Medical Association, v. 283, p. 1731-1737
Or, Zeynep (2000): «Determinants of Health Outcomes in Industrialised Countries: A Pooled, Cross-Country, Time-Series Analysis »; OECD Economic Studies, v. 0, iss. 30, pp. 53-77
Olsen, Reed Neil (1996): «The Reform of Medical Malpractice Law: Historical Perspectives »; American Journal of Economics and Sociology, v. 55, p. 257-275
Palmisano, Donald J. (2005): Speech to the House of Representatives Small Business Committee; February 17, 2005
Ramsey, James B. (1969): « Tests for Specification Errors in Classical Linear Least Squares Regression Analysis »; Journal of the Royal Statistical Society, Series B, vol. 31, pp. 350-71.
Riccardi, Anthony H.; Ireland, Thomas R. (2000): « Structured Judgments and Periodic Payments in New York: A Unique and Complex System for Tort Awards »; Journal of Legal Economics, v. 10, iss. 2, pp. 55-74
Rubin, Paul H. (1993): «Tort Reform by Contract »; AEI Press
Sinn, Hans-Werner (2003): «Weber's Law and the Biological Evolution of Risk Preferences: The Selective Dominance of the Logarithmic Utility Function, 2002 Geneva Risk Lecture »; Geneva Papers on Risk and Insurance Theory, v. 28, iss. 2, p. 87-100
Thompson, Mark A. (1998): «Assessing the Economic Costs of High School Noncompletion »; Journal of Economics and Finance, v. 22, iss. 2-3, pp. 109-17
The Tobacco Institute (1998): «Monthly State Cigarette Tax Reports »; 1875 I Street, N.W. Washington, DC 20006.
US Department of Agriculture, Agricultural Research Service, Dietary Guidelines Advisory Committee (1995): «Report of the Dietary Guidelines Advisory Committee on the dietary guidelines for Americans, 1995, to the Secretary of Health and Human Services and the Secretary of Agriculture »; US Department of Agriculture
Vidmar, Neil (1995): «Medical Malpractice and the American Jury: Confronting the Myths about Jury Incompetence, Deep Pockets, and Outrageous Damage Awards »; University of Michigan Press
48
Wilkinson, Richard G. (2000): « The Need for an Interdisciplinary Perspective on the Social Determinants of Health »; Health Economics, v. 9, iss. 7, p. 581-83
www.health.state.ny.us/statistics/cancer/registry/age.htm Revised March 2006